Embed Size (px)
Citation preview
RReeppuubblliicc ooff KKeennyyaa
MMiinniissttrryy ooff HHeeaalltthh
Kenya
Household Health Expenditure and Utilisation Survey Report 2007 Friday, 21 August 2009
Table of Contents List of Tables ................................................................................................................ iv
Foreword ....................................................................................................................... v
Acknowledgements ...................................................................................................... vii
Abbreviations and Acronyms ..................................................................................... viii
Map of Kenya ............................................................................................................... ix
Executive Summary ...................................................................................................... x
Introduction .............................................................................................................. x
Methodology and response rates ........................................................................... xi
Demographic Characteristics ................................................................................ xi
Household Amenities .............................................................................................. xi
Utilisation of outpatient health care services....................................................... xii
Utilisation of inpatient health care services ....................................................... xiii
Insurance Coverage ............................................................................................... xv
1 Introduction ........................................................................................................... 1
1.1 Organisation of the Survey ......................................................................... 1
1.2 Socioeconomic Indicators and Epidemiological Profile ........................... 2
1.3 Health Care Delivery System in Kenya ..................................................... 3
1.4 Role of Households in Health Care Financing .......................................... 4
1.5 Objectives of the Household survey ........................................................... 4
1.6 Rationale for the Survey .............................................................................. 4
1.7 Organisation of the report ........................................................................... 6
1.8 Principal questions addressed in this Survey ............................................ 6
2 Survey Methodology .............................................................................................. 7
2.1 Sample Size and Allocation to the Provinces ............................................. 7
2.2 Survey Data Collection instrument ............................................................ 8
2.3 Training ........................................................................................................ 8
2.4 Data collection .............................................................................................. 9
2.5 Data Processing ............................................................................................ 9
2.6 Data analysis ............................................................................................... 10
2.7 Wealth index ............................................................................................... 10
2.8 Sample coverage and Response rates ....................................................... 10
ii
3 Household Demographic and Socioeconomic Characteristics ......................... 11
3.1 Household Demographic and Socioeconomic Characteristics ............... 11
3.2 Education levels .......................................................................................... 13
3.3 Employment Status .................................................................................... 13
3.4 Residence and Wealth Index ..................................................................... 13
3.5 Household Size ........................................................................................... 14
3.6 Self-assessment of health status ................................................................ 15
4 Housing and Household Amenities .................................................................... 17
4.1 Distribution of Type of Dwellings ............................................................. 17
4.2 Type of Roof ............................................................................................... 18
4.3 Type of Wall ............................................................................................... 18
4.4 Type of Floor .............................................................................................. 19
4.5 Sources of Cooking and Lighting Energy ................................................ 20
4.6 Water sources ............................................................................................. 23
4.7 Toilet Facilities ........................................................................................... 24
4.8 Household Possessions ............................................................................... 24
5 Utilisation of outpatient health services and out of pocket expenditures ......... 26
5.1 Frequency of Illness and per capita Visits for outpatient health Care services .................................................................................................................... 26
5.1.1 Proportion of population reporting illness in four weeks prior to the survey by province and residence ........................................................................ 27 5.1.2 Utilisation of outpatient health care services by province and residence 28 5.1.3 Utilisation of outpatient health care services by gender and age group .. 29 5.1.4 Changes from 2003 to 2007 ..................................................................... 30
5.2 Choice of provider: Distribution of outpatient visits by provider type 33
5.3 Annual OOP expenditures per capita on outpatient visits .................... 35 5.3.1 Expenditure by Wealth Index Quintiles ................................................... 38 5.3.2 Health Care Expenditure by Age ............................................................. 38 5.3.3 Expenditure by Education ........................................................................ 39
5.4 Leading causes for seeking outpatient care ............................................. 40
5.5 Reasons for those ill not seeking health care ........................................... 40
5.6 Reasons for avoiding nearest health provider (All visits) ...................... 41
5.7 Reasons for choosing provider .................................................................. 42
5.8 Distribution of expenditures on outpatient care by component ............ 42
6 Utilisation of inpatient health services and out of pocket expenditures ........... 43
6.1 Utilisation of inpatient health care services ............................................. 43
6.2 Admission rate by Education .................................................................... 46
6.3 Admission rate by province and residence .............................................. 47
iii
6.4 Admission rate by age group and gender ................................................ 47
6.5 Admission rate by wealth index ................................................................ 49
6.6 Admission rate by insurance cover .......................................................... 50
6.7 Where do individuals seek inpatient care? Choice of health care provider for inpatient services .............................................................................. 51
6.8 Distribution of admissions by Wealth Index Quintile and Health facility Type 53
6.9 Causes of Admission .................................................................................. 55
6.10 Reasons for avoiding nearest health care providers ............................... 55
6.11 Main reasons for choosing the admitting health care provider ............. 56
6.12 Sources of funds ......................................................................................... 57
6.13 Annual OOP expenditures per capita for inpatient care ....................... 58
6.14 Average length of stay (days) by selected characteristics ....................... 61
7 Health Insurance Coverage ................................................................................ 63
7.1 Population with Health Insurance Cover ................................................ 63
7.2 Type of insurance coverage ....................................................................... 65
8 References ........................................................................................................... 67
9 Annexes ............................................................................................................... 68
9.1 Annex 1: Allocation of the clusters and households, response rates by province, district and place of residence .............................................................. 68
9.2 Annex 2: Annual outpatients visits per capita, percentages of sample reporting illness in 4 weeks before the survey and percent of ill persons who did not seek treatment by selected characteristics, KENYA, 2007. .................. 72
9.3 Annex 3: Percentage of Distribution of Outpatient visits by type of health care provider, KENYA, 2007 .................................................................................. 78
9.4 Annex 4: Percent distribution of admissions by type of health provider, KENYA, 2007 ......................................................................................................... 82
iv
List of Tables Table 1.1: Selected socioeconomic indicators for Kenya .............................................. 2 Table 2.1: Distribution of Clusters and Households by Province and place of Residence, Kenya, 2007. ................................................................................................ 8 Table 2.2: Household Response Rates by province and Place of Residence, KENYA, 2007.............................................................................................................................. 10 Table 3.2: Percentage distribution of population by wealth index quintiles and Urban/ Rural residence, KENYA, 2007 ......................................................................... 14 Table 3.3: Self-assessment of health status by gender, KENYA, 2007 ....................... 15 Table 3.4: Distribution of Population according to household wealth index and reported health status, 2007, Kenya. ............................................................................ 16 Table 4.1: Percentage distribution of Households by Housing characteristics ............ 17 Table 4.2: Percentage distribution of Households by Roofing material, KENYA, 2007...................................................................................................................................... 18 Table 4.3: Percentage distribution of Households by type of wall of main house, KENYA, 2007 ................................................................................................................. 19 Table 4.4: Percentage distribution of Households by type of floor material of main house, KENYA, 2007 ..................................................................................................... 19 Table 4.5: Percentage distribution of Households by Sources of cooking and lighting energy, KENYA, 2007 .................................................................................................... 20 Table 4.6: Percentage distribution of Households by Sources of water, KENYA, 2007 ............................................................................................. 23 Table 4.7: Percentage distribution of Households by Sources of water, sanitation facilities, KENYA, 2007 ................................................................................................. 24 Table 4.8: Household possessions by Province and Cluster type ................................ 25 Table 5.1: Total number of visits and utilisation rates, KENYA, 2003 and 2007 ......... 26 Table 5.5: Distribution of the reasons for avoiding the nearest provider, KENYA, 2007...................................................................................................................................... 41 Table 5.6: Percent distribution of responses by reason for choice of health provider, KENYA, 2007 ................................................................................................................. 42 Table 6.1(a): Summary statistics on Admissions ......................................................... 43 Table 6.1: Average annual number of admissions per 1,000 population to health facilities by selected characteristics, KENYA, 2007 ...................................................... 44 Table 6.5: Causes of admission, KENYA, 2007 ......................................................... 55 Table 6.6: Percent distribution of reasons for avoiding nearest provider, KENYA, 2007.............................................................................................................................. 56 Table 6.7: Percent distribution of admissions by sources of payment for inpatient care, KENYA, 2007.............................................................................................................. 58 Table 6.8: Per capita OOP Expenditure on admissions, KENYA, 2007 ......................... 59 Table 7.1: Proportion of population with Health Insurance Cover, KENYA, 2007....... 64
v
Foreword This is Kenya’s second Household Health Expenditure and Utilisation Survey, the first having been conducted in 2003. The survey findings continue to attract the attention of policymakers, health managers, and health stakeholders alike. Public policymakers and stakeholders are debating the best arrangements of financing health and how best to organise and deliver health services. This entails efficient allocation of scarce resources and works towards a healthier society. To achieve effective and efficient health management, it is crucial to assess the utilisation of health services, as well as out-of-pocket expenditures on health at the national and regional levels, and by socioeconomic and demographic groups. An analysis of the use of health care is relevant because of the high priority the government places on equity in the provision of its services. In addition, information on household health expenditure is important because of its significant contribution to the financing of health services. This survey, therefore, should be regarded as an important tool for identifying the size of out-of-pocket health expenditures and guiding current and future reforms of health financing. This survey addresses a set of interrelated questions. What are the determinants of utilisation? How do rich and poor individuals make decisions about their treatment? What are the implications for equitable access to health care and health status of the people across wealth quintiles? Health systems deliver services aimed at making a difference in people’s health – improved health status can enable poor households to escape poverty. However, the financial burden of high out-of-pocket payments at the time of health care utilisation – especially in the case of chronic or catastrophic care – can consumer a major portion of household income, forcing household members to reduce spending on other needs, perhaps pushing them into poverty, or, alternatively, preventing the sick individual from seeking or obtaining care. Therefore, it is a major challenge for health systems to protect households from the excessive health expenditure that risks impoverishing them, and to ensure that the population seeks and receives health services when needed. This means getting away from reliance on out-of-pocket payments and instituting financial
vi
risk protection measures. Improving health systems is critical to meet this challenge. I strongly hope that this survey will be useful for all stakeholders and actors in the health sector and extend my sincere thanks to all who made invaluable contribution to the survey. Hon. Prof. Peter Anyang’ Nyong’o, EGH, MP
Minister for Medical Services
vii
Acknowledgements This household health expenditure and utilisation survey was a enormous exercise. Many organisations and individuals were involved in survey planning, design, and execution. Therefore, we wish to acknowledge the assistance and participation of the following individuals and organisations: United States Agency for International Development (USAID) /Kenya: for the financial support to undertake the survey; Dr Bedan Gechaga provided guidance and review of survey instruments and facilitated data collection from USAID-financed institutions. The Kenya National Bureau of Statistics: Mr Anthony K. Kilele, the Director General, for providing crucial support for the survey. Selected staff, both at the headquarters and the field, participated in data collection and supervision; their efforts are greatly appreciated. Further, Paul Waweru and Samuel Kipruto provided support in computer programming and data analysis. All households surveyed for willingly participating in the survey. Health Management Information Systems, Ministry of Health: for staff contributions with data entry and data editing. Health Systems 20/20, led by Abt Associates Inc.: Susna De, Ken Carlson, Ellie Brown, Lisa Fleisher, Steve Musau and Darwin Young for their technical assistance and Maer Associates for facilitating logistical support. Ministry of Health: Officers of the Policy and Planning Division (PPD) were responsible for survey design and execution, data analysis, and compilation of this report. These were Mr Stephen Muchiri, Mr Geoffrey Kimani, Mr Thomas Maina, and Mr Henry Onyiego. Support also was provided by Mr Elkana Ong’uti, current Head PPD. Health Sector Financing Strategy Task Force members: for providing guidance. We also acknowledge the support of many individuals who reviewed the initial drafts.
viii
Abbreviations and Acronyms AIDS Acquired Immunodeficiency Syndrome
ALOS Average Length of Stay
EA Enumeration Area
FBO Faith-based Organisation
GDP Gross Domestic Product
HIV Human Immunodeficiency Virus
KNBS Kenya National Bureau of Statistics
NASSEP National Sample Survey Evaluation Programme
NHA National Health Accounts
NHIF National Health Insurance Fund
NHSSP National Health Sector Strategic Plan
OOP Out-of-Pocket
SPSS Statistical Package for Social Scientists
USAID United States Aid for International Development
ix
Map of Kenya
x
Executive Summary
Introduction
The 2007 Household Health Expenditure and Utilisation Survey was undertaken as part the National Health Accounts (NHA) estimation. NHA estimates give information not only on the distribution of health funding by financing sources but also by the entities through which the funds pass (financing agents), the health services providers that consume the funds, and ultimately the health functions on which the funds are spent. Households are key sources and also “managers” of funds because they exercise control over where the funds are spent. Thus, households are important actors in the overall health accounts. Objectives: The overarching goal of the survey was to obtain information on household health care utilisation and expenditures in Kenya. Specifically, the following were the key objectives:
a) To document health care seeking behaviour amongst the Kenyan population and assess how care seeking behaviour varied with demographic characteristics;
b) To collect detailed information on health care service
utilisation;
c) To gain insight into the health expenditures made by the household members when they consult health care providers and analyse how these expenditures vary with socioeconomic and demographic characteristics and type of health care sought;
d) To investigate patterns of outpatient and inpatient health care
use and choice and perception of provider type. Survey implementation: This household survey was implemented by the Ministry of Health in collaboration with the Kenya National Bureau of Statistics. Financial support for the survey was provided by the United States Agency for International Development (USAID). The USAID Health Systems 20/20 project, led by Abt Associates Inc., provided technical assistance.
xi
Methodology and Response Rates
The Household Health Expenditure and Utilisation Survey was a nationally representative sample survey. It covered Kenya’s eight provinces and all its districts. In all, 737 clusters were selected; 506 (68.7 percent) were rural and 231 urban. In each cluster, 12 households were systematically randomly selected; whenever possible, the households selected for the 2007 survey were the same households that had been interviewed in the 2003 survey. The sample, therefore, consisted of 8,844 households, 6,072 of them rural and 2,772 urban. A total of 8,453 households were successfully interviewed, giving a response rate of 96 percent; this ranged, however, from 89 percent in Western province to 98 percent in Rift Valley province. Data collection was carried out in September and October 2007.
Demographic Characteristics
Age distribution: Survey results showed almost an equal proportion of female (51 percent) and male (49 percent) respondents. A large proportion of household members are young: the population age less than 15 years is 42 percent, while those under 25 years represent 62 percent. Only 4 percent are 65 years and over. Household size: The poorest households have the highest household size (5.2 persons); the richest households average 3.7 persons. Rural areas have bigger households (4.8) than urban areas (3.6). Regionally, the largest household size is in North Eastern province (5.4 persons), smallest in Nairobi (3.5 persons). Overall, the average household size for Kenya is 4.5 persons which compares favourably with the 4.4 persons found in the Kenya Demographic and Health Survey 2003.
Household Amenities
Water supply: Overall, 61 percent of all households in Kenya have access to safe drinking water: 91 percent of the urban households have access to safe drinking water, compared with 51 percent of rural ones. Toilet facility: Eighty-seven percent of Kenya households have a toilet facility. The most common type of toilet facility is the pit latrine, reported by two thirds (66 percent) of the households. A higher proportion of households (98 percent) in urban areas have toilet facilities compared with 83 percent in rural areas. Sixteen
xii
percent of rural households report no toilet facilities compared with about 1 percent in urban areas. Cooking fuel: Firewood is overwhelmingly used for cooking in most households (67 percent): 86 percent of rural households use firewood for cooking compared with only 7 percent in urban areas. Charcoal (17 percent of households) is the next most frequently used fuel, followed by kerosene (12 percent of households). Lighting fuel: Nearly three out of four households (74 percent) use kerosene for lighting, followed by electricity (19 percent of households).
Utilisation of Outpatient Health Care Services
Overall, 15 percent of all individuals reported an illness during the four-week recall period for outpatient care. Of these, 84 percent sought health care. This is significantly higher than the 78 percent of sick people who got care in 2003. Amongst those who did not seek care in 2007, over a third (38 percent) identified lack of money as the reason while another third said they self-medicated. During the recall period, 7.4 million outpatient visits were made to health care providers for treatment of illness. This gives an average utilisation rate of 20 visits per 100 people and 132 visits per 100 sick people. Using these figures and assuming that the seasonal variation in the level of utilisation was not marked, the annual utilisation rate for the population is approximately 2.6 visits per person, an increase from 1.9 visits in 2003. The population in Nairobi is more likely to report being ill (18 percent) than that of any other province. The North Eastern province has the lowest reported incidence of illness. The health care provider use rate range is about half as large in North Eastern province (1.2 annual visits per capita) as in the country as a whole (2.6). Residents in urban areas tend to have a higher number of outpatient visits (3.2) per capita compared with their rural counterparts (2.5). Women make 1.3 times as many outpatient visits per capita (2.9 visits per year) as males (2.3). The young and the old make significantly more visits than those of intermediate age. In 2003, the poor were significantly more likely than the rich to let an illness go untreated. By 2007, this gap had not only been
xiii
eradicated, but the poorest are slightly more likely to obtain care than the richest. In both 2003 and 2007, a large majority of sick children received medical care. In 2003, however, access to care decreased markedly with age. By 2007, the effect of age had been greatly diminished, with the greatest improvement amongst the elderly. At every age, Kenyans reported fewer illnesses in 2007 than they had in 2003. Although some of this improvement may result directly from improved access to care, 2003 to 2007 was also a period of substantial attempts to reduce the incidence of malaria. Malaria fell significantly as a cause of visits to medical providers. This decrease in malaria could be sufficient to explain the change in total illness Choice of health provider. Government facilities account for 57 percent of total outpatient visits. About 15 percent of outpatients rely on a chemist for care. Private and mission health facilities account for 18 percent and 6 percent of visits, respectively, while traditional healers attract a negligible proportion of patients (1 percent). Per capita expenditure. The data from the household survey show that the relatively well to do (richest wealth index quintile households) use health care services more and spend more on these services. Overall, the cost per capita of outpatient visits was KSh 328 with a range from KSh 159 in North Eastern province to KSh 1,089 per capita in Nairobi. Further, the average out-of-pocket (OOP) expenditure made by the urban population (KSh 699) was significantly higher than that by rural population (KSh 236).
Utilisation of Inpatient Health Care Services
Approximately 2 percent of Kenya’s 37 million people reported that they were inpatients during the 12 months prior to the 2007 survey. Admission rates: The analysis indicates an overall annual rate of admissions of 27 admissions per 1,000 population. This is a sharp increase from the admission rate of 15 per 1,000 in 2003. Females are hospitalised more often (33 admissions per 1,000 population) than males (19.8 per 1,000 population). About half of the difference between males and females is due to childbirth and other reproductive health services. Women between the ages of 15 and 50 require significantly more admissions than men of the same age. The age group 5-14 years has the lowest hospitalisation rate (8 per 1,000 population).
xiv
Urban individuals have a higher admission rate (38 per 1,000 population) than their rural counterparts (24 admissions per 1,000 population). Nairobi and Central province reported the highest admission rates (34 admissions per 1,000 population), North Eastern province the lowest (7 percent). This is similar to the rates found in 2003.
There is a strong correlation between wealth index and use of inpatient care. In 2007, individuals in the richest wealth index quintile were about twice as likely to use inpatient care (37 admissions per 1,000 population) as those in the poorest quintile (20 per 1,000 population). Comparison with 2003 admission rates reveals similar trends and again raises concerns about the equity of the health care system. Choice of health provider: Government hospitals account for 59 percent of all admissions, with private and mission hospitals each providing 14 percent of inpatient care. Differences between 2003 and 2007 in choice of provider are not statistically significant. Cause of admission: Malaria is the most common illness amongst hospitalised individuals, accounting for 23 percent of total admissions. The next highest reported cause is respiratory infections (18 percent). Accidents (6 percent) are amongst the top ten causes of admission while chronic illnesses like diabetes are increasingly common. Reason for choosing admitting health provider: Most of the reasons for choosing a provider involve quality of care (availability of medicine, qualifications of staff, etc.) The facility’s geographic proximity to the patient’s home represented 15 percent of responses. About 12 percent of respondents mentioned lower facility costs. Source of funds to pay for inpatient health care: For nearly two thirds (67 percent) of the admissions, cash was available to pay for the hospitalisation. However, this varied by wealth quintile (75 percent amongst the richest households compared with 55 percent amongst the poorest households). The cash was provided by friends, relatives, and family members in 19 percent of the admissions. For 7 percent, households had to borrow money; for another 7 percent, household assets were sold. Per capita expenditure: The annual per capita OOP expenditure on admissions is KSh 245. In urban areas, it is KSh 674, in rural areas KSh 139. Women are more likely to be admitted for inpatient
xv
care than men are. However, women’s per capita OOP spending is less probably because their cost per admission is somewhat lower than men’s cost per admission. Results show that insured individuals make substantially higher per capita OOP expenditures (KSh 1,273) than the uninsured (KSh 137). Per capita OOP expenditure is highest (KSh 887) for individuals in the richest quintile group and lowest (KSh 59) for those in the poorest quintile group.
Insurance Coverage
The survey data show that about 10 percent of the population has some form of insurance cover, about the same as in 2003, when coverage was 9.7 percent. By region, Nairobi has the highest coverage – nearly one in four individuals has insurance cover – while coverage is lowest in North Eastern province.
Household Survey of Health Care Utilisation and Expenditure, 2007, Kenya
| Introduction 1
1 Introduction This Household Health Expenditure and Utilisation Survey survey was undertaken to inform the National Health Accounts (NHA) estimation and the development of the health care financing strategy. The NHA give information not only on the distribution of health financing sources but also on the entities through which funds pass (financial agents), the health services providers that receive the payments, and ultimately the health functions on which funds are spent. Households are both sources and “managers” of funds because they exercise control over where the funds are spent. Thus, they are a crucial actor in the overall health accounts. The aim of the household survey was to understand the health care seeking behaviour and health expenditure patterns of the Kenyan population. The survey intended to complement, not duplicate, the data that were already available in Kenya. Use of health services is not only influenced by quality and quantity of services but also by individual background factors and perceived needs for health services. The use of health services thus becomes an important indicator for measuring equity in health care provision.
1.1 Organisation of the Survey
The survey was organised by the Ministry of Health. The Kenya National Bureau of Statistics (KNBS) provided substantial support, particularly in the sample design, survey methodology, interviewer training, field data collection, and data processing and analysis. Overseeing all technical aspects of the survey was a Technical Working Group under the direction of National Steering Committee, the latter composed of representatives from the Ministry of Health, KNBS, civil society, the private sector, and technical experts from development partners involved in the health sector.
Household Survey of Health Care Utilisation and Expenditure, 2007, Kenya
| Introduction 2
1.2 Socioeconomic Indicators and Epidemiological Profile
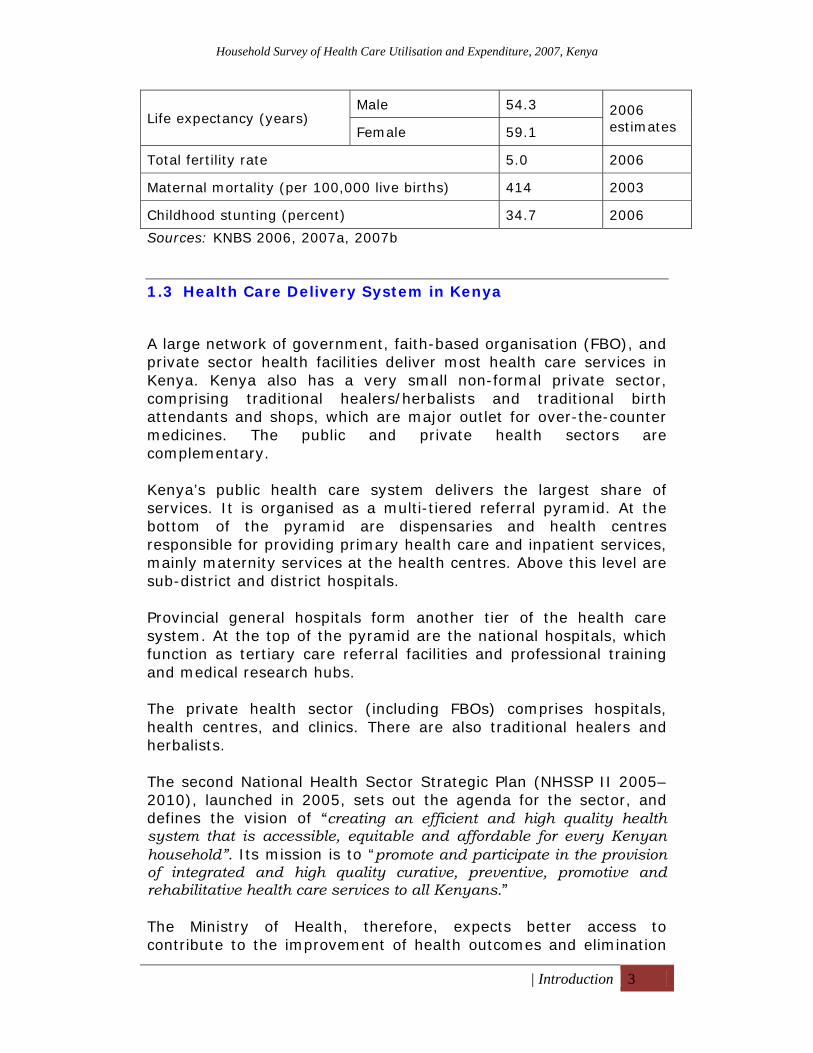
Despite rapid economic growth in recent years, Kenya remains a low-income country. The new Kenya Vision 2030, the long-term development blueprint for the country, therefore, aims at transforming Kenya into “a newly-industrialising, middle income, globally competitive and prosperous country with a high quality of life to all its citizens in a clean and secure environment by 2030.” The population of Kenya was estimated to be 37 million in 2007 while life expectancy was estimated to be 54.3 and 59.1 years for males and females respectively for 2006 (KNBS, 2007a) (Table 1.1). According to the Kenya AIDS Indicator Survey (Ministry of Health, 2007), the prevalence of AIDS amongst adults age 15-49 years is 7.8 percent. The fertility rate increased marginally, from 4.9 in 2003 to 5.0 in 2006. Overall, morbidity and mortality remain high, particularly amongst children. However, there is evidence of reversal in vital indicators. For example, infant mortality rate declined by 22 percent, from 77 per 1,000 live births in 2003 to 60 per 1,000 in 2006. Under-five mortality also fell over the same period by 20 percent and stood at 92 per 1,000 in 2006. Levels of stunting amongst children under the age of five years remained high averaging about 33 percent in the last decade. Maternal mortality related to pregnancy or childbirth complications is high. A 2003 report estimated maternal mortality at 414 per 100,000 live births (Central Bureau of Statistics 2003). Only 40 percent of deliveries are performed in a health facility. Overall, malaria, respiratory disease, diarrhoeal disease, skin infection, and intestinal worms are the commonest causes of illness, accounting for about 70 percent of all outpatient morbidity. This pattern has persisted during the past decade. Poverty has declined from 56 percent in the 1990s to 46 by 2006 (KNBS 2006). The national coverage of nurses is 120 nurses per 100,000 population while that of medical doctors is 15 per 100,000 population (KNBS 2007b).
Table 1.1: Selected Socioeconomic Indicators for Kenya Indicators Value Year
Population (millions) 37 2007 projection
GDP per capita (KSh) 48,770 2007
Infant mortality (per 1,000 live births) 60 2006
Under-five mortality (per 1,000 live births) 92 2006
Household Survey of Health Care Utilisation and Expenditure, 2007, Kenya
| Introduction 3
Life expectancy (years) Male 54.3 2006
estimates Female 59.1
Total fertility rate 5.0 2006
Maternal mortality (per 100,000 live births) 414 2003
Childhood stunting (percent) 34.7 2006
Sources: KNBS 2006, 2007a, 2007b
1.3 Health Care Delivery System in Kenya
A large network of government, faith-based organisation (FBO), and private sector health facilities deliver most health care services in Kenya. Kenya also has a very small non-formal private sector, comprising traditional healers/herbalists and traditional birth attendants and shops, which are major outlet for over-the-counter medicines. The public and private health sectors are complementary. Kenya’s public health care system delivers the largest share of services. It is organised as a multi-tiered referral pyramid. At the bottom of the pyramid are dispensaries and health centres responsible for providing primary health care and inpatient services, mainly maternity services at the health centres. Above this level are sub-district and district hospitals. Provincial general hospitals form another tier of the health care system. At the top of the pyramid are the national hospitals, which function as tertiary care referral facilities and professional training and medical research hubs. The private health sector (including FBOs) comprises hospitals, health centres, and clinics. There are also traditional healers and herbalists. The second National Health Sector Strategic Plan (NHSSP II 2005–2010), launched in 2005, sets out the agenda for the sector, and defines the vision of “creating an efficient and high quality health system that is accessible, equitable and affordable for every Kenyan household”. Its mission is to “promote and participate in the provision of integrated and high quality curative, preventive, promotive and rehabilitative health care services to all Kenyans.” The Ministry of Health, therefore, expects better access to contribute to the improvement of health outcomes and elimination
Household Survey of Health Care Utilisation and Expenditure, 2007, Kenya
| Introduction 4
of disparities. The low level of cost recovery in Kenyan public health facilities implies that the public health facilities will continue to depend substantially on the government budget for most of their resources.
1.4 Role of Households in Health Care Financing
Kenya’s health financing system consists of three main sub-systems: the public sector, health insurance, and the private sector, including households. The Kenyan government continues to implement programmes to increase accessibility of health care services amongst the population. The implications on the financing of health care services are substantial, partly due to high population growth. Kenyans continue to be overburdened by the out-of-pocket (OOP) health financing, which may be a barrier to access of health care. However, due to the increased investment in health by the government and donors, the levels of OOP expenditures have declined over the last five years.
1.5 Objectives of the Household Survey
The goal of the survey was to obtain information on the health care seeking behaviour and expenditures in Kenya. Specifically, the following were the key objectives:
a) To document the health care seeking behaviour amongst the Kenyan population and assess how care seeking behaviour varies with demographic characteristics;
b) To collect information on health care service utilisation;
c) To gain an insight into the health expenditures made by the
household members when they consulted health care providers and analyse how these expenditures vary with socioeconomic and demographic characteristics; and
d) To investigate the patterns of outpatient and inpatient health
care use and choice and perception of provider type.
1.6 Rationale for the Survey
Access to health care services is an important policy concern, reflecting both efforts to improve health outcomes and to meet international obligations. Although the need to improve physical access through expansion of the network of facilities continues,
Household Survey of Health Care Utilisation and Expenditure, 2007, Kenya
| Introduction 5
individuals make active choices about whether or not to use the provided services. Actual utilisation of health services may differ in accordance with demand factors such as income, cost of care, education, social norms and traditions, and the quality and appropriateness of the services provided. Hence, apart from addressing the issue of physical access, there is need to understand what factors affect health care decisions, and why low levels of utilisation persist amongst certain socioeconomic groups or geographic regions. Health care utilisation is interesting to study from an efficiency perspective, as health is the foundation for work productivity, education (the capacity to learn), and the capacity to grow physically and emotionally. At the macroeconomic level, good health in the population is a critical input into poverty reduction, economic growth, and long-term economic development. Very few studies provide information about Kenyan populations’ health care use and expenditures in relation to their socioeconomic and demographic characteristics. Increased knowledge about which population groups have high health expenditures and their utilisation patterns will aid policymakers and health care providers in developing services for specific population groups. Furthermore, it is important to understand how households finance their health care. As public health sector budgets remain tight, health care expenditures become increasingly important to policymakers exploring alternative mechanisms to finance health care services. This survey was conducted while the Ministry of Health was working on a health care financing strategy whose focus was to develop a policy framework that will ensure a long-term, fiscally sustainable, equitable, and efficient approach to financing health services in Kenya. Assessment of utilisation and coverage of health services and determinants of household decisions regarding the choice of provider and utilisation of health care services can assist policymakers during the development of the health care financing strategy to:
Identify bottlenecks in the provision of health care services; Help to analyse the constraining factors and to select
effective measures to improve services; and
Identify patterns of service use by various socioeconomic factors.
Household Survey of Health Care Utilisation and Expenditure, 2007, Kenya
| Introduction 6
Knowledge of these issues can point to certain policy instruments that will promote appropriate use as well as enhance equity in health service utilisation.
1.7 Organisation of the Report
The structure of the report is as follows. Chapter 2 presents the survey methodology, which highlights the survey design and sampling, training, data collection, and data analysis. Chapter 3 deals with demographic and socioeconomic information of the households, while Chapter 4 presents the housing and household amenities. Chapter 5 presents the utilisation of outpatient health services, OOP expenditures, and factors contributing to utilisation of outpatient health care. Utilisation of inpatient health care is presented in Chapter 6, while Chapter 7 presents the health insurance coverage. Annexes show detailed survey results.
1.8 Principal Questions Addressed in this Survey
This report presents the findings of analyses of utilisation of health care and the determinants of use and the levels of OOP health care payments by households in Kenya. The household survey addresses the following questions:
a) What are the health status perceptions of household members?
b) What is the utilisation pattern of health care services?
c) What are household OOP health care expenditure patterns?
d) How does health care expenditure differ amongst various socioeconomic groups?
e) How well are households able to meet household members’ health needs?
f) What factors influence health care seeking behaviour by households? How do these factors vary by socioeconomic conditions of households?
g) What policy recommendations do the data suggest, especially for health care financing?
Household Survey of Health Care Utilisation and Expenditure, 2007, Kenya
| Survey Methodology 7
2 Survey Methodology This chapter presents the survey methodology. The topics discussed are the sample size and allocation to the provinces, training, data collection, and data processing. The household survey was conducted during the last quarter of 2007 in all the provinces of the country.
2.1 Sample Size and Allocation to the Provinces
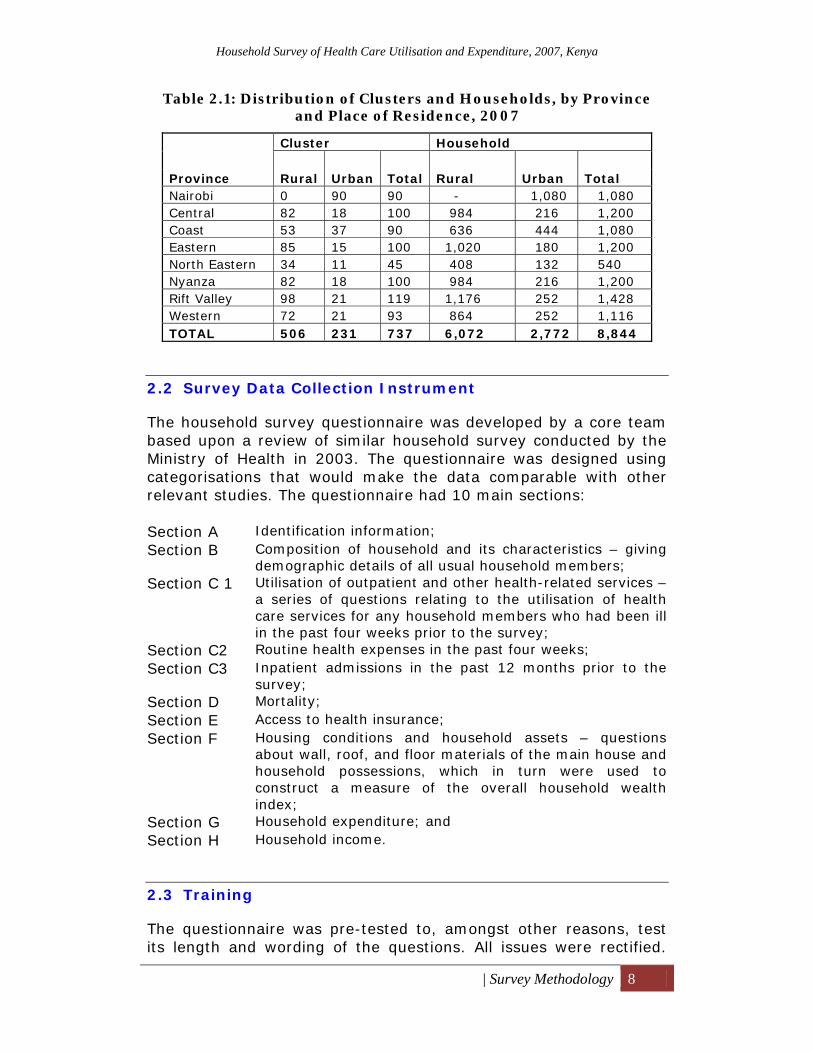
Kenya is divided into eight provinces. The provinces are in turn subdivided into districts. Each district is subdivided into divisions, each division into locations, and each location into sub-locations. During the 1999 population census, each sub-location was subdivided into smaller units called Enumeration Areas (EAs). The EAs provided census information on households and population. This information was used in the design of the National Sample Survey Evaluation Programme IV (NASSEP) master sample. The cartographic records for each EA in the master sample are regularly updated in the field. The frame covered all the districts of the country. The frame extended to the rural areas of the North Eastern Province and other areas of the Arid and Semi Arid Lands in Rift Valley province, which were not covered by earlier sampling frames (NASSEP I-III). The survey covered all provinces and districts of the country. A total of 737 clusters were selected and divided into 506 (68.7 percent) rural and 231 urban clusters (Table 2.1). The sample of households interviewed in 2007 consisted, to the extent possible, of the same households that were in the sample for the 2003 household survey. Thereafter, 12 households were systematically randomly selected from each cluster. The sample, therefore, consisted of 8,844 households, 2,772 urban and 6,072 rural. The sample was selected in a way that ensured that: • The entire sample was nationally representative; • The urban (rural) sample was representative of urban (rural)
households; and • Each provincial sample was representative at the province
level. This design allowed for analysis at national, provincial, and urban/rural levels.
Household Survey of Health Care Utilisation and Expenditure, 2007, Kenya
| Survey Methodology 8
Table 2.1: Distribution of Clusters and Households, by Province and Place of Residence, 2007
2.2 Survey Data Collection Instrument
The household survey questionnaire was developed by a core team based upon a review of similar household survey conducted by the Ministry of Health in 2003. The questionnaire was designed using categorisations that would make the data comparable with other relevant studies. The questionnaire had 10 main sections: Section A Identification information; Section B Composition of household and its characteristics – giving
demographic details of all usual household members; Section C 1 Utilisation of outpatient and other health-related services –
a series of questions relating to the utilisation of health care services for any household members who had been ill in the past four weeks prior to the survey;
Section C2 Routine health expenses in the past four weeks; Section C3 Inpatient admissions in the past 12 months prior to the
survey; Section D Mortality; Section E Access to health insurance; Section F Housing conditions and household assets – questions
about wall, roof, and floor materials of the main house and household possessions, which in turn were used to construct a measure of the overall household wealth index;
Section G Household expenditure; and Section H Household income.
2.3 Training
The questionnaire was pre-tested to, amongst other reasons, test its length and wording of the questions. All issues were rectified.
Province
Cluster Household
Rural Urban Total Rural Urban Total Nairobi 0 90 90 - 1,080 1,080 Central 82 18 100 984 216 1,200 Coast 53 37 90 636 444 1,080 Eastern 85 15 100 1,020 180 1,200 North Eastern 34 11 45 408 132 540 Nyanza 82 18 100 984 216 1,200 Rift Valley 98 21 119 1,176 252 1,428 Western 72 21 93 864 252 1,116 TOTAL 506 231 737 6,072 2,772 8,844
Household Survey of Health Care Utilisation and Expenditure, 2007, Kenya
| Survey Methodology 9
Subsequently, two levels of training were held. First, a training of trainers was undertaken. The participants became trainers in the provinces/regions to which they were subsequently deployed. The second level of training was conducted in ten regional centres. The participants were the survey interviewers and the district statistical officers who became the survey coordinators in their respective districts. During the training, the participants were informed of the main objectives of the survey and how the collected information would be used. They were also informed that their participation in the survey would provide valuable input toward improving the health services. The participants received a detailed interviewer manual that included guidelines for conducting an interview and specific instructions for the questions. On the whole, the training included: • General training related to basic interview techniques; • Special sessions on how to fill out the questionnaire; • Opportunities for the role play and mock interviews; and • Field practice conducted in locations not selected for the
survey.
2.4 Data Collection
The fieldwork for the survey was carried out in September and October 2007. Respondents were informed that information provided would be treated in a confidential manner.
The head of the household was targeted to be the main respondent for the survey. However, if the head could not be contacted, another adult in household who was knowledgeable about household expenditures and utilisation of health care was interviewed. These household representatives provided information on the household's health situation, health care utilisation, health expenditures, households’ expenditures in other areas, and household income and assets.
2.5 Data Processing
Completed questionnaires were sent by the field supervisors as soon as sufficient numbers were accumulated. Data processing was conducted by a team assembled specially for the task. The data were entered into computers using CSPro software. Data from all questionnaires were re-entered for verification using a different data entry team. Data editors reviewed the entered data for consistency and completeness, and corrected any errors found.
Household Survey of Health Care Utilisation and Expenditure, 2007, Kenya
| Survey Methodology 10
2.6 Data Analysis
A tabulation plan was developed prior to data processing and reviewed by the Technical Working Group. Upon completion of data entry and editing, a clean data file was imported into SPSS and a set of preliminary tabulations produced. Weights were applied to the estimates to reflect the probability of inclusion of each household in the sample, and to bring the age and sex distribution into conformity with KNBS projections. These were reviewed and, where necessary, additional tabulations were made to clarify the preliminary findings.
2.7 Wealth Index
A wealth index was calculated based on various household amenities, convenience facilities, and other socioeconomic characteristics. The index categorised the households into five quintiles: 1) Poorest, 2) Second poorest, 3) Middle, 4) Fourth richest and 5) Richest.
2.8 Sample Coverage and Response Rates
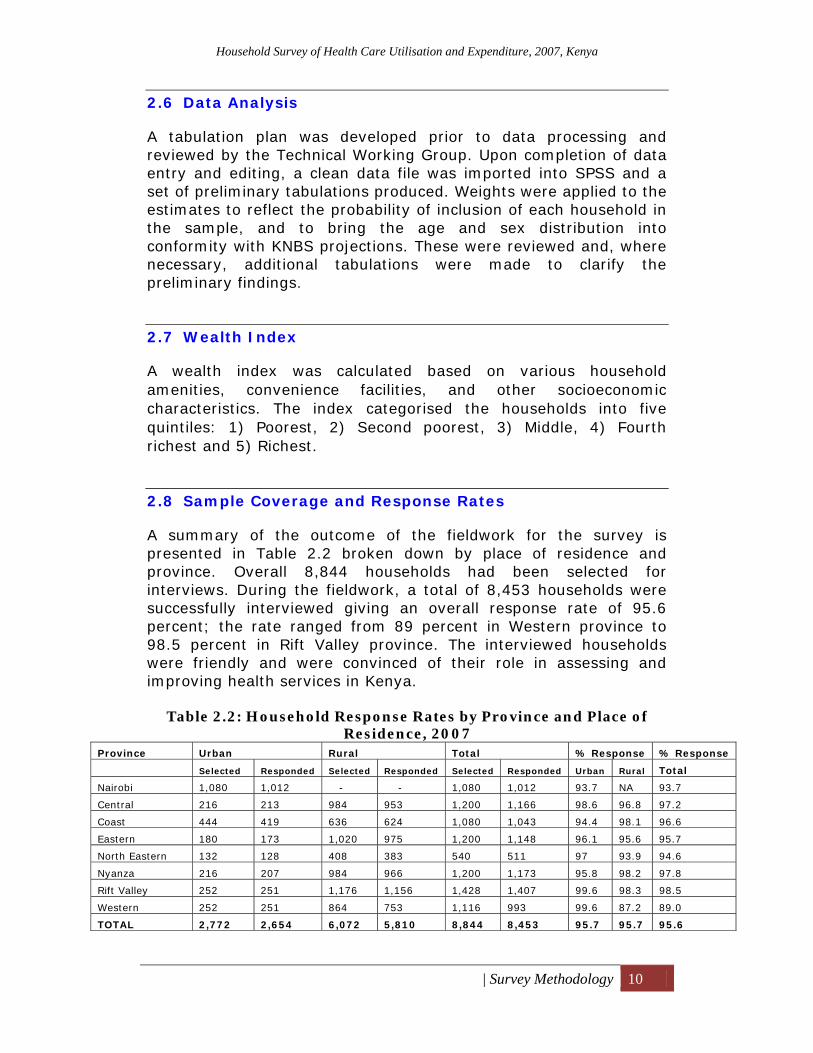
A summary of the outcome of the fieldwork for the survey is presented in Table 2.2 broken down by place of residence and province. Overall 8,844 households had been selected for interviews. During the fieldwork, a total of 8,453 households were successfully interviewed giving an overall response rate of 95.6 percent; the rate ranged from 89 percent in Western province to 98.5 percent in Rift Valley province. The interviewed households were friendly and were convinced of their role in assessing and improving health services in Kenya.
Table 2.2: Household Response Rates by Province and Place of Residence, 2007
Province Urban Rural Total % Response % Response
Selected Responded Selected Responded Selected Responded Urban Rural Total
Nairobi 1,080 1,012 - - 1,080 1,012 93.7 NA 93.7
Central 216 213 984 953 1,200 1,166 98.6 96.8 97.2
Coast 444 419 636 624 1,080 1,043 94.4 98.1 96.6
Eastern 180 173 1,020 975 1,200 1,148 96.1 95.6 95.7
North Eastern 132 128 408 383 540 511 97 93.9 94.6
Nyanza 216 207 984 966 1,200 1,173 95.8 98.2 97.8
Rift Valley 252 251 1,176 1,156 1,428 1,407 99.6 98.3 98.5
Western 252 251 864 753 1,116 993 99.6 87.2 89.0
TOTAL 2,772 2,654 6,072 5,810 8,844 8,453 95.7 95.7 95.6
Household Survey of Health Care Utilisation and Expenditure, 2007, Kenya
| Household Demographic and Socioeconomic Characteristics 11
3 Household Demographic and Socioeconomic Characteristics
This chapter presents results on basic socioeconomic and demographic characteristics of Kenyan households based on information collected in the survey household questionnaire. The information was collected for persons who usually live in the sampled households.
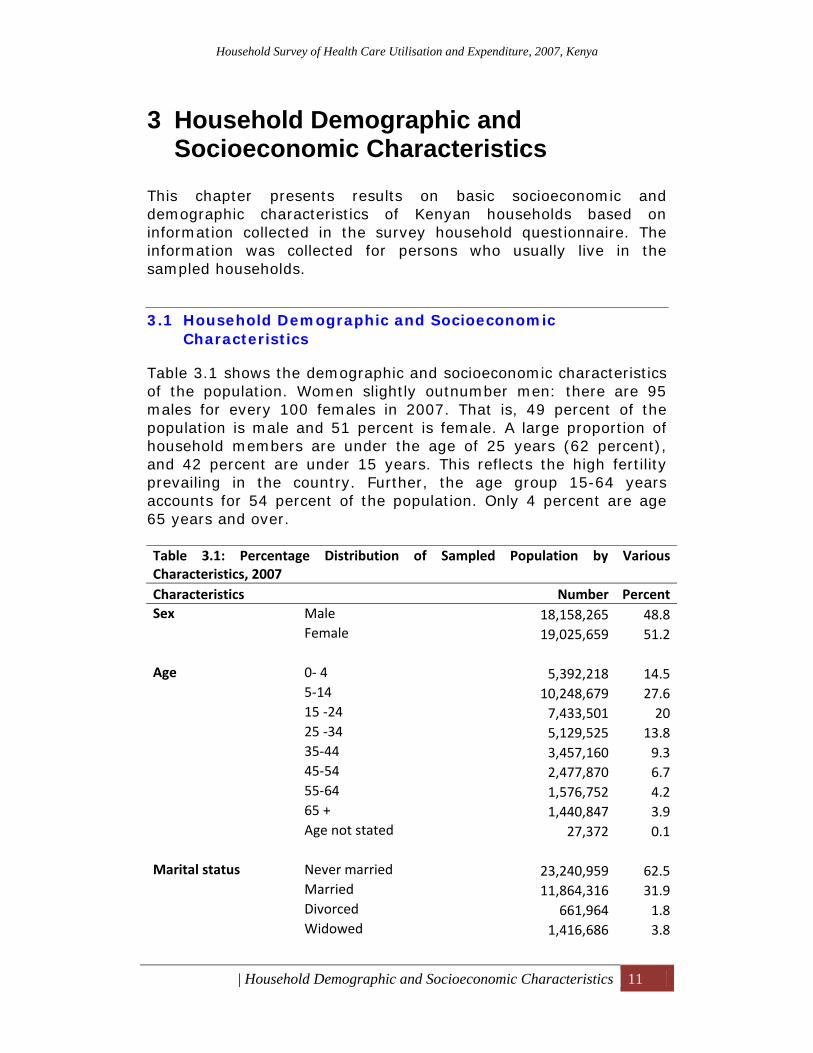
3.1 Household Demographic and Socioeconomic Characteristics
Table 3.1 shows the demographic and socioeconomic characteristics of the population. Women slightly outnumber men: there are 95 males for every 100 females in 2007. That is, 49 percent of the population is male and 51 percent is female. A large proportion of household members are under the age of 25 years (62 percent), and 42 percent are under 15 years. This reflects the high fertility prevailing in the country. Further, the age group 15-64 years accounts for 54 percent of the population. Only 4 percent are age 65 years and over. Table 3.1: Percentage Distribution of Sampled Population by Various Characteristics, 2007 Characteristics Number PercentSex Male 18,158,265 48.8
Female 19,025,659 51.2 Age 0‐ 4 5,392,218 14.5
5‐14 10,248,679 27.615 ‐24 7,433,501 2025 ‐34 5,129,525 13.835‐44 3,457,160 9.345‐54 2,477,870 6.755‐64 1,576,752 4.265 + 1,440,847 3.9Age not stated 27,372 0.1
Marital status Never married 23,240,959 62.5
Married 11,864,316 31.9Divorced 661,964 1.8Widowed 1,416,686 3.8
Household Survey of Health Care Utilisation and Expenditure, 2007, Kenya
| Household Demographic and Socioeconomic Characteristics 12
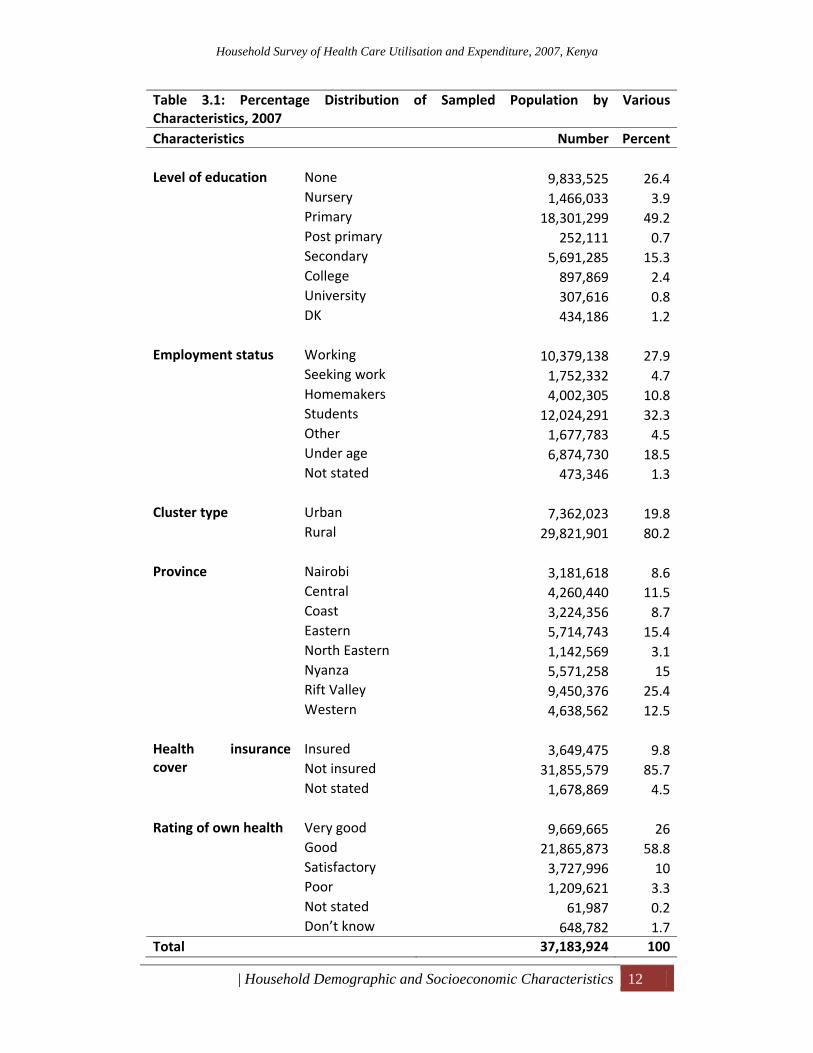
Table 3.1: Percentage Distribution of Sampled Population by Various Characteristics, 2007 Characteristics Number Percent Level of education None 9,833,525 26.4
Nursery 1,466,033 3.9Primary 18,301,299 49.2Post primary 252,111 0.7Secondary 5,691,285 15.3College 897,869 2.4University 307,616 0.8DK 434,186 1.2
Employment status Working 10,379,138 27.9
Seeking work 1,752,332 4.7Homemakers 4,002,305 10.8Students 12,024,291 32.3Other 1,677,783 4.5Under age 6,874,730 18.5Not stated 473,346 1.3
Cluster type Urban 7,362,023 19.8
Rural 29,821,901 80.2 Province Nairobi 3,181,618 8.6
Central 4,260,440 11.5Coast 3,224,356 8.7Eastern 5,714,743 15.4North Eastern 1,142,569 3.1Nyanza 5,571,258 15Rift Valley 9,450,376 25.4Western 4,638,562 12.5
Health insurance cover
Insured 3,649,475 9.8Not insured 31,855,579 85.7Not stated 1,678,869 4.5
Rating of own health Very good 9,669,665 26
Good 21,865,873 58.8Satisfactory 3,727,996 10Poor 1,209,621 3.3Not stated 61,987 0.2Don’t know 648,782 1.7
Total 37,183,924 100
Household Survey of Health Care Utilisation and Expenditure, 2007, Kenya
| Household Demographic and Socioeconomic Characteristics 13
3.2 Education Levels
Education is a human right and one of the major stimuli of development; as such, its importance cannot be overemphasised. Education is commonly seen as an indicator for socioeconomic development. Education insufficient to achieve basic literacy is unlikely to confer much benefit. As seen in Table 3.1, nearly half of the household members have a primary level of education.
3.3 Employment Status
Examining the composition of household population by employment status is vital for monitoring the development of a country. Employment of household members is an important indicator of the economic status of the household and hence a key determinant of wealth of the population. Information was collected with a reference period of the 12 months prior to the date of survey. Table 3.1 highlights the findings. Of the total population, only 28 percent are reported to be working (both formal and informal). An additional 5 percent of the population are seeking work. A third of the population are students. The student category was singled out because schooling is viewed as the most important means of drawing persons away from the labour market. Another 19 percent of the total population were too young to work.
3.4 Residence and Wealth Index
Eighty-two percent of the wealthiest households live in urban areas, while the majority of households in rural areas were in the poorest quintiles (Table 3.2). Thus, geography and wealth status are closely linked. However, because the wealth index is computed as a weighted sum of household goods and amenities, it may not value the possessions of agricultural households in the same way that the household assets would. While most urban households probably are wealthier than the average rural household, the index may overstate the disparity.
Household Survey of Health Care Utilisation and Expenditure, 2007, Kenya
| Household Demographic and Socioeconomic Characteristics 14
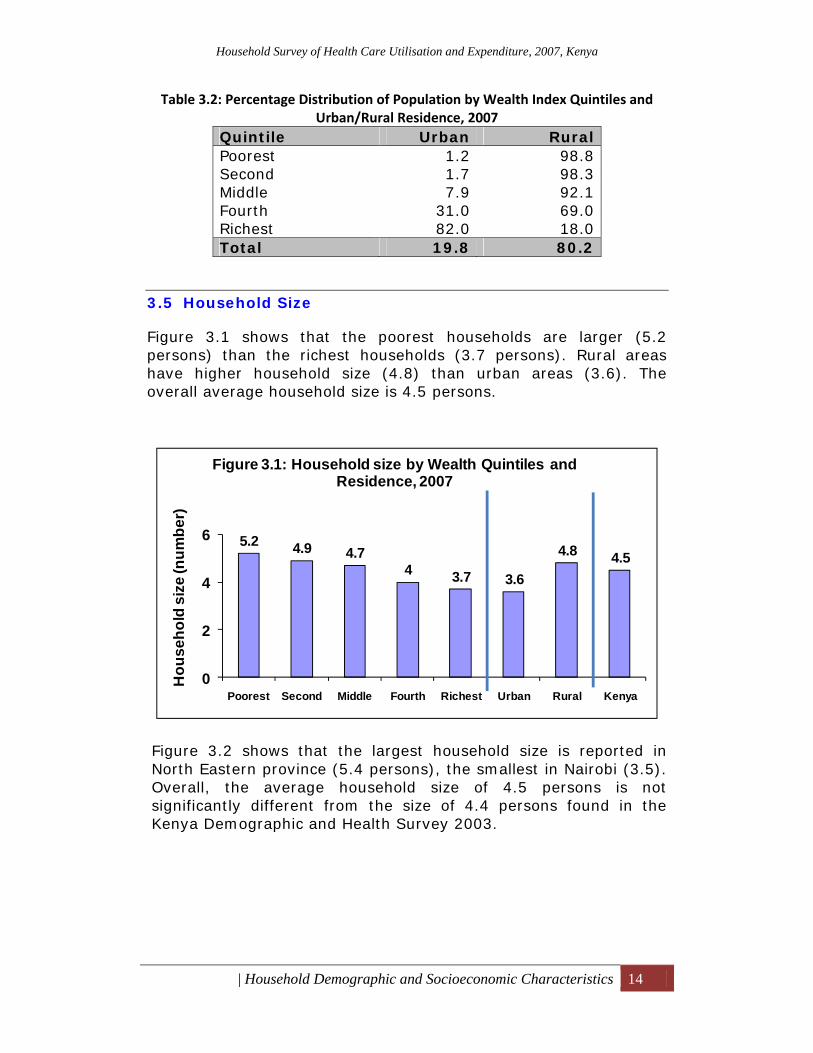
Table 3.2: Percentage Distribution of Population by Wealth Index Quintiles and Urban/Rural Residence, 2007
Quintile Urban Rural Poorest 1.2 98.8 Second 1.7 98.3 Middle 7.9 92.1 Fourth 31.0 69.0 Richest 82.0 18.0 Total 19.8 80.2
3.5 Household Size
Figure 3.1 shows that the poorest households are larger (5.2 persons) than the richest households (3.7 persons). Rural areas have higher household size (4.8) than urban areas (3.6). The overall average household size is 4.5 persons.
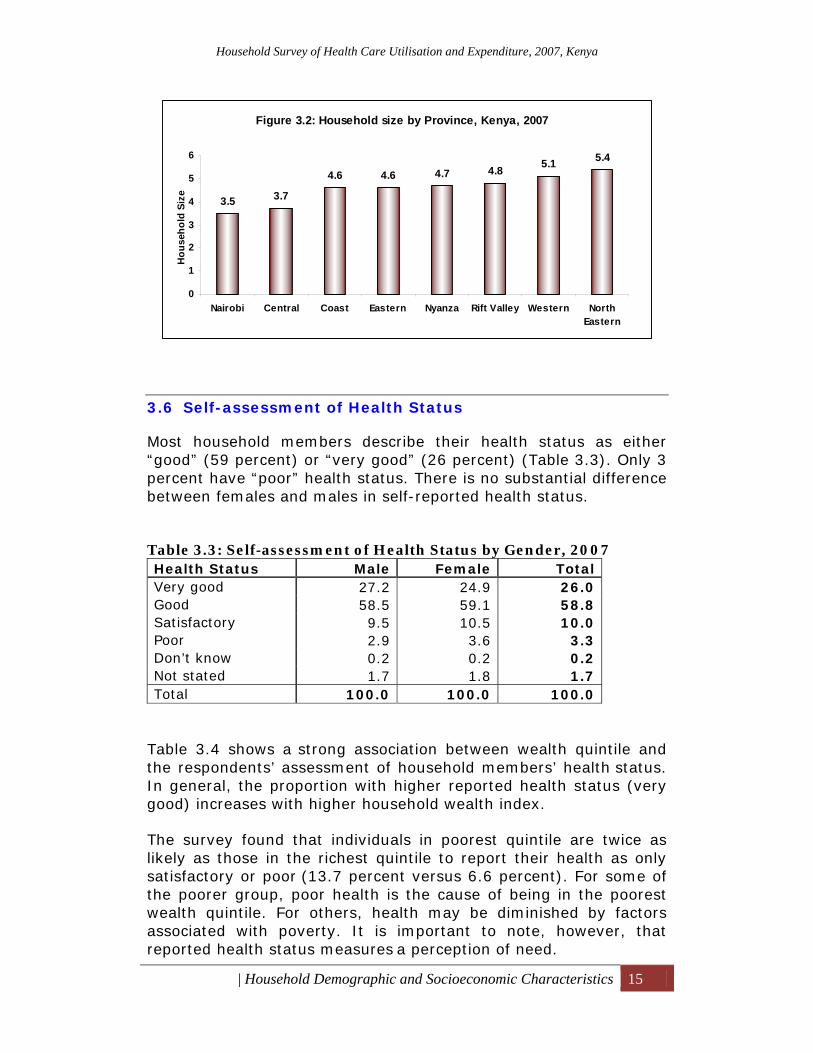
Figure 3.2 shows that the largest household size is reported in North Eastern province (5.4 persons), the smallest in Nairobi (3.5). Overall, the average household size of 4.5 persons is not significantly different from the size of 4.4 persons found in the Kenya Demographic and Health Survey 2003.
5.2 4.9 4.74 3.7 3.6
4.8 4.5
0
2
4
6
Poorest Second Middle Fourth Richest Urban Rural Kenya
Hou
seho
ld s
ize
(num
ber)
Figure 3.1: Household size by Wealth Quintiles and Residence, 2007
Household Survey of Health Care Utilisation and Expenditure, 2007, Kenya
| Household Demographic and Socioeconomic Characteristics 15
3.6 Self-assessment of Health Status
Most household members describe their health status as either “good” (59 percent) or “very good” (26 percent) (Table 3.3). Only 3 percent have “poor” health status. There is no substantial difference between females and males in self-reported health status. Table 3.3: Self-assessment of Health Status by Gender, 2007 Health Status Male Female Total Very good 27.2 24.9 26.0 Good 58.5 59.1 58.8 Satisfactory 9.5 10.5 10.0 Poor 2.9 3.6 3.3 Don’t know 0.2 0.2 0.2 Not stated 1.7 1.8 1.7 Total 100.0 100.0 100.0
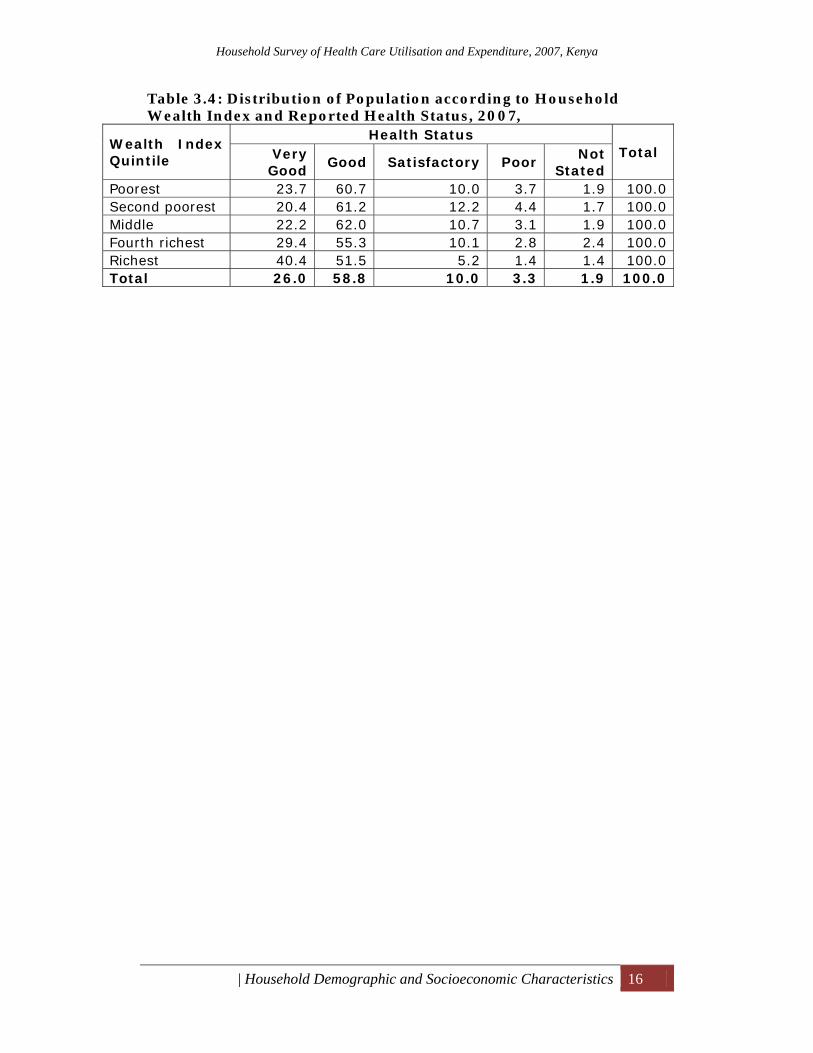
Table 3.4 shows a strong association between wealth quintile and the respondents’ assessment of household members’ health status. In general, the proportion with higher reported health status (very good) increases with higher household wealth index.
The survey found that individuals in poorest quintile are twice as likely as those in the richest quintile to report their health as only satisfactory or poor (13.7 percent versus 6.6 percent). For some of the poorer group, poor health is the cause of being in the poorest wealth quintile. For others, health may be diminished by factors
associated with poverty. It is important to note, however, that reported health status measures a perception of need.
Figure 3.2: Household size by Province, Kenya, 2007
3.5 3.7
4.6 4.6 4.7 4.8 5.1 5.4
0
1
2
3
4
5
6
Nairobi Central Coast Eastern Nyanza Rift Valley Western NorthEastern
Hou
seho
ld S
ize
Household Survey of Health Care Utilisation and Expenditure, 2007, Kenya
| Household Demographic and Socioeconomic Characteristics 16
Table 3.4: Distribution of Population according to Household Wealth Index and Reported Health Status, 2007,
Wealth Index Quintile
Health Status Total Very
Good Good Satisfactory Poor
Not Stated
Poorest 23.7 60.7 10.0 3.7 1.9 100.0 Second poorest 20.4 61.2 12.2 4.4 1.7 100.0 Middle 22.2 62.0 10.7 3.1 1.9 100.0 Fourth richest 29.4 55.3 10.1 2.8 2.4 100.0 Richest 40.4 51.5 5.2 1.4 1.4 100.0 Total 26.0 58.8 10.0 3.3 1.9 100.0

Household Survey of Health Care Utilisation and Expenditure, 2007, Kenya
| Housing and Household Amenities 17
4 Housing and Household Amenities One objective of the survey was to measure development indicators in the country by looking at the type of dwellings in which households live, and access to amenities such as piped water, electricity, and toilet facilities. Comparisons of 2003 and 2007 household survey results are made. The survey collected information on housing characteristics and household amenities. The housing characteristics included the type of dwelling occupied by the household, type of tenure, and type of roof, wall, and floor. Information on main water sources, toilet facilities, and type of fuel used by the households for both lighting and cooking was also collected. Information on these characteristics is useful in that it reflects on the households’ socioeconomic status from a public health point of view.
4.1 Distribution of Type of Dwellings
Only less than a third (28 percent) of the housing units in Kenya are permanent, while close to a half (49 percent) are semi-permanent (Table 4.1). As expected, Nairobi has the highest proportion of housing units that are permanent (64 percent) followed by Eastern province (36 percent); Nyanza province reports the least (15 percent). In urban areas, more than half (56 percent) of the housing units are permanent, compared with 19 percent in rural areas. Table 4.1: Percentage Distribution of Households by Housing Characteristic
Province/Residence
Type of Dwelling Permanent Semi-
permanent Temporary
Total
Nairobi 64.1 20.6 15.3 100.0
Central 28.8 49.9 21.3 100.0
Coast 28.9 41.7 29.4 100.0
Eastern 35.5 48.0 16.5 100.0
North Eastern 16.9 23.0 60.1 100.0
Nyanza 15.1 63.0 21.9 100.0
Rift Valley 22.3 52.8 24.9 100.0
Western 14.6 64.5 21.0 100.0
Urban 56.2 32.6 11.3 100.0
Rural 19.3 54.6 26.1 100.0
Total 28.3 49.2 22.5 100.0
Household Survey of Health Care Utilisation and Expenditure, 2007, Kenya
| Housing and Household Amenities 18
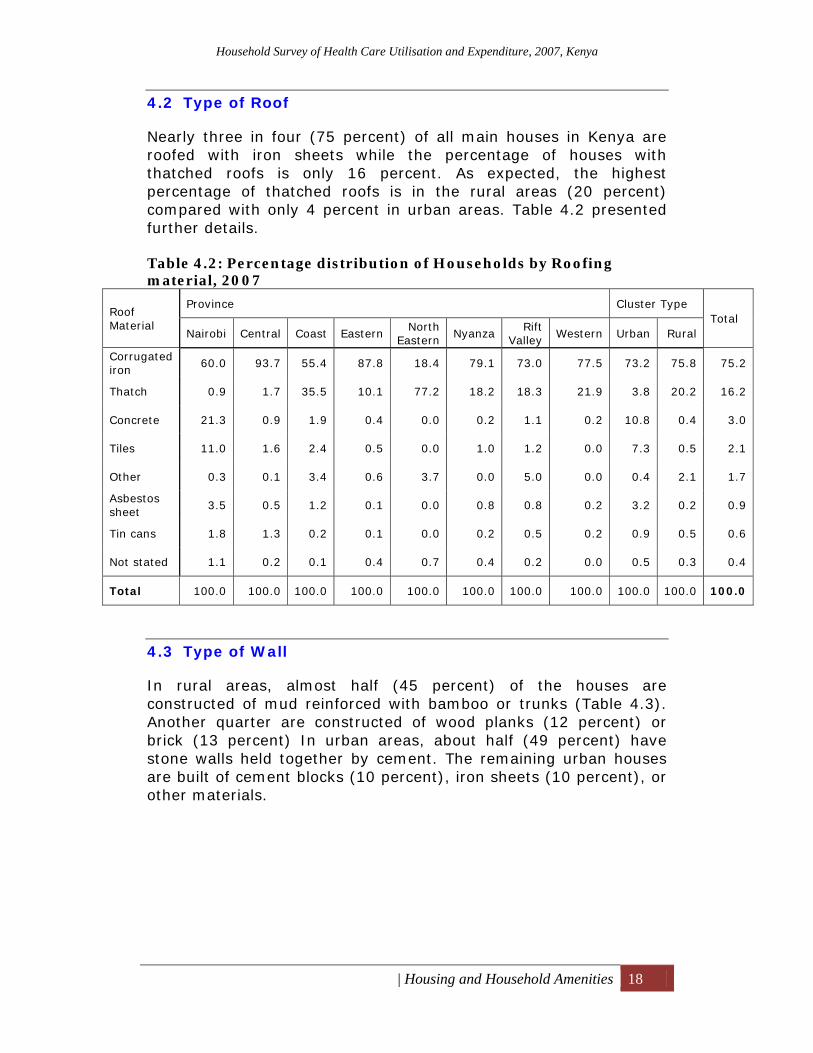
4.2 Type of Roof
Nearly three in four (75 percent) of all main houses in Kenya are roofed with iron sheets while the percentage of houses with thatched roofs is only 16 percent. As expected, the highest percentage of thatched roofs is in the rural areas (20 percent) compared with only 4 percent in urban areas. Table 4.2 presented further details. Table 4.2: Percentage distribution of Households by Roofing material, 2007
Roof Material
Province Cluster Type Total
Nairobi Central Coast Eastern North
Eastern Nyanza Rift
Valley Western Urban Rural
Corrugated iron
60.0 93.7 55.4 87.8 18.4 79.1 73.0 77.5 73.2 75.8 75.2
Thatch 0.9 1.7 35.5 10.1 77.2 18.2 18.3 21.9 3.8 20.2 16.2
Concrete 21.3 0.9 1.9 0.4 0.0 0.2 1.1 0.2 10.8 0.4 3.0
Tiles 11.0 1.6 2.4 0.5 0.0 1.0 1.2 0.0 7.3 0.5 2.1
Other 0.3 0.1 3.4 0.6 3.7 0.0 5.0 0.0 0.4 2.1 1.7
Asbestos sheet
3.5 0.5 1.2 0.1 0.0 0.8 0.8 0.2 3.2 0.2 0.9
Tin cans 1.8 1.3 0.2 0.1 0.0 0.2 0.5 0.2 0.9 0.5 0.6
Not stated 1.1 0.2 0.1 0.4 0.7 0.4 0.2 0.0 0.5 0.3 0.4
Total 100.0 100.0 100.0 100.0 100.0 100.0 100.0 100.0 100.0 100.0 100.0
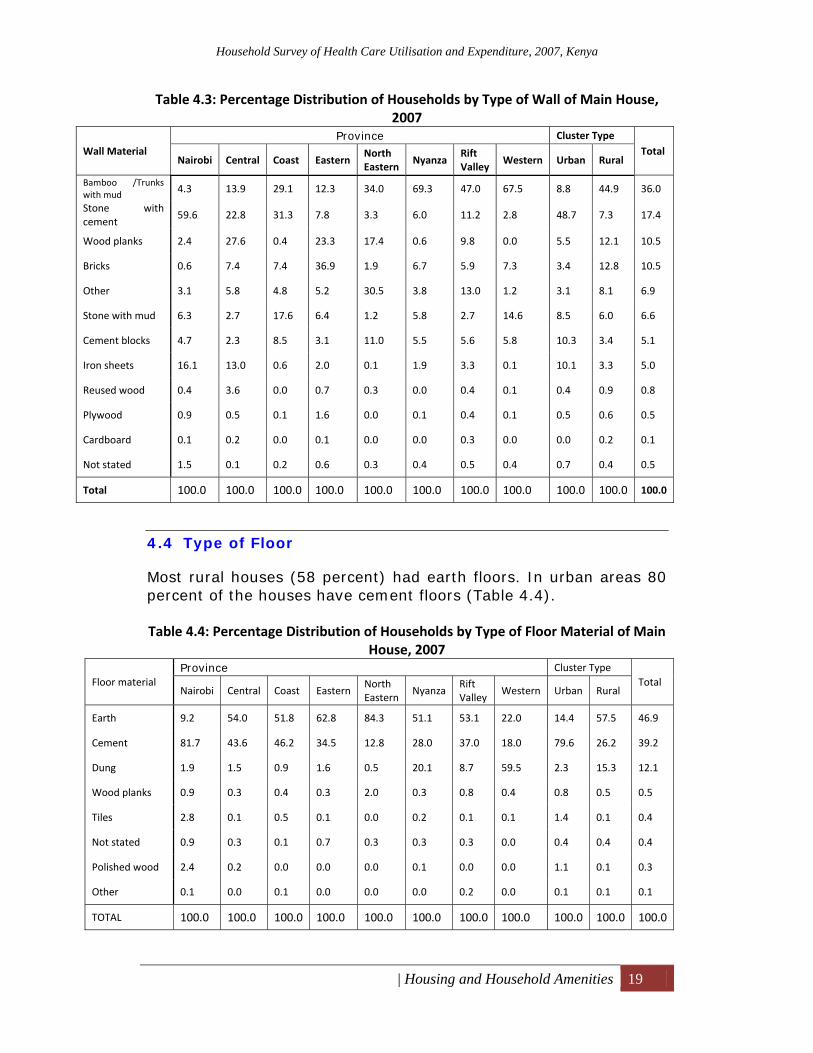
4.3 Type of Wall
In rural areas, almost half (45 percent) of the houses are constructed of mud reinforced with bamboo or trunks (Table 4.3). Another quarter are constructed of wood planks (12 percent) or brick (13 percent) In urban areas, about half (49 percent) have stone walls held together by cement. The remaining urban houses are built of cement blocks (10 percent), iron sheets (10 percent), or other materials.
Household Survey of Health Care Utilisation and Expenditure, 2007, Kenya
| Housing and Household Amenities 19
Table 4.3: Percentage Distribution of Households by Type of Wall of Main House, 2007
Wall Material Province Cluster Type
Total Nairobi Central Coast Eastern
North Eastern
Nyanza Rift Valley
Western Urban Rural
Bamboo /Trunks with mud 4.3 13.9 29.1 12.3 34.0 69.3 47.0 67.5 8.8 44.9 36.0
Stone with cement
59.6 22.8 31.3 7.8 3.3 6.0 11.2 2.8 48.7 7.3 17.4
Wood planks 2.4 27.6 0.4 23.3 17.4 0.6 9.8 0.0 5.5 12.1 10.5
Bricks 0.6 7.4 7.4 36.9 1.9 6.7 5.9 7.3 3.4 12.8 10.5
Other 3.1 5.8 4.8 5.2 30.5 3.8 13.0 1.2 3.1 8.1 6.9
Stone with mud 6.3 2.7 17.6 6.4 1.2 5.8 2.7 14.6 8.5 6.0 6.6
Cement blocks 4.7 2.3 8.5 3.1 11.0 5.5 5.6 5.8 10.3 3.4 5.1
Iron sheets 16.1 13.0 0.6 2.0 0.1 1.9 3.3 0.1 10.1 3.3 5.0
Reused wood 0.4 3.6 0.0 0.7 0.3 0.0 0.4 0.1 0.4 0.9 0.8
Plywood 0.9 0.5 0.1 1.6 0.0 0.1 0.4 0.1 0.5 0.6 0.5
Cardboard 0.1 0.2 0.0 0.1 0.0 0.0 0.3 0.0 0.0 0.2 0.1
Not stated 1.5 0.1 0.2 0.6 0.3 0.4 0.5 0.4 0.7 0.4 0.5
Total 100.0 100.0 100.0 100.0 100.0 100.0 100.0 100.0 100.0 100.0 100.0
4.4 Type of Floor
Most rural houses (58 percent) had earth floors. In urban areas 80 percent of the houses have cement floors (Table 4.4). Table 4.4: Percentage Distribution of Households by Type of Floor Material of Main
House, 2007
Floor material Province Cluster Type
Total Nairobi Central Coast Eastern
North Eastern
Nyanza Rift Valley
Western Urban Rural
Earth 9.2 54.0 51.8 62.8 84.3 51.1 53.1 22.0 14.4 57.5 46.9
Cement 81.7 43.6 46.2 34.5 12.8 28.0 37.0 18.0 79.6 26.2 39.2
Dung 1.9 1.5 0.9 1.6 0.5 20.1 8.7 59.5 2.3 15.3 12.1
Wood planks 0.9 0.3 0.4 0.3 2.0 0.3 0.8 0.4 0.8 0.5 0.5
Tiles 2.8 0.1 0.5 0.1 0.0 0.2 0.1 0.1 1.4 0.1 0.4
Not stated 0.9 0.3 0.1 0.7 0.3 0.3 0.3 0.0 0.4 0.4 0.4
Polished wood 2.4 0.2 0.0 0.0 0.0 0.1 0.0 0.0 1.1 0.1 0.3
Other 0.1 0.0 0.1 0.0 0.0 0.0 0.2 0.0 0.1 0.1 0.1
TOTAL 100.0 100.0 100.0 100.0 100.0 100.0 100.0 100.0 100.0 100.0 100.0
Household Survey of Health Care Utilisation and Expenditure, 2007, Kenya
| Housing and Household Amenities 20
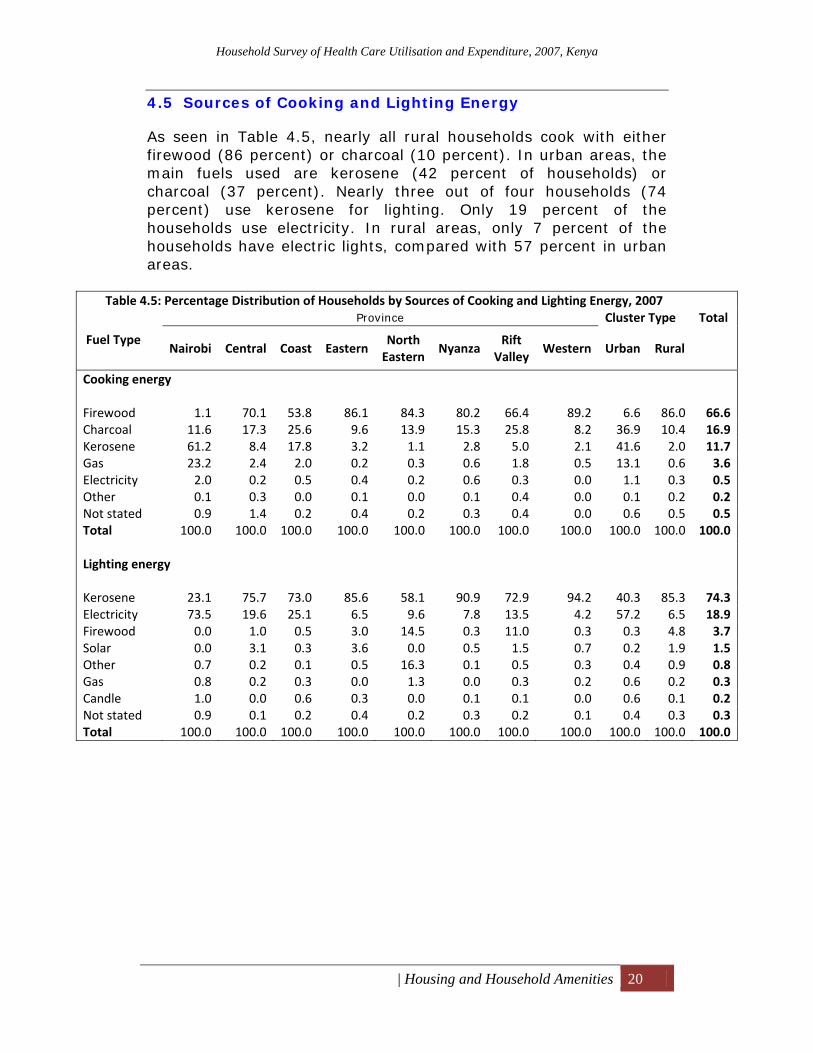
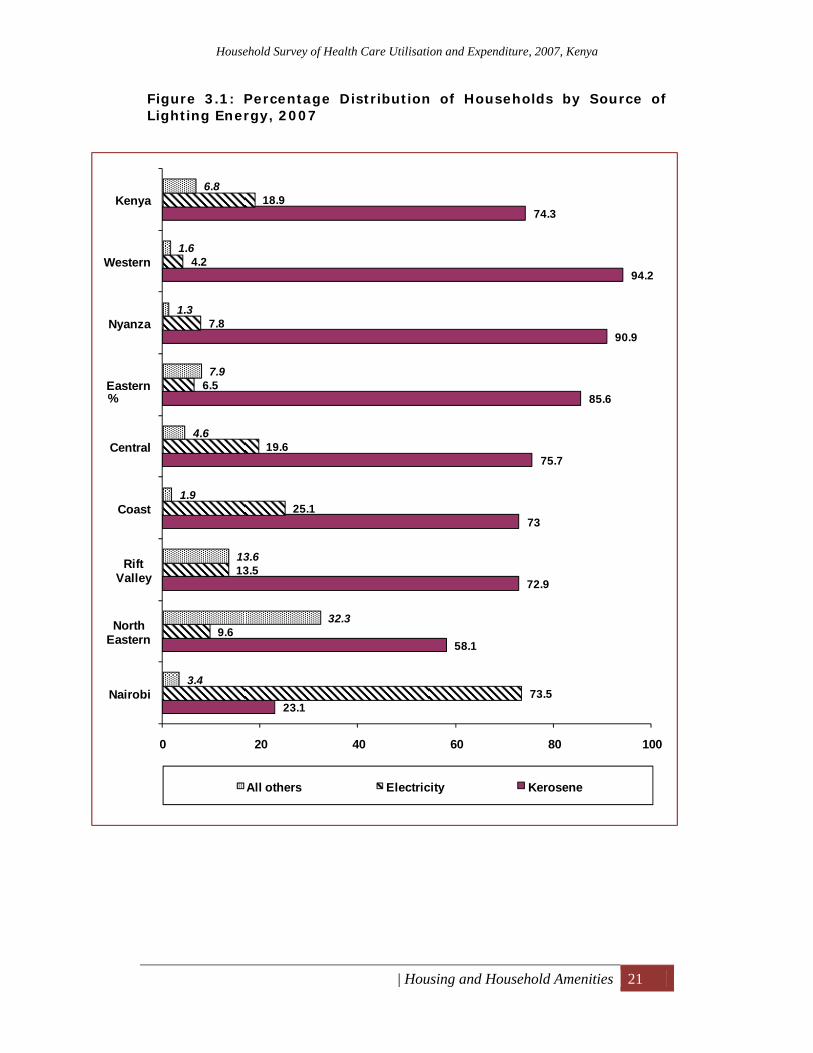
4.5 Sources of Cooking and Lighting Energy
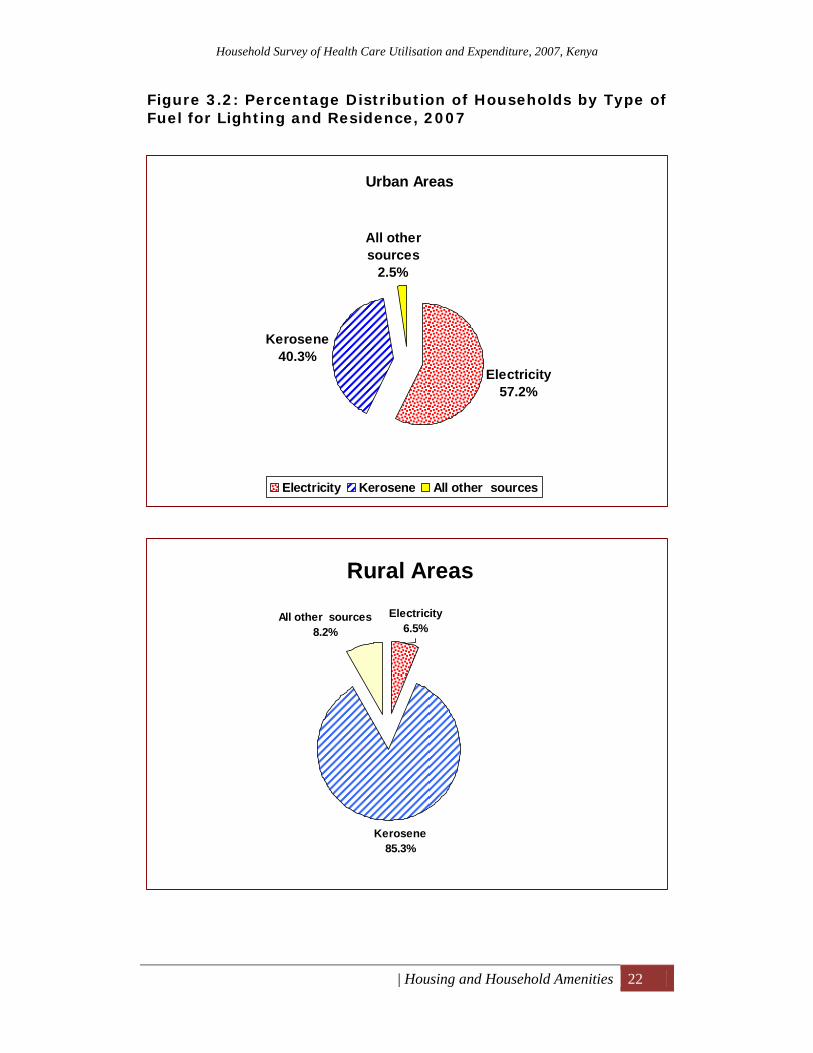
As seen in Table 4.5, nearly all rural households cook with either firewood (86 percent) or charcoal (10 percent). In urban areas, the main fuels used are kerosene (42 percent of households) or charcoal (37 percent). Nearly three out of four households (74 percent) use kerosene for lighting. Only 19 percent of the households use electricity. In rural areas, only 7 percent of the households have electric lights, compared with 57 percent in urban areas.
Table 4.5: Percentage Distribution of Households by Sources of Cooking and Lighting Energy, 2007
Fuel Type
Province Cluster Type Total
Nairobi Central Coast Eastern North Eastern
NyanzaRift
ValleyWestern Urban Rural
Cooking energy
Firewood 1.1 70.1 53.8 86.1 84.3 80.2 66.4 89.2 6.6 86.0 66.6Charcoal 11.6 17.3 25.6 9.6 13.9 15.3 25.8 8.2 36.9 10.4 16.9Kerosene 61.2 8.4 17.8 3.2 1.1 2.8 5.0 2.1 41.6 2.0 11.7Gas 23.2 2.4 2.0 0.2 0.3 0.6 1.8 0.5 13.1 0.6 3.6Electricity 2.0 0.2 0.5 0.4 0.2 0.6 0.3 0.0 1.1 0.3 0.5Other 0.1 0.3 0.0 0.1 0.0 0.1 0.4 0.0 0.1 0.2 0.2Not stated 0.9 1.4 0.2 0.4 0.2 0.3 0.4 0.0 0.6 0.5 0.5Total 100.0 100.0 100.0 100.0 100.0 100.0 100.0 100.0 100.0 100.0 100.0 Lighting energy
Kerosene 23.1 75.7 73.0 85.6 58.1 90.9 72.9 94.2 40.3 85.3 74.3Electricity 73.5 19.6 25.1 6.5 9.6 7.8 13.5 4.2 57.2 6.5 18.9Firewood 0.0 1.0 0.5 3.0 14.5 0.3 11.0 0.3 0.3 4.8 3.7Solar 0.0 3.1 0.3 3.6 0.0 0.5 1.5 0.7 0.2 1.9 1.5Other 0.7 0.2 0.1 0.5 16.3 0.1 0.5 0.3 0.4 0.9 0.8Gas 0.8 0.2 0.3 0.0 1.3 0.0 0.3 0.2 0.6 0.2 0.3Candle 1.0 0.0 0.6 0.3 0.0 0.1 0.1 0.0 0.6 0.1 0.2Not stated 0.9 0.1 0.2 0.4 0.2 0.3 0.2 0.1 0.4 0.3 0.3Total 100.0 100.0 100.0 100.0 100.0 100.0 100.0 100.0 100.0 100.0 100.0
Household Survey of Health Care Utilisation and Expenditure, 2007, Kenya
| Housing and Household Amenities 21
Figure 3.1: Percentage Distribution of Households by Source of Lighting Energy, 2007
23.1
58.1
72.9
73
75.7
85.6
90.9
94.2
74.3
73.5
9.6
13.5
25.1
19.6
6.5
7.8
4.2
18.9
3.4
32.3
13.6
1.9
4.6
7.9
1.3
1.6
6.8
0 20 40 60 80 100
Nairobi
North Eastern
Rift Valley
Coast
Central
Eastern
Nyanza
Western
Kenya
%
All others Electricity Kerosene
Household Survey of Health Care Utilisation and Expenditure, 2007, Kenya
| Housing and Household Amenities 22
Figure 3.2: Percentage Distribution of Households by Type of Fuel for Lighting and Residence, 2007
Urban Areas
Electricity57.2%
Kerosene40.3%
All other sources
2.5%
Electricity Kerosene All other sources
Rural Areas
Kerosene85.3%
All other sources8.2%
Electricity6.5%
Household Survey of Health Care Utilisation and Expenditure, 2007, Kenya
| Housing and Household Amenities 23
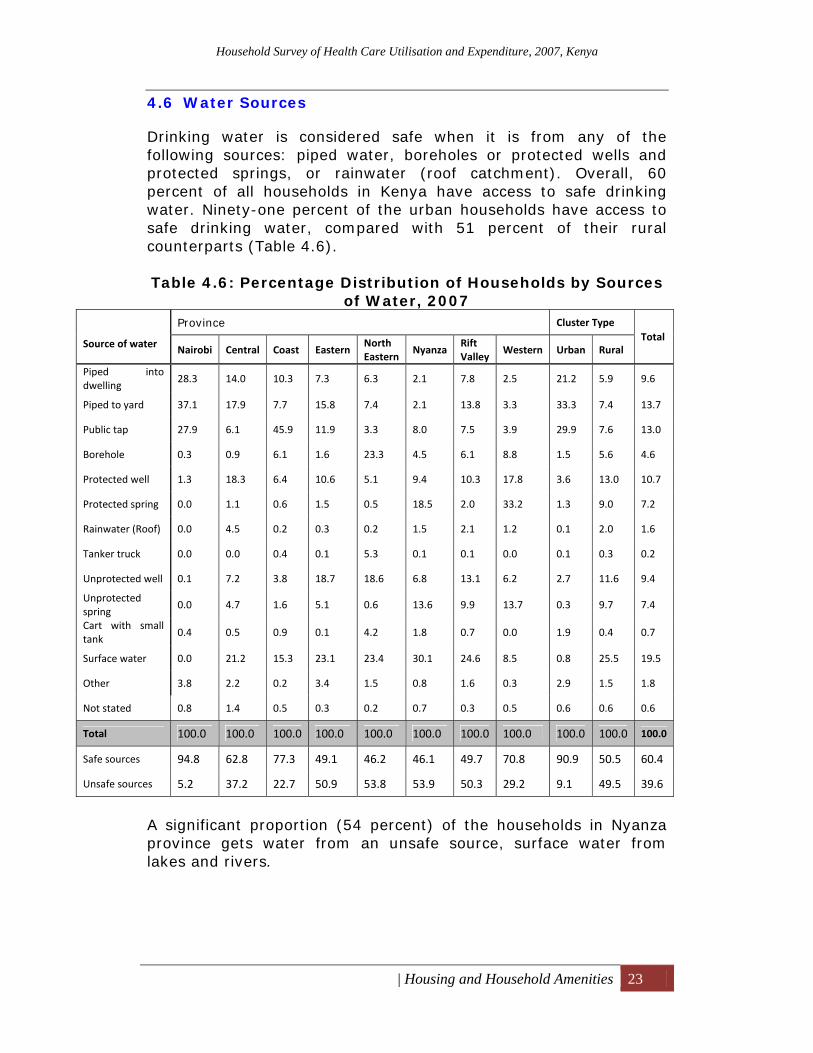
4.6 Water Sources
Drinking water is considered safe when it is from any of the following sources: piped water, boreholes or protected wells and protected springs, or rainwater (roof catchment). Overall, 60 percent of all households in Kenya have access to safe drinking water. Ninety-one percent of the urban households have access to safe drinking water, compared with 51 percent of their rural counterparts (Table 4.6). Table 4.6: Percentage Distribution of Households by Sources
of Water, 2007
Source of water
Province Cluster Type Total
Nairobi Central Coast Eastern North Eastern
Nyanza Rift Valley
Western Urban Rural
Piped into dwelling
28.3 14.0 10.3 7.3 6.3 2.1 7.8 2.5 21.2 5.9 9.6
Piped to yard 37.1 17.9 7.7 15.8 7.4 2.1 13.8 3.3 33.3 7.4 13.7
Public tap 27.9 6.1 45.9 11.9 3.3 8.0 7.5 3.9 29.9 7.6 13.0
Borehole 0.3 0.9 6.1 1.6 23.3 4.5 6.1 8.8 1.5 5.6 4.6
Protected well 1.3 18.3 6.4 10.6 5.1 9.4 10.3 17.8 3.6 13.0 10.7
Protected spring 0.0 1.1 0.6 1.5 0.5 18.5 2.0 33.2 1.3 9.0 7.2
Rainwater (Roof) 0.0 4.5 0.2 0.3 0.2 1.5 2.1 1.2 0.1 2.0 1.6
Tanker truck 0.0 0.0 0.4 0.1 5.3 0.1 0.1 0.0 0.1 0.3 0.2
Unprotected well 0.1 7.2 3.8 18.7 18.6 6.8 13.1 6.2 2.7 11.6 9.4
Unprotected spring
0.0 4.7 1.6 5.1 0.6 13.6 9.9 13.7 0.3 9.7 7.4
Cart with small tank
0.4 0.5 0.9 0.1 4.2 1.8 0.7 0.0 1.9 0.4 0.7
Surface water 0.0 21.2 15.3 23.1 23.4 30.1 24.6 8.5 0.8 25.5 19.5
Other 3.8 2.2 0.2 3.4 1.5 0.8 1.6 0.3 2.9 1.5 1.8
Not stated 0.8 1.4 0.5 0.3 0.2 0.7 0.3 0.5 0.6 0.6 0.6
Total 100.0 100.0 100.0 100.0 100.0 100.0 100.0 100.0 100.0 100.0 100.0
Safe sources 94.8 62.8 77.3 49.1 46.2 46.1 49.7 70.8 90.9 50.5 60.4
Unsafe sources 5.2 37.2 22.7 50.9 53.8 53.9 50.3 29.2 9.1 49.5 39.6
A significant proportion (54 percent) of the households in Nyanza province gets water from an unsafe source, surface water from lakes and rivers.
Household Survey of Health Care Utilisation and Expenditure, 2007, Kenya
| Housing and Household Amenities 24
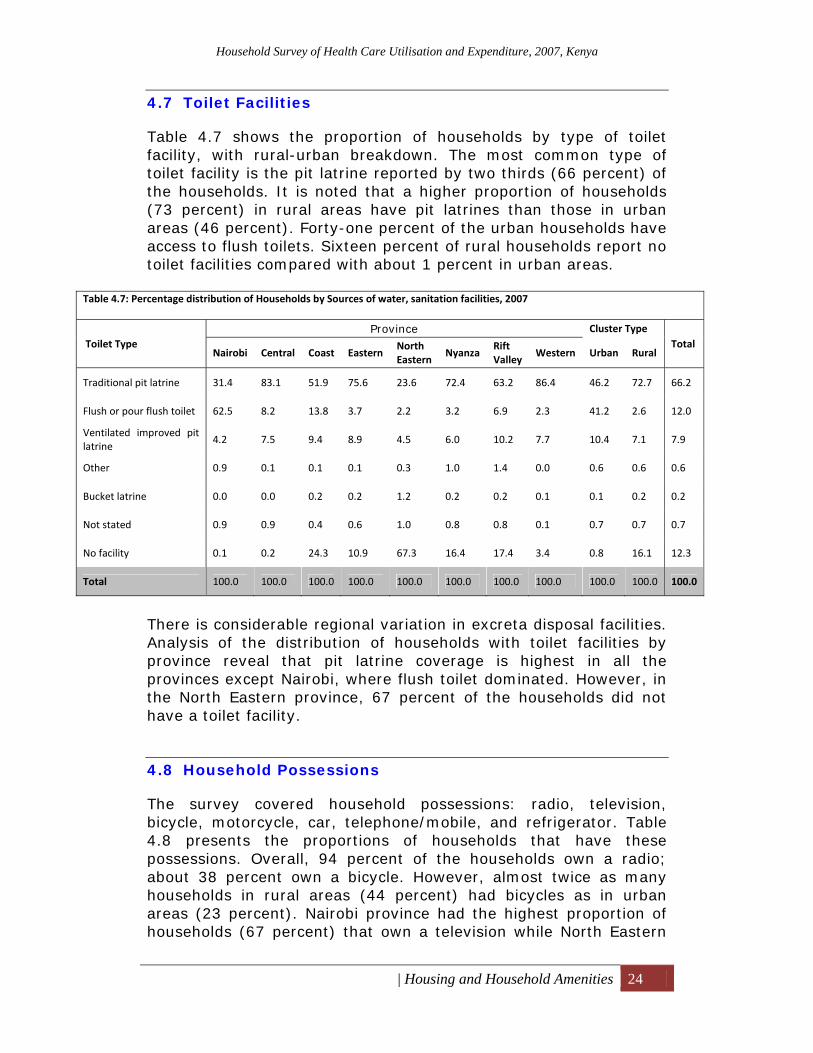
4.7 Toilet Facilities
Table 4.7 shows the proportion of households by type of toilet facility, with rural-urban breakdown. The most common type of toilet facility is the pit latrine reported by two thirds (66 percent) of the households. It is noted that a higher proportion of households (73 percent) in rural areas have pit latrines than those in urban areas (46 percent). Forty-one percent of the urban households have access to flush toilets. Sixteen percent of rural households report no toilet facilities compared with about 1 percent in urban areas.
Table 4.7: Percentage distribution of Households by Sources of water, sanitation facilities, 2007
Toilet Type Province Cluster Type
Total Nairobi Central Coast Eastern
North Eastern
Nyanza Rift Valley
Western Urban Rural
Traditional pit latrine 31.4 83.1 51.9 75.6 23.6 72.4 63.2 86.4 46.2 72.7 66.2
Flush or pour flush toilet 62.5 8.2 13.8 3.7 2.2 3.2 6.9 2.3 41.2 2.6 12.0
Ventilated improved pit latrine
4.2 7.5 9.4 8.9 4.5 6.0 10.2 7.7 10.4 7.1 7.9
Other 0.9 0.1 0.1 0.1 0.3 1.0 1.4 0.0 0.6 0.6 0.6
Bucket latrine 0.0 0.0 0.2 0.2 1.2 0.2 0.2 0.1 0.1 0.2 0.2
Not stated 0.9 0.9 0.4 0.6 1.0 0.8 0.8 0.1 0.7 0.7 0.7
No facility 0.1 0.2 24.3 10.9 67.3 16.4 17.4 3.4 0.8 16.1 12.3
Total 100.0 100.0 100.0 100.0 100.0 100.0 100.0 100.0 100.0 100.0 100.0
There is considerable regional variation in excreta disposal facilities. Analysis of the distribution of households with toilet facilities by province reveal that pit latrine coverage is highest in all the provinces except Nairobi, where flush toilet dominated. However, in the North Eastern province, 67 percent of the households did not have a toilet facility.
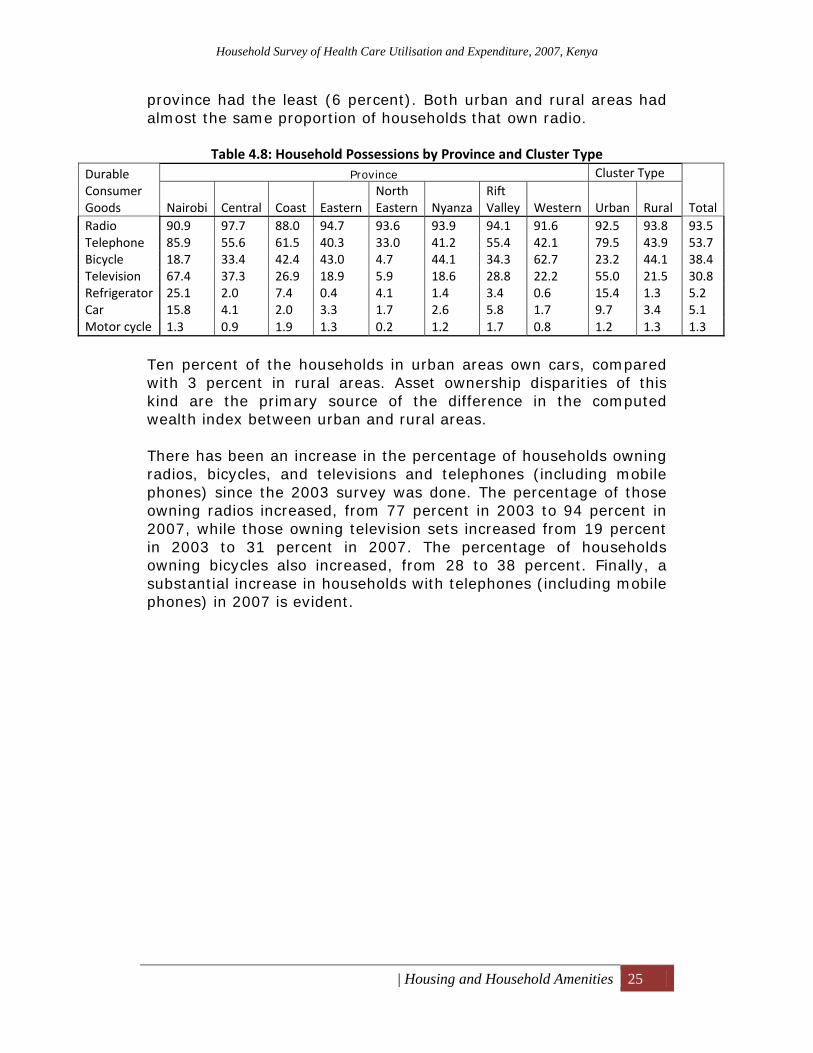
4.8 Household Possessions
The survey covered household possessions: radio, television, bicycle, motorcycle, car, telephone/mobile, and refrigerator. Table 4.8 presents the proportions of households that have these possessions. Overall, 94 percent of the households own a radio; about 38 percent own a bicycle. However, almost twice as many households in rural areas (44 percent) had bicycles as in urban areas (23 percent). Nairobi province had the highest proportion of households (67 percent) that own a television while North Eastern
Household Survey of Health Care Utilisation and Expenditure, 2007, Kenya
| Housing and Household Amenities 25
province had the least (6 percent). Both urban and rural areas had almost the same proportion of households that own radio.
Table 4.8: Household Possessions by Province and Cluster Type Durable Consumer Goods
Province Cluster Type
TotalNairobi Central Coast EasternNorth Eastern Nyanza
Rift Valley Western Urban Rural
Radio 90.9 97.7 88.0 94.7 93.6 93.9 94.1 91.6 92.5 93.8 93.5Telephone 85.9 55.6 61.5 40.3 33.0 41.2 55.4 42.1 79.5 43.9 53.7 Bicycle 18.7 33.4 42.4 43.0 4.7 44.1 34.3 62.7 23.2 44.1 38.4 Television 67.4 37.3 26.9 18.9 5.9 18.6 28.8 22.2 55.0 21.5 30.8 Refrigerator 25.1 2.0 7.4 0.4 4.1 1.4 3.4 0.6 15.4 1.3 5.2Car 15.8 4.1 2.0 3.3 1.7 2.6 5.8 1.7 9.7 3.4 5.1Motor cycle 1.3 0.9 1.9 1.3 0.2 1.2 1.7 0.8 1.2 1.3 1.3
Ten percent of the households in urban areas own cars, compared with 3 percent in rural areas. Asset ownership disparities of this kind are the primary source of the difference in the computed wealth index between urban and rural areas. There has been an increase in the percentage of households owning radios, bicycles, and televisions and telephones (including mobile phones) since the 2003 survey was done. The percentage of those owning radios increased, from 77 percent in 2003 to 94 percent in 2007, while those owning television sets increased from 19 percent in 2003 to 31 percent in 2007. The percentage of households owning bicycles also increased, from 28 to 38 percent. Finally, a substantial increase in households with telephones (including mobile phones) in 2007 is evident.
Household Survey of Health Care Utilisation and Expenditure, 2007, Kenya
| Utilisation of Outpatient Health Services and OOP Expenditures 26
5 Utilisation of Outpatient Health Services and OOP Expenditures
This chapter presents the pattern of utilisation of outpatient health care services, frequency of use, and factors that determine this use.
5.1 Frequency of Illness and Per Capita Visits for Outpatient Health Care Services
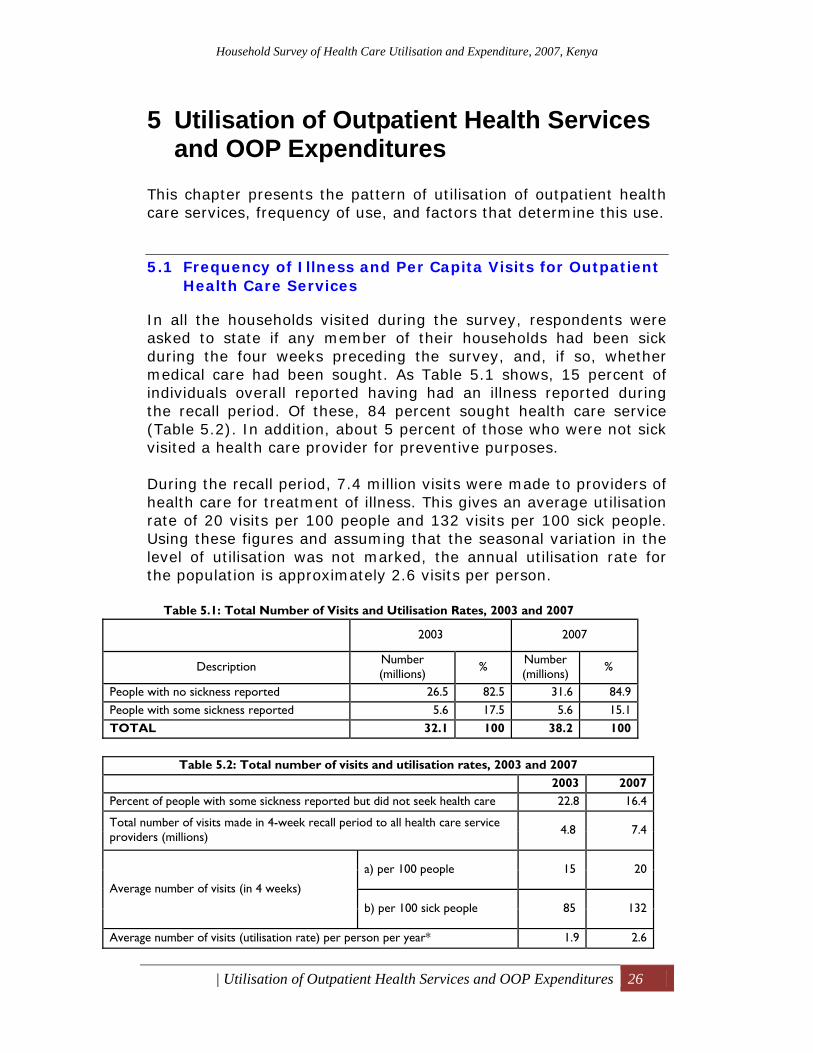
In all the households visited during the survey, respondents were asked to state if any member of their households had been sick during the four weeks preceding the survey, and, if so, whether medical care had been sought. As Table 5.1 shows, 15 percent of individuals overall reported having had an illness reported during the recall period. Of these, 84 percent sought health care service (Table 5.2). In addition, about 5 percent of those who were not sick visited a health care provider for preventive purposes. During the recall period, 7.4 million visits were made to providers of health care for treatment of illness. This gives an average utilisation rate of 20 visits per 100 people and 132 visits per 100 sick people. Using these figures and assuming that the seasonal variation in the level of utilisation was not marked, the annual utilisation rate for the population is approximately 2.6 visits per person.
Table 5.1: Total Number of Visits and Utilisation Rates, 2003 and 2007
2003 2007
Description Number (millions) % Number
(millions) %
People with no sickness reported 26.5 82.5 31.6 84.9 People with some sickness reported 5.6 17.5 5.6 15.1 TOTAL 32.1 100 38.2 100
Table 5.2: Total number of visits and utilisation rates, 2003 and 2007
2003 2007 Percent of people with some sickness reported but did not seek health care 22.8 16.4
Total number of visits made in 4-week recall period to all health care service providers (millions) 4.8 7.4
Average number of visits (in 4 weeks)
a) per 100 people 15 20
b) per 100 sick people 85 132
Average number of visits (utilisation rate) per person per year* 1.9 2.6
Household Survey of Health Care Utilisation and Expenditure, 2007, Kenya
| Utilisation of Outpatient Health Services and OOP Expenditures 27
* The calculation of this rate is based on the formula: Annual utilisation rate= Number of visits made in 4 weeks/ Number of people in the sample(weighted) x 52/4 Estimates based on surveys have a margin of error because they are based on samples, rather than on total population. The margin of error for population totals in this table is 6-8% of the total. For the utilisation rate, the margin is 0.13 visits.
5.1.1 Proportion of Population Reporting Illness in the Four Weeks Prior to the Survey, by Province and Residence
The population in Nairobi is more likely to report being ill (18 percent) than people in any other province (Figure 5.1(a)). The North Eastern province reported the lowest incidence. The differences amongst the other provinces are not statistically significant. It should be noted that this measure of illness depends on a subjective assessment of how severe a condition must be before it is classified as an illness, and this, in turn, may be influenced by the range of response options available. Members of wealthy households are significantly more likely to report an illness than are those in poor households, although they are probably actually healthier. Individuals in urban households are more likely (18 percent) to report an illness than their rural counterparts (14 percent), and are more likely to visit a provider when ill (87.5 percent in sick urban individuals compared with 82.5 percent of sick rural individuals). The differences amongst Nairobi, the North Eastern Province, and the rest of the country are thus a product of reporting behaviour superimposed on actual health. Analysis shows that, except for Nairobi province, all provinces experienced a drop in the proportion of population reporting illness in 2007 compared with 2003. Nyanza province reported the largest decline, 10 percentage points, followed by Coast and North Eastern.
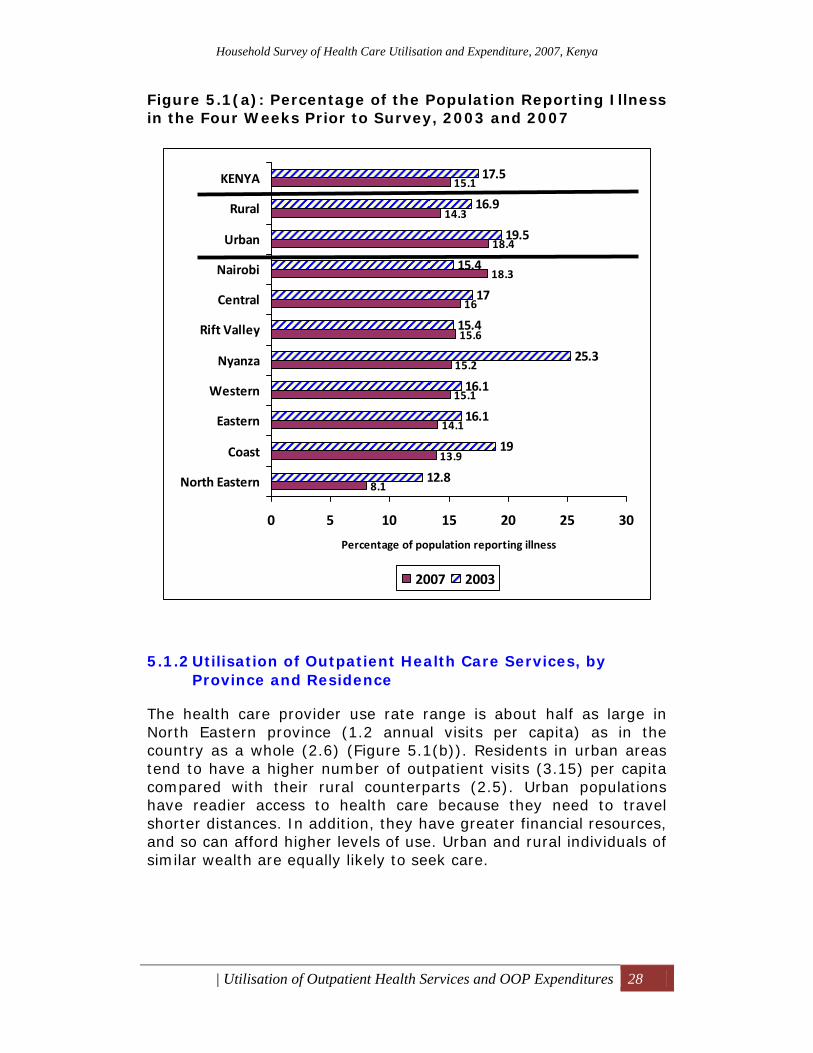
Household Survey of Health Care Utilisation and Expenditure, 2007, Kenya
| Utilisation of Outpatient Health Services and OOP Expenditures 28
Figure 5.1(a): Percentage of the Population Reporting Illness in the Four Weeks Prior to Survey, 2003 and 2007
5.1.2 Utilisation of Outpatient Health Care Services, by Province and Residence
The health care provider use rate range is about half as large in North Eastern province (1.2 annual visits per capita) as in the country as a whole (2.6) (Figure 5.1(b)). Residents in urban areas tend to have a higher number of outpatient visits (3.15) per capita compared with their rural counterparts (2.5). Urban populations have readier access to health care because they need to travel shorter distances. In addition, they have greater financial resources, and so can afford higher levels of use. Urban and rural individuals of similar wealth are equally likely to seek care.
8.1
13.9
14.1
15.1
15.2
15.6
16
18.3
18.4
14.3
15.1
12.8
19
16.1
16.1
25.3
15.4
17
15.4
19.5
16.9
17.5
0 5 10 15 20 25 30
North Eastern
Coast
Eastern
Western
Nyanza
Rift Valley
Central
Nairobi
Urban
Rural
KENYA
Percentage of population reporting illness
2007 2003
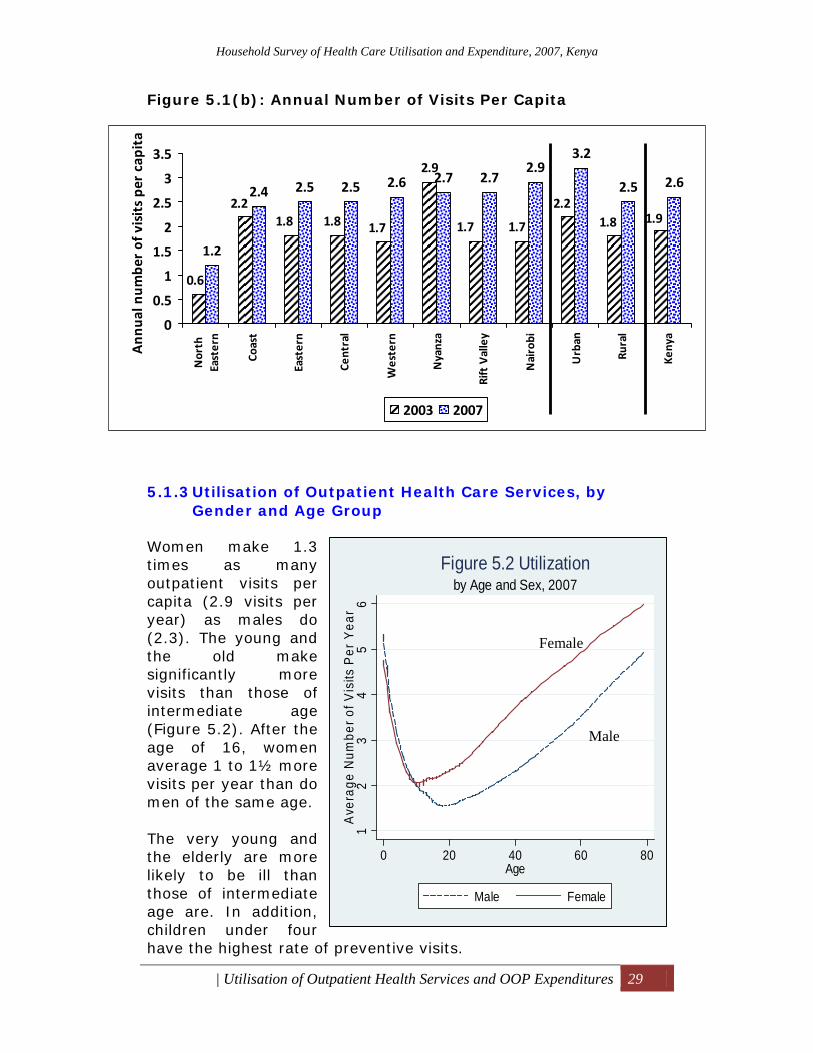
Household Survey of Health Care Utilisation and Expenditure, 2007, Kenya
| Utilisation of Outpatient Health Services and OOP Expenditures 29
Figure 5.1(b): Annual Number of Visits Per Capita
5.1.3 Utilisation of Outpatient Health Care Services, by Gender and Age Group
Women make 1.3 times as many outpatient visits per capita (2.9 visits per year) as males do (2.3). The young and the old make significantly more visits than those of intermediate age (Figure 5.2). After the age of 16, women average 1 to 1½ more visits per year than do men of the same age. The very young and the elderly are more likely to be ill than those of intermediate age are. In addition, children under four have the highest rate of preventive visits.
12
34
56
Ave
rage
Num
ber o
f Vis
its P
er Y
ear
0 20 40 60 80Age
Male Female
by Age and Sex, 2007Figure 5.2 Utilization
2.9
1.2
2.4 2.5 2.5 2.6 2.7 2.72.9
3.2
2.5 2.6
0.6
2.21.8 1.8 1.7 1.7 1.7
2.21.8 1.9
0
0.5
1
1.5
2
2.5
3
3.5
North
Eastern
Coast
Eastern
Central
Western
Nyanza
Rift Valley
Nairobi
Urban
Rural
Kenya
Ann
ual n
umbe
r of visits pe
r capita
2003 2007
Female
Male
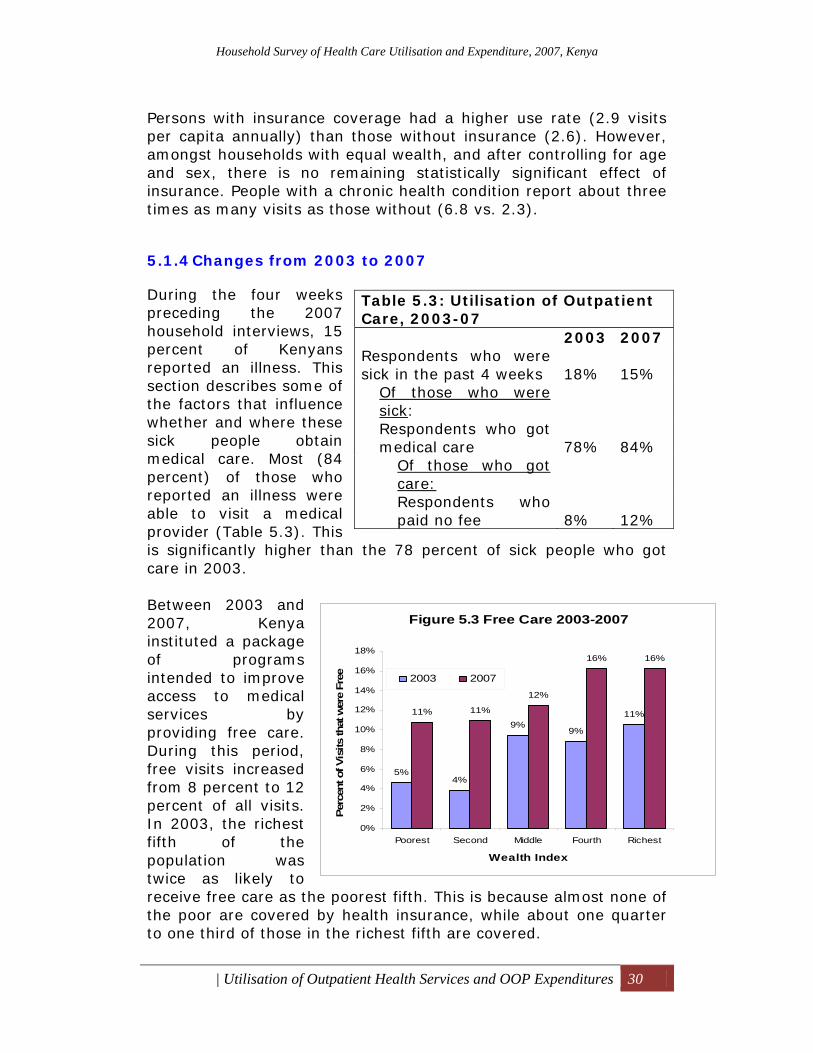
Household Survey of Health Care Utilisation and Expenditure, 2007, Kenya
| Utilisation of Outpatient Health Services and OOP Expenditures 30
Persons with insurance coverage had a higher use rate (2.9 visits per capita annually) than those without insurance (2.6). However, amongst households with equal wealth, and after controlling for age and sex, there is no remaining statistically significant effect of insurance. People with a chronic health condition report about three times as many visits as those without (6.8 vs. 2.3).
5.1.4 Changes from 2003 to 2007
During the four weeks preceding the 2007 household interviews, 15 percent of Kenyans reported an illness. This section describes some of the factors that influence whether and where these sick people obtain medical care. Most (84 percent) of those who reported an illness were able to visit a medical provider (Table 5.3). This is significantly higher than the 78 percent of sick people who got care in 2003. Between 2003 and 2007, Kenya instituted a package of programs intended to improve access to medical services by providing free care. During this period, free visits increased from 8 percent to 12 percent of all visits. In 2003, the richest fifth of the population was twice as likely to receive free care as the poorest fifth. This is because almost none of the poor are covered by health insurance, while about one quarter to one third of those in the richest fifth are covered.
Table 5.3: Utilisation of Outpatient Care, 2003-07 2003 2007 Respondents who were sick in the past 4 weeks 18% 15%
Of those who were sick: Respondents who got medical care 78% 84%
Of those who got care: Respondents who paid no fee 8% 12%
Figure 5.3 Free Care 2003-2007
5%4%
9%9%
11%11% 11%
12%
16% 16%
0%
2%
4%
6%
8%
10%
12%
14%
16%
18%
Poorest Second Middle Fourth Richest
Wealth Index
Perc
ent o
f Vis
its th
at w
ere
Free 2003 2007
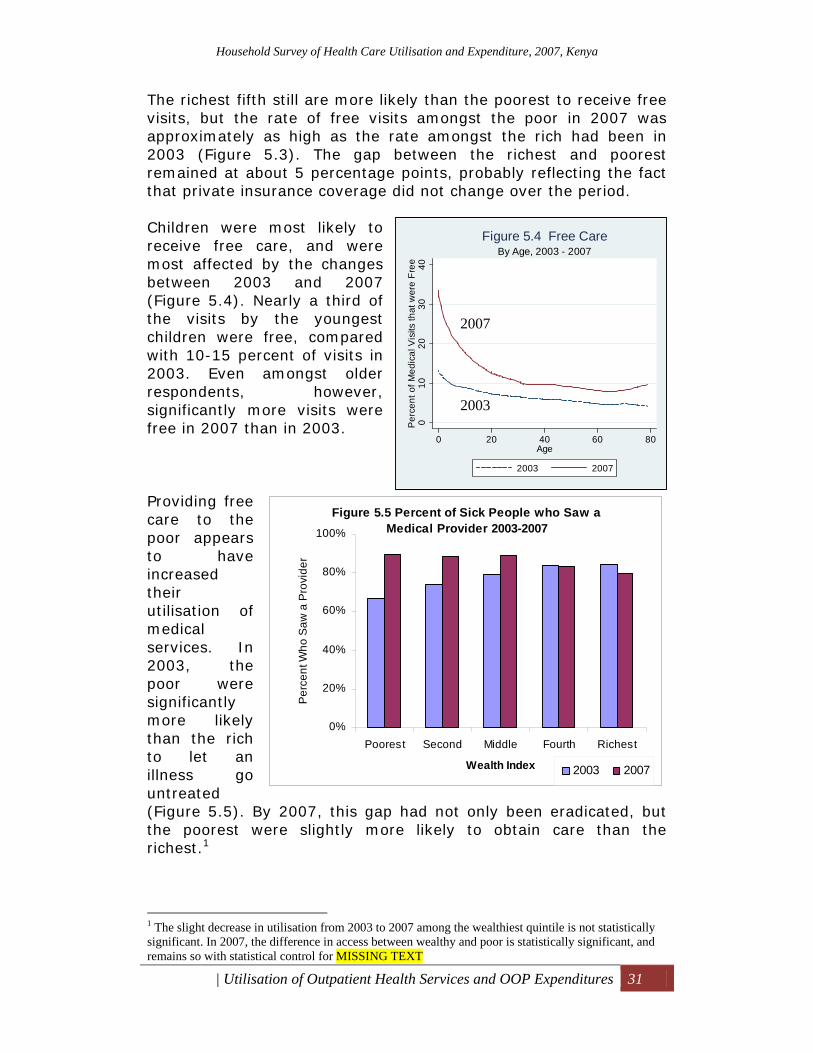
Household Survey of Health Care Utilisation and Expenditure, 2007, Kenya
| Utilisation of Outpatient Health Services and OOP Expenditures 31
The richest fifth still are more likely than the poorest to receive free visits, but the rate of free visits amongst the poor in 2007 was approximately as high as the rate amongst the rich had been in 2003 (Figure 5.3). The gap between the richest and poorest remained at about 5 percentage points, probably reflecting the fact that private insurance coverage did not change over the period. Children were most likely to receive free care, and were most affected by the changes between 2003 and 2007 (Figure 5.4). Nearly a third of the visits by the youngest children were free, compared with 10-15 percent of visits in 2003. Even amongst older respondents, however, significantly more visits were free in 2007 than in 2003. Providing free care to the poor appears to have increased their utilisation of medical services. In 2003, the poor were significantly more likely than the rich to let an illness go untreated (Figure 5.5). By 2007, this gap had not only been eradicated, but the poorest were slightly more likely to obtain care than the richest.1
1 The slight decrease in utilisation from 2003 to 2007 among the wealthiest quintile is not statistically significant. In 2007, the difference in access between wealthy and poor is statistically significant, and remains so with statistical control for MISSING TEXT
010
2030
40P
erce
nt o
f Med
ical
Vis
its th
at w
ere
Free
0 20 40 60 80Age
2003 2007
By Age, 2003 - 2007Figure 5.4 Free Care
Figure 5.5 Percent of Sick People who Saw a Medical Provider 2003-2007
0%
20%
40%
60%
80%
100%
Poorest Second Middle Fourth Richest
Wealth Index
Per
cent
Who
Saw
a P
rovi
der
2003 2007
2007
2003
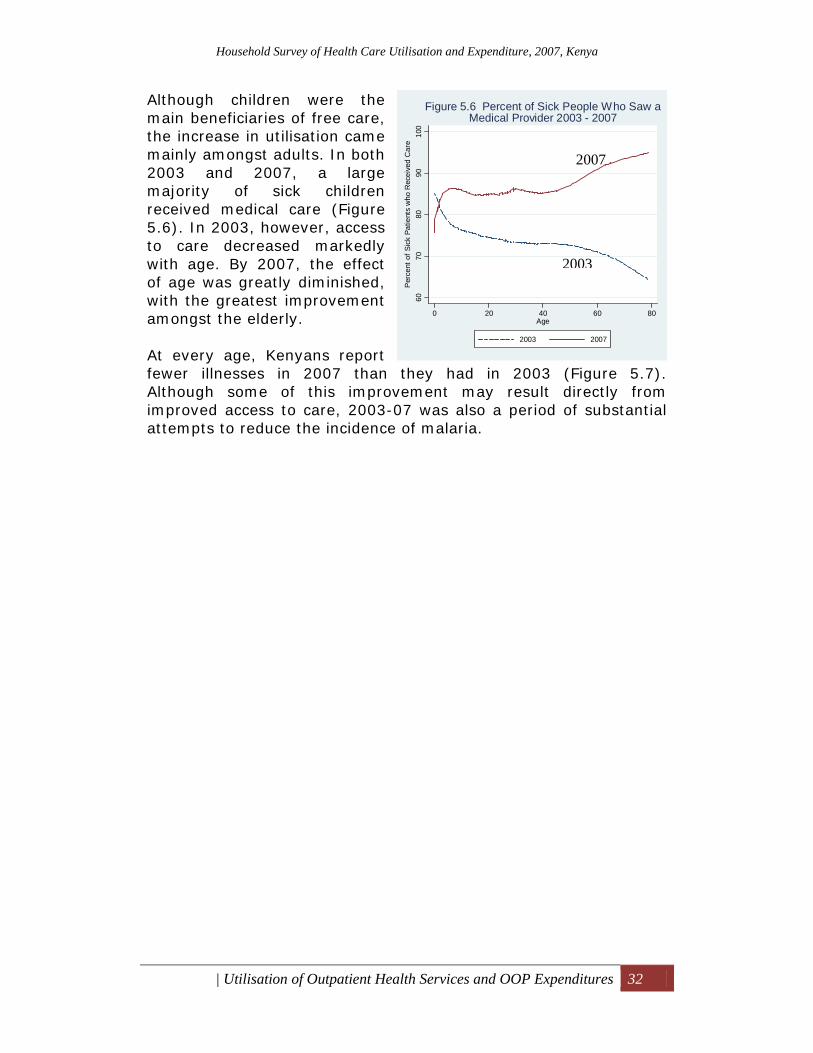
Household Survey of Health Care Utilisation and Expenditure, 2007, Kenya
| Utilisation of Outpatient Health Services and OOP Expenditures 32
Although children were the main beneficiaries of free care, the increase in utilisation came mainly amongst adults. In both 2003 and 2007, a large majority of sick children received medical care (Figure 5.6). In 2003, however, access to care decreased markedly with age. By 2007, the effect of age was greatly diminished, with the greatest improvement amongst the elderly. At every age, Kenyans report fewer illnesses in 2007 than they had in 2003 (Figure 5.7). Although some of this improvement may result directly from improved access to care, 2003-07 was also a period of substantial attempts to reduce the incidence of malaria.
6070
8090
100
Per
cent
of S
ick
Patie
nts
who
Rec
eive
d C
are
0 20 40 60 80Age
2003 2007
Figure 5.6 Percent of Sick People Who Saw aMedical Provider 2003 - 2007
2007
2003
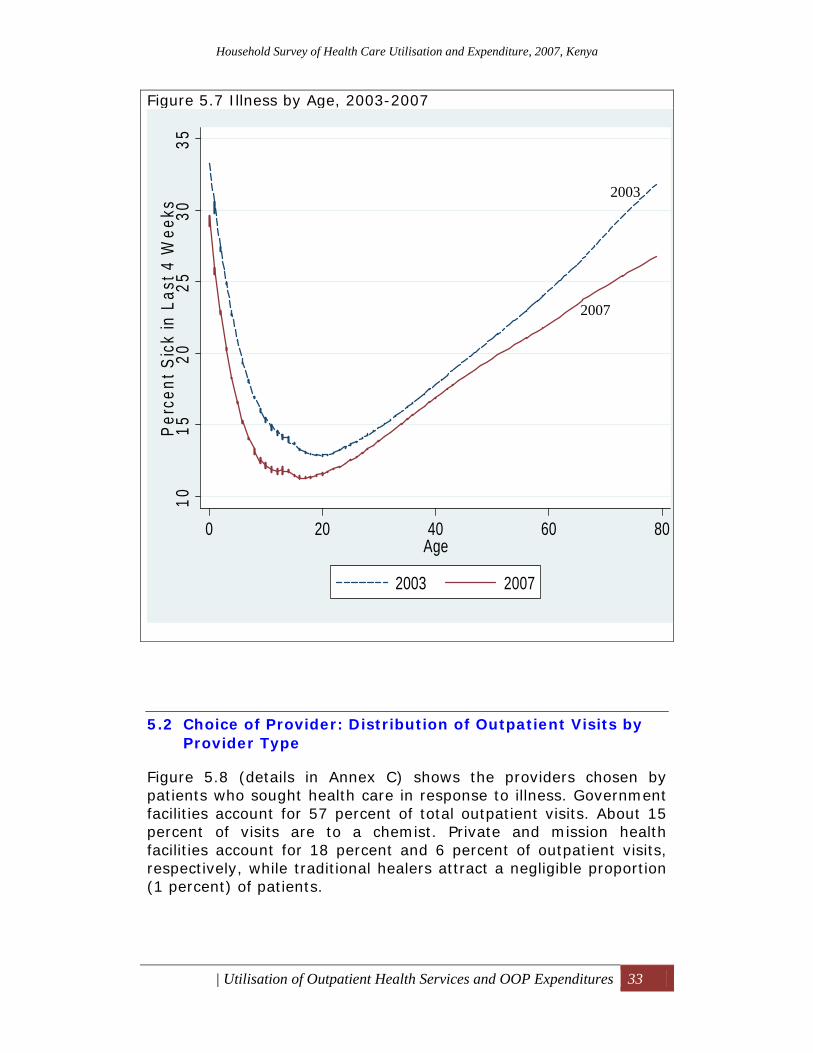
Household Survey of Health Care Utilisation and Expenditure, 2007, Kenya
| Utilisation of Outpatient Health Services and OOP Expenditures 33
Figure 5.7 Illness by Age, 2003-2007
1015
2025
3035
Perc
ent S
ick
in L
ast 4
Wee
ks
0 20 40 60 80Age
2003 2007
5.2 Choice of Provider: Distribution of Outpatient Visits by Provider Type
Figure 5.8 (details in Annex C) shows the providers chosen by patients who sought health care in response to illness. Government facilities account for 57 percent of total outpatient visits. About 15 percent of visits are to a chemist. Private and mission health facilities account for 18 percent and 6 percent of outpatient visits, respectively, while traditional healers attract a negligible proportion (1 percent) of patients.
2003
2007
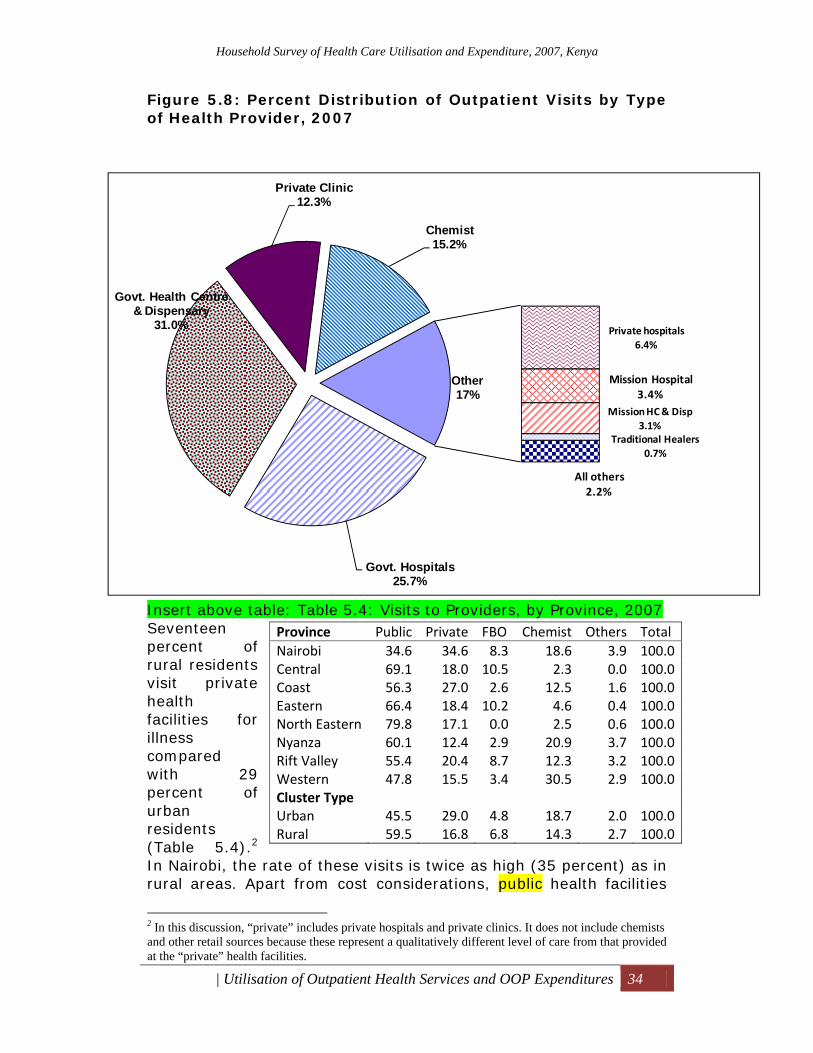
Household Survey of Health Care Utilisation and Expenditure, 2007, Kenya
| Utilisation of Outpatient Health Services and OOP Expenditures 34
Figure 5.8: Percent Distribution of Outpatient Visits by Type of Health Provider, 2007
Insert above table: Table 5.4: Visits to Providers, by Province, 2007 Seventeen percent of rural residents visit private health facilities for illness compared with 29 percent of urban residents (Table 5.4).2 In Nairobi, the rate of these visits is twice as high (35 percent) as in rural areas. Apart from cost considerations, public health facilities
2 In this discussion, “private” includes private hospitals and private clinics. It does not include chemists and other retail sources because these represent a qualitatively different level of care from that provided at the “private” health facilities.
Province Public Private FBO Chemist Others Total Nairobi 34.6 34.6 8.3 18.6 3.9 100.0Central 69.1 18.0 10.5 2.3 0.0 100.0Coast 56.3 27.0 2.6 12.5 1.6 100.0Eastern 66.4 18.4 10.2 4.6 0.4 100.0North Eastern 79.8 17.1 0.0 2.5 0.6 100.0Nyanza 60.1 12.4 2.9 20.9 3.7 100.0Rift Valley 55.4 20.4 8.7 12.3 3.2 100.0Western 47.8 15.5 3.4 30.5 2.9 100.0Cluster Type Urban 45.5 29.0 4.8 18.7 2.0 100.0Rural 59.5 16.8 6.8 14.3 2.7 100.0
Govt. Hospitals25.7%
Private hospitals6.4%
Mission Hospital3.4%
Govt. Health Centre & Dispensary
31.0%
Private Clinic12.3%
Mission HC & Disp3.1%
Chemist15.2%
Traditional Healers0.7%
All others2.2%
Other17%
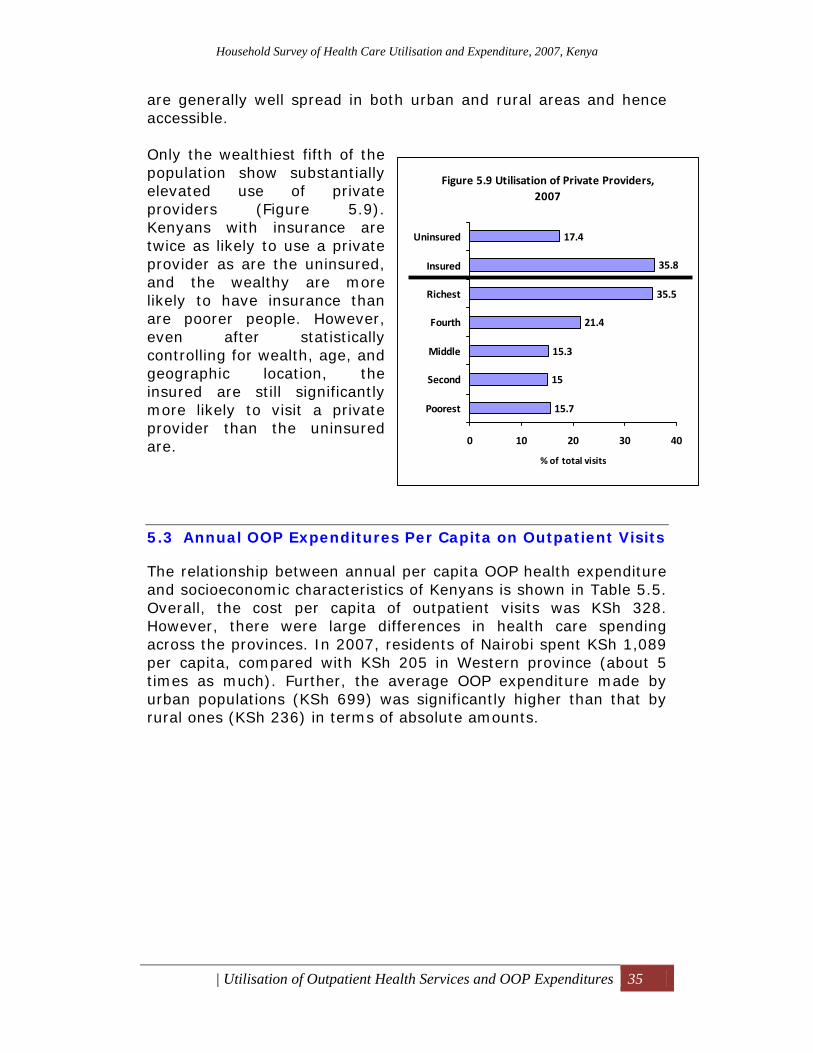
Household Survey of Health Care Utilisation and Expenditure, 2007, Kenya
| Utilisation of Outpatient Health Services and OOP Expenditures 35
are generally well spread in both urban and rural areas and hence accessible. Only the wealthiest fifth of the population show substantially elevated use of private providers (Figure 5.9). Kenyans with insurance are twice as likely to use a private provider as are the uninsured, and the wealthy are more likely to have insurance than are poorer people. However, even after statistically controlling for wealth, age, and geographic location, the insured are still significantly more likely to visit a private provider than the uninsured are.
5.3 Annual OOP Expenditures Per Capita on Outpatient Visits
The relationship between annual per capita OOP health expenditure and socioeconomic characteristics of Kenyans is shown in Table 5.5. Overall, the cost per capita of outpatient visits was KSh 328. However, there were large differences in health care spending across the provinces. In 2007, residents of Nairobi spent KSh 1,089 per capita, compared with KSh 205 in Western province (about 5 times as much). Further, the average OOP expenditure made by urban populations (KSh 699) was significantly higher than that by rural ones (KSh 236) in terms of absolute amounts.
Figure 5.9 Utilisation of Private Providers, 2007
15.7
15
15.3
21.4
35.5
35.8
17.4
0 10 20 30 40
Poorest
Second
Middle
Fourth
Richest
Insured
Uninsured
% of total visits
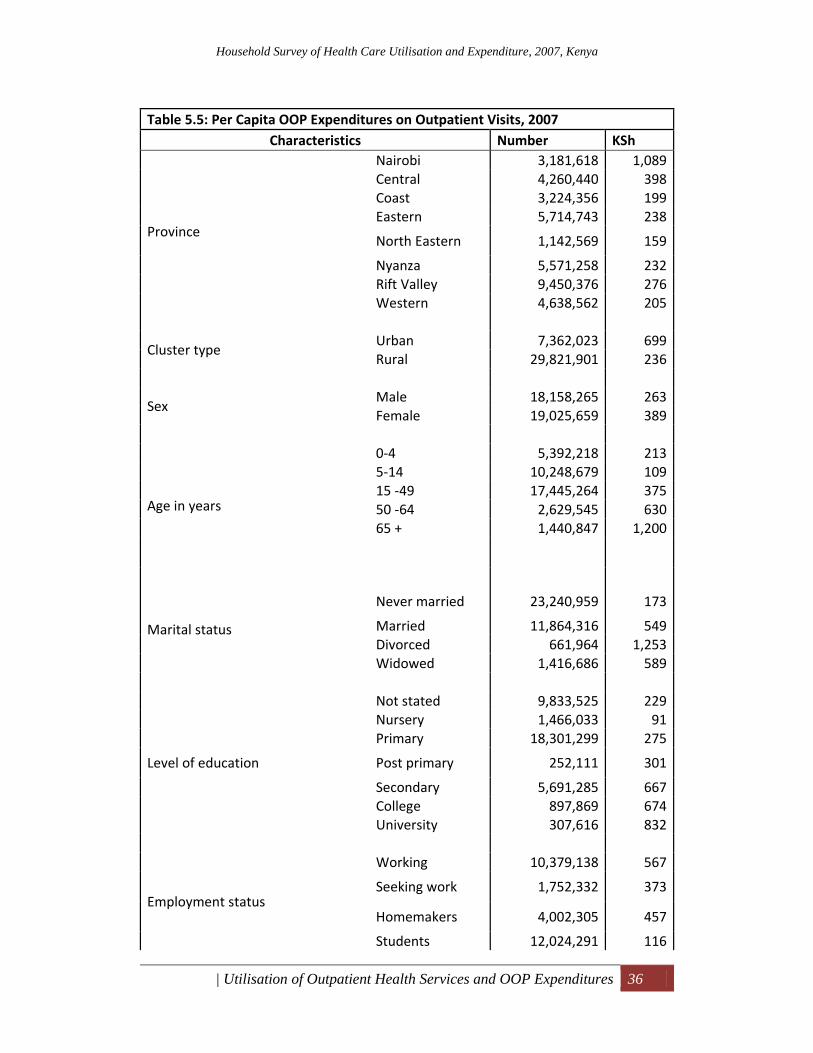
Household Survey of Health Care Utilisation and Expenditure, 2007, Kenya
| Utilisation of Outpatient Health Services and OOP Expenditures 36
Table 5.5: Per Capita OOP Expenditures on Outpatient Visits, 2007
Characteristics Number KSh
Province
Nairobi 3,181,618 1,089Central 4,260,440 398Coast 3,224,356 199Eastern 5,714,743 238
North Eastern 1,142,569 159
Nyanza 5,571,258 232Rift Valley 9,450,376 276Western 4,638,562 205
Cluster type Urban 7,362,023 699Rural 29,821,901 236
Sex Male 18,158,265 263Female 19,025,659 389
Age in years
0‐4 5,392,218 2135‐14 10,248,679 10915 ‐49 17,445,264 37550 ‐64 2,629,545 63065 + 1,440,847 1,200
Marital status
Never married 23,240,959 173
Married 11,864,316 549Divorced 661,964 1,253Widowed 1,416,686 589
Level of education
Not stated 9,833,525 229Nursery 1,466,033 91Primary 18,301,299 275
Post primary 252,111 301
Secondary 5,691,285 667College 897,869 674University 307,616 832
Employment status
Working 10,379,138 567
Seeking work 1,752,332 373
Homemakers 4,002,305 457
Students 12,024,291 116
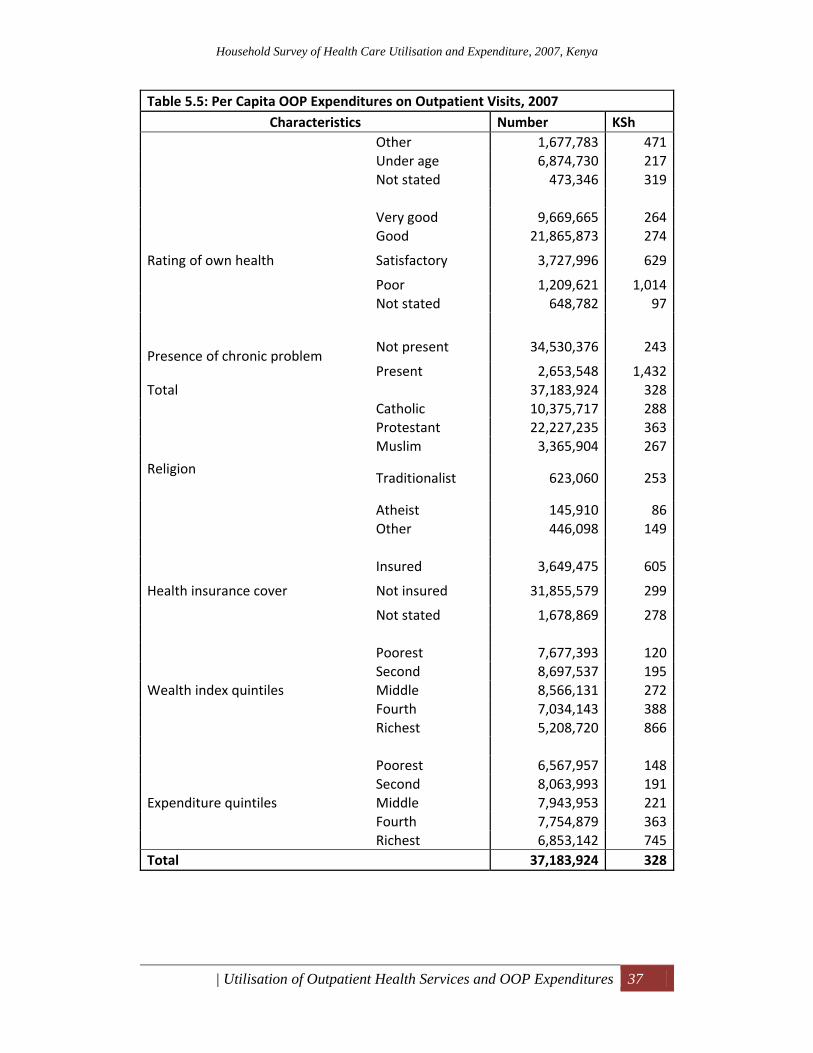
Household Survey of Health Care Utilisation and Expenditure, 2007, Kenya
| Utilisation of Outpatient Health Services and OOP Expenditures 37
Table 5.5: Per Capita OOP Expenditures on Outpatient Visits, 2007 Characteristics Number KSh
Other 1,677,783 471Under age 6,874,730 217Not stated 473,346 319
Rating of own health
Very good 9,669,665 264Good 21,865,873 274
Satisfactory 3,727,996 629
Poor 1,209,621 1,014Not stated 648,782 97
Presence of chronic problem Not present 34,530,376 243
Present 2,653,548 1,432Total 37,183,924 328
Religion
Catholic 10,375,717 288Protestant 22,227,235 363Muslim 3,365,904 267
Traditionalist 623,060 253
Atheist 145,910 86Other 446,098 149
Health insurance cover
Insured 3,649,475 605
Not insured 31,855,579 299
Not stated 1,678,869 278
Wealth index quintiles
Poorest 7,677,393 120Second 8,697,537 195Middle 8,566,131 272Fourth 7,034,143 388Richest 5,208,720 866
Expenditure quintiles
Poorest 6,567,957 148Second 8,063,993 191Middle 7,943,953 221Fourth 7,754,879 363Richest 6,853,142 745
Total 37,183,924 328
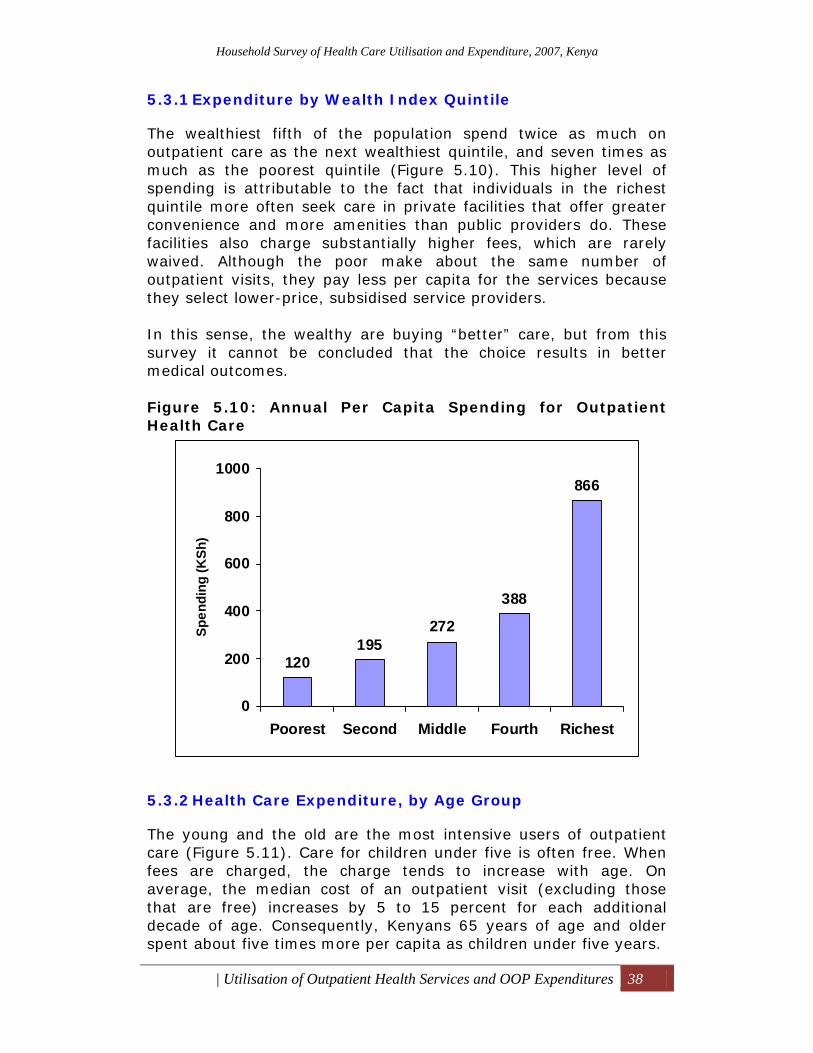
Household Survey of Health Care Utilisation and Expenditure, 2007, Kenya
| Utilisation of Outpatient Health Services and OOP Expenditures 38
5.3.1 Expenditure by Wealth Index Quintile
The wealthiest fifth of the population spend twice as much on outpatient care as the next wealthiest quintile, and seven times as much as the poorest quintile (Figure 5.10). This higher level of spending is attributable to the fact that individuals in the richest quintile more often seek care in private facilities that offer greater convenience and more amenities than public providers do. These facilities also charge substantially higher fees, which are rarely waived. Although the poor make about the same number of outpatient visits, they pay less per capita for the services because they select lower-price, subsidised service providers. In this sense, the wealthy are buying “better” care, but from this survey it cannot be concluded that the choice results in better medical outcomes. Figure 5.10: Annual Per Capita Spending for Outpatient Health Care
5.3.2 Health Care Expenditure, by Age Group
The young and the old are the most intensive users of outpatient care (Figure 5.11). Care for children under five is often free. When fees are charged, the charge tends to increase with age. On average, the median cost of an outpatient visit (excluding those that are free) increases by 5 to 15 percent for each additional decade of age. Consequently, Kenyans 65 years of age and older spent about five times more per capita as children under five years.
120195
272
388
866
0
200
400
600
800
1000
Poorest Second Middle Fourth Richest
Spen
ding
(KSh
)
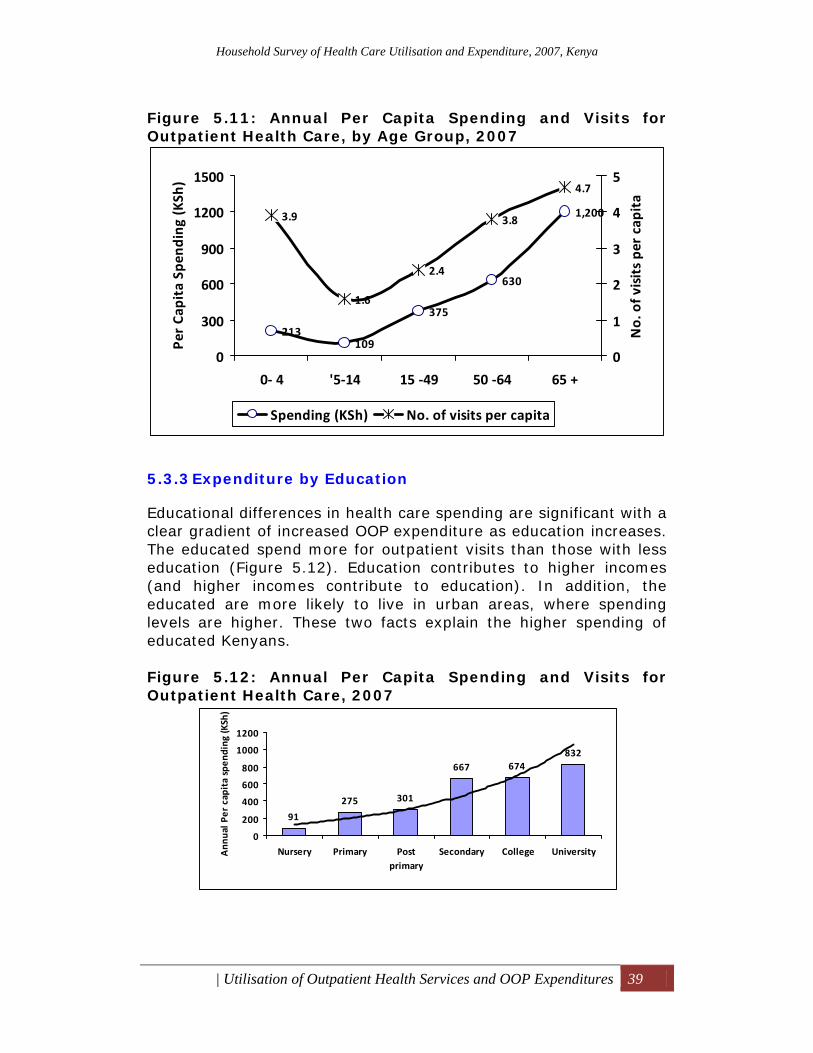
Household Survey of Health Care Utilisation and Expenditure, 2007, Kenya
| Utilisation of Outpatient Health Services and OOP Expenditures 39
Figure 5.11: Annual Per Capita Spending and Visits for Outpatient Health Care, by Age Group, 2007
5.3.3 Expenditure by Education
Educational differences in health care spending are significant with a clear gradient of increased OOP expenditure as education increases. The educated spend more for outpatient visits than those with less education (Figure 5.12). Education contributes to higher incomes (and higher incomes contribute to education). In addition, the educated are more likely to live in urban areas, where spending levels are higher. These two facts explain the higher spending of educated Kenyans. Figure 5.12: Annual Per Capita Spending and Visits for Outpatient Health Care, 2007
213109
375
630
1,2003.9
1.6
2.4
3.8
4.7
0
300
600
900
1200
1500
0‐ 4 '5‐14 15 ‐49 50 ‐64 65 +
Per Ca
pita Spe
nding (KSh
)
0
1
2
3
4
5
No. of v
isits pe
r capita
Spending (KSh) No. of visits per capita
91
275 301
667 674832
0
200
400
600
800
1000
1200
Nursery Primary Postprimary
Secondary College UniversityAnn
ual P
er capita spen
ding
(KSh)
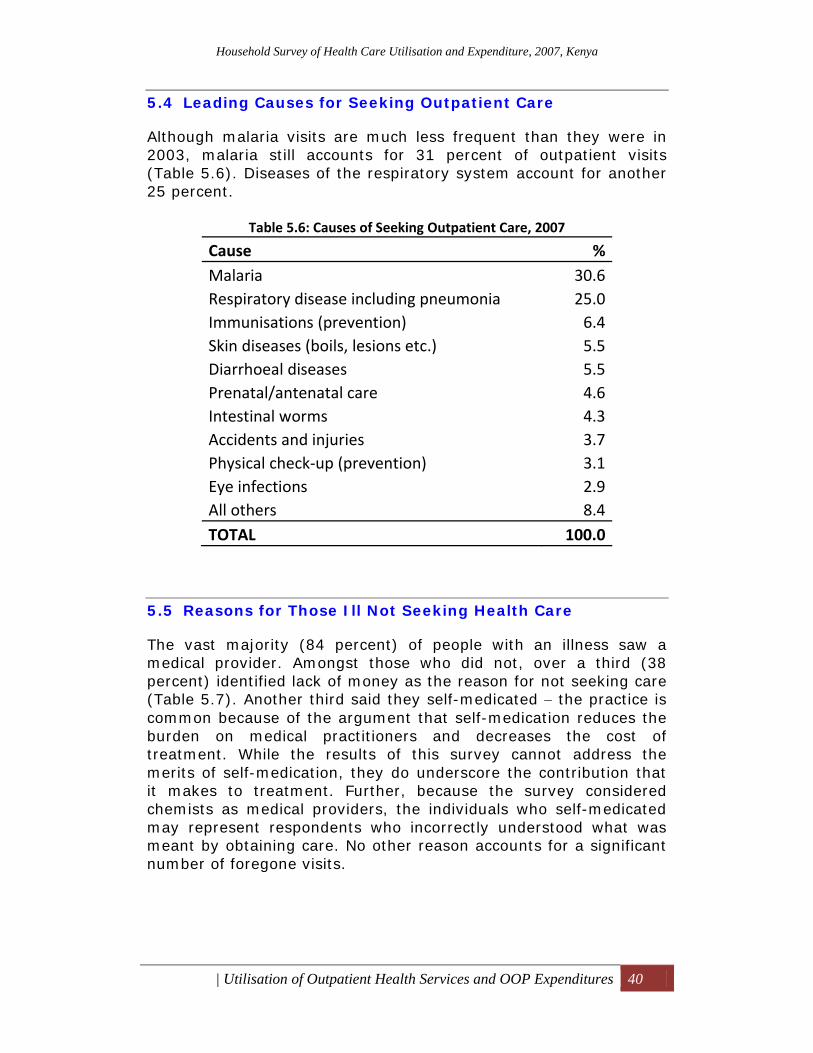
Household Survey of Health Care Utilisation and Expenditure, 2007, Kenya
| Utilisation of Outpatient Health Services and OOP Expenditures 40
5.4 Leading Causes for Seeking Outpatient Care
Although malaria visits are much less frequent than they were in 2003, malaria still accounts for 31 percent of outpatient visits (Table 5.6). Diseases of the respiratory system account for another 25 percent.
Table 5.6: Causes of Seeking Outpatient Care, 2007
Cause % Malaria 30.6 Respiratory disease including pneumonia 25.0 Immunisations (prevention) 6.4 Skin diseases (boils, lesions etc.) 5.5 Diarrhoeal diseases 5.5 Prenatal/antenatal care 4.6 Intestinal worms 4.3 Accidents and injuries 3.7 Physical check‐up (prevention) 3.1 Eye infections 2.9 All others 8.4 TOTAL 100.0
5.5 Reasons for Those Ill Not Seeking Health Care
The vast majority (84 percent) of people with an illness saw a medical provider. Amongst those who did not, over a third (38 percent) identified lack of money as the reason for not seeking care (Table 5.7). Another third said they self-medicated − the practice is common because of the argument that self-medication reduces the burden on medical practitioners and decreases the cost of treatment. While the results of this survey cannot address the merits of self-medication, they do underscore the contribution that it makes to treatment. Further, because the survey considered chemists as medical providers, the individuals who self-medicated may represent respondents who incorrectly understood what was meant by obtaining care. No other reason accounts for a significant number of foregone visits.
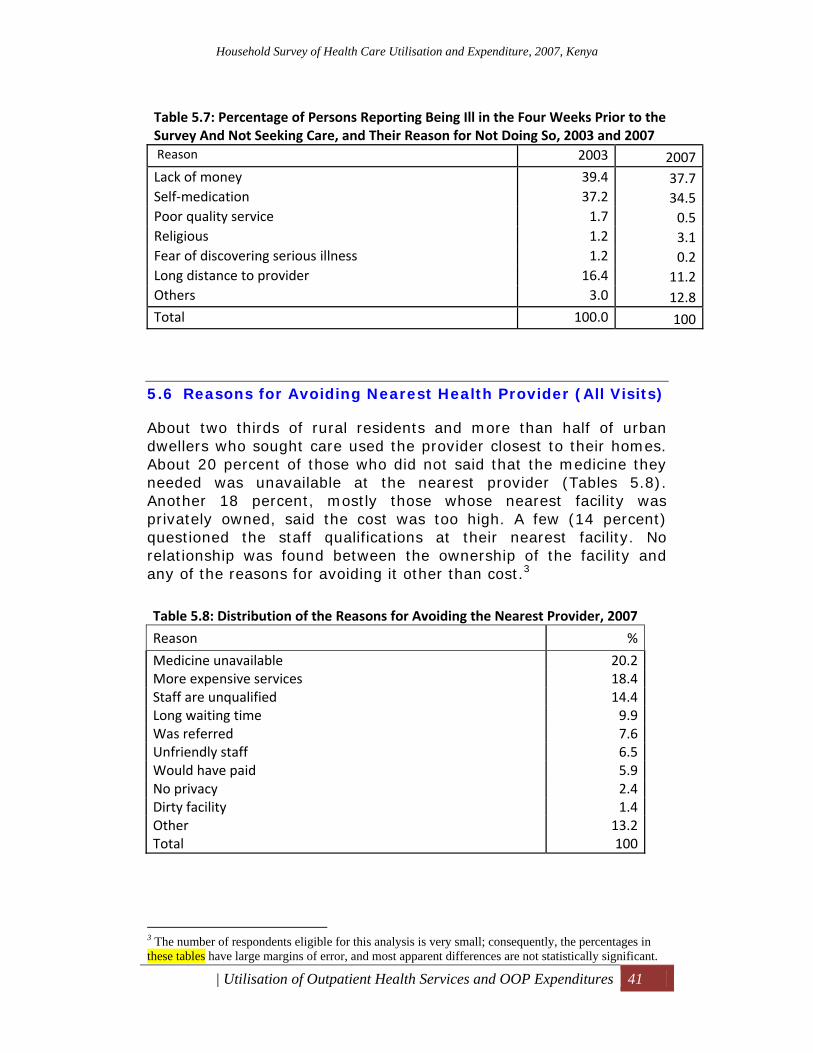
Household Survey of Health Care Utilisation and Expenditure, 2007, Kenya
| Utilisation of Outpatient Health Services and OOP Expenditures 41
Table 5.7: Percentage of Persons Reporting Being Ill in the Four Weeks Prior to the Survey And Not Seeking Care, and Their Reason for Not Doing So, 2003 and 2007 Reason 2003 2007Lack of money 39.4 37.7Self‐medication 37.2 34.5Poor quality service 1.7 0.5Religious 1.2 3.1Fear of discovering serious illness 1.2 0.2Long distance to provider 16.4 11.2Others 3.0 12.8Total 100.0 100
5.6 Reasons for Avoiding Nearest Health Provider (All Visits)
About two thirds of rural residents and more than half of urban dwellers who sought care used the provider closest to their homes. About 20 percent of those who did not said that the medicine they needed was unavailable at the nearest provider (Tables 5.8). Another 18 percent, mostly those whose nearest facility was privately owned, said the cost was too high. A few (14 percent) questioned the staff qualifications at their nearest facility. No relationship was found between the ownership of the facility and any of the reasons for avoiding it other than cost.3
Table 5.8: Distribution of the Reasons for Avoiding the Nearest Provider, 2007
Reason %
Medicine unavailable 20.2 More expensive services 18.4 Staff are unqualified 14.4 Long waiting time 9.9 Was referred 7.6 Unfriendly staff 6.5 Would have paid 5.9 No privacy 2.4 Dirty facility 1.4 Other 13.2 Total 100
3 The number of respondents eligible for this analysis is very small; consequently, the percentages in these tables have large margins of error, and most apparent differences are not statistically significant.
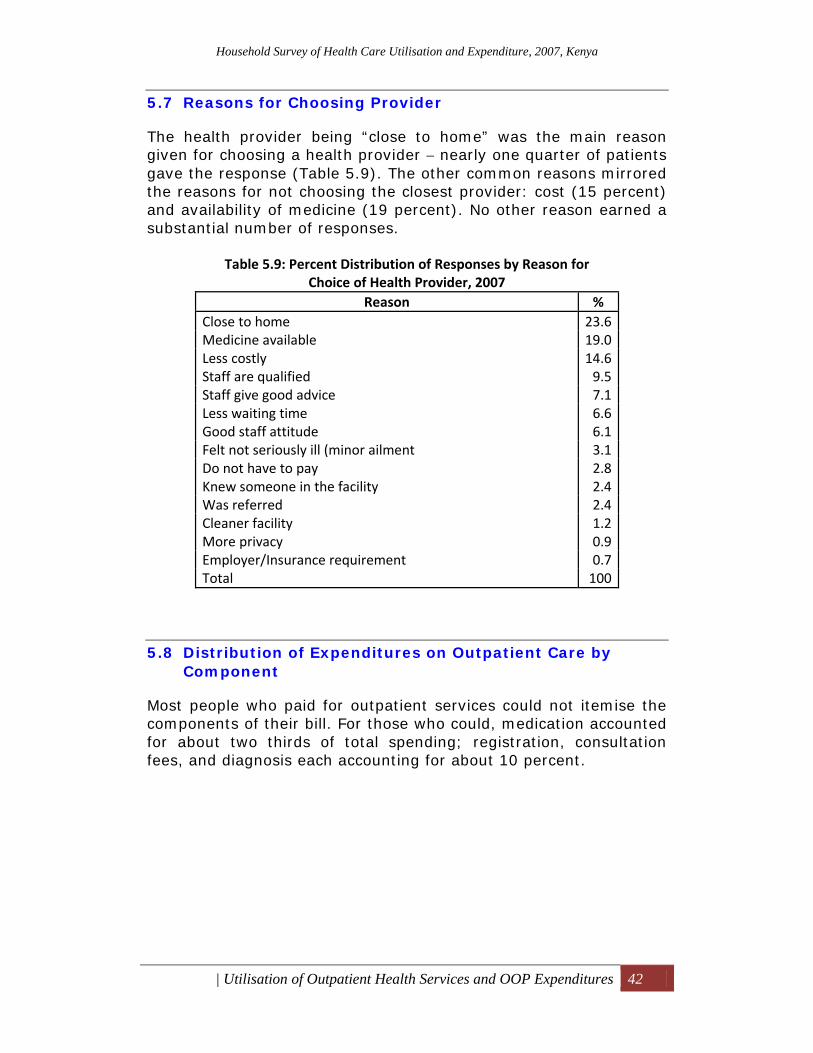
Household Survey of Health Care Utilisation and Expenditure, 2007, Kenya
| Utilisation of Outpatient Health Services and OOP Expenditures 42
5.7 Reasons for Choosing Provider
The health provider being “close to home” was the main reason given for choosing a health provider − nearly one quarter of patients gave the response (Table 5.9). The other common reasons mirrored the reasons for not choosing the closest provider: cost (15 percent) and availability of medicine (19 percent). No other reason earned a substantial number of responses.
Table 5.9: Percent Distribution of Responses by Reason for Choice of Health Provider, 2007
Reason % Close to home 23.6 Medicine available 19.0 Less costly 14.6 Staff are qualified 9.5 Staff give good advice 7.1 Less waiting time 6.6 Good staff attitude 6.1 Felt not seriously ill (minor ailment 3.1 Do not have to pay 2.8 Knew someone in the facility 2.4 Was referred 2.4 Cleaner facility 1.2 More privacy 0.9 Employer/Insurance requirement 0.7 Total 100
5.8 Distribution of Expenditures on Outpatient Care by Component
Most people who paid for outpatient services could not itemise the components of their bill. For those who could, medication accounted for about two thirds of total spending; registration, consultation fees, and diagnosis each accounting for about 10 percent.
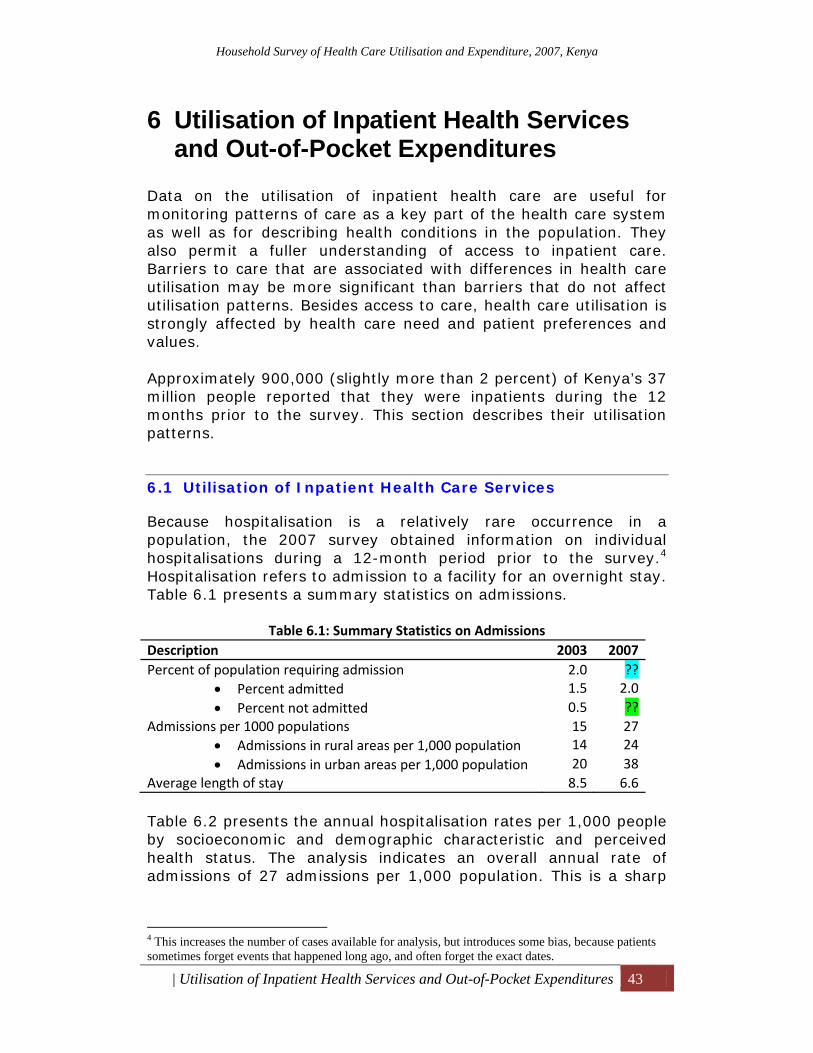
Household Survey of Health Care Utilisation and Expenditure, 2007, Kenya
| Utilisation of Inpatient Health Services and Out-of-Pocket Expenditures 43
6 Utilisation of Inpatient Health Services and Out-of-Pocket Expenditures
Data on the utilisation of inpatient health care are useful for monitoring patterns of care as a key part of the health care system as well as for describing health conditions in the population. They also permit a fuller understanding of access to inpatient care. Barriers to care that are associated with differences in health care utilisation may be more significant than barriers that do not affect utilisation patterns. Besides access to care, health care utilisation is strongly affected by health care need and patient preferences and values. Approximately 900,000 (slightly more than 2 percent) of Kenya’s 37 million people reported that they were inpatients during the 12 months prior to the survey. This section describes their utilisation patterns.
6.1 Utilisation of Inpatient Health Care Services
Because hospitalisation is a relatively rare occurrence in a population, the 2007 survey obtained information on individual hospitalisations during a 12-month period prior to the survey.4 Hospitalisation refers to admission to a facility for an overnight stay. Table 6.1 presents a summary statistics on admissions.
Table 6.1: Summary Statistics on Admissions Description 2003 2007 Percent of population requiring admission 2.0 ??
• Percent admitted 1.5 2.0 • Percent not admitted 0.5 ??
Admissions per 1000 populations 15 27 • Admissions in rural areas per 1,000 population 14 24 • Admissions in urban areas per 1,000 population 20 38
Average length of stay 8.5 6.6 Table 6.2 presents the annual hospitalisation rates per 1,000 people by socioeconomic and demographic characteristic and perceived health status. The analysis indicates an overall annual rate of admissions of 27 admissions per 1,000 population. This is a sharp
4 This increases the number of cases available for analysis, but introduces some bias, because patients sometimes forget events that happened long ago, and often forget the exact dates.
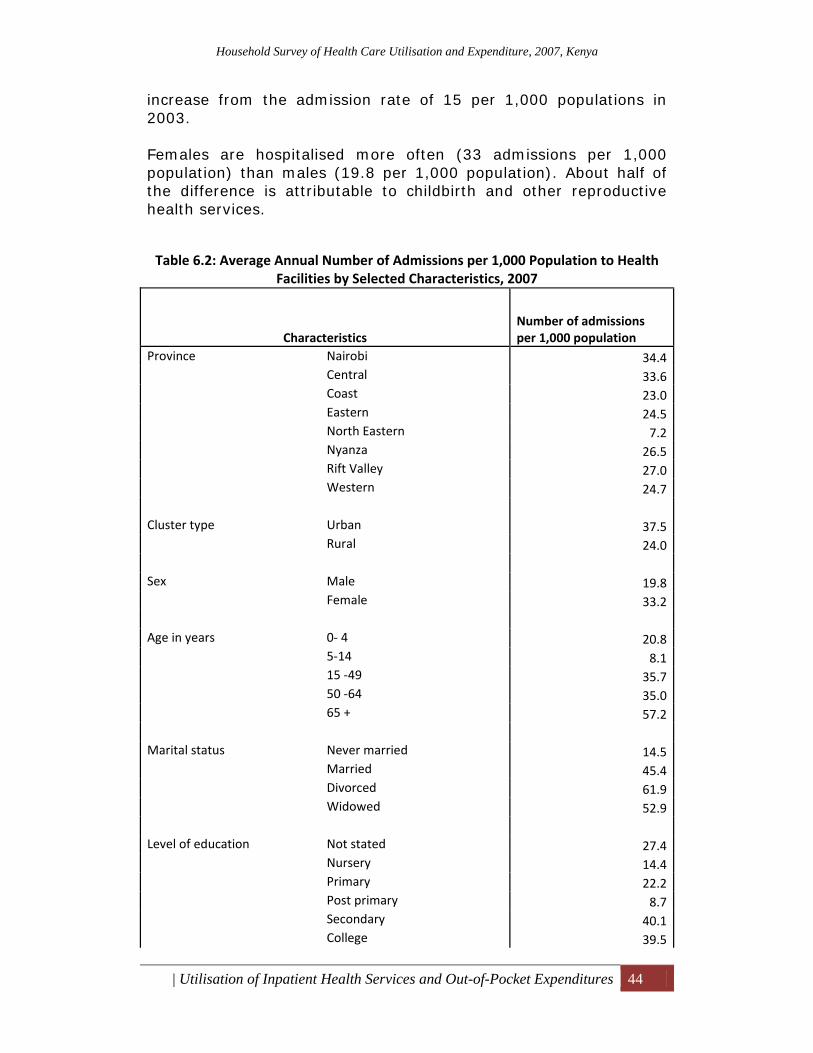
Household Survey of Health Care Utilisation and Expenditure, 2007, Kenya
| Utilisation of Inpatient Health Services and Out-of-Pocket Expenditures 44
increase from the admission rate of 15 per 1,000 populations in 2003. Females are hospitalised more often (33 admissions per 1,000 population) than males (19.8 per 1,000 population). About half of the difference is attributable to childbirth and other reproductive health services.
Table 6.2: Average Annual Number of Admissions per 1,000 Population to Health Facilities by Selected Characteristics, 2007
Characteristics Number of admissions per 1,000 population
Province Nairobi 34.4Central 33.6Coast 23.0Eastern 24.5North Eastern 7.2Nyanza 26.5Rift Valley 27.0Western 24.7
Cluster type Urban 37.5
Rural 24.0 Sex Male 19.8
Female 33.2 Age in years 0‐ 4 20.8
5‐14 8.115 ‐49 35.750 ‐64 35.065 + 57.2
Marital status Never married 14.5Married 45.4Divorced 61.9Widowed 52.9
Level of education Not stated 27.4
Nursery 14.4Primary 22.2Post primary 8.7Secondary 40.1College 39.5
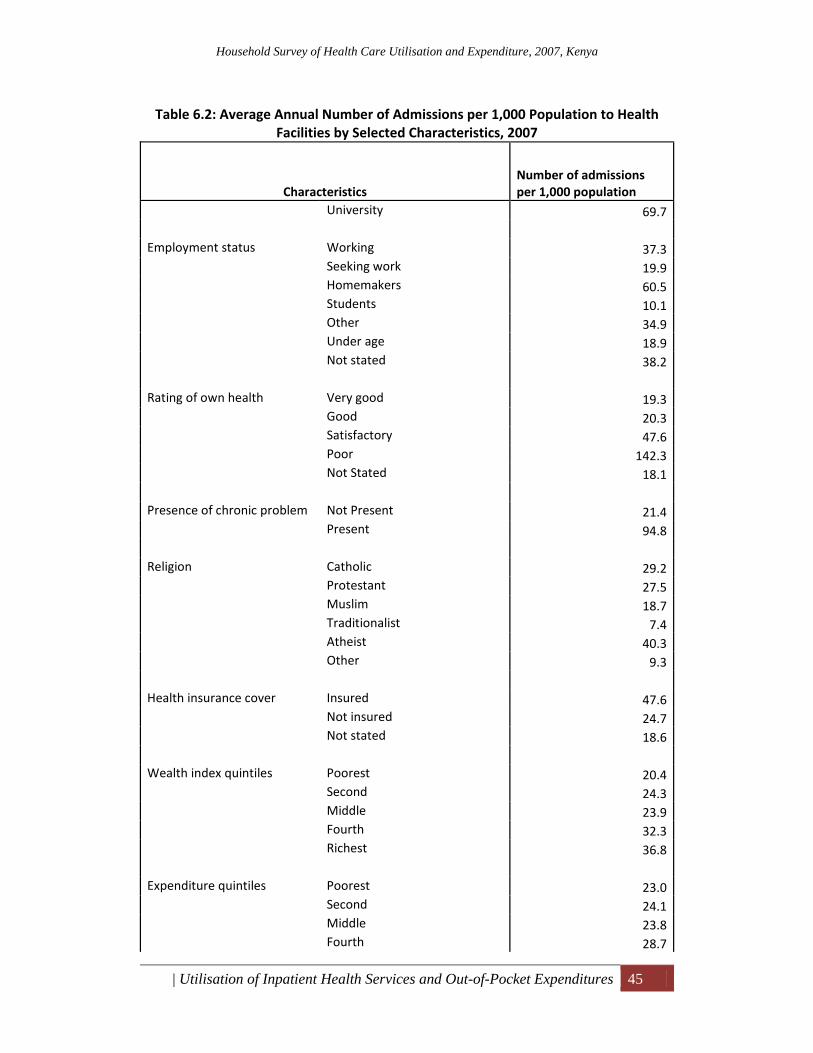
Household Survey of Health Care Utilisation and Expenditure, 2007, Kenya
| Utilisation of Inpatient Health Services and Out-of-Pocket Expenditures 45
Table 6.2: Average Annual Number of Admissions per 1,000 Population to Health Facilities by Selected Characteristics, 2007
Characteristics Number of admissions per 1,000 population
University 69.7 Employment status Working 37.3
Seeking work 19.9Homemakers 60.5Students 10.1Other 34.9Under age 18.9Not stated 38.2
Rating of own health Very good 19.3
Good 20.3Satisfactory 47.6Poor 142.3Not Stated 18.1
Presence of chronic problem Not Present 21.4
Present 94.8 Religion Catholic 29.2
Protestant 27.5Muslim 18.7Traditionalist 7.4Atheist 40.3Other 9.3
Health insurance cover Insured 47.6
Not insured 24.7Not stated 18.6
Wealth index quintiles Poorest 20.4
Second 24.3Middle 23.9Fourth 32.3Richest 36.8
Expenditure quintiles Poorest 23.0
Second 24.1Middle 23.8Fourth 28.7
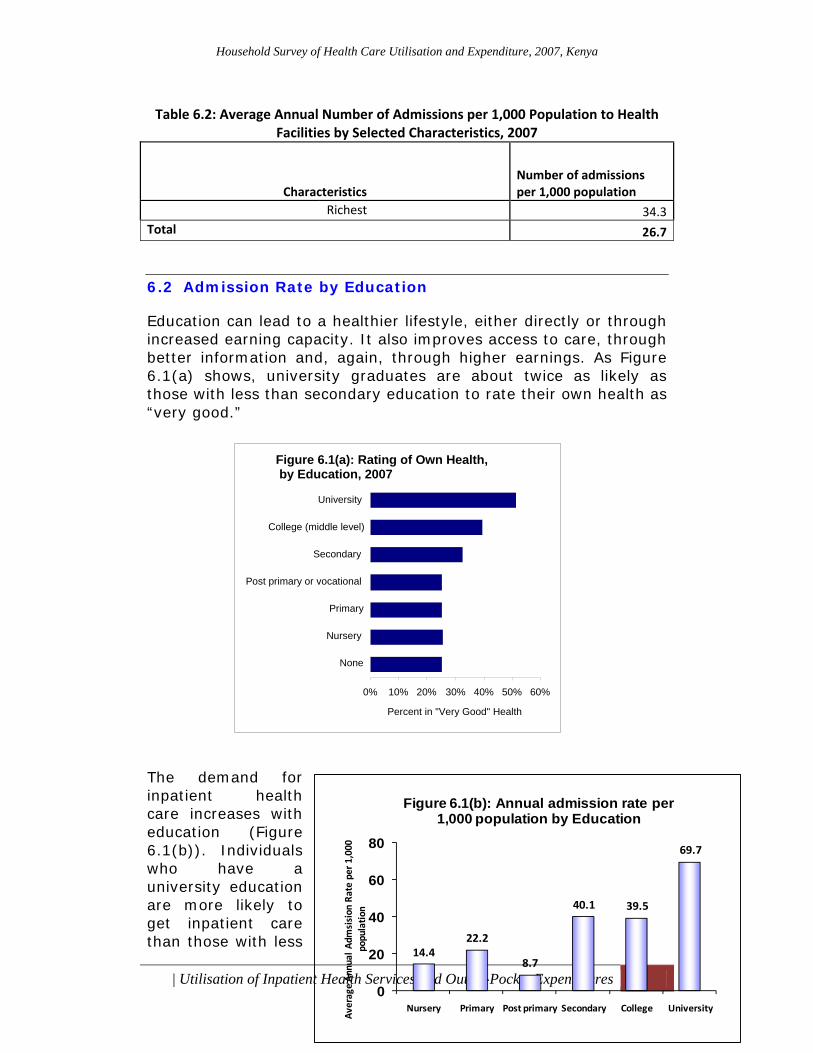
Household Survey of Health Care Utilisation and Expenditure, 2007, Kenya
| Utilisation of Inpatient Health Services and Out-of-Pocket Expenditures 46
Table 6.2: Average Annual Number of Admissions per 1,000 Population to Health Facilities by Selected Characteristics, 2007
Characteristics Number of admissions per 1,000 population
Richest 34.3Total 26.7
6.2 Admission Rate by Education
Education can lead to a healthier lifestyle, either directly or through increased earning capacity. It also improves access to care, through better information and, again, through higher earnings. As Figure 6.1(a) shows, university graduates are about twice as likely as those with less than secondary education to rate their own health as “very good.” The demand for inpatient health care increases with education (Figure 6.1(b)). Individuals who have a university education are more likely to get inpatient care than those with less
Figure 6.1(a): Rating of Own Health, by Education, 2007
0% 10% 20% 30% 40% 50% 60%
None
Nursery
Primary
Post primary or vocational
Secondary
College (middle level)
University
Percent in "Very Good" Health
14.422.2
8.7
40.1 39.5
69.7
0
20
40
60
80
Nursery Primary Post primary Secondary College University
Average An
nual Adm
sision
Rate per 1
,000
populatio
n
Figure 6.1(b): Annual admission rate per 1,000 population by Education
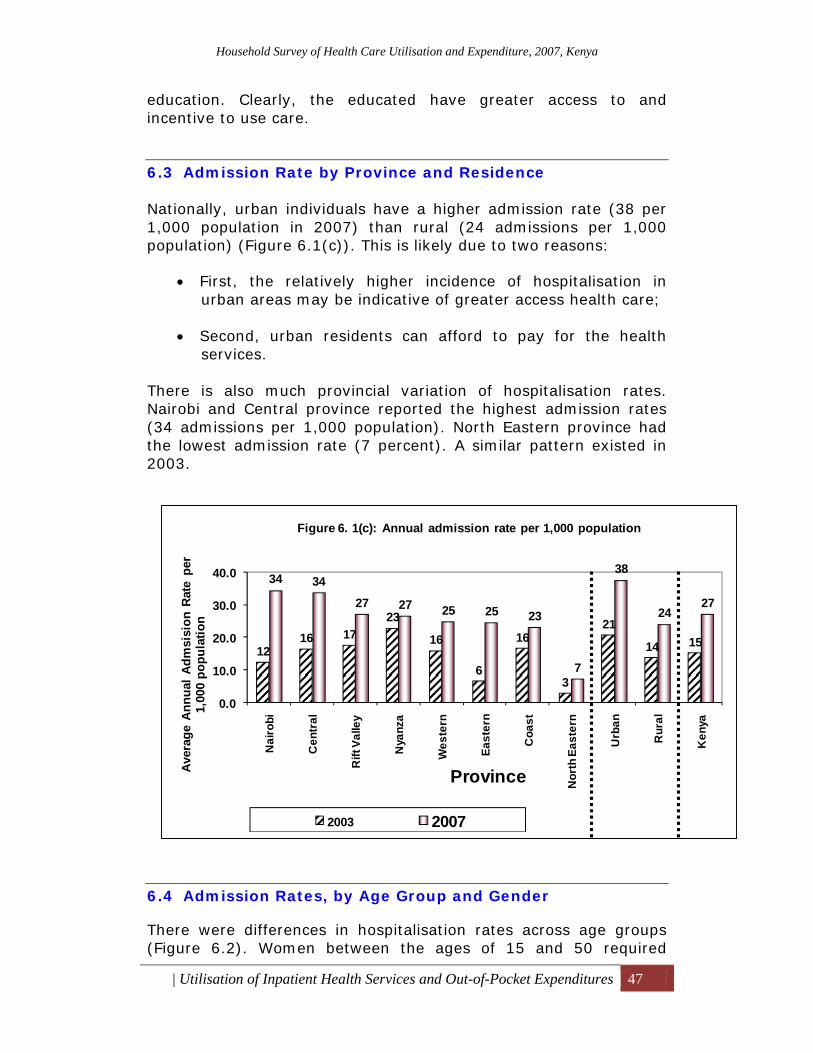
Household Survey of Health Care Utilisation and Expenditure, 2007, Kenya
| Utilisation of Inpatient Health Services and Out-of-Pocket Expenditures 47
education. Clearly, the educated have greater access to and incentive to use care.
6.3 Admission Rate by Province and Residence
Nationally, urban individuals have a higher admission rate (38 per 1,000 population in 2007) than rural (24 admissions per 1,000 population) (Figure 6.1(c)). This is likely due to two reasons:
• First, the relatively higher incidence of hospitalisation in urban areas may be indicative of greater access health care;
• Second, urban residents can afford to pay for the health
services.
There is also much provincial variation of hospitalisation rates. Nairobi and Central province reported the highest admission rates (34 admissions per 1,000 population). North Eastern province had the lowest admission rate (7 percent). A similar pattern existed in 2003.
6.4 Admission Rates, by Age Group and Gender
There were differences in hospitalisation rates across age groups (Figure 6.2). Women between the ages of 15 and 50 required
1216 17
23
16
6
16
3
21
14 15
34 34
27 27 25 25 23
7
38
2427
0.0
10.0
20.0
30.0
40.0
Nai
robi
Cen
tral
Rift
Val
ley
Nya
nza
Wes
tern
East
ern
Coa
st
Nor
th E
aste
rn
Urb
an
Rur
al
Ken
ya
Aver
age
Ann
ual A
dmsi
sion
Rat
e pe
r 1,
000
popu
latio
n
Province
Figure 6. 1(c): Annual admission rate per 1,000 population
2003 2007
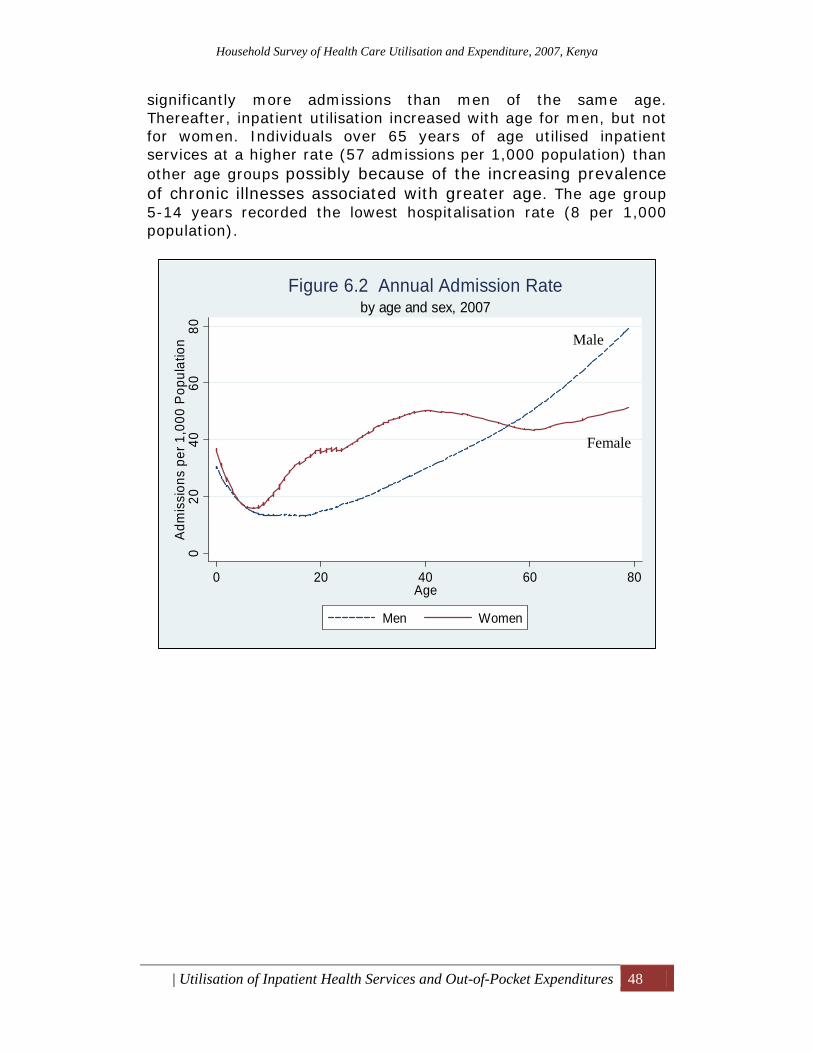
Household Survey of Health Care Utilisation and Expenditure, 2007, Kenya
| Utilisation of Inpatient Health Services and Out-of-Pocket Expenditures 48
significantly more admissions than men of the same age. Thereafter, inpatient utilisation increased with age for men, but not for women. Individuals over 65 years of age utilised inpatient services at a higher rate (57 admissions per 1,000 population) than other age groups possibly because of the increasing prevalence of chronic illnesses associated with greater age. The age group 5-14 years recorded the lowest hospitalisation rate (8 per 1,000 population).
020
4060
80Ad
mis
sion
s pe
r 1,0
00 P
opul
atio
n
0 20 40 60 80Age
Men Women
by age and sex, 2007Figure 6.2 Annual Admission Rate
Male
Female
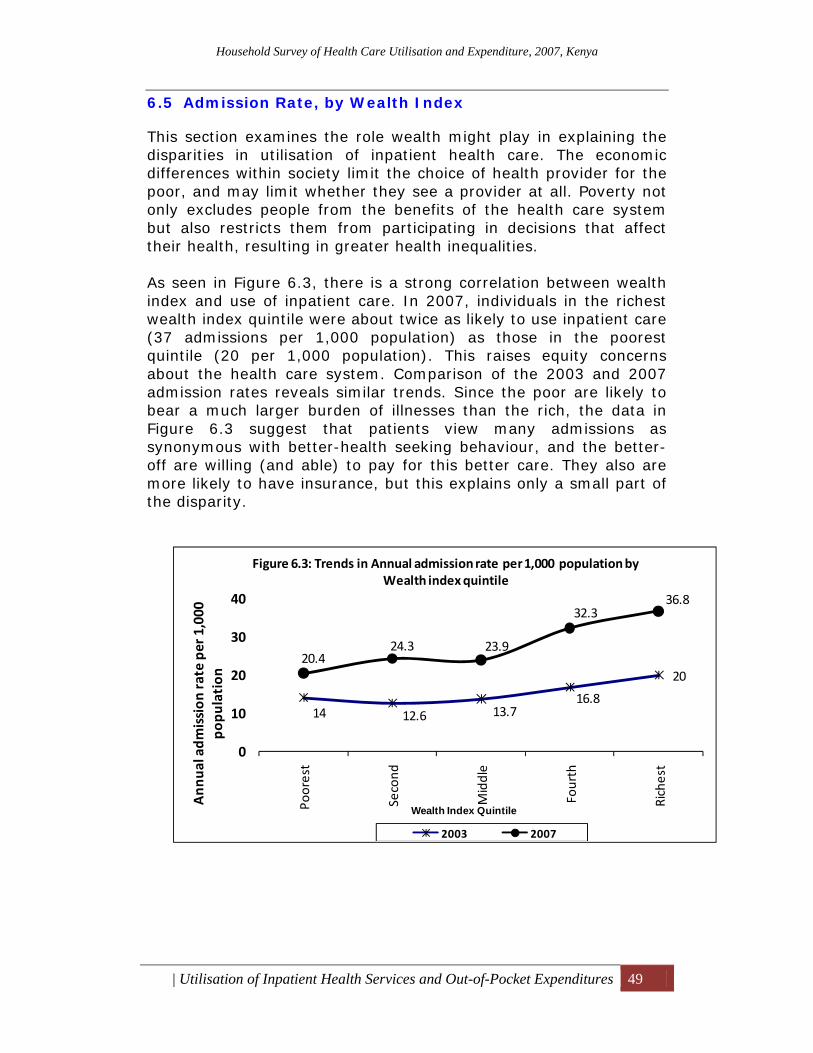
Household Survey of Health Care Utilisation and Expenditure, 2007, Kenya
| Utilisation of Inpatient Health Services and Out-of-Pocket Expenditures 49
6.5 Admission Rate, by Wealth Index
This section examines the role wealth might play in explaining the disparities in utilisation of inpatient health care. The economic differences within society limit the choice of health provider for the poor, and may limit whether they see a provider at all. Poverty not only excludes people from the benefits of the health care system but also restricts them from participating in decisions that affect their health, resulting in greater health inequalities. As seen in Figure 6.3, there is a strong correlation between wealth index and use of inpatient care. In 2007, individuals in the richest wealth index quintile were about twice as likely to use inpatient care (37 admissions per 1,000 population) as those in the poorest quintile (20 per 1,000 population). This raises equity concerns about the health care system. Comparison of the 2003 and 2007 admission rates reveals similar trends. Since the poor are likely to bear a much larger burden of illnesses than the rich, the data in Figure 6.3 suggest that patients view many admissions as synonymous with better-health seeking behaviour, and the better-off are willing (and able) to pay for this better care. They also are more likely to have insurance, but this explains only a small part of the disparity.
14 12.6 13.716.8
2020.4
24.3 23.9
32.336.8
0
10
20
30
40
Poorest
Second
Middle
Fourth
Richest
Ann
ual adm
ission
rate per 1,000
po
pulation
Wealth Index Quintile
Figure 6.3: Trends in Annual admission rate per 1,000 population by Wealth index quintile
2003 2007
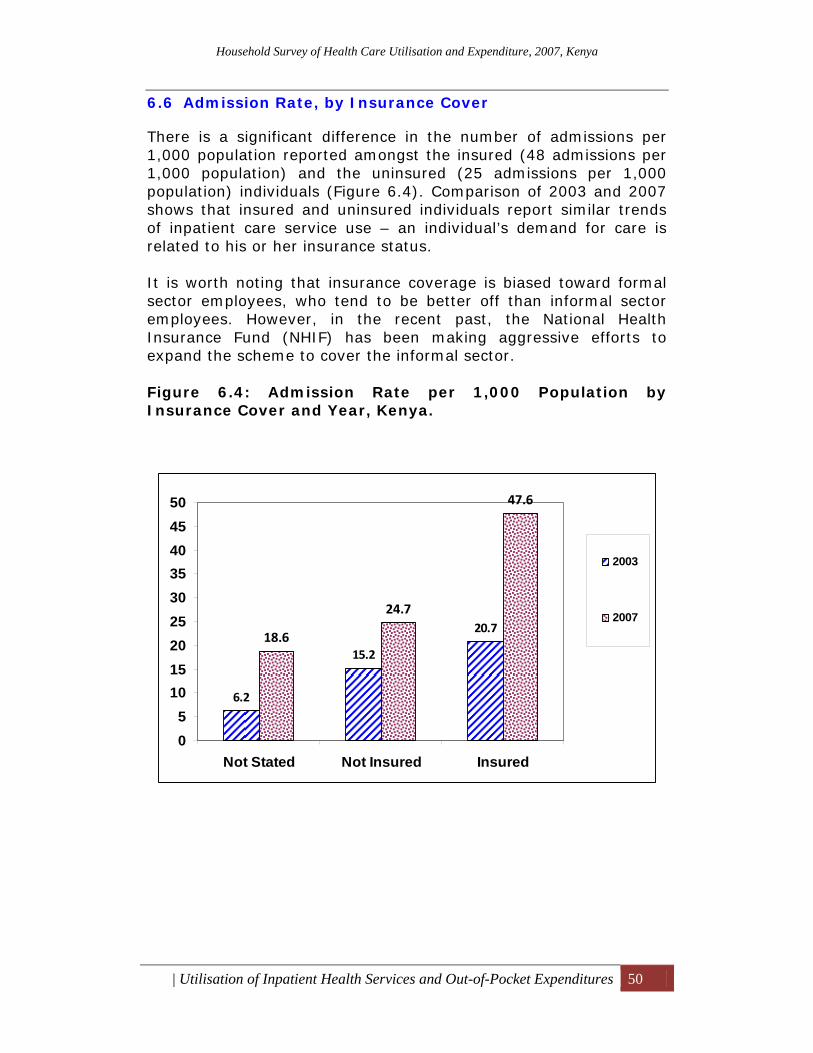
Household Survey of Health Care Utilisation and Expenditure, 2007, Kenya
| Utilisation of Inpatient Health Services and Out-of-Pocket Expenditures 50
6.6 Admission Rate, by Insurance Cover
There is a significant difference in the number of admissions per 1,000 population reported amongst the insured (48 admissions per 1,000 population) and the uninsured (25 admissions per 1,000 population) individuals (Figure 6.4). Comparison of 2003 and 2007 shows that insured and uninsured individuals report similar trends of inpatient care service use – an individual’s demand for care is related to his or her insurance status. It is worth noting that insurance coverage is biased toward formal sector employees, who tend to be better off than informal sector employees. However, in the recent past, the National Health Insurance Fund (NHIF) has been making aggressive efforts to expand the scheme to cover the informal sector. Figure 6.4: Admission Rate per 1,000 Population by Insurance Cover and Year, Kenya.
6.2
15.2
20.718.6
24.7
47.6
05
101520253035404550
Not Stated Not Insured Insured
2003
2007
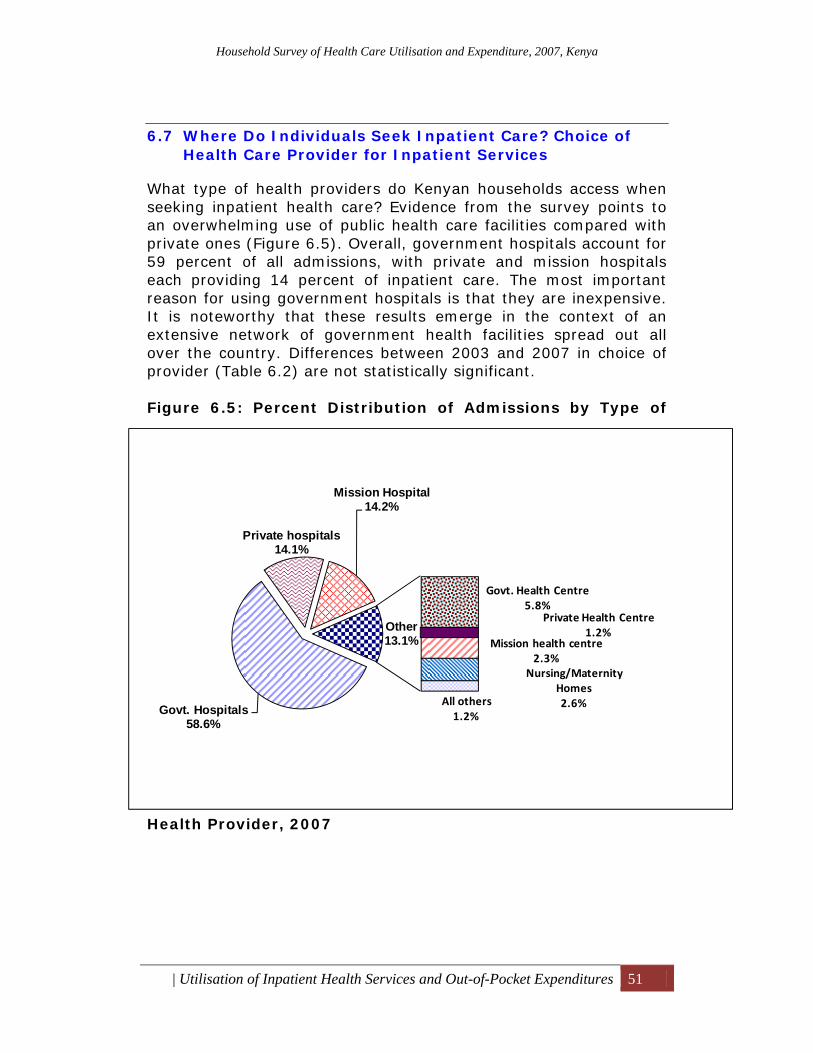
Household Survey of Health Care Utilisation and Expenditure, 2007, Kenya
| Utilisation of Inpatient Health Services and Out-of-Pocket Expenditures 51
6.7 Where Do Individuals Seek Inpatient Care? Choice of Health Care Provider for Inpatient Services
What type of health providers do Kenyan households access when seeking inpatient health care? Evidence from the survey points to an overwhelming use of public health care facilities compared with private ones (Figure 6.5). Overall, government hospitals account for 59 percent of all admissions, with private and mission hospitals each providing 14 percent of inpatient care. The most important reason for using government hospitals is that they are inexpensive. It is noteworthy that these results emerge in the context of an extensive network of government health facilities spread out all over the country. Differences between 2003 and 2007 in choice of provider (Table 6.2) are not statistically significant. Figure 6.5: Percent Distribution of Admissions by Type of
Health Provider, 2007
Govt. Hospitals58.6%
Private hospitals14.1%
Mission Hospital14.2%
Govt. Health Centre5.8%
Private Health Centre1.2%
Mission health centre2.3%
Nursing/Maternity Homes2.6%All others
1.2%
Other13.1%
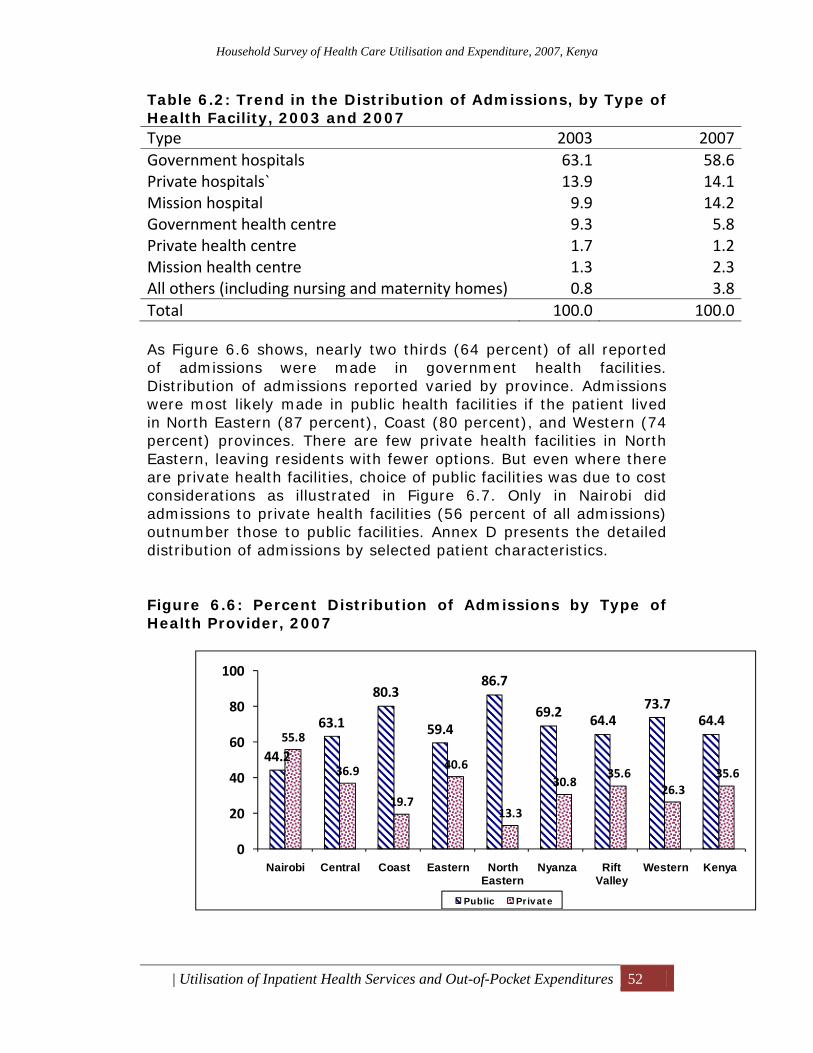
Household Survey of Health Care Utilisation and Expenditure, 2007, Kenya
| Utilisation of Inpatient Health Services and Out-of-Pocket Expenditures 52
Table 6.2: Trend in the Distribution of Admissions, by Type of Health Facility, 2003 and 2007 Type 2003 2007Government hospitals 63.1 58.6Private hospitals` 13.9 14.1Mission hospital 9.9 14.2Government health centre 9.3 5.8Private health centre 1.7 1.2Mission health centre 1.3 2.3All others (including nursing and maternity homes) 0.8 3.8Total 100.0 100.0 As Figure 6.6 shows, nearly two thirds (64 percent) of all reported of admissions were made in government health facilities. Distribution of admissions reported varied by province. Admissions were most likely made in public health facilities if the patient lived in North Eastern (87 percent), Coast (80 percent), and Western (74 percent) provinces. There are few private health facilities in North Eastern, leaving residents with fewer options. But even where there are private health facilities, choice of public facilities was due to cost considerations as illustrated in Figure 6.7. Only in Nairobi did admissions to private health facilities (56 percent of all admissions) outnumber those to public facilities. Annex D presents the detailed distribution of admissions by selected patient characteristics. Figure 6.6: Percent Distribution of Admissions by Type of Health Provider, 2007
44.2
63.1
80.3
59.4
86.7
69.2 64.473.7
64.455.8
36.9
19.7
40.6
13.3
30.835.6
26.335.6
0
20
40
60
80
100
Nairobi Central Coast Eastern North Eastern
Nyanza Rift Valley
Western Kenya
Public Priv at e
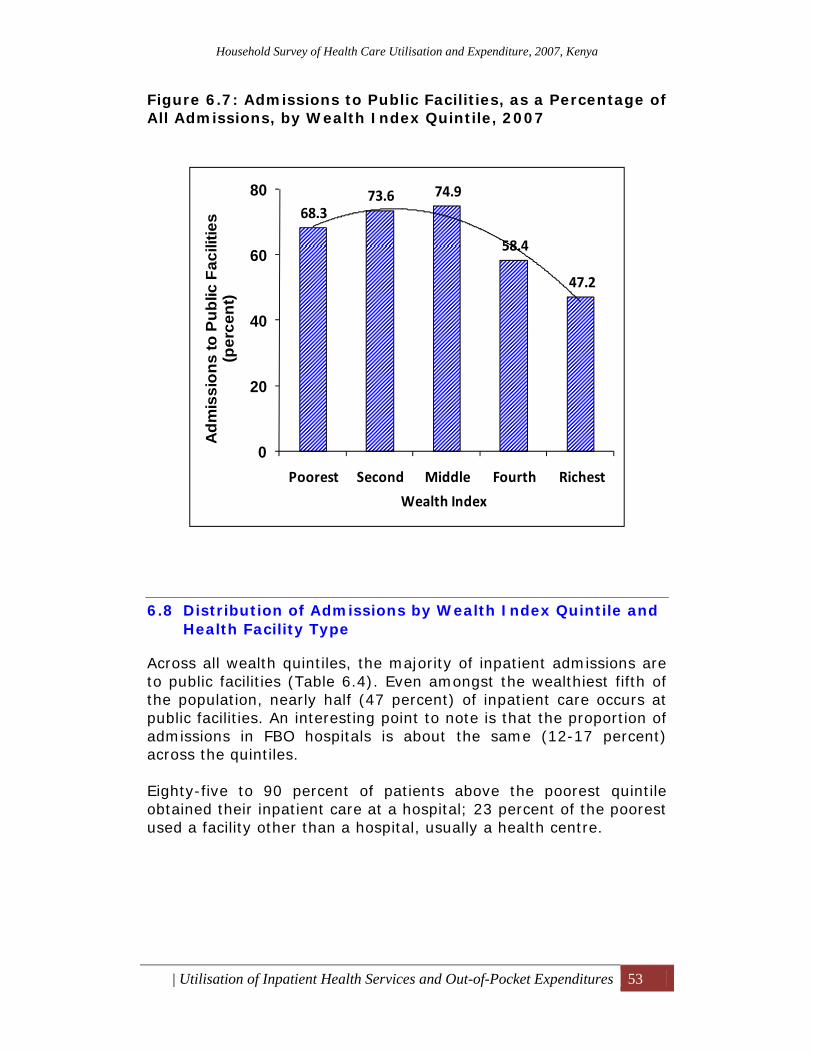
Household Survey of Health Care Utilisation and Expenditure, 2007, Kenya
| Utilisation of Inpatient Health Services and Out-of-Pocket Expenditures 53
Figure 6.7: Admissions to Public Facilities, as a Percentage of All Admissions, by Wealth Index Quintile, 2007
6.8 Distribution of Admissions by Wealth Index Quintile and Health Facility Type
Across all wealth quintiles, the majority of inpatient admissions are to public facilities (Table 6.4). Even amongst the wealthiest fifth of the population, nearly half (47 percent) of inpatient care occurs at public facilities. An interesting point to note is that the proportion of admissions in FBO hospitals is about the same (12-17 percent) across the quintiles. Eighty-five to 90 percent of patients above the poorest quintile obtained their inpatient care at a hospital; 23 percent of the poorest used a facility other than a hospital, usually a health centre.
68.373.6 74.9
58.4
47.2
0
20
40
60
80
Poorest Second Middle Fourth Richest
Adm
issi
ons
to P
ublic
Fac
ilitie
s (p
erce
nt)
Wealth Index
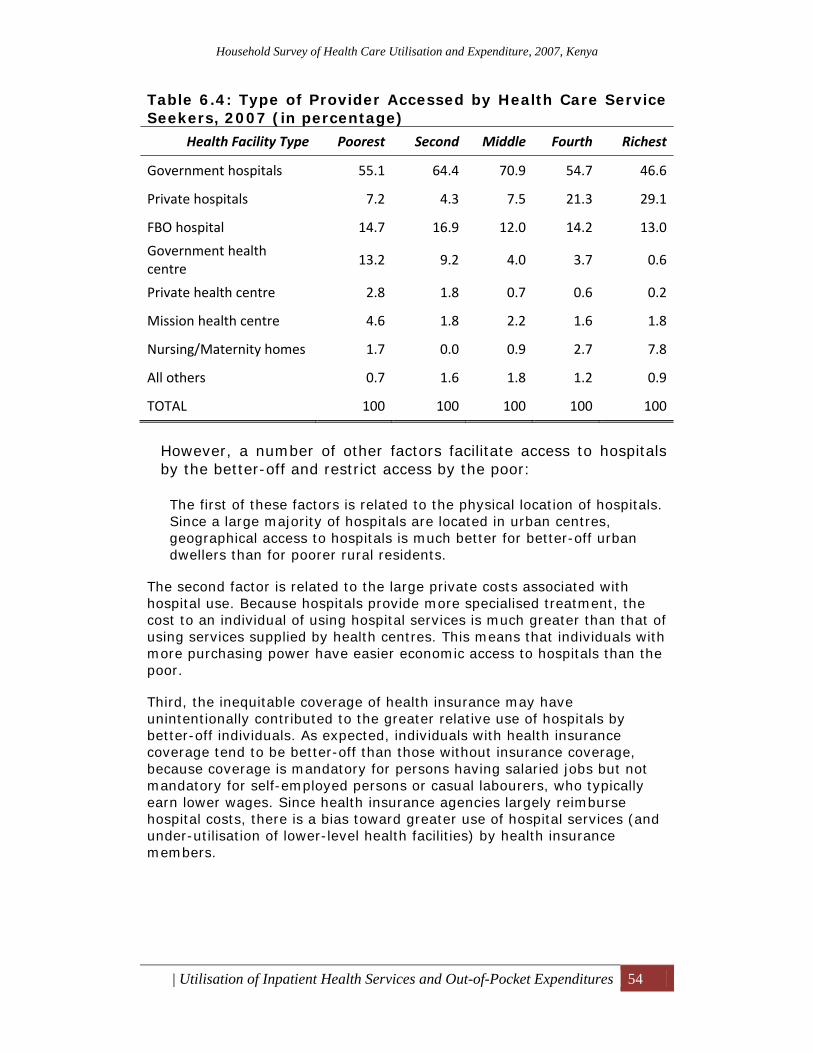
Household Survey of Health Care Utilisation and Expenditure, 2007, Kenya
| Utilisation of Inpatient Health Services and Out-of-Pocket Expenditures 54
Table 6.4: Type of Provider Accessed by Health Care Service Seekers, 2007 (in percentage)
Health Facility Type Poorest Second Middle Fourth Richest
Government hospitals 55.1 64.4 70.9 54.7 46.6
Private hospitals 7.2 4.3 7.5 21.3 29.1
FBO hospital 14.7 16.9 12.0 14.2 13.0
Government health centre
13.2 9.2 4.0 3.7 0.6
Private health centre 2.8 1.8 0.7 0.6 0.2
Mission health centre 4.6 1.8 2.2 1.6 1.8
Nursing/Maternity homes 1.7 0.0 0.9 2.7 7.8
All others 0.7 1.6 1.8 1.2 0.9
TOTAL 100 100 100 100 100
However, a number of other factors facilitate access to hospitals by the better-off and restrict access by the poor:
The first of these factors is related to the physical location of hospitals. Since a large majority of hospitals are located in urban centres, geographical access to hospitals is much better for better-off urban dwellers than for poorer rural residents.
The second factor is related to the large private costs associated with hospital use. Because hospitals provide more specialised treatment, the cost to an individual of using hospital services is much greater than that of using services supplied by health centres. This means that individuals with more purchasing power have easier economic access to hospitals than the poor.
Third, the inequitable coverage of health insurance may have unintentionally contributed to the greater relative use of hospitals by better-off individuals. As expected, individuals with health insurance coverage tend to be better-off than those without insurance coverage, because coverage is mandatory for persons having salaried jobs but not mandatory for self-employed persons or casual labourers, who typically earn lower wages. Since health insurance agencies largely reimburse hospital costs, there is a bias toward greater use of hospital services (and under-utilisation of lower-level health facilities) by health insurance members.
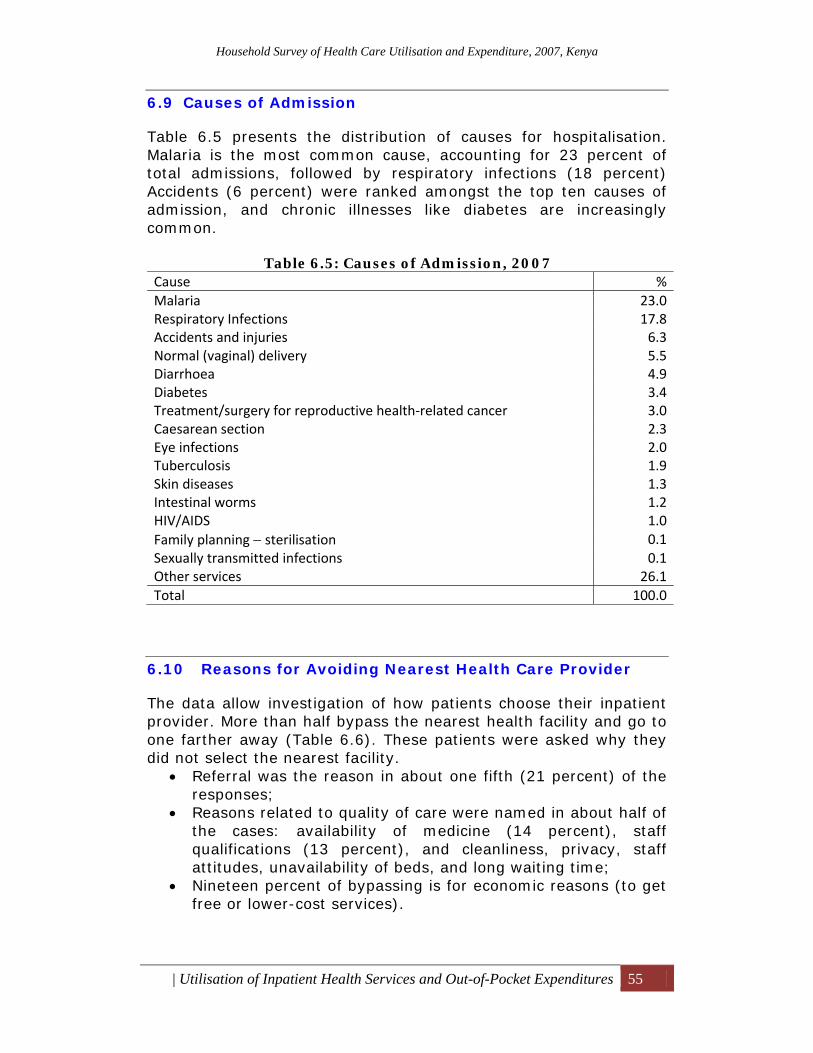
Household Survey of Health Care Utilisation and Expenditure, 2007, Kenya
| Utilisation of Inpatient Health Services and Out-of-Pocket Expenditures 55
6.9 Causes of Admission
Table 6.5 presents the distribution of causes for hospitalisation. Malaria is the most common cause, accounting for 23 percent of total admissions, followed by respiratory infections (18 percent) Accidents (6 percent) were ranked amongst the top ten causes of admission, and chronic illnesses like diabetes are increasingly common.
Table 6.5: Causes of Admission, 2007 Cause %Malaria 23.0Respiratory Infections 17.8Accidents and injuries 6.3Normal (vaginal) delivery 5.5Diarrhoea 4.9Diabetes 3.4Treatment/surgery for reproductive health‐related cancer 3.0Caesarean section 2.3Eye infections 2.0Tuberculosis 1.9Skin diseases 1.3Intestinal worms 1.2HIV/AIDS 1.0Family planning − sterilisation 0.1Sexually transmitted infections 0.1Other services 26.1Total 100.0
6.10 Reasons for Avoiding Nearest Health Care Provider
The data allow investigation of how patients choose their inpatient provider. More than half bypass the nearest health facility and go to one farther away (Table 6.6). These patients were asked why they did not select the nearest facility.
• Referral was the reason in about one fifth (21 percent) of the responses;
• Reasons related to quality of care were named in about half of the cases: availability of medicine (14 percent), staff qualifications (13 percent), and cleanliness, privacy, staff attitudes, unavailability of beds, and long waiting time;
• Nineteen percent of bypassing is for economic reasons (to get free or lower-cost services).
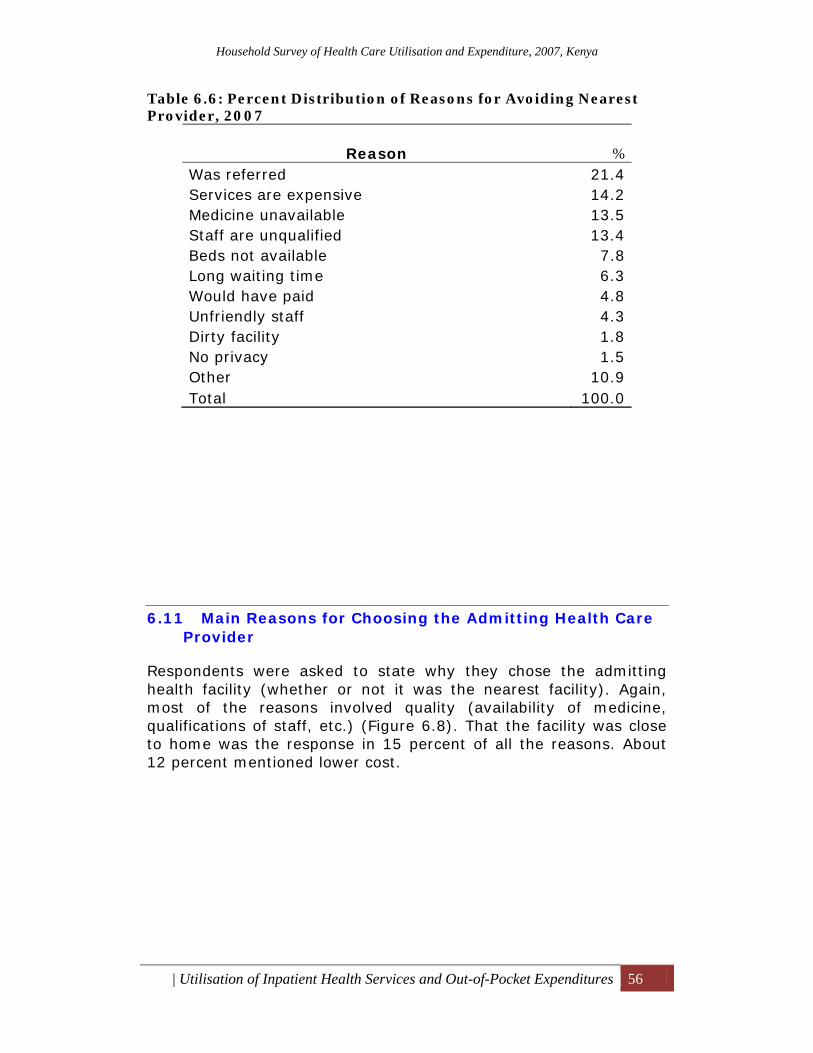
Household Survey of Health Care Utilisation and Expenditure, 2007, Kenya
| Utilisation of Inpatient Health Services and Out-of-Pocket Expenditures 56
Table 6.6: Percent Distribution of Reasons for Avoiding Nearest Provider, 2007
Reason % Was referred 21.4 Services are expensive 14.2 Medicine unavailable 13.5 Staff are unqualified 13.4 Beds not available 7.8 Long waiting time 6.3 Would have paid 4.8 Unfriendly staff 4.3 Dirty facility 1.8 No privacy 1.5 Other 10.9 Total 100.0
6.11 Main Reasons for Choosing the Admitting Health Care Provider
Respondents were asked to state why they chose the admitting health facility (whether or not it was the nearest facility). Again, most of the reasons involved quality (availability of medicine, qualifications of staff, etc.) (Figure 6.8). That the facility was close to home was the response in 15 percent of all the reasons. About 12 percent mentioned lower cost.
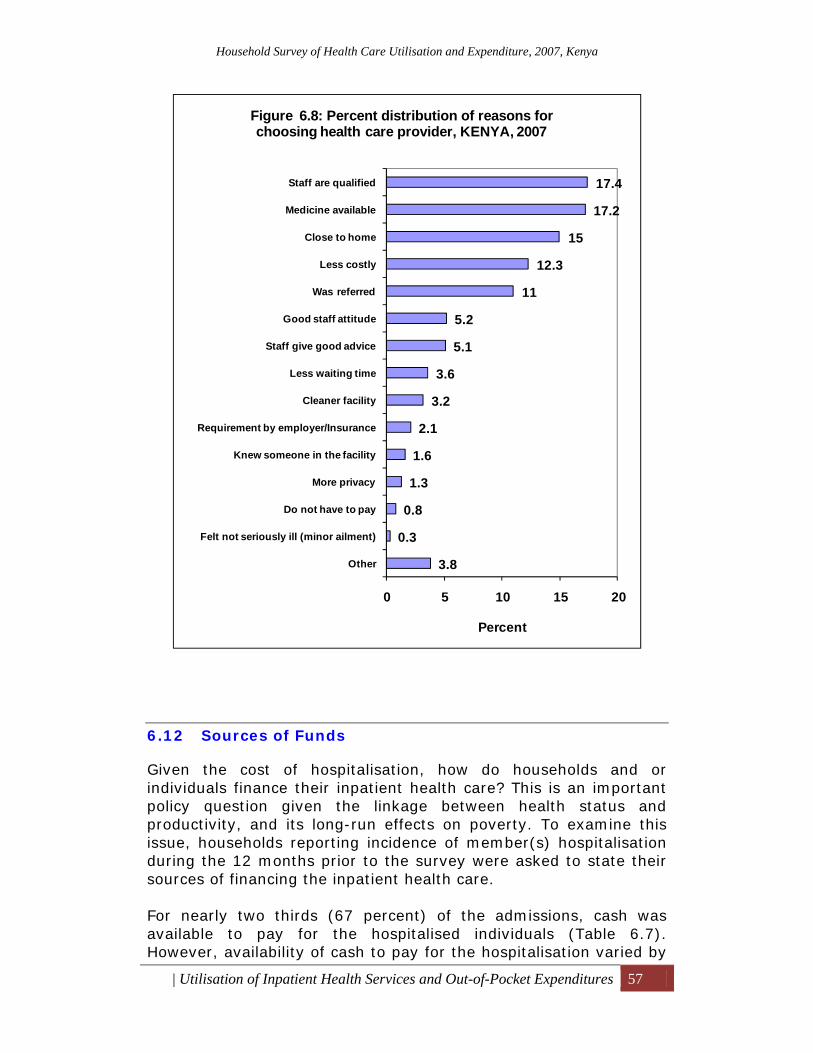
Household Survey of Health Care Utilisation and Expenditure, 2007, Kenya
| Utilisation of Inpatient Health Services and Out-of-Pocket Expenditures 57
6.12 Sources of Funds
Given the cost of hospitalisation, how do households and or individuals finance their inpatient health care? This is an important policy question given the linkage between health status and productivity, and its long-run effects on poverty. To examine this issue, households reporting incidence of member(s) hospitalisation during the 12 months prior to the survey were asked to state their sources of financing the inpatient health care. For nearly two thirds (67 percent) of the admissions, cash was available to pay for the hospitalised individuals (Table 6.7). However, availability of cash to pay for the hospitalisation varied by
3.8
0.3
0.8
1.3
1.6
2.1
3.2
3.6
5.1
5.2
11
12.3
15
17.2
17.4
0 5 10 15 20
Other
Felt not seriously ill (minor ailment)
Do not have to pay
More privacy
Knew someone in the facility
Requirement by employer/Insurance
Cleaner facility
Less waiting time
Staff give good advice
Good staff attitude
Was referred
Less costly
Close to home
Medicine available
Staff are qualified
Percent
Figure 6.8: Percent distribution of reasons for choosing health care provider, KENYA, 2007
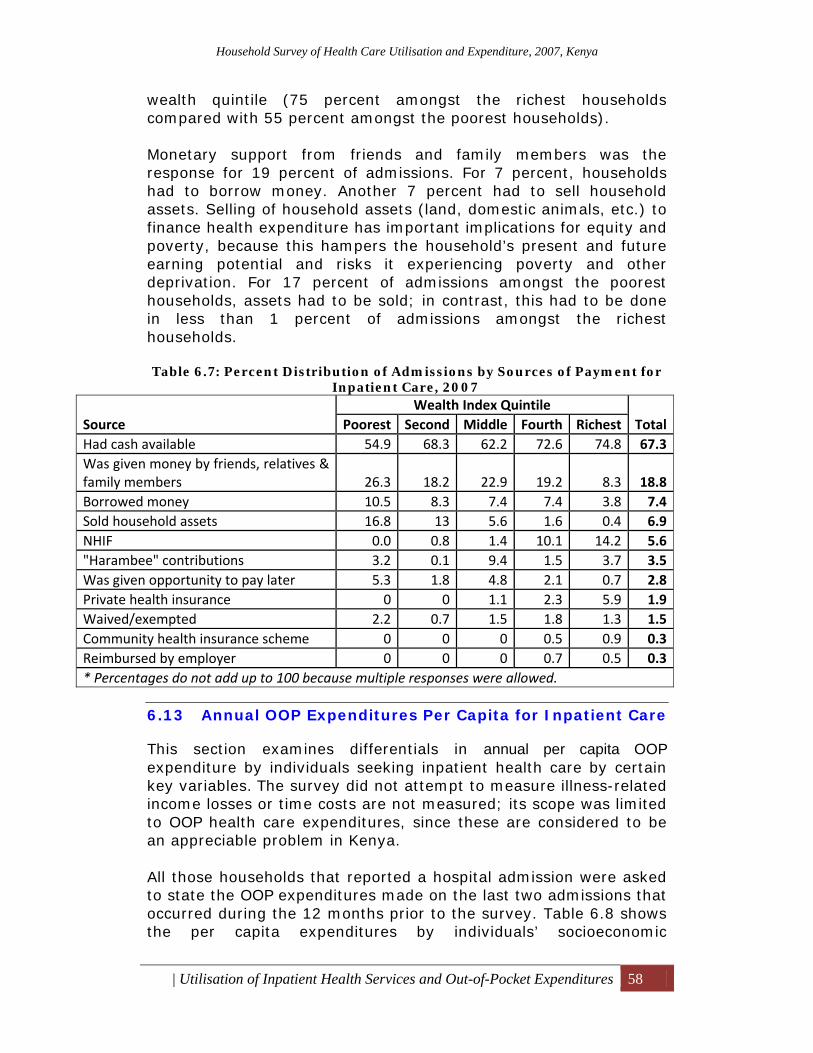
Household Survey of Health Care Utilisation and Expenditure, 2007, Kenya
| Utilisation of Inpatient Health Services and Out-of-Pocket Expenditures 58
wealth quintile (75 percent amongst the richest households compared with 55 percent amongst the poorest households). Monetary support from friends and family members was the response for 19 percent of admissions. For 7 percent, households had to borrow money. Another 7 percent had to sell household assets. Selling of household assets (land, domestic animals, etc.) to finance health expenditure has important implications for equity and poverty, because this hampers the household’s present and future earning potential and risks it experiencing poverty and other deprivation. For 17 percent of admissions amongst the poorest households, assets had to be sold; in contrast, this had to be done in less than 1 percent of admissions amongst the richest households. Table 6.7: Percent Distribution of Admissions by Sources of Payment for
Inpatient Care, 2007
Source Wealth Index Quintile
TotalPoorest Second Middle Fourth Richest Had cash available 54.9 68.3 62.2 72.6 74.8 67.3Was given money by friends, relatives & family members 26.3 18.2 22.9 19.2 8.3 18.8Borrowed money 10.5 8.3 7.4 7.4 3.8 7.4Sold household assets 16.8 13 5.6 1.6 0.4 6.9NHIF 0.0 0.8 1.4 10.1 14.2 5.6"Harambee" contributions 3.2 0.1 9.4 1.5 3.7 3.5Was given opportunity to pay later 5.3 1.8 4.8 2.1 0.7 2.8Private health insurance 0 0 1.1 2.3 5.9 1.9Waived/exempted 2.2 0.7 1.5 1.8 1.3 1.5Community health insurance scheme 0 0 0 0.5 0.9 0.3Reimbursed by employer 0 0 0 0.7 0.5 0.3* Percentages do not add up to 100 because multiple responses were allowed.
6.13 Annual OOP Expenditures Per Capita for Inpatient Care
This section examines differentials in annual per capita OOP expenditure by individuals seeking inpatient health care by certain key variables. The survey did not attempt to measure illness-related income losses or time costs are not measured; its scope was limited to OOP health care expenditures, since these are considered to be an appreciable problem in Kenya. All those households that reported a hospital admission were asked to state the OOP expenditures made on the last two admissions that occurred during the 12 months prior to the survey. Table 6.8 shows the per capita expenditures by individuals’ socioeconomic
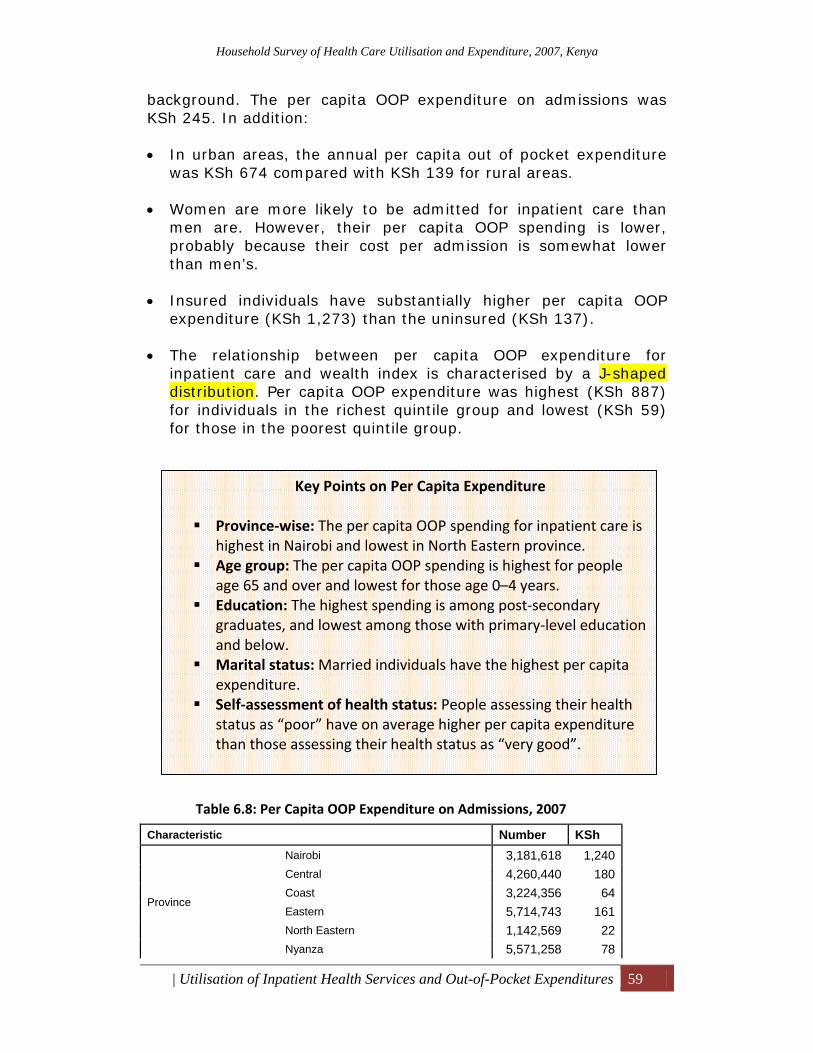
Household Survey of Health Care Utilisation and Expenditure, 2007, Kenya
| Utilisation of Inpatient Health Services and Out-of-Pocket Expenditures 59
background. The per capita OOP expenditure on admissions was KSh 245. In addition: • In urban areas, the annual per capita out of pocket expenditure
was KSh 674 compared with KSh 139 for rural areas. • Women are more likely to be admitted for inpatient care than
men are. However, their per capita OOP spending is lower, probably because their cost per admission is somewhat lower than men’s.
• Insured individuals have substantially higher per capita OOP
expenditure (KSh 1,273) than the uninsured (KSh 137). • The relationship between per capita OOP expenditure for
inpatient care and wealth index is characterised by a J-shaped distribution. Per capita OOP expenditure was highest (KSh 887) for individuals in the richest quintile group and lowest (KSh 59) for those in the poorest quintile group.
Table 6.8: Per Capita OOP Expenditure on Admissions, 2007
Characteristic Number KSh
Province
Nairobi 3,181,618 1,240 Central 4,260,440 180 Coast 3,224,356 64 Eastern 5,714,743 161 North Eastern 1,142,569 22 Nyanza 5,571,258 78
Key Points on Per Capita Expenditure Province‐wise: The per capita OOP spending for inpatient care is highest in Nairobi and lowest in North Eastern province.
Age group: The per capita OOP spending is highest for people age 65 and over and lowest for those age 0–4 years.
Education: The highest spending is among post‐secondary graduates, and lowest among those with primary‐level education and below.
Marital status: Married individuals have the highest per capita expenditure.
Self‐assessment of health status: People assessing their health status as “poor” have on average higher per capita expenditure than those assessing their health status as “very good”.
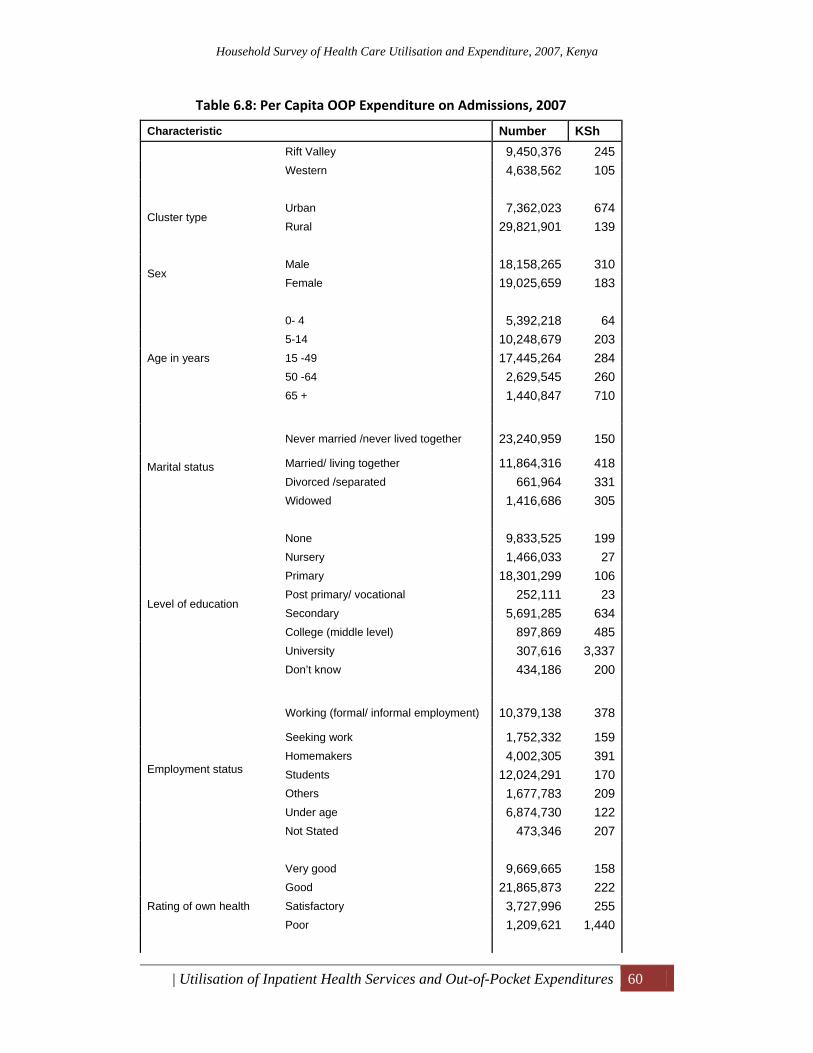
Household Survey of Health Care Utilisation and Expenditure, 2007, Kenya
| Utilisation of Inpatient Health Services and Out-of-Pocket Expenditures 60
Table 6.8: Per Capita OOP Expenditure on Admissions, 2007
Characteristic Number KSh Rift Valley 9,450,376 245 Western 4,638,562 105
Cluster type Urban 7,362,023 674 Rural 29,821,901 139
Sex Male 18,158,265 310 Female 19,025,659 183
Age in years
0- 4 5,392,218 64 5-14 10,248,679 203 15 -49 17,445,264 284 50 -64 2,629,545 260 65 + 1,440,847 710
Marital status
Never married /never lived together 23,240,959 150
Married/ living together 11,864,316 418 Divorced /separated 661,964 331 Widowed 1,416,686 305
Level of education
None 9,833,525 199 Nursery 1,466,033 27 Primary 18,301,299 106 Post primary/ vocational 252,111 23 Secondary 5,691,285 634 College (middle level) 897,869 485 University 307,616 3,337 Don’t know 434,186 200
Employment status
Working (formal/ informal employment) 10,379,138 378
Seeking work 1,752,332 159 Homemakers 4,002,305 391 Students 12,024,291 170 Others 1,677,783 209 Under age 6,874,730 122 Not Stated 473,346 207
Rating of own health
Very good 9,669,665 158 Good 21,865,873 222 Satisfactory 3,727,996 255 Poor 1,209,621 1,440
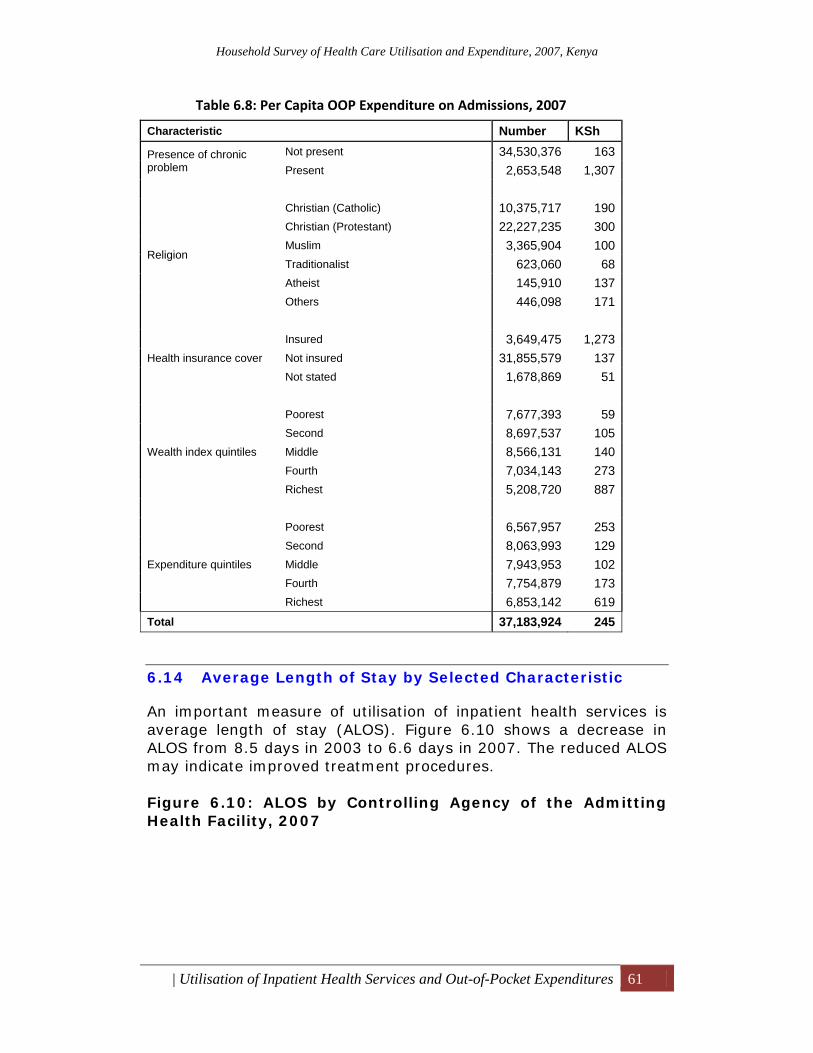
Household Survey of Health Care Utilisation and Expenditure, 2007, Kenya
| Utilisation of Inpatient Health Services and Out-of-Pocket Expenditures 61
Table 6.8: Per Capita OOP Expenditure on Admissions, 2007
Characteristic Number KSh
Presence of chronic problem
Not present 34,530,376 163 Present 2,653,548 1,307
Religion
Christian (Catholic) 10,375,717 190 Christian (Protestant) 22,227,235 300 Muslim 3,365,904 100 Traditionalist 623,060 68 Atheist 145,910 137 Others 446,098 171
Health insurance cover
Insured 3,649,475 1,273 Not insured 31,855,579 137 Not stated 1,678,869 51
Wealth index quintiles
Poorest 7,677,393 59 Second 8,697,537 105 Middle 8,566,131 140 Fourth 7,034,143 273 Richest 5,208,720 887
Expenditure quintiles
Poorest 6,567,957 253 Second 8,063,993 129 Middle 7,943,953 102 Fourth 7,754,879 173 Richest 6,853,142 619
Total 37,183,924 245
6.14 Average Length of Stay by Selected Characteristic
An important measure of utilisation of inpatient health services is average length of stay (ALOS). Figure 6.10 shows a decrease in ALOS from 8.5 days in 2003 to 6.6 days in 2007. The reduced ALOS may indicate improved treatment procedures. Figure 6.10: ALOS by Controlling Agency of the Admitting Health Facility, 2007
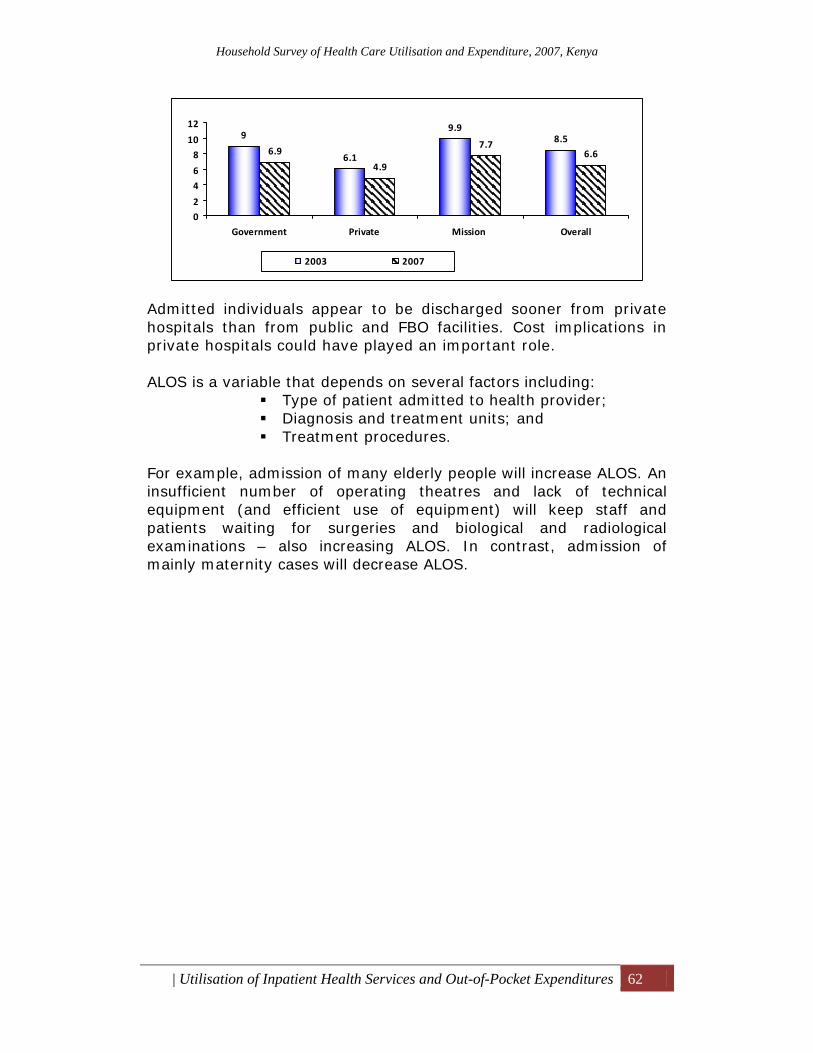
Household Survey of Health Care Utilisation and Expenditure, 2007, Kenya
| Utilisation of Inpatient Health Services and Out-of-Pocket Expenditures 62
Admitted individuals appear to be discharged sooner from private hospitals than from public and FBO facilities. Cost implications in private hospitals could have played an important role. ALOS is a variable that depends on several factors including:
Type of patient admitted to health provider; Diagnosis and treatment units; and Treatment procedures.
For example, admission of many elderly people will increase ALOS. An insufficient number of operating theatres and lack of technical equipment (and efficient use of equipment) will keep staff and patients waiting for surgeries and biological and radiological examinations – also increasing ALOS. In contrast, admission of mainly maternity cases will decrease ALOS.
9
6.1
9.98.5
6.9
4.9
7.76.6
0
2
4
6
8
10
12
Government Private Mission Overall
2003 2007
Household Survey of Health Care Utilisation and Expenditure, 2007, Kenya
| Health Insurance Coverage 63
7 Health Insurance Coverage This section presents the socioeconomic and demographic characteristics of insured and uninsured individuals to identify whether insurance coverage can be linked to these characteristics. In Kenya, contribution to the NHIF is compulsory for specific groups: all persons engaged in formal employment. It is voluntary for the self-employed. Some large companies also have group insurance schemes for their employees. There are also private health insurance firms. The results of this household survey are relevant to Kenya’s current debate on the introduction of national social health insurance as a means to make health care services more accessible.
7.1 Population with Health Insurance Cover
Table 7.1 presents the population by insurance coverage and socioeconomic and demographic characteristics. Overall, only about 10 percent have some form of insurance cover. Coverage has remained the same since 2003. By region, Nairobi has the highest coverage − nearly one in four individuals has insurance – while it is lowest in North Eastern province. Insurance coverage is higher (20 percent) amongst urban residents than amongst rural ones (7 percent). Coverage of males is slightly higher than that of females. Insurance coverage is highest amongst those whose self-assessed health status was recorded as “very good.” In terms of income, coverage is highest for those in the richest quintile (31 percent) and lowest for those in the poorest quintile (1 percent). As education level increases, the percentage of insurance coverage increases – the percentage with insurance cover was highest amongst those with post-secondary education (over 43 percent) and lowest amongst those who had only primary-level education (7 percent).
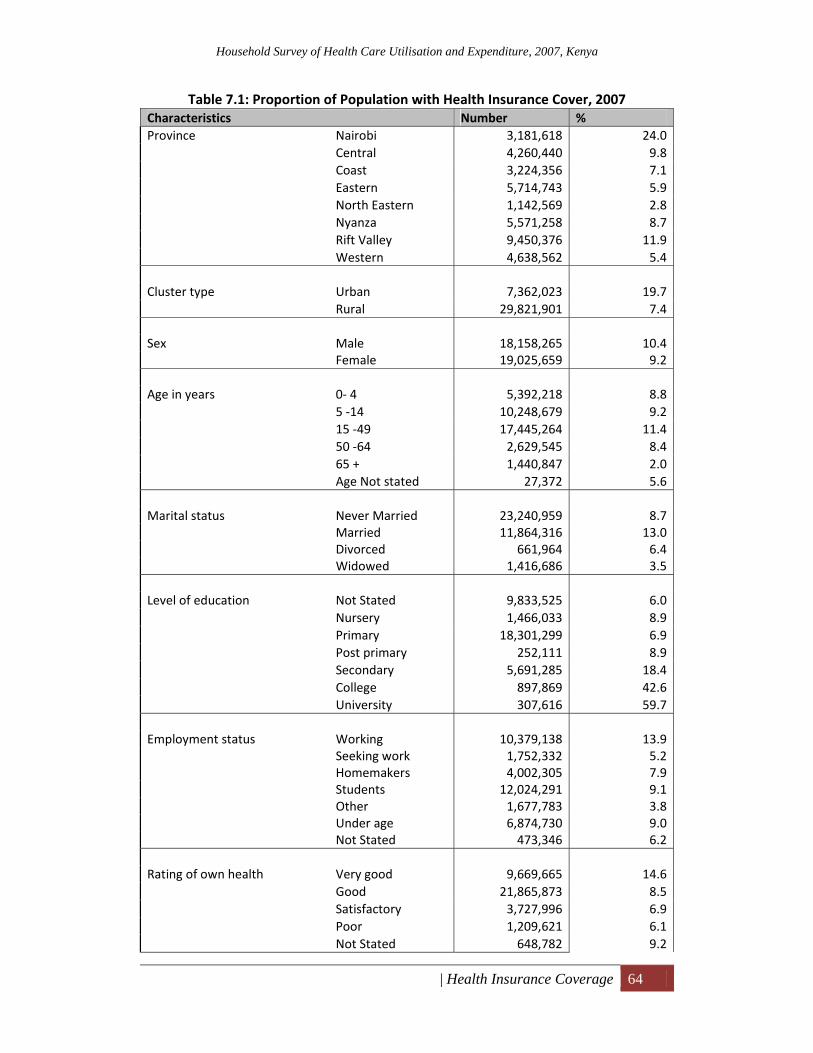
Household Survey of Health Care Utilisation and Expenditure, 2007, Kenya
| Health Insurance Coverage 64
Table 7.1: Proportion of Population with Health Insurance Cover, 2007 Characteristics Number % Province Nairobi 3,181,618 24.0
Central 4,260,440 9.8Coast 3,224,356 7.1Eastern 5,714,743 5.9North Eastern 1,142,569 2.8Nyanza 5,571,258 8.7Rift Valley 9,450,376 11.9Western 4,638,562 5.4
Cluster type Urban 7,362,023 19.7
Rural 29,821,901 7.4 Sex Male 18,158,265 10.4
Female 19,025,659 9.2 Age in years 0‐ 4 5,392,218 8.8
5 ‐14 10,248,679 9.215 ‐49 17,445,264 11.450 ‐64 2,629,545 8.465 + 1,440,847 2.0Age Not stated 27,372 5.6
Marital status Never Married 23,240,959 8.7
Married 11,864,316 13.0Divorced 661,964 6.4Widowed 1,416,686 3.5
Level of education Not Stated 9,833,525 6.0
Nursery 1,466,033 8.9Primary 18,301,299 6.9Post primary 252,111 8.9Secondary 5,691,285 18.4College 897,869 42.6University 307,616 59.7
Employment status Working 10,379,138 13.9
Seeking work 1,752,332 5.2Homemakers 4,002,305 7.9Students 12,024,291 9.1Other 1,677,783 3.8Under age 6,874,730 9.0Not Stated 473,346 6.2
Rating of own health Very good 9,669,665 14.6
Good 21,865,873 8.5Satisfactory 3,727,996 6.9Poor 1,209,621 6.1Not Stated 648,782 9.2
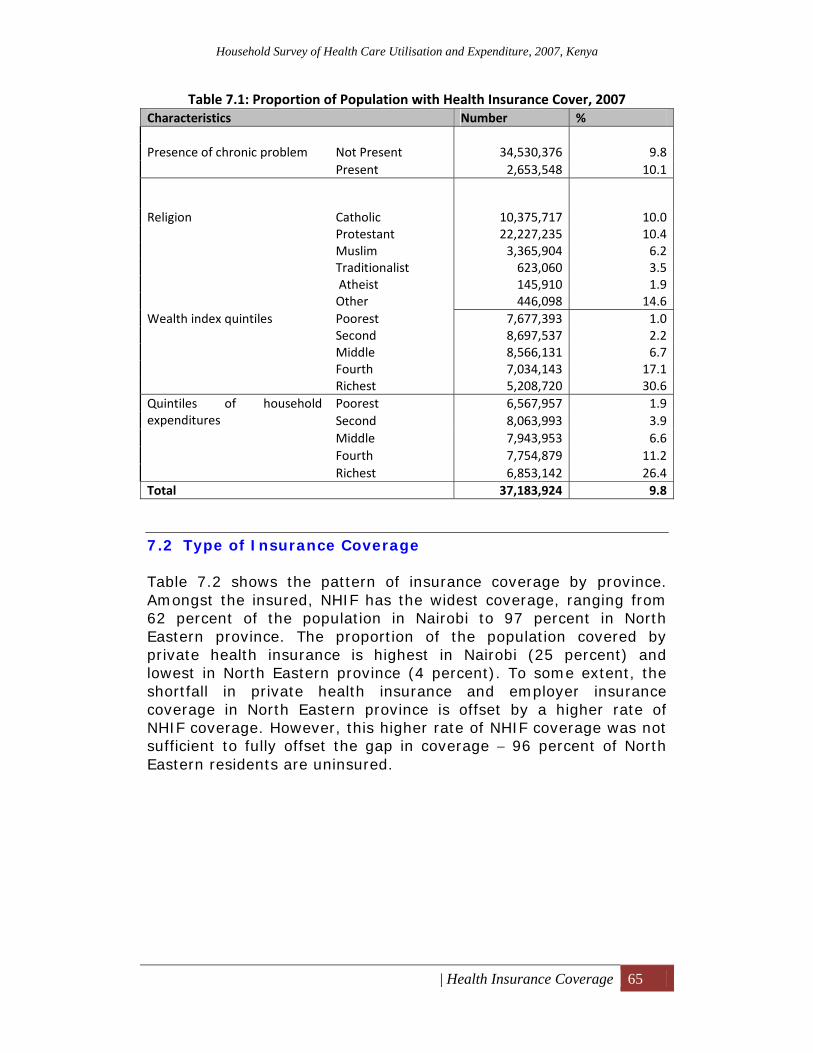
Household Survey of Health Care Utilisation and Expenditure, 2007, Kenya
| Health Insurance Coverage 65
Table 7.1: Proportion of Population with Health Insurance Cover, 2007 Characteristics Number % Presence of chronic problem Not Present 34,530,376 9.8
Present 2,653,548 10.1
Religion Catholic 10,375,717 10.0Protestant 22,227,235 10.4Muslim 3,365,904 6.2Traditionalist 623,060 3.5 Atheist 145,910 1.9Other 446,098 14.6
Wealth index quintiles Poorest 7,677,393 1.0Second 8,697,537 2.2Middle 8,566,131 6.7Fourth 7,034,143 17.1Richest 5,208,720 30.6
Quintiles of household expenditures
Poorest 6,567,957 1.9Second 8,063,993 3.9Middle 7,943,953 6.6Fourth 7,754,879 11.2Richest 6,853,142 26.4
Total 37,183,924 9.8
7.2 Type of Insurance Coverage
Table 7.2 shows the pattern of insurance coverage by province. Amongst the insured, NHIF has the widest coverage, ranging from 62 percent of the population in Nairobi to 97 percent in North Eastern province. The proportion of the population covered by private health insurance is highest in Nairobi (25 percent) and lowest in North Eastern province (4 percent). To some extent, the shortfall in private health insurance and employer insurance coverage in North Eastern province is offset by a higher rate of NHIF coverage. However, this higher rate of NHIF coverage was not sufficient to fully offset the gap in coverage − 96 percent of North Eastern residents are uninsured.
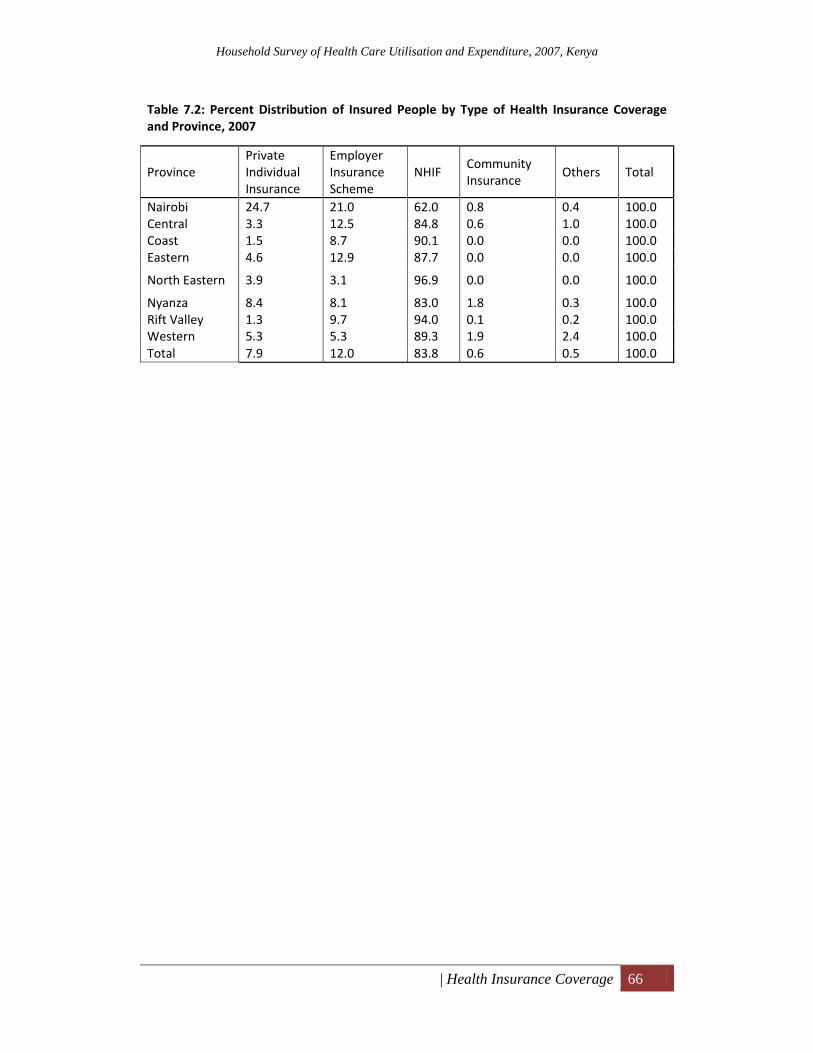
Household Survey of Health Care Utilisation and Expenditure, 2007, Kenya
| Health Insurance Coverage 66
Table 7.2: Percent Distribution of Insured People by Type of Health Insurance Coverage and Province, 2007
Province Private Individual Insurance
Employer Insurance Scheme
NHIF Community Insurance
Others Total
Nairobi 24.7 21.0 62.0 0.8 0.4 100.0Central 3.3 12.5 84.8 0.6 1.0 100.0 Coast 1.5 8.7 90.1 0.0 0.0 100.0 Eastern 4.6 12.9 87.7 0.0 0.0 100.0
North Eastern 3.9 3.1 96.9 0.0 0.0 100.0
Nyanza 8.4 8.1 83.0 1.8 0.3 100.0 Rift Valley 1.3 9.7 94.0 0.1 0.2 100.0 Western 5.3 5.3 89.3 1.9 2.4 100.0Total 7.9 12.0 83.8 0.6 0.5 100.0
Household Survey of Health Care Utilisation and Expenditure, 2007, Kenya
| References 67
References Central Bureau of Statistics, Kenya. 2003. .Kenya Demographic and Health Survey, 2003.
Kenya National Bureau of Statistics. 2008. Economic Survey 2008. ⎯⎯⎯. 2007a. Kenya Facts and Figures, 2007. ⎯⎯⎯. 2007b. Economic Survey, 2007.
⎯⎯⎯. 2007c. Statistical Abstract, 2007. ⎯⎯⎯. 2006. Kenya Integrated Household Budget Survey, 2006.
Ministry of Health. 2007. Kenya AIDS Indicator Survey. Preliminary report.
⎯⎯⎯. 2003. Kenya Household Expenditure and Utilisation Survey Report.
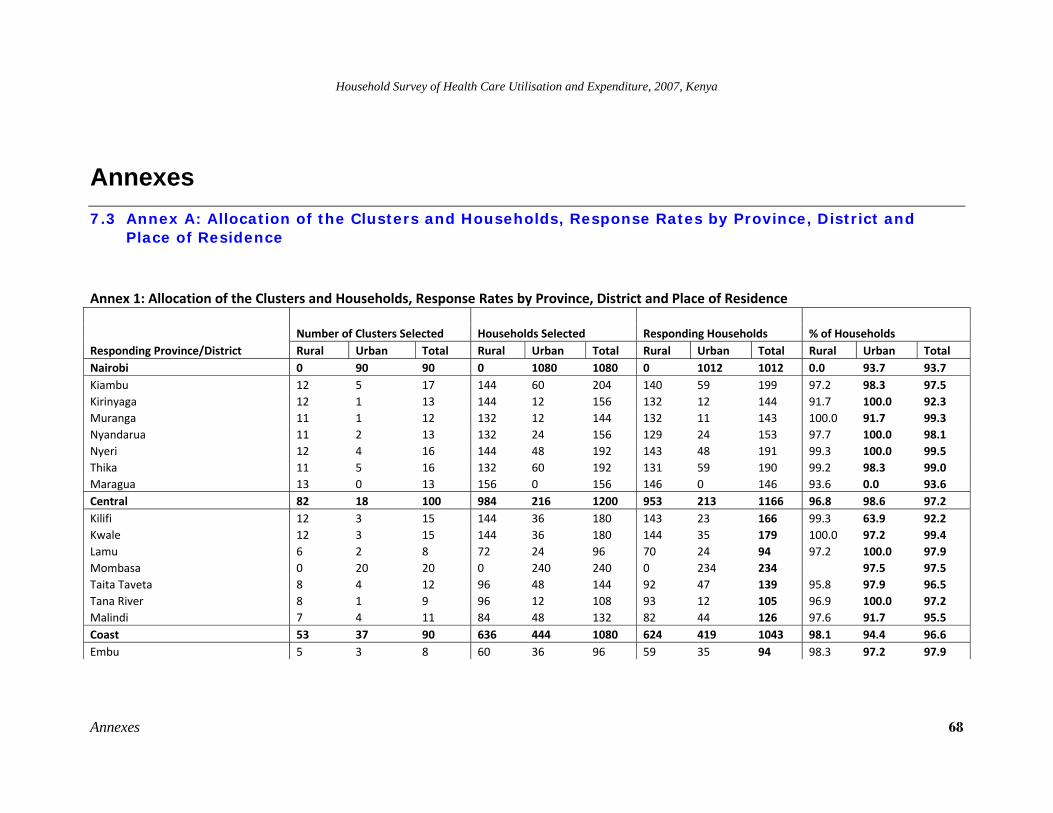
Household Survey of Health Care Utilisation and Expenditure, 2007, Kenya
Annexes 68
Annexes 7.3 Annex A: Allocation of the Clusters and Households, Response Rates by Province, District and
Place of Residence
Annex 1: Allocation of the Clusters and Households, Response Rates by Province, District and Place of Residence
Responding Province/District Number of Clusters Selected Households Selected Responding Households % of Households Rural Urban Total Rural Urban Total Rural Urban Total Rural Urban Total
Nairobi 0 90 90 0 1080 1080 0 1012 1012 0.0 93.7 93.7 Kiambu 12 5 17 144 60 204 140 59 199 97.2 98.3 97.5 Kirinyaga 12 1 13 144 12 156 132 12 144 91.7 100.0 92.3 Muranga 11 1 12 132 12 144 132 11 143 100.0 91.7 99.3 Nyandarua 11 2 13 132 24 156 129 24 153 97.7 100.0 98.1 Nyeri 12 4 16 144 48 192 143 48 191 99.3 100.0 99.5 Thika 11 5 16 132 60 192 131 59 190 99.2 98.3 99.0 Maragua 13 0 13 156 0 156 146 0 146 93.6 0.0 93.6 Central 82 18 100 984 216 1200 953 213 1166 96.8 98.6 97.2 Kilifi 12 3 15 144 36 180 143 23 166 99.3 63.9 92.2 Kwale 12 3 15 144 36 180 144 35 179 100.0 97.2 99.4 Lamu 6 2 8 72 24 96 70 24 94 97.2 100.0 97.9 Mombasa 0 20 20 0 240 240 0 234 234 97.5 97.5 Taita Taveta 8 4 12 96 48 144 92 47 139 95.8 97.9 96.5 Tana River 8 1 9 96 12 108 93 12 105 96.9 100.0 97.2 Malindi 7 4 11 84 48 132 82 44 126 97.6 91.7 95.5 Coast 53 37 90 636 444 1080 624 419 1043 98.1 94.4 96.6 Embu 5 3 8 60 36 96 59 35 94 98.3 97.2 97.9
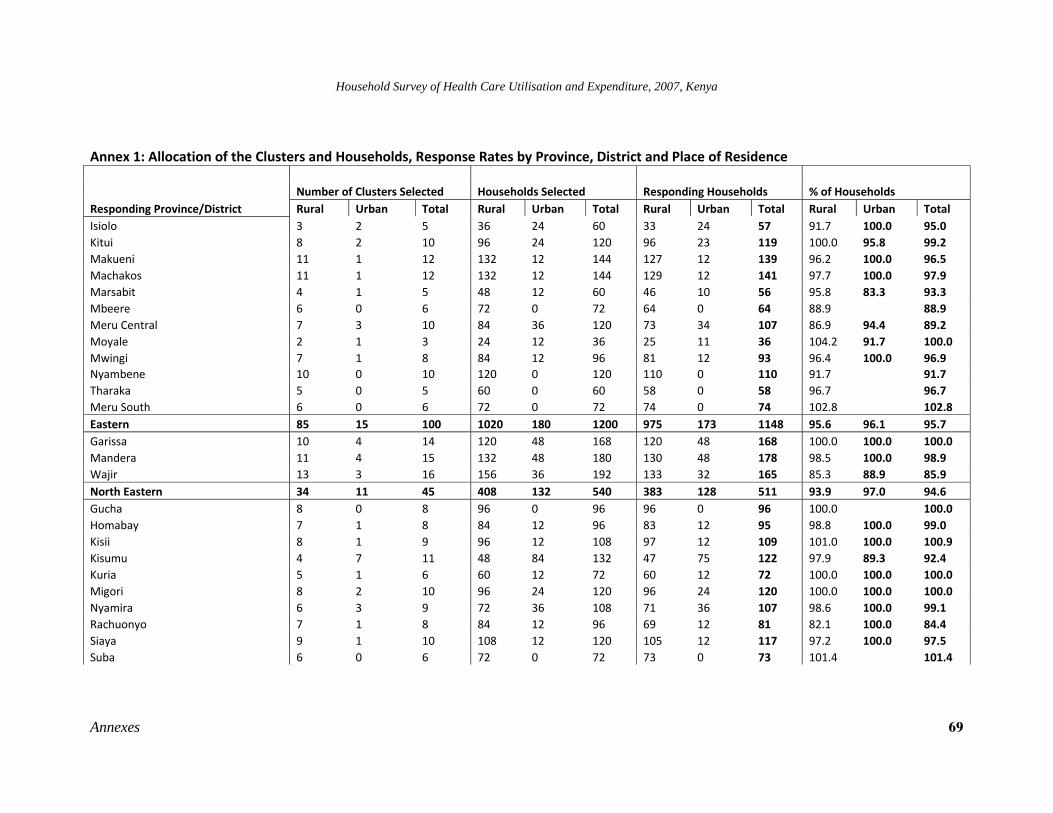
Household Survey of Health Care Utilisation and Expenditure, 2007, Kenya
Annexes 69
Annex 1: Allocation of the Clusters and Households, Response Rates by Province, District and Place of Residence
Responding Province/District Number of Clusters Selected Households Selected Responding Households % of Households Rural Urban Total Rural Urban Total Rural Urban Total Rural Urban Total
Isiolo 3 2 5 36 24 60 33 24 57 91.7 100.0 95.0 Kitui 8 2 10 96 24 120 96 23 119 100.0 95.8 99.2 Makueni 11 1 12 132 12 144 127 12 139 96.2 100.0 96.5 Machakos 11 1 12 132 12 144 129 12 141 97.7 100.0 97.9 Marsabit 4 1 5 48 12 60 46 10 56 95.8 83.3 93.3 Mbeere 6 0 6 72 0 72 64 0 64 88.9 88.9 Meru Central 7 3 10 84 36 120 73 34 107 86.9 94.4 89.2 Moyale 2 1 3 24 12 36 25 11 36 104.2 91.7 100.0 Mwingi 7 1 8 84 12 96 81 12 93 96.4 100.0 96.9 Nyambene 10 0 10 120 0 120 110 0 110 91.7 91.7 Tharaka 5 0 5 60 0 60 58 0 58 96.7 96.7 Meru South 6 0 6 72 0 72 74 0 74 102.8 102.8 Eastern 85 15 100 1020 180 1200 975 173 1148 95.6 96.1 95.7 Garissa 10 4 14 120 48 168 120 48 168 100.0 100.0 100.0 Mandera 11 4 15 132 48 180 130 48 178 98.5 100.0 98.9 Wajir 13 3 16 156 36 192 133 32 165 85.3 88.9 85.9 North Eastern 34 11 45 408 132 540 383 128 511 93.9 97.0 94.6 Gucha 8 0 8 96 0 96 96 0 96 100.0 100.0 Homabay 7 1 8 84 12 96 83 12 95 98.8 100.0 99.0 Kisii 8 1 9 96 12 108 97 12 109 101.0 100.0 100.9 Kisumu 4 7 11 48 84 132 47 75 122 97.9 89.3 92.4 Kuria 5 1 6 60 12 72 60 12 72 100.0 100.0 100.0 Migori 8 2 10 96 24 120 96 24 120 100.0 100.0 100.0 Nyamira 6 3 9 72 36 108 71 36 107 98.6 100.0 99.1 Rachuonyo 7 1 8 84 12 96 69 12 81 82.1 100.0 84.4 Siaya 9 1 10 108 12 120 105 12 117 97.2 100.0 97.5 Suba 6 0 6 72 0 72 73 0 73 101.4 101.4
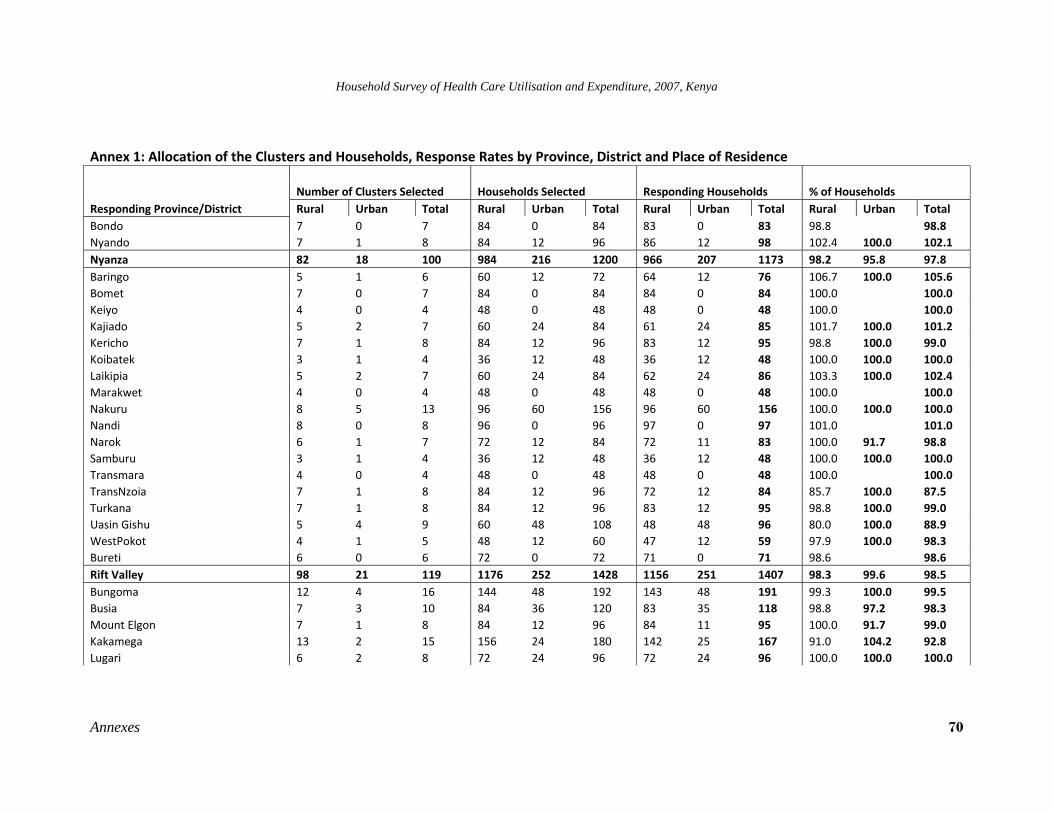
Household Survey of Health Care Utilisation and Expenditure, 2007, Kenya
Annexes 70
Annex 1: Allocation of the Clusters and Households, Response Rates by Province, District and Place of Residence
Responding Province/District Number of Clusters Selected Households Selected Responding Households % of Households Rural Urban Total Rural Urban Total Rural Urban Total Rural Urban Total
Bondo 7 0 7 84 0 84 83 0 83 98.8 98.8 Nyando 7 1 8 84 12 96 86 12 98 102.4 100.0 102.1 Nyanza 82 18 100 984 216 1200 966 207 1173 98.2 95.8 97.8 Baringo 5 1 6 60 12 72 64 12 76 106.7 100.0 105.6 Bomet 7 0 7 84 0 84 84 0 84 100.0 100.0 Keiyo 4 0 4 48 0 48 48 0 48 100.0 100.0 Kajiado 5 2 7 60 24 84 61 24 85 101.7 100.0 101.2 Kericho 7 1 8 84 12 96 83 12 95 98.8 100.0 99.0 Koibatek 3 1 4 36 12 48 36 12 48 100.0 100.0 100.0 Laikipia 5 2 7 60 24 84 62 24 86 103.3 100.0 102.4 Marakwet 4 0 4 48 0 48 48 0 48 100.0 100.0 Nakuru 8 5 13 96 60 156 96 60 156 100.0 100.0 100.0 Nandi 8 0 8 96 0 96 97 0 97 101.0 101.0 Narok 6 1 7 72 12 84 72 11 83 100.0 91.7 98.8 Samburu 3 1 4 36 12 48 36 12 48 100.0 100.0 100.0 Transmara 4 0 4 48 0 48 48 0 48 100.0 100.0 TransNzoia 7 1 8 84 12 96 72 12 84 85.7 100.0 87.5 Turkana 7 1 8 84 12 96 83 12 95 98.8 100.0 99.0 Uasin Gishu 5 4 9 60 48 108 48 48 96 80.0 100.0 88.9 WestPokot 4 1 5 48 12 60 47 12 59 97.9 100.0 98.3 Bureti 6 0 6 72 0 72 71 0 71 98.6 98.6 Rift Valley 98 21 119 1176 252 1428 1156 251 1407 98.3 99.6 98.5 Bungoma 12 4 16 144 48 192 143 48 191 99.3 100.0 99.5 Busia 7 3 10 84 36 120 83 35 118 98.8 97.2 98.3 Mount Elgon 7 1 8 84 12 96 84 11 95 100.0 91.7 99.0 Kakamega 13 2 15 156 24 180 142 25 167 91.0 104.2 92.8 Lugari 6 2 8 72 24 96 72 24 96 100.0 100.0 100.0
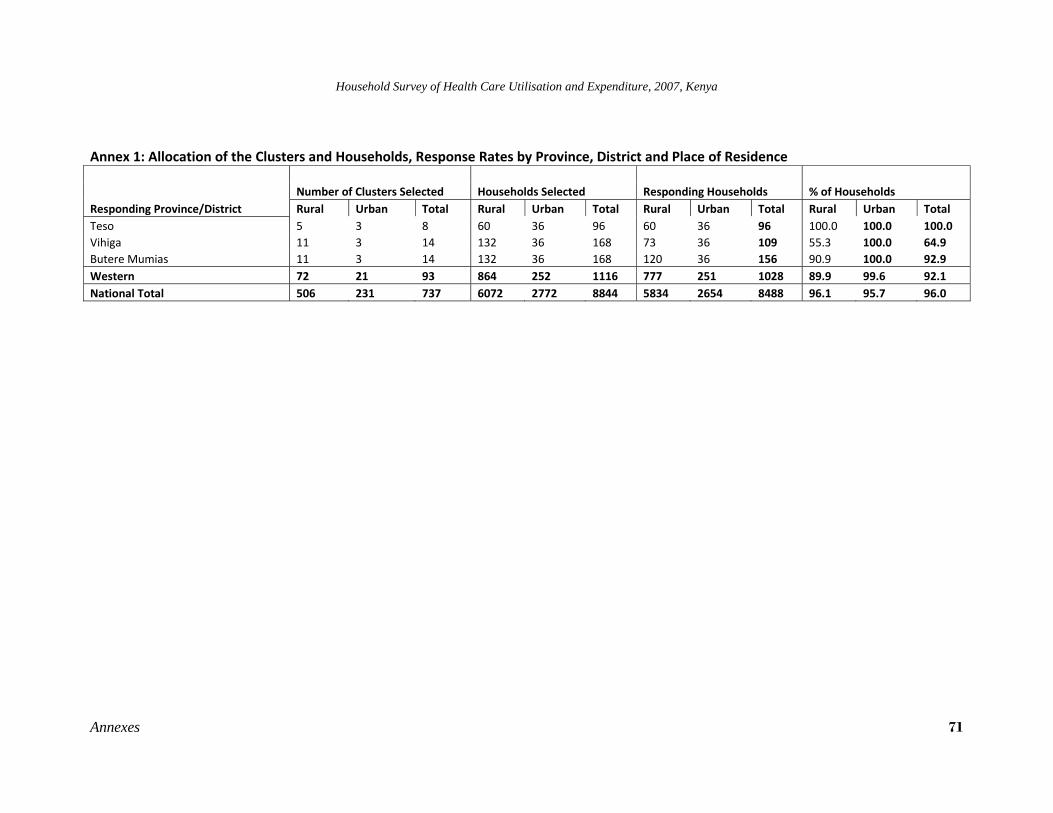
Household Survey of Health Care Utilisation and Expenditure, 2007, Kenya
Annexes 71
Annex 1: Allocation of the Clusters and Households, Response Rates by Province, District and Place of Residence
Responding Province/District Number of Clusters Selected Households Selected Responding Households % of Households Rural Urban Total Rural Urban Total Rural Urban Total Rural Urban Total
Teso 5 3 8 60 36 96 60 36 96 100.0 100.0 100.0 Vihiga 11 3 14 132 36 168 73 36 109 55.3 100.0 64.9 Butere Mumias 11 3 14 132 36 168 120 36 156 90.9 100.0 92.9 Western 72 21 93 864 252 1116 777 251 1028 89.9 99.6 92.1 National Total 506 231 737 6072 2772 8844 5834 2654 8488 96.1 95.7 96.0
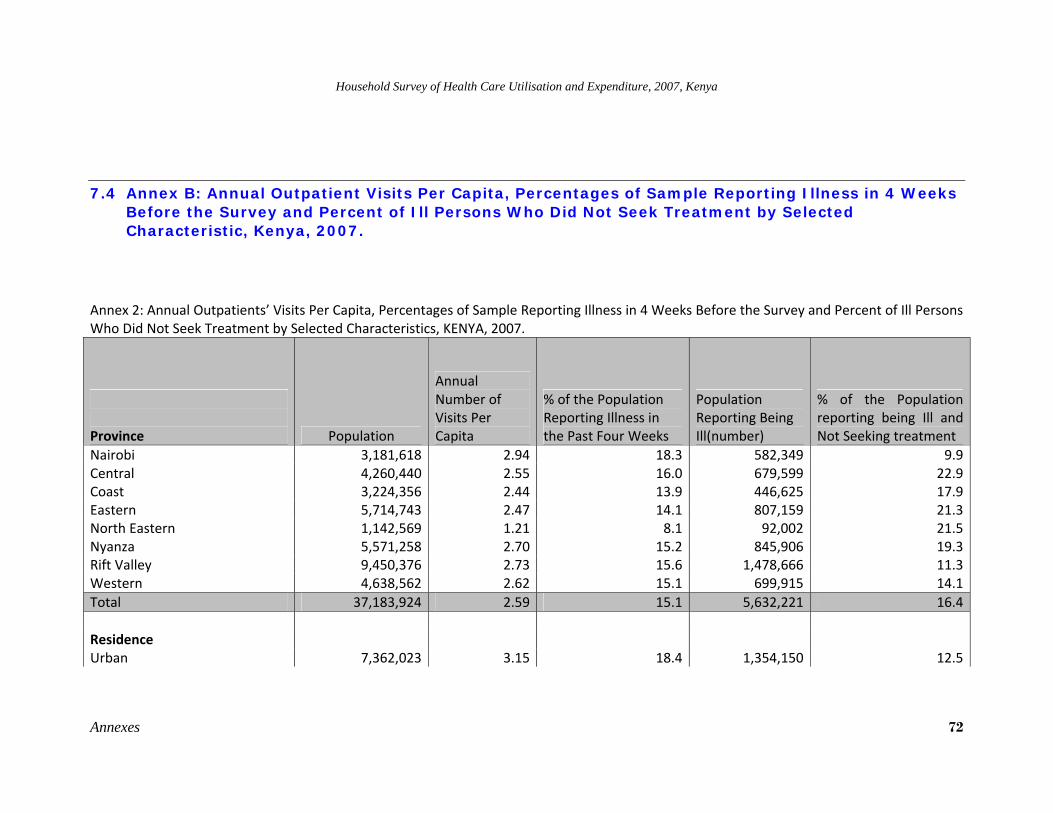
Household Survey of Health Care Utilisation and Expenditure, 2007, Kenya
Annexes 72
7.4 Annex B: Annual Outpatient Visits Per Capita, Percentages of Sample Reporting Illness in 4 Weeks Before the Survey and Percent of Ill Persons Who Did Not Seek Treatment by Selected Characteristic, Kenya, 2007.
Annex 2: Annual Outpatients’ Visits Per Capita, Percentages of Sample Reporting Illness in 4 Weeks Before the Survey and Percent of Ill Persons Who Did Not Seek Treatment by Selected Characteristics, KENYA, 2007.
Province Population
Annual Number of Visits Per Capita
% of the Population Reporting Illness in the Past Four Weeks
Population Reporting Being Ill(number)
% of the Population reporting being Ill and Not Seeking treatment
Nairobi 3,181,618 2.94 18.3 582,349 9.9Central 4,260,440 2.55 16.0 679,599 22.9Coast 3,224,356 2.44 13.9 446,625 17.9Eastern 5,714,743 2.47 14.1 807,159 21.3North Eastern 1,142,569 1.21 8.1 92,002 21.5Nyanza 5,571,258 2.70 15.2 845,906 19.3Rift Valley 9,450,376 2.73 15.6 1,478,666 11.3Western 4,638,562 2.62 15.1 699,915 14.1Total 37,183,924 2.59 15.1 5,632,221 16.4 Residence Urban 7,362,023 3.15 18.4 1,354,150 12.5
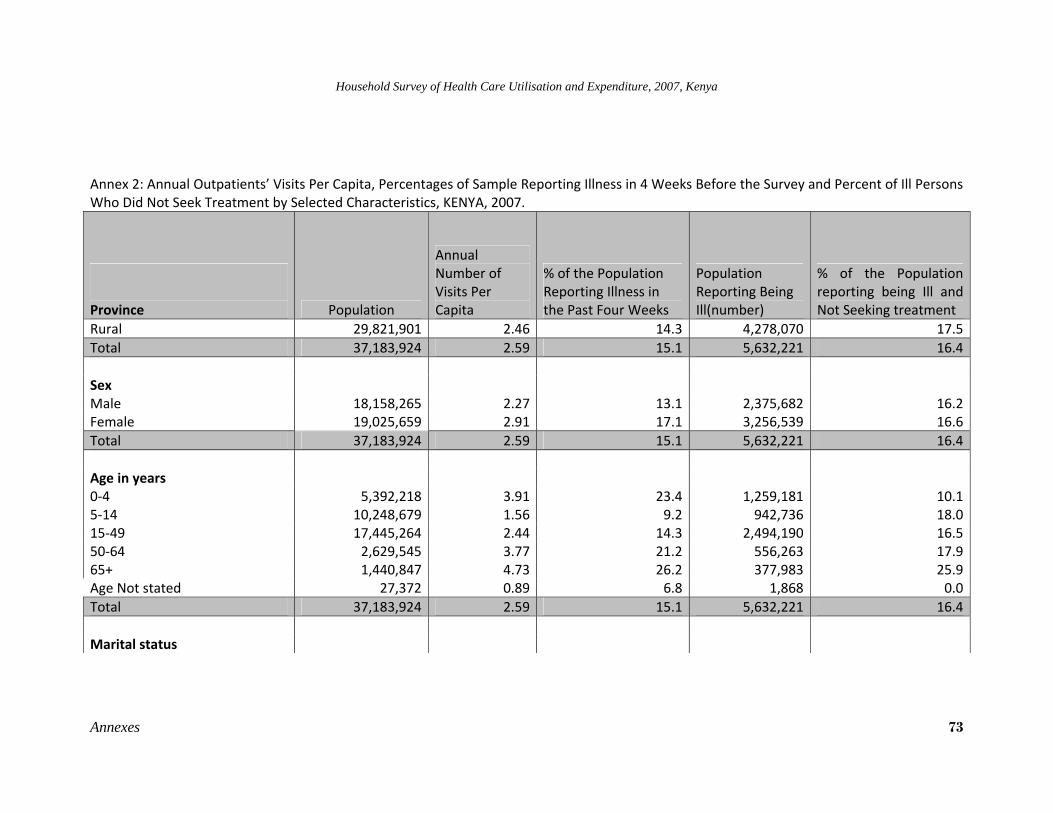
Household Survey of Health Care Utilisation and Expenditure, 2007, Kenya
Annexes 73
Annex 2: Annual Outpatients’ Visits Per Capita, Percentages of Sample Reporting Illness in 4 Weeks Before the Survey and Percent of Ill Persons Who Did Not Seek Treatment by Selected Characteristics, KENYA, 2007.
Province Population
Annual Number of Visits Per Capita
% of the Population Reporting Illness in the Past Four Weeks
Population Reporting Being Ill(number)
% of the Population reporting being Ill and Not Seeking treatment
Rural 29,821,901 2.46 14.3 4,278,070 17.5Total 37,183,924 2.59 15.1 5,632,221 16.4 Sex Male 18,158,265 2.27 13.1 2,375,682 16.2Female 19,025,659 2.91 17.1 3,256,539 16.6Total 37,183,924 2.59 15.1 5,632,221 16.4 Age in years 0‐4 5,392,218 3.91 23.4 1,259,181 10.15‐14 10,248,679 1.56 9.2 942,736 18.015‐49 17,445,264 2.44 14.3 2,494,190 16.550‐64 2,629,545 3.77 21.2 556,263 17.965+ 1,440,847 4.73 26.2 377,983 25.9Age Not stated 27,372 0.89 6.8 1,868 0.0Total 37,183,924 2.59 15.1 5,632,221 16.4 Marital status
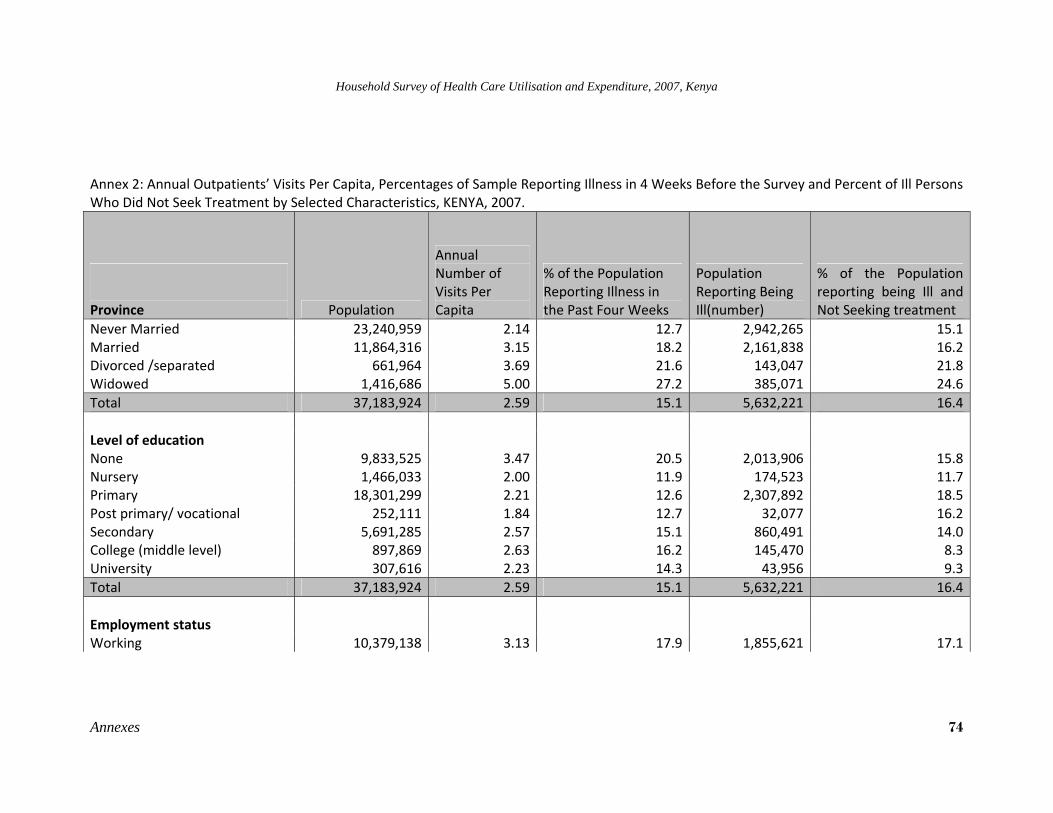
Household Survey of Health Care Utilisation and Expenditure, 2007, Kenya
Annexes 74
Annex 2: Annual Outpatients’ Visits Per Capita, Percentages of Sample Reporting Illness in 4 Weeks Before the Survey and Percent of Ill Persons Who Did Not Seek Treatment by Selected Characteristics, KENYA, 2007.
Province Population
Annual Number of Visits Per Capita
% of the Population Reporting Illness in the Past Four Weeks
Population Reporting Being Ill(number)
% of the Population reporting being Ill and Not Seeking treatment
Never Married 23,240,959 2.14 12.7 2,942,265 15.1Married 11,864,316 3.15 18.2 2,161,838 16.2Divorced /separated 661,964 3.69 21.6 143,047 21.8Widowed 1,416,686 5.00 27.2 385,071 24.6Total 37,183,924 2.59 15.1 5,632,221 16.4 Level of education None 9,833,525 3.47 20.5 2,013,906 15.8Nursery 1,466,033 2.00 11.9 174,523 11.7Primary 18,301,299 2.21 12.6 2,307,892 18.5Post primary/ vocational 252,111 1.84 12.7 32,077 16.2Secondary 5,691,285 2.57 15.1 860,491 14.0College (middle level) 897,869 2.63 16.2 145,470 8.3University 307,616 2.23 14.3 43,956 9.3Total 37,183,924 2.59 15.1 5,632,221 16.4 Employment status Working 10,379,138 3.13 17.9 1,855,621 17.1

Household Survey of Health Care Utilisation and Expenditure, 2007, Kenya
Annexes 75
Annex 2: Annual Outpatients’ Visits Per Capita, Percentages of Sample Reporting Illness in 4 Weeks Before the Survey and Percent of Ill Persons Who Did Not Seek Treatment by Selected Characteristics, KENYA, 2007.
Province Population
Annual Number of Visits Per Capita
% of the Population Reporting Illness in the Past Four Weeks
Population Reporting Being Ill(number)
% of the Population reporting being Ill and Not Seeking treatment
Seeking work 1,752,332 1.73 10.2 178,700 21.9Homemakers 4,002,305 3.35 19.7 786,464 17.2
Students 12,024,291 1.42 8.5 1,017,246 17.9
Other 1,677,783 3.15 18.5 310,309 20.7Under age 6,874,730 3.50 20.5 1,412,230 11.1Not Stated 473,346 2.40 15.1 71,650 28.1Total 37,183,924 2.59 15.1 5,632,221 16.4 Rating of own health Very good 9,669,665 2.15 13.0 1,259,123 13.7Good 21,865,873 2.30 13.7 3,005,178 16.7Satisfactory 3,727,996 3.81 20.8 773,898 17.5Poor 1,209,621 7.70 40.5 490,086 19.1Not Stated 648,782 2.69 14.7 95,439 14.0Total 37,183,924 2.59 15.1 5,632,221 16.4
Presence of chronic condition
Not present 34,530,376 2.27 13.4 4,638,777 15.9
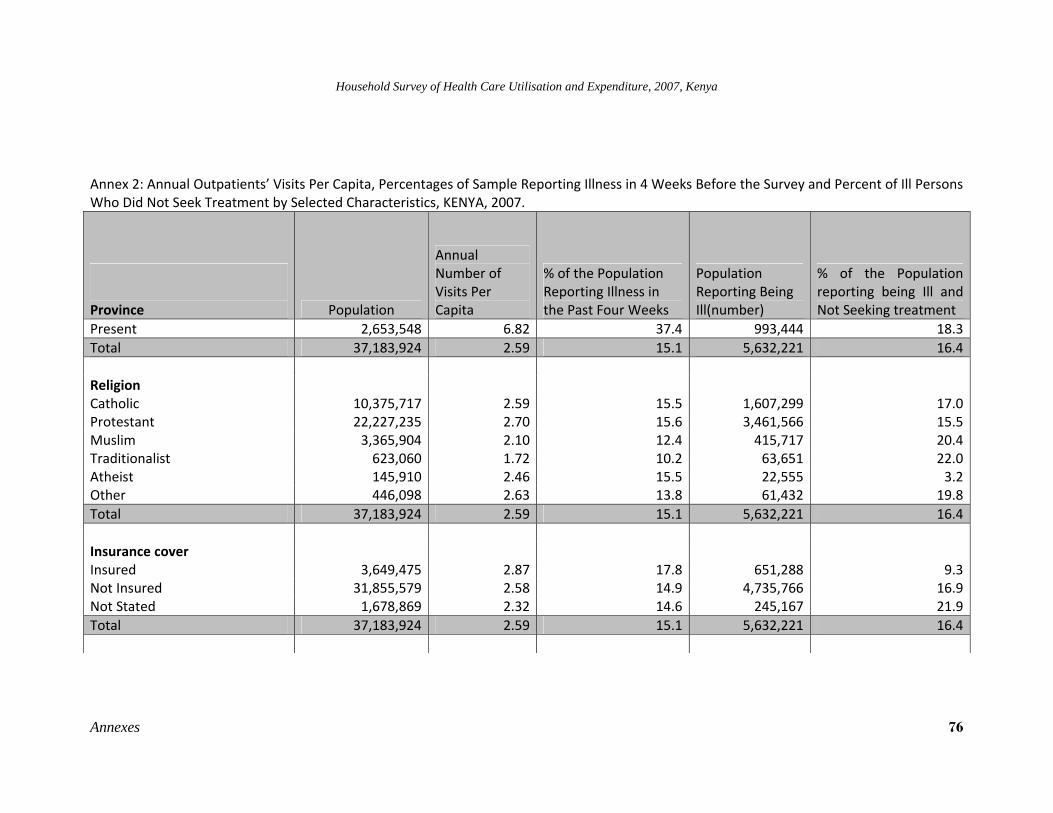
Household Survey of Health Care Utilisation and Expenditure, 2007, Kenya
Annexes 76
Annex 2: Annual Outpatients’ Visits Per Capita, Percentages of Sample Reporting Illness in 4 Weeks Before the Survey and Percent of Ill Persons Who Did Not Seek Treatment by Selected Characteristics, KENYA, 2007.
Province Population
Annual Number of Visits Per Capita
% of the Population Reporting Illness in the Past Four Weeks
Population Reporting Being Ill(number)
% of the Population reporting being Ill and Not Seeking treatment
Present 2,653,548 6.82 37.4 993,444 18.3Total 37,183,924 2.59 15.1 5,632,221 16.4 Religion Catholic 10,375,717 2.59 15.5 1,607,299 17.0Protestant 22,227,235 2.70 15.6 3,461,566 15.5Muslim 3,365,904 2.10 12.4 415,717 20.4Traditionalist 623,060 1.72 10.2 63,651 22.0Atheist 145,910 2.46 15.5 22,555 3.2Other 446,098 2.63 13.8 61,432 19.8Total 37,183,924 2.59 15.1 5,632,221 16.4 Insurance cover Insured 3,649,475 2.87 17.8 651,288 9.3Not Insured 31,855,579 2.58 14.9 4,735,766 16.9Not Stated 1,678,869 2.32 14.6 245,167 21.9Total 37,183,924 2.59 15.1 5,632,221 16.4
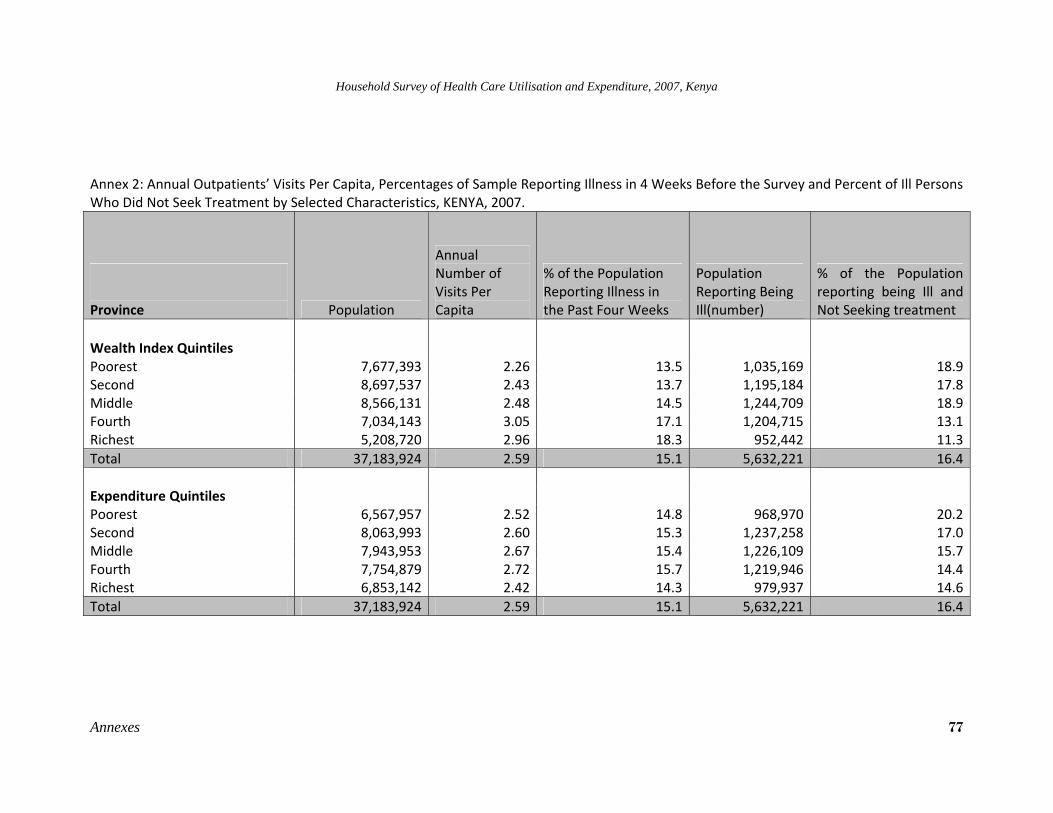
Household Survey of Health Care Utilisation and Expenditure, 2007, Kenya
Annexes 77
Annex 2: Annual Outpatients’ Visits Per Capita, Percentages of Sample Reporting Illness in 4 Weeks Before the Survey and Percent of Ill Persons Who Did Not Seek Treatment by Selected Characteristics, KENYA, 2007.
Province Population
Annual Number of Visits Per Capita
% of the Population Reporting Illness in the Past Four Weeks
Population Reporting Being Ill(number)
% of the Population reporting being Ill and Not Seeking treatment
Wealth Index Quintiles
Poorest 7,677,393 2.26 13.5 1,035,169 18.9Second 8,697,537 2.43 13.7 1,195,184 17.8Middle 8,566,131 2.48 14.5 1,244,709 18.9Fourth 7,034,143 3.05 17.1 1,204,715 13.1Richest 5,208,720 2.96 18.3 952,442 11.3Total 37,183,924 2.59 15.1 5,632,221 16.4 Expenditure Quintiles Poorest 6,567,957 2.52 14.8 968,970 20.2Second 8,063,993 2.60 15.3 1,237,258 17.0Middle 7,943,953 2.67 15.4 1,226,109 15.7Fourth 7,754,879 2.72 15.7 1,219,946 14.4Richest 6,853,142 2.42 14.3 979,937 14.6Total 37,183,924 2.59 15.1 5,632,221 16.4
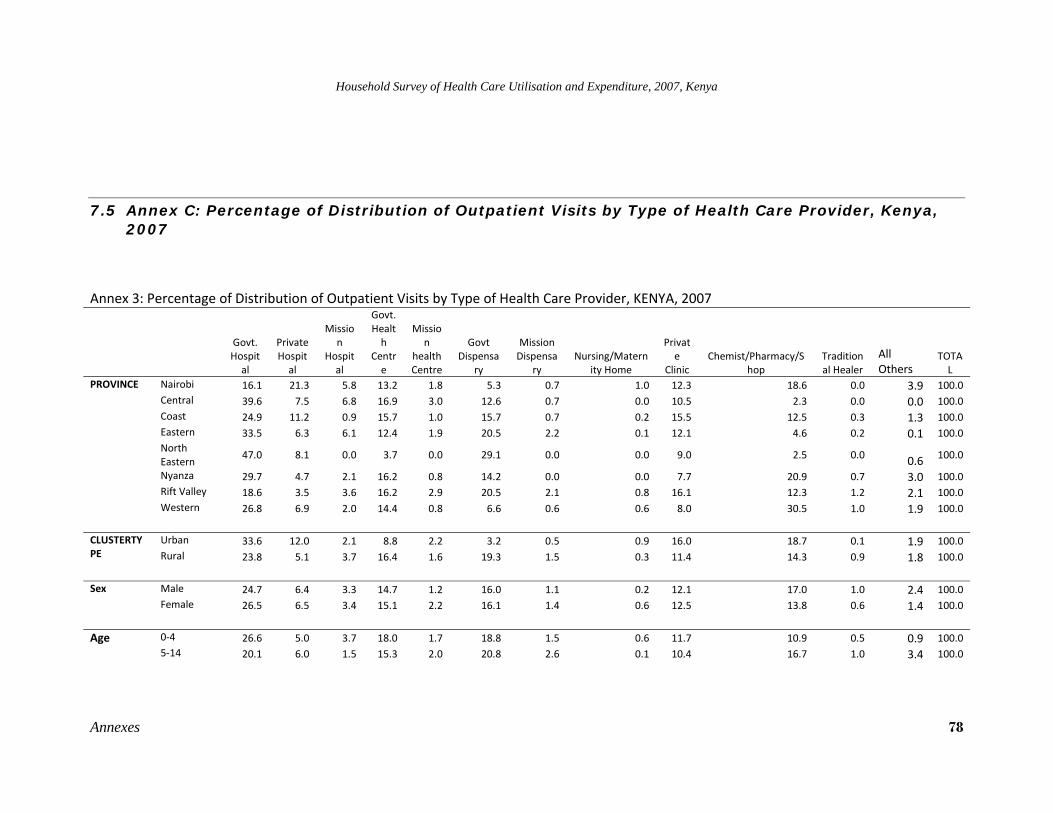
Household Survey of Health Care Utilisation and Expenditure, 2007, Kenya
Annexes 78
7.5 Annex C: Percentage of Distribution of Outpatient Visits by Type of Health Care Provider, Kenya, 2007
Annex 3: Percentage of Distribution of Outpatient Visits by Type of Health Care Provider, KENYA, 2007
Govt. Hospital
Private Hospital
Mission
Hospital
Govt. Health
Centre
Mission
health Centre
Govt Dispensa
ry
Mission Dispensa
ry Nursing/Matern
ity Home
Private
Clinic Chemist/Pharmacy/S
hop Traditional Healer
All Others
TOTAL
PROVINCE Nairobi 16.1 21.3 5.8 13.2 1.8 5.3 0.7 1.0 12.3 18.6 0.0 3.9 100.0 Central 39.6 7.5 6.8 16.9 3.0 12.6 0.7 0.0 10.5 2.3 0.0 0.0 100.0 Coast 24.9 11.2 0.9 15.7 1.0 15.7 0.7 0.2 15.5 12.5 0.3 1.3 100.0 Eastern 33.5 6.3 6.1 12.4 1.9 20.5 2.2 0.1 12.1 4.6 0.2 0.1 100.0 North Eastern
47.0 8.1 0.0 3.7 0.0 29.1 0.0 0.0 9.0 2.5 0.0 0.6 100.0
Nyanza 29.7 4.7 2.1 16.2 0.8 14.2 0.0 0.0 7.7 20.9 0.7 3.0 100.0 Rift Valley 18.6 3.5 3.6 16.2 2.9 20.5 2.1 0.8 16.1 12.3 1.2 2.1 100.0 Western 26.8 6.9 2.0 14.4 0.8 6.6 0.6 0.6 8.0 30.5 1.0 1.9 100.0
CLUSTERTYPE
Urban 33.6 12.0 2.1 8.8 2.2 3.2 0.5 0.9 16.0 18.7 0.1 1.9 100.0 Rural 23.8 5.1 3.7 16.4 1.6 19.3 1.5 0.3 11.4 14.3 0.9 1.8 100.0
Sex Male 24.7 6.4 3.3 14.7 1.2 16.0 1.1 0.2 12.1 17.0 1.0 2.4 100.0
Female 26.5 6.5 3.4 15.1 2.2 16.1 1.4 0.6 12.5 13.8 0.6 1.4 100.0
Age 0‐4 26.6 5.0 3.7 18.0 1.7 18.8 1.5 0.6 11.7 10.9 0.5 0.9 100.0 5‐14 20.1 6.0 1.5 15.3 2.0 20.8 2.6 0.1 10.4 16.7 1.0 3.4 100.0
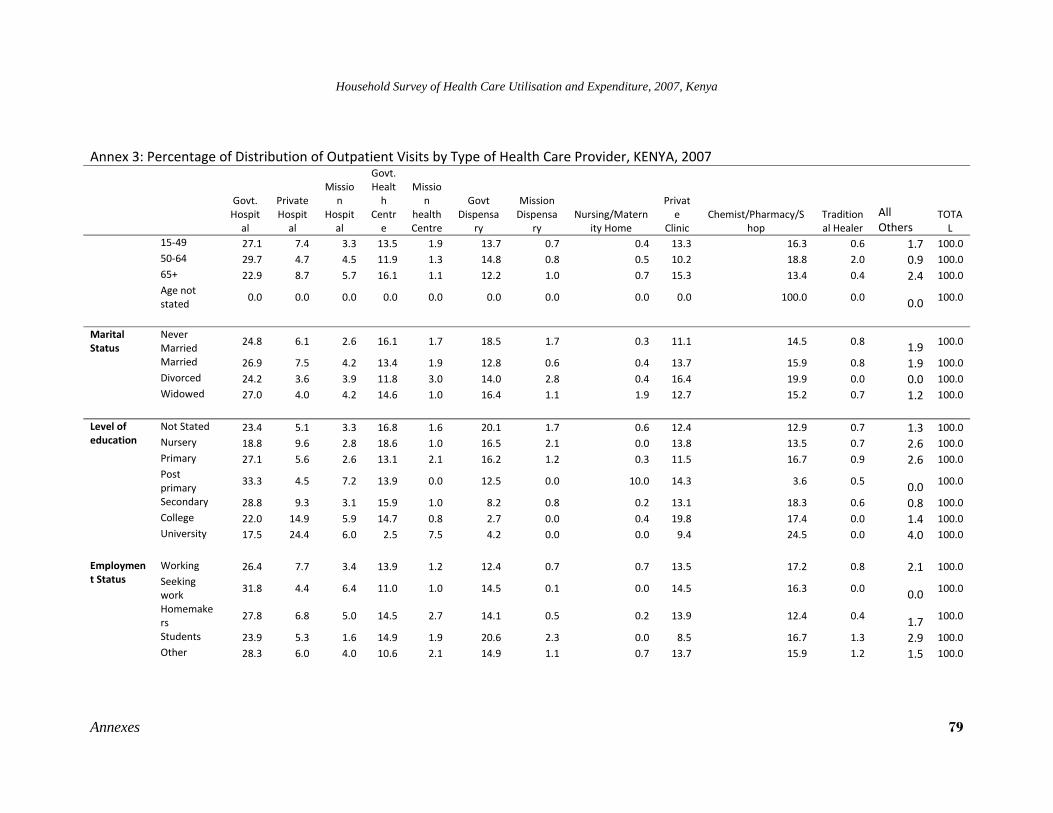
Household Survey of Health Care Utilisation and Expenditure, 2007, Kenya
Annexes 79
Annex 3: Percentage of Distribution of Outpatient Visits by Type of Health Care Provider, KENYA, 2007
Govt. Hospital
Private Hospital
Mission
Hospital
Govt. Health
Centre
Mission
health Centre
Govt Dispensa
ry
Mission Dispensa
ry Nursing/Matern
ity Home
Private
Clinic Chemist/Pharmacy/S
hop Traditional Healer
All Others
TOTAL
15‐49 27.1 7.4 3.3 13.5 1.9 13.7 0.7 0.4 13.3 16.3 0.6 1.7 100.0 50‐64 29.7 4.7 4.5 11.9 1.3 14.8 0.8 0.5 10.2 18.8 2.0 0.9 100.0 65+ 22.9 8.7 5.7 16.1 1.1 12.2 1.0 0.7 15.3 13.4 0.4 2.4 100.0 Age not stated
0.0 0.0 0.0 0.0 0.0 0.0 0.0 0.0 0.0 100.0 0.0 0.0 100.0
Marital Status
Never Married
24.8 6.1 2.6 16.1 1.7 18.5 1.7 0.3 11.1 14.5 0.8 1.9 100.0
Married 26.9 7.5 4.2 13.4 1.9 12.8 0.6 0.4 13.7 15.9 0.8 1.9 100.0 Divorced 24.2 3.6 3.9 11.8 3.0 14.0 2.8 0.4 16.4 19.9 0.0 0.0 100.0 Widowed 27.0 4.0 4.2 14.6 1.0 16.4 1.1 1.9 12.7 15.2 0.7 1.2 100.0
Level of education
Not Stated 23.4 5.1 3.3 16.8 1.6 20.1 1.7 0.6 12.4 12.9 0.7 1.3 100.0 Nursery 18.8 9.6 2.8 18.6 1.0 16.5 2.1 0.0 13.8 13.5 0.7 2.6 100.0 Primary 27.1 5.6 2.6 13.1 2.1 16.2 1.2 0.3 11.5 16.7 0.9 2.6 100.0 Post primary
33.3 4.5 7.2 13.9 0.0 12.5 0.0 10.0 14.3 3.6 0.5 0.0 100.0
Secondary 28.8 9.3 3.1 15.9 1.0 8.2 0.8 0.2 13.1 18.3 0.6 0.8 100.0 College 22.0 14.9 5.9 14.7 0.8 2.7 0.0 0.4 19.8 17.4 0.0 1.4 100.0 University 17.5 24.4 6.0 2.5 7.5 4.2 0.0 0.0 9.4 24.5 0.0 4.0 100.0
Employment Status
Working 26.4 7.7 3.4 13.9 1.2 12.4 0.7 0.7 13.5 17.2 0.8 2.1 100.0 Seeking work
31.8 4.4 6.4 11.0 1.0 14.5 0.1 0.0 14.5 16.3 0.0 0.0 100.0
Homemakers
27.8 6.8 5.0 14.5 2.7 14.1 0.5 0.2 13.9 12.4 0.4 1.7 100.0
Students 23.9 5.3 1.6 14.9 1.9 20.6 2.3 0.0 8.5 16.7 1.3 2.9 100.0 Other 28.3 6.0 4.0 10.6 2.1 14.9 1.1 0.7 13.7 15.9 1.2 1.5 100.0
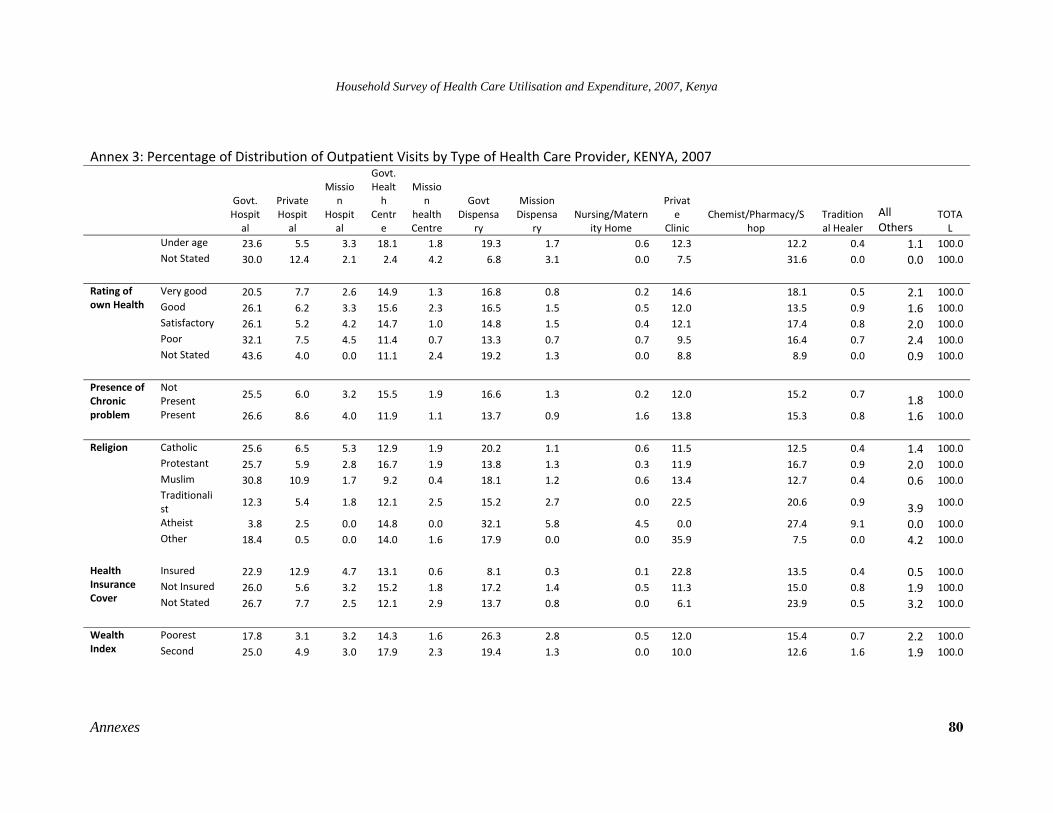
Household Survey of Health Care Utilisation and Expenditure, 2007, Kenya
Annexes 80
Annex 3: Percentage of Distribution of Outpatient Visits by Type of Health Care Provider, KENYA, 2007
Govt. Hospital
Private Hospital
Mission
Hospital
Govt. Health
Centre
Mission
health Centre
Govt Dispensa
ry
Mission Dispensa
ry Nursing/Matern
ity Home
Private
Clinic Chemist/Pharmacy/S
hop Traditional Healer
All Others
TOTAL
Under age 23.6 5.5 3.3 18.1 1.8 19.3 1.7 0.6 12.3 12.2 0.4 1.1 100.0 Not Stated 30.0 12.4 2.1 2.4 4.2 6.8 3.1 0.0 7.5 31.6 0.0 0.0 100.0
Rating of own Health
Very good 20.5 7.7 2.6 14.9 1.3 16.8 0.8 0.2 14.6 18.1 0.5 2.1 100.0 Good 26.1 6.2 3.3 15.6 2.3 16.5 1.5 0.5 12.0 13.5 0.9 1.6 100.0 Satisfactory 26.1 5.2 4.2 14.7 1.0 14.8 1.5 0.4 12.1 17.4 0.8 2.0 100.0 Poor 32.1 7.5 4.5 11.4 0.7 13.3 0.7 0.7 9.5 16.4 0.7 2.4 100.0 Not Stated 43.6 4.0 0.0 11.1 2.4 19.2 1.3 0.0 8.8 8.9 0.0 0.9 100.0
Presence of Chronic problem
Not Present
25.5 6.0 3.2 15.5 1.9 16.6 1.3 0.2 12.0 15.2 0.7 1.8 100.0
Present 26.6 8.6 4.0 11.9 1.1 13.7 0.9 1.6 13.8 15.3 0.8 1.6 100.0 Religion Catholic 25.6 6.5 5.3 12.9 1.9 20.2 1.1 0.6 11.5 12.5 0.4 1.4 100.0
Protestant 25.7 5.9 2.8 16.7 1.9 13.8 1.3 0.3 11.9 16.7 0.9 2.0 100.0 Muslim 30.8 10.9 1.7 9.2 0.4 18.1 1.2 0.6 13.4 12.7 0.4 0.6 100.0 Traditionalist
12.3 5.4 1.8 12.1 2.5 15.2 2.7 0.0 22.5 20.6 0.9 3.9 100.0
Atheist 3.8 2.5 0.0 14.8 0.0 32.1 5.8 4.5 0.0 27.4 9.1 0.0 100.0 Other 18.4 0.5 0.0 14.0 1.6 17.9 0.0 0.0 35.9 7.5 0.0 4.2 100.0
Health Insurance Cover
Insured 22.9 12.9 4.7 13.1 0.6 8.1 0.3 0.1 22.8 13.5 0.4 0.5 100.0 Not Insured 26.0 5.6 3.2 15.2 1.8 17.2 1.4 0.5 11.3 15.0 0.8 1.9 100.0 Not Stated 26.7 7.7 2.5 12.1 2.9 13.7 0.8 0.0 6.1 23.9 0.5 3.2 100.0
Wealth Index
Poorest 17.8 3.1 3.2 14.3 1.6 26.3 2.8 0.5 12.0 15.4 0.7 2.2 100.0 Second 25.0 4.9 3.0 17.9 2.3 19.4 1.3 0.0 10.0 12.6 1.6 1.9 100.0
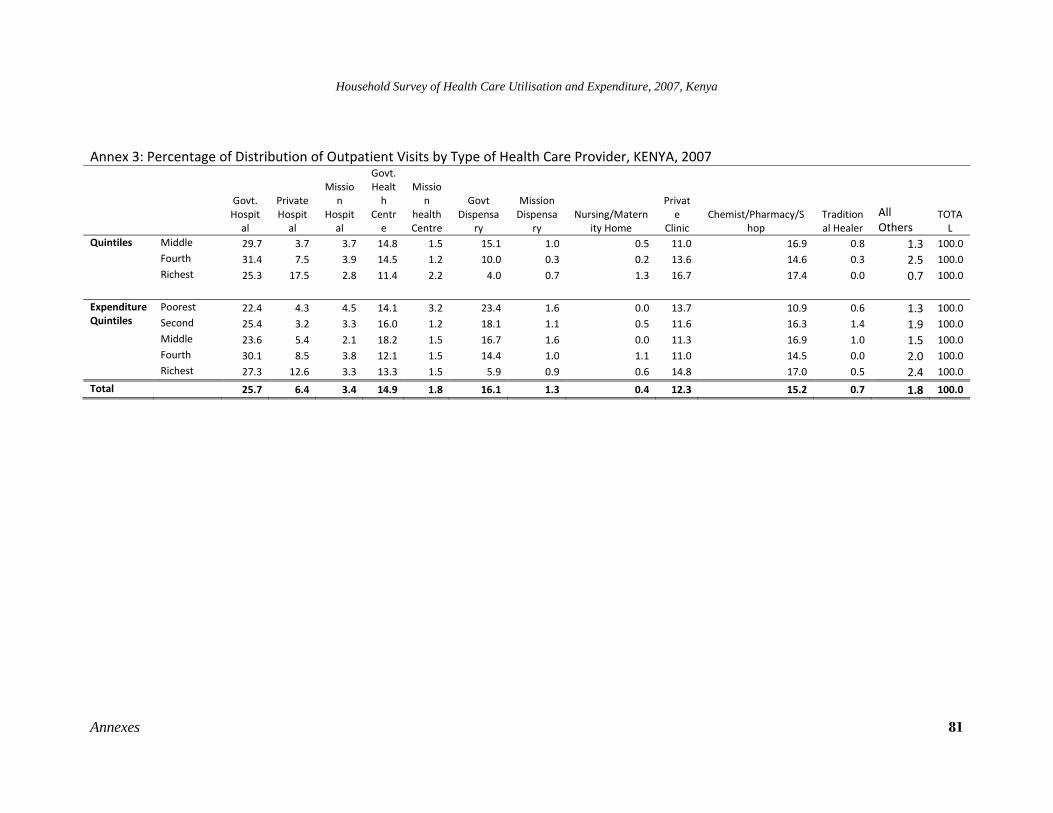
Household Survey of Health Care Utilisation and Expenditure, 2007, Kenya
Annexes 81
Annex 3: Percentage of Distribution of Outpatient Visits by Type of Health Care Provider, KENYA, 2007
Govt. Hospital
Private Hospital
Mission
Hospital
Govt. Health
Centre
Mission
health Centre
Govt Dispensa
ry
Mission Dispensa
ry Nursing/Matern
ity Home
Private
Clinic Chemist/Pharmacy/S
hop Traditional Healer
All Others
TOTAL
Quintiles Middle 29.7 3.7 3.7 14.8 1.5 15.1 1.0 0.5 11.0 16.9 0.8 1.3 100.0 Fourth 31.4 7.5 3.9 14.5 1.2 10.0 0.3 0.2 13.6 14.6 0.3 2.5 100.0 Richest 25.3 17.5 2.8 11.4 2.2 4.0 0.7 1.3 16.7 17.4 0.0 0.7 100.0
Expenditure Quintiles
Poorest 22.4 4.3 4.5 14.1 3.2 23.4 1.6 0.0 13.7 10.9 0.6 1.3 100.0 Second 25.4 3.2 3.3 16.0 1.2 18.1 1.1 0.5 11.6 16.3 1.4 1.9 100.0 Middle 23.6 5.4 2.1 18.2 1.5 16.7 1.6 0.0 11.3 16.9 1.0 1.5 100.0 Fourth 30.1 8.5 3.8 12.1 1.5 14.4 1.0 1.1 11.0 14.5 0.0 2.0 100.0 Richest 27.3 12.6 3.3 13.3 1.5 5.9 0.9 0.6 14.8 17.0 0.5 2.4 100.0
Total 25.7 6.4 3.4 14.9 1.8 16.1 1.3 0.4 12.3 15.2 0.7 1.8 100.0
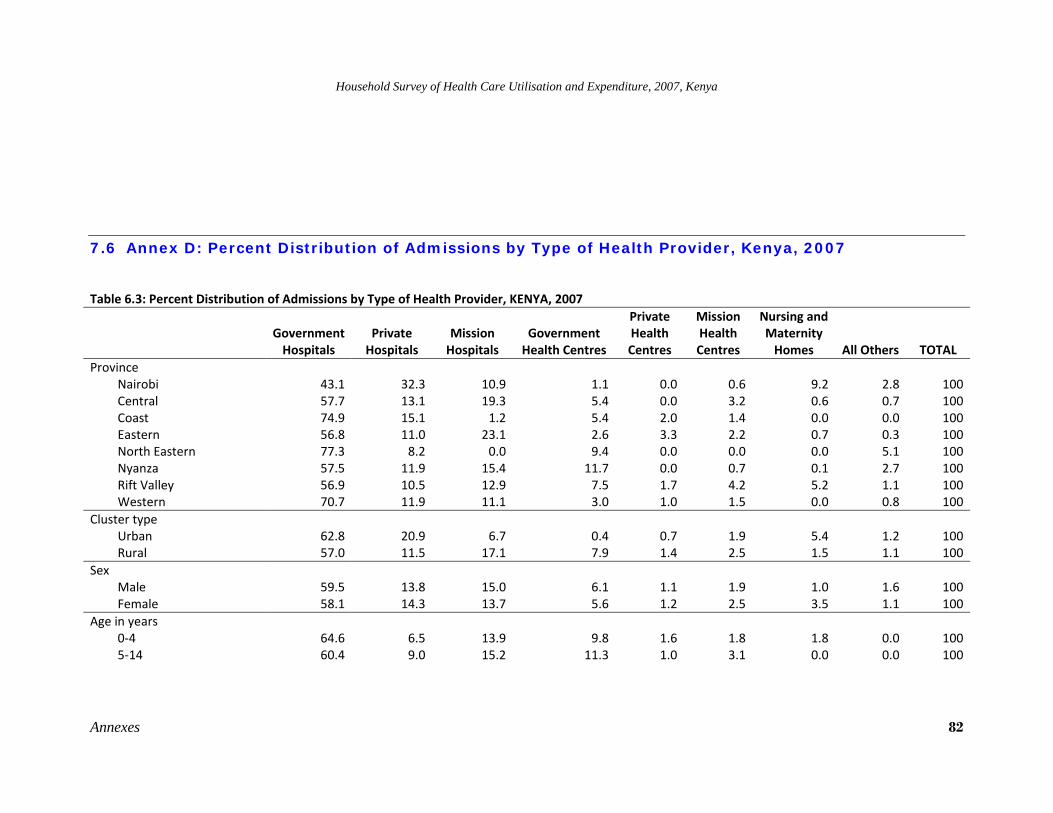
Household Survey of Health Care Utilisation and Expenditure, 2007, Kenya
Annexes 82
7.6 Annex D: Percent Distribution of Admissions by Type of Health Provider, Kenya, 2007
Table 6.3: Percent Distribution of Admissions by Type of Health Provider, KENYA, 2007
Government Hospitals
Private Hospitals
Mission Hospitals
Government Health Centres
Private Health Centres
Mission Health Centres
Nursing and Maternity Homes All Others TOTAL
Province Nairobi 43.1 32.3 10.9 1.1 0.0 0.6 9.2 2.8 100Central 57.7 13.1 19.3 5.4 0.0 3.2 0.6 0.7 100Coast 74.9 15.1 1.2 5.4 2.0 1.4 0.0 0.0 100Eastern 56.8 11.0 23.1 2.6 3.3 2.2 0.7 0.3 100North Eastern 77.3 8.2 0.0 9.4 0.0 0.0 0.0 5.1 100Nyanza 57.5 11.9 15.4 11.7 0.0 0.7 0.1 2.7 100Rift Valley 56.9 10.5 12.9 7.5 1.7 4.2 5.2 1.1 100Western 70.7 11.9 11.1 3.0 1.0 1.5 0.0 0.8 100
Cluster type Urban 62.8 20.9 6.7 0.4 0.7 1.9 5.4 1.2 100Rural 57.0 11.5 17.1 7.9 1.4 2.5 1.5 1.1 100
Sex Male 59.5 13.8 15.0 6.1 1.1 1.9 1.0 1.6 100Female 58.1 14.3 13.7 5.6 1.2 2.5 3.5 1.1 100
Age in years 0‐4 64.6 6.5 13.9 9.8 1.6 1.8 1.8 0.0 1005‐14 60.4 9.0 15.2 11.3 1.0 3.1 0.0 0.0 100
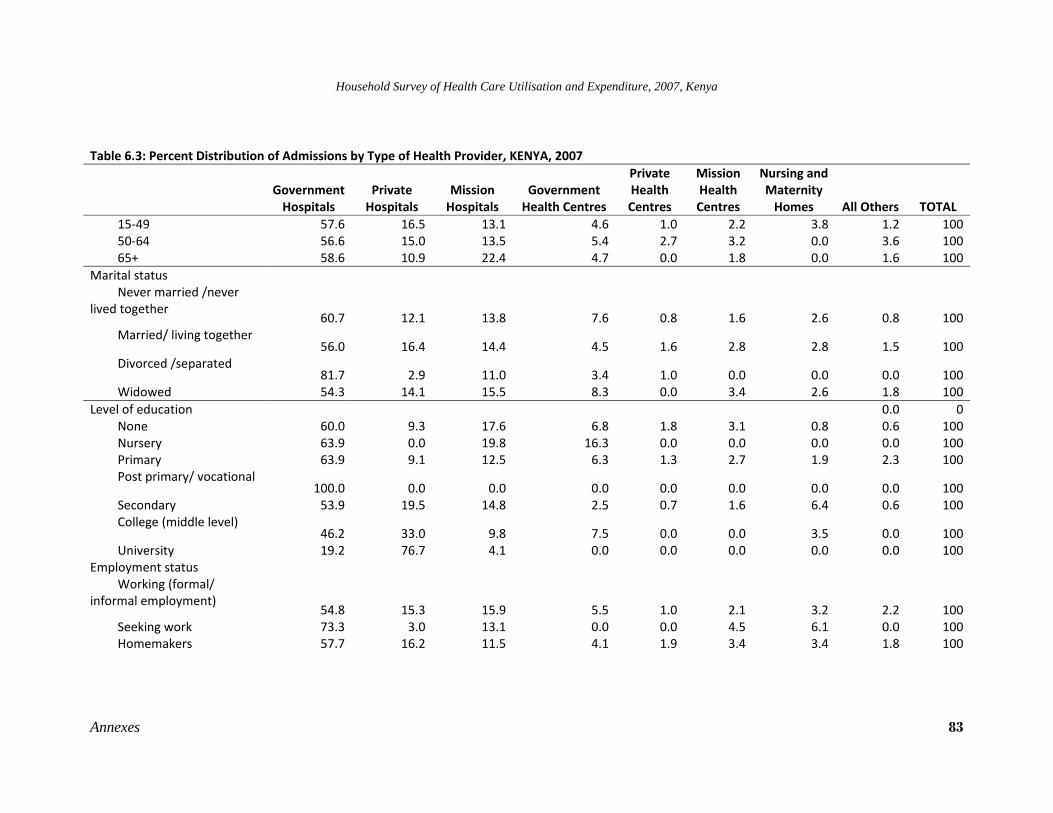
Household Survey of Health Care Utilisation and Expenditure, 2007, Kenya
Annexes 83
Table 6.3: Percent Distribution of Admissions by Type of Health Provider, KENYA, 2007
Government Hospitals
Private Hospitals
Mission Hospitals
Government Health Centres
Private Health Centres
Mission Health Centres
Nursing and Maternity Homes All Others TOTAL
15‐49 57.6 16.5 13.1 4.6 1.0 2.2 3.8 1.2 10050‐64 56.6 15.0 13.5 5.4 2.7 3.2 0.0 3.6 10065+ 58.6 10.9 22.4 4.7 0.0 1.8 0.0 1.6 100
Marital status Never married /never
lived together 60.7 12.1 13.8 7.6 0.8 1.6 2.6 0.8 100
Married/ living together 56.0 16.4 14.4 4.5 1.6 2.8 2.8 1.5 100
Divorced /separated 81.7 2.9 11.0 3.4 1.0 0.0 0.0 0.0 100
Widowed 54.3 14.1 15.5 8.3 0.0 3.4 2.6 1.8 100Level of education 0.0 0
None 60.0 9.3 17.6 6.8 1.8 3.1 0.8 0.6 100Nursery 63.9 0.0 19.8 16.3 0.0 0.0 0.0 0.0 100Primary 63.9 9.1 12.5 6.3 1.3 2.7 1.9 2.3 100Post primary/ vocational
100.0 0.0 0.0 0.0 0.0 0.0 0.0 0.0 100Secondary 53.9 19.5 14.8 2.5 0.7 1.6 6.4 0.6 100College (middle level)
46.2 33.0 9.8 7.5 0.0 0.0 3.5 0.0 100University 19.2 76.7 4.1 0.0 0.0 0.0 0.0 0.0 100
Employment status Working (formal/
informal employment) 54.8 15.3 15.9 5.5 1.0 2.1 3.2 2.2 100
Seeking work 73.3 3.0 13.1 0.0 0.0 4.5 6.1 0.0 100Homemakers 57.7 16.2 11.5 4.1 1.9 3.4 3.4 1.8 100
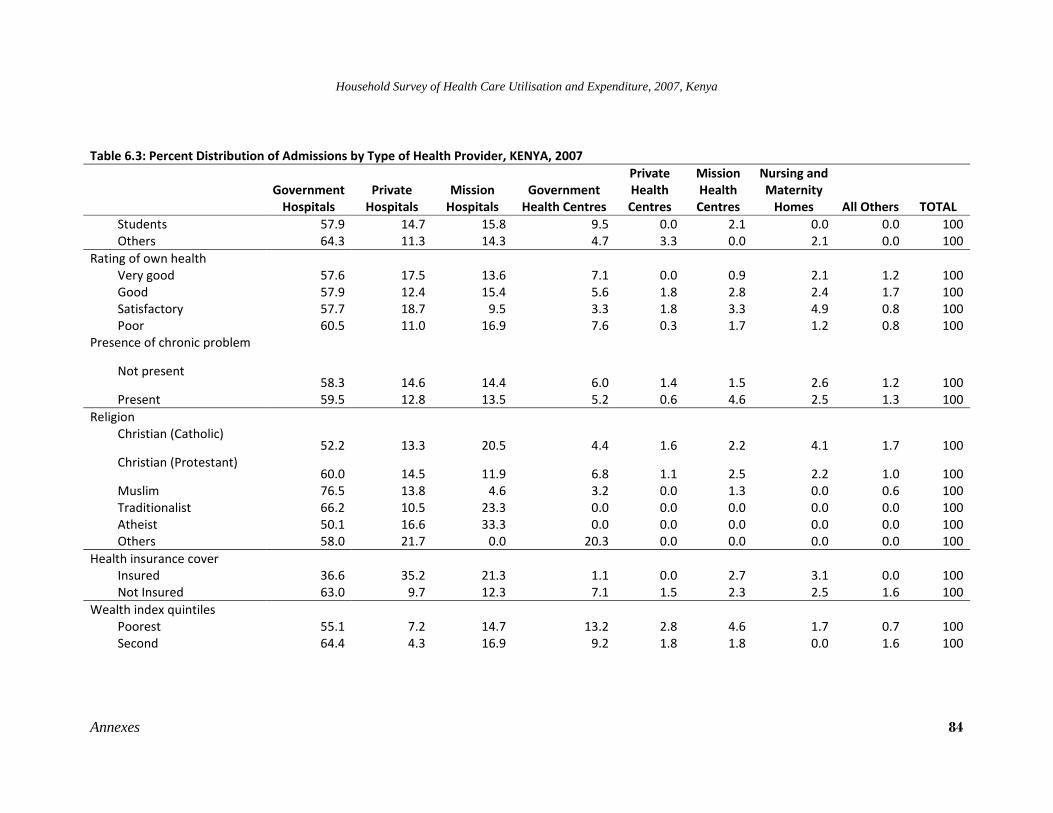
Household Survey of Health Care Utilisation and Expenditure, 2007, Kenya
Annexes 84
Table 6.3: Percent Distribution of Admissions by Type of Health Provider, KENYA, 2007
Government Hospitals
Private Hospitals
Mission Hospitals
Government Health Centres
Private Health Centres
Mission Health Centres
Nursing and Maternity Homes All Others TOTAL
Students 57.9 14.7 15.8 9.5 0.0 2.1 0.0 0.0 100Others 64.3 11.3 14.3 4.7 3.3 0.0 2.1 0.0 100
Rating of own health Very good 57.6 17.5 13.6 7.1 0.0 0.9 2.1 1.2 100Good 57.9 12.4 15.4 5.6 1.8 2.8 2.4 1.7 100Satisfactory 57.7 18.7 9.5 3.3 1.8 3.3 4.9 0.8 100Poor 60.5 11.0 16.9 7.6 0.3 1.7 1.2 0.8 100
Presence of chronic problem
Not present 58.3 14.6 14.4 6.0 1.4 1.5 2.6 1.2 100
Present 59.5 12.8 13.5 5.2 0.6 4.6 2.5 1.3 100Religion
Christian (Catholic) 52.2 13.3 20.5 4.4 1.6 2.2 4.1 1.7 100
Christian (Protestant) 60.0 14.5 11.9 6.8 1.1 2.5 2.2 1.0 100
Muslim 76.5 13.8 4.6 3.2 0.0 1.3 0.0 0.6 100Traditionalist 66.2 10.5 23.3 0.0 0.0 0.0 0.0 0.0 100Atheist 50.1 16.6 33.3 0.0 0.0 0.0 0.0 0.0 100Others 58.0 21.7 0.0 20.3 0.0 0.0 0.0 0.0 100
Health insurance cover Insured 36.6 35.2 21.3 1.1 0.0 2.7 3.1 0.0 100Not Insured 63.0 9.7 12.3 7.1 1.5 2.3 2.5 1.6 100
Wealth index quintiles Poorest 55.1 7.2 14.7 13.2 2.8 4.6 1.7 0.7 100Second 64.4 4.3 16.9 9.2 1.8 1.8 0.0 1.6 100
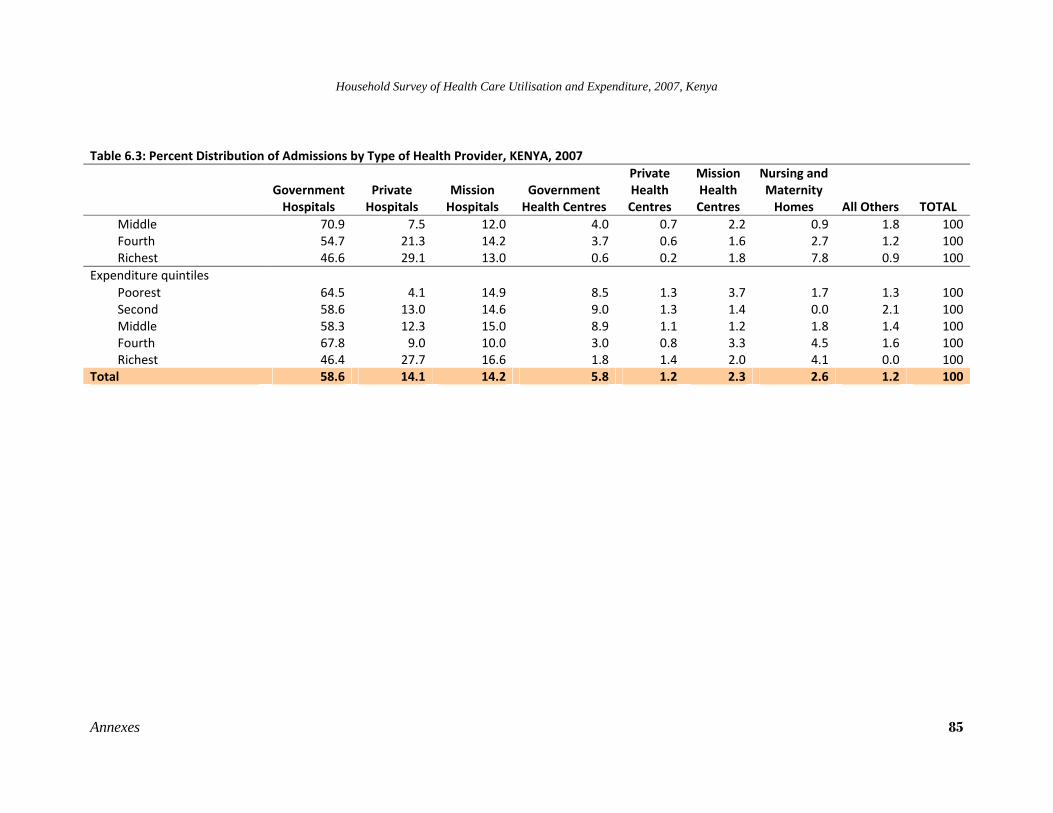
Household Survey of Health Care Utilisation and Expenditure, 2007, Kenya
Annexes 85
Table 6.3: Percent Distribution of Admissions by Type of Health Provider, KENYA, 2007
Government Hospitals
Private Hospitals
Mission Hospitals
Government Health Centres
Private Health Centres
Mission Health Centres
Nursing and Maternity Homes All Others TOTAL
Middle 70.9 7.5 12.0 4.0 0.7 2.2 0.9 1.8 100Fourth 54.7 21.3 14.2 3.7 0.6 1.6 2.7 1.2 100Richest 46.6 29.1 13.0 0.6 0.2 1.8 7.8 0.9 100
Expenditure quintiles Poorest 64.5 4.1 14.9 8.5 1.3 3.7 1.7 1.3 100Second 58.6 13.0 14.6 9.0 1.3 1.4 0.0 2.1 100Middle 58.3 12.3 15.0 8.9 1.1 1.2 1.8 1.4 100Fourth 67.8 9.0 10.0 3.0 0.8 3.3 4.5 1.6 100Richest 46.4 27.7 16.6 1.8 1.4 2.0 4.1 0.0 100
Total 58.6 14.1 14.2 5.8 1.2 2.3 2.6 1.2 100