Embed Size (px)
Citation preview

29
3 Household Energy Use Patterns
3.1 This chapter gives descriptive statistics about household energy use patterns as a function of sector (rural or urban), household income, and the year in which the data were collected. Household energy use was examined using the 50th and the 55th rounds of the NSS. These surveys are conducted from July to June of the following year. The sample for the 50th round, conducted in 1993–94, sampled 115,394 households, consisting of 69,225 rural and 46,169 urban households of a total of 132.2 million rural and 45.7 million urban households. The corresponding figures for the 55th round, conducted in 1999–2000, were 71,385 rural and 48,924 urban households, representing 137.4 million and 51.4 million households, respectively. Detailed descriptions of how the raw data were handled are given in Annex 1. Although the data from the 55th round are not strictly comparable to those from previous years because of changes in survey design, no expenditure adjustments were made because they were expected to have only a marginal effect.
Primary Cooking and Lighting Energy Sources
3.2 Table 3.1 shows the household use of different primary energy sources for cooking and lighting in 1993–94 and 1999–2000. For cooking, firewood dominated among rural households, with dung a distant second. The use of LPG and kerosene was small, even in 1999–2000. In contrast, the dominant fuel in urban areas shifted from wood in 1993–94 to LPG in 1999–2000. By 1999–2000 wood was the second most commonly used primary cooking fuel in urban areas, with twice as many households using LPG. Wood was closely followed by kerosene. For lighting, the observed pattern in both rural and urban areas was an increase in reliance on electricity as the primary lighting fuel, at the expense of kerosene. Most rural households nonetheless used kerosene rather than electricity for lighting even in 1999–2000.

30 Access of the Poor to Clean Household Fuels in India
Table 3.1 Primary Cooking and Lighting Energy Sources (percentage of households)
1993–94 1999–2000
Primary Energy Rural Urban Rural Urban
Cooking
Coke, coal 1.3 5.6 1.5 4.1 Firewood and chips 80.1 30.3 75.4 22.2 LPG 1.8 29.7 5.4 44.1 Gobar gas 0.4 0.1 0.3 0.5 Dung 10.4 2.7 10.6 2.1 Charcoal 0.0 0.2 0.0 0.1 Kerosene 1.9 22.9 2.7 21.7 Electricity negligible 0.1 0.4 Others 3.5 2.4 2.7 0.7 No cooking arrangement 0.7 6.2 1.1 4.2
Lighting
Kerosene 58.3 15.9 50.5 10.2 Other oil 0.3 0.1 0.3 0.1 Gas 0.0 0.1 0.1 0.1 Candles 0.1 0.1 0.1 0.0
Electricity 38.0 83.4 48.4 88.9
Others 0.5 0.1 0.1 0.1
No lighting arrangement 2.8 0.2 0.5 0.3
Note: Census 2001, conducted in February 2001, showed higher dung use in rural areas (2.8 percent), firewood and crop residues separately accounted for (combined total of 77.2 percent in rural areas and 24.8 percent in urban), and lower use of electricity for lighting (43.5 percent in rural, 87.6 percent in urban). See http://www.censusindia.net/.
3.3 While reliance on wood declined in both urban and rural areas, in rural areas the use of dung as the primary cooking fuel did not change between the two periods. Given the much higher damage to health likely to be caused by dung use relative to wood, this is a concern. The proportion of rural households using traditional biomass declined by 4.5 percent from 90.5 in 1993–94 to 86 percent in 1999–2000. The corresponding fall in urban areas was 8.7 percent, from 33 percent to 24.3 percent.
3.4 Household energy use patterns were analyzed further as a function of per capita(p.c.) expenditure decile, which was calculated by computing the total household expenditure divided by the household size. In the case of the 55th round (see also Chapter 4),

Household Energy Use Patterns 31
total household expenditures were further adjusted by interstate cost-of-living differences. The households were then ranked in order of increasing per capita expenditure and divided into 10 groups—the per capita expenditure deciles—each containing the same number of households unless indicated otherwise. Decile 1 corresponds to the bottom 10 percent, and decile 10 to the top 10 percent. The expenditure decile statistics for 1999–2000, showing lower expenditure levels in rural than urban areas in a given decile, and a higher concentration in the lower deciles and lower concentration in the upper deciles of rural households, when deciles are defined nationally, are given in Annex 1.
3.5 The share of households using wood, dung, kerosene and LPG as their primary cooking fuels in 1999–2000 are shown in Figure 3.1 (rural) and Figure 3.2 (urban) as a function of per capita expenditure decile. The sharp contrast between rural and urban areas is immediately clear. Wood use dominated among all rural households. Its use by urban households, however, declined rapidly with increasing expenditure, falling to less than one-fifth of households by decile 5. Dung use was virtually independent of expenditure in rural areas and was nearly constant at about 11 percent, whereas in urban areas its use was small and declined rapidly. Kerosene was used by more than one-fifth of urban households between decile 2 and decile 8. Its use was limited in rural areas where less than one-tenth of households used it as the primary cooking fuel, even in the top decile. LPG use increased rapidly with increasing per capita expenditure in urban areas, exceeding 50 percent of households by decile 6 and reaching nearly 80 percent in decile 10. Its use was very limited in rural areas until about decile 7 but rose rapidly in the top two deciles. Even in decile 10, however, LPG use was limited to fewer than 30 percent of households.

32 Access of the Poor to Clean Household Fuels in India
Figure 3.1 Primary Cooking Fuels in Rural India, 1999–2000
0
10
20
30
40
50
60
70
80
90
100
1 2 3 4 5 6 7 8 9 10Per capita expenditure decile
% o
f hou
seho
lds
in d
ecile
Firewood
Dung
Kerosene
LPG
Figure 3.2 Primary Cooking Fuels in Urban India, 1999–2000
0
10
20
30
40
50
60
70
80
90
100
1 2 3 4 5 6 7 8 9 10Per capita expenditure decile
% o
f hou
seho
lds
in d
ecile
Firewood
Dung
Kerosene
LPG
Household Energy Use Patterns 33
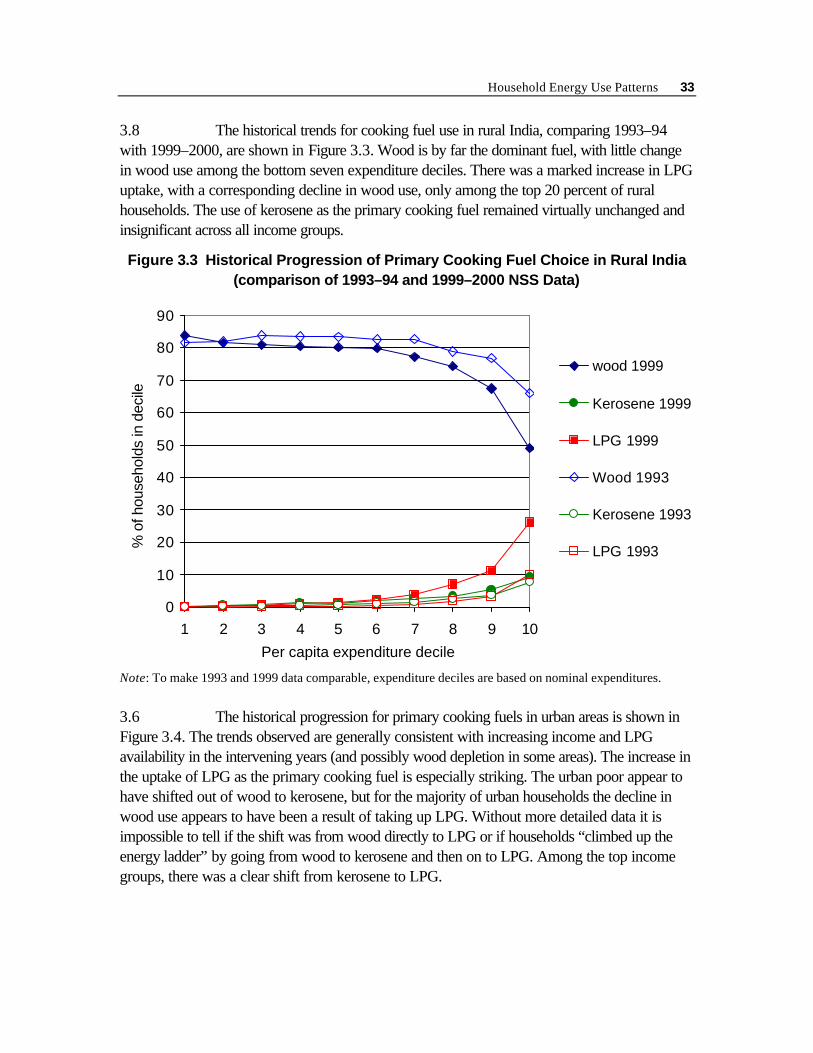
3.8 The historical trends for cooking fuel use in rural India, comparing 1993–94 with 1999–2000, are shown in Figure 3.3. Wood is by far the dominant fuel, with little change in wood use among the bottom seven expenditure deciles. There was a marked increase in LPG uptake, with a corresponding decline in wood use, only among the top 20 percent of rural households. The use of kerosene as the primary cooking fuel remained virtually unchanged and insignificant across all income groups.
Figure 3.3 Historical Progression of Primary Cooking Fuel Choice in Rural India (comparison of 1993–94 and 1999–2000 NSS Data)
0
10
20
30
40
50
60
70
80
90
1 2 3 4 5 6 7 8 9 10
Per capita expenditure decile
% o
f hou
seho
lds
in d
ecile
wood 1999
Kerosene 1999
LPG 1999
Wood 1993
Kerosene 1993
LPG 1993
Note: To make 1993 and 1999 data comparable, expenditure deciles are based on nominal expenditures.
3.6 The historical progression for primary cooking fuels in urban areas is shown in Figure 3.4. The trends observed are generally consistent with increasing income and LPG availability in the intervening years (and possibly wood depletion in some areas). The increase in the uptake of LPG as the primary cooking fuel is especially striking. The urban poor appear to have shifted out of wood to kerosene, but for the majority of urban households the decline in wood use appears to have been a result of taking up LPG. Without more detailed data it is impossible to tell if the shift was from wood directly to LPG or if households “climbed up the energy ladder” by going from wood to kerosene and then on to LPG. Among the top income groups, there was a clear shift from kerosene to LPG.

34 Access of the Poor to Clean Household Fuels in India
Figure 3.4 Historical Progression of Primary Cooking Fuel Choice in Urban India (comparison of 1993–94 and 1999–2000 NSS Data)
0
10
20
30
40
50
60
70
80
90
1 2 3 4 5 6 7 8 9 10
Per capita expenditure decile
% o
f hou
seho
lds
in d
ecile
Wood 1999
Kerosene 1999
LPG 1999
Wood 1993
Kerosene 1993
LPG 1993
3.7 Similar trends were observed in a number of earlier studies of household energy use patterns in India (see, for example, Alam and others 1998 and World Bank 1999). A study in Hyderabad (World Bank 1999), based on a primary survey conducted in 1994, in particular provides complementary insights. The study found rapid interfuel substitution in urban Hyderabad as households switched from wood to kerosene and from kerosene to LPG. This happened despite the fact that there was little real income growth in the preceding 15 years. In part, it was able to take place because of changes in relative fuel prices between 1981 and 1994, when the price of firewood in Hyderabad rose faster than the prices of LPG and kerosene, and by the liberalization of energy markets, which resulted in increased fuel availability. The overall patterns of energy use hide significant differences among income groups, however. Kerosene and wood dominated energy use in the lower income groups. The use of wood declined rapidly with increasing income, to the point where it was used by only a very small percentage of the population. In contrast, kerosene was a staple fuel for low-income households. The use of both LPG and electricity was strongly dependent on the level of income, accounting for about half of total energy use in the middle-income ranges and for more than 90 percent of total energy use in the highest income groups.
3.8 The historical progression for kerosene and electricity, the two dominant sources of energy for lighting, is shown in Figure 3.5 and Figure 3.6 for rural and urban households, respectively. In urban areas, the majority of households in every decile used

Household Energy Use Patterns 35
electricity for lighting in both survey periods, but in rural areas this was the case only among the top three deciles in 1993–94 and the top five deciles in 1999–2000.
Figure 3.5 Historical Progression of Primary Lighting Energy Source in Rural India (comparison of 1993–94 and 1999–2000 NSS Data)
0
10
20
30
40
50
60
70
80
90
100
1 2 3 4 5 6 7 8 9 10
Per capita expenditure decile
% o
f hou
seho
lds
in d
ecile
Kerosene 1993
Kerosene 1999
Electricity 1993
Electricity 1999
Note: To make 1993 and 1999 data comparable, expenditure deciles are based on nominal expenditures.

36 Access of the Poor to Clean Household Fuels in India
Figure 3.6 Historical Progression of Primary Lighting Energy Source in Urban India (comparison of 1993–94 and 1999–2000 NSS Data)
0
10
20
30
40
50
60
70
80
90
100
1 2 3 4 5 6 7 8 9 10
Per capita expenditure decile
% o
f hou
seho
lds
in d
ecile
Kerosene 1993
Kerosene 1999
Electricity 1993
Electricity 1999
Uptake of Different Energy Sources
3.9 Many households used more than one energy source for cooking, and supplemented kerosene lamps for electricity where the power supply was unreliable. While primary energy sources give a good idea of which fuels are most commonly used, these figures could be misleading if the primary energy sources are supplemented significantly by other sources. Table 3.2 reports the percentages of households in rural and urban areas that reported positive consumption of various energy sources in 1993–94 and 1999–2000. All the percentage figures should be equal to or greater than those reported for primary energy sources. In the case of electricity, the percentage of households that reported positive consumption was lower than the percentage that claimed to use electricity as their primary lighting source, indicating either inconsistencies in the responses given or errors in the recording of data.

Household Energy Use Patterns 37
Table 3.2 Uptake of Different Energy Sources (percentage of all households)
1 9 9 3 – 1 9 9 4 1 9 9 9 – 2 0 0 0 Energy Source Rural Urban National Rural Urban National
Firewood and chips 87 37 74 86 30 71
Dung 44 15 36 47 10 37
Biomass (dung, wood, or both) 93 43 80 92 33 76
LPG 1 26 8 6 45 17
Total kerosene 86 76 83 95 71 88
PDS kerosene 61 53 59 76 48 68
Market kerosene 37 34 36 37 39 38
Coal, coke 1 5 2 1 2 1
Gobar gas 0 0 0 0.3 0.04 0.3
Charcoal 0.1 0.5 0.2 0.1 0.4 0.2
Electricity 28 63 37 46 81 56
3.10 Biomass use remained virtually unchanged between 1993–94 and 1999–2000 in rural areas, with more than 90 percent of all rural households using wood, dung, or both. Nationally, LPG uptake doubled between 1993–94 and 1999–2000, but remained limited to fewer than one-fifth of households: in 1999–2000, three-quarters of all households continued to use biomass. Kerosene uptake increased in rural areas but declined in urban areas between the two periods. The urban decline is primarily due to the reduced use of PDS kerosene—the uptake of market kerosene actually increased. The percentage of households using gobar gas or charcoal remained negligibly small.
3.11 The households that reported positive consumption are further divided into per capita expenditure deciles and their consumption shown in Figure 3.7 for wood, total kerosene, and LPG. Extensive use is evident of both wood and kerosene across all expenditure deciles in rural areas, with kerosene being used by more than 90 percent of households in all deciles except decile 10. Kerosene use also is extensive among the lower 50 percent of urban households. The use of kerosene as an energy source for both lighting and cooking makes interpretation of household data difficult, as the survey did not explicitly ask about the quantities of kerosene consumed for these two distinct purposes. Comparison with Figure 3.1 shows that most urban households that consume LPG use it as their primary cooking fuel.

38 Access of the Poor to Clean Household Fuels in India
Figure 3.7 Uptake of Wood, Kerosene, and LPG, 1999–2000
0
10
20
30
40
50
60
70
80
90
100
1 2 3 4 5 6 7 8 9 10
Per capita expenditure decile
% o
f hou
seho
lds
in d
ecile
Wood rural
Wood urban
Kerosene rural
Kerosene urban
LPG rural
LPG urban
3.12 An alternative way of summarizing the data is to look at the distribution of individuals, as opposed to households, who live in houses using different fuels. From the point of view of exposure to smoke emissions and public health it is the number of people who are exposed that is important, and household figures may not represent this number well given that household size differs markedly (two-fold) between the top and bottom deciles. The distribution of individuals cannot, however, capture the fact that not everyone in the household is exposed to the same degree to ambient particulate concentrations. With these limitations in mind, individuals in rural and urban areas were grouped into 10 decile groups, each group containing the same number of individuals rather than households. The results are shown in Table 3.3.
3.13 Because the household size decreases with increasing per capita expenditure, the percentage of individuals living in households that consume fuels primarily used by the poor is greater than the corresponding percentage of households in this category. This is the case for both wood and dung, especially in urban areas where biomass use declines rapidly with increasing income. Most rural residents live in households that use wood and dung, and more than one-third of urban residents live in households that use wood. These high figures are a cause for concern. At the other end of the scale, the percentage of individuals living in households that consume fuels used primarily by the better-off is lower than the corresponding percentage of households in this group. (This generalization does not apply in the case of LPG use in urban areas. LPG-using households are larger than the average household in nearly every expenditure decile, the average size of LPG-consuming households being 4.8 persons, compared to the 4.3 persons per household that does not use LPG.)

Household Energy Use Patterns 39
Table 3.3 Percentage of Individuals in Each Decile Living in Households Using Different Fuels, 1999–2000
R U R A L U R B A N N A T I O N A L P.c. decile by individual1 Wood Dung Kero LPG Wood Dung Kero LPG Wood Dung Kero LPG
1 91 48 97 0 75 31 95 6 90 50 97 0
2 90 56 98 1 63 26 94 14 89 55 98 1
3 90 56 98 0 54 20 92 23 89 53 98 1
4 91 56 98 1 45 16 89 32 89 54 97 2
5 91 56 98 1 35 12 84 42 86 50 97 4
6 90 55 98 3 26 8 78 54 84 46 96 7
7 90 52 97 4 20 5 71 62 78 42 95 13
8 88 52 96 7 15 4 63 72 69 36 90 23
9 87 50 94 13 9 2 51 78 50 26 84 41
10 75 42 90 30 5 1 31 88 23 10 57 70
Average 88 52 96 6 35 12 75 47 75 42 91 17
Kero – kerosene. 1 Decile groups containing the same number of individuals rather than households.
Parallel Markets for Kerosene
3.14 The kerosene market in India merits special examination because of its extensive use, especially in rural areas, and because there was (and remains) a dual price structure at the time of the 50th and 55th rounds of NSS. The same applies to LPG, but unfortunately LPG consumers in the survey were not asked whether they purchased LPG from private or state oil company dealers. Because of the large scatter in the data it was not possible to categorize LPG consumers into those that purchased subsidized LPG and those that paid the market price. In contrast, kerosene consumers were asked how much PDS kerosene and how much kerosene from other sources the household purchased, both in monetary terms and quantity, during the last 30 days.
3.15 The percentage of kerosene-consuming households increased from 1993–94 to 1999–2000 in rural areas, but declined in urban areas. A lower bound to the availability of PDS was estimated by defining access to PDS as living in an area (in this case, the first sampling unit: a village in rural areas and a block in urban areas) where at least one household, including itself, purchased PDS kerosene. It is possible that PDS kerosene was available but that none of the households surveyed in the first sampling unit happened to be purchasing PDS kerosene, and the actual access figures therefore are likely to be higher than those recorded. Bearing this limitation in mind, access, defined in this way, increased in rural areas but remained static in urban areas. By 1999–2000, a greater proportion of rural households had access to PDS kerosene than their urban counterparts, suggesting that it became easier over this period to purchase PDS kerosene in rural areas. The fraction of rural households using PDS kerosene

40 Access of the Poor to Clean Household Fuels in India
increased to three-quarters in 1999–2000, but declined to less than half in urban areas. These results are shown in Table 3.4.
Table 3.4 Household Uptake of Kerosene and Access to PDS (percentage of all households)
1 9 9 3 –1 9 9 4 1 9 9 9 – 2 0 0 0 Households Rural Urban Rural Urban
Using kerosene 86 76 95 71
Having access to PDS kerosene1 85 89 95 89
Using PDS kerosene 61 54 76 48 1 For definition of access to PDS kerosene, see paragraph 3.15.
3.16 The impact of access to PDS on kerosene uptake is shown in Table 3.5. Households in communities in which at least one household was purchasing PDS kerosene were far more likely to be using kerosene: in 1999–2000, in urban areas they were more than twice as likely to be using it. For all the measures examined in Table 3.5, there was an increase in rural areas and a decline in urban areas between the two time periods.
Table 3.5 Impact of Access to PDS on Kerosene Uptake (percentage of households in each category)
1 9 9 3 – 1 9 9 4 1 9 9 9 – 2 0 0 0 Households with access to PDS
Households without access to PDS Rural Urban Rural Urban
Using kerosene 90 80 95 75
Using PDS kerosene 73 60 80 54
Using kerosene 62 48 87 35
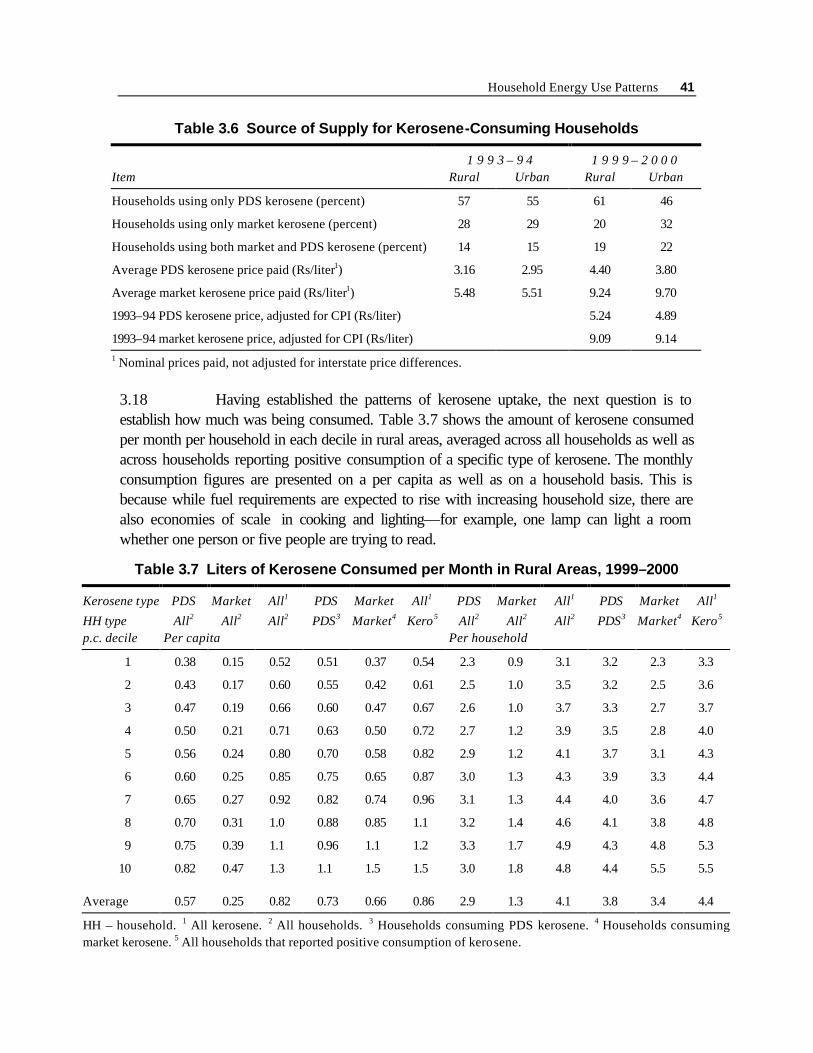
3.17 Among households that reported positive consumption of kerosene there was increasing reliance on PDS kerosene in rural areas but increasing reliance on market kerosene in urban areas (see Table 3.6). Market kerosene was significantly more expensive (in urban areas, more than 2.5 times as expensive) than PDS kerosene, and yet close to one-third of urban kerosene-consuming households did not purchase any PDS kerosene. This strongly suggests that the transaction cost of purchasing PDS kerosene was high (for example, it may have been in chronic short supply at the fair price shops), or that the kerosene allotted on paper was in practice not available. Table 3.6 also shows that, when adjusted for the CPI, PDS kerosene prices did not rise as much but market kerosene prices rose more than the price of other consumer goods between the two survey periods, making PDS kerosene even more attractive in principle than market kerosene in 1999–2000.
Household Energy Use Patterns 41
Table 3.6 Source of Supply for Kerosene-Consuming Households
1 9 9 3 – 9 4 1 9 9 9 – 2 0 0 0 Item Rural Urban Rural Urban
Households using only PDS kerosene (percent) 57 55 61 46
Households using only market kerosene (percent) 28 29 20 32
Households using both market and PDS kerosene (percent) 14 15 19 22
Average PDS kerosene price paid (Rs/liter1) 3.16 2.95 4.40 3.80
Average market kerosene price paid (Rs/liter1) 5.48 5.51 9.24 9.70
1993–94 PDS kerosene price, adjusted for CPI (Rs/liter) 5.24 4.89
1993–94 market kerosene price, adjusted for CPI (Rs/liter) 9.09 9.14 1 Nominal prices paid, not adjusted for interstate price differences.
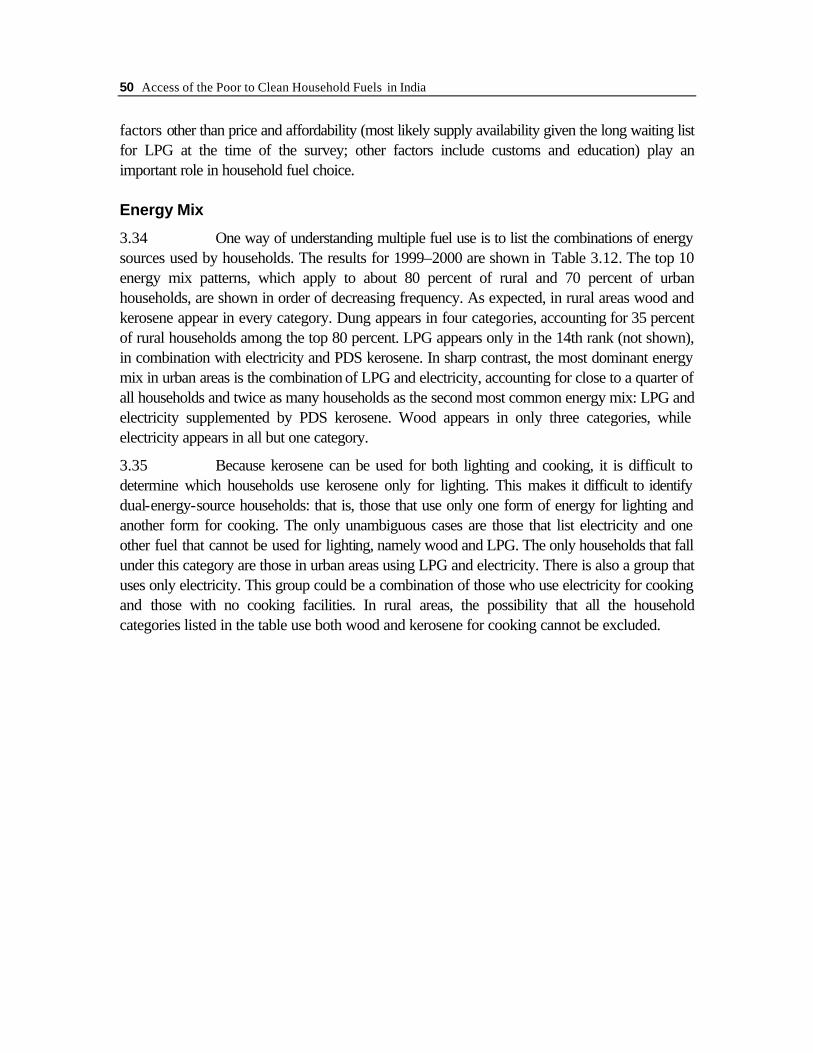
3.18 Having established the patterns of kerosene uptake, the next question is to establish how much was being consumed. Table 3.7 shows the amount of kerosene consumed per month per household in each decile in rural areas, averaged across all households as well as across households reporting positive consumption of a specific type of kerosene. The monthly consumption figures are presented on a per capita as well as on a household basis. This is because while fuel requirements are expected to rise with increasing household size, there are also economies of scale in cooking and lighting—for example, one lamp can light a room whether one person or five people are trying to read.
Table 3.7 Liters of Kerosene Consumed per Month in Rural Areas, 1999–2000
Kerosene type PDS Market All1 PDS Market All1 PDS Market All1 PDS Market All1
HH type All2 All2 All2 PDS3 Market4 Kero5 All2 All2 All2 PDS3 Market4 Kero5 p.c. decile Per capita Per household
1 0.38 0.15 0.52 0.51 0.37 0.54 2.3 0.9 3.1 3.2 2.3 3.3
2 0.43 0.17 0.60 0.55 0.42 0.61 2.5 1.0 3.5 3.2 2.5 3.6
3 0.47 0.19 0.66 0.60 0.47 0.67 2.6 1.0 3.7 3.3 2.7 3.7
4 0.50 0.21 0.71 0.63 0.50 0.72 2.7 1.2 3.9 3.5 2.8 4.0
5 0.56 0.24 0.80 0.70 0.58 0.82 2.9 1.2 4.1 3.7 3.1 4.3
6 0.60 0.25 0.85 0.75 0.65 0.87 3.0 1.3 4.3 3.9 3.3 4.4
7 0.65 0.27 0.92 0.82 0.74 0.96 3.1 1.3 4.4 4.0 3.6 4.7
8 0.70 0.31 1.0 0.88 0.85 1.1 3.2 1.4 4.6 4.1 3.8 4.8
9 0.75 0.39 1.1 0.96 1.1 1.2 3.3 1.7 4.9 4.3 4.8 5.3
10 0.82 0.47 1.3 1.1 1.5 1.5 3.0 1.8 4.8 4.4 5.5 5.5
Average 0.57 0.25 0.82 0.73 0.66 0.86 2.9 1.3 4.1 3.8 3.4 4.4
HH – household. 1 All kerosene. 2 All households. 3 Households consuming PDS kerosene. 4 Households consuming market kerosene. 5 All households that reported positive consumption of kerosene.

42 Access of the Poor to Clean Household Fuels in India
3.19 Per capita consumption of both PDS and market kerosene rose rapidly with increasing expenditure. Household consumption of kerosene also rose monotonically with increasing expenditure, although at a slower rate, a result of the fact that the higher expenditure households that consume more kerosene generally are smaller in size. Household consumption of PDS kerosene remained small, averaging less than 3 liters across all households and less than 4 liters even when only those households that purchase PDS kerosene were considered. Among those that reported positive consumption, the amount of market kerosene purchased exceeded that of PDS kerosene in the top two deciles. Among kerosene-consuming households, even those that consumed the largest quantity—the top decile—consumed less than 6 liters per month. This is not adequate to meet all cooking requirements. These small quantities reflect both the urban bias in kerosene allocation and the limited use of kerosene in general for household chores. For example, even when kerosene is used to “supplement” wood for cooking, it often is used mainly as a fire-starter rather than as a cooking fuel (World Bank 2002b). The small quantities of kerosene used are also indicative of the extensive use of kerosene for lighting even in electrified households, probably reflecting the low reliability of electricity supply.
3.20 The corresponding figures for urban households are given in Table 3.8. PDS kerosene consumption, both on a per capita and household basis, was higher in urban areas than rural areas except among the top three expenditure deciles. The households in the top three deciles consumed more market kerosene than PDS kerosene even when consumption was averaged across all households. Among kerosene-consuming households, kerosene consumption per household rose steadily and peaked at deciles 5–7, reaching nearly 10 liters per month, before it declined. The bottom decile consumed as much as the top decile (more than 6 liters per month), and more than the top decile in rural areas.
3.21 One of the most interesting and important findings comes from the comparison of the total amount of PDS kerosene consumed by households with the total amount allocated by the central government. Comparison for both the 50th and the 55th rounds of the NSS shows that the total amount of kerosene supplied through the PDS and consumed by households amounted to one-half of the total amount uplifted by all the states and union territories—that is to say, the leakage rate was about 50 percent. This substantial diversion of PDS kerosene, apparently to the automotive sector where kerosene is used as a substitute for diesel and to the black market for household consumption, would explain why many households rely on market kerosene despite its much higher price. Given the high leakage rate, the transaction cost of purchasing PDS kerosene would also be expected to be high, due to the consequent chronic supply shortages.

Household Energy Use Patterns 43
Table 3.8 Liters of Kerosene Consumed per Month in Urban Areas, 1999–2000
Kerosene type PDS Market All1 PDS Market All1 PDS Market All1 PDS Market All1
HH type All2 All2 All2 PDS3 Market4 Kero5 All2 All2 All2 PDS3 Market4 Kero5 P..c. decile Per capita Per household
1 0.58 0.37 1.0 0.8 0.9 1.0 3.6 2.3 5.8 5.4 5.2 6.3
2 0.75 0.56 1.3 1.1 1.2 1.4 4.1 3.1 7.2 6.3 6.5 7.8
3 0.80 0.64 1.4 1.2 1.4 1.6 4.2 3.4 7.6 6.5 7.1 8.4
4 0.86 0.72 1.6 1.4 1.6 1.9 4.3 3.6 7.9 6.9 7.8 9.3
5 0.88 0.74 1.6 1.5 1.8 2.1 4.2 3.5 7.7 7.4 8.2 9.7
6 0.83 0.77 1.6 1.6 2.0 2.2 3.7 3.4 7.1 7.5 8.3 9.7
7 0.81 0.73 1.6 1.8 2.1 2.4 3.3 3.0 6.3 7.9 7.9 9.7
8 0.61 0.78 1.4 1.6 2.6 2.4 2.3 2.9 5.2 6.6 8.4 8.8
9 0.45 0.60 1.0 1.7 2.6 2.4 1.5 2.0 3.5 6.2 7.3 7.8
10 0.26 0.36 0.6 1.6 2.6 2.3 0.8 1.1 1.9 5.4 6.5 6.5
Average 0.71 0.63 1.3 1.3 1.6 1.8 3.2 2.8 6.0 6.7 7.4 8.5
HH – household. 1 All kerosene. 2 All households. 3 Households consuming PDS kerosene. 4 Households consuming market kerosene. 5 All households that reported positive consumption of kerosene.
3.22 The next important policy question is how the consumption of the PDS kerosene that reaches the intended beneficiaries (households) is in aggregate distributed among the different decile groups. To answer this question, the cumulative amount of kerosene consumed is plotted in percentages, beginning with the bottom decile, in Figure 3.8. If each decile consumed the same amount the data would fall on the line referred to as “uniform distribution” in the figure. Should the data fall below this line it would indicate that the poor consumed proportionately less than the better-off, and vice versa. Figure 3.8 shows that there was a relative shift in consumption of PDS kerosene from the rich to the worse-off in both urban and rural areas between 1993–94 and 1999–2000. Among rural households in 1999–2000, the distribution of kerosene consumption (and hence the subsidy portion that reaches households) was fairly uniform; among urban households it was skewed toward middle-income households.

44 Access of the Poor to Clean Household Fuels in India
Figure 3.8 Cumulative Consumption of PDS Kerosene
0%
20%
40%
60%
80%
100%
1 2 3 4 5 6 7 8 9 10Per capita expenditure decile
Cum
ulat
ive
perc
enta
ge
Rural 99-00
Urban 99-00
Rural 93-94
Urban 93-94
Uniformdistribution
Note: To make 1993 and 1999 data comparable, expenditure deciles are based on nominal expenditures.
3.23 When examined in terms of the percentage of the total household budget, the kerosene subsidy that reached the households appeared to be progressive. Figure 3.9 plots the expenditure on PDS kerosene in 1999–2000 as a percentage of total household expenditure as a function of the per capita expenditure decile, averaged across all households in each decile. The share decreases monotonically in both rural and urban areas. The subsidy delivered as the share of the total household budget is in turn directly proportional to the figures shown in Figure 3.9.
3.24 The above observations indicate that the poor benefit more from the portion of the kerosene subsidy that has not been diverted to the black market than do the nonpoor. This distribution pattern is consistent with that observed in the Hyderabad study cited above, in which a kerosene subsidy, despite the problems with rationing, was found to be a more effective policy intervention for reaching poor households than were LPG or electricity subsidies. In Hyderabad, the two poorest income groups received a subsidy of close to Rs 7 million per month through this program in 1994, while the highest 20 percent of households, which used little kerosene, received only slightly more than Rs 1 million per month as a class. (The two highest income groups nonetheless were well compensated through other subsidies, as they received more than Rs 22 million per month in subsidies for electricity and LPG combined. If the kerosene subsidy leakage is taken into account, the distribution of subsidies shifts further in favor of the high-income groups.)

Household Energy Use Patterns 45
Figure 3.9 Expenditure on PDS Kerosene by All Households, 1999–2000 (percentage of total household expenditure)
0
0.1
0.2
0.3
0.4
0.5
0.6
0.7
0.8
0.9
1
1 2 3 4 5 6 7 8 9 10
Per capita expenditure decile
% o
f tot
al h
ouse
hold
exp
endi
ture
Rural
Urban
3.23 These findings could lend support to the continuation of the kerosene subsidy in some form, but only provided that leakage can be contained. An extremely high rate of leakage, most likely to the nonpoor (such as vehicle owners), brings into serious question the cost-effectiveness of the kerosene subsidy, even should the subsidy portion that reaches households be progressive. In 1999–2000, a kerosene subsidy leakage rate of 50 percent was equivalent to a loss of Rs 40 billion (about US$1 billion), a large amount of public funds that could have been spent on high-priority social needs such as primary health, education, or employment programs.
LPG Consumption
3.25 LPG is clearly the fuel of choice for those who can afford it. By knowing how much households typically consume, it is possible to back-calculate the corresponding monthly expenditure under different price scenarios (for example, after subsidy elimination). In examining LPG uptake and consumption, it was not possible to distinguish between subsidized and market LPG because this information was not explicitly sought in the NSS questionnaire. However, private sector LPG dealers played a minor role even in 1999–2000. For all intents and purposes, the vast majority of LPG consumed by households was subsidized: the state oil companies held close to 95 percent of the LPG market at the time the 55th round of the NSS was conducted. A 14.2 kg LPG cylinder cost Rs 100.39 in rural and Rs 99.83 in urban areas in 1993–94, and Rs 185.59 on average in rural areas and Rs 175.94 in urban areas in 1999–

46 Access of the Poor to Clean Household Fuels in India
2000. These figures are not adjusted for interstate cost-of-living differences, and exclude the top and bottom 5 percent of the price distribution to remove outliers. Adjusted for the CPI, the 1993–94 prices would be equivalent to Rs 166.53 in rural and Rs 165.61 in urban areas in 1999–2000; in other words, LPG retail prices rose slightly more than the CPI during this period.
3.26 Consumption of LPG as a function of per capita expenditure, averaged across all households as well as across exclusively LPG-consuming households, is presented in Table 3.9 for 1999–2000. As discussed in Annex 1, these figures are may carry a significant upward bias. It is unlikely that the rural poor were consuming 8 to 10 kg of LPG per month, or that rural households on average consumed more than 11 kg per month.
Table 3.9 Kilograms of LPG Consumed per Month, 1999–2000
R U R A L U R B A N HH type All LPG All LPG All LPG All LPG P.c. decile Per capita Per household Per capita Per household
1 0.00 1.9 0.0 8.3 0.1 1.6 0.8 11.8
2 0.01 1.1 0.0 9.0 0.4 2.0 1.9 12.9
3 0.01 1.6 0.1 10.5 0.6 2.0 3.2 12.7
4 0.02 1.8 0.1 10.3 0.9 2.3 4.6 13.7
5 0.03 2.1 0.2 12.8 1.2 2.4 5.9 13.5
6 0.05 1.6 0.3 10.6 1.6 2.5 6.9 13.1
7 0.09 1.7 0.5 10.9 1.9 2.7 7.8 13.2
8 0.17 1.9 0.8 11.3 2.3 3.0 8.5 13.5
9 0.32 2.0 1.4 10.9 2.7 3.3 9.2 13.2
10 0.87 2.6 3.2 11.3 3.4 3.8 10.4 13.5
Average 0.14 2.2 0.7 11.3 1.3 2.8 5.9 13.3
HH – households; All – all households; LPG – households that reported positive consumption of LPG.
3.27 Cumulative consumption of LPG for the two survey periods is shown in Figure 3.10. Compared to kerosene, the change with time in the distribution of LPG consumption was much smaller in both urban and rural areas. Among rural households in particular, the top four deciles continued to consume more than 80 percent of total household LPG demand. It is clear that the LPG subsidy accrued disproportionately to high-income households residing in urban areas.

Household Energy Use Patterns 47
Figure 3.10 Cumulative Consumption of LPG
0%
20%
40%
60%
80%
100%
1 2 3 4 5 6 7 8 9 10Per capita expenditure decile
Cum
ulat
ive
perc
enta
ge
Rural 99-00
Urban 99-00
Rural 93-94
Urban 93-94
Uniformdistribution
Note: To make 1993 and 1999 data comparable, expenditure deciles are based on nominal expenditures.
3.28 An indication of the subsidy delivered as a percentage of the total household budget can be found in Table A1.3 (rural) and Table A1.4 (urban) in Annex 1. In rural areas, the share rose sharply with each higher decile. In urban areas, the share increased up to decile 7, after which it fell. Because no distinction was made between subsidized and market-priced LPG, the subsidy would not be strictly proportional to these figures, but the share of market LPG was small, and furthermore subsidized LPG was most readily available in large cities where the richest households live. It is clear that the LPG subsidy is regressive.
3.29 The leakage of subsidized LPG was examined by comparing the amount allocated by the central government and the actual amount consumed. The calculations showed that these two amounts were essentially identical in both 1993–94 and 1999–2000. However, given the suspected upward bias in the reported consumption of LPG, the actual differences might have been greater.
Firewood Consumption
3.30 Firewood is the most important energy source in rural India. While more households use kerosene than wood, kerosene consumption remains low on average, and rural households rely on fuels other than kerosene for the majority of their cooking needs. A large fraction of rural households, especially the rural poor, use home-grown or freely collected wood. As explained in Annex 1, this makes estimation of the quantities of wood consumed as well as their imputed values difficult. Table A1. in Annex 1 shows that close to a quarter of rural households live in communities where nobody reported purchasing firewood. This gives an indication of the extent of the absence of commercial markets for wood, a situation that is due to

48 Access of the Poor to Clean Household Fuels in India
both the relative abundance of biomass and the low value of time, arising from a lack of income-generating opportunities. A study of LPG use in Andhra Pradesh undertaken in the previous ESMAP study (World Bank 2002a) shows that when income-generating activities are available, such as during the agricultural season, even rural households with access to free biomass shift from biomass to LPG for convenience and for the time saved.
3.31 The amounts of firewood consumed are shown in Table 3.10, averaged across all households as well as only those households that reported positive consumption of wood. Among wood-consuming households, per capita consumption increased monotonically in both rural and urban areas. Household (as opposed to per capita) consumption also rose in rural areas except in the top decile, but declined in urban areas. The rural trend is consistent with observations in other countries: as rural households become richer, their total energy consumption rises, resulting in an increase rather than a decline in wood consumption.
Table 3.10 Kilograms of Firewood Consumed per Month, 1999–2000
R U R A L U R B A N HH type All Wood All Wood All Wood All Wood P.c. decile Per capita Per household Per capita Per household
1 15 16 82 91 10 14 58 82
2 14 15 82 91 10 13 58 82
3 15 16 85 94 9 15 47 82
4 16 18 88 98 8 16 40 82
5 17 18 93 102 6 17 30 79
6 18 20 92 102 5 18 24 82
7 19 21 95 106 3 17 15 73
8 20 22 94 106 3 17 11 67
9 21 24 95 109 2 20 8 77
10 21 25 92 111 1 21 5 76
Average 18 20 89 103 5 15 24 80
HH – households; All – all households; Wood – households that reported positive consumption of wood.
3.32 Whether households use free or bought firewood is an important question. Where time is unconstrained (that is, valued at close to zero in monetary terms) and there is firewood to be grown or collected, it is difficult for commercial fuels to compete with firewood. The same applies to dung, which is freely available to those households with cattle. Sources of firewood, categorized by requirements for cash outlays, are shown in Table 3.11. The percentages shown are of all households, so that the sum of “free,” “cash,” and “balance” gives the percentage of households in each decile that reported positive consumption of firewood. More than one-half of rural households in every decile except decile 10 used only free firewood. On average, close to 60 percent of rural households did not pay to use wood. In

Household Energy Use Patterns 49
contrast, in urban areas even among the bottom decile less than one-fifth used free firewood, averaging a mere 7 percent across all urban households. About 20 percent of urban and rural households alike used only purchased firewood. In urban areas close to 50 percent of the bottom decile used purchased firewood, the highest percentage of all deciles, whereas in rural areas the highest percentages of purchased firewood users were found in deciles 4 through 9. It is surprising that among those who purchased biomass, the amounts paid were essentially the same for rural and urban households, and even among the bottom 20 percent in rural areas were not markedly lower.
Table 3.11 Sources of Firewood, 1999–2000 (percentage of all households in each decile)
R U R A L U R B A N Per capita decile Free Cash Balance Rs/mo Free Cash Balance Rs/mo
1 62% 15% 13% 76 19% 47% 4% 100
2 66% 18% 6% 87 13% 41% 3% 106
3 65% 19% 6% 91 10% 36% 3% 103
4 62% 23% 6% 99 8% 28% 2% 100
5 62% 22% 6% 95 6% 21% 2% 100
6 59% 24% 6% 99 4% 16% 2% 95
7 60% 23% 6% 102 3% 12% 1% 86
8 57% 24% 7% 109 3% 7% 1% 99
9 54% 22% 7% 109 2% 4% 1% 101
10 46% 19% 6% 113 1% 2% 0% 119
Average 59% 21% 7% 99 7% 21% 2% 101
Free – only home-grown or freely collected wood; Cash – only purchased wood; Balance – combination of free and purchased, or other (unspecified) sources; Rs/mo Rs spent per month per household, adjusted for cost-of-living, on wood purchase by those who used only purchased wood.
3.33 Those who rely primarily on purchased wood are the most likely candidates for fuel switching. Those who reported using purchased wood as the primary cooking fuel were analyzed and compared to those who reported using LPG as the primary cooking fuel. The results are shown in Annex 1, Table A1.5 to Table A1.8. Although users of purchased wood were paying significant amounts, they were spending consistently less on fuel than LPG users in the same per capita expenditure decile group. Averaged across all expenditure deciles, they paid Rs 137 per month for wood, kerosene, and LPG, compared to Rs 176 per month spent by those who used LPG as the primary cooking fuel. They were also, on average, poorer than those who cooked mainly with LPG. These findings suggest that the higher cost of cooking with LPG is the major reason for not switching from purchased wood to LPG. There nonetheless were families in the poorer (lower) expenditure deciles that cooked primarily with LPG and families from richer (upper) deciles that cooked mainly with purchased wood. This suggests that
50 Access of the Poor to Clean Household Fuels in India
factors other than price and affordability (most likely supply availability given the long waiting list for LPG at the time of the survey; other factors include customs and education) play an important role in household fuel choice.
Energy Mix
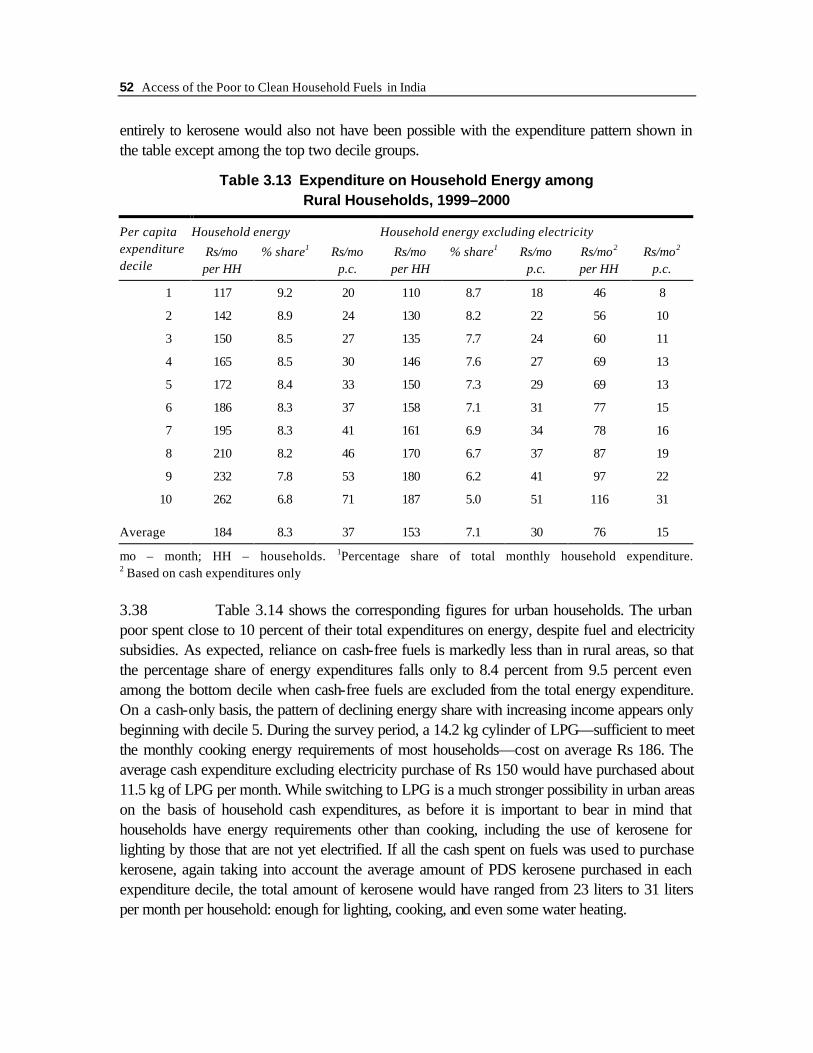
3.34 One way of understanding multiple fuel use is to list the combinations of energy sources used by households. The results for 1999–2000 are shown in Table 3.12. The top 10 energy mix patterns, which apply to about 80 percent of rural and 70 percent of urban households, are shown in order of decreasing frequency. As expected, in rural areas wood and kerosene appear in every category. Dung appears in four categories, accounting for 35 percent of rural households among the top 80 percent. LPG appears only in the 14th rank (not shown), in combination with electricity and PDS kerosene. In sharp contrast, the most dominant energy mix in urban areas is the combination of LPG and electricity, accounting for close to a quarter of all households and twice as many households as the second most common energy mix: LPG and electricity supplemented by PDS kerosene. Wood appears in only three categories, while electricity appears in all but one category.
3.35 Because kerosene can be used for both lighting and cooking, it is difficult to determine which households use kerosene only for lighting. This makes it difficult to identify dual-energy-source households: that is, those that use only one form of energy for lighting and another form for cooking. The only unambiguous cases are those that list electricity and one other fuel that cannot be used for lighting, namely wood and LPG. The only households that fall under this category are those in urban areas using LPG and electricity. There is also a group that uses only electricity. This group could be a combination of those who use electricity for cooking and those with no cooking facilities. In rural areas, the possibility that all the household categories listed in the table use both wood and kerosene for cooking cannot be excluded.
Household Energy Use Patterns 51
Table 3.12 Energy Mix of Rural and Urban Households, 1999–2000
R U R A L U R B A N Rank Energy mix % HH Cum % Rs/mo Energy mix % HH Cum % Rs/mo
1 W, PK, E 15% 15% 172 LPG, E 22% 22% 426
2 W, PK, D 14% 30% 169 PK, LPG, E 11% 33% 357
3 W, PK 12% 41% 112 PK, MK, E 7% 40% 530
4 W, PK, D, E 10% 51% 263 W, PK, E 7% 48% 222
5 W, PK, MK, D 6% 57% 200 MK, E 6% 54% 204
6 W, MK, D 5% 63% 174 MK, LPG, E 5% 59% 359
7 W, PK, MK 5% 68% 147 W, MK, E 3% 62% 215
8 W, MK 4% 72% 122 PK, E 3% 65% 165
9 W, MK, E 3% 75% 174 W, PK 3% 68% 132
10 W, PK, MK, E 2% 78% 217 E 3% 71% 68
PK – PDS kerosene; W – wood; E – electricity; MK – market kerosene; D – dung; HH – households; cum – cumulative; Rs/mo Rs spent on household energy per month per household, adjusted for interstate price differences.
Expenditures on Household Energy
3.36 The monthly household expenditure on energy and its share of the total expenditure is an important determinant of energy choice. It also gives some idea of the scope for fuel switching: for example, a household paying a lot of cash for wood out of its total energy budget is more likely to consider switching to kerosene or LPG than is one that collects free wood. Table 3.13 shows how much rural households were spending, in cash and imputed, on acquiring household energy (excluding transportation fuels), adjusted for interstate price differences. Also shown are household expenditures on energy, excluding electricity and noncash biomass, again adjusted for interstate price differences. A breakdown of energy share for kerosene, LPG, and electricity is given in Annex 1.
3.37 The strong reliance of rural households on cash-free fuels emerges clearly in the table. The percentage share of expenditures on household energy falls to 4.4 percent from 9.2 percent for the bottom decile if cash-free fuels are excluded, and the usual pattern of declining percentage share with increasing income is reversed up to decile 9. The amount of cash spent on fuels was not sufficient to switch entirely to LPG for cooking in any expenditure decile, especially given that in addition to cooking, households need fuel for heating water, and in colder regions of India, for space heating in winter. If all of the cash spent on fuels were used to purchase kerosene, taking into account the average amount of PDS kerosene purchased in each expenditure decile (see Table 3.7 for more detail), the total amount of kerosene purchased would have ranged from 9 liters in the bottom decile to 22 liters per household per month in the top decile. Since some kerosene is used for lighting, especially among the poor, switching
52 Access of the Poor to Clean Household Fuels in India
entirely to kerosene would also not have been possible with the expenditure pattern shown in the table except among the top two decile groups.
Table 3.13 Expenditure on Household Energy among Rural Households, 1999–2000
Household energy Household energy excluding electricity
Rs/mo % share1 Rs/mo Rs/mo % share1 Rs/mo Rs/mo2 Rs/mo2
Per capita expenditure decile per HH p.c. per HH p.c. per HH p.c.
1 117 9.2 20 110 8.7 18 46 8
2 142 8.9 24 130 8.2 22 56 10
3 150 8.5 27 135 7.7 24 60 11
4 165 8.5 30 146 7.6 27 69 13
5 172 8.4 33 150 7.3 29 69 13
6 186 8.3 37 158 7.1 31 77 15
7 195 8.3 41 161 6.9 34 78 16
8 210 8.2 46 170 6.7 37 87 19
9 232 7.8 53 180 6.2 41 97 22
10 262 6.8 71 187 5.0 51 116 31
Average 184 8.3 37 153 7.1 30 76 15
mo – month; HH – households. 1Percentage share of total monthly household expenditure. 2 Based on cash expenditures only
3.38 Table 3.14 shows the corresponding figures for urban households. The urban poor spent close to 10 percent of their total expenditures on energy, despite fuel and electricity subsidies. As expected, reliance on cash-free fuels is markedly less than in rural areas, so that the percentage share of energy expenditures falls only to 8.4 percent from 9.5 percent even among the bottom decile when cash-free fuels are excluded from the total energy expenditure. On a cash-only basis, the pattern of declining energy share with increasing income appears only beginning with decile 5. During the survey period, a 14.2 kg cylinder of LPG—sufficient to meet the monthly cooking energy requirements of most households—cost on average Rs 186. The average cash expenditure excluding electricity purchase of Rs 150 would have purchased about 11.5 kg of LPG per month. While switching to LPG is a much stronger possibility in urban areas on the basis of household cash expenditures, as before it is important to bear in mind that households have energy requirements other than cooking, including the use of kerosene for lighting by those that are not yet electrified. If all the cash spent on fuels was used to purchase kerosene, again taking into account the average amount of PDS kerosene purchased in each expenditure decile, the total amount of kerosene would have ranged from 23 liters to 31 liters per month per household: enough for lighting, cooking, and even some water heating.

Household Energy Use Patterns 53
Table 3.14 Expenditure on Household Energy among Urban Households, 1999–2000
Household energy Household energy excluding electricity Rs/mo % share1 Rs/mo Rs/mo % share1 Rs/mo Rs/mo2 Rs/mo2
Per capita expenditure decile per HH p.c. per HH p.c. per HH p.c.
1 178 9.5 29 139 7.5 23 118 19
2 211 9.2 38 152 6.8 28 138 25
3 234 8.9 45 158 6.2 30 146 28
4 252 8.8 51 162 5.8 33 152 31
5 274 8.5 58 170 5.4 36 162 34
6 283 8.1 64 169 5.0 38 163 37
7 292 7.6 71 165 4.5 40 160 39
8 305 7.1 82 162 4.0 43 158 42
9 329 6.5 97 156 3.3 46 154 45
10 643 5.5 212 152 2.2 50 151 50
Average 299 8.0 66 159 5.1 35 150 33
mo – month; HH – households; p.c. – per capita. 1 Percentage share of total monthly household expenditure. 2 Based on cash expenditures only
3.39 The faster decline of reliance on biomass, the much lower availability of free biomass, and the much higher cash expenditures on household fuels (excluding electricity) in urban than in rural areas all point to the much greater potential for promoting a shift to cleaner commercial fuels among urban households. At the same time, and precisely because there is much greater reliance on subsidized fuels for cooking, urban households may be affected more by subsidy elimination. This question will be examined in the next chapter.