Embed Size (px)
Citation preview
Household Energy and Indoor Particulate PollHousehold Energy and Indoor Particulate Pollution—Investigation and Measurement at Villaution—Investigation and Measurement at Villa
ges-in-town of Taiyuan, Chinages-in-town of Taiyuan, China
Li Hongge and Fang Jinghua
Taiyuan University of Technology
Taiyuan, Shanxi, China
Workshop in Oslo, Norway
2004.10.17-19
BackgroundBackground Great efforts put into fighting air pollution in Taiyuan i
n the past decade. In the central part of the city, town-gas covered 77.5% residents and 63.5% of the total constructed area were heated by co-generations and district boiler houses.
Significant progress in improving air quality. PM10 from 0.349 mg/m3 in 1992 to 0.172 mg/m3 in 2003 and SO2 from 0.331 mg/m3 in 1992 to 0.099 mg/m3 in 2003. Ranking from No.1 in 47 cities in 1998-2000 to No.21 in 105 cities in 2003.
Air quality is still poor in terms of National Standard 2nd class (PM10-0.10 mg/m3; SO2-0.06 mg/m3 )
Most attention has been put to control emissions from industrial pollution sources since long
Emissions from widely scattered low-height chimneys in so-called “villages-in-town” are now believed one of the main reasons for the severe air quality.
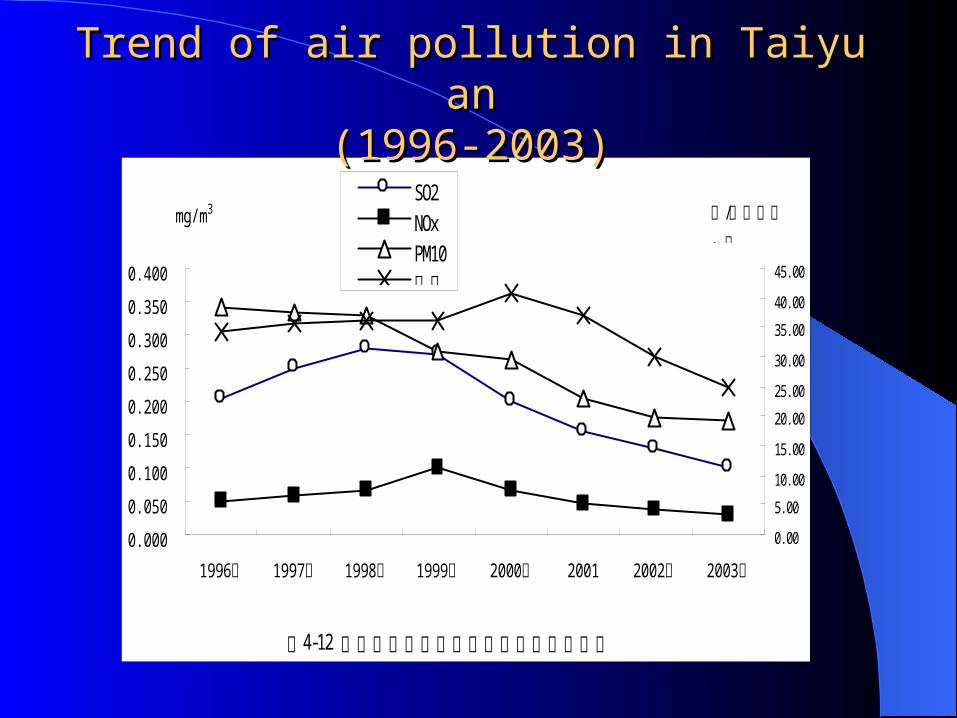
图4-12 太原市环境空气污染物浓度年际变化图
0. 000
0. 050
0. 100
0. 150
0. 200
0. 250
0. 300
0. 350
0. 400
1996年 1997年 1998年 1999年 2000年 2001 2002年 2003年
0. 00
5. 00
10. 00
15. 00
20. 00
25. 00
30. 00
35. 00
40. 00
45. 00
SO2NOxPM10降尘
mg/ m3 吨/平方公里· 月
Trend of air pollution in TaiyuanTrend of air pollution in Taiyuan(1996-2003)(1996-2003)
Investigation on Villages-in-townInvestigation on Villages-in-town The Great Taiyuan consists of 6 districts, 3 counties and
1 sub-city, covering 6988 km2 and residing 3.3 million people.
The area of 6 districts is commonly called Taiyuan city, covering 1460 km2 with population of 2.46 million plus temporary moving-in people of 0.239 million, who are mostly farmer-workers.
In the central part of Taiyuan of 197 km2, there are 75 so-called “villages-in-town”with area of 88 km2 and population of 117324. Among the 75, there are 31 villages fully surrounded by urban construction, covering 22.2 km2 and residing 52773 villagers plus moving-in population of about 150,000.
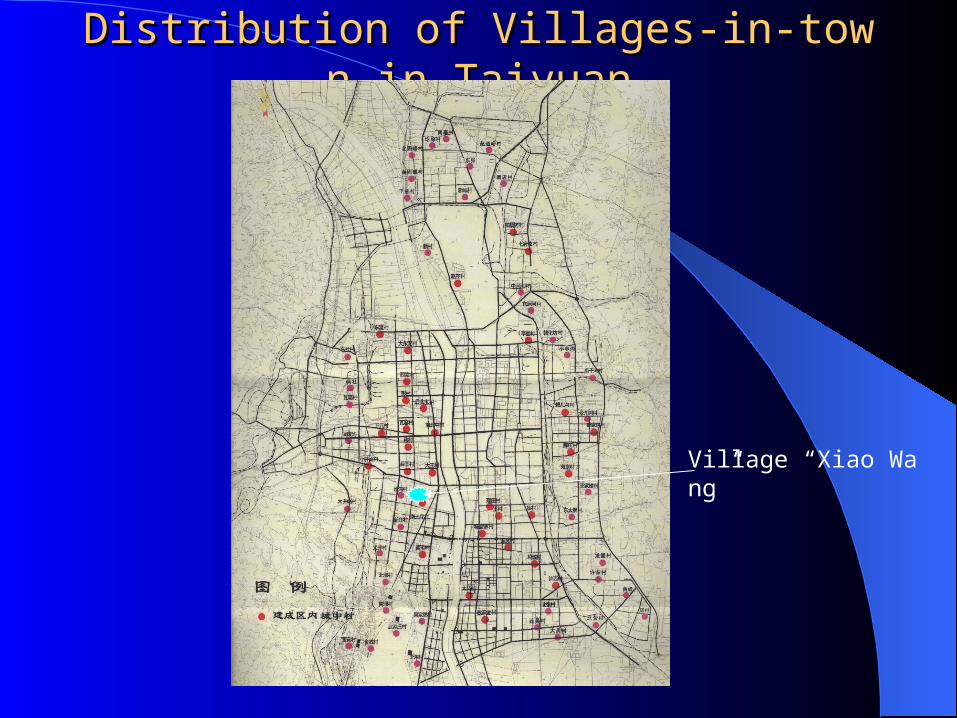
Distribution of Villages-in-town in TaiyuanDistribution of Villages-in-town in Taiyuan
Village “Xiao Wang”
Investigation on Villages-in-town (cont.)Investigation on Villages-in-town (cont.) Villages-in-town are the result of the long-term dual-
structure policy (separation between urban and rural residents) and rapid urbanization
Rich and Poor phenomena in the villages Rich as income and space occupied: The average income (about RMB11,000) of the villagers is higher than
common citizens ( not as in the previous decades). The main source of income is from services section, such as land rent,
room rent, business of restaurants and retails, small processing, transportation, etc.
Agriculture becomes less and less important. Lager part of households have retrofitted their own yards ( around 250-
350 m2) into 3-6 story buildings with 20 to 60 rooms for rent. ( joke: changing their job from planting crops into planting rooms)
Advanced positions of the villages, convenient transportation and utility.
Investigation on Villages-in-town (cont.)Investigation on Villages-in-town (cont.)
Poor as surroundings and social position: Illegal construction has been continuing Crowded living space: “well-like buildings”and “hands-
shaking buildings”, Dusty alley, dirt road, mess piled coal and construction
material, noisy, unsuitable planning for construction Bad habits: smoking, spitting, short schooling… Some unhealthy and unsafe phenomena: gambling, drug,
prostitute, and even criminal Kind of narrow-mind, lazy and greedy, local accent and
dialect, interiority complex Poor management in the community

Household energy and air quality Household energy and air quality in the villagesin the villages
Most of households use LPG for their cooking, some still use raw coal or honeycomb briquette for cooking.
All household use raw coal for heating in the winter Each household has one small indigenous boiler burning
raw coal for heating their family and guests. The boiler consumes more coal because of low efficiency
and pollutes the air seriously due to burning dirty fuel and low-height chimney and without any cleaning device.
The air quality in the area of the villages is clearly lower than common place of the city, especially in the winter.
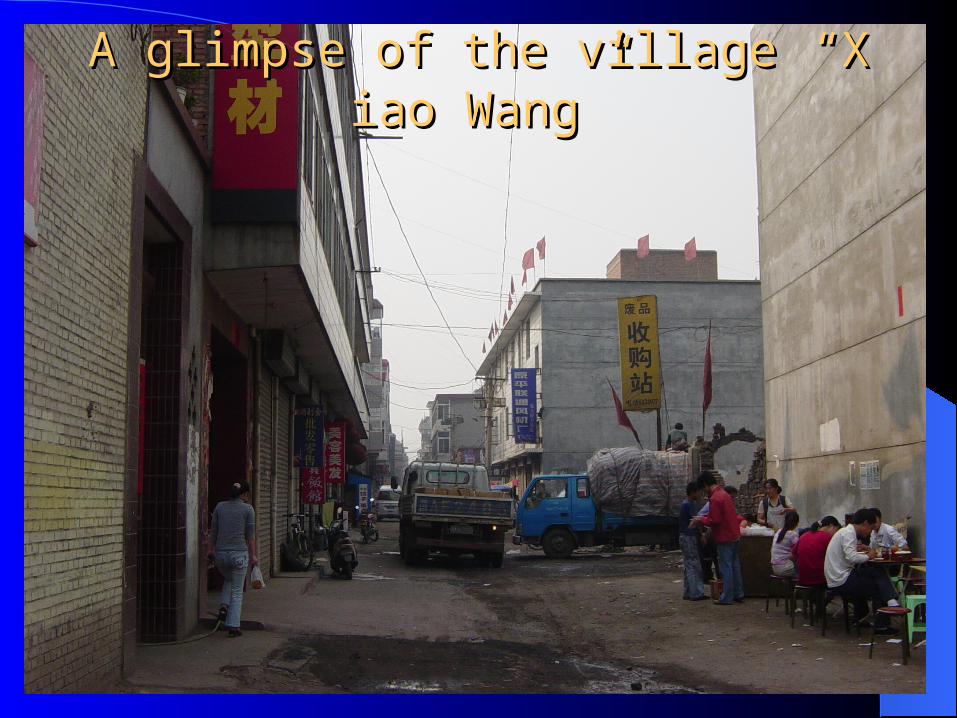
A glimpse of the villageA glimpse of the village “Xiao Wang”“Xiao Wang”
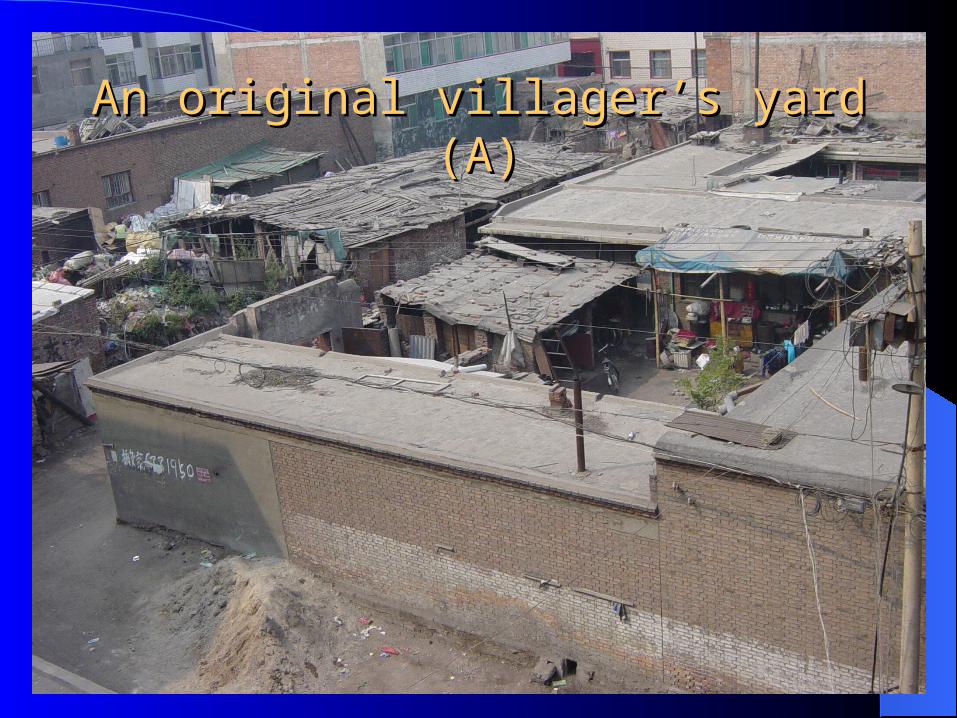
An original villager’s yard(A)An original villager’s yard(A)
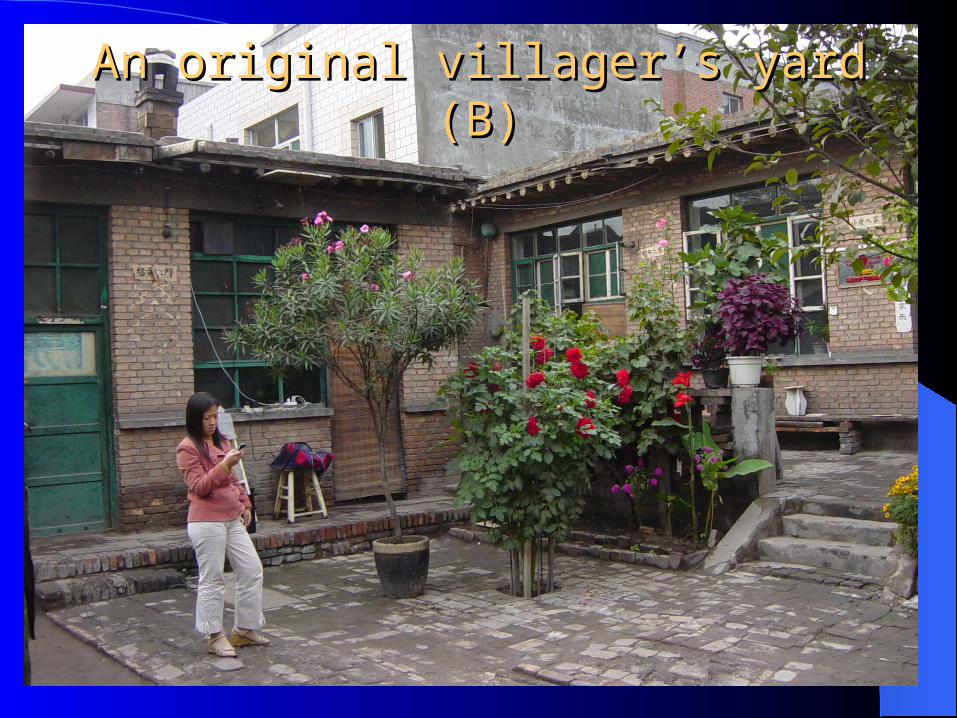
An original villager’s yard(B)An original villager’s yard(B)
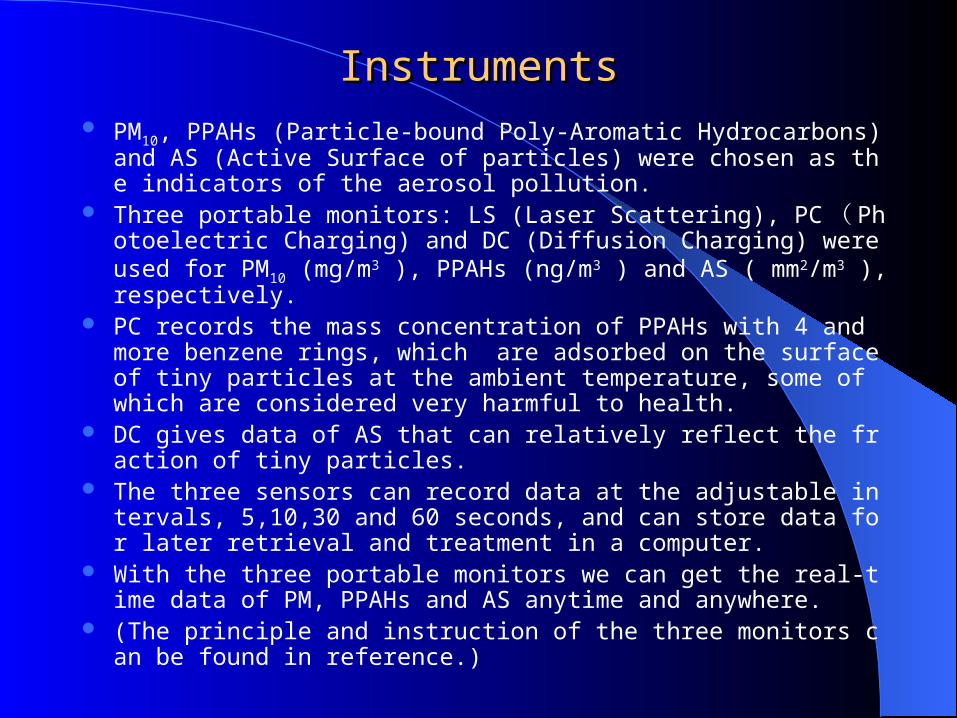
InstrumentsInstruments PM10, PPAHs (Particle-bound Poly-Aromatic Hydrocarbons) and AS (A
ctive Surface of particles) were chosen as the indicators of the aerosol pollution.
Three portable monitors: LS (Laser Scattering), PC( Photoelectric Charging) and DC (Diffusion Charging) were used for PM10 (mg/m3 ), PPAHs (ng/m3 ) and AS ( mm2/m3 ), respectively.
PC records the mass concentration of PPAHs with 4 and more benzene rings, which are adsorbed on the surface of tiny particles at the ambient temperature, some of which are considered very harmful to health.
DC gives data of AS that can relatively reflect the fraction of tiny particles.
The three sensors can record data at the adjustable intervals, 5,10,30 and 60 seconds, and can store data for later retrieval and treatment in a computer.
With the three portable monitors we can get the real-time data of PM, PPAHs and AS anytime and anywhere.
(The principle and instruction of the three monitors can be found in reference.)
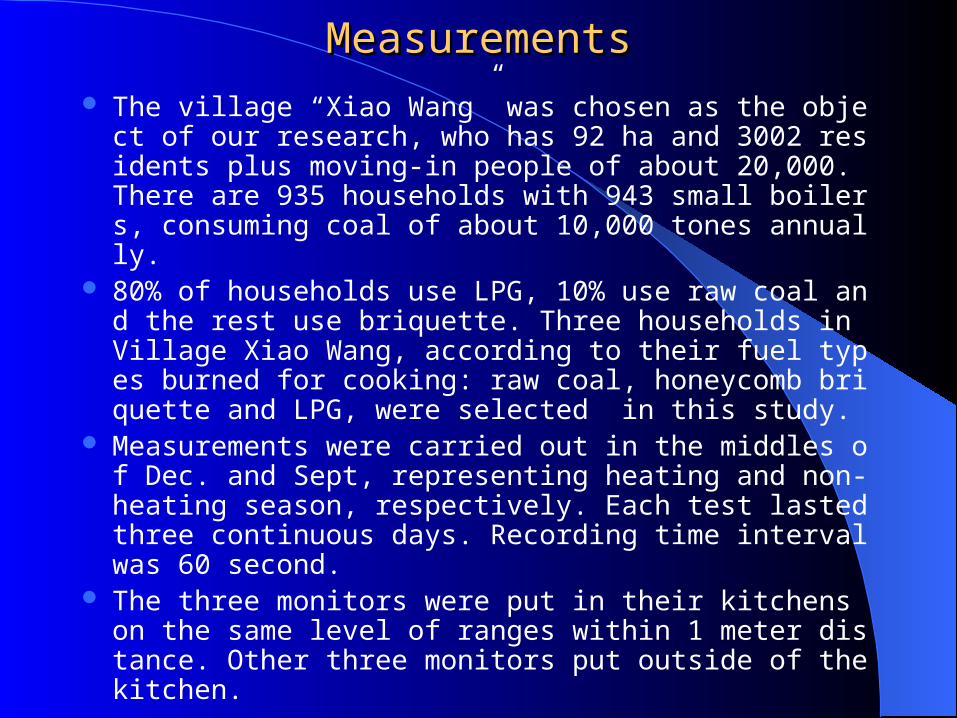
MeasurementsMeasurements
The village “Xiao Wang” was chosen as the object of our research, who has 92 ha and 3002 residents plus moving-in people of about 20,000. There are 935 households with 943 small boilers, consuming coal of about 10,000 tones annually.
80% of households use LPG, 10% use raw coal and the rest use briquette. Three households in Village Xiao Wang, according to their fuel types burned for cooking: raw coal, honeycomb briquette and LPG, were selected in this study.
Measurements were carried out in the middles of Dec. and Sept, representing heating and non-heating season, respectively. Each test lasted three continuous days. Recording time interval was 60 second.
The three monitors were put in their kitchens on the same level of ranges within 1 meter distance. Other three monitors put outside of the kitchen.
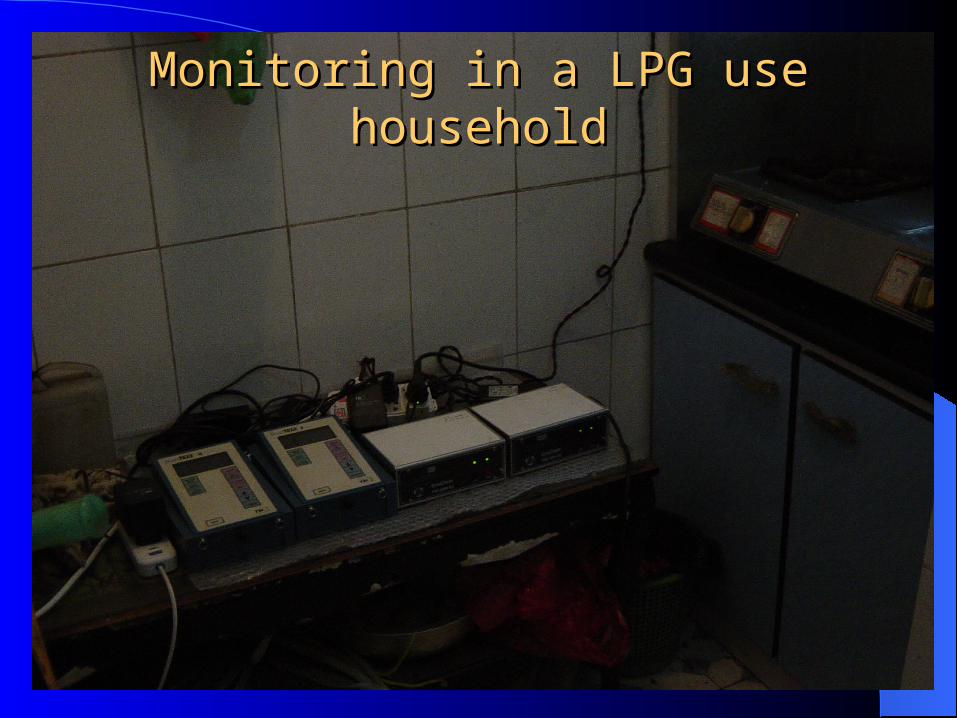
Monitoring in a LPG use householdMonitoring in a LPG use household
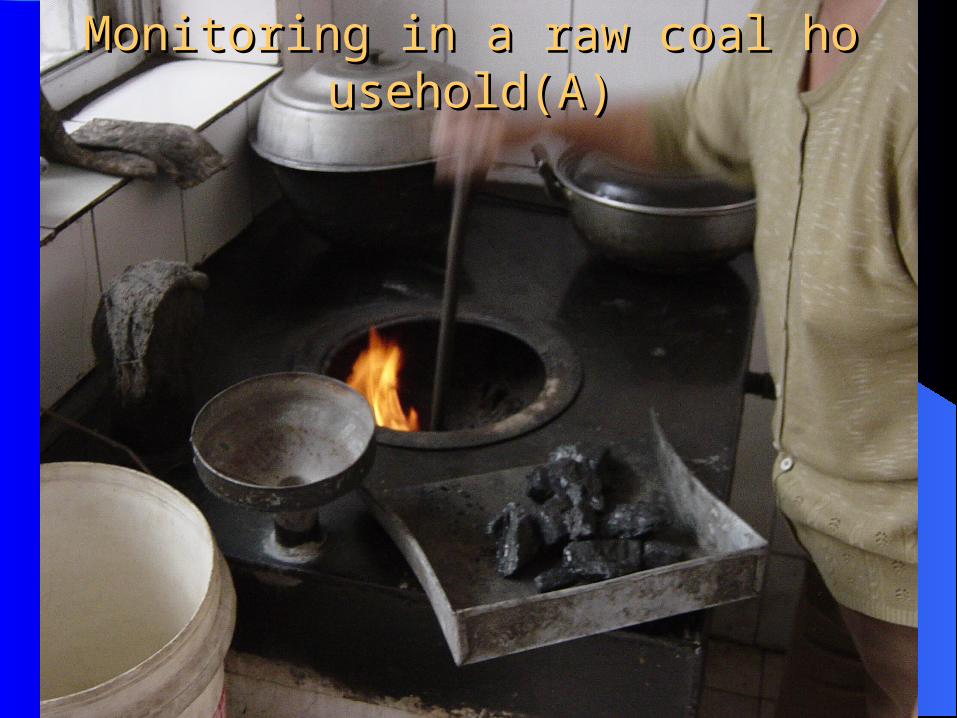
Monitoring in a raw coal householdMonitoring in a raw coal household(A)(A)
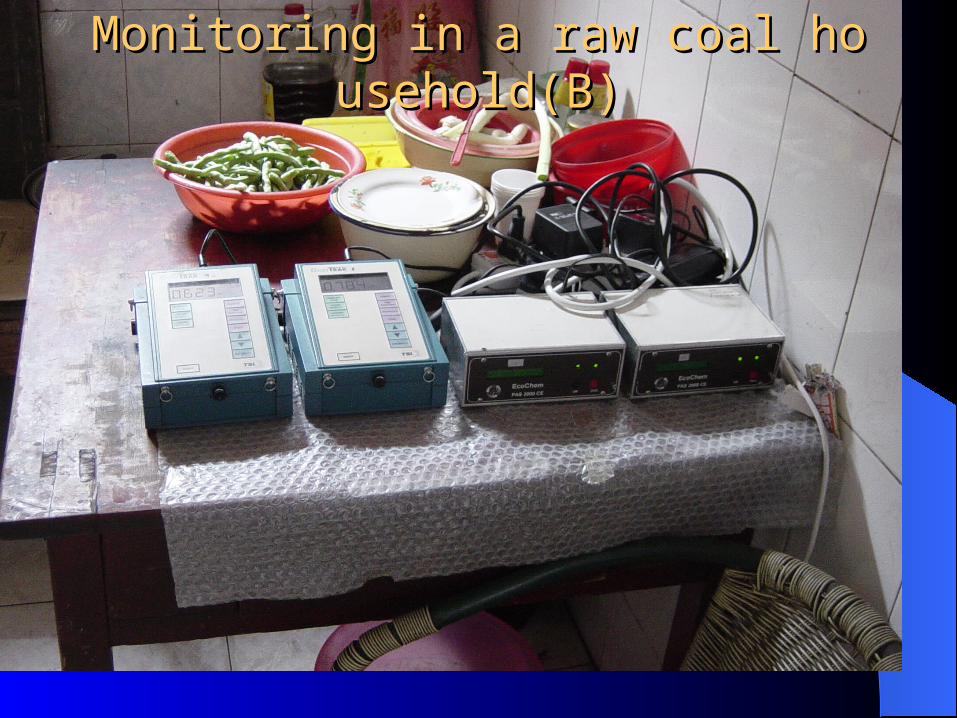
Monitoring in a raw coal householdMonitoring in a raw coal household(B)(B)
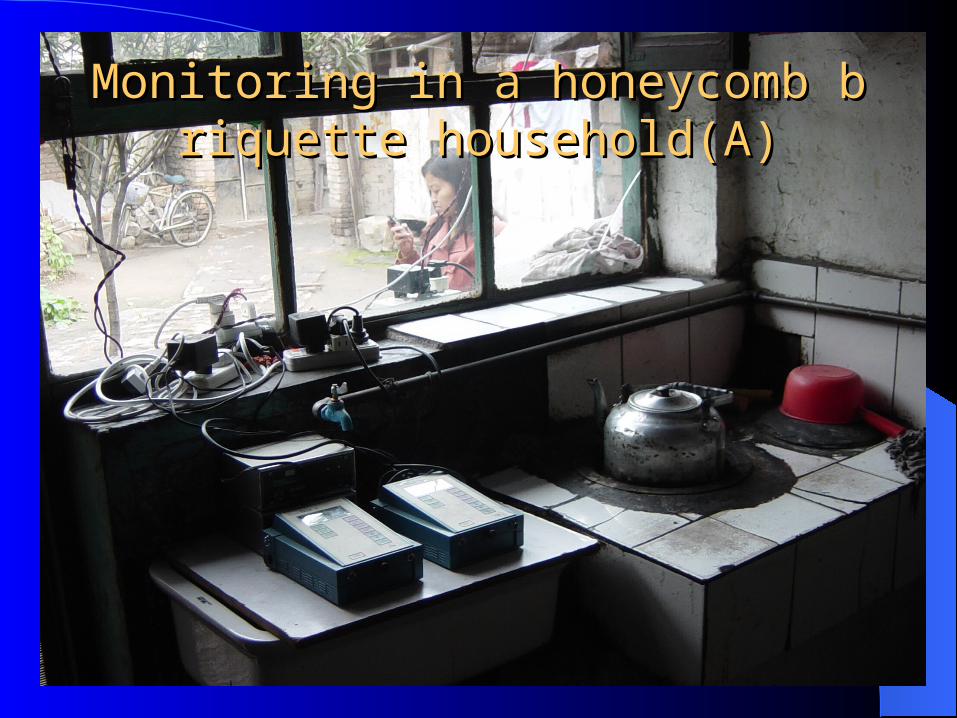
Monitoring in a honeycomb briquette Monitoring in a honeycomb briquette household(A)household(A)
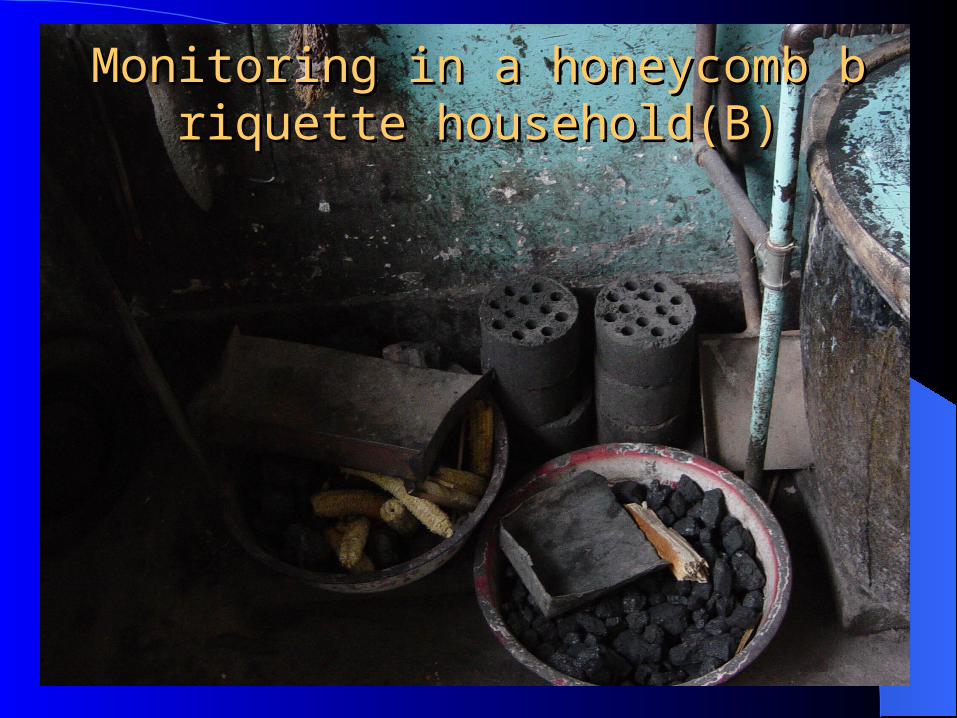
Monitoring in a honeycomb briquette Monitoring in a honeycomb briquette household(B)household(B)
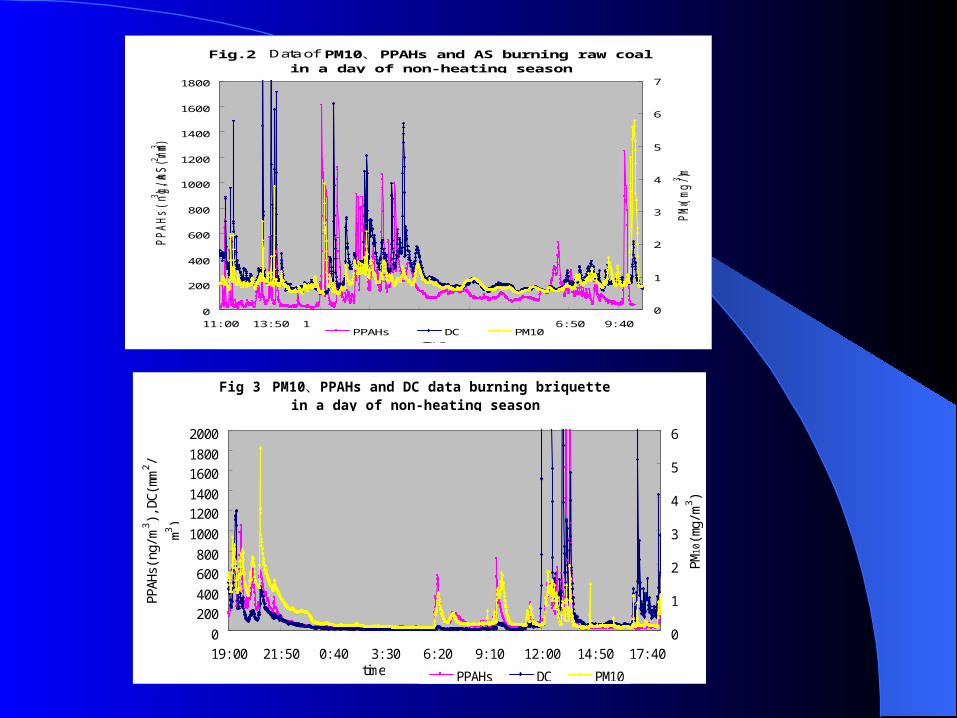
Fi g. 2 Data of PM10 PPAHs and AS burni ng raw coal、i n a day of non-heati ng season
0
200
400
600
800
1000
1200
1400
1600
1800
11: 00 13: 50 16: 40 19: 30 22: 20 1: 10 4: 00 6: 50 9: 40
time
PPAHs(ng/m
3 ),AS(mm
2 /m3 )
0
1
2
3
4
5
6
7
PM 1
0(mg/m
3 )
PPAHs DC PM10
Fi g 3 PM10 PPAHs and DC data burni ng bri quette、i n a day of non- heat i ng season
0
200400
600800
1000
12001400
16001800
2000
19: 00 21: 50 0: 40 3: 30 6: 20 9: 10 12: 00 14: 50 17: 40time
PPAH
s(ng
/m3 ),
DC(m
m2 /
m3 )
0
1
2
3
4
5
6
PM10
(mg/
m3 )
PPAHs DC PM10
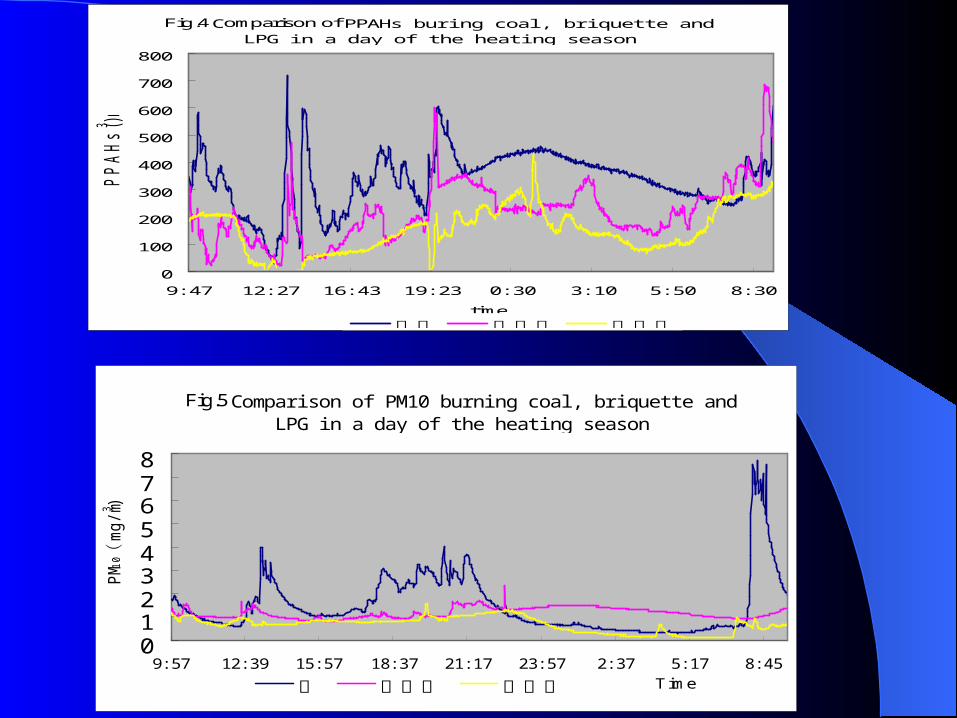
Fig.4 Comparison of PPAHs bur i ng coal , br i quet te andLPG i n a day of the heat i ng season
0
100
200
300
400
500
600
700
800
9: 47 12: 27 16: 43 19: 23 0: 30 3: 10 5: 50 8: 30
time
PPAHs(ng/m
3 )
散煤 蜂窝煤 液化气
Fig.5 Compar i son of PM10 burni ng coal , br i quet te andLPG i n a day of the heat i ng season
012345678
9: 57 12: 39 15: 57 18: 37 21: 17 23: 57 2: 37 5: 17 8: 45Time
PM 1
0mg/m
(3 )
炭 蜂窝煤 液化气
FuelPM10( mg/m3) PPAHs(ng/m3)
AVE. MAX. MIN. ( outdoor) AVE. AVE. MAX. MIN.
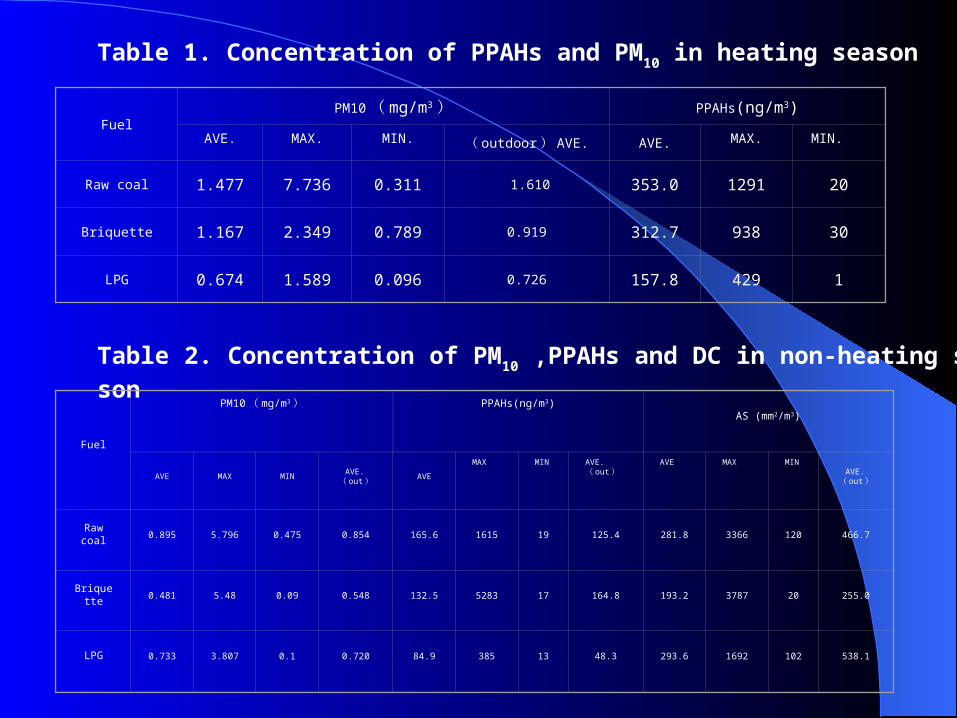
Raw coal 1.477 7.736 0.311 1.610 353.0 1291 20
Briquette 1.167 2.349 0.789 0.919 312.7 938 30
LPG 0.674 1.589 0.096 0.726 157.8 429 1
Table 1. Concentration of PPAHs and PM10 in heating season
Table 2. Concentration of PM10 ,PPAHs and DC in non-heating season
Fuel
PM10( mg/m3) PPAHs(ng/m3)AS (mm2/m3)
AVE MAX MINAVE.( out) AVE
MAX MIN AVE.( out)
AVE MAX MINAVE.( out)
Raw coal 0.895 5.796 0.475 0.854 165.6 1615 19 125.4 281.8 3366 120 466.7
Briquette 0.481 5.48 0.09 0.548 132.5 5283 17 164.8 193.2 3787 20 255.0
LPG 0.733 3.807 0.1 0.720 84.9 385 13 48.3 293.6 1692 102 538.1
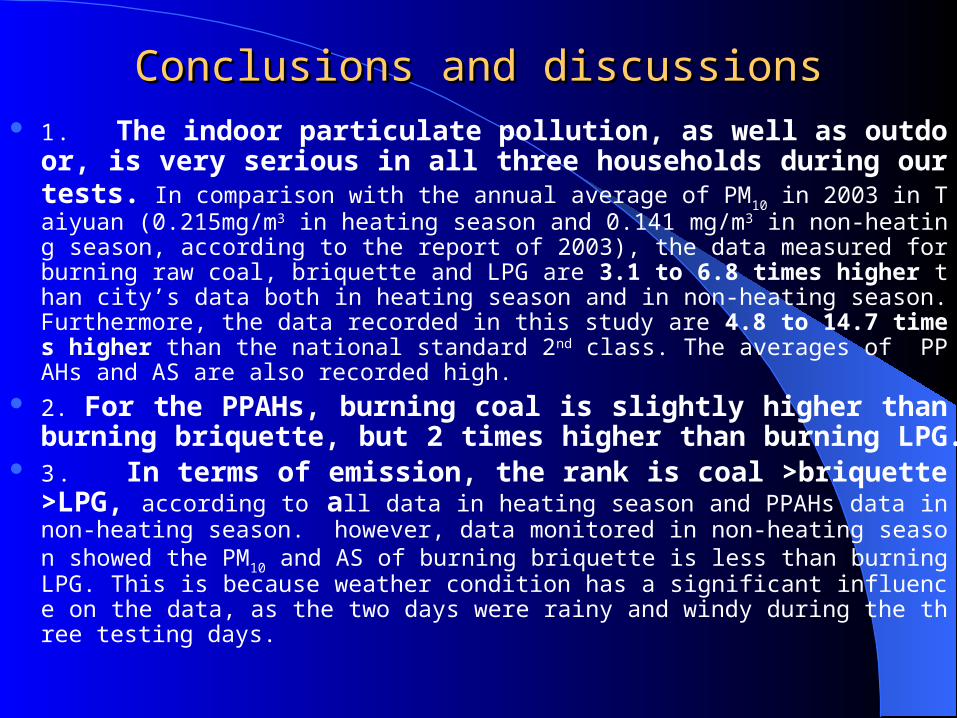
Conclusions and discussionsConclusions and discussions 1. The indoor particulate pollution, as well as outdoor, is very s
erious in all three households during our tests. In comparison with the annual average of PM10 in 2003 in Taiyuan (0.215mg/m3 in heating season and 0.141 mg/m3 in non-heating season, according to the report of 2003), the data measured for burning raw coal, briquette and LPG are 3.1 to 6.8 times higher than city’s data both in heating season and in non-heating season. Furthermore, the data recorded in this study are 4.8 to 14.7 times higher than the national standard 2nd class. The averages of PPAHs and AS are also recorded high.
2. For the PPAHs, burning coal is slightly higher than burning briquette, but 2 times higher than burning LPG.
3. In terms of emission, the rank is coal >briquette >LPG, according to all data in heating season and PPAHs data in non-heating season. however, data monitored in non-heating season showed the PM10 and AS of burning briquette is less than burning LPG. This is because weather condition has a significant influence on the data, as the two days were rainy and windy during the three testing days.
Conclusions and discussions (cont.)Conclusions and discussions (cont.)
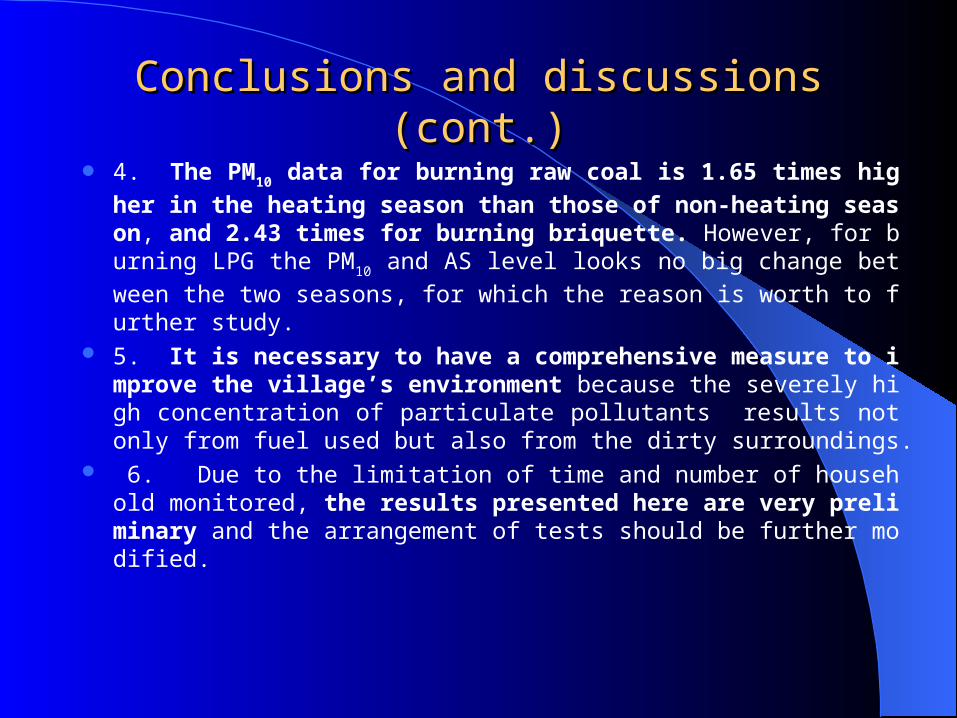
4. The PM10 data for burning raw coal is 1.65 times higher in the he
ating season than those of non-heating season, and 2.43 times for burning briquette. However, for burning LPG the PM10 and AS level look
s no big change between the two seasons, for which the reason is worth to further study.
5. It is necessary to have a comprehensive measure to improve the village’s environment because the severely high concentration of particulate pollutants results not only from fuel used but also from the dirty surroundings.
6. Due to the limitation of time and number of household monitored, the results presented here are very preliminary and the arrangement of tests should be further modified.

Further work in this winterFurther work in this winter Continue the ongoing measurements on household energy
and aerosol pollutants in the three households Monitor the aerosol pollutants in a village and a nearby
place at the same time to compare the air pollutions between areas of villages-in-town and common places of the city
Find the real influence of household coal-firing boilers on local environment.
Evaluate the impact of household energy policy to local and global environment based on our measurements and other researches in China.

Thank youThank you