Embed Size (px)
Citation preview
H
Ta
b
c
a
ARA
KISSNS
C
l2
(
1d
Renewable and Sustainable Energy Reviews 15 (2011) 3178–3186
Contents lists available at ScienceDirect
Renewable and Sustainable Energy Reviews
journa l homepage: www.e lsev ier .com/ locate / rser
otspots of solar potential in India
.V. Ramachandraa,b,c,∗, Rishabh Jaina, Gautham Krishnadasa
Energy & Wetlands Research Group, Centre for Ecological Sciences [CES], Indian Institute of Science, Bangalore, Karnataka 560 012, IndiaCentre for Sustainable Technologies Centre (astra), Indian Institute of Science, Bangalore, Karnataka 560 012, IndiaCentre for infrastructure, Sustainable Transportation and Urban Planning [CiSTUP], Indian Institute of Science, Bangalore, Karnataka 560 012, India
r t i c l e i n f o
rticle history:eceived 6 March 2011ccepted 7 April 2011
eywords:ndiaolar hotspotsolar resource potentialational Solar Mission
a b s t r a c t
Solar hotspots are the regions characterized by an exceptional solar power potential suitable for decen-tralized commercial exploitation of energy. Identification of solar hotspots in a vast geographicalexpanse with dense habitations helps to meet escalating power demand in a decentralized, effi-cient and sustainable manner. This communication focuses on the assessment of resource potentialwith variability in India derived from high resolution satellite derived insolation data. Data analysisreveals that nearly 58% of the geographical area potentially represent the solar hotspots in the coun-try with more than 5 kWh/m2/day of annual average Global insolation. A techno-economic analysisof the solar power technologies and a prospective minimal utilization of the land available within
olar power generation these solar hotspots demonstrate their immense power generation as well as emission reductionpotential. The study evaluates the progress made in solar power generation in the country espe-cially with the inception of an ambitious National Solar Mission (NSM) also termed as ‘Solar India’.The organizational aspects of solar power generation with focus on existing policy elements are alsoaddressed so as to probe the actual potential of the identified solar hotspots in meeting the NSM targetsand beyond.
© 2011 Elsevier Ltd. All rights reserved.
ontents
1. Introduction . . . . . . . . . . . . . . . . . . . . . . . . . . . . . . . . . . . . . . . . . . . . . . . . . . . . . . . . . . . . . . . . . . . . . . . . . . . . . . . . . . . . . . . . . . . . . . . . . . . . . . . . . . . . . . . . . . . . . . . . . . . . . . . . . . . . . . . . . . 31781.1. Need to identify solar hotspots in India . . . . . . . . . . . . . . . . . . . . . . . . . . . . . . . . . . . . . . . . . . . . . . . . . . . . . . . . . . . . . . . . . . . . . . . . . . . . . . . . . . . . . . . . . . . . . . . . . . . . . . 31791.2. Solar resource potential assessment . . . . . . . . . . . . . . . . . . . . . . . . . . . . . . . . . . . . . . . . . . . . . . . . . . . . . . . . . . . . . . . . . . . . . . . . . . . . . . . . . . . . . . . . . . . . . . . . . . . . . . . . . 3179
2. Objective . . . . . . . . . . . . . . . . . . . . . . . . . . . . . . . . . . . . . . . . . . . . . . . . . . . . . . . . . . . . . . . . . . . . . . . . . . . . . . . . . . . . . . . . . . . . . . . . . . . . . . . . . . . . . . . . . . . . . . . . . . . . . . . . . . . . . . . . . . . . . 31803. Methodology . . . . . . . . . . . . . . . . . . . . . . . . . . . . . . . . . . . . . . . . . . . . . . . . . . . . . . . . . . . . . . . . . . . . . . . . . . . . . . . . . . . . . . . . . . . . . . . . . . . . . . . . . . . . . . . . . . . . . . . . . . . . . . . . . . . . . . . . . 31804. Results . . . . . . . . . . . . . . . . . . . . . . . . . . . . . . . . . . . . . . . . . . . . . . . . . . . . . . . . . . . . . . . . . . . . . . . . . . . . . . . . . . . . . . . . . . . . . . . . . . . . . . . . . . . . . . . . . . . . . . . . . . . . . . . . . . . . . . . . . . . . . . . . 3181
4.1. Techno-economic feasibility of solar energy. . . . . . . . . . . . . . . . . . . . . . . . . . . . . . . . . . . . . . . . . . . . . . . . . . . . . . . . . . . . . . . . . . . . . . . . . . . . . . . . . . . . . . . . . . . . . . . . . 31824.2. Prospects of solar power in India . . . . . . . . . . . . . . . . . . . . . . . . . . . . . . . . . . . . . . . . . . . . . . . . . . . . . . . . . . . . . . . . . . . . . . . . . . . . . . . . . . . . . . . . . . . . . . . . . . . . . . . . . . . . 31834.3. Organizational aspects of solar power generation in India . . . . . . . . . . . . . . . . . . . . . . . . . . . . . . . . . . . . . . . . . . . . . . . . . . . . . . . . . . . . . . . . . . . . . . . . . . . . . . . . . . 3185
5. Social aspects . . . . . . . . . . . . . . . . . . . . . . . . . . . . . . . . . . . . . . . . . . . . . . . . . . . . . . . . . . . . . . . . . . . . . . . . . . . . . . . . . . . . . . . . . . . . . . . . . . . . . . . . . . . . . . . . . . . . . . . . . . . . . . . . . . . . . . . . . 31856. Conclusion. . . . . . . . . . . . . . . . . . . . . . . . . . . . . . . . . . . . . . . . . . . . . . . . . . . . . . . . . . . . . . . . . . . . . . . . . . . . . . . . . . . . . . . . . . . . . . . . . . . . . . . . . . . . . . . . . . . . . . . . . . . . . . . . . . . . . . . . . . . . 3185
Acknowledgements . . . . . . . . . . . . . . . . . . . . . . . . . . . . . . . . . . . . . . . . . . . . . . . . . . . . . . . . . . . . . . . . . . . . . . . . . . . . . . . . . . . . . . . . . . . . . . . . . . . . . . . . . . . . . . . . . . . . . . . . . . . . . . . . . . 3185References . . . . . . . . . . . . . . . . . . . . . . . . . . . . . . . . . . . . . . . . . . . . . . . . . . . . . . . . . . . . . . . . . . . . . . . . . . . . . . . . . . . . . . . . . . . . . . . . . . . . . . . . . . . . . . . . . . . . . . . . . . . . . . . . . . . . . . . . . . . 3186
∗ Corresponding author at: Energy & Wetland Research Group, Centre for Eco-ogical Sciences, Indian Institute of Science, Bangalore 560012, India. Tel.: +91 0803600985/2293 3099/2293 2506; fax: +91 080 23601428/23600085/23600683.
E-mail addresses: [email protected], [email protected]. Ramachandra).
URL: http://ces.iisc.ernet.in/energy (T.V. Ramachandra).
364-0321/$ – see front matter © 2011 Elsevier Ltd. All rights reserved.oi:10.1016/j.rser.2011.04.007
1. Introduction
Life on earth is heliocentric as most of its energy is derivedfrom the sun. Imminent climatic changes and the demand for clean
energy sources have induced significant global interest in solarenergy. It has been observed that, solar as viable alternative forpower generation among the available clean energy sources hasthe highest global warming mitigation potential [1].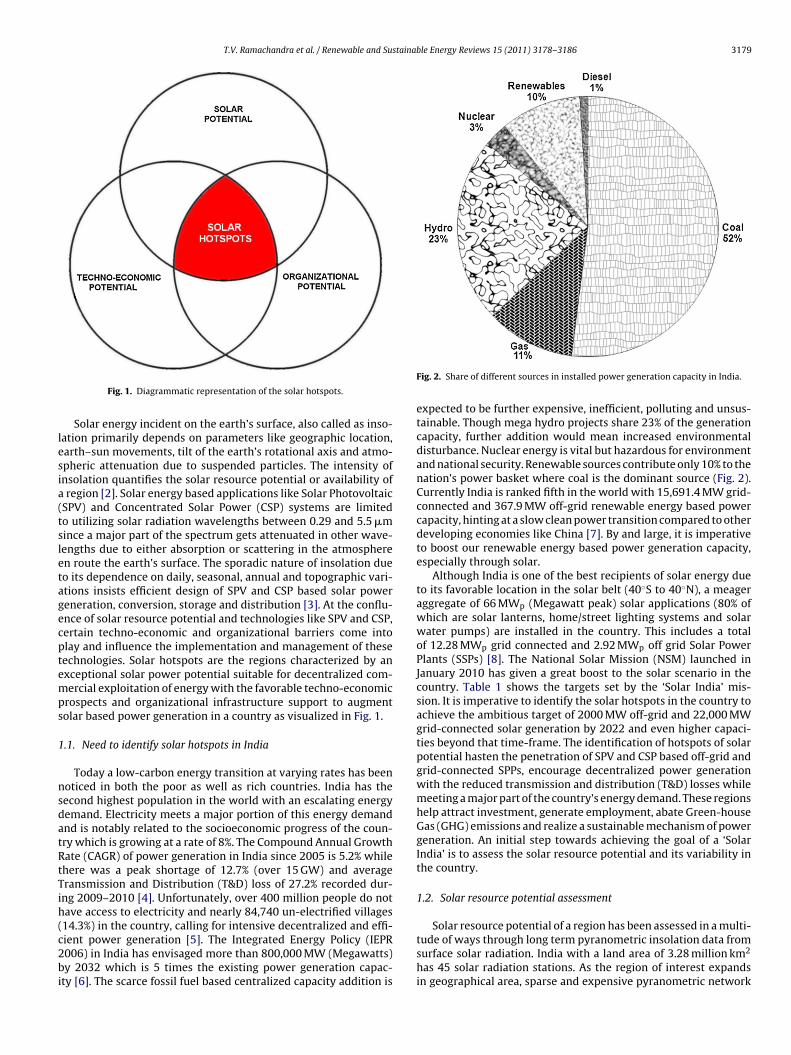
T.V. Ramachandra et al. / Renewable and Sustainable Energy Reviews 15 (2011) 3178–3186 3179
lesia(tsletagecptemps
1
nsdatRtTih(c2bi
Fig. 1. Diagrammatic representation of the solar hotspots.
Solar energy incident on the earth’s surface, also called as inso-ation primarily depends on parameters like geographic location,arth–sun movements, tilt of the earth’s rotational axis and atmo-pheric attenuation due to suspended particles. The intensity ofnsolation quantifies the solar resource potential or availability ofregion [2]. Solar energy based applications like Solar Photovoltaic
SPV) and Concentrated Solar Power (CSP) systems are limitedo utilizing solar radiation wavelengths between 0.29 and 5.5 �mince a major part of the spectrum gets attenuated in other wave-engths due to either absorption or scattering in the atmospheren route the earth’s surface. The sporadic nature of insolation dueo its dependence on daily, seasonal, annual and topographic vari-tions insists efficient design of SPV and CSP based solar powereneration, conversion, storage and distribution [3]. At the conflu-nce of solar resource potential and technologies like SPV and CSP,ertain techno-economic and organizational barriers come intolay and influence the implementation and management of theseechnologies. Solar hotspots are the regions characterized by anxceptional solar power potential suitable for decentralized com-ercial exploitation of energy with the favorable techno-economic
rospects and organizational infrastructure support to augmentolar based power generation in a country as visualized in Fig. 1.
.1. Need to identify solar hotspots in India
Today a low-carbon energy transition at varying rates has beenoticed in both the poor as well as rich countries. India has theecond highest population in the world with an escalating energyemand. Electricity meets a major portion of this energy demandnd is notably related to the socioeconomic progress of the coun-ry which is growing at a rate of 8%. The Compound Annual Growthate (CAGR) of power generation in India since 2005 is 5.2% whilehere was a peak shortage of 12.7% (over 15 GW) and averageransmission and Distribution (T&D) loss of 27.2% recorded dur-ng 2009–2010 [4]. Unfortunately, over 400 million people do notave access to electricity and nearly 84,740 un-electrified villages14.3%) in the country, calling for intensive decentralized and effi-
ient power generation [5]. The Integrated Energy Policy (IEPR006) in India has envisaged more than 800,000 MW (Megawatts)y 2032 which is 5 times the existing power generation capac-ty [6]. The scarce fossil fuel based centralized capacity addition is
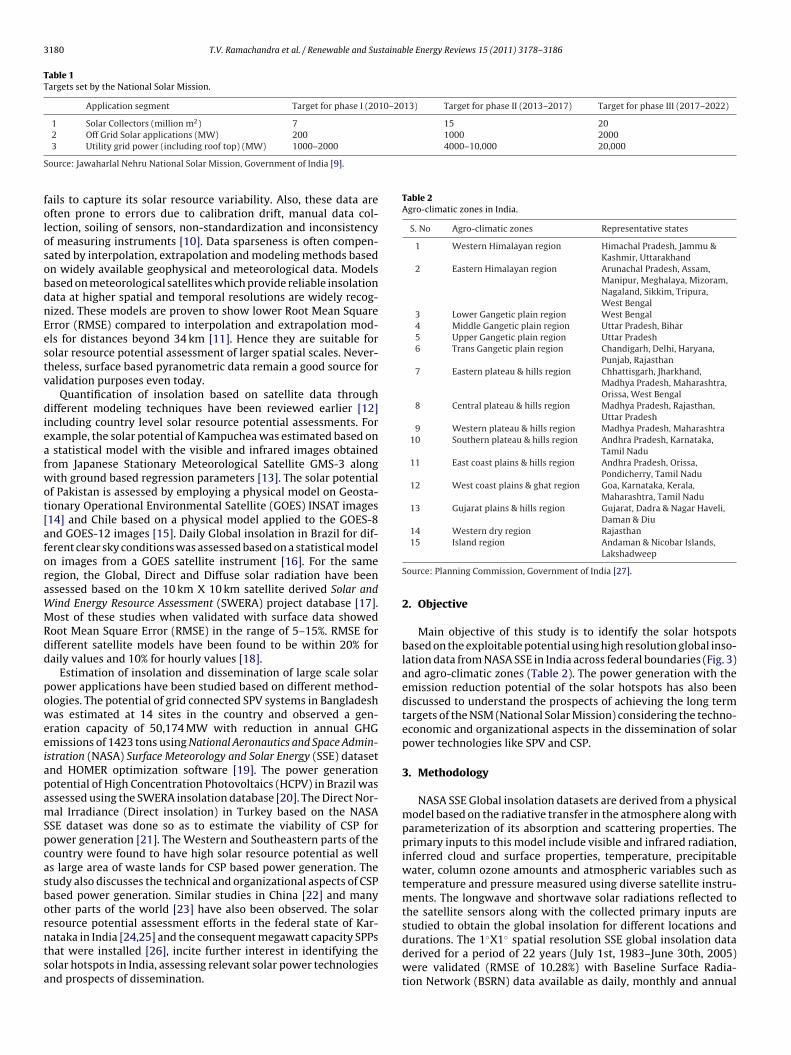
Fig. 2. Share of different sources in installed power generation capacity in India.
expected to be further expensive, inefficient, polluting and unsus-tainable. Though mega hydro projects share 23% of the generationcapacity, further addition would mean increased environmentaldisturbance. Nuclear energy is vital but hazardous for environmentand national security. Renewable sources contribute only 10% to thenation’s power basket where coal is the dominant source (Fig. 2).Currently India is ranked fifth in the world with 15,691.4 MW grid-connected and 367.9 MW off-grid renewable energy based powercapacity, hinting at a slow clean power transition compared to otherdeveloping economies like China [7]. By and large, it is imperativeto boost our renewable energy based power generation capacity,especially through solar.
Although India is one of the best recipients of solar energy dueto its favorable location in the solar belt (40◦S to 40◦N), a meageraggregate of 66 MWp (Megawatt peak) solar applications (80% ofwhich are solar lanterns, home/street lighting systems and solarwater pumps) are installed in the country. This includes a totalof 12.28 MWp grid connected and 2.92 MWp off grid Solar PowerPlants (SSPs) [8]. The National Solar Mission (NSM) launched inJanuary 2010 has given a great boost to the solar scenario in thecountry. Table 1 shows the targets set by the ‘Solar India’ mis-sion. It is imperative to identify the solar hotspots in the country toachieve the ambitious target of 2000 MW off-grid and 22,000 MWgrid-connected solar generation by 2022 and even higher capaci-ties beyond that time-frame. The identification of hotspots of solarpotential hasten the penetration of SPV and CSP based off-grid andgrid-connected SPPs, encourage decentralized power generationwith the reduced transmission and distribution (T&D) losses whilemeeting a major part of the country’s energy demand. These regionshelp attract investment, generate employment, abate Green-houseGas (GHG) emissions and realize a sustainable mechanism of powergeneration. An initial step towards achieving the goal of a ‘SolarIndia’ is to assess the solar resource potential and its variability inthe country.
1.2. Solar resource potential assessment
Solar resource potential of a region has been assessed in a multi-
tude of ways through long term pyranometric insolation data fromsurface solar radiation. India with a land area of 3.28 million km2has 45 solar radiation stations. As the region of interest expandsin geographical area, sparse and expensive pyranometric network
3180 T.V. Ramachandra et al. / Renewable and Sustainable Energy Reviews 15 (2011) 3178–3186
Table 1Targets set by the National Solar Mission.
Application segment Target for phase I (2010–2013) Target for phase II (2013–2017) Target for phase III (2017–2022)
1 Solar Collectors (million m2) 7 15 202 Off Grid Solar applications (MW) 200 1000 2000
4000–10,000 20,000
S
folosobdnEestv
dieafwot[aforaWMRdd
poweeiapamSpcasborntsa
Table 2Agro-climatic zones in India.
S. No Agro-climatic zones Representative states
1 Western Himalayan region Himachal Pradesh, Jammu &Kashmir, Uttarakhand
2 Eastern Himalayan region Arunachal Pradesh, Assam,Manipur, Meghalaya, Mizoram,Nagaland, Sikkim, Tripura,West Bengal
3 Lower Gangetic plain region West Bengal4 Middle Gangetic plain region Uttar Pradesh, Bihar5 Upper Gangetic plain region Uttar Pradesh6 Trans Gangetic plain region Chandigarh, Delhi, Haryana,
Punjab, Rajasthan7 Eastern plateau & hills region Chhattisgarh, Jharkhand,
Madhya Pradesh, Maharashtra,Orissa, West Bengal
8 Central plateau & hills region Madhya Pradesh, Rajasthan,Uttar Pradesh
9 Western plateau & hills region Madhya Pradesh, Maharashtra10 Southern plateau & hills region Andhra Pradesh, Karnataka,
Tamil Nadu11 East coast plains & hills region Andhra Pradesh, Orissa,
Pondicherry, Tamil Nadu12 West coast plains & ghat region Goa, Karnataka, Kerala,
Maharashtra, Tamil Nadu13 Gujarat plains & hills region Gujarat, Dadra & Nagar Haveli,
Daman & Diu14 Western dry region Rajasthan15 Island region Andaman & Nicobar Islands,
3 Utility grid power (including roof top) (MW) 1000–2000
ource: Jawaharlal Nehru National Solar Mission, Government of India [9].
ails to capture its solar resource variability. Also, these data areften prone to errors due to calibration drift, manual data col-ection, soiling of sensors, non-standardization and inconsistencyf measuring instruments [10]. Data sparseness is often compen-ated by interpolation, extrapolation and modeling methods basedn widely available geophysical and meteorological data. Modelsased on meteorological satellites which provide reliable insolationata at higher spatial and temporal resolutions are widely recog-ized. These models are proven to show lower Root Mean Squarerror (RMSE) compared to interpolation and extrapolation mod-ls for distances beyond 34 km [11]. Hence they are suitable forolar resource potential assessment of larger spatial scales. Never-heless, surface based pyranometric data remain a good source foralidation purposes even today.
Quantification of insolation based on satellite data throughifferent modeling techniques have been reviewed earlier [12]
ncluding country level solar resource potential assessments. Forxample, the solar potential of Kampuchea was estimated based onstatistical model with the visible and infrared images obtained
rom Japanese Stationary Meteorological Satellite GMS-3 alongith ground based regression parameters [13]. The solar potential
f Pakistan is assessed by employing a physical model on Geosta-ionary Operational Environmental Satellite (GOES) INSAT images14] and Chile based on a physical model applied to the GOES-8nd GOES-12 images [15]. Daily Global insolation in Brazil for dif-erent clear sky conditions was assessed based on a statistical modeln images from a GOES satellite instrument [16]. For the sameegion, the Global, Direct and Diffuse solar radiation have beenssessed based on the 10 km X 10 km satellite derived Solar andind Energy Resource Assessment (SWERA) project database [17].ost of these studies when validated with surface data showed
oot Mean Square Error (RMSE) in the range of 5–15%. RMSE forifferent satellite models have been found to be within 20% foraily values and 10% for hourly values [18].
Estimation of insolation and dissemination of large scale solarower applications have been studied based on different method-logies. The potential of grid connected SPV systems in Bangladeshas estimated at 14 sites in the country and observed a gen-
ration capacity of 50,174 MW with reduction in annual GHGmissions of 1423 tons using National Aeronautics and Space Admin-stration (NASA) Surface Meteorology and Solar Energy (SSE) datasetnd HOMER optimization software [19]. The power generationotential of High Concentration Photovoltaics (HCPV) in Brazil wasssessed using the SWERA insolation database [20]. The Direct Nor-al Irradiance (Direct insolation) in Turkey based on the NASA
SE dataset was done so as to estimate the viability of CSP forower generation [21]. The Western and Southeastern parts of theountry were found to have high solar resource potential as wells large area of waste lands for CSP based power generation. Thetudy also discusses the technical and organizational aspects of CSPased power generation. Similar studies in China [22] and manyther parts of the world [23] have also been observed. The solaresource potential assessment efforts in the federal state of Kar-
ataka in India [24,25] and the consequent megawatt capacity SPPshat were installed [26], incite further interest in identifying theolar hotspots in India, assessing relevant solar power technologiesnd prospects of dissemination.Lakshadweep
Source: Planning Commission, Government of India [27].
2. Objective
Main objective of this study is to identify the solar hotspotsbased on the exploitable potential using high resolution global inso-lation data from NASA SSE in India across federal boundaries (Fig. 3)and agro-climatic zones (Table 2). The power generation with theemission reduction potential of the solar hotspots has also beendiscussed to understand the prospects of achieving the long termtargets of the NSM (National Solar Mission) considering the techno-economic and organizational aspects in the dissemination of solarpower technologies like SPV and CSP.
3. Methodology
NASA SSE Global insolation datasets are derived from a physicalmodel based on the radiative transfer in the atmosphere along withparameterization of its absorption and scattering properties. Theprimary inputs to this model include visible and infrared radiation,inferred cloud and surface properties, temperature, precipitablewater, column ozone amounts and atmospheric variables such astemperature and pressure measured using diverse satellite instru-ments. The longwave and shortwave solar radiations reflected tothe satellite sensors along with the collected primary inputs arestudied to obtain the global insolation for different locations and
durations. The 1◦X1◦ spatial resolution SSE global insolation dataderived for a period of 22 years (July 1st, 1983–June 30th, 2005)were validated (RMSE of 10.28%) with Baseline Surface Radia-tion Network (BSRN) data available as daily, monthly and annual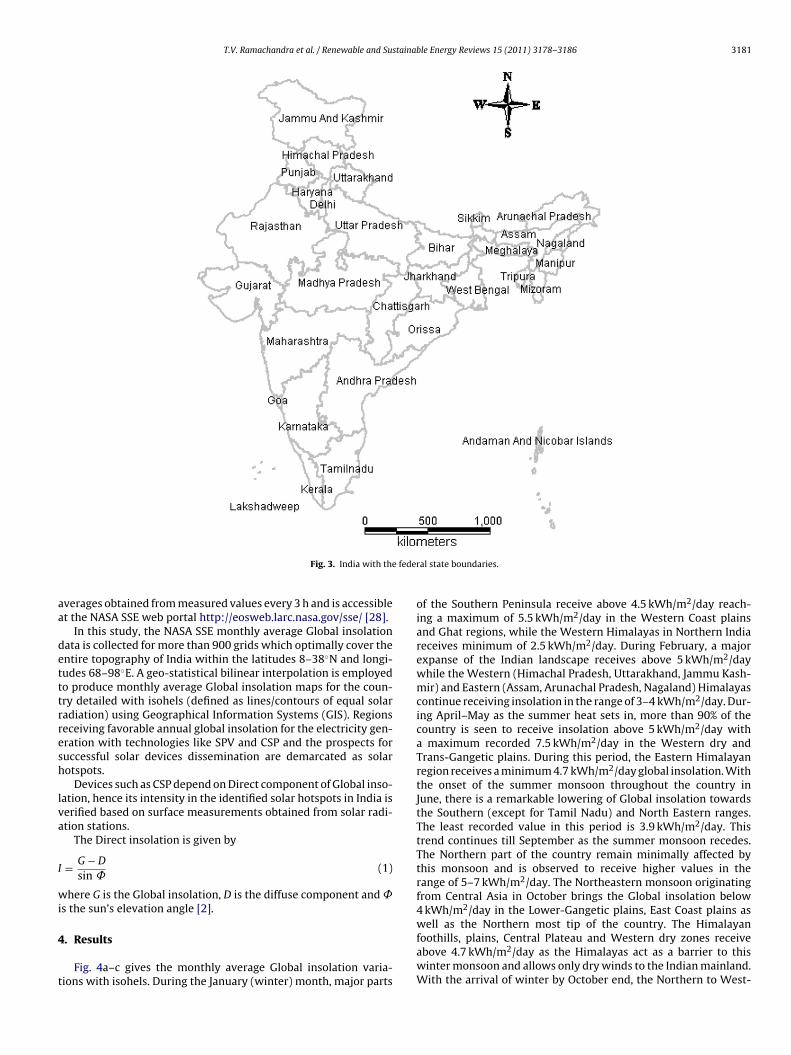
T.V. Ramachandra et al. / Renewable and Sustainable Energy Reviews 15 (2011) 3178–3186 3181
feder
aa
detttrresh
lva
I
wi
4
t
Fig. 3. India with the
verages obtained from measured values every 3 h and is accessiblet the NASA SSE web portal http://eosweb.larc.nasa.gov/sse/ [28].
In this study, the NASA SSE monthly average Global insolationata is collected for more than 900 grids which optimally cover thentire topography of India within the latitudes 8–38◦N and longi-udes 68–98◦E. A geo-statistical bilinear interpolation is employedo produce monthly average Global insolation maps for the coun-ry detailed with isohels (defined as lines/contours of equal solaradiation) using Geographical Information Systems (GIS). Regionseceiving favorable annual global insolation for the electricity gen-ration with technologies like SPV and CSP and the prospects foruccessful solar devices dissemination are demarcated as solarotspots.
Devices such as CSP depend on Direct component of Global inso-ation, hence its intensity in the identified solar hotspots in India iserified based on surface measurements obtained from solar radi-tion stations.
The Direct insolation is given by
= G − D
sin ˚(1)
here G is the Global insolation, D is the diffuse component and ˚s the sun’s elevation angle [2].
. Results
Fig. 4a–c gives the monthly average Global insolation varia-ions with isohels. During the January (winter) month, major parts
al state boundaries.
of the Southern Peninsula receive above 4.5 kWh/m2/day reach-ing a maximum of 5.5 kWh/m2/day in the Western Coast plainsand Ghat regions, while the Western Himalayas in Northern Indiareceives minimum of 2.5 kWh/m2/day. During February, a majorexpanse of the Indian landscape receives above 5 kWh/m2/daywhile the Western (Himachal Pradesh, Uttarakhand, Jammu Kash-mir) and Eastern (Assam, Arunachal Pradesh, Nagaland) Himalayascontinue receiving insolation in the range of 3–4 kWh/m2/day. Dur-ing April–May as the summer heat sets in, more than 90% of thecountry is seen to receive insolation above 5 kWh/m2/day witha maximum recorded 7.5 kWh/m2/day in the Western dry andTrans-Gangetic plains. During this period, the Eastern Himalayanregion receives a minimum 4.7 kWh/m2/day global insolation. Withthe onset of the summer monsoon throughout the country inJune, there is a remarkable lowering of Global insolation towardsthe Southern (except for Tamil Nadu) and North Eastern ranges.The least recorded value in this period is 3.9 kWh/m2/day. Thistrend continues till September as the summer monsoon recedes.The Northern part of the country remain minimally affected bythis monsoon and is observed to receive higher values in therange of 5–7 kWh/m2/day. The Northeastern monsoon originatingfrom Central Asia in October brings the Global insolation below4 kWh/m2/day in the Lower-Gangetic plains, East Coast plains aswell as the Northern most tip of the country. The Himalayan
foothills, plains, Central Plateau and Western dry zones receiveabove 4.7 kWh/m2/day as the Himalayas act as a barrier to thiswinter monsoon and allows only dry winds to the Indian mainland.With the arrival of winter by October end, the Northern to West-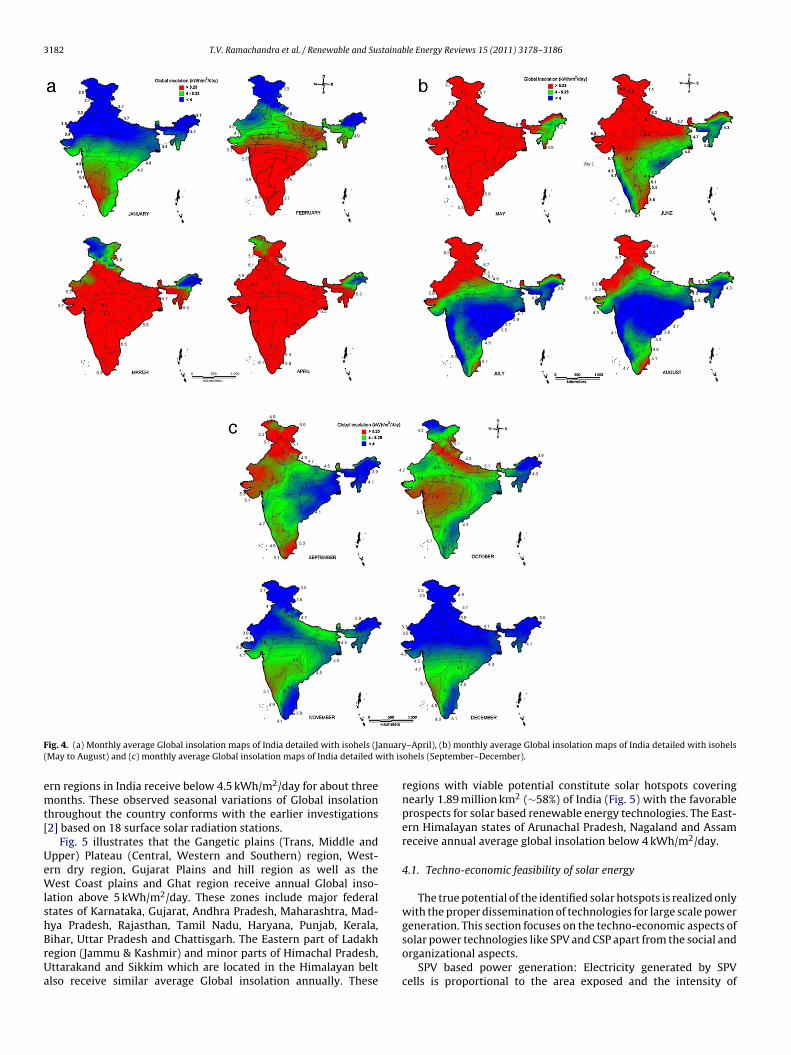
3182 T.V. Ramachandra et al. / Renewable and Sustainable Energy Reviews 15 (2011) 3178–3186
F anuary( ith is
emt[
UeWlshBrUa
ig. 4. (a) Monthly average Global insolation maps of India detailed with isohels (JMay to August) and (c) monthly average Global insolation maps of India detailed w
rn regions in India receive below 4.5 kWh/m2/day for about threeonths. These observed seasonal variations of Global insolation
hroughout the country conforms with the earlier investigations2] based on 18 surface solar radiation stations.
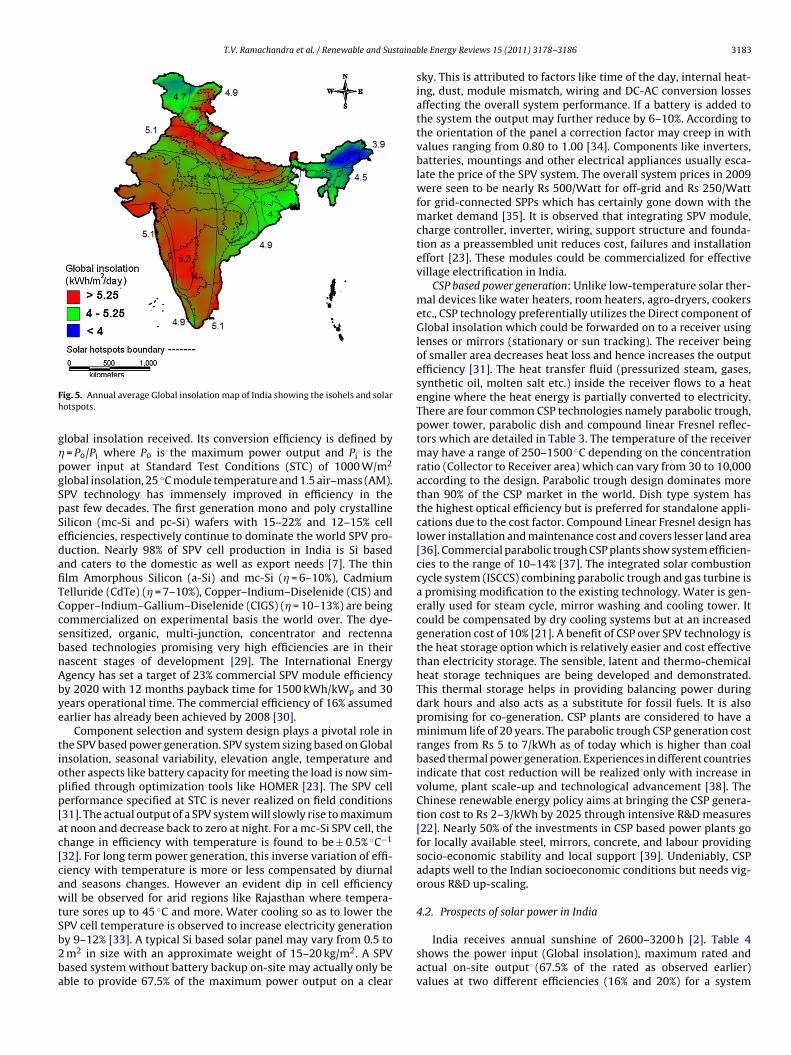
Fig. 5 illustrates that the Gangetic plains (Trans, Middle andpper) Plateau (Central, Western and Southern) region, West-rn dry region, Gujarat Plains and hill region as well as theest Coast plains and Ghat region receive annual Global inso-
ation above 5 kWh/m2/day. These zones include major federaltates of Karnataka, Gujarat, Andhra Pradesh, Maharashtra, Mad-ya Pradesh, Rajasthan, Tamil Nadu, Haryana, Punjab, Kerala,
ihar, Uttar Pradesh and Chattisgarh. The Eastern part of Ladakhegion (Jammu & Kashmir) and minor parts of Himachal Pradesh,ttarakand and Sikkim which are located in the Himalayan beltlso receive similar average Global insolation annually. These–April), (b) monthly average Global insolation maps of India detailed with isohelsohels (September–December).
regions with viable potential constitute solar hotspots coveringnearly 1.89 million km2 (∼58%) of India (Fig. 5) with the favorableprospects for solar based renewable energy technologies. The East-ern Himalayan states of Arunachal Pradesh, Nagaland and Assamreceive annual average global insolation below 4 kWh/m2/day.
4.1. Techno-economic feasibility of solar energy
The true potential of the identified solar hotspots is realized onlywith the proper dissemination of technologies for large scale powergeneration. This section focuses on the techno-economic aspects of
solar power technologies like SPV and CSP apart from the social andorganizational aspects.SPV based power generation: Electricity generated by SPVcells is proportional to the area exposed and the intensity of
T.V. Ramachandra et al. / Renewable and Sustainab
Fh
g�pgSpSedafiTCcsbnAbye
tiopp[ac[cawtSb2ba
ig. 5. Annual average Global insolation map of India showing the isohels and solarotspots.
lobal insolation received. Its conversion efficiency is defined by= Po/Pi where Po is the maximum power output and Pi is theower input at Standard Test Conditions (STC) of 1000 W/m2
lobal insolation, 25 ◦C module temperature and 1.5 air–mass (AM).PV technology has immensely improved in efficiency in theast few decades. The first generation mono and poly crystallineilicon (mc-Si and pc-Si) wafers with 15–22% and 12–15% cellfficiencies, respectively continue to dominate the world SPV pro-uction. Nearly 98% of SPV cell production in India is Si basednd caters to the domestic as well as export needs [7]. The thinlm Amorphous Silicon (a-Si) and mc-Si (� = 6–10%), Cadmiumelluride (CdTe) (� = 7–10%), Copper–Indium–Diselenide (CIS) andopper–Indium–Gallium–Diselenide (CIGS) (� = 10–13%) are beingommercialized on experimental basis the world over. The dye-ensitized, organic, multi-junction, concentrator and rectennaased technologies promising very high efficiencies are in theirascent stages of development [29]. The International Energygency has set a target of 23% commercial SPV module efficiencyy 2020 with 12 months payback time for 1500 kWh/kWp and 30ears operational time. The commercial efficiency of 16% assumedarlier has already been achieved by 2008 [30].
Component selection and system design plays a pivotal role inhe SPV based power generation. SPV system sizing based on Globalnsolation, seasonal variability, elevation angle, temperature andther aspects like battery capacity for meeting the load is now sim-lified through optimization tools like HOMER [23]. The SPV cellerformance specified at STC is never realized on field conditions31]. The actual output of a SPV system will slowly rise to maximumt noon and decrease back to zero at night. For a mc-Si SPV cell, thehange in efficiency with temperature is found to be ± 0.5% ◦C−1
32]. For long term power generation, this inverse variation of effi-iency with temperature is more or less compensated by diurnalnd seasons changes. However an evident dip in cell efficiencyill be observed for arid regions like Rajasthan where tempera-
ure sores up to 45 ◦C and more. Water cooling so as to lower thePV cell temperature is observed to increase electricity generation
y 9–12% [33]. A typical Si based solar panel may vary from 0.5 tom2 in size with an approximate weight of 15–20 kg/m2. A SPVased system without battery backup on-site may actually only beble to provide 67.5% of the maximum power output on a clearle Energy Reviews 15 (2011) 3178–3186 3183
sky. This is attributed to factors like time of the day, internal heat-ing, dust, module mismatch, wiring and DC-AC conversion lossesaffecting the overall system performance. If a battery is added tothe system the output may further reduce by 6–10%. According tothe orientation of the panel a correction factor may creep in withvalues ranging from 0.80 to 1.00 [34]. Components like inverters,batteries, mountings and other electrical appliances usually esca-late the price of the SPV system. The overall system prices in 2009were seen to be nearly Rs 500/Watt for off-grid and Rs 250/Wattfor grid-connected SPPs which has certainly gone down with themarket demand [35]. It is observed that integrating SPV module,charge controller, inverter, wiring, support structure and founda-tion as a preassembled unit reduces cost, failures and installationeffort [23]. These modules could be commercialized for effectivevillage electrification in India.
CSP based power generation: Unlike low-temperature solar ther-mal devices like water heaters, room heaters, agro-dryers, cookersetc., CSP technology preferentially utilizes the Direct component ofGlobal insolation which could be forwarded on to a receiver usinglenses or mirrors (stationary or sun tracking). The receiver beingof smaller area decreases heat loss and hence increases the outputefficiency [31]. The heat transfer fluid (pressurized steam, gases,synthetic oil, molten salt etc.) inside the receiver flows to a heatengine where the heat energy is partially converted to electricity.There are four common CSP technologies namely parabolic trough,power tower, parabolic dish and compound linear Fresnel reflec-tors which are detailed in Table 3. The temperature of the receivermay have a range of 250–1500 ◦C depending on the concentrationratio (Collector to Receiver area) which can vary from 30 to 10,000according to the design. Parabolic trough design dominates morethan 90% of the CSP market in the world. Dish type system hasthe highest optical efficiency but is preferred for standalone appli-cations due to the cost factor. Compound Linear Fresnel design haslower installation and maintenance cost and covers lesser land area[36]. Commercial parabolic trough CSP plants show system efficien-cies to the range of 10–14% [37]. The integrated solar combustioncycle system (ISCCS) combining parabolic trough and gas turbine isa promising modification to the existing technology. Water is gen-erally used for steam cycle, mirror washing and cooling tower. Itcould be compensated by dry cooling systems but at an increasedgeneration cost of 10% [21]. A benefit of CSP over SPV technology isthe heat storage option which is relatively easier and cost effectivethan electricity storage. The sensible, latent and thermo-chemicalheat storage techniques are being developed and demonstrated.This thermal storage helps in providing balancing power duringdark hours and also acts as a substitute for fossil fuels. It is alsopromising for co-generation. CSP plants are considered to have aminimum life of 20 years. The parabolic trough CSP generation costranges from Rs 5 to 7/kWh as of today which is higher than coalbased thermal power generation. Experiences in different countriesindicate that cost reduction will be realized only with increase involume, plant scale-up and technological advancement [38]. TheChinese renewable energy policy aims at bringing the CSP genera-tion cost to Rs 2–3/kWh by 2025 through intensive R&D measures[22]. Nearly 50% of the investments in CSP based power plants gofor locally available steel, mirrors, concrete, and labour providingsocio-economic stability and local support [39]. Undeniably, CSPadapts well to the Indian socioeconomic conditions but needs vig-orous R&D up-scaling.
4.2. Prospects of solar power in India
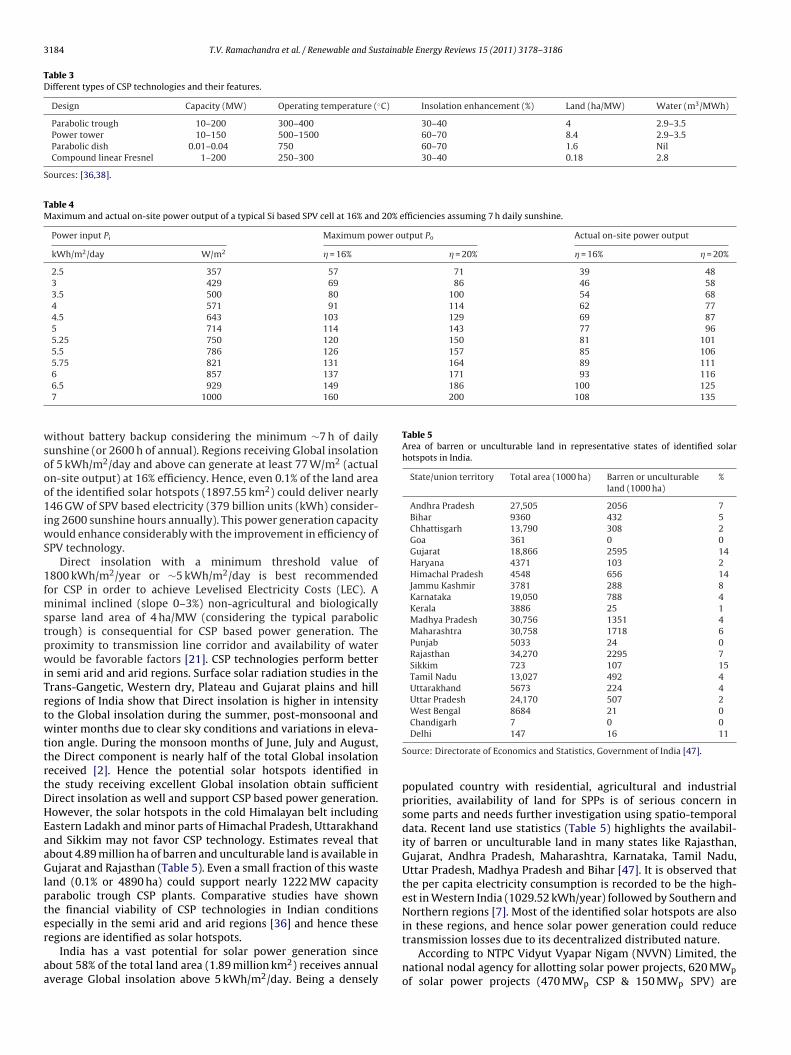
India receives annual sunshine of 2600–3200 h [2]. Table 4shows the power input (Global insolation), maximum rated andactual on-site output (67.5% of the rated as observed earlier)values at two different efficiencies (16% and 20%) for a system
3184 T.V. Ramachandra et al. / Renewable and Sustainable Energy Reviews 15 (2011) 3178–3186
Table 3Different types of CSP technologies and their features.
Design Capacity (MW) Operating temperature (◦C) Insolation enhancement (%) Land (ha/MW) Water (m3/MWh)
Parabolic trough 10–200 300–400 30–40 4 2.9–3.5Power tower 10–150 500–1500 60–70 8.4 2.9–3.5Parabolic dish 0.01–0.04 750 60–70 1.6 NilCompound linear Fresnel 1–200 250–300 30–40 0.18 2.8
Sources: [36,38].
Table 4Maximum and actual on-site power output of a typical Si based SPV cell at 16% and 20% efficiencies assuming 7 h daily sunshine.
Power input Pi Maximum power output Po Actual on-site power output
kWh/m2/day W/m2 � = 16% � = 20% � = 16% � = 20%
2.5 357 57 71 39 483 429 69 86 46 583.5 500 80 100 54 684 571 91 114 62 774.5 643 103 129 69 875 714 114 143 77 965.25 750 120 150 81 1015.5 786 126 157 85 1065.75 821 131 164 89 1116 857 137 171 93 116
186 100 125200 108 135
wsooo1iwS
1fmstpwiTrtwttrtDHEaaGlpter
aa
Table 5Area of barren or unculturable land in representative states of identified solarhotspots in India.
State/union territory Total area (1000 ha) Barren or unculturableland (1000 ha)
%
Andhra Pradesh 27,505 2056 7Bihar 9360 432 5Chhattisgarh 13,790 308 2Goa 361 0 0Gujarat 18,866 2595 14Haryana 4371 103 2Himachal Pradesh 4548 656 14Jammu Kashmir 3781 288 8Karnataka 19,050 788 4Kerala 3886 25 1Madhya Pradesh 30,756 1351 4Maharashtra 30,758 1718 6Punjab 5033 24 0Rajasthan 34,270 2295 7Sikkim 723 107 15Tamil Nadu 13,027 492 4Uttarakhand 5673 224 4Uttar Pradesh 24,170 507 2West Bengal 8684 21 0Chandigarh 7 0 0
6.5 929 1497 1000 160
ithout battery backup considering the minimum ∼7 h of dailyunshine (or 2600 h of annual). Regions receiving Global insolationf 5 kWh/m2/day and above can generate at least 77 W/m2 (actualn-site output) at 16% efficiency. Hence, even 0.1% of the land areaf the identified solar hotspots (1897.55 km2) could deliver nearly46 GW of SPV based electricity (379 billion units (kWh) consider-
ng 2600 sunshine hours annually). This power generation capacityould enhance considerably with the improvement in efficiency of
PV technology.Direct insolation with a minimum threshold value of
800 kWh/m2/year or ∼5 kWh/m2/day is best recommendedor CSP in order to achieve Levelised Electricity Costs (LEC). A
inimal inclined (slope 0–3%) non-agricultural and biologicallyparse land area of 4 ha/MW (considering the typical parabolicrough) is consequential for CSP based power generation. Theroximity to transmission line corridor and availability of waterould be favorable factors [21]. CSP technologies perform better
n semi arid and arid regions. Surface solar radiation studies in therans-Gangetic, Western dry, Plateau and Gujarat plains and hillegions of India show that Direct insolation is higher in intensityo the Global insolation during the summer, post-monsoonal andinter months due to clear sky conditions and variations in eleva-
ion angle. During the monsoon months of June, July and August,he Direct component is nearly half of the total Global insolationeceived [2]. Hence the potential solar hotspots identified inhe study receiving excellent Global insolation obtain sufficientirect insolation as well and support CSP based power generation.owever, the solar hotspots in the cold Himalayan belt includingastern Ladakh and minor parts of Himachal Pradesh, Uttarakhandnd Sikkim may not favor CSP technology. Estimates reveal thatbout 4.89 million ha of barren and unculturable land is available inujarat and Rajasthan (Table 5). Even a small fraction of this waste
and (0.1% or 4890 ha) could support nearly 1222 MW capacityarabolic trough CSP plants. Comparative studies have shownhe financial viability of CSP technologies in Indian conditionsspecially in the semi arid and arid regions [36] and hence these
egions are identified as solar hotspots.India has a vast potential for solar power generation sincebout 58% of the total land area (1.89 million km2) receives annualverage Global insolation above 5 kWh/m2/day. Being a densely
Delhi 147 16 11
Source: Directorate of Economics and Statistics, Government of India [47].
populated country with residential, agricultural and industrialpriorities, availability of land for SPPs is of serious concern insome parts and needs further investigation using spatio-temporaldata. Recent land use statistics (Table 5) highlights the availabil-ity of barren or unculturable land in many states like Rajasthan,Gujarat, Andhra Pradesh, Maharashtra, Karnataka, Tamil Nadu,Uttar Pradesh, Madhya Pradesh and Bihar [47]. It is observed thatthe per capita electricity consumption is recorded to be the high-est in Western India (1029.52 kWh/year) followed by Southern andNorthern regions [7]. Most of the identified solar hotspots are alsoin these regions, and hence solar power generation could reduce
transmission losses due to its decentralized distributed nature.According to NTPC Vidyut Vyapar Nigam (NVVN) Limited, thenational nodal agency for allotting solar power projects, 620 MWp
of solar power projects (470 MWp CSP & 150 MWp SPV) are
stainab
sCPbnOGt116Rc1iseatIdrh
rRob[nT2(gwTftsIg
4
taoeisAoa1pTtBibimal
T.V. Ramachandra et al. / Renewable and Su
elected for the first phase of NSM which ends by May 2013.SP based plants are proposed for Rajasthan (400 MWp), Andhraradesh (50 MWp) and Gujarat (20 MWp), while SPV projects areased in Rajasthan (105 MWp), Andhra Pradesh (15 MWp), Kar-ataka (10 MWp), Maharashtra (5 MWp), Uttar Pradesh (5 MWp),rissa (5 MWp) and Tamil Nadu (5 MWp) [40]. Various states likeujarat, Uttaranchal, Uttar Pradesh and Jharkhand have promised
o increase their percentage share of solar based electricity to% by financial year 2011–2012. Karnataka has already approved29 MWp solar based grid connected power generation of whichMWp have been commissioned by November 30th, 2010 [41].ajasthan having the highest share of solar power projects in theountry launched a Solar Energy Policy in 2010, which aims for0,000–12,000 MWp of solar power generation by 2022 coincid-
ng with the third phase of the NSM [42]. Andhra Pradesh hasanctioned nearly 11 MWp of standalone off grid SPPs in the statexpected to be commissioned by mid 2011 [43]. Uttar Pradesh haspproved 32.5 MW SPV based power projects in the state [44] whilehe state of Jammu Kashmir also launched a solar energy policy.ndia’s progress in solar power generation after the launch of NSM isefinitely encouraging. Considering the immense potential of solaresources in the country, the generation capacity could surpass theighest targets set by the NSM under proper mechanisms.
Apart from the power generation potential of SPPs, their envi-onmental attribute could be quantified with the introduction ofenewable Energy Certificates (RECs). The solar power purchasebligation envisaged by the NSM, requires states to buy 0.25% solarased power in its first phase which will be scaled up to 3% by 20229]. This opens up new vistas for the Clean Development Mecha-ism (CDM) by interstate sale and purchase of solar specific RECs.he average emission from the regional power grid according to the008–2009 baseline database of the Central Electricity AuthorityCEA) is 860 gCO2/kWh [45]. Studies show that Si SPV based powereneration emits 35–40 gCO2/kWh equivalent during its life cycle,hich is phenomenally lower than the fossil fuel based plants [46].
he assumed Si SPV based output of 379 billion units generatedrom 0.1% land area of the identified solar hotspots, can offset morehan 300 mtCO2 per year. CSP can also offset high amounts of emis-ion by replacing the fossil fuel based conventional power plants.n the international level, this adds to India’s efforts in mitigatinglobal warming.
.3. Organizational aspects of solar power generation in India
Dissemination of SPV and CSP technologies for power genera-ion needs detailed understanding of the organizational structurend market conditions. Capital grant is a major policy instrumentf the Indian government with respect to the off-grid renewablenergy projects. Rural village electrification envisages decentral-zed and distributed systems with thrust on renewable energyources providing capital subsidies. There is a Central Financialssistance (CFA) of Rs. 70–90/Watt (depending on battery backup)r 30% of the project cost whichever is lower for small scale SPVpplications. The government has promised a subsidy of up to Rs.00/Watt (to a maximum of 40% of the cost of system) for non-rofit making bodies for installations of 25–100 kW capacity [7].he Indian government’s policy measure for grid-connected sys-ems encourages competition and efficiency through Generationased Incentives (GBI). The incentive for SPV is Rs 12/kWh and CSP
s Rs 10/kWh for a total of 50 MWp projects on first come first serveasis. An individual power developer can avail generation based
ncentive for a minimum of 1 MWp at a single location and maxi-um of 5 MWp for a maximum of 10 years [48]. State level policies
lso offer incentives for solar power production up to 25 years orife of the plant whichever is earlier.
le Energy Reviews 15 (2011) 3178–3186 3185
Fiscal and financial incentives like tax holiday, tax free dividend,abolition of excise duty to investors encourage further investment.Institutional support has been observed to be a major factor for sus-taining new technologies while strengthening of R&D and openingup of a local free market need priority rather than subsidy basedincentives [23]. Major developing economies like China have real-ized the importance of R&D so as to bring grid parity for solar basedpower generation [22]. Since demand for skilled resource personsfor promotion, installation and maintenance of solar power systemsare on the rise, India needs to strengthen its training institutionswith world class infrastructure.
5. Social aspects
While solar resource potential, techno-economic feasibility andorganizational aspects play indispensible role, social acceptancegives the final verdict on the long term success of solar powergeneration. Awareness on the environmental and health benefitsof solar energy is essential to mobilise solar technologies in thefuel-wood based grass-root economy of India [49]. The Govern-ment of India has taken initiatives for knowledge disseminationin the district level. Developing solar micro-grid systems in villagelevel for meeting the electricity requirements of a cluster of familiesthrough financial support for energy service providers, proper fee-for-service models, and micro-finance for consumers could lead theway for decentralized rural electrification and management [50].This successful strategy is testified in Sundarbans in the federalstate of West Bengal where a 345 kWp SPV based SPP has beenestablished for 1750 consumers [51]. A case study in Sagar Dweepisland [52] extols the improvement in education, income genera-tion, social life and health of the people benefited by decentralizedsolar electrification. While these experiences inspire us to movetowards a solar economy, it is essential to expel selfish elementswho influence the governance and the citizenry to continue in theunsustainable development track. A holistic approach involving thepublic, government, academia, media and international organiza-tions need to be adopted to ensure social acceptance of solar powergeneration.
6. Conclusion
The study identified the solar hotspots in India using highresolution satellite data. It is observed that nearly 58% of the coun-try receives annual average Global insolation of 5 kWh/m2/daywhich could help meet her escalating power requirements in adecentralized, efficient and sustainable manner. The solar powertechnologies like SPV and CSP have been discussed with focuson their techno-economic constraints of implementation. A majorthrust for R&D in solar technologies is essential to lower the genera-tion cost and enable a competition with the conventional fossil fuelbased options. Solar hotspots in India have the potential to offseta huge volume of GHG emissions as demonstrated and help real-ize a low carbon economy at a faster rate. It will create numerousemployment opportunities especially in the village level. Learningfrom other developing countries as well as its own past experi-ences, India can be a world leader in solar power generation. Withan ambitious solar mission, and positively evolving policy instru-ments, the nation will rightly adorn the epithet of ‘Solar India’ inthe near future.
Acknowledgements
We thank NASA for SSE datasets for renewable energy potentialassessment. We are grateful to NRDMS division, the Ministry of Sci-ence and Technology and the Ministry of Environment and Forests,
3 staina
Gt
R
[
[
[
[
[
[
[
[
[
[
[
[
[
[
[
[
[
[
[
[
[
[
[
[
[
[
[
[
[
[
[
[
[
[
[
[
[
[
[
[
[
[
186 T.V. Ramachandra et al. / Renewable and Su
overnment of India and Indian Institute of Science, Bangalore forhe financial and infrastructure support.
eferences
[1] Drennen TE, Erickson JD, Chapman D. Solar power and climate change policiesin developing countries. Energy Policy 1996;95:0301–4215.
[2] Mani A. Handbook of solar radiation. New Delhi: Allied Publishers; 1981.[3] Wilbur LC. Handbook of energy systems engineering. USA: John Wiley & Sons;
1985.[4] Renewables Global Status Report 2010 update, Renewable energy policy net-
work for the 21st century (REN21), REN21 Secretariat, Paris, Viewed onDecember 15 2010 http://www.ren21.net/Portals/97/documents/GSR/REN21GSR 2010 full revised%20Sept2010.pdf.
[5] Progress Report on Village Electrification, Central ElectricityAuthority, Government of India, Viewed on December 15 2010http://www.cea.nic.in/god/dpd/village electrification.pdf.
[6] Report of the Expert Committee, Integrated Energy Policy, PlanningCommission, Government of India, Viewed on December 15 2010http://www.planningcommission.gov.in/reports/genrep/rep intengy.pdf.
[7] TERI Energy Data Directory & Yearbook. New Delhi: TERI Press; 2010.[8] Delhi International Renewable Energy Conference, Ministry of New and
Renewable Energy, Government of India, Viewed on December 16 2010http://www.direc2010.gov.in/solar.html.
[9] Jawaharlal Nehru National Solar Mission, Ministry of New and Renew-able Energy, Government of India, Viewed on December 15 2010,http://mnre.gov.in/pdf/mission-document-JNNSM.pdf.
10] R. D. Varshita, M.K. Gupta, Modernization of Radiation Network, IndianMeteorological Department, Pune, India, Viewed December 2 2010,http://www.wmo.int/pages/prog/www/IMOP/publications/IOM-82-TECO 2005/Posters/P1%2810%29 India Vashistha.pdf.
11] Seals R, Zelenka A, Perez R. Comparing satellite remote sensing and groundnetwork measurements for the production of site/time specific irradiance data.Sol Energy 1997:89–96, f50.
12] Hay JE. Satellite based estimates of solar irradiance at the earth’s surface – IModelling approaches. Renew Energ 1993;3:381–93.
13] Sorapipatana C. An assessment of solar energy potential in Kampuchea. RenewSust Energ Rev 2010;14:2174–8.
14] Mufti A, Hiser HW, Veziroglu NT, Kazi L, Malik AQ. Application of geosta-tionary data for determining solar radiation over Pakistan. Renew Energ1991;1:455–61.
15] Escobar R, Colle S, Abreu SL, Ortega A. The state of solar energy resource assess-ment in Chile. Renew Energ 2010;35:2514–24.
16] Frulla LA, Gallegos G, Gagliardini TDA, Atmnzai G. Analysis of satellite measuredinsolation in Brazil. Sol Wind Technol 1990;7:501–9.
17] Martins FR, Pereira EB, Silva SAB, Abreu SL. Sergio Colle, Solar energy scenariosin Brazil, Part one: resource assessment. Energy Policy 2008;36:2853–64.
18] Illera P, Fernfindez A, Perez A. A simple model for the calculation of global solarradiation using geostationary satellite data. Atmos Res 1995;39:79–90.
19] Mondal MAH, Islam AKMS. Potential and viability of grid-connected solar SPVsystem in Bangladesh. Renew Energ 2011;36:1869–74.
20] Viana TS, Rüther R, Martins FR, Pereira EB. Assessing the potential of concentrat-ing solar photovoltaic generation in Brazil with satellite-derived direct normalirradiation. Solar Energy 2011;85:486–95.
21] Kaygusuz K. Prospect of concentrating solar power in Turkey: the sustainablefuture. Renew Sust Energ Rev 2011;15:808–14.
22] Wang Z. Prospectives for China’s solar thermal power technology development.Energy 2010;35:4417–20.
23] Chaurey A, Kandpal TC. Assessment and evaluation of SPV based decentralizedrural electrification: an overview. Renew Sust Energ Rev 2010;14:2266–78.
24] Ramachandra TV. Solar energy potential assessment using GIS. Energy Educ SciTechnol 2007;18:101–14.
25] Ramachandra TV, Jha RK, Krishna SV, Shruthi BV. Solar energy decision supportsystem. Int J Sust Energ 2005;24:207–24.
26] Projects, Karnataka Power Corporation Limited, Government of Karnataka,Viewed on February 10 2011, http://www.karnatakapower.com/projects.asp.
27] Agro-climatic Zones in India, Indian Agricultural Statistics Research Insti-
tute, Viewed on February 2 2011 http://www.iasri.res.in/agridata/08data/chapter1/db2008tb1 2.pdf.28] Surface Meteorology and Solar Energy Release 6.0 Methodology, NASA,Viewed 29 July 2010, http://eosweb.larc.nasa.gov/sse/documents/SSE6Methodology.pdf.
[
ble Energy Reviews 15 (2011) 3178–3186
29] Razykov TM, Ferekides CS, Morel D, Stefanakos E, Ullal HS, Upadhyaya HM.Solar photovoltaic electricity: current status and future prospects. Solar Energy,http://dx.doi.org/10.1016/j.solener.2010.12.002.
30] Technology Roadmap: Solar Photovoltaic Energy, Inter-national Energy Agency, Viewed on January 10 2011,http://www.iea.org/papers/2010/SPV roadmap.pdf.
31] Kishore VVN. Renewable energy engineering and technology: a knowledgecompendium. New Delhi: TERI Press; 2008.
32] Green MA, Emery K, Hishikawa Y, Warta W. Solar cell efficiency tables (Version33). Res Appl Prog Photovolt 2009;17:85–94.
33] Kumar A, Mohanty P, Palit D, Chaurey A. Approach for standardization of off-grid electrification projects. Renew Sust Energ Rev 2009;13:1946–56.
34] A guide to Photovoltaic (SPV) System Design and Installation-ConsultationReport June 2001, Consultation Report June 2001, California Energy Commis-sion, Viewed on January 10 2011 http://www.energy.ca.gov/reports/2001-09-04 500-01-020.PDF.
35] Trends in Photovoltaic Applications, Survey report of selected IEAcountries between 1992 and 2009, Survey report of selected IEA coun-tries between 1992 and 2009, International Energy Agency, ViewedJanuary 10 2010 http://www.iea-SPVps.org/fileadmin/dam/public/report/statistics/tr 2009 neu.pdf.
36] Purohit I, Purohit P. Techno-economic evaluation of concentrating solar powergeneration in India. Energy Policy 2010;38:3015–29.
37] Quaschning V. Technical and economical system comparison of photovoltaicand concentrating solar thermal power systems depending on annual globalirradiation. Sol Energy 2004;77:171–8.
38] High temperature solar thermal technology Roadmap, Coun-cil of Australian Governments, Viewed January 13 2011,http://www.coag.gov.au/reports/docs/HTSolar thermal roadmap.pdf.
39] Viebahn P, Lechon Y, Trieb F. The potential role of concentrated solar power(CSP) in Africa and Europe—a dynamic assessment of technology develop-ment, cost development and life cycle inventories until 2050. Energy Policy,http://dx.doi.org/10.1016/j.enpol.2010.09.026.
40] Selected projects for Phase 1 JNNSM, NTPC Vidyut Vya-par Nigam Limited (NVVN), Viewed on January 16 2011http://www.nvvn.co.in/Selected%20Projects%20List.pdf.
41] Progress report, Karnataka Renewable Energy Development Lim-ited (KREDL), Government of Karnataka, Viewed on January 16 2011http://kredl.kar.nic.in/ProgressReport.htm.
42] Solar Energy Policy, Rajasthan Renewable Energy CorporationLimited, Government of Rajasthan, viewed on January 16 2011http://www.rrecl.com/Rajasthan%20Solar%20Energy%20Policy%20-2010.pdf.
43] Solar Energy, Non-conventional Energy Development Corporation of AndhraPradesh Limited, Government of Andhra Pradesh, Viewed on January 16 2011,http://www.nedcap.gov.in/Solar Energy.aspx?ID=24.
44] List of Project Proponents Approved for setting up of SSPV Power Projects, Newand Renewable Energy Development Agency, Government of Uttar Pradesh,Viewed on January 16 2011, http://neda.up.nic.in/PROGRAMMES/SEM/LIST-SPSSGP.pdf.
45] Baseline CO2 Emission Database, Central Electricity Authority, Gov-ernment of India, Viewed on January 13 2011 http://www.cea.nic.in/planning/c%20and%20e/government%20of%20india%20website.htm.
46] Alsema EA, de Wild-Scholten MJ. Environmental Impacts of Crystalline Sili-con Photovoltaic Module Production. In: 13th CIRP Intern. Conf. on Life CycleEngineering. 2006.
47] Land use statistics, Directorate of Economics and Statis-tics, Government of India, Viewed on January 13 2011http://dacnet.nic.in/eands/Land Use Statistics-2000/4.1.pdf.
48] Grid Connected Solar Power Generation Guidelines, Ministry of New andRenewable Energy, Government of India, Viewed on January 16 2011http://www.mnre.gov.in/pdf/guidelines spg.pdf.
49] Ramachandra TV, Subramanian DK. Potential and prospects of solar energyin Uttara Kannada, District of Karnataka State, India. Energy Sources1997;9:945–88.
50] Kirubi C, Jacobson A, Kammen DM, Mills A. Community-based electric micro-grids can contribute to rural development: evidence from Kenya. World Dev2009;37:1204–21.
51] Solar photovoltaic minigrids in Sunderbans (India)—a combinationof government and community funding, Asia-Pacific Environmen-
tal Innovation Strategies (APEIS), Viewed on February 19 2011,http://enviroscope.iges.or.jp/contents/APEIS/RISPO/inventory/db/pdf/0022.pdf.52] Chakrabarti S, Chakrabarti S. Rural electrification programme with solarenergy in remote region–a case study in an island. Energy Policy 2002;30:33–42.