Embed Size (px)
Citation preview
T V Ramachandra, Bharath Setturu, Tara N M ENVIS-SAHYADRI: Western Ghats Biodiversity & Ecology
EWRG, ([email protected]; [email protected])
Center for Ecological Sciences, IISc, BangaloreE Mail: [email protected]; [email protected]
[email protected]; [email protected]
Tel: 91-080-2293099/22933503
GREEN SKILL DEVELOPMENT
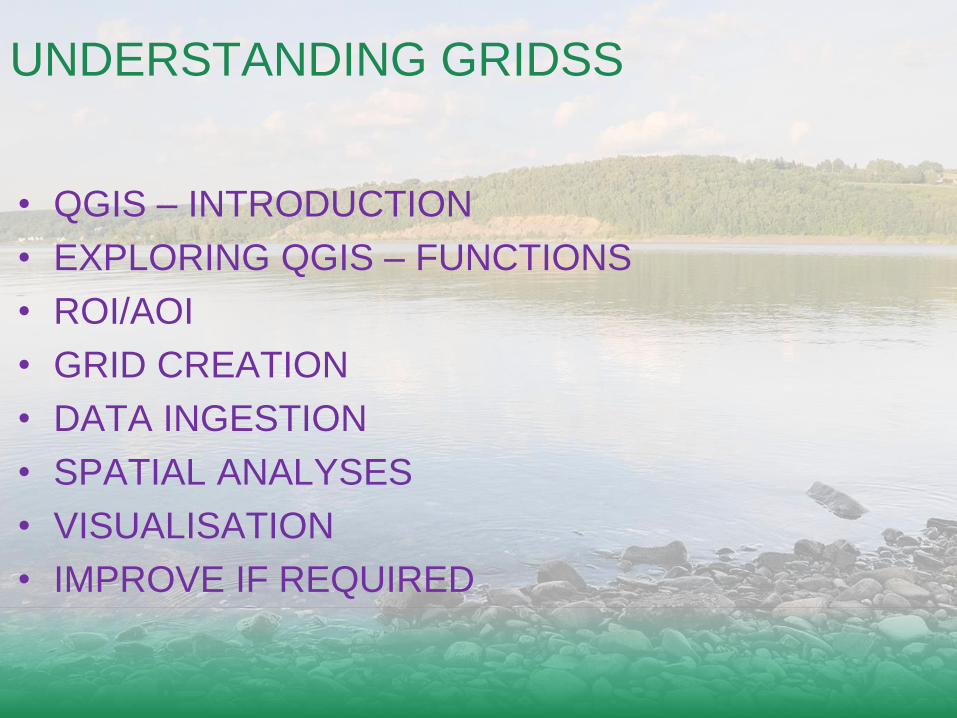
UNDERSTANDING GRIDSS
• QGIS – INTRODUCTION
• EXPLORING QGIS – FUNCTIONS
• ROI/AOI
• GRID CREATION
• DATA INGESTION
• SPATIAL ANALYSES
• VISUALISATION
• IMPROVE IF REQUIRED
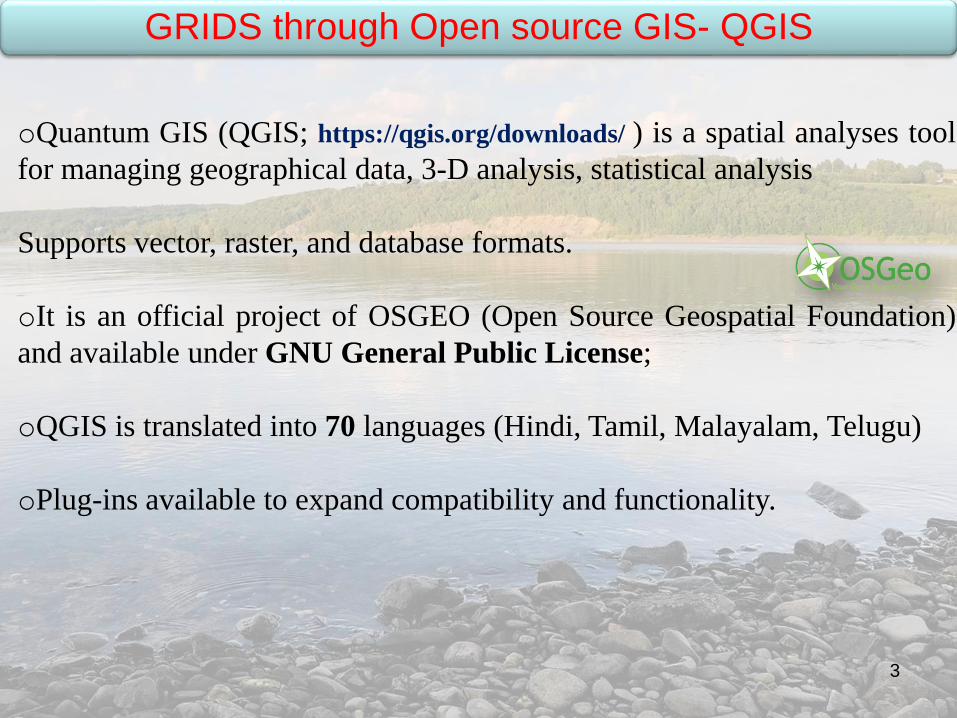
GRIDS through Open source GIS- QGIS
oQuantum GIS (QGIS; https://qgis.org/downloads/ ) is a spatial analyses tool
for managing geographical data, 3-D analysis, statistical analysis
Supports vector, raster, and database formats.
oIt is an official project of OSGEO (Open Source Geospatial Foundation)
and available under GNU General Public License;
oQGIS is translated into 70 languages (Hindi, Tamil, Malayalam, Telugu)
oPlug-ins available to expand compatibility and functionality.
3
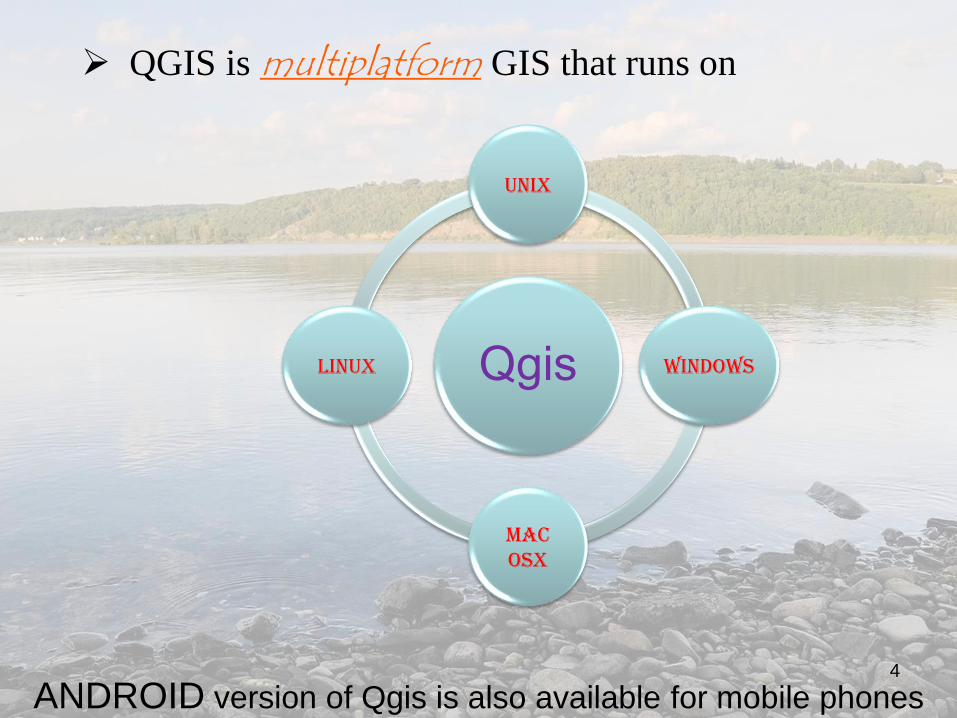
QGIS is multiplatform GIS that runs on
Qgis
Unix
Windows
Mac OSX
Linux
ANDROID version of Qgis is also available for mobile phones4
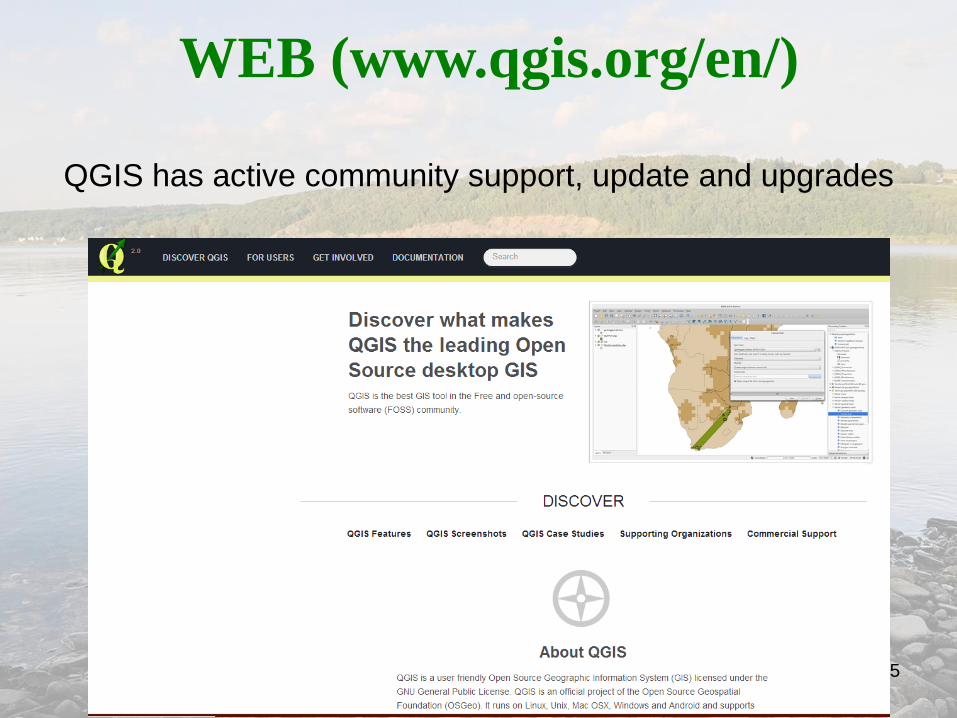
WEB (www.qgis.org/en/)
QGIS has active community support, update and upgrades
5
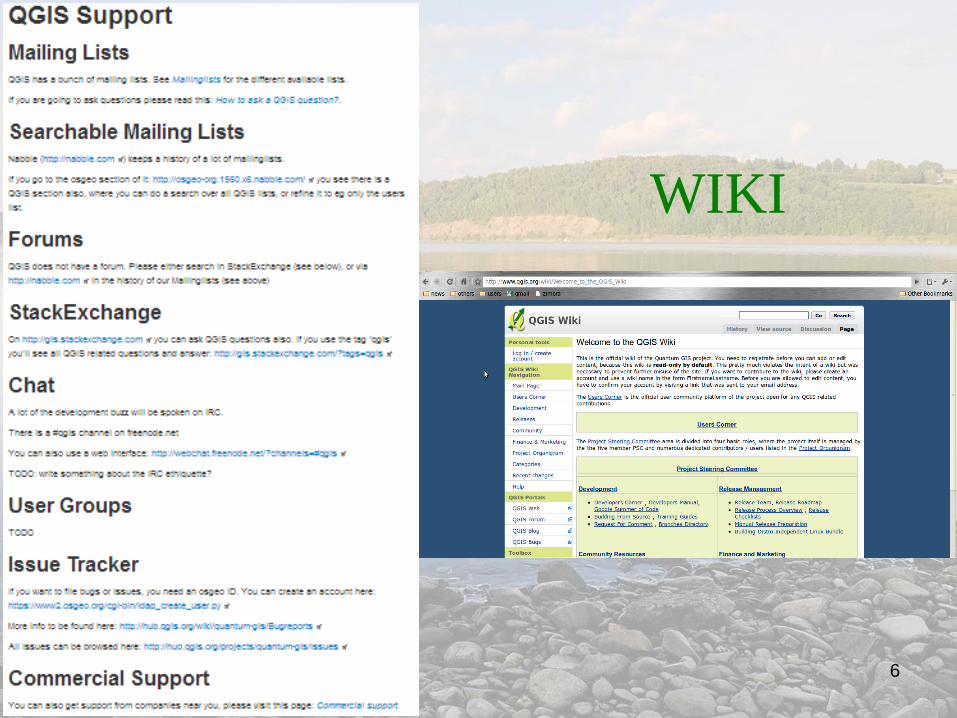
WIKI
6
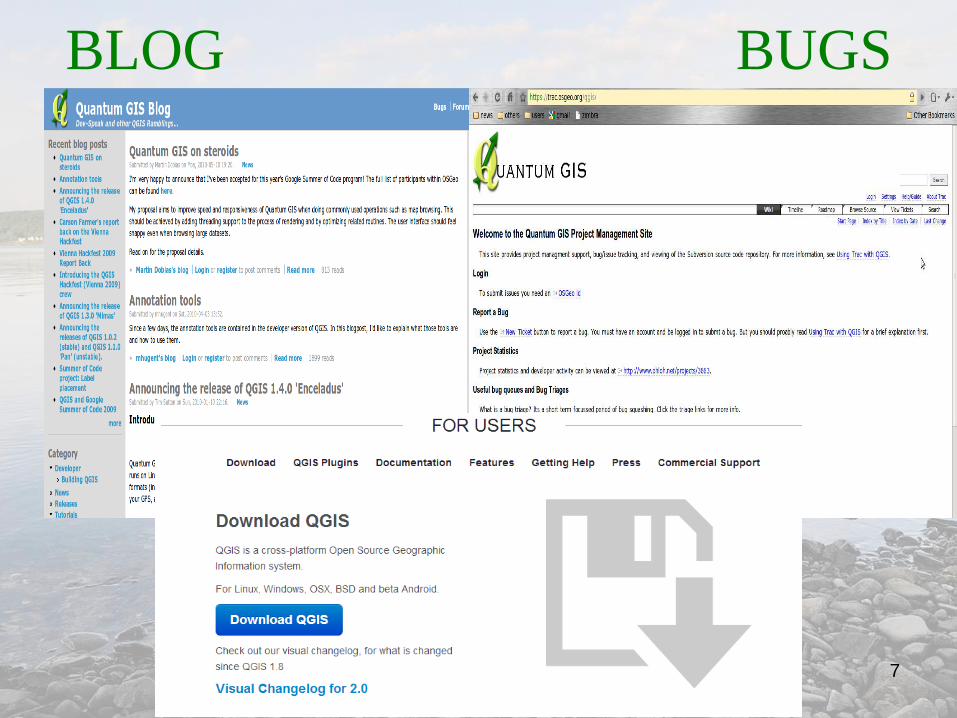
BLOG BUGS
7
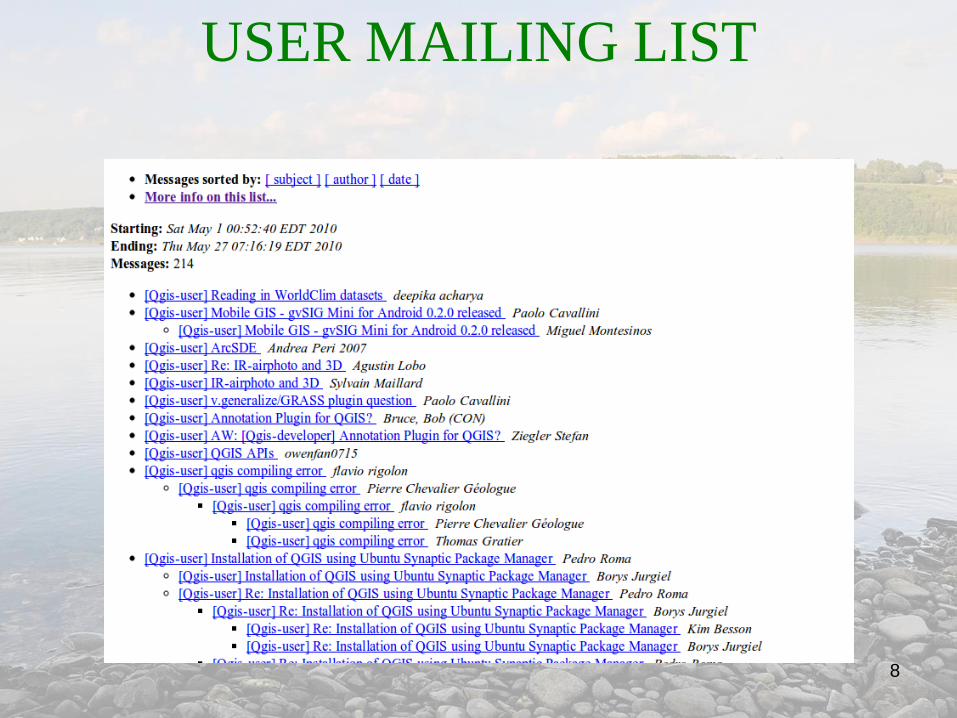
USER MAILING LIST
8
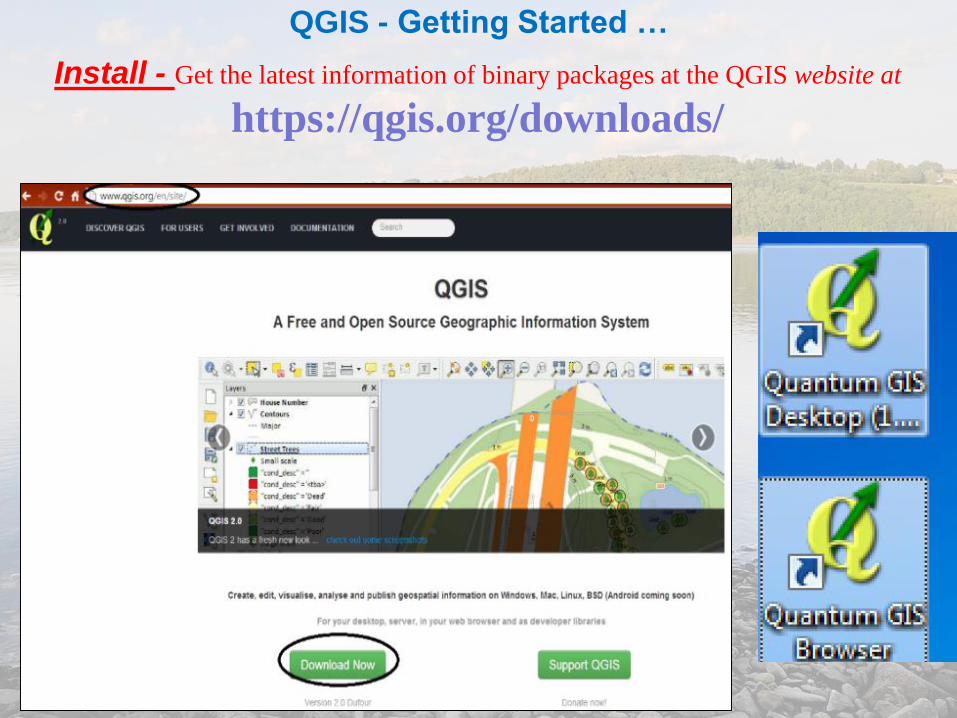
QGIS - Getting Started …
Install - Get the latest information of binary packages at the QGIS website at
https://qgis.org/downloads/
EXPLORE QGIS
12
3
4
5
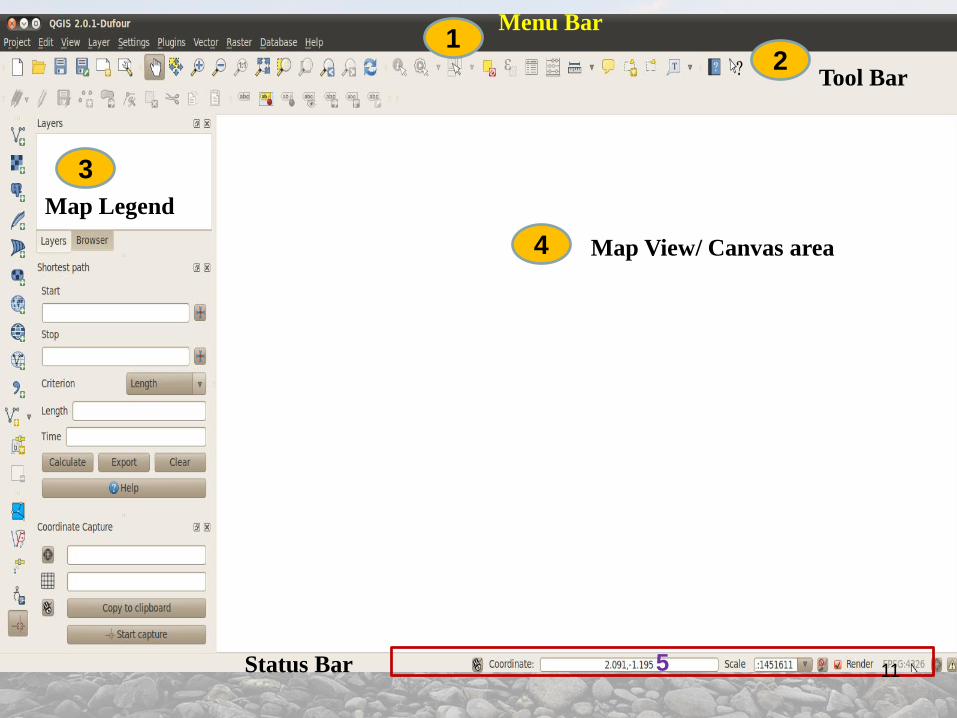
Menu Bar
Tool Bar
Map Legend
Map View/ Canvas area
Status Bar 11
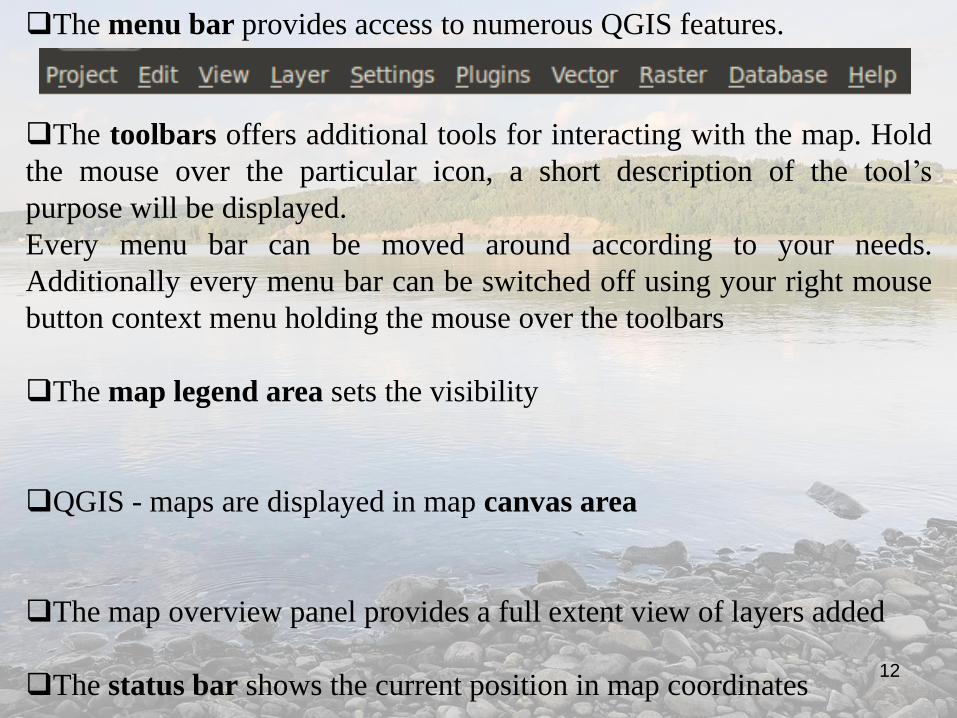
The menu bar provides access to numerous QGIS features.
The toolbars offers additional tools for interacting with the map. Hold
the mouse over the particular icon, a short description of the tool’s
purpose will be displayed.
Every menu bar can be moved around according to your needs.
Additionally every menu bar can be switched off using your right mouse
button context menu holding the mouse over the toolbars
The map legend area sets the visibility
QGIS - maps are displayed in map canvas area
The map overview panel provides a full extent view of layers added
The status bar shows the current position in map coordinates12
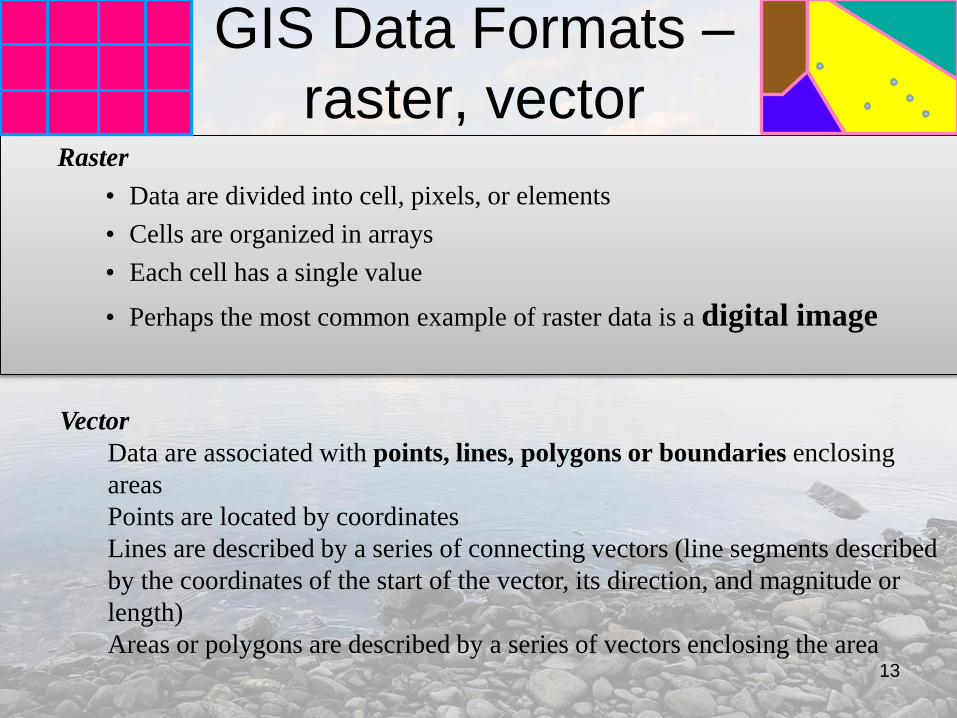
GIS Data Formats –
raster, vectorRaster
• Data are divided into cell, pixels, or elements
• Cells are organized in arrays
• Each cell has a single value
• Perhaps the most common example of raster data is a digital image
Vector
Data are associated with points, lines, polygons or boundaries enclosing
areas
Points are located by coordinates
Lines are described by a series of connecting vectors (line segments described
by the coordinates of the start of the vector, its direction, and magnitude or
length)
Areas or polygons are described by a series of vectors enclosing the area13
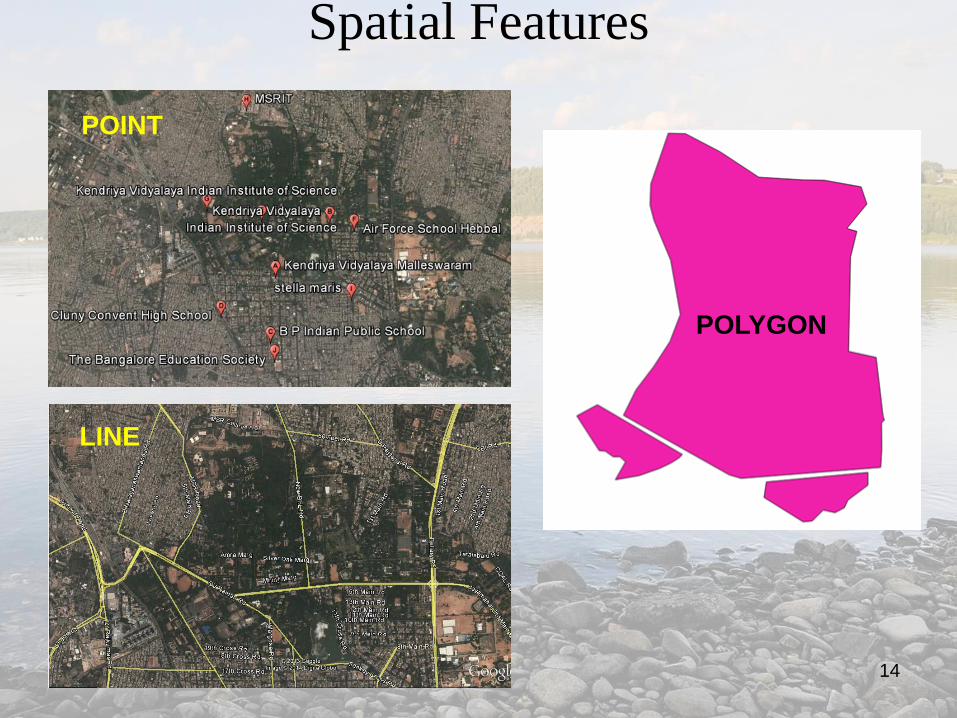
Spatial Features
POINT
LINE
POLYGON
14
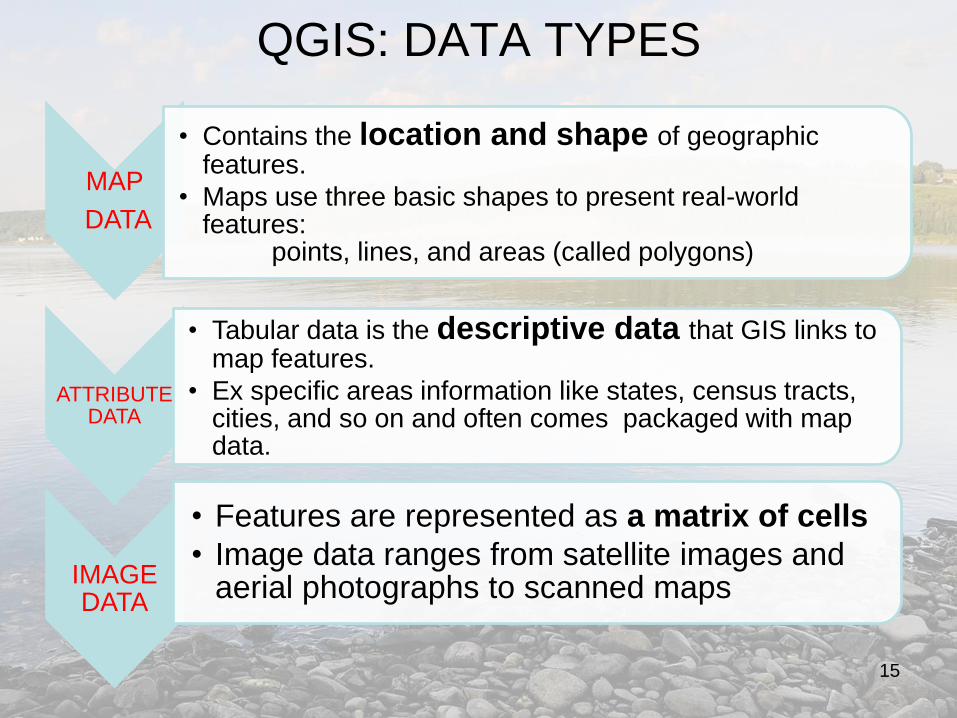
QGIS: DATA TYPES
MAP
DATA
• Contains the location and shape of geographic features.
• Maps use three basic shapes to present real-world features:
points, lines, and areas (called polygons)
ATTRIBUTE DATA
• Tabular data is the descriptive data that GIS links to map features.
• Ex specific areas information like states, census tracts, cities, and so on and often comes packaged with map data.
IMAGE DATA
• Features are represented as a matrix of cells
• Image data ranges from satellite images and aerial photographs to scanned maps
15
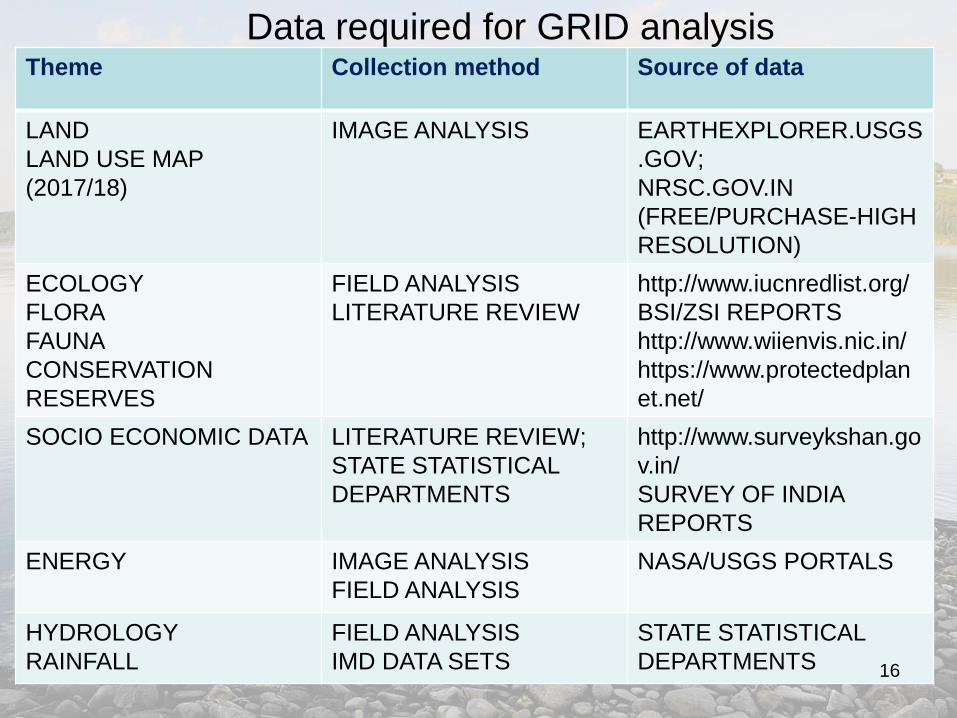
Data required for GRID analysisTheme Collection method Source of data
LAND
LAND USE MAP
(2017/18)
IMAGE ANALYSIS EARTHEXPLORER.USGS
.GOV;
NRSC.GOV.IN
(FREE/PURCHASE-HIGH
RESOLUTION)
ECOLOGY
FLORA
FAUNA
CONSERVATION
RESERVES
FIELD ANALYSIS
LITERATURE REVIEW
http://www.iucnredlist.org/
BSI/ZSI REPORTS
http://www.wiienvis.nic.in/
https://www.protectedplan
et.net/
SOCIO ECONOMIC DATA LITERATURE REVIEW;
STATE STATISTICAL
DEPARTMENTS
http://www.surveykshan.go
v.in/
SURVEY OF INDIA
REPORTS
ENERGY IMAGE ANALYSIS
FIELD ANALYSIS
NASA/USGS PORTALS
HYDROLOGY
RAINFALL
FIELD ANALYSIS
IMD DATA SETS
STATE STATISTICAL
DEPARTMENTS 16
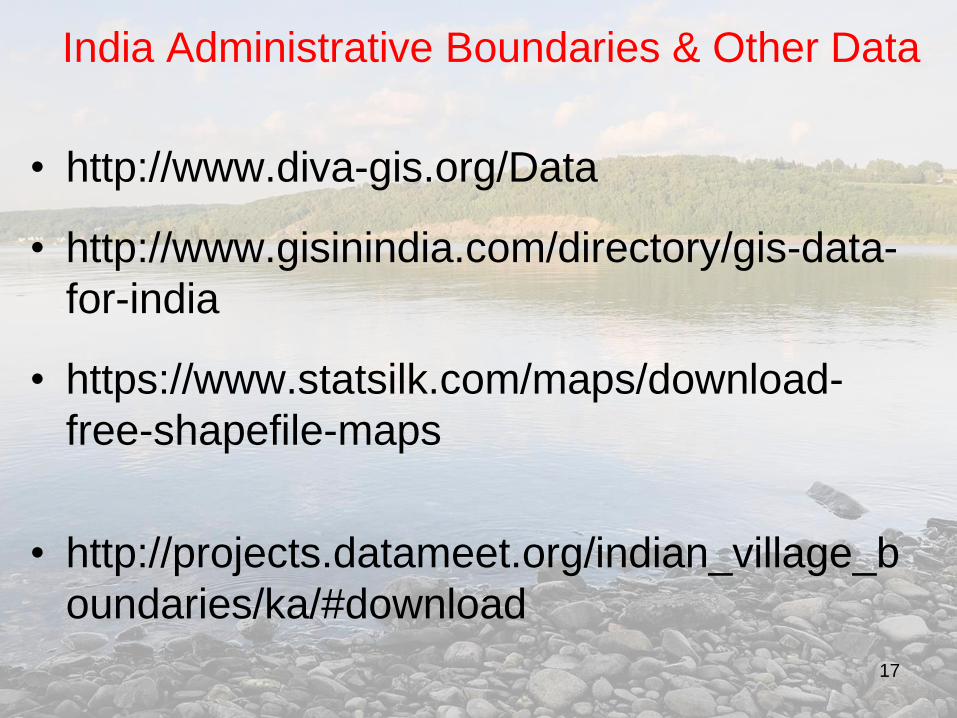
India Administrative Boundaries & Other Data
• http://www.diva-gis.org/Data
• http://www.gisinindia.com/directory/gis-data-
for-india
• https://www.statsilk.com/maps/download-
free-shapefile-maps
• http://projects.datameet.org/indian_village_b
oundaries/ka/#download
17
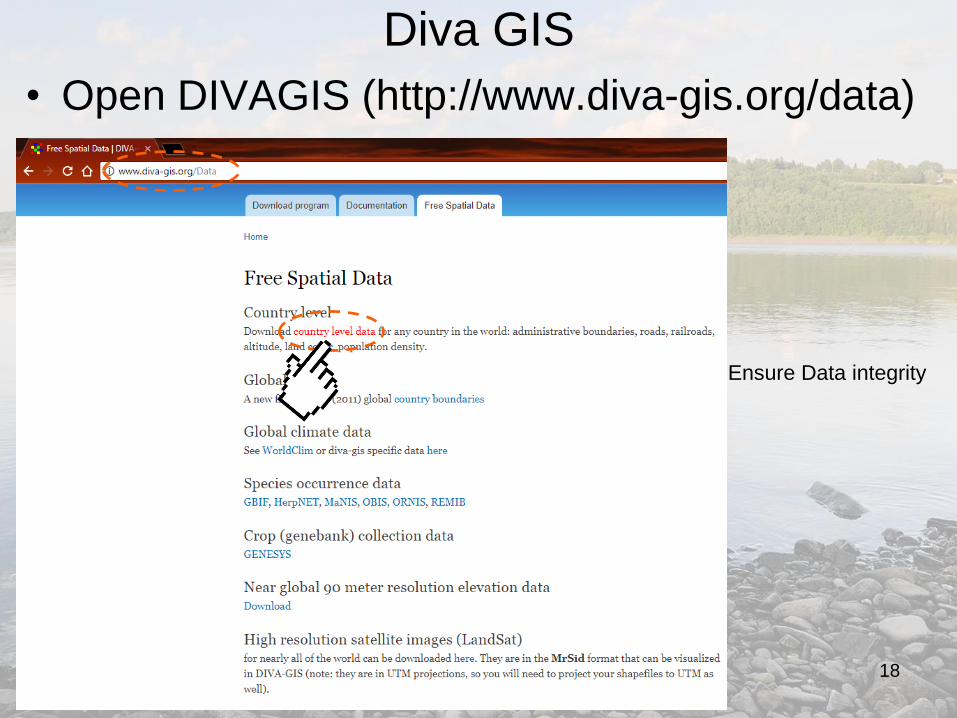
Diva GIS
• Open DIVAGIS (http://www.diva-gis.org/data)
18
Ensure Data integrity
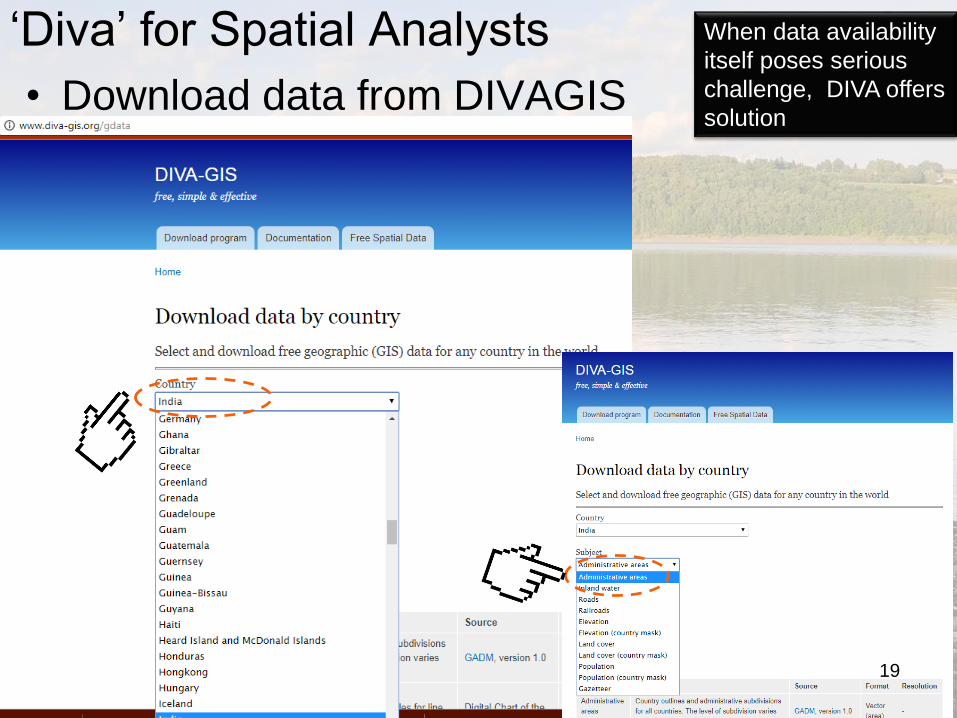
‘Diva’ for Spatial Analysts
• Download data from DIVAGIS
19
When data availability
itself poses serious
challenge, DIVA offers
solution
20
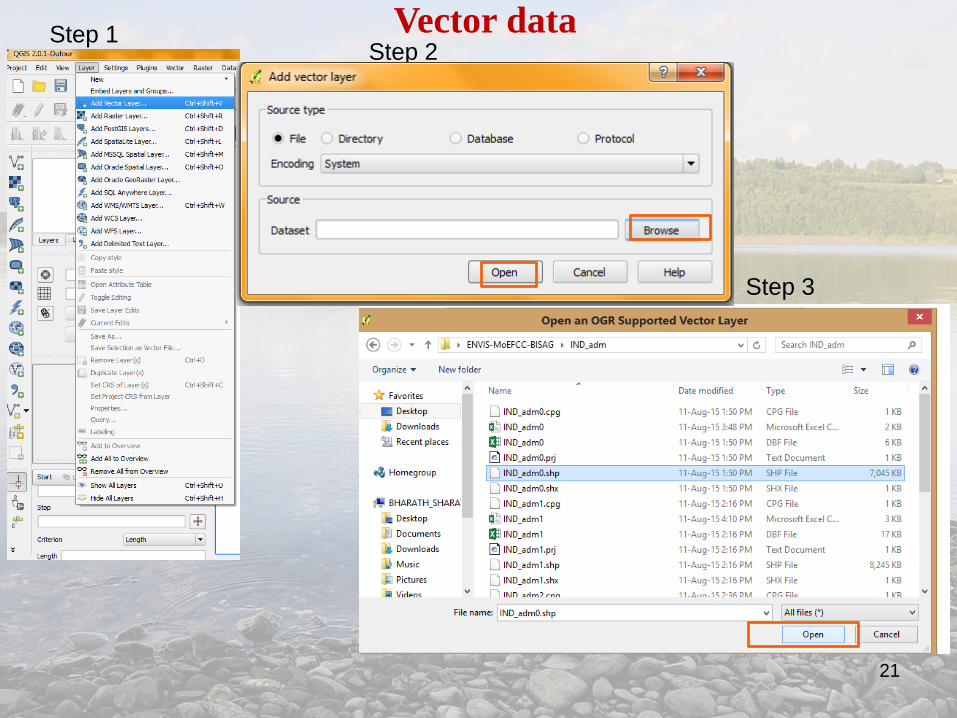
Vector dataStep 1Step 2
Step 3
21
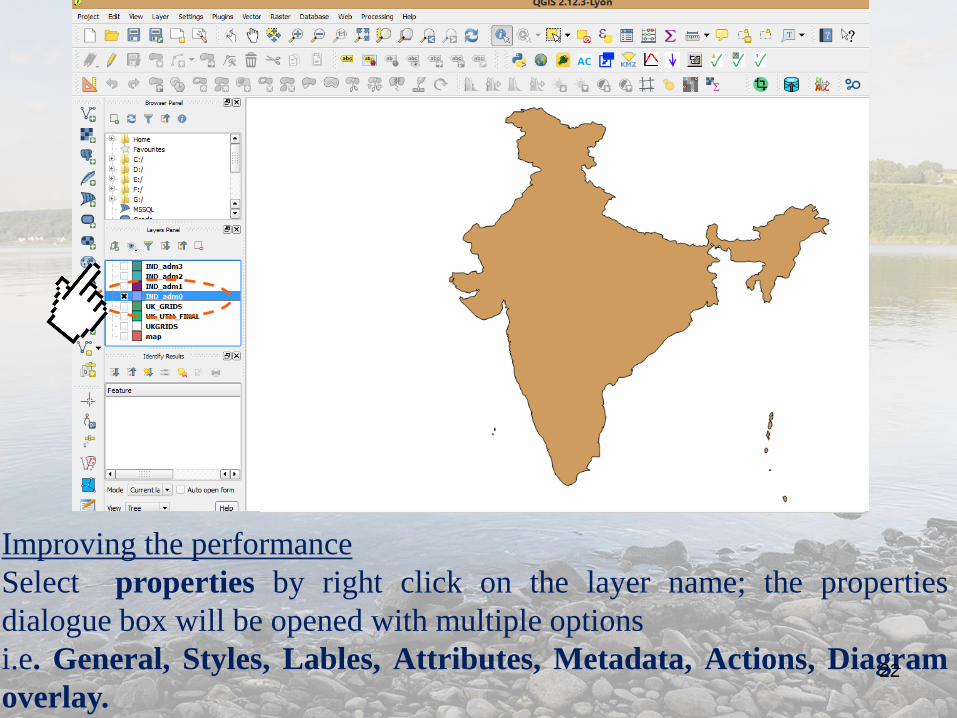
Improving the performance
Select properties by right click on the layer name; the properties
dialogue box will be opened with multiple options
i.e. General, Styles, Lables, Attributes, Metadata, Actions, Diagram
overlay.22
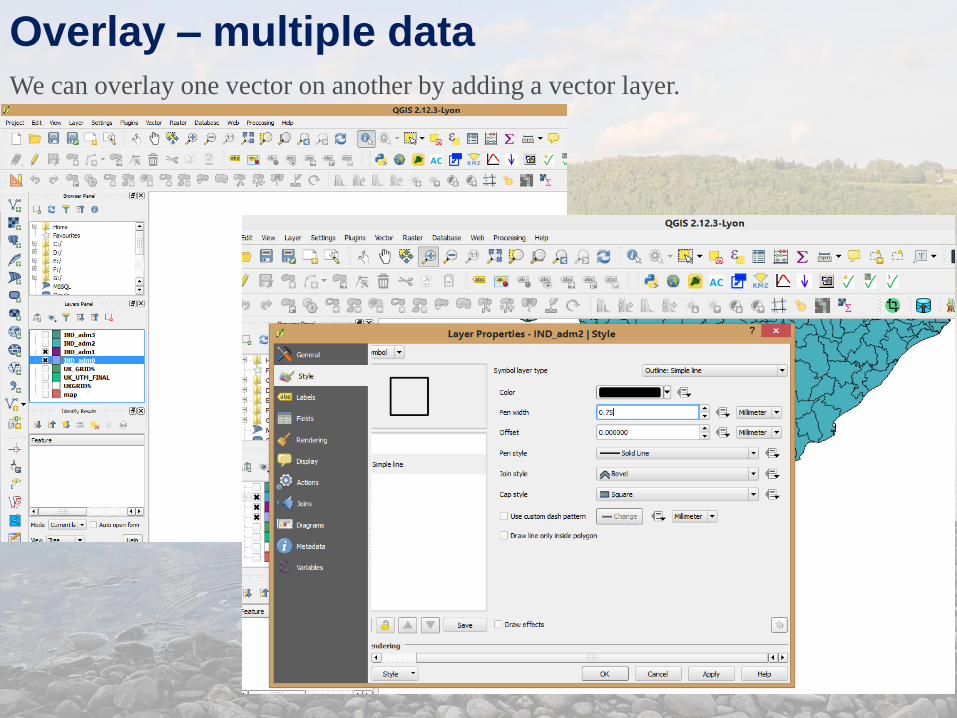
Overlay – multiple data We can overlay one vector on another by adding a vector layer.
Database ingest-querying
• Data ingestion- obtain, import and process data.
• Process – data normalisation and aggregation
25
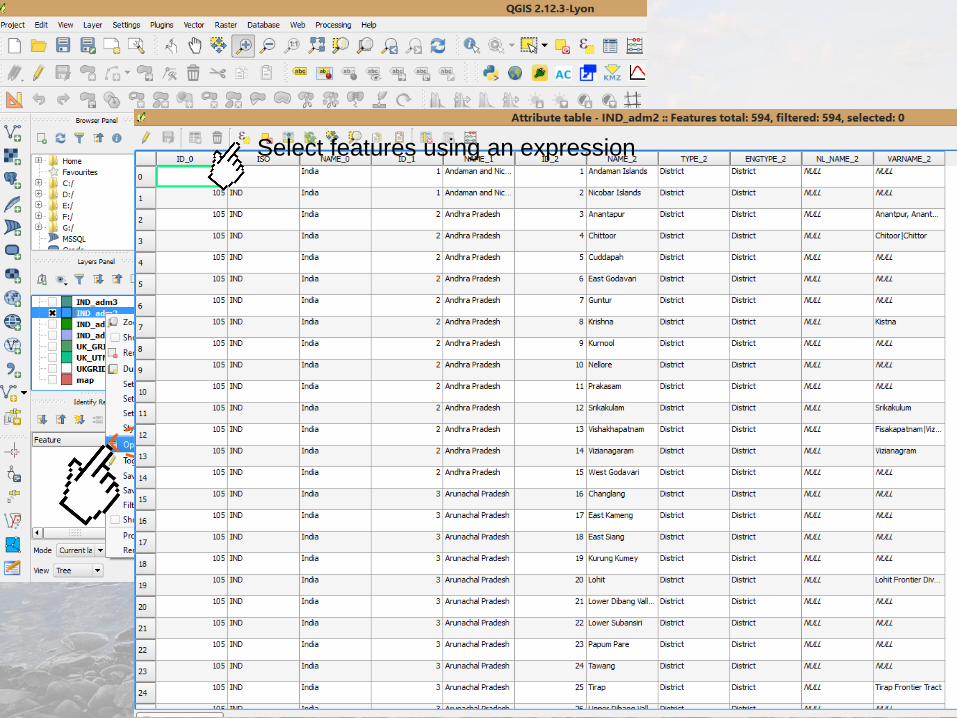
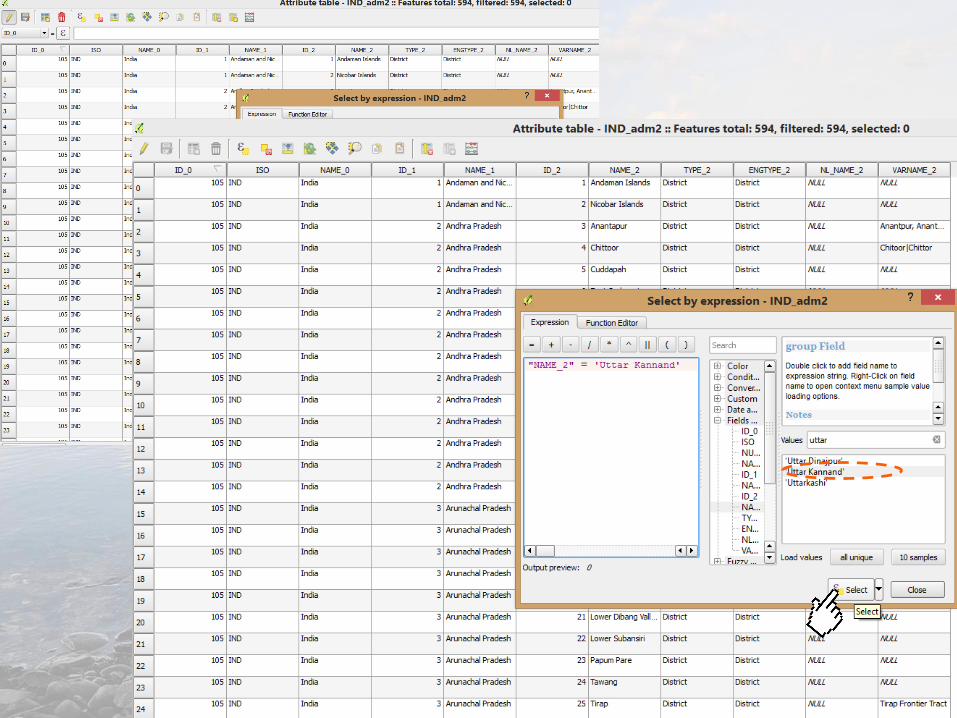
Select features using an expression
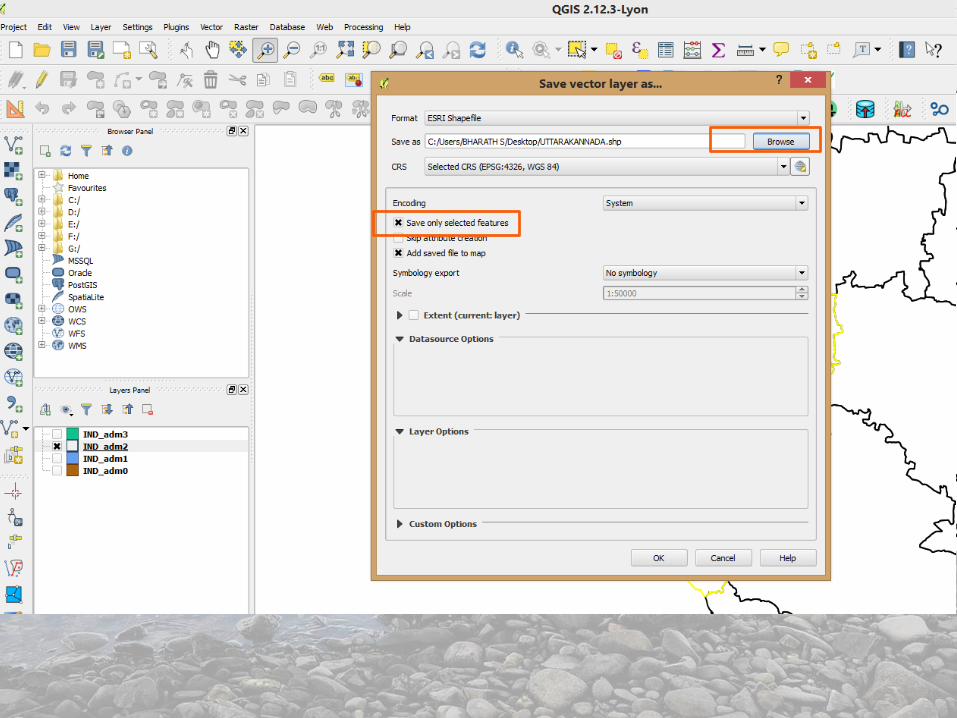
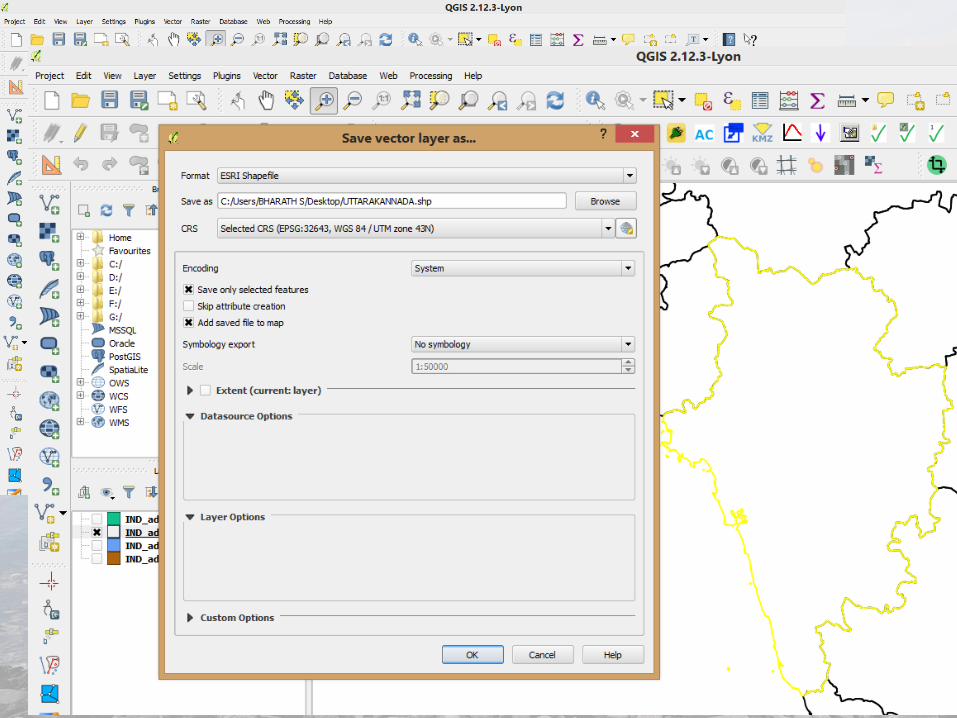
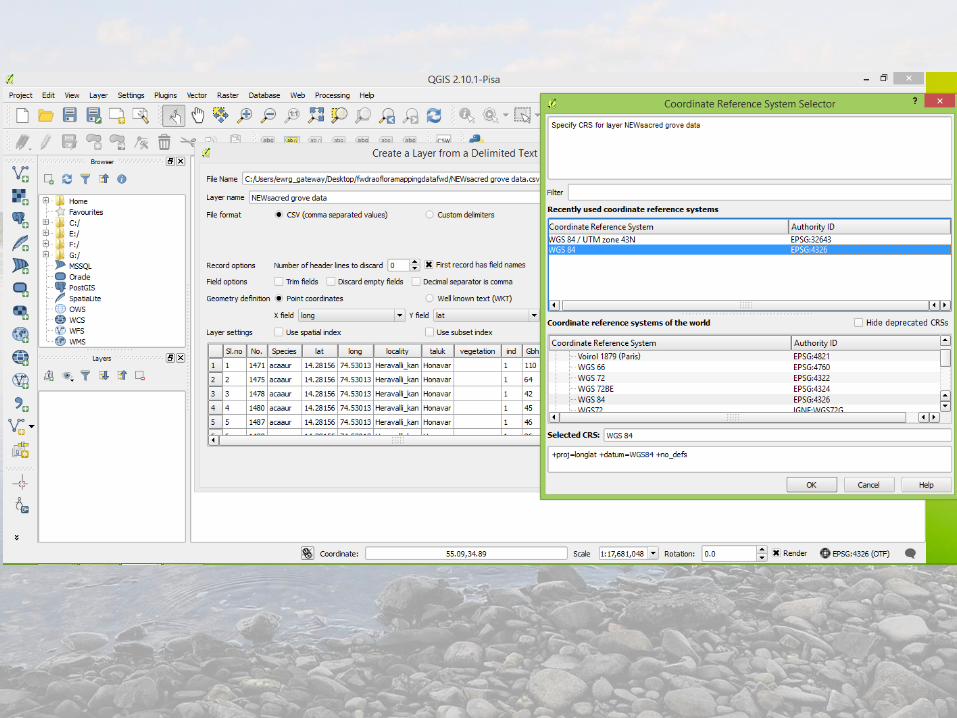
Projections – Earth is SPHEROID!
You can change projection by right click properties or save as option to
save a new file with you own projection.
The global default CRS is EPSG:4326 - WGS 84 (proj=longlat +ellps=WGS84
+datum=WGS84 +no_defs)
Options for global and project-wide CRS (Coordinate Reference System)
for layers.
allows to define custom coordinate reference systems and supports on-the-
fly (OTF) projection of vector and raster layers - Can display layers (with
different CRS) and options for overlay.
QGIS supports >2,700 known CRS. Definitions for each of these CRS are
stored in a SQLite database that is installed with QGIS. 29
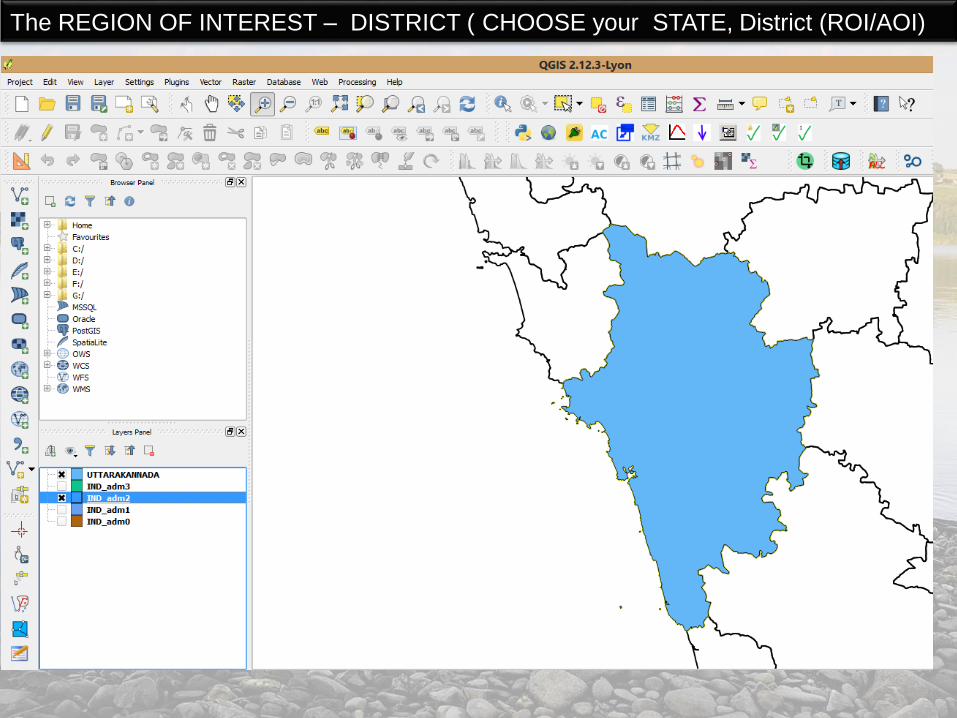
The REGION OF INTEREST – DISTRICT ( CHOOSE your STATE, District (ROI/AOI)
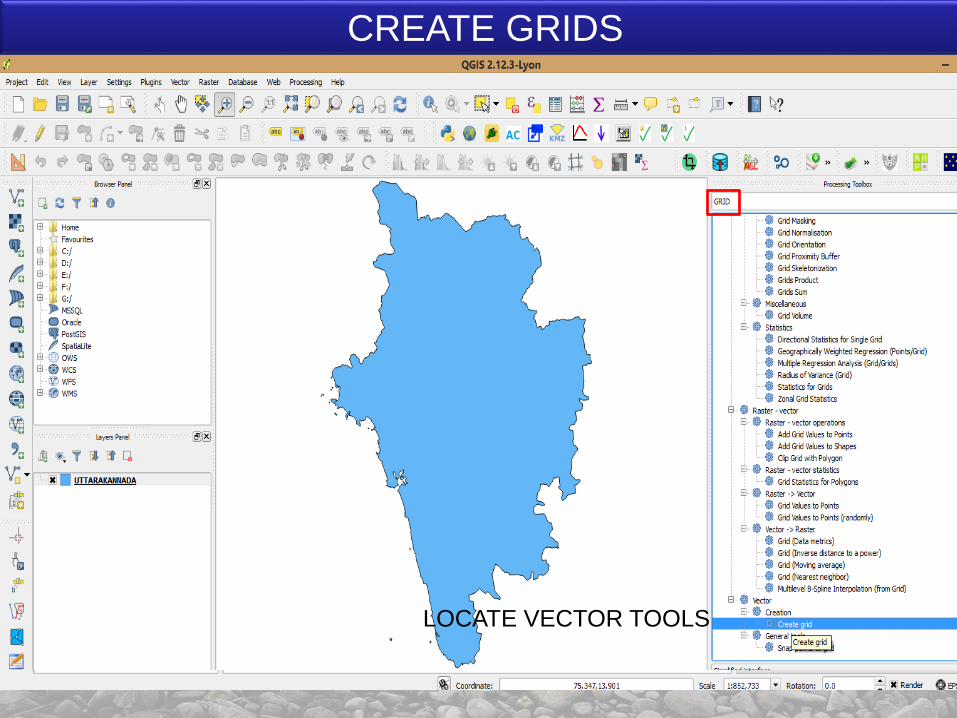
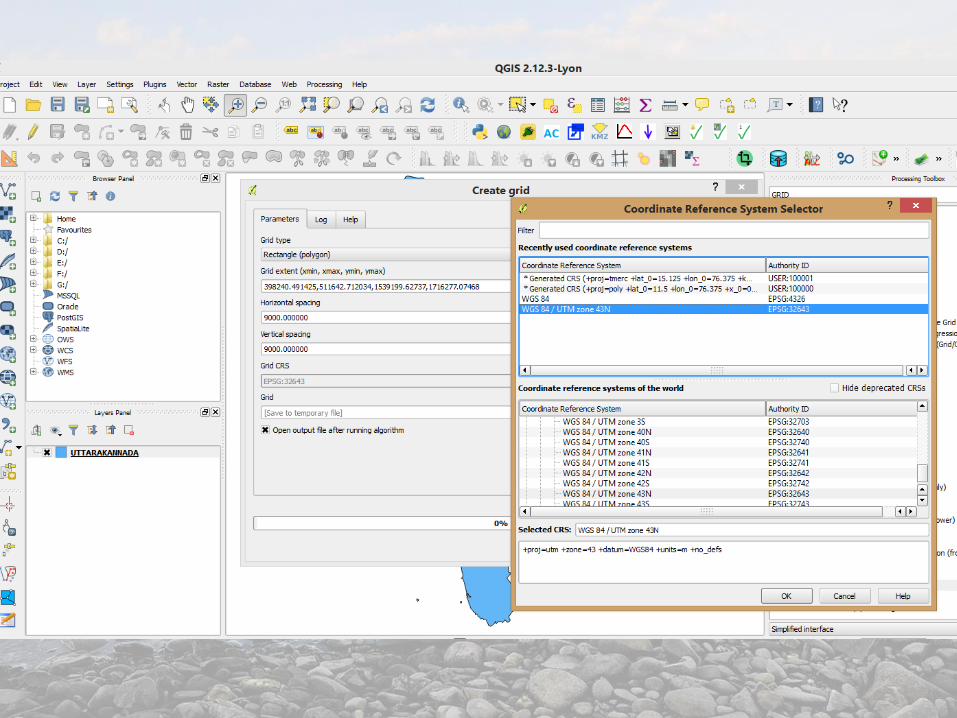
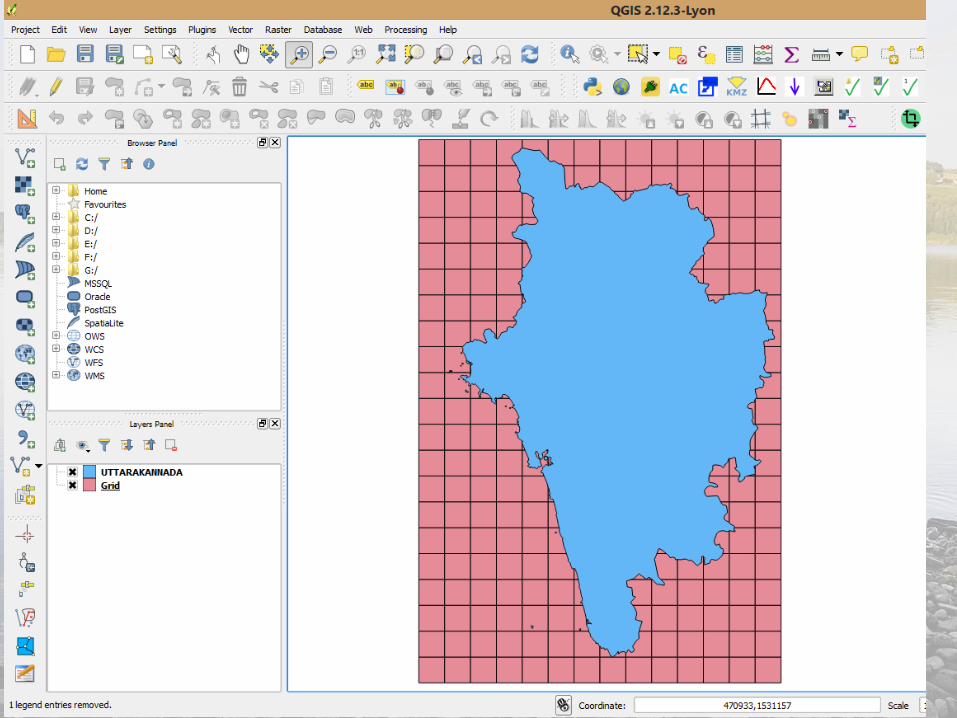
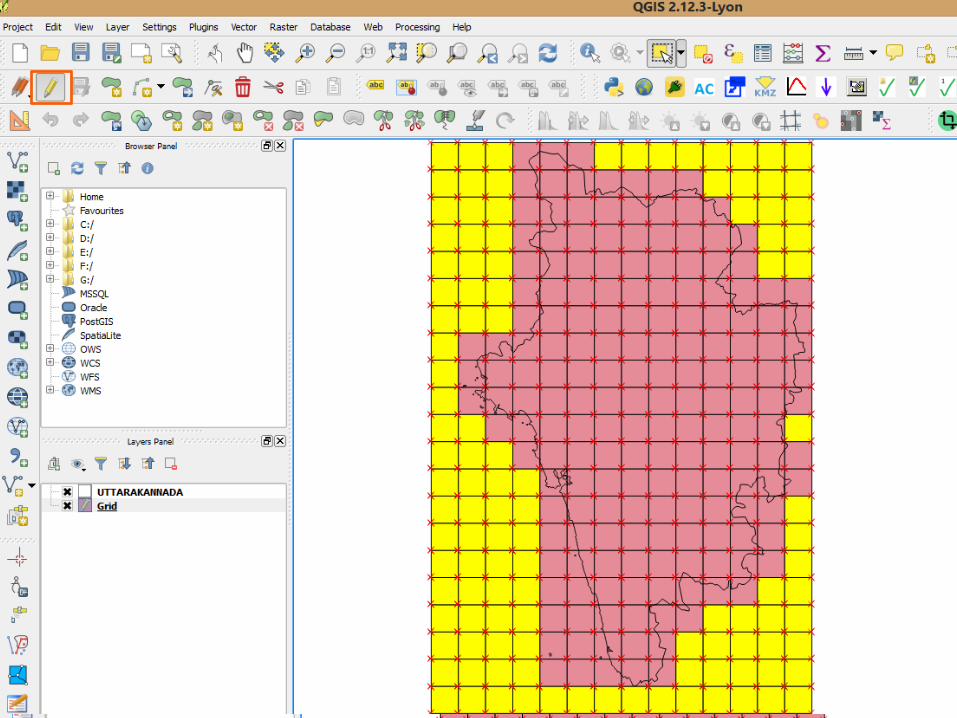
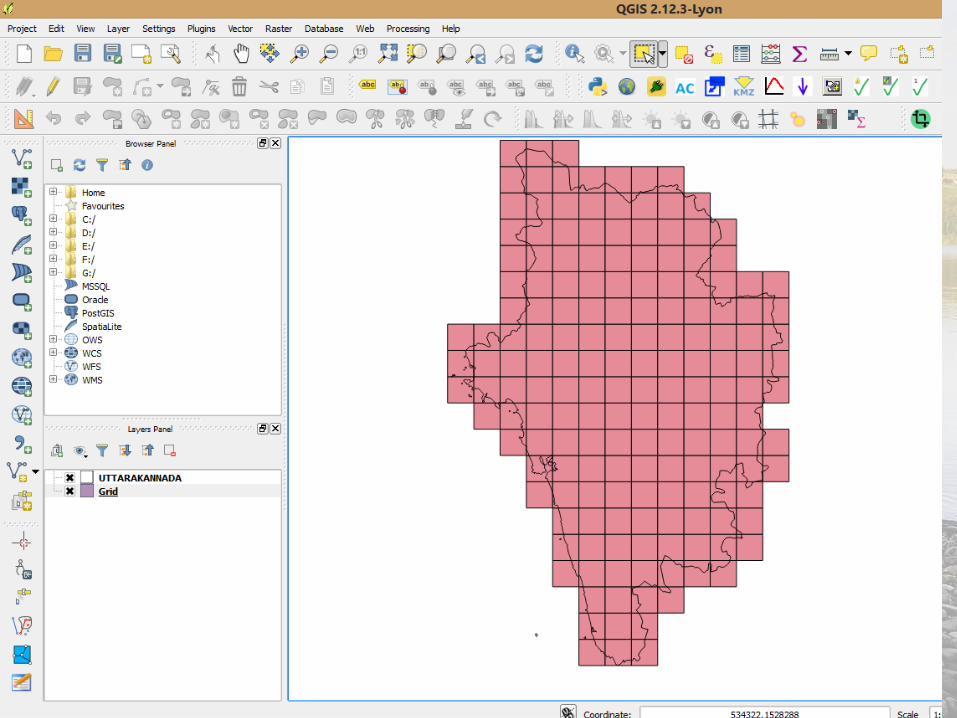
CREATE GRIDS
LOCATE VECTOR TOOLS
STEP 1
STEP 2
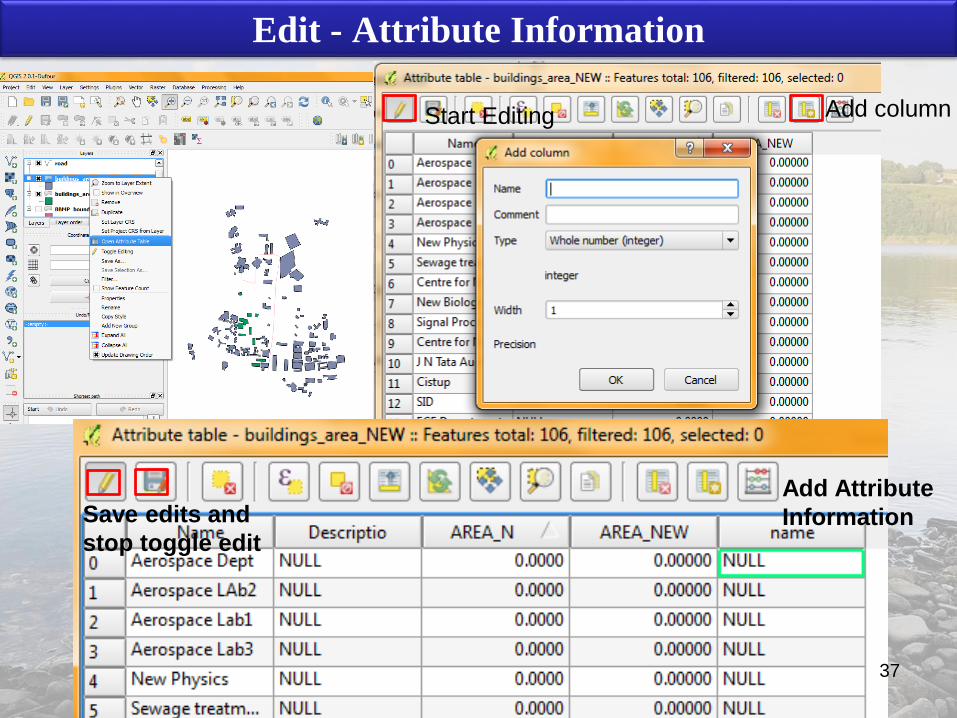
Edit - Attribute Information
Start Editing Add column
Add Attribute
InformationSave edits and
stop toggle edit
37
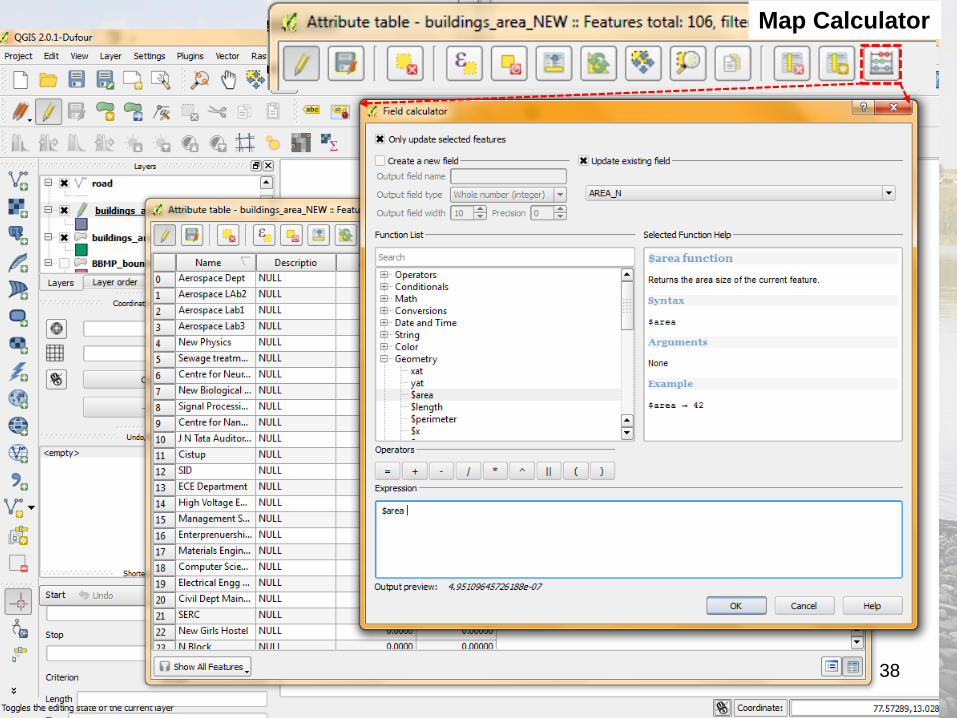
Map Calculator
38
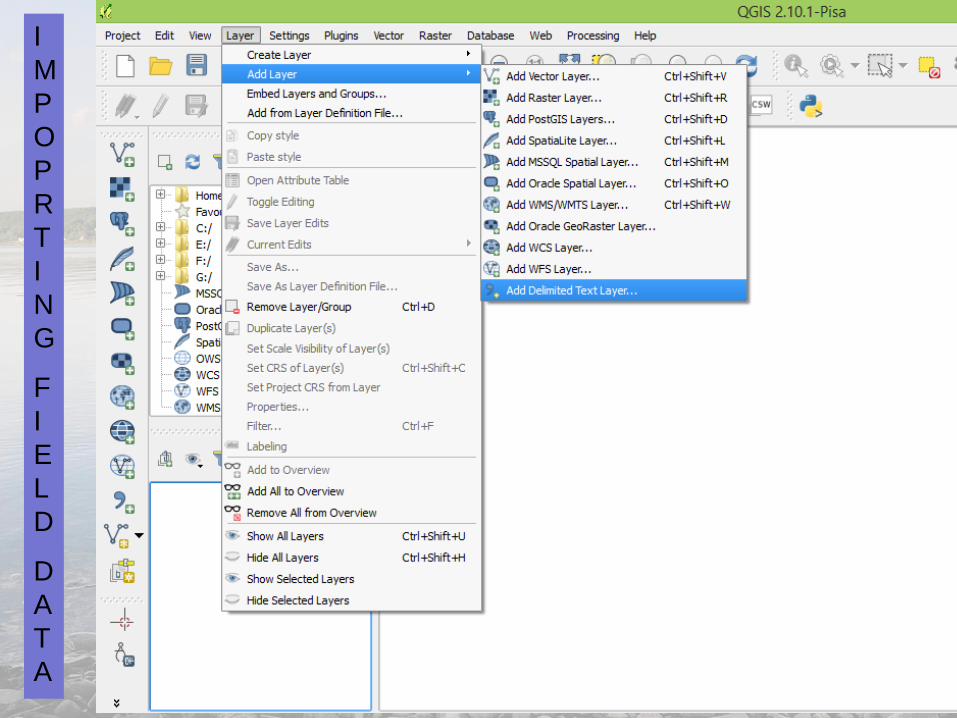
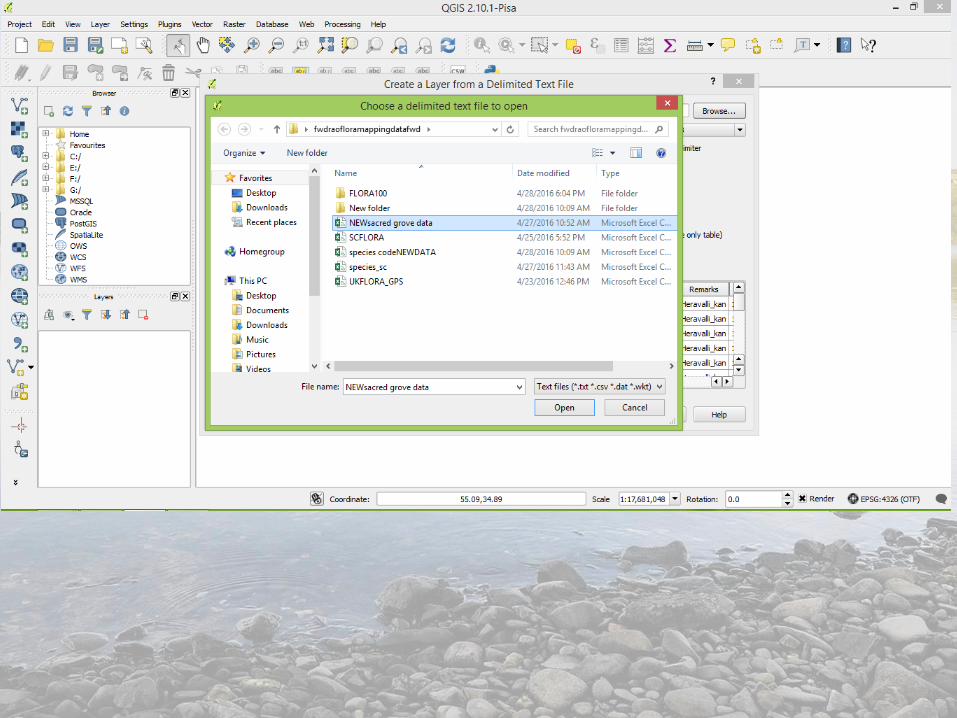
I
M
P
O
P
R
T
I
N
G
F
I
E
L
D
D
A
T
A
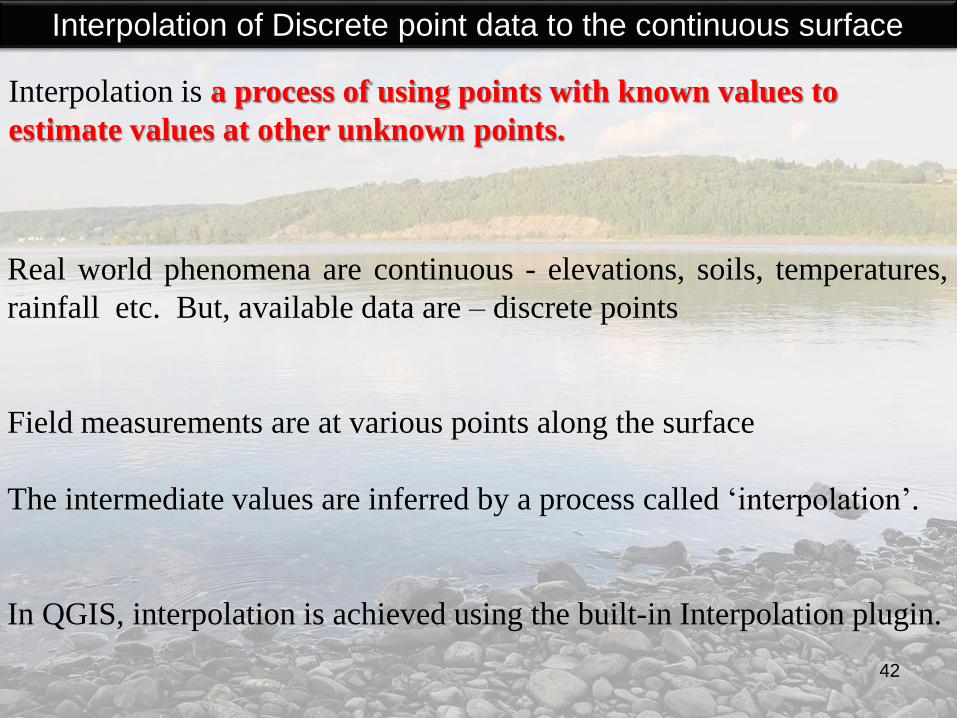
Real world phenomena are continuous - elevations, soils, temperatures,
rainfall etc. But, available data are – discrete points
Field measurements are at various points along the surface
The intermediate values are inferred by a process called ‘interpolation’.
In QGIS, interpolation is achieved using the built-in Interpolation plugin.
Interpolation of Discrete point data to the continuous surface
Interpolation is a process of using points with known values to
estimate values at other unknown points.
42
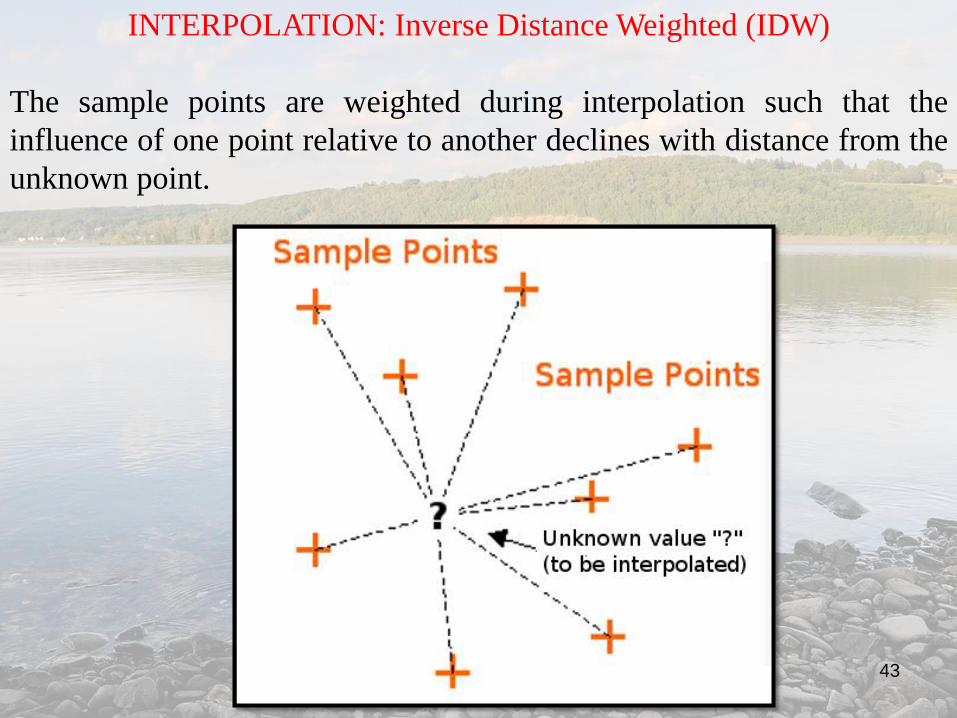
INTERPOLATION: Inverse Distance Weighted (IDW)
The sample points are weighted during interpolation such that the
influence of one point relative to another declines with distance from the
unknown point.
43
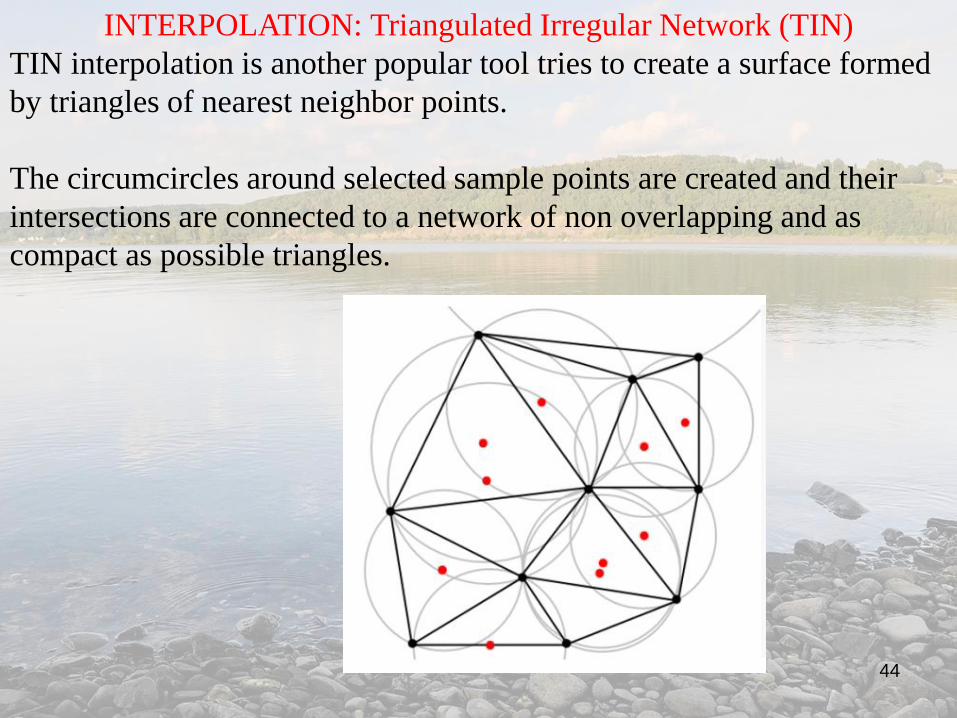
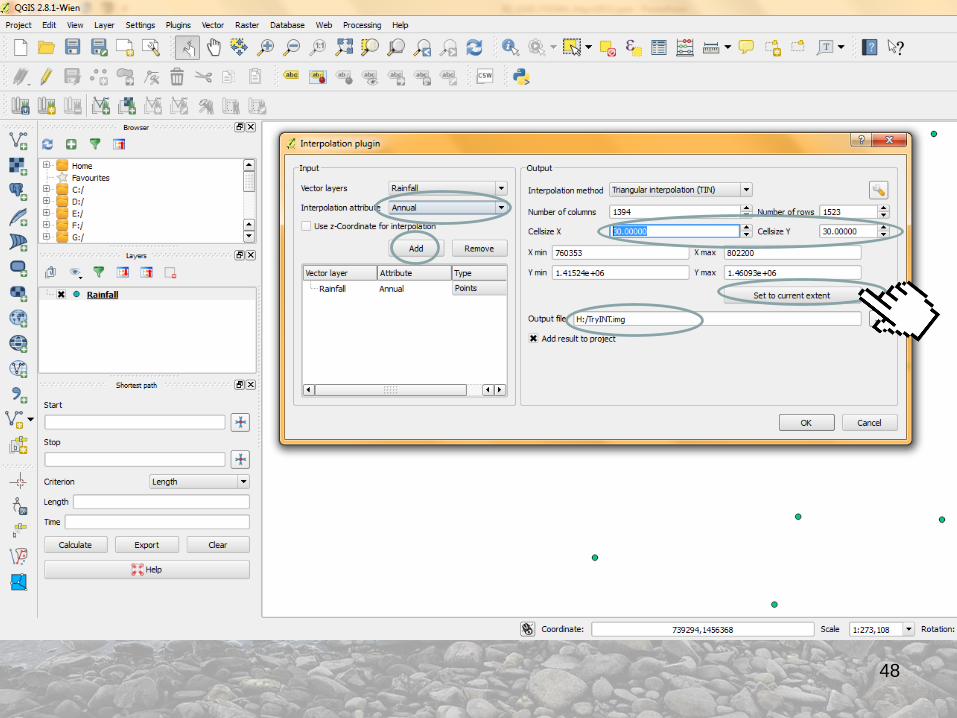
INTERPOLATION: Triangulated Irregular Network (TIN)
TIN interpolation is another popular tool tries to create a surface formed
by triangles of nearest neighbor points.
The circumcircles around selected sample points are created and their
intersections are connected to a network of non overlapping and as
compact as possible triangles.
44
45
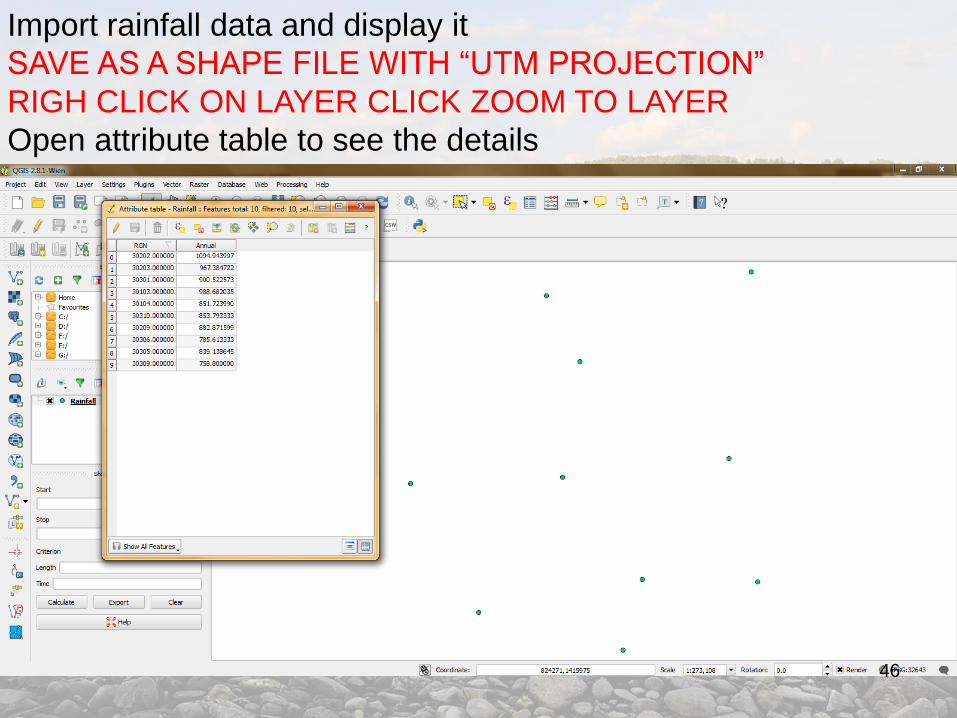
Import rainfall data and display it
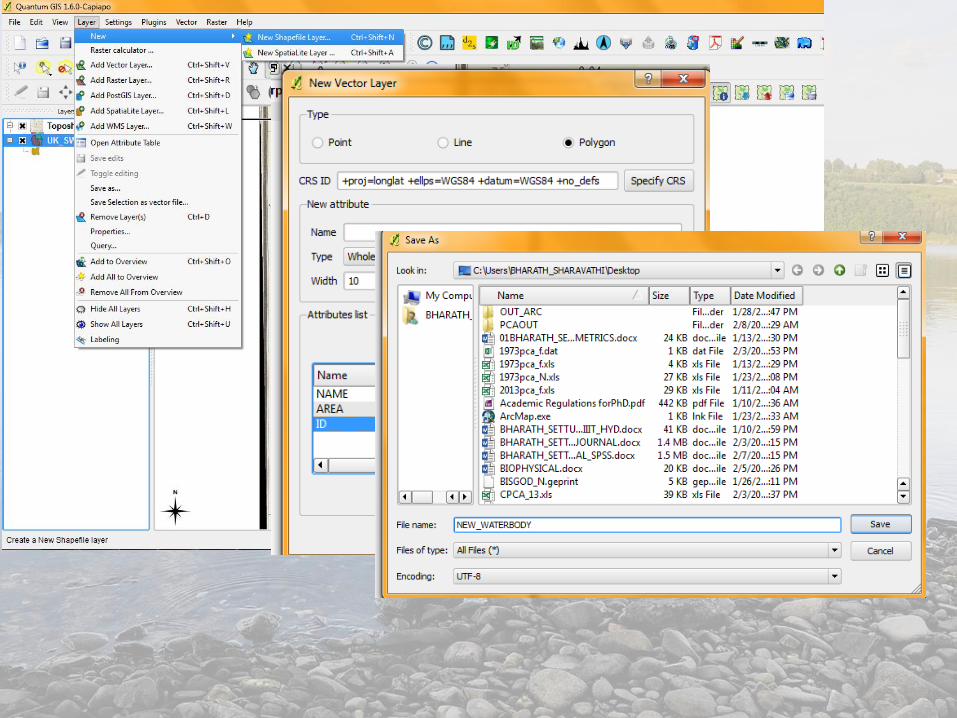
SAVE AS A SHAPE FILE WITH “UTM PROJECTION”
RIGH CLICK ON LAYER CLICK ZOOM TO LAYER
Open attribute table to see the details
46
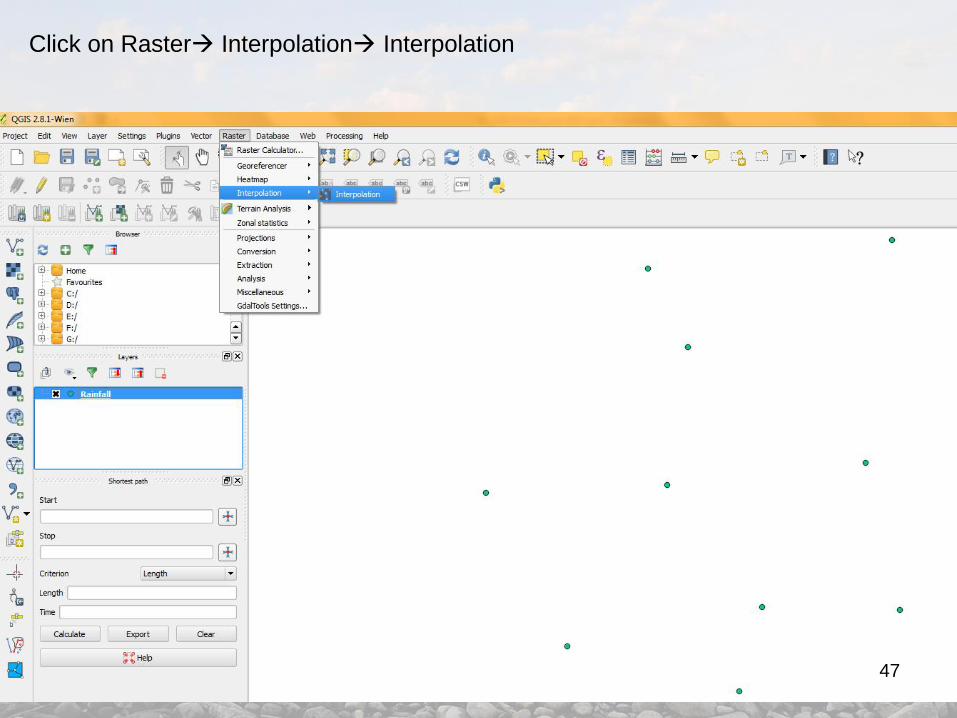
Click on Raster Interpolation Interpolation
47
48
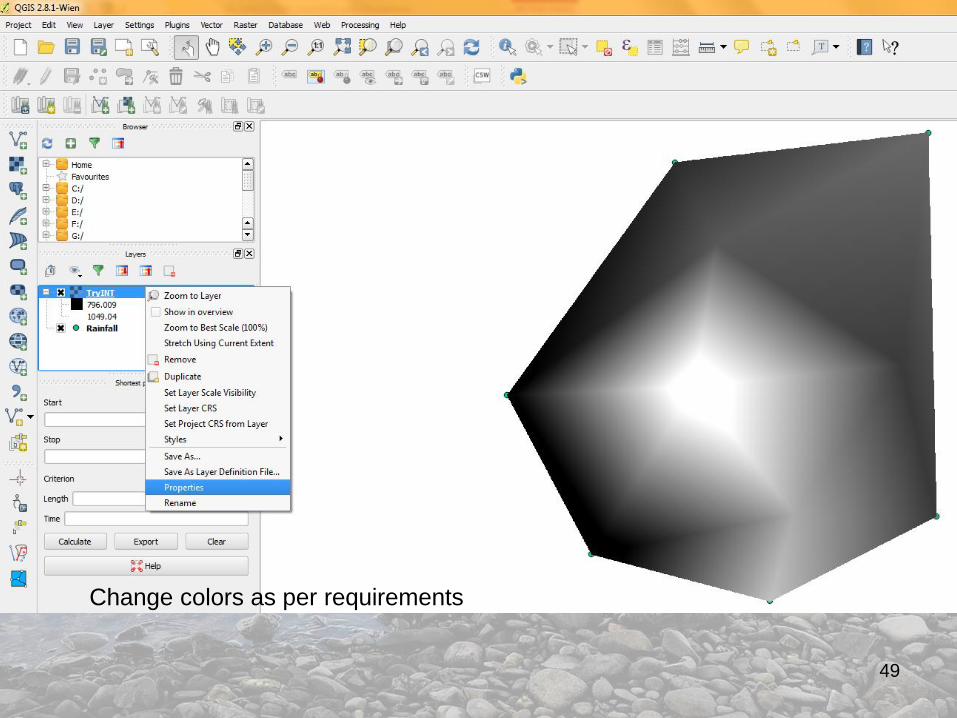
Change colors as per requirements
49
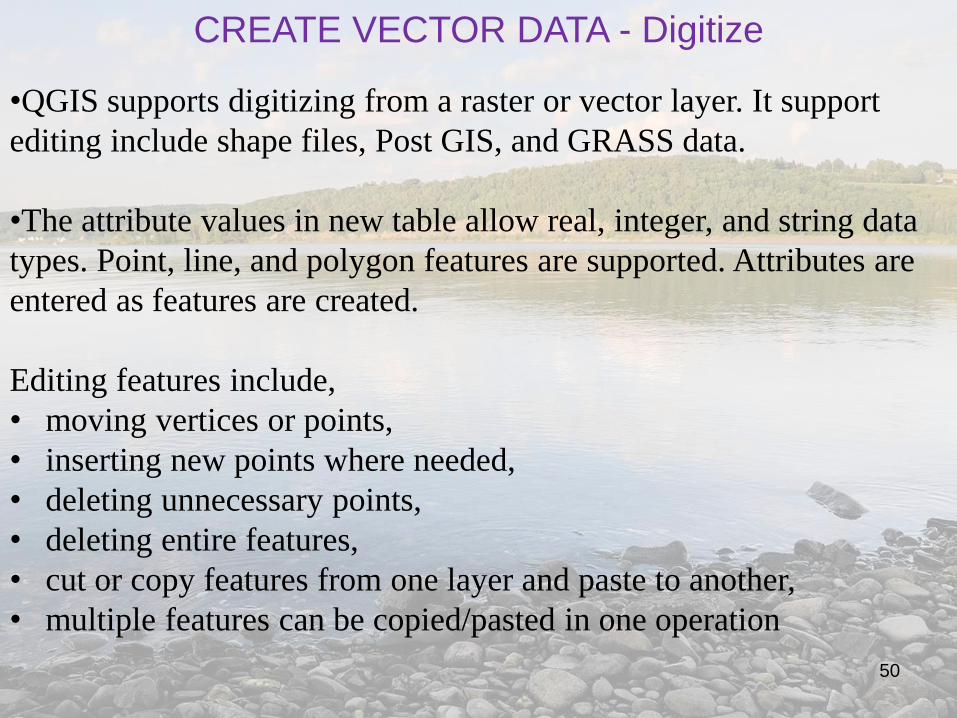
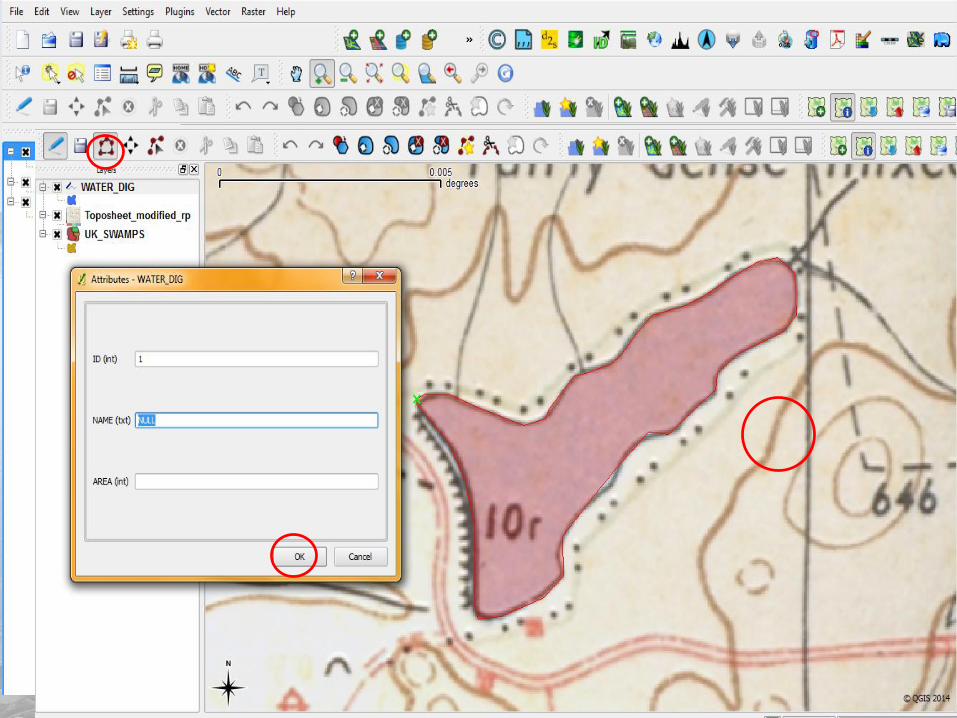
CREATE VECTOR DATA - Digitize
•QGIS supports digitizing from a raster or vector layer. It support
editing include shape files, Post GIS, and GRASS data.
•The attribute values in new table allow real, integer, and string data
types. Point, line, and polygon features are supported. Attributes are
entered as features are created.
Editing features include,
• moving vertices or points,
• inserting new points where needed,
• deleting unnecessary points,
• deleting entire features,
• cut or copy features from one layer and paste to another,
• multiple features can be copied/pasted in one operation
50
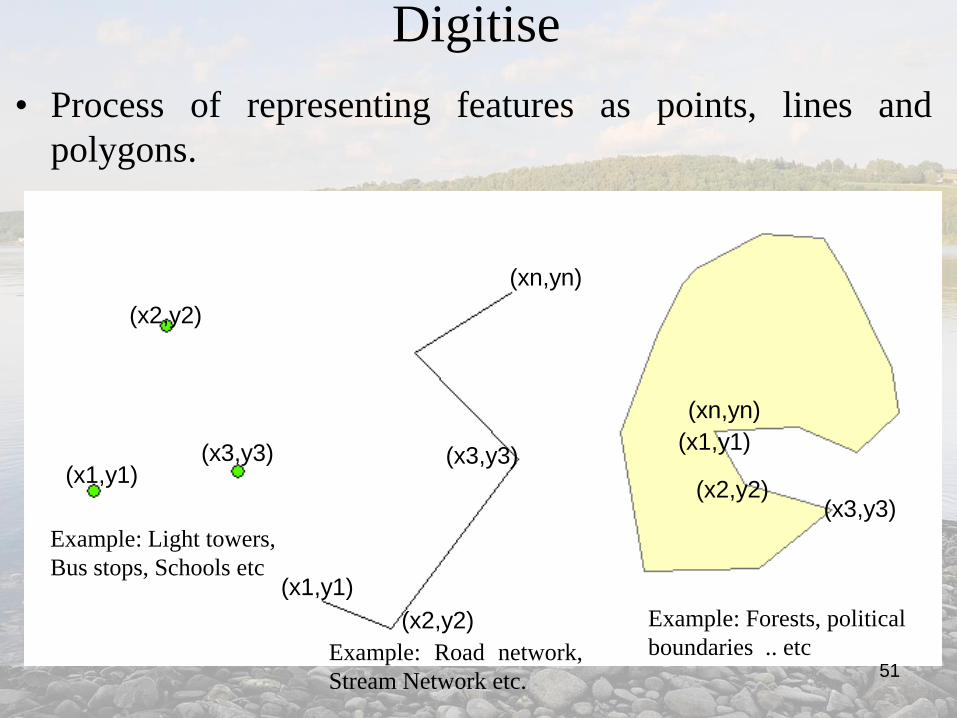
Digitise
• Process of representing features as points, lines and
polygons.
Example: Light towers,
Bus stops, Schools etc
Example: Road network,
Stream Network etc.
Example: Forests, political
boundaries .. etc
(x1,y1)
(x2,y2)
(x3,y3) (x3,y3)
(x1,y1)
(x2,y2)
(xn,yn)
(xn,yn)
(x1,y1)
(x3,y3)(x2,y2)
51
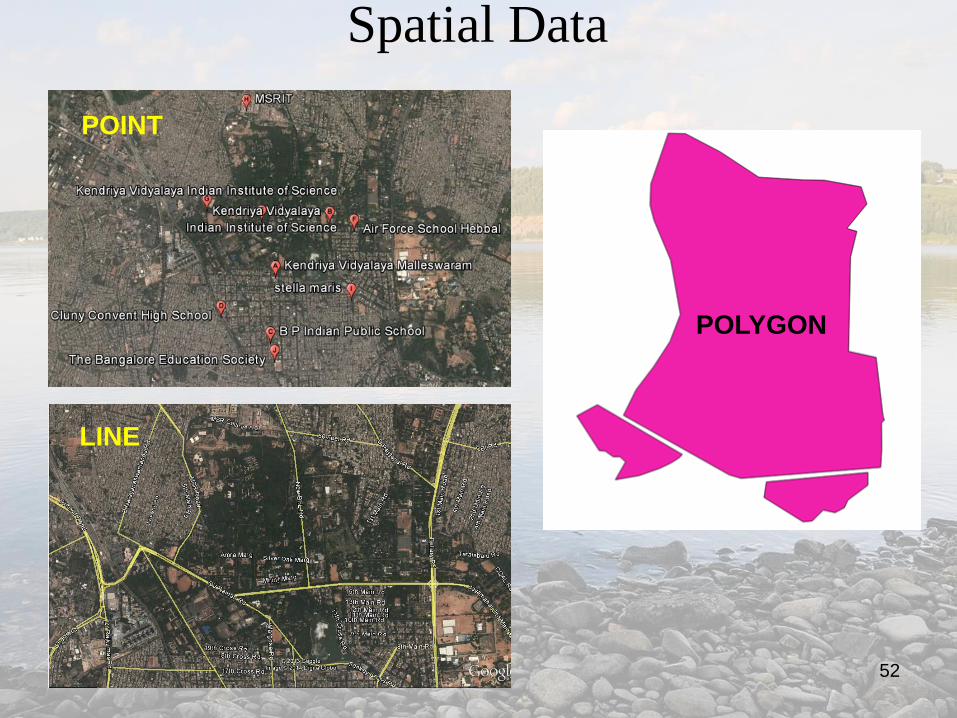
Spatial Data
POINT
LINE
POLYGON
52
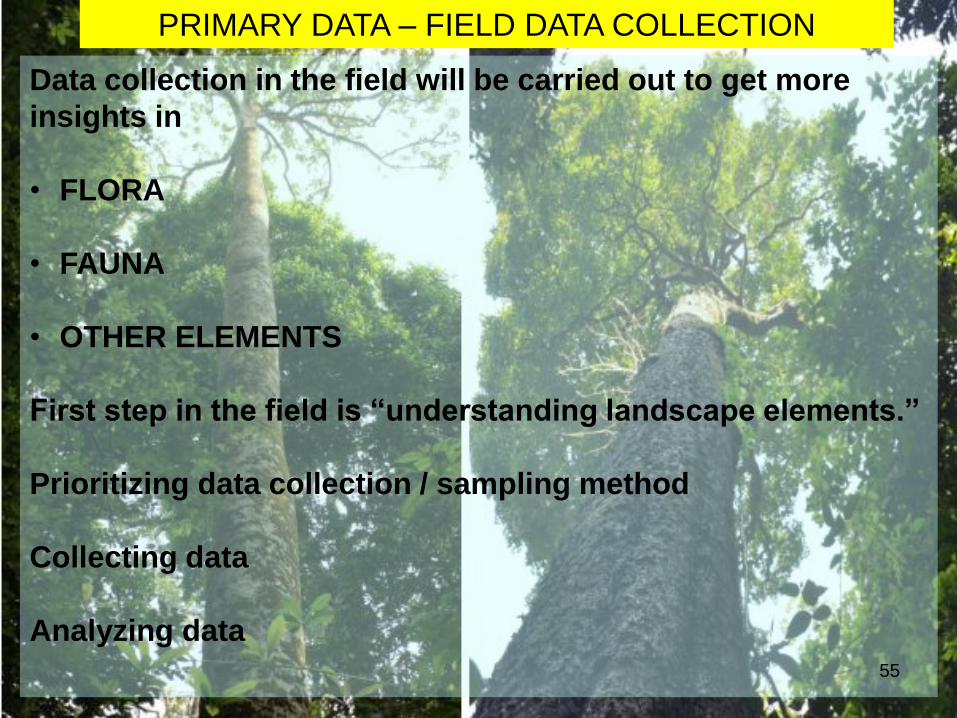
PRIMARY DATA – FIELD DATA COLLECTION
Data collection in the field will be carried out to get more
insights in
• FLORA
• FAUNA
• OTHER ELEMENTS
First step in the field is “understanding landscape elements.”
Prioritizing data collection / sampling method
Collecting data
Analyzing data55
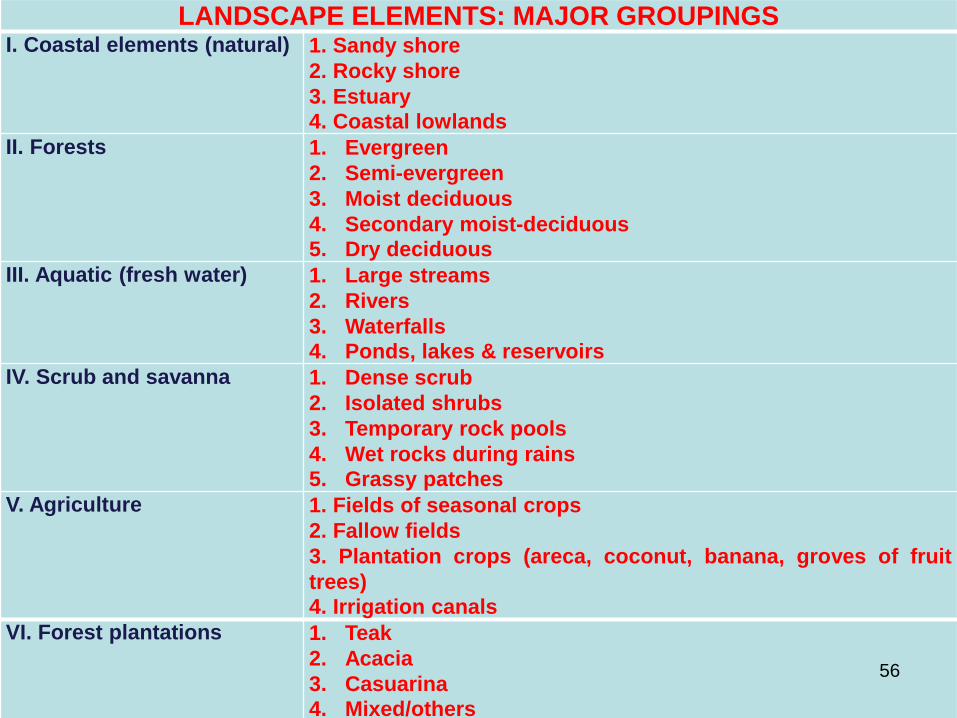
LANDSCAPE ELEMENTS: MAJOR GROUPINGS I. Coastal elements (natural) 1. Sandy shore
2. Rocky shore
3. Estuary
4. Coastal lowlands
II. Forests 1. Evergreen
2. Semi-evergreen
3. Moist deciduous
4. Secondary moist-deciduous
5. Dry deciduous
III. Aquatic (fresh water) 1. Large streams
2. Rivers
3. Waterfalls
4. Ponds, lakes & reservoirs
IV. Scrub and savanna 1. Dense scrub
2. Isolated shrubs
3. Temporary rock pools
4. Wet rocks during rains
5. Grassy patches
V. Agriculture 1. Fields of seasonal crops
2. Fallow fields
3. Plantation crops (areca, coconut, banana, groves of fruit
trees)
4. Irrigation canals
VI. Forest plantations 1. Teak
2. Acacia
3. Casuarina
4. Mixed/others
56
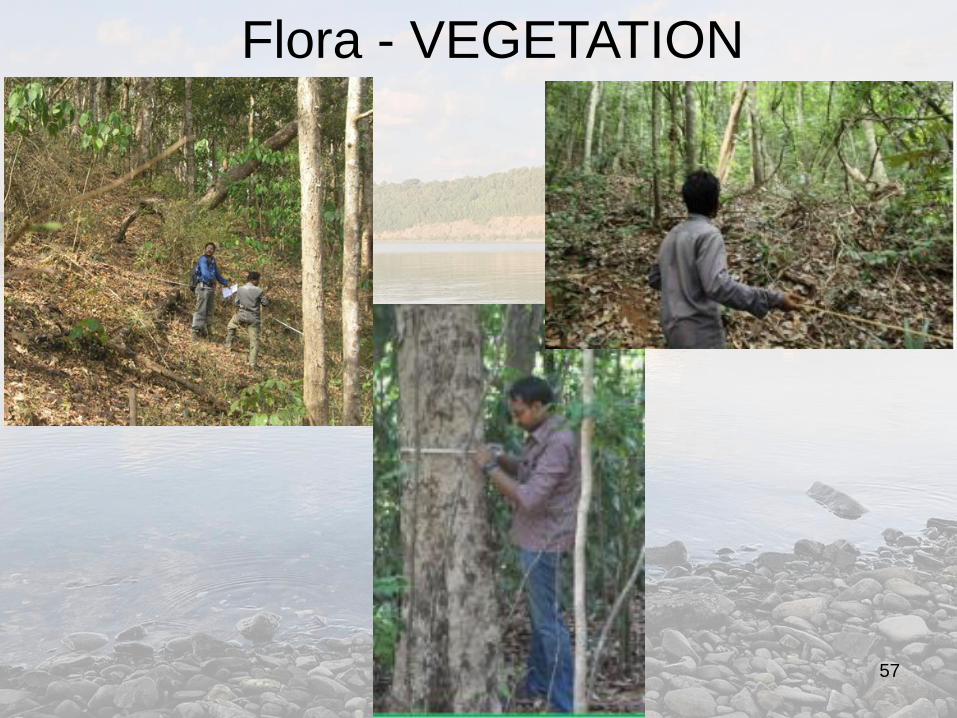
Flora - VEGETATION
57
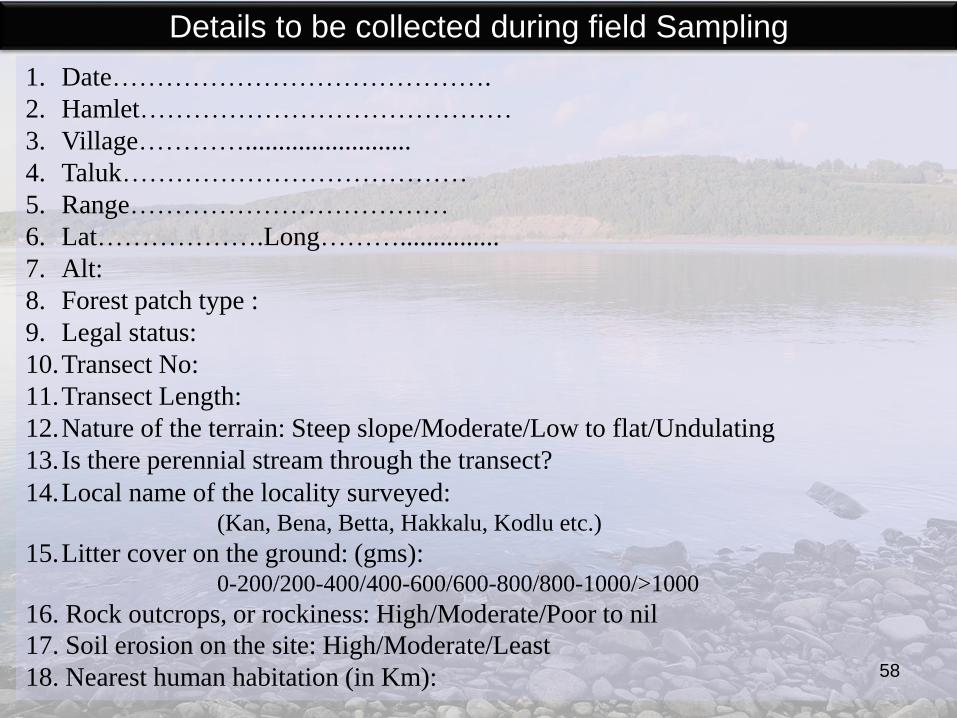
Details to be collected during field Sampling
1. Date…………………………………….
2. Hamlet……………………………………
3. Village………….........................
4. Taluk…………………………………
5. Range………………………………
6. Lat……………….Long………...............
7. Alt:
8. Forest patch type :
9. Legal status:
10.Transect No:
11.Transect Length:
12.Nature of the terrain: Steep slope/Moderate/Low to flat/Undulating
13.Is there perennial stream through the transect?
14.Local name of the locality surveyed:(Kan, Bena, Betta, Hakkalu, Kodlu etc.)
15.Litter cover on the ground: (gms):0-200/200-400/400-600/600-800/800-1000/>1000
16. Rock outcrops, or rockiness: High/Moderate/Poor to nil
17. Soil erosion on the site: High/Moderate/Least
18. Nearest human habitation (in Km): 58
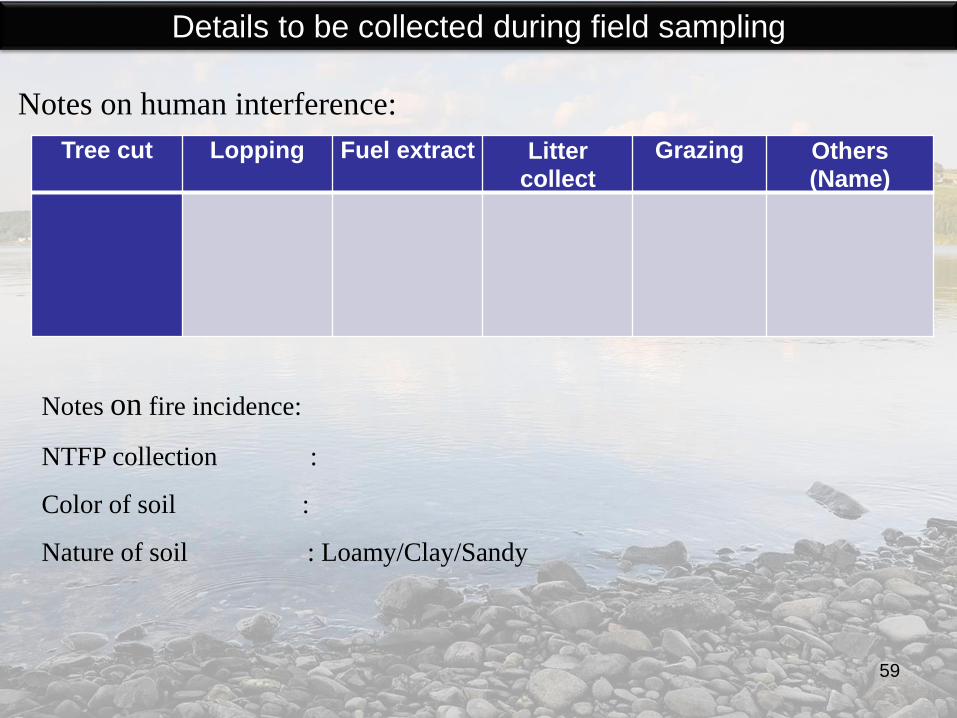
Details to be collected during field sampling
Tree cut Lopping Fuel extract Litter
collect
Grazing Others
(Name)
Notes on human interference:
Notes on fire incidence:
NTFP collection :
Color of soil :
Nature of soil : Loamy/Clay/Sandy
59
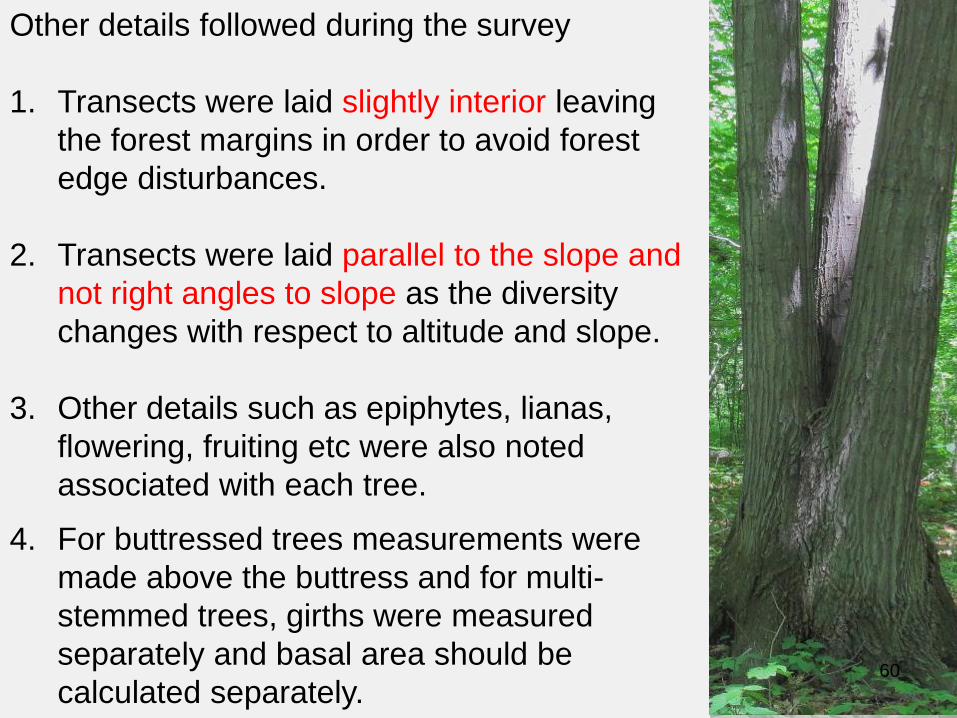
Other details followed during the survey
1. Transects were laid slightly interior leaving
the forest margins in order to avoid forest
edge disturbances.
2. Transects were laid parallel to the slope and
not right angles to slope as the diversity
changes with respect to altitude and slope.
3. Other details such as epiphytes, lianas,
flowering, fruiting etc were also noted
associated with each tree.
4. For buttressed trees measurements were
made above the buttress and for multi-
stemmed trees, girths were measured
separately and basal area should be
calculated separately.60
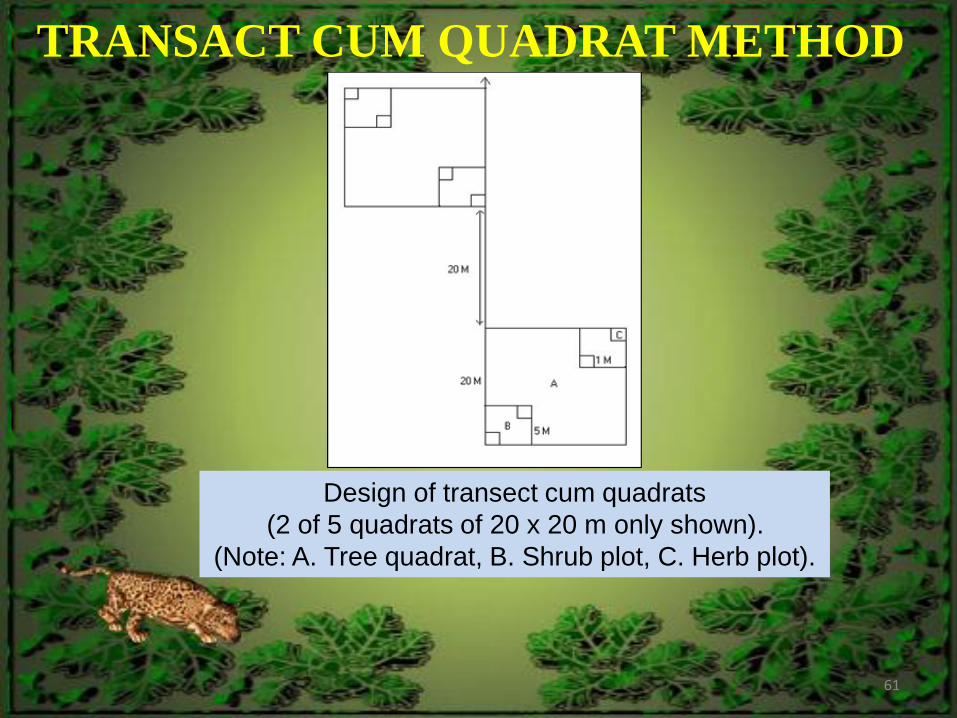
TRANSACT CUM QUADRAT METHOD
Design of transect cum quadrats
(2 of 5 quadrats of 20 x 20 m only shown).
(Note: A. Tree quadrat, B. Shrub plot, C. Herb plot).
61
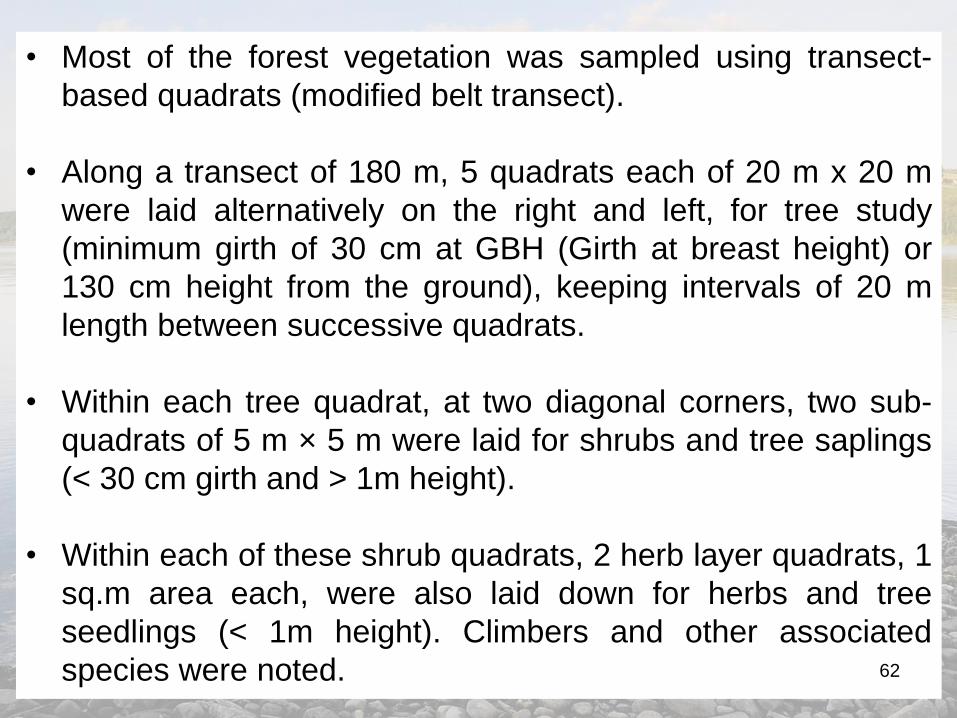
• Most of the forest vegetation was sampled using transect-
based quadrats (modified belt transect).
• Along a transect of 180 m, 5 quadrats each of 20 m x 20 m
were laid alternatively on the right and left, for tree study
(minimum girth of 30 cm at GBH (Girth at breast height) or
130 cm height from the ground), keeping intervals of 20 m
length between successive quadrats.
• Within each tree quadrat, at two diagonal corners, two sub-
quadrats of 5 m × 5 m were laid for shrubs and tree saplings
(< 30 cm girth and > 1m height).
• Within each of these shrub quadrats, 2 herb layer quadrats, 1
sq.m area each, were also laid down for herbs and tree
seedlings (< 1m height). Climbers and other associated
species were noted. 62
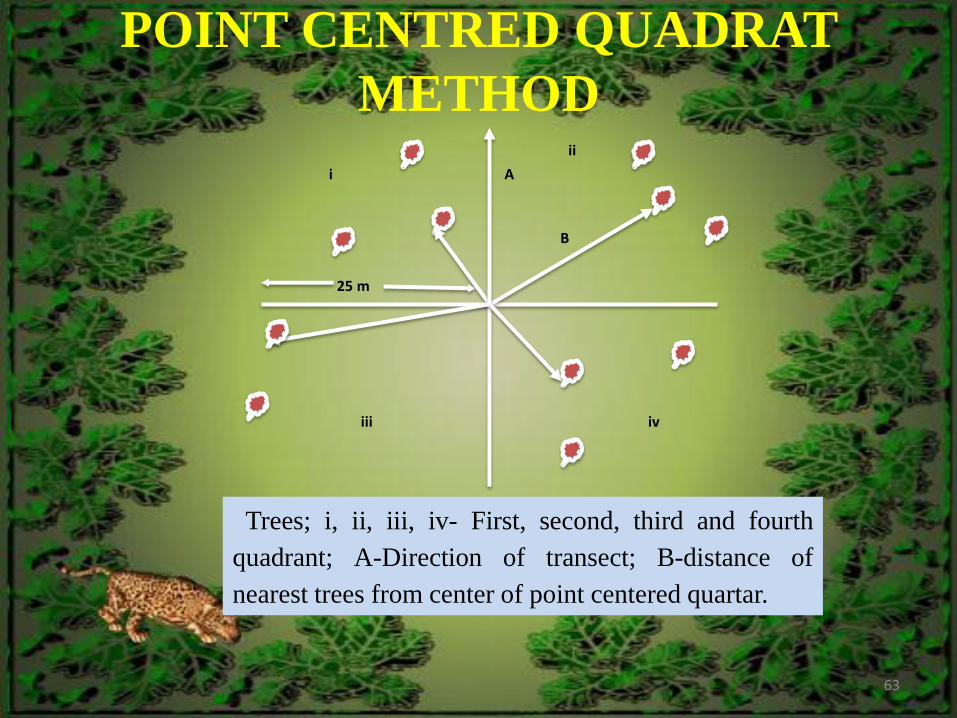
POINT CENTRED QUADRAT
METHOD
25 m
A
B
ii
i
iv iii
Trees; i, ii, iii, iv- First, second, third and fourth
quadrant; A-Direction of transect; B-distance of
nearest trees from center of point centered quartar.
63

• From each sector, tree data was obtained from 30 points
(with a distance of 50 m between points) covering 1.5
km., of total transect length.
• The advantage of this method is the fastness with which
large distances can be covered in relatively short times
compared to the quadrat method or others.
• At each point along the transect, using two sticks a cross
was made forming four quarters.
• In each quarter-distance to the nearest tree (minimum
GBH of 30 cm) from the central point was measured.
64
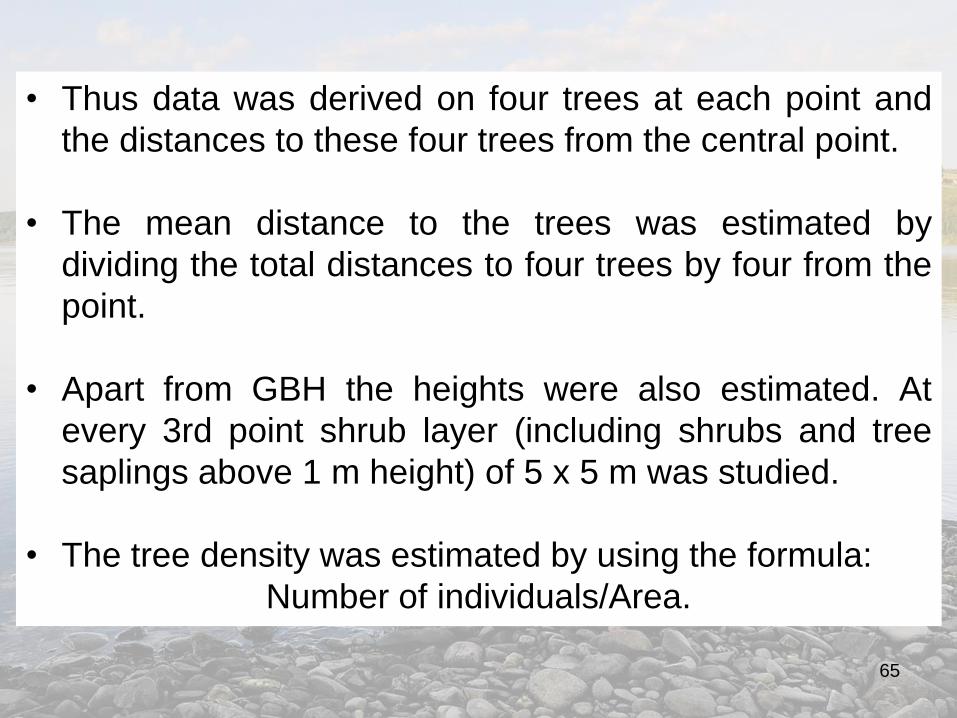
• Thus data was derived on four trees at each point and
the distances to these four trees from the central point.
• The mean distance to the trees was estimated by
dividing the total distances to four trees by four from the
point.
• Apart from GBH the heights were also estimated. At
every 3rd point shrub layer (including shrubs and tree
saplings above 1 m height) of 5 x 5 m was studied.
• The tree density was estimated by using the formula:
Number of individuals/Area.
65
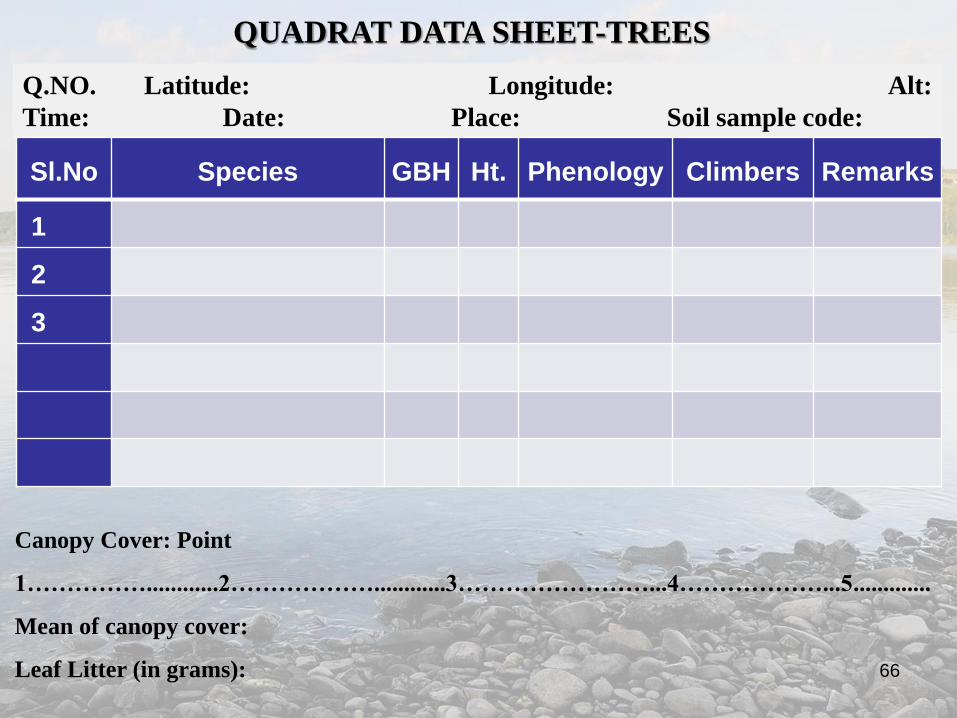
QUADRAT DATA SHEET-TREES
Q.NO. Latitude: Longitude: Alt:
Time: Date: Place: Soil sample code:
Sl.No Species GBH Ht. Phenology Climbers Remarks
1
2
3
Canopy Cover: Point
1……………............2………………............3……………………...4………………...5.............
Mean of canopy cover:
Leaf Litter (in grams): 66
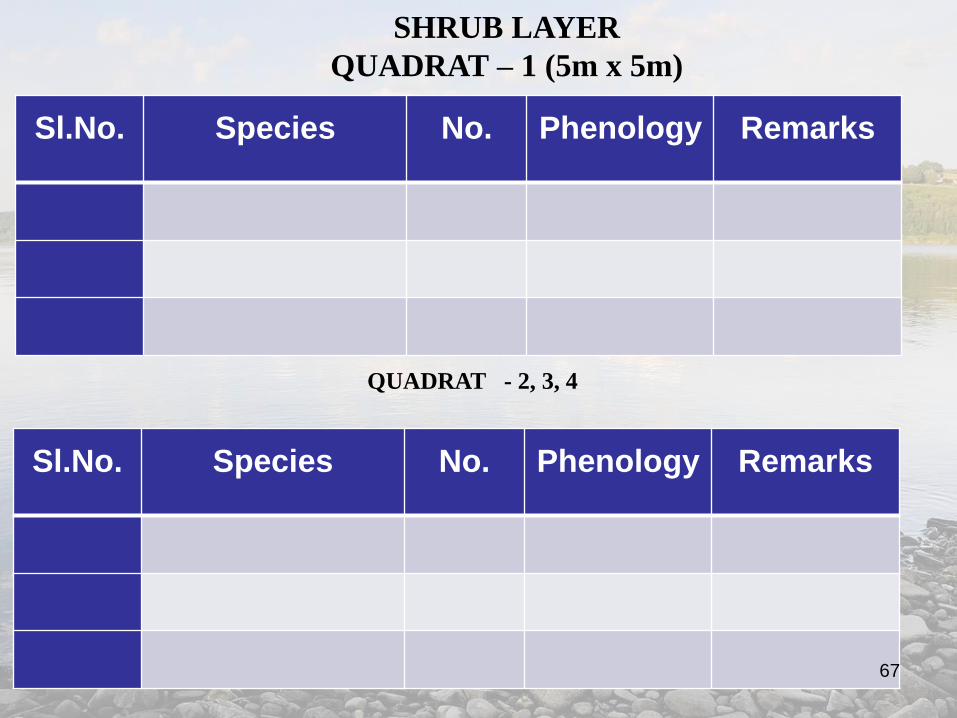
SHRUB LAYER
QUADRAT – 1 (5m x 5m)
Sl.No. Species No. Phenology Remarks
QUADRAT - 2, 3, 4
Sl.No. Species No. Phenology Remarks
67
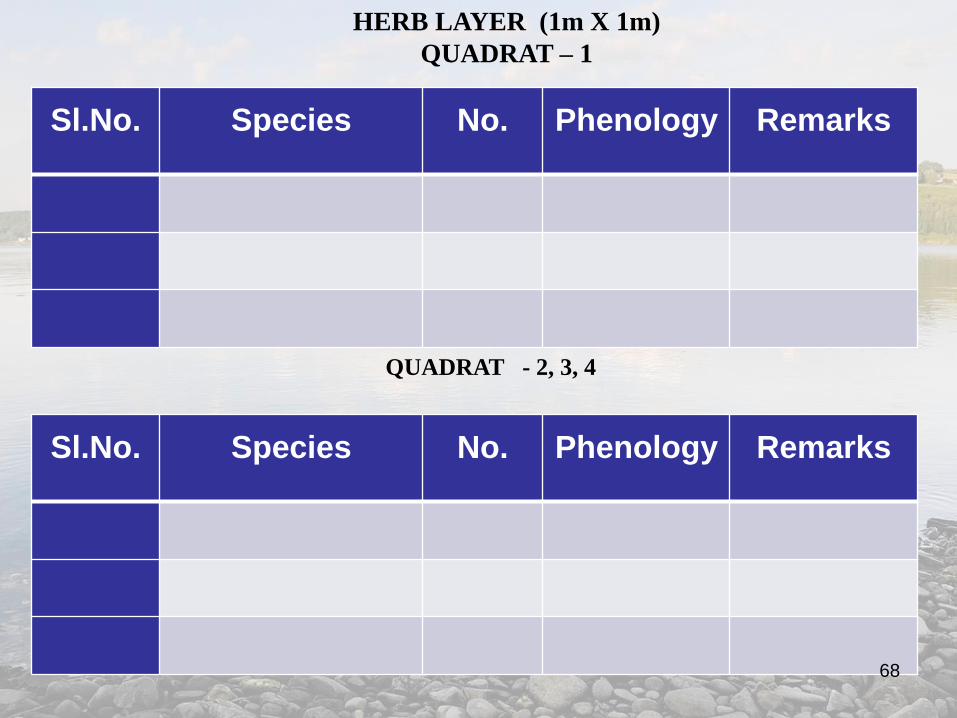
HERB LAYER (1m X 1m)
QUADRAT – 1
Sl.No. Species No. Phenology Remarks
QUADRAT - 2, 3, 4
Sl.No. Species No. Phenology Remarks
68
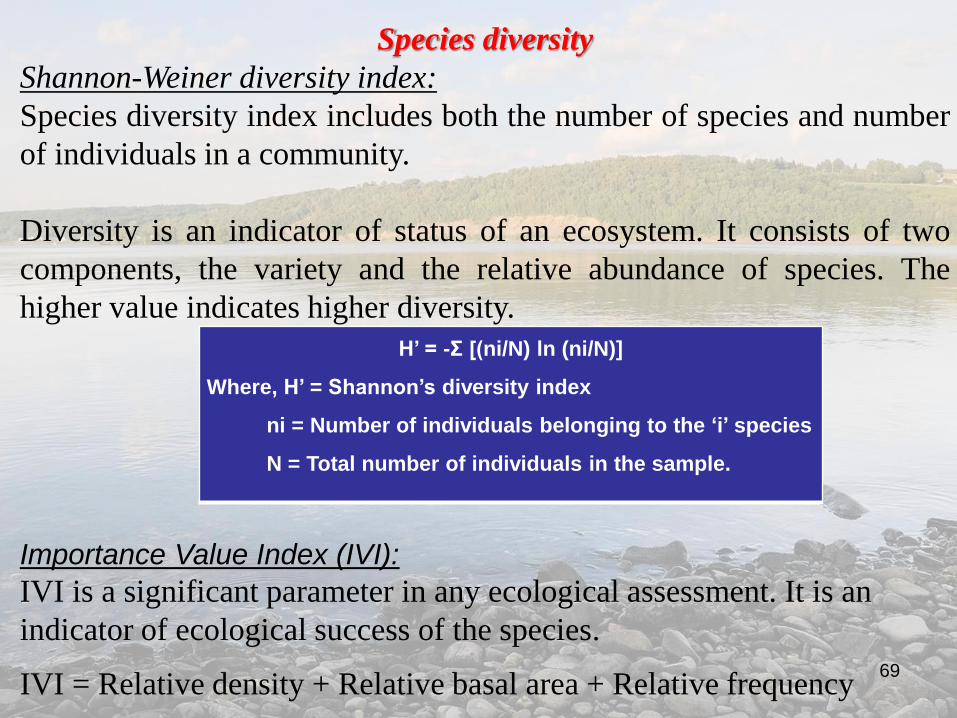
H’ = -Σ [(ni/N) ln (ni/N)]
Where, H’ = Shannon’s diversity index
ni = Number of individuals belonging to the ‘i’ species
N = Total number of individuals in the sample.
Species diversity
Shannon-Weiner diversity index:
Species diversity index includes both the number of species and number
of individuals in a community.
Diversity is an indicator of status of an ecosystem. It consists of two
components, the variety and the relative abundance of species. The
higher value indicates higher diversity.
Importance Value Index (IVI):
IVI is a significant parameter in any ecological assessment. It is an
indicator of ecological success of the species.
IVI = Relative density + Relative basal area + Relative frequency69
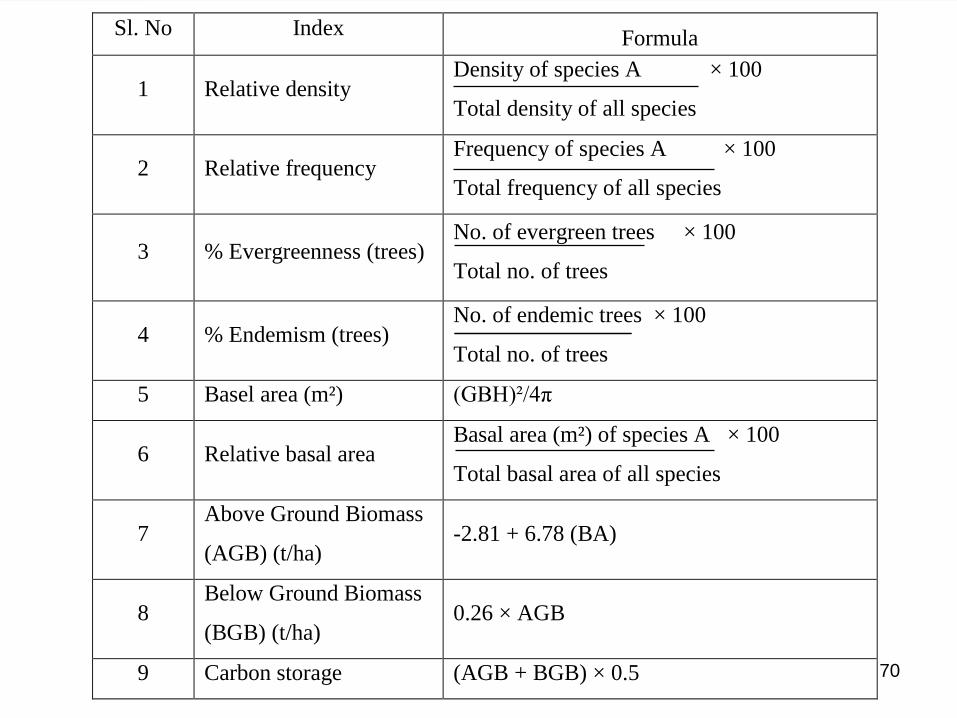
Sl. No Index Formula
1 Relative density Density of species A × 100
Total density of all species
2 Relative frequency Frequency of species A × 100
Total frequency of all species
3 % Evergreenness (trees) No. of evergreen trees × 100
Total no. of trees
4 % Endemism (trees) No. of endemic trees × 100
Total no. of trees
5 Basel area (m²) (GBH)²/4π
6 Relative basal area Basal area (m²) of species A × 100
Total basal area of all species
7 Above Ground Biomass
(AGB) (t/ha) -2.81 + 6.78 (BA)
8 Below Ground Biomass
(BGB) (t/ha) 0.26 × AGB
9 Carbon storage (AGB + BGB) × 0.5
1
70
IMPORT FIELD DATA (GPS) to QGIS
INTERSECTING AND CREATING GRID WISE DISTRIBUTION
71
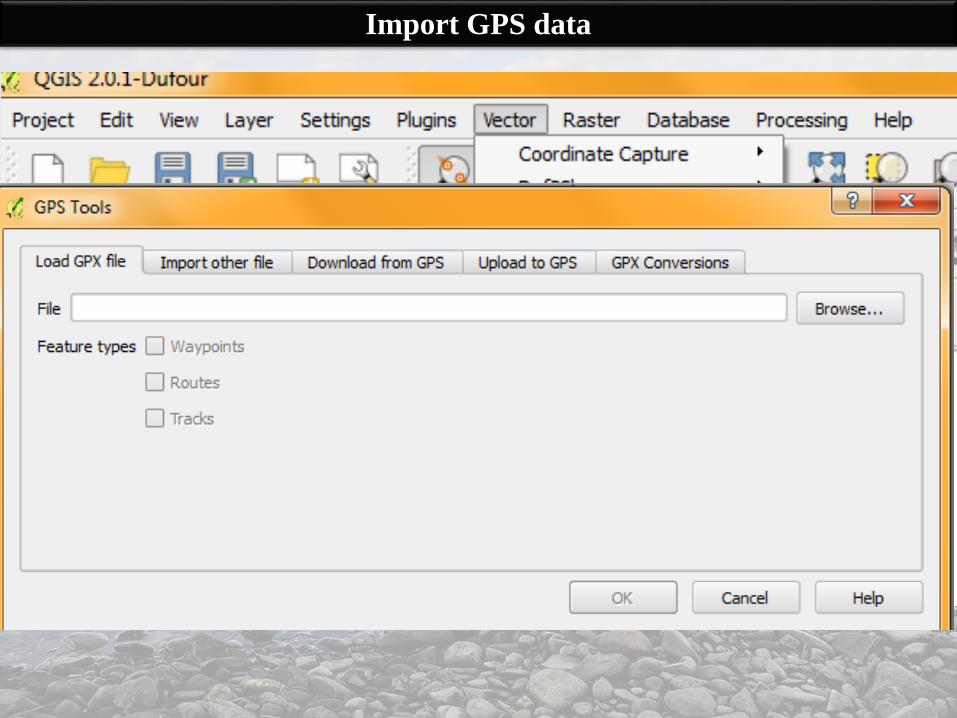
Import GPS data
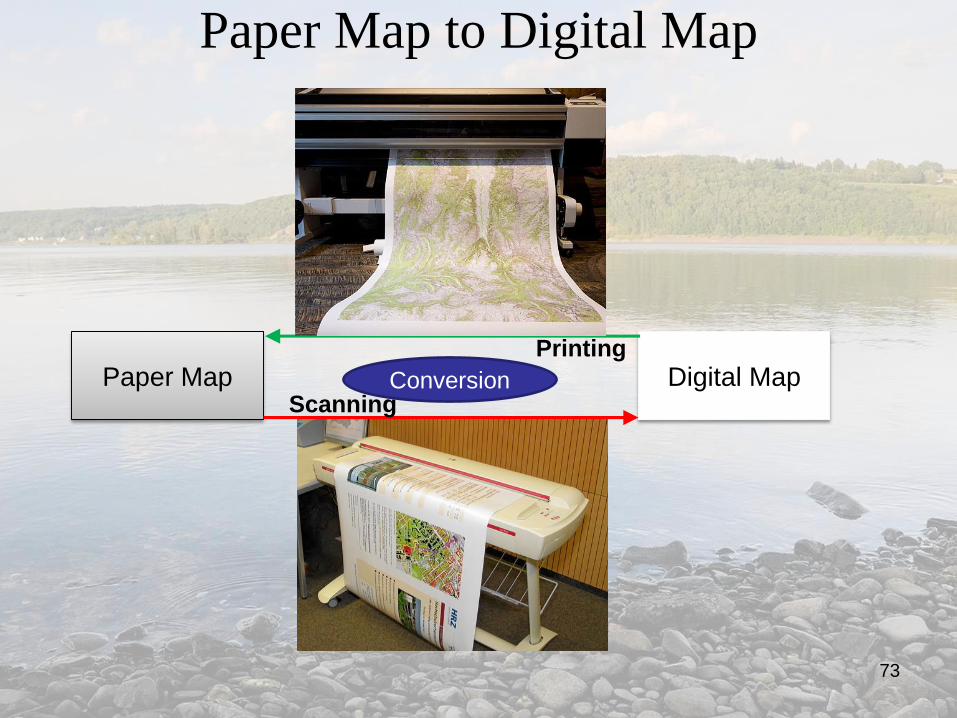
Paper Map to Digital Map
Paper Map Digital MapScanning
Printing
Conversion
73
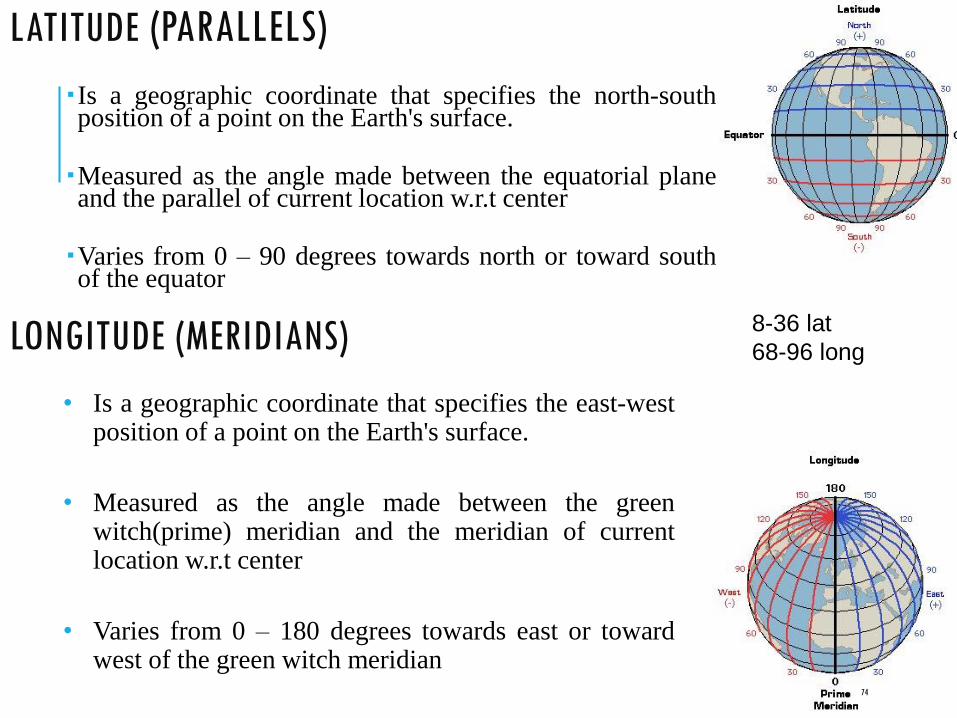
LATITUDE (PARALLELS)
Is a geographic coordinate that specifies the north-southposition of a point on the Earth's surface.
Measured as the angle made between the equatorial planeand the parallel of current location w.r.t center
Varies from 0 – 90 degrees towards north or toward southof the equator
LONGITUDE (MERIDIANS)
• Is a geographic coordinate that specifies the east-westposition of a point on the Earth's surface.
• Measured as the angle made between the greenwitch(prime) meridian and the meridian of currentlocation w.r.t center
• Varies from 0 – 180 degrees towards east or towardwest of the green witch meridian
8-36 lat
68-96 long
74

75
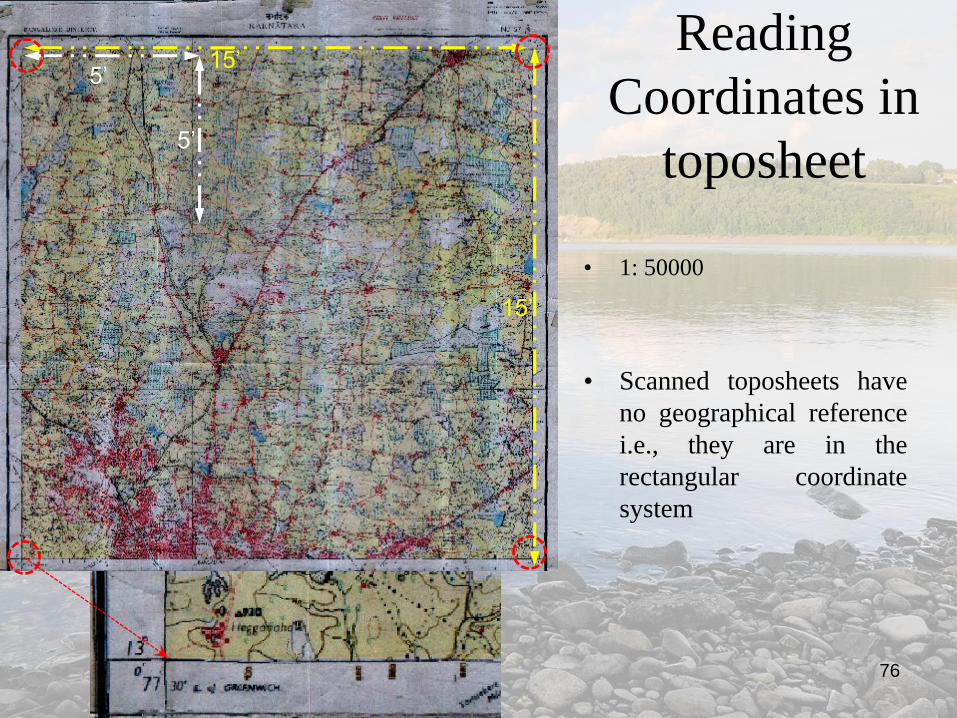
Reading
Coordinates in
toposheet
• 1: 50000
• Scanned toposheets have
no geographical reference
i.e., they are in the
rectangular coordinate
system
15’
15’
5’
5’
76
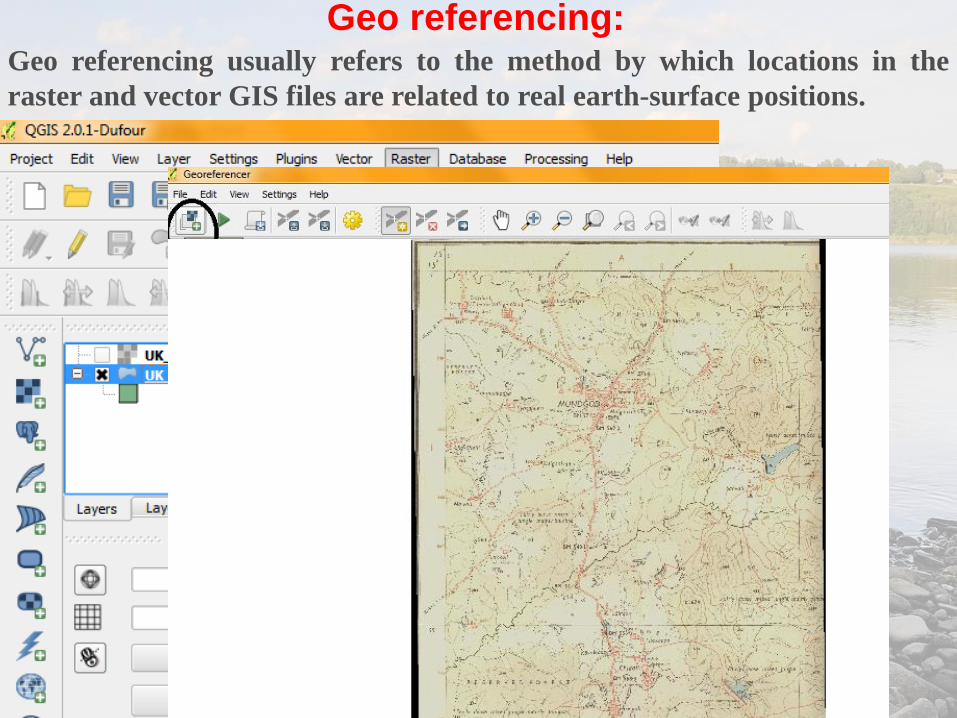
Geo referencing: Geo referencing usually refers to the method by which locations in the
raster and vector GIS files are related to real earth-surface positions.
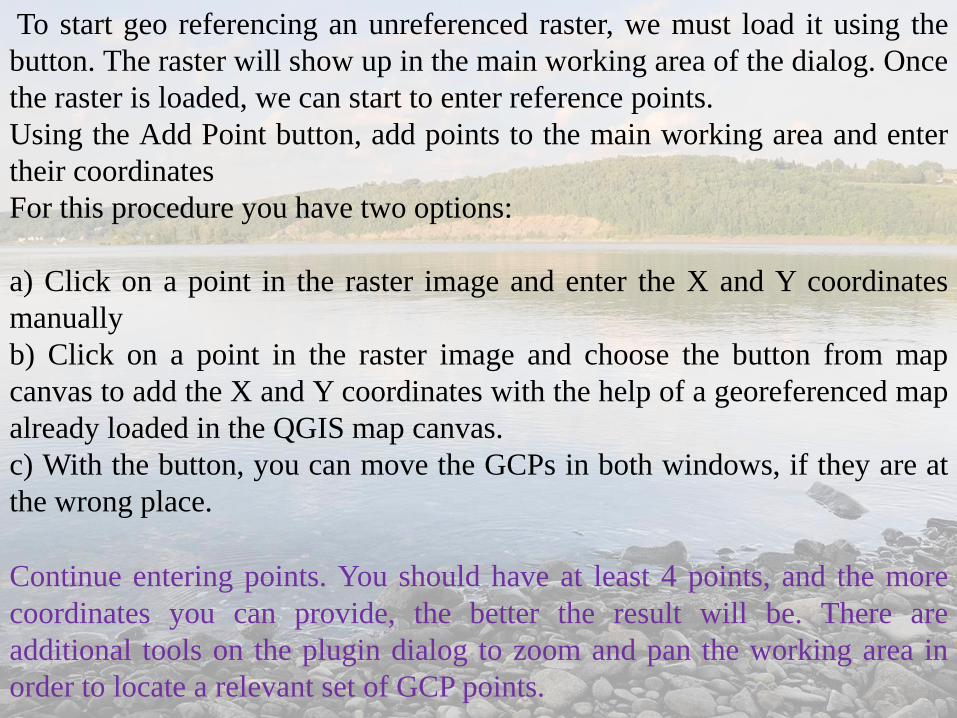
To start geo referencing an unreferenced raster, we must load it using the
button. The raster will show up in the main working area of the dialog. Once
the raster is loaded, we can start to enter reference points.
Using the Add Point button, add points to the main working area and enter
their coordinates
For this procedure you have two options:
a) Click on a point in the raster image and enter the X and Y coordinates
manually
b) Click on a point in the raster image and choose the button from map
canvas to add the X and Y coordinates with the help of a georeferenced map
already loaded in the QGIS map canvas.
c) With the button, you can move the GCPs in both windows, if they are at
the wrong place.
Continue entering points. You should have at least 4 points, and the more
coordinates you can provide, the better the result will be. There are
additional tools on the plugin dialog to zoom and pan the working area in
order to locate a relevant set of GCP points.
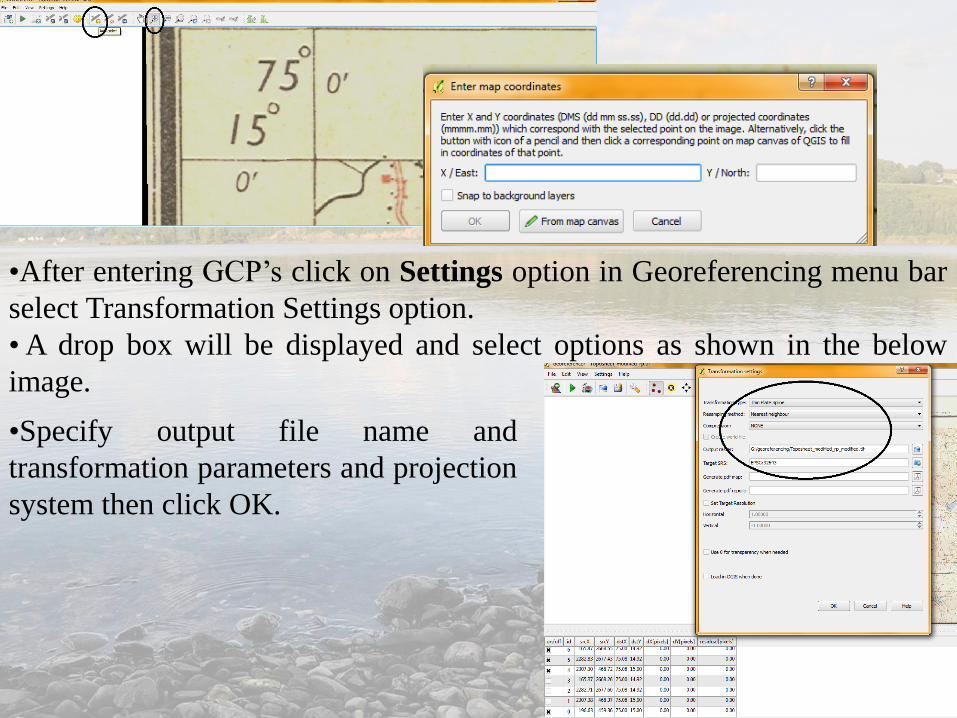
•After entering GCP’s click on Settings option in Georeferencing menu bar
select Transformation Settings option.
•A drop box will be displayed and select options as shown in the below
image.
•Specify output file name and
transformation parameters and projection
system then click OK.
QGIS Plugins
Plugin Manager provides a resource to load or unload plugins.
-- Core Plugins are automatically part of every QGIS
distribution. They are written in one of two languages: C++ or
Python.
– External Plugins are currently all written in Python. They
can be added to QGIS using the Plugin Installer.
80
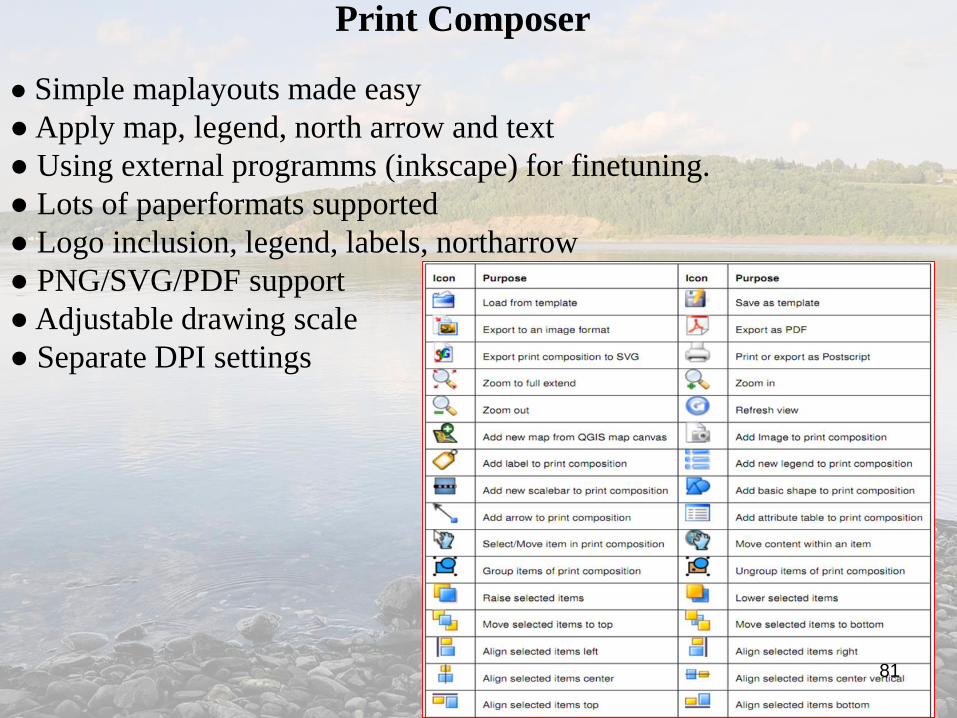
Print Composer
● Simple maplayouts made easy
●Apply map, legend, north arrow and text
● Using external programms (inkscape) for finetuning.
● Lots of paperformats supported
● Logo inclusion, legend, labels, northarrow
● PNG/SVG/PDF support
●Adjustable drawing scale
● Separate DPI settings
81
LEARN AND USE GREEN DATA
FOR SUSTAINABLE GREEN
INDIA
82
THANK YOU