Embed Size (px)
Citation preview

1
What might Brexit mean for UK tradein agriculturalproducts?
HORIZONMarket Intelligence 12 October 2016


3
FOREWORD
The UK food and drink industry is a global force representing the UK’s fourth largest exporting sector, with exports of agricultural commodities alone valued at £6.25 billion a year. The UK’s trading relationship with the rest of the world underpins the productivity and profitability of its farm businesses, as well as exposing them to the peaks and troughs of global market dynamics.
In previous editions of Horizon we have explored how this relationship may evolve in a post-Brexit landscape, depending on Government policy decisions and trade negotiations with various global players, including the EU. This edition further explores these issues at a sector level, reflecting the diversity of the UK’s agricultural and horticultural industries, the wide range of products and the differing trade scenarios associated with each of these.
Barriers to trade in the form of tariffs or regulation and the level at which these are set will be key to the continued competitiveness of the UK’s farming and growing sectors. Across all sectors, trade with the EU will be changed radically if the UK loses tariff-free access to the EU single market and imposes tariffs on EU imports. Whether these will represent an opportunity or threat depends on each sector’s reliance on imports and exports, both within and without the EU. In common with all sectors, the policy of other governments, as well as the UK’s, will be the deciding factor.
Despite this diversity, some common themes arise throughout. Food exports and imports are largely driven by consumer choice and both AHDB and the industry need to continue to work to help shape those choices.
Recognising opportunity and negotiating access in new and emerging markets will be vital to sustainability in the global marketplace. The viability of those markets – and some existing ones – will be determined by negotiations over the terms of trade. These are likely to be about technical standards as much as tariffs and quotas.
Increasing productivity and profitability across the supply chain will also be critical in a post-Brexit world, especially in sectors where major global exporters are able to price more competitively. This will help UK businesses to remain resilient if access to the UK market is opened up to a wider range of suppliers.
EU membership has also defined how the UK industry has invested and structurally evolved over the past 40 years. Globalisation, combined with seismic shocks such as BSE and Foot and Mouth Disease, mean processing capacity is lower than needed to cope with all production within the UK in some sectors. Future trade agreements could impact the viability of some agricultural products as a result, if raw materials are subject to tariffs when exported for processing. In the short to medium term, while there is still little clarity around the detailed terms of Brexit, global investors may also struggle over capital investment decisions into UK interests.
In this era of uncertainty, what is clear is that the UK’s future trade relationships will have a significant impact on UK agriculture and horticulture businesses. At a sector level, this may bring great risks or great rewards but almost certainly significant change.

4
SCENE SETTING
In this edition of Horizon, we will examine trade flows between the UK, the EU and its other major global trading partners for the main agricultural products. We will look at how trading relationships might change after the UK leaves the EU. In addition, we will examine the major global trade flows, in order to identify areas of potential market growth for UK exports, as well as areas that may be vulnerable to increased competition in a post-Brexit trading environment.
In past Horizon publications we have examined the trading relationship the UK may have with the EU post-Brexit. We have also looked at how non-EU trade would be affected by Brexit and what UK trade might look like assuming the UK set its external trade policy along World Trade Organisation (WTO) guidelines.
In this edition, we look at trade by sector, identify patterns and trends at a UK and global level and examine where the UK’s key strategic interests will be after Brexit.
Within the analysis we present in later sections we make the assumption that the UK will continue as a member of the WTO in its own right and would therefore be bound by WTO rules.
CONTENTS
Possible post-Brexit trade scenarios 5Current Free Trade Agreements and negotiations 6Import tariffs 7Tariff rate quotas 7Non-tariff barriers 7Trans-shipment and the ‘Rotterdam effect’ 8Trade impacts by sector 9
Dairy 10Beef 14Sheep Meat 18Pork 22Poultry Meat 26Cereals & Oilseeds 30Potatoes 34Horticulture 38
Appendix – EU Import Tariff Rates 41

5
POSSIBLE POST-BREXIT TRADE SCENARIOS
As with previous editions of Horizon, the UK has not yet defined the exact post-Brexit relationship it intends to seek with the EU or with the rest of the world, although it has set out a free trade agenda.
New Free Trade Agreements (FTAs) with non-EU countries can only be put in place once the UK has left the EU. If the UK were to negotiate a relationship with the EU which involves staying within the Single Market or the EU Customs Union, it would have to adopt current EU tariffs on imports from outside the EU. It would also have less flexibility to negotiate its own trade deals with partners outside the EU, although some simpler, less comprehensive, deals would still be possible. In this situation, little would change in terms of the UK’s trade in agricultural products.
However, other possible scenarios may have a significant impact on trade flows for agricultural products. This could have major implications for the UK’s agricultural sectors. These implications are examined in detail later in this report.
One option is that the UK may negotiate a trade agreement with the EU which falls short of providing full access to the Single Market. This might be more like FTAs which the EU has negotiated with a range of other countries. Such an FTA might allow free access to the Single Market for most products but there may still be tariffs for some ‘sensitive products’, which would be likely to include some agricultural outputs. It might also include tariff rate quotas or non-tariff barriers to free trade, such as sanitary and phytosanitary (SPS) measures, which are explained in more detail later in this report.
Given the complex negotiations involved in agreeing a trade deal, it is possible, perhaps even likely, that the UK may not have reached agreement with the EU by the time it leaves. In this circumstance, there may be an interim deal agreed, allowing free trade between the EU and the UK to continue while a permanent agreement is reached. However, if this is not possible, the UK would revert to trading with the EU on the same basis as other WTO members without a trade deal. This would mean that UK exports would be subject to import tariffs when entering the EU.
Depending on the nature of any trade agreement with the EU, the UK may well need to decide whether to impose import tariffs of its own. One option would be for it to continue to apply the same tariffs as the EU on all imports, which would include those from the EU. However, this would be likely to lead to higher consumer prices, including for food, which may be politically unacceptable.
Therefore, the UK Government may prefer to open up wider access to the UK market, at least for some products. It could do this by just lowering or removing tariffs but this would automatically apply to imports from outside the EU, as well as those from inside it. Alternatively, it could be done by using import quotas, which would allow a defined volume of product to enter the UK market at reduced or zero tariffs. Either approach would open many UK industries, including agriculture, up to increased competition and some would be at a competitive disadvantage, at least in the short-term.
Any deal with the EU short of membership of the Single Market or EU Customs Union would leave the UK free to set aspects of its own trade relationship with non-EU countries. This would include the ability to negotiate trade deals, including FTAs, with trading partners, based on their significance to the UK. During the referendum campaign senior Vote Leave campaigners argued that securing autonomy in this area and increasing our trade with the rest of the world would be a benefit of leaving the EU.
However, the position of agricultural goods within these negotiations is likely to be extremely complex. In many trade agreements, tariffs remain in place on sensitive products, and these products are very often agricultural goods. In addition, non-tariff barriers are often used to limit trade in agricultural goods.

6
Current Free Trade Agreements and negotiations Trade relationships outside the EU are currently coordinated through the Common Commercial Policy. Within the European Commission, a Trade Commissioner leads negotiations in multilateral and bilateral trade talks on behalf of the EU and its Member States. As a result of these, the EU currently has FTAs with 58 countries, including Mexico, South Africa, Chile and South Korea. Trade talks are also ongoing with other parts of the world as shown on the map below.
The state of EU Trade, June 2016
Source: European Commission
EU and customs union Preferential trade agreement in place
European Economic Area
Preferential agreement awaiting adoption or in negotiation
Although the status of existing FTAs post-Brexit is not certain, they may no longer apply to the UK. Therefore, to retain free access to the countries involved, the UK will need to negotiate with them, as well as any other countries it wishes to trade freely with. Past experience suggests that this is likely to be a lengthy process. The UK can only finalise and implement FTAs with non-EU countries once it has left the EU, although talks could take place before that.
Both the EU and the UK also have many bilateral agreements in place with a wide variety of countries, which govern aspects of trade. In many cases these will cover technical aspects, such as sanitary and phytosanitary (SPS) measures, export certification or inspection processes. Other examples involve providing access to tariff rate quotas (TRQs) for specific products. The vast majority of such bilateral agreements made by the UK rely on the fact that the UK is subject to EU rules and regulations.
Many of these bilateral agreements will require renegotiation to reflect the new situation. This may apply to existing UK bilateral agreements as well as those previously handled at EU level. Although agreements of this kind are likely to be simpler to implement than full FTAs, failure to do so could close off trade with the countries involved, at least temporarily. While many of these agreements can probably be updated quickly, some are likely to require significant time, for example because of the need for inspection or other assessment of any new regulations.

7
Tariff rate quotasTariff rate quotas (TRQs) allow a specified quantity of produce to enter the market at a reduced (or zero) tariff. Once the limit has been reached, the tariff reverts to the standard external tariff rate. TRQs are used to protect industries which would be vulnerable to international competition but where there is a desire to allow a certain level of imports, for example to ensure market stability. Quotas can be specific to one exporting country, a group of specified countries or can be open to all suppliers.The EU currently operates a number of TRQs covering agricultural products. Whether these quotas would continue to apply to imports to the UK will be determined during the negotiations over Brexit. The split of TRQs between the UK and the rest of the EU will also form part of any agreement.Recent agreements, such as the EU-Canada trade deal, have included TRQs for some sensitive agricultural products. This allows products from the exporting country to gain some access to the importing market, while still providing a degree of protection to domestic production. This would usually be balanced by similar concessions on access for other sensitive products in reverse.
Non-tariff barriersNon-tariff barriers include sanitary and phytosanitary (SPS) measures and technical barriers to trade. WTO rules state that SPS measures should be applied only to the extent necessary to protect human, animal or plant life or health. Therefore, there is a balance between ensuring imported food is safe to eat for domestic consumers, while at the same time ensuring that regulations put in place are not being used to protect domestic producers. Also, they should not arbitrarily or unjustifiably discriminate between countries where identical or similar conditions prevail. In practice these measures are often the hardest to agree in trade agreements, as seen in the recent Transatlantic Trade and Investment Partnership (TTIP) where issues such as antimicrobial treatments and hormone-treated beef are highly contentious.Technical barriers to trade can also become obstacles but they are often deemed necessary for a range of reasons, from environmental protection, safety and national security to consumer information. Therefore the same basic question arises again: how to ensure that standards are genuinely useful, and not arbitrary or an excuse for protectionism. Examples of technical barriers to trade include country of origin labelling and restrictions on importation of genetically modified products.
Import tariffsCustoms duties on merchandise imports are called tariffs. Tariffs can give a price advantage to locally-produced goods over similar goods which are imported and they also raise revenues for governments. One result of the WTO Uruguay round of negotiations was countries’ commitments to cut import tariffs and to bind their tariff rates to levels which are difficult to raise. The current negotiations continue efforts in that direction in agriculture.
Tariff rates can be set in a number of different ways. The most common type is an ‘ad valorem’ tariff, in which the amount paid is a percentage of the price of the item being imported. Ad valorem tariffs are widely used by the EU and by many other countries. An alternative is to set a tariff at a fixed amount in monetary terms per unit (usually based on weight). Tariffs may also be a mix of ad valorem and fixed amounts.
Some tariffs may vary seasonally, usually for products where supply levels, either globally or within the importing country, depend on the time of year.
Tariffs for processed products are sometimes more complex, being based on a formula which takes account of the quantity of different components which are used to make up the product. EU tariffs on processed products are typically higher than those for raw materials, as this makes it more cost-effective to import raw materials and process them within the EU, giving some protection to processing industries.
Examples of EU import tariffs for selected agricultural and food products can be found in an Appendix (p41) to this report. These examples cover some of the most important categories of UK exports to and imports from the EU and are intended to illustrate the potential impact if trade with the EU in these products was subject to tariffs.
Under its reform programme, WTO members converted some of their non-tariff measures to equivalent bound tariffs. The new rule for market access in agricultural products is ‘tariffs only’. Before the Uruguay Round, some agricultural imports were restricted by quotas and other non-tariff measures. These have been replaced by tariffs that provide more-or-less equivalent levels of protection — if the previous policy meant domestic prices were 75 per cent higher than world prices, then the new tariff could be around 75 per cent.

8
Trans-shipment and the ‘Rotterdam effect’Trans-shipment means the unloading of goods from one ship and its loading into another to complete a journey to a further destination. The term can also be applied more generally to other transport modes, such as freight transport by road, rail or air, or any combination of them.
Trans-shipment is significant for many UK exports, which are currently initially shipped to another EU country before being sent on to their ultimate destination. While this involves many different EU destinations, by far the most significant is the Netherlands. This is because of the size and importance of the port of Rotterdam, both as an entry point to the rest of Europe and for shipments to other parts of the world.
This gives rise to the so-called ‘Rotterdam effect’ – the theory that recorded trade in goods with the Netherlands is artificially inflated by those goods routed through Rotterdam, despite the ultimate destination or country of origin being elsewhere. The Rotterdam effect can distort views of the UK’s trade relationship with EU and non-EU countries. For example, agricultural goods exported from countries outside the EU to Rotterdam and re-exported to the UK may be counted as an import from the EU, rather than a non-EU import. Conversely, a product exported by the UK to Rotterdam and subsequently transited to a non-EU country may be counted as an export to the EU rather than to the rest of the world. Requirements for export health certification may mean this is less of an issue for exports than for imports, though.
The table below illustrates the point, by showing the proportion of UK imports and exports of different agricultural product categories which are recorded as being from or to the Netherlands and where it ranks relative to other countries.
Table 1: Summary of UK Trade with the Netherlands in 2013
Product Category Value of exports to NL
NL export share
NL export ranking
Value of imports from NL
NL import share
NL import ranking
Meat $197mn 10% 3rd $1.281bn 22% 2nd
Dairy $190mn 10% 2nd $346mn 9% 4th
Cereals $106mn 12% 2nd $65mn 4% 8th
Oilseeds $51mn 13% 2nd $126mn 12% 3rd
Fruit $41mn 14% 2nd $365mn 6% 3rd
Vegetables $34mn 7% 4th $965mn 23% 2nd
Plants/cut flowers $24mn 29% 2nd $1.23bn 75% 1st
Overall, across all goods, the Netherlands is the UK’s third largest trading partner in the EU. However, it is not possible to estimate with any certainty the impact that the Rotterdam effect has on UK trade with the Netherlands and its subsequent impact on the balance of UK trade between EU and non-EU countries.
If tariffs are imposed on trade between the UK and the EU, it might affect the UK’s ability to route products via Rotterdam. This could have an impact on its trade with countries outside the EU as well as within it, as availability of shipping direct from the UK will be more limited, which may mean higher costs.
In many FTAs a direct transport rule ensures that the goods arriving in the country of importation are identical to those goods that left the country of exportation. The objective of this rule is to reduce the chance that goods eligible for preferences under a free trade arrangement will be manipulated or mixed during transportation with non-eligible goods. This means that the direct transport rule is in fact not an ‘origin rule’ per se, but an administrative requirement to prevent circumvention and abusive manipulations of originating goods during transportation.
However, due to the changes in transportation methods and routes, an emerging trend on a global level is to move away from a very strict requirement in relation to direct transportation or direct consignment.
Source: UN Comtrade

9
Trade impacts by sectorThe remainder of this report provides an assessment of the potential impact on the major agricultural and horticultural sectors if the UK’s trading relationships with the EU and with non-EU countries were to change.
Each section begins by looking in detail at current trade flows to and from the UK, covering the mix of products involved, their sources and destinations, as well as any significant changes over time. It then looks at existing tariff and non-tariff barriers affecting trade.
The analysis then considers the opportunities which may be available post-Brexit. This includes identifying any potentially significant markets for UK products where FTAs could improve access for UK exports. We also look at opportunities which might arise for AHDB’s levy-paying sectors should products which currently have free access to the UK market no longer do (for example, if imports from the EU were subject to tariffs).
Finally, we consider the threats which may be apparent post-Brexit. This will include identifying potentially significant suppliers to the UK market for which access is currently prevented or limited due to EU tariff or non-tariff barriers. As with imports, we also look at the impact on exports if the UK no longer has tariff-free access to the EU or other existing markets.
10
Current situation – exports
The overall value of exports of dairy products in 2015 amounted to £1.1 billion. Of this, nearly £800 million was generated by sales to other EU countries, with £300 million in sales to third countries. Around 90 per cent of UK dairy exports by volume are destined for the EU.
Exports tend to fluctuate with domestic milk production, suggesting many are dealing with the UK’s surplus milk rather than being customer-focused. This is shown by the UK’s trade balance worsening between 2011 and 2013 while improving in 2014 and 2015 in line with milk production.
Exports of milk and cream appear high, at 660,000 tonnes in 2015 but, for liquid milk, the majority of trade, in both directions, is across the Irish border. Most of this exported milk is likely to be for processing and some of the finished products will then return to the UK.
Other exports of liquid milk are mainly UHT sales. Cheese is the next most important export for the dairy industry at 150,000 tonnes, again dominated by the EU, with Ireland, France and the Netherlands the main destinations. Cheese sales will be a combination of customer-focused added-value products and low-value stock clearing sales. Cheddar and mozzarella are the two biggest cheese export products.
Exports to countries outside the EU are predominantly made up of powders (around 50,000 tonnes in 2015) and cheese (26,000 tonnes). Processing developments underway may open up new export trades, for example in infant formula.
Current situation – imports
The situation with imports is similar to that for exports, as the EU accounts for around 99 per cent of total UK dairy imports.
Ireland is the big player regarding imports. As well as the trade in milk and cream mentioned before, Ireland also exported 65,000 tonnes of butter and dairy spreads and 139,000 tonnes of cheese to the UK in 2015. Irish butter is used in some branded products as well as in manufactured goods. Cheddar is the main cheese exported from Ireland to the UK. The majority of this cheddar will be packed into retail products for either branded or value own-label cheeses. Irish cheddar will also go through the foodservice and industrial usage routes.
Speciality cheese from the continent also features highly on the UK’s import list. Buttermilk and yoghurts are other key imports, with the former most likely used in manufacturing.
Overall, the UK is around 75 per cent self-sufficient in butter and 55 per cent for cheese. However, with some home production exported, around half of butter and over 60 per cent of cheese consumed on the UK market is imported. In contrast, the UK is a net exporter of milk powders.
UK dairy exports, 2015
Imports Exports Balance
3,000
2,500
2,000
1,500
1,000
500
0
0
-200
-400
-600
-800
-1,000
-1,200
-1,400
-1,6002005 2006 2007 2008 2009 2010 2011 2012 2013 2014 2015
Imp
ort
s &
exp
ort
s (£
ms)
Bal
ance
(£m
s)
UK trade balance
600
500
400
300
200
100
0
Leading dairy importers, 2015
China Russia Mexico Algeria Japan Indonesia
3,000
2,500
2,000
1,500
1,000
500
0
Leading dairy exporters, 2015
New EU US Australia Belarus Argentina Zealand
1,00
0 to
nnes
1,00
0 to
nnes
Uk dairy imports, 2015Non EU 1%
France
Germany
Ireland
Other EU
Uk dairy exports, 2015
Non EU
Ireland
Netherlands
Other EU24%
16%
30%
28%14%
10%
8% 67%
#$!!!
#$"!!
%$!!!
%$"!!
&$!!!
#$!!!*6;..(5
UK dairy exports, 2015UK dairy imports, 2015
Imports Exports Balance
3,000
2,500
2,000
1,500
1,000
500
0
0
-200
-400
-600
-800
-1,000
-1,200
-1,400
-1,6002005 2006 2007 2008 2009 2010 2011 2012 2013 2014 2015
Imp
ort
s &
exp
ort
s (£
ms)
Bal
ance
(£m
s)
UK trade balance
600
500
400
300
200
100
0
Leading dairy importers, 2015
China Russia Mexico Algeria Japan Indonesia
3,000
2,500
2,000
1,500
1,000
500
0
Leading dairy exporters, 2015
New EU US Australia Belarus Argentina Zealand
1,00
0 to
nnes
1,00
0 to
nnes
Uk dairy imports, 2015Non EU 1%
France
Germany
Ireland
Other EU
Uk dairy exports, 2015
Non EU
Ireland
Netherlands
Other EU24%
16%
30%
28%14%
10%
8% 67%
#$!!!
#$"!!
%$!!!
%$"!!
&$!!!
#$!!!*6;..(5
Dairy
Source: HMRC Source: HMRC

11
Current situation – tariffs and trade barriersMost dairy imports into the EU are subject to import tariffs, which are typically a fixed value based either on total weight or the weight of lactic matter in the product. As an example, tariffs on most butter imports are €1,896 per tonne, while for cheddar, the tariff is €1,671 per tonne.
These tariffs prevent most imports of dairy products into the EU. However, the EU does operate preferential import quotas for butter and cheese. The main supplier of butter to the EU is New Zealand, although its shipments have declined significantly since 2014 as market prices have made the EU a less attractive destination. The main source of imported cheese is Switzerland, which has tariff-free access to the EU market through a bilateral deal. It exports around 50,000 tonnes to the EU annually. Volumes from other suppliers, such as New Zealand, Australia and the US fluctuate depending on market conditions.
For some dairy products, in particular speciality cheeses, EU rules on geographical indications (GIs) provide protection from imports.
Most of the EU’s existing Free Trade Agreements have limited significance for the dairy trade as the countries involved are neither major importers nor exporters. When ratified, the proposed free trade agreement between the EU and Canada has the potential to open up trade in dairy products in both directions. In particular, it will improve access to the EU market for Canadian cheese, while protecting EU GIs in Canada.
Most other dairy importing countries also have tariff and non-tariff barriers in place. For example, China applies tariffs of between 10 per cent and 20 per cent on imports of most dairy products.
UK dairy trade balance
Imports Exports Balance
3,000
2,500
2,000
1,500
1,000
500
0
0
-200
-400
-600
-800
-1,000
-1,200
-1,400
-1,6002005 2006 2007 2008 2009 2010 2011 2012 2013 2014 2015
Imp
ort
s &
exp
ort
s (£
ms)
Bal
ance
(£m
s)UK trade balance
600
500
400
300
200
100
0
Leading dairy importers, 2015
China Russia Mexico Algeria Japan Indonesia
3,000
2,500
2,000
1,500
1,000
500
0
Leading dairy exporters, 2015
New EU US Australia Belarus Argentina Zealand
1,00
0 to
nnes
1,00
0 to
nnes
Uk dairy imports, 2015Non EU 1%
France
Germany
Ireland
Other EU
Uk dairy exports, 2015
Non EU
Ireland
Netherlands
Other EU24%
16%
30%
28%14%
10%
8% 67%
#$!!!
#$"!!
%$!!!
%$"!!
&$!!!
#$!!!*6;..(5
Dairy
Source: HMRC

12
OpportunitiesThe main trade-related opportunities of Brexit for the UK dairy industry will focus on displacing imports or growing new export markets. If the UK manages to negotiate a trade deal with the EU allowing tariff-free access, then the likelihood is for business as usual with the EU. However, if not, any import tariffs imposed by the UK could provide an opportunity to substitute a number of imports with British milk. Experience from the EU suggests that tariffs may limit the scale of imports of commodity-type products, although speciality products will probably still reach the UK.
Combined with increased supply chain investment, this could see the UK progress as an industry. At present, the UK has two major milk processors, whose dominance could help rebalance the supply chain, leading to an increase in processing investment – if managed correctly.
The other key opportunity is the ever growing global population, with increasing numbers of affluent consumers seeking dairy products. The UK may be better able to agree favourable trade arrangements with some of these emerging markets alone, compared with the EU. Targeting specific countries looking for value-added products could be a great opportunity to improve the returns for the supply chain and push the brand of UK products around the world.
An earlier study undertaken by AHDB Dairy identified Russia as the main growth opportunity for UK exports outside the EU but that market is likely to remain closed for some time. Therefore, growth opportunities are most likely to come from China and other emerging markets in Asia, the Middle East and North Africa. These regions are expected to be the focus of most of the global growth in dairy imports and there may be some opportunities for UK exporters there.
UK dairy exports, 2015Leading dairy importers, 2015
Imports Exports Balance
3,000
2,500
2,000
1,500
1,000
500
0
0
-200
-400
-600
-800
-1,000
-1,200
-1,400
-1,6002005 2006 2007 2008 2009 2010 2011 2012 2013 2014 2015
Imp
ort
s &
exp
ort
s (£
ms)
Bal
ance
(£m
s)
UK trade balance
600
500
400
300
200
100
0
Leading dairy importers, 2015
China Russia Mexico Algeria Japan Indonesia
3,000
2,500
2,000
1,500
1,000
500
0
Leading dairy exporters, 2015
New EU US Australia Belarus Argentina Zealand
1,00
0 to
nnes
1,00
0 to
nnes
Uk dairy imports, 2015Non EU 1%
France
Germany
Ireland
Other EU
Uk dairy exports, 2015
Non EU
Ireland
Netherlands
Other EU24%
16%
30%
28%14%
10%
8% 67%
#$!!!
#$"!!
%$!!!
%$"!!
&$!!!
#$!!!*6;..(5
Dairy sector at a glanceThe UK is reliant on imports of butter and cheese to satisfy domestic demand
Ireland is a key trading partner for the dairy sector, including as a major processor of UK-produced liquid milk, which often returns to the UK as finished product
Reduction or removal of tariffs could see more global competition in butter and cheese supply, with impacts throughout the supply chain
China and emerging markets in Asia, North Africa and the Middle East are the focus of global growth opportunities
Potential barriers to EU exports could hamper investment during trade negotiations
Source: UN Comtrade

13
UK dairy exports, 2015
Imports Exports Balance
3,000
2,500
2,000
1,500
1,000
500
0
0
-200
-400
-600
-800
-1,000
-1,200
-1,400
-1,6002005 2006 2007 2008 2009 2010 2011 2012 2013 2014 2015
Imp
ort
s &
exp
ort
s (£
ms)
Bal
ance
(£m
s)
UK trade balance
600
500
400
300
200
100
0
Leading dairy importers, 2015
China Russia Mexico Algeria Japan Indonesia
3,000
2,500
2,000
1,500
1,000
500
0
Leading dairy exporters, 2015
New EU US Australia Belarus Argentina Zealand
1,00
0 to
nnes
1,00
0 to
nnes
Uk dairy imports, 2015Non EU 1%
France
Germany
Ireland
Other EU
Uk dairy exports, 2015
Non EU
Ireland
Netherlands
Other EU24%
16%
30%
28%14%
10%
8% 67%
#$!!!
#$"!!
%$!!!
%$"!!
&$!!!
#$!!!*6;..(5
Leading dairy exporters, 2015
ThreatsThe eventual deal between the UK and EU will be key for the UK dairy industry. The EU currently provides the home for the majority of UK exports and milk production is expected to return to growth over the coming years, production of commodity products is likely to grow. Any tariffs imposed could, therefore, incentivise processors to encourage milk production to stagnate, depending on deals struck with other nations and buyer interest/competitiveness.
Any imposition of tariffs on UK exports to the EU could cause particular issues for the cross-border trade with Ireland. As indicated above, large volumes of milk are exported from the UK for processing in the Irish Republic. This trade would be threatened if tariffs were put in place. Furthermore, any of the resulting product which returns to the UK may also be subject to import tariffs, which would almost certainly make this trade uneconomic. While this could have major consequences for the Irish processing sector, there might also be challenges for the UK industry in processing the milk which was previously being exported.
There is also the issue of the time required for negotiating new trade deals, which could hamper industry growth if negotiations are protracted. With limited opportunities to grow domestic markets, particularly if lack of free movement of EU workers reduces population growth, barriers to EU exports could hit investment levels. In this context, it is worth remembering that the largest dairy companies in the UK are foreign-owned.
If, rather than impose high tariffs on imports from the EU and elsewhere, the UK government decides to reduce or remove them, it could open the domestic industry up to competition from outside the EU. The most likely products involved would be butter and cheese. The UK is a net exporter of powders and the short shelf-life and high costs of transporting most other dairy products would be prohibitive.
The main global exporter of butter is New Zealand. It currently has access to the UK market via EU quotas but may seek to increase shipments, providing competition for both UK and Irish supplies. For cheese, there are a wider variety of potential suppliers, including Australia, New Zealand, the US and Canada. Most would be likely to target manufacturing uses but Canada may also seek to increase its sales of cheddar for the retail market. These suppliers could provide increased competition for domestic cheese, potentially driving down prices throughout the supply chain.
Source: UN Comtrade

14
Current situation – exports
Beef and veal exports only resumed in 2006 following the BSE-related ban and remain well below imports. Domestic demand is particularly strong for hindquarter cuts. Therefore, although there are some shipments of premium beef, most exports are either of products for processing overseas, as processing capacity is limited in the UK, or of products with a higher value overseas than in the UK. The latter category includes items for which there is no or minimal demand on the domestic market, such as offal.
In recent years, beef and veal exports have fluctuated between 100–120,000 tonnes, equating to 15–17 per cent of production. Over time, there has been a move away from exporting carcases towards cuts (and particularly boneless cuts), where the value added in processing is retained on the domestic market. Bovine offal exports have rocketed over the past few years, in part on the back of improved market access outside the EU. Offal exports in 2015 amounted to 48,000 tonnes, more than double 2009’s level and up by nearly half since 2013.
The value of UK beef and veal exports in 2015 was £342 million. This was the lowest figure since 2010, as the weak euro hit both the volume and price of exports. On top of this, exports of bovine offal were worth £61 million.
In 2015, over 90% of UK beef exports went to other EU countries. Ireland and the Netherlands are the most significant destinations, accounting for 55–65 per cent of all trade. This is partly because the UK lost much of its
capacity to process cow carcases during the BSE years and has never regained it. Carcases are now exported and the meat returned after further processing, the so-called ‘carousel effect’. It is thought that much of the other beef entering the Netherlands ends up elsewhere (eg. France), sometimes after further processing.
Current situation – imports
The UK currently imports around 35 per cent of the beef and veal it consumes or around 250,000 tonnes annually. Imports have been fairly stable recently, although increasing somewhat in the last two years, partly due to the weak euro. The dominant supplier has always been Ireland, with a market share of almost 70 per cent. No other country accounts for more than eight per cent of UK imports. The EU supplies over 90 per cent of imports, with no single non-EU country supplying more than three per cent of the total.
Around three-quarters of imports are fresh/chilled beef, mostly boneless cuts, which achieve higher prices because little or no further processing is required and transport costs are lower. Carcases account for less than a fifth of fresh/chilled imports. As outlined above, some imports will be of UK beef (mainly cow beef) returning following processing in Ireland or the Netherlands. The remaining 25 per cent of imports are frozen consignments, also dominated by boneless cuts.
UK beef exports, 2015
Self-sufficiency Production Imports Exports Consumption
68%
9%
6%
4%
5%
8%
37%
22%
10%
6%
17%
8%
2005 2006 2007 2008 2009 2010 2011 2012 2013 2014 2015
1,400
1,200
1,000
800
600
400
200
0
1,00
0 to
nnes
UK beef balance sheet
100%
95%
90%
85%
80%
75%
70%
65%
60%
55%
50%
Self
-suffi
cenc
y
Uk beef imports by source, 2015
Non EU
Ireland
Other EU
Germany
Poland
Netherlands
Uk beef exports by destination, 2015
Non EU
IrelandOther EU
Italy
Netherlands
France
1,200
1,000
800
600
400
200
0
1,400
1,200
1,000
800
600
400
200
0
Leading global beef importers, 2015 Leading global beef exporters, 2015
US Japan China Russia South Korea Hong Kong EU Australia India Brazil US New Canada Paraguay Uruguay EU Zealand
1,00
0 to
nnes
1,00
0 to
nnes
UK beef imports, 2015
Self-sufficiency Production Imports Exports Consumption
68%
9%
6%
4%
5%
8%
37%
22%
10%
6%
17%
8%
2005 2006 2007 2008 2009 2010 2011 2012 2013 2014 2015
1,400
1,200
1,000
800
600
400
200
0
1,00
0 to
nnes
UK beef balance sheet
100%
95%
90%
85%
80%
75%
70%
65%
60%
55%
50%
Self
-suffi
cenc
y
Uk beef imports by source, 2015
Non EU
Ireland
Other EU
Germany
Poland
Netherlands
Uk beef exports by destination, 2015
Non EU
IrelandOther EU
Italy
Netherlands
France
1,200
1,000
800
600
400
200
0
1,400
1,200
1,000
800
600
400
200
0
Leading global beef importers, 2015 Leading global beef exporters, 2015
US Japan China Russia South Korea Hong Kong EU Australia India Brazil US New Canada Paraguay Uruguay EU Zealand
1,00
0 to
nnes
1,00
0 to
nnes
Beef
Source: HMRC
Source: HMRC

15
Current situation – tariffs and trade barriersMost beef imports into the EU are subject to ad valorem tariffs of 12.8 per cent plus a fixed amount ranging from €1,414 to €3,041 per tonne, depending on the cut. In most cases this tariff equates to an addition of 50 per cent or more to the value of imports, which seriously impacts on the ability of imported beef to compete with EU meat. Processed beef products are also subject to import tariffs but most bovine offal can be imported tariff-free.
Although these tariffs prevent most beef imports, the EU has quotas for import of High Quality Beef from a number of countries in North and South America, southern Africa and Australasia. The quotas allow around 118,000 tonnes of beef to access the EU market at reduced or zero tariffs, although volumes may be negotiated downwards once the UK leaves. Last year, the UK’s share of beef imports from the countries with access to the quotas was around 16,000 tonnes.
None of the existing EU Free Trade Agreements is significant for the beef trade. However, negotiations are underway with several major beef exporters, including Canada, the US, Mercosur (the main South American exporters), Australia and New Zealand. This may result in these countries gaining increased access to the EU market, once concluded.
The main non-tariff barriers limiting access to the EU market are sanitary and phytosanitary (SPS) measures. There are a range of such requirements but perhaps the most significant is the ban on beef from animals treated with growth hormones, a widespread practice in some major exporting countries.
Most other beef importing countries also have tariff and non-tariff barriers in place. For example, China imposes ad valorem tariffs of between 12 per cent and 25 per cent on beef imports.
UK beef balance sheet
Self-sufficiency Production Imports Exports Consumption
68%
9%
6%
4%
5%
8%
37%
22%
10%
6%
17%
8%
2005 2006 2007 2008 2009 2010 2011 2012 2013 2014 2015
1,400
1,200
1,000
800
600
400
200
0
1,00
0 to
nnes
UK beef balance sheet
100%
95%
90%
85%
80%
75%
70%
65%
60%
55%
50%
Self
-suffi
cenc
y
Uk beef imports by source, 2015
Non EU
Ireland
Other EU
Germany
Poland
Netherlands
Uk beef exports by destination, 2015
Non EU
IrelandOther EU
Italy
Netherlands
France
1,200
1,000
800
600
400
200
0
1,400
1,200
1,000
800
600
400
200
0
Leading global beef importers, 2015 Leading global beef exporters, 2015
US Japan China Russia South Korea Hong Kong EU Australia India Brazil US New Canada Paraguay Uruguay EU Zealand
1,00
0 to
nnes
1,00
0 to
nnes
Beef
Sources: Defra, HMRC, AHDB

16
OpportunitiesExpansion of UK beef exports to non-EU markets has been constrained by limited market access. Access to many major beef importing countries has never been restored following the BSE-related restrictions imposed in the late 1990s. We are now starting to see markets reopening but, at the moment, UK beef struggles to be price competitive in many of the countries involved. Even if FTAs can be agreed which provide preferential access, exports are therefore likely to be limited to premium cuts. These can be sold into high-end outlets, taking advantage of the UK’s pasture-based production systems.
More substantial benefits may come from opening up markets which provide improved opportunities for exporting lower-value cuts and offals. These can deliver improved returns to the UK industry, as these cuts have little or no value on the domestic market.
The most obvious example of this is China, which is widely expected to increase its beef imports significantly. However, UK product would initially be at a disadvantage against countries which have an FTA with China in place, such as Australia and New Zealand. This could change if the UK government was able to negotiate its own trade agreement with China. Other Asian and African markets also have potential to take more UK beef and bovine offal, depending on how trading relationships develop.
In the absence of a trade deal with the EU at the point at which it leaves, the UK may decide to impose tariffs on beef imports. These tariffs would apply to imports from the EU, including the UK’s main supplier, Ireland, as well as third countries, which would either limit imports or make them much more expensive.
In the short term this would significantly tighten supplies on the UK market, as it would take some time for domestic production to react. Even if UK exports to the EU were also subject to tariffs, prices for cattle and for beef would almost certainly rise sharply. The long-term impact would depend, in part, on how consumers responded, influenced by the extent of similar disruptions affecting other meats. If prices become too high, demand may fall, which could have consequences if and when import barriers are reduced.
UK dairy exports, 2015Leading global beef importers, 2015
Self-sufficiency Production Imports Exports Consumption
68%
9%
6%
4%
5%
8%
37%
22%
10%
6%
17%
8%
2005 2006 2007 2008 2009 2010 2011 2012 2013 2014 2015
1,400
1,200
1,000
800
600
400
200
0
1,00
0 to
nnes
UK beef balance sheet
100%
95%
90%
85%
80%
75%
70%
65%
60%
55%
50%
Self
-suffi
cenc
y
Uk beef imports by source, 2015
Non EU
Ireland
Other EU
Germany
Poland
Netherlands
Uk beef exports by destination, 2015
Non EU
IrelandOther EU
Italy
Netherlands
France
1,200
1,000
800
600
400
200
0
1,400
1,200
1,000
800
600
400
200
0
Leading global beef importers, 2015 Leading global beef exporters, 2015
US Japan China Russia South Korea Hong Kong EU Australia India Brazil US New Canada Paraguay Uruguay EU Zealand
1,00
0 to
nnes
1,00
0 to
nnes
Source: GTIS

17
UK dairy exports, 2015
Self-sufficiency Production Imports Exports Consumption
68%
9%
6%
4%
5%
8%
37%
22%
10%
6%
17%
8%
2005 2006 2007 2008 2009 2010 2011 2012 2013 2014 2015
1,400
1,200
1,000
800
600
400
200
0
1,00
0 to
nnes
UK beef balance sheet
100%
95%
90%
85%
80%
75%
70%
65%
60%
55%
50%
Self
-suffi
cenc
y
Uk beef imports by source, 2015
Non EU
Ireland
Other EU
Germany
Poland
Netherlands
Uk beef exports by destination, 2015
Non EU
IrelandOther EU
Italy
Netherlands
France
1,200
1,000
800
600
400
200
0
1,400
1,200
1,000
800
600
400
200
0
Leading global beef importers, 2015 Leading global beef exporters, 2015
US Japan China Russia South Korea Hong Kong EU Australia India Brazil US New Canada Paraguay Uruguay EU Zealand
1,00
0 to
nnes
1,00
0 to
nnes
Leading global beef exporters, 2015
ThreatsIf no trade deal has been agreed with the EU when the UK leaves, UK beef would be subject to tariffs when entering the EU. This would cause particular issues for cow beef, unless domestic processing capacity increases, given the carousel effect described earlier. This trade could involve payment of two tariffs, probably making it uneconomic. This could have significant implications for the cull cow market, affecting dairy as well as beef producers. Although tariffs might lead to some loss of trade in prime cuts, these would probably find a home on the domestic market in the absence of imports, so would have less impact.
As with other meats, there is a risk that access to some markets for beef or offal depends on the UK following EU rules and regulations. If trade deals are not renegotiated, this trade could be closed off, at least temporarily.
If the UK instead decides not to impose tariffs on imports, or negotiates quotas with global exporters, there could be a sizeable rise in imports from the global market. Australia, the US and South America, the most likely suppliers, are all keen to increase their access to the EU market, including the UK. These countries are lower-cost producers, which would mean their beef would be competitive on the UK market, even after shipping costs are taken into account.
Trade would probably be particularly focused on high-value steak cuts, perhaps mainly within foodservice, where provenance is less of an issue. As these cuts drive much of the value in the prime cattle market, increased imports would have a significant impact on returns to UK producers and processors, possibly affecting the viability of many. However, it is worth remembering that tariffs are not the only barrier to trade. Non-tariff barriers, such as growth hormones, may still limit trade, depending on the attitude of the UK Government to such issues.
Beef sector at a glanceUK is reliant on EU partners for processing beef carcases, especially cows, a challenge if it loses tariff-free access to the EU
EU tariffs currently prevent most beef imports from leading global exporters but any opening up of market could mean they provide increased competition
Some major beef exporting countries are currently affected by EU ban on use of animal growth hormones
Beef import markets are gradually re-opening following BSE restrictions of late 90s and there may be opportunities to open up new markets more quickly
Lower value cuts and offal are a major opportunity for UK beef exports
Source: GTIS

18
Current situation – exports
UK sheep meat exports have been recovering since the 2001 outbreak of Foot and Mouth Disease. However, a reduced flock means they remain below levels seen before the outbreak. Exports largely aim to address imbalances in demand for different cuts and the higher supply of sheep meat at certain times of year. Also, additional markets have had to be found to take items for which there is no or minimal demand on the domestic market, including offal and skins.
In recent years, sheep meat exports have fluctuated between 90 and 100,000 tonnes, equating to around a third of production. Over time, an increasing proportion of sheep meat has been exported as cuts (and particularly bone-in cuts), where much of the value added in processing is retained on the domestic market. However, carcases remain the largest proportion of UK sheep meat exports. Ovine offal exports increased sharply between 2005 and 2010, in part on the back of improved market access outside the EU, but have stabilised since then. Offal exports in 2015 amounted to 4,000 tonnes, more than double 2006’s level.
The value of UK sheep meat exports in 2015 was £302 million. This was the lowest figure since 2010, as the weak euro had an impact on both the volume and price of exports. However there are some doubts over the accuracy of the data, with exports believed to be higher than the official data indicate. In addition, exports of ovine offal were worth £6.6 million. Sheep skin exports were worth an additional £60 million, although this was a third less than in 2013 due to declining prices.
In 2015 over 95 per cent of UK sheep meat exports went to other EU countries. France is the main destination, accounting for 45–55 per cent of all trade, although this is a lower share than in the past. The second largest market is now Germany, accounting for about ten percent of trade, a share which has grown recently. However, uncertainty about the accuracy of export data mean trade with all countries may be understated.
Current situation – imports
The UK currently imports around a third of the sheep meat it consumes, or around 100,000 tonnes annually. Imports have been fairly stable recently. The dominant supplier has always been New Zealand, with a market share of over 70 per cent. Australia is the second largest supplier, accounting for around 15 per cent. This largely reflects the different seasonality of sheep meat production in the Southern Hemisphere, which helps to ensure supplies are available throughout the year. The EU supplies around 10 per cent of imports.
Over 95 per cent of imports are in the form of cuts, mostly bone-in, which enables them to be targeted at the best value market for that cut (eg. the UK for legs). Carcases account for less than five per cent of imports. The split between fresh and frozen product is more even, with between 55 per cent and 60 per cent coming in the form of frozen product and the remainder being fresh.
UK sheep meat exports
Self-sufficiency Production Imports Exports Consumption
4%6%
15%
74%
54%
12%
5%
8%
9%
12%
Uk sheep meat exports
Non EU
France
Other EU
Belgium
Germany
Ireland
250
200
150
100
50
0
Leading global sheep meat importers, 2015
2005 2006 2007 2008 2009 2010 2011 2012 2013 2014 2015
450
400
350
300
250
200
150
100
50
0
1,00
0 to
nnes
105%
100%
95%
90%
85%
80%
75%
Self
-suffi
cenc
y
UK sheep meat balance sheet
Uk Sheep imports
OtherNon EU 1%Other EU
Ireland
Australia
New Zealand
1,00
0 to
nnes
China France UK US Saudi Arabia Germany Malaysia
450
400
350
250
200
150
50
0
Leading global sheep meat exporters, 2015
1,00
0 to
nnes
Australia New Zealand UK Ireland Spain Netherlands India
UK sheep meat imports
Self-sufficiency Production Imports Exports Consumption
4%6%
15%
74%
54%
12%
5%
8%
9%
12%
Uk sheep meat exports
Non EU
France
Other EU
Belgium
Germany
Ireland
250
200
150
100
50
0
Leading global sheep meat importers, 2015
2005 2006 2007 2008 2009 2010 2011 2012 2013 2014 2015
450
400
350
300
250
200
150
100
50
0
1,00
0 to
nnes
105%
100%
95%
90%
85%
80%
75%
Self
-suffi
cenc
y
UK sheep meat balance sheet
Uk Sheep imports
OtherNon EU 1%Other EU
Ireland
Australia
New Zealand
1,00
0 to
nnes
China France UK US Saudi Arabia Germany Malaysia
450
400
350
250
200
150
50
0
Leading global sheep meat exporters, 2015
1,00
0 to
nnes
Australia New Zealand UK Ireland Spain Netherlands India
Sheep meat
Source: HMRC
Source: HMRC

19
Current situation – tariffs and trade barriersMost sheep meat imports to the EU fall within a quota, allowing tariff-free access to the EU market for certain volumes of sheep meat. New Zealand has the largest quota, accounting for approximately 80 per cent of the total but it has not come close to filling its quota to the EU since 2011. The current volume of lamb imports available within the tariff-free quota for New Zealand is 228,254 tonnes, with only 76 per cent of this being used in 2015. In comparison, Australia has a smaller quota of just 19,000 tonnes and unsurprisingly, comes close to filling it. Of EU Member States, the UK is by far the largest importer from the global market.
Any sheep meat imports outside quota or from countries not covered by it, are subject to ad valorem tariffs of 12.8% plus a fixed amount ranging from €902 to €3118 per tonne, depending on the cut. In many cases this would be equivalent to an ad valorem tariff of 50 per cent or more, which seriously impacts on the ability of imported sheep meat to compete with EU meat. This, in reality, makes any sheep meat outside of the quota uncompetitive on the EU market, so virtually all sheep meat is imported through the quota.
Most other sheep meat importing countries also have tariff and non-tariff barriers in place. For example, China, the world’s largest importer, imposes ad valorem tariffs of 12–15 per cent on lamb and 23 per cent on mutton imports. However, China has FTAs in place with both New Zealand and Australia, the main suppliers, which mean that tariff rates on their imports are gradually being reduced and will eventually be eliminated.
UK sheep meat balance sheet
Self-sufficiency Production Imports Exports Consumption
4%6%
15%
74%
54%
12%
5%
8%
9%
12%
Uk sheep meat exports
Non EU
France
Other EU
Belgium
Germany
Ireland
250
200
150
100
50
0
Leading global sheep meat importers, 2015
2005 2006 2007 2008 2009 2010 2011 2012 2013 2014 2015
450
400
350
300
250
200
150
100
50
0
1,00
0 to
nnes
105%
100%
95%
90%
85%
80%
75%
Self
-suffi
cenc
y
UK sheep meat balance sheet
Uk Sheep imports
OtherNon EU 1%Other EU
Ireland
Australia
New Zealand
1,00
0 to
nnes
China France UK US Saudi Arabia Germany Malaysia
450
400
350
250
200
150
50
0
Leading global sheep meat exporters, 2015
1,00
0 to
nnes
Australia New Zealand UK Ireland Spain Netherlands India
Sheep meat
Sources: Defra, HMRC, AHDB

20
OpportunitiesAs with beef, market access and competitiveness issues have affected sheep meat exports to non-EU markets. Several new markets for sheep meat from the UK have been opened in recent years but UK sheep meat struggles to be price competitive against the major Southern Hemisphere exporters, which dominate global trade. Exports to some of these markets are, therefore, likely to be limited to premium cuts, which can be sold to consumers who are attracted by the UK’s pasture-based production systems.Greater benefits are, therefore, likely to be derived from markets where there is demand for lower-value cuts and offals. These can deliver improved returns to the UK industry, as these cuts have little or no value on the domestic market. The most obvious example of this is China, already the largest importer of sheep meat and widely expected to increase its imports further. However, China already has Free Trade Agreements in place with New Zealand and Australia, so UK product would initially be at a disadvantage against them. This could change if the UK Government was able to negotiate its own trade agreement with China. Other Asian and African markets also have potential to take more UK sheep meat offal, depending on how trading relationships develop.The level of any tariffs or import quotas for sheep meat into the UK will depend on any trade agreement with the EU. The UK might need to decide whether to impose its own tariffs and quotas. If the UK does reduce tariff-free access to its market, it could lead to tighter supplies and provide an opportunity for domestic lamb to replace imports. This would probably lead to higher prices in the short-term, particularly as it would take domestic production a while to react. However, UK consumers’ preference for legs, in particular, may limit the extent to which domestic lamb could displace imports.
ThreatsDue to the seasonality of UK lamb production, reduced import access, as described above, could mean much tighter supplies at some times of year, potentially increasing price volatility. The long-term impact on the market would depend on how consumers react to changing levels of supply and prices. If prices of sheep meat, which is already considered expensive, rise, experience suggests consumers are likely to switch to other meats. This could lead to reduced demand for sheep meat, even at times when supply was more plentiful. As with other meats, there is a risk that access to some markets for sheep meat or by-products depends on the UK following EU rules and regulations. If trade deals are not renegotiated, this trade could be closed off.If the UK either decides not to impose tariffs or negotiates quotas with global exporters, imports to the UK could stay at current levels or even rise. Import volumes from New Zealand would be expected to remain similar, as it is not
UK dairy exports, 2015Leading global sheep meat importers, 2015
Self-sufficiency Production Imports Exports Consumption
4%6%
15%
74%
54%
12%
5%
8%
9%
12%
Uk sheep meat exports
Non EU
France
Other EU
Belgium
Germany
Ireland
250
200
150
100
50
0
Leading global sheep meat importers, 2015
2005 2006 2007 2008 2009 2010 2011 2012 2013 2014 2015
450
400
350
300
250
200
150
100
50
0
1,00
0 to
nnes
105%
100%
95%
90%
85%
80%
75%
Self
-suffi
cenc
y
UK sheep meat balance sheet
Uk Sheep imports
OtherNon EU 1%Other EU
Ireland
Australia
New Zealand
1,00
0 to
nnes
China France UK US Saudi Arabia Germany Malaysia
450
400
350
250
200
150
50
0
Leading global sheep meat exporters, 2015
1,00
0 to
nnes
Australia New Zealand UK Ireland Spain Netherlands India
Sources: GTIS, UN Comtrade

21
Sheep meat at a glanceThe EU quota system for sheep meat imports allows New Zealand, in particular, tariff-free access and much will depend on how these imports are managed in futureThe UK is by far the largest exporter of sheep meat in the EU, so tariff-free access to the EU market will be crucial to the sector’s prospectsFrance is the UK’s biggest customer for sheep meat, accounting for around half of exportsUK lamb struggles to compete on price outside the EU but there are opportunities to position as a premium productCheaper cuts and offal may offer a market opportunity in Asia, the Middle East and emerging economies, subject to agreeing market access
filling its quota now. However, there is potential for higher imports from Australia if it had a larger quota or wider tariff-free access. This could provide increased competition for domestic producers, particularly in foodservice. This has the potential to drive down prices, particularly at certain times of year, although if it stimulates additional demand, it could benefit domestic producers in the longer-term.
The overall effect of this would be highly dependent on any trade deal between the UK and the EU, the UK’s largest export market for sheep meat. If UK sheep meat was subject to tariffs when entering the EU, it would result in product from the UK becoming uncompetitive in our main markets, potentially leading to a collapse in export volumes. This could be mitigated, if the UK had access to an import quota, although that could limit opportunities for future growth. Tariffs could also limit movement of Northern Irish lambs to slaughter in Ireland.
UK dairy exports, 2015
Self-sufficiency Production Imports Exports Consumption
4%6%
15%
74%
54%
12%
5%
8%
9%
12%
Uk sheep meat exports
Non EU
France
Other EU
Belgium
Germany
Ireland
250
200
150
100
50
0
Leading global sheep meat importers, 2015
2005 2006 2007 2008 2009 2010 2011 2012 2013 2014 2015
450
400
350
300
250
200
150
100
50
0
1,00
0 to
nnes
105%
100%
95%
90%
85%
80%
75%
Self
-suffi
cenc
y
UK sheep meat balance sheet
Uk Sheep imports
OtherNon EU 1%Other EU
Ireland
Australia
New Zealand
1,00
0 to
nnes
China France UK US Saudi Arabia Germany Malaysia
450
400
350
250
200
150
50
0
Leading global sheep meat exporters, 2015
1,00
0 to
nnes
Australia New Zealand UK Ireland Spain Netherlands India
Leading global sheep meat exporters, 2015
Source: GTIS

22
Current situation – exports
Pork exports have been steadily increasing over recent years. Domestic demand is strong for loin and leg cuts, in particular, so exports mainly aim to find better markets for other products, which have a higher value overseas than in the UK. These markets also help to reduce the volume of waste, by taking products for which there is little or no value in the UK, such as offal.
Pork exports have grown by over 50,000 tonnes since 2010, and have increased from 21 per cent to 26 per cent of production, with a further rise expected this year. Offal exports have more than doubled over the same time period, assisted by improved market access outside the EU. Offal exports were almost 59,000 tonnes in 2015 versus 28,000 tonnes in 2010, with 2013 the only year showing a fall in export volumes over the past six years.
The value of UK fresh and frozen pork exports in 2015 was £197 million. This was a decline on the previous two years, which highlighted the global pressure on pig prices since late 2014. Much of this pressure was caused by global over-supply, with the Russian import ban exacerbating this. In contrast, the value of offal exports was more than double 2010 values, at over £38 million in 2015.
In 2015, 70 per cent of UK pork exports went to fellow EU Member States. Germany and Ireland were the main destinations for UK pork. Denmark and the Netherlands were also major recipients but much of this pork is thought to be for re-export to third countries, partly reflecting the EU ownership of some UK processors. Shipments to Germany are predominantly of sow
meat; the vast majority of UK sow meat is exported as there is little domestic demand for products containing it. Exports to China accounted for 15 per cent of all pork shipments in 2015, and have grown significantly throughout 2016. Shipments to the United States grew sharply through 2015 and 2016 and the expansion of this market creates more value, due to the higher-value cuts involved.
Current situation – imports
The UK is a net importer of pig meat, currently importing around 60 per cent of all the pork it consumes. The volume of these imports stood at 968,000 tonnes in 2015. Import levels have fluctuated slightly over recent years – since falling back in 2012, they have been increasing steadily year-on-year. Denmark is the dominant supplier, accounting for over a quarter of all UK pork imports. Together with Germany and the Netherlands, they account for 60 per cent of imports. The EU supplies virtually all the pork imported into the UK, due to the high import tariffs on pork from elsewhere.
Fresh and frozen pork makes a little over 40 per cent of all pig meat imports (the remainder being processed products). Almost 80 per cent of this is fresh/chilled, the majority being boneless cuts, which will achieve higher prices as little or no further processing is required and transport costs are lower. The remaining 20 per cent is frozen product, predominantly made up of boneless cuts.
On top of this, the UK imports substantial quantities of bacon, gammon, ham, sausages and other processed pig meat products. These are mostly derived from cuts for which domestic demand exceeds supply.
UK pork exports, 2015
Self-sufficiency Production Imports Exports Consumption
17%16%
23%
13%15%
17%
26%30%
10%
15%
18%
Uk pork exports, 2015
Other non EU
Ireland
China
Other EU
Germany
Denmark
2,000
1,500
1,000
500
0
2009 2010 2011 2012 2013 2014 2015
1,800
1,600
1,400
1,200
1,000
800
600
400
200
0
1,00
0 to
nnes
60%
55%
50%
45%
40%
Self
-suffi
cenc
y
UK pork balance sheet
1,00
0 to
nnes
EU US Canada Brazil Chile Mexico Hong Kong
Leading global pork exporters, 2015
Other EU Denmark
Netherlands
Belgium Germany
Non-EU
Uk pork imports, 2015
900
800
700
600
500
400
300
200
100
0
1,00
0 to
nnes
Japan China Mexico US South Hong Australia Korea Kong
Leading global pork importers, 2015
UK pork imports, 2015
Self-sufficiency Production Imports Exports Consumption
17%16%
23%
13%15%
17%
26%30%
10%
15%
18%
Uk pork exports, 2015
Other non EU
Ireland
China
Other EU
Germany
Denmark
2,000
1,500
1,000
500
0
2009 2010 2011 2012 2013 2014 2015
1,800
1,600
1,400
1,200
1,000
800
600
400
200
0
1,00
0 to
nnes
60%
55%
50%
45%
40%
Self
-suffi
cenc
y
UK pork balance sheet
1,00
0 to
nnes
EU US Canada Brazil Chile Mexico Hong Kong
Leading global pork exporters, 2015
Other EU Denmark
Netherlands
Belgium Germany
Non-EU
Uk pork imports, 2015
900
800
700
600
500
400
300
200
100
0
1,00
0 to
nnes
Japan China Mexico US South Hong Australia Korea Kong
Leading global pork importers, 2015
Pork
Source: HMRC
Source: HMRC

23
Current situation – tariffs and trade barriersAlmost all pig meat imports into the EU, with the exception of offal, are subject to sizeable import tariffs. They range from €172 to €1,494 per tonne, depending on the cut. The high level of tariffs effectively mean that most non-EU pork is uncompetitive on the EU market, even though production costs and wholesale prices are lower in other exporting countries such as the United States, Canada and Brazil.
None of the existing EU FTAs is significant for UK pork exports, though both South Korea and Vietnam are potential future markets. However, negotiations have been completed or are underway with all the major pork exporters, Canada, the US and Brazil (part of the Mercosur trade bloc). These may result in these countries gaining increased access to the EU market once agreements have been ratified.
The main non-tariff barriers limiting access to the EU market are sanitary and phytosanitary (SPS) measures. There are a range of such requirements but perhaps the most significant is the widespread use of the EU-banned growth hormone Ractopamine, especially among producers from the United States. This would probably limit imports to a large extent, even if tariffs were removed, although the level of hormone-free production is rising.
Russia was one of the largest importers of EU pork prior to it banning all EU pig meat in 2014 on the grounds of concerns over African Swine Fever (ASF). However, the World Trade Organisation (WTO) has now ruled this ban unlawful, although it remains to be seen how Russia will respond to the ruling.
UK pork balance sheet
Self-sufficiency Production Imports Exports Consumption
17%16%
23%
13%15%
17%
26%30%
10%
15%
18%
Uk pork exports, 2015
Other non EU
Ireland
China
Other EU
Germany
Denmark
2,000
1,500
1,000
500
0
2009 2010 2011 2012 2013 2014 2015
1,800
1,600
1,400
1,200
1,000
800
600
400
200
0
1,00
0 to
nnes
60%
55%
50%
45%
40%
Self
-suffi
cenc
y
UK pork balance sheet
1,00
0 to
nnes
EU US Canada Brazil Chile Mexico Hong Kong
Leading global pork exporters, 2015
Other EU Denmark
Netherlands
Belgium Germany
Non-EU
Uk pork imports, 2015
900
800
700
600
500
400
300
200
100
0
1,00
0 to
nnes
Japan China Mexico US South Hong Australia Korea Kong
Leading global pork importers, 2015
Pork
Sources: Defra, HMRC, AHDB

24
OpportunitiesThe UK may decide to keep import tariffs on pork at current EU levels and apply these to EU imports, unless a trade deal is struck. It could also decide to apply quotas to allow some imports. These actions could significantly limit the volume of EU pork entering the UK market. In the shorter term, this action would significantly tighten supplies on the domestic market, while domestic production responded to the change in trade flow. With the tightening of supplies, it would be expected that pig price could rise sharply.
However, it is hard to predict how this action would affect the UK market in the longer term. Due to the issue of carcase balance, there would be a large excess of the less popular cuts required if domestic production were to satiate the demand for the more popular parts. This excess product would need to find a market – either at home or abroad. Consumer demand for pig meat could also be affected if customers did not respond favourably to price rises. Depending on the extent of similar issues for other meats, demand may be difficult to stimulate if, and when, supply levels recovered.
Carcase balance, as well as overall demand, may be addressed by increasing trade with non-EU countries, such as China. This may depend on updating existing bilateral trade agreements to reflect the UK’s departure from the EU. The UK will be able to prioritise negotiation of FTAs which could benefit pork exporters and might be able to react quicker to any changes in policy or demand set by importing countries.
The benefits would arise particularly from delivering better values for exports of lower-value cuts and offal. This could improve returns to the UK industry, as these products have little or no value on the domestic market. As well as China, there may be opportunities in emerging markets elsewhere in Asia and Africa, if the right trade deals can be negotiated. Complex FTA-type deals may not be required, if regulatory and trading arrangements can be agreed.
ThreatsIf the UK was to leave the EU before a trade deal was agreed, this would leave it vulnerable to tariffs being applied on its exported pig meat to other EU countries. Given that the EU accounts for 70 per cent of all pork exports, this could have a sizeable impact on the UK’s export market, with a knock-on effect on prices.
One particular issue could be exports of sow meat. Germany is the main destination for cull sows, which have little value on the domestic market. Therefore, if these exports were subject to tariffs, it could have significant implications for this market, with sows potentially having little or no value. While this only forms a relatively small part of producers’ incomes, it would certainly have an effect on profitability.
UK dairy exports, 2015Leading global pork importers, 2015
Self-sufficiency Production Imports Exports Consumption
17%16%
23%
13%15%
17%
26%30%
10%
15%
18%
Uk pork exports, 2015
Other non EU
Ireland
China
Other EU
Germany
Denmark
2,000
1,500
1,000
500
0
2009 2010 2011 2012 2013 2014 2015
1,800
1,600
1,400
1,200
1,000
800
600
400
200
0
1,00
0 to
nnes
60%
55%
50%
45%
40%
Self
-suffi
cenc
y
UK pork balance sheet
1,00
0 to
nnes
EU US Canada Brazil Chile Mexico Hong Kong
Leading global pork exporters, 2015
Other EU Denmark
Netherlands
Belgium Germany
Non-EU
Uk pork imports, 2015
900
800
700
600
500
400
300
200
100
0
1,00
0 to
nnes
Japan China Mexico US South Hong Australia Korea Kong
Leading global pork importers, 2015
Source: GTIS

25
UK dairy exports, 2015
Self-sufficiency Production Imports Exports Consumption
17%16%
23%
13%15%
17%
26%30%
10%
15%
18%
Uk pork exports, 2015
Other non EU
Ireland
China
Other EU
Germany
Denmark
2,000
1,500
1,000
500
0
2009 2010 2011 2012 2013 2014 2015
1,800
1,600
1,400
1,200
1,000
800
600
400
200
0
1,00
0 to
nnes
60%
55%
50%
45%
40%
Self
-suffi
cenc
y
UK pork balance sheet
1,00
0 to
nnes
EU US Canada Brazil Chile Mexico Hong Kong
Leading global pork exporters, 2015
Other EU Denmark
Netherlands
Belgium Germany
Non-EU
Uk pork imports, 2015
900
800
700
600
500
400
300
200
100
0
1,00
0 to
nnes
Japan China Mexico US South Hong Australia Korea Kong
Leading global pork importers, 2015
Leading global pork exporters, 2015
As with other meats, there is a risk that access to some markets for pig meat or offal depends on the UK following EU rules and regulations. If trade deals are not renegotiated, this trade could be closed off, at least temporarily.
Should the UK decide not to impose tariffs on imports, or negotiate quotas with global exporters, this may leave the UK market vulnerable to cheaper pork, for example from the US, Canada or Brazil, which operate at a much lower cost of production. This could cause a large over-supply in the domestic market and it would take some time for production levels to respond accordingly.
While much of this additional supply may displace imports from the EU, the UK pig price would be negatively affected. This could lead to a substantial reduction of the size of the UK breeding herd. Consumer demand may increase should the price fall but recent history has shown that this may not always be the case and there are a myriad of other factors affecting the purchase decision.
Pork sector at a glanceThe EU currently supplies around 60 per cent of domestic pork demand
Exports are important to add value to cuts unpopular with UK consumers
Tariff or quota limits on the volume of pork traded between EU and UK could mean sharp price movements, affecting demand
EU import tariffs could curb sow meat exports to the UK’s main customer, Germany, seriously reducing the value of UK sows
Regulatory and trading agreements with individual countries on certain products may bypass need for complex FTA negotiations
Source: GTIS

26
Current situation – exports
Although the UK is a net importer of poultry meat, UK
Although the UK is a net importer of poultry meat, UK consumers’ preference for certain cuts, notably breast meat, means that it exports surplus dark meat from other parts of the carcase. In recent years, exports have usually been between 250–300,000 tonnes annually, equivalent to 20–25 per cent of production. Exports fell in 2015 as outbreaks of Avian Influenza (AI) meant some markets were temporarily closed to UK poultry meat.
Around 70 per cent of exports are to other EU countries, although the share was higher in 2015. The Netherlands is the largest market, although this is partly because of the Rotterdam effect. Outside the EU, the key markets are South Africa and Hong Kong, which accounted for around 20 per cent of exports in 2014 (12 per cent in 2015 due to the AI outbreak).
Current situation – imports
The UK currently imports around 40 per cent of the poultry meat it consumes. Fresh/frozen imports, 95 per cent of which come from elsewhere in the EU, are mainly made up of breast meat. They reached a record 440,000 tonnes last year. The Netherlands is the leading supplier, although the Rotterdam effect may exaggerate its share to some extent.
Processed (mainly cooked) poultry meat imports, again mainly of breast meat, are also important, totalling 337,000 tonnes in 2015. More than half come from outside the EU, with Thailand and Brazil the two leading suppliers.
Uk poultry meat exports by destination, 2015
Self-sufficiency Production Imports Exports Consumption
44%
15%
9%
7%
7%
14%
5%
32%
14%
8%8%
16%
23%
2005 2006 2007 2008 2009 2010 2011 2012 2013 2014 2015
2,500
2,000
1,500
1000
500
0
1,00
0 to
nnes
UK Poultry meat balance sheet
84%
82%
80%
78%
76%
74%
72%
70%
Self
-suffi
cenc
y
Uk poultry meat imports by source, 2015
Non EU
Ireland
Other EU
Germany
Poland
Netherlands
Uk poultry meat exports by destination, 2015
Non EU
Ireland
Other EU
Netherlands
France
1,000
900
800
700
600
500
400
300
200
100
0
4,500
4,000
3,500
3,000
2,500
2,000
1,500
1,000
500
0
Leading global poultry meat importers, 2015
Leading global poultry meat exporters, 2015
Saudi Mexico Hong Kong Japan South Africa China EU Arabia
Brazil US EU Hong Kong Turkey Argentina
Belgium
Germany
1,00
0 to
nnes
1,00
0 to
nnes
Uk poultry meat imports by source, 2015
Self-sufficiency Production Imports Exports Consumption
44%
15%
9%
7%
7%
14%
5%
32%
14%
8%8%
16%
23%
2005 2006 2007 2008 2009 2010 2011 2012 2013 2014 2015
2,500
2,000
1,500
1000
500
0
1,00
0 to
nnes
UK Poultry meat balance sheet
84%
82%
80%
78%
76%
74%
72%
70%
Self
-suffi
cenc
y
Uk poultry meat imports by source, 2015
Non EU
Ireland
Other EU
Germany
Poland
Netherlands
Uk poultry meat exports by destination, 2015
Non EU
Ireland
Other EU
Netherlands
France
1,000
900
800
700
600
500
400
300
200
100
0
4,500
4,000
3,500
3,000
2,500
2,000
1,500
1,000
500
0
Leading global poultry meat importers, 2015
Leading global poultry meat exporters, 2015
Saudi Mexico Hong Kong Japan South Africa China EU Arabia
Brazil US EU Hong Kong Turkey Argentina
Belgium
Germany
1,00
0 to
nnes
1,00
0 to
nnes
Poultry Meat
Although AHDB does not cover the poultry meat sector, trade developments can have a significant impact on the beef, lamb and pork sectors, as well as the cereals sector. The analysis below is not intended to be a full assessment of the impact of Brexit on the poultry meat sector. Rather it focuses on how any impact may affect the red meat sectors.
Source: HMRC
Source: HMRC

27
UK poultry meat balance sheet
Self-sufficiency Production Imports Exports Consumption
44%
15%
9%
7%
7%
14%
5%
32%
14%
8%8%
16%
23%
2005 2006 2007 2008 2009 2010 2011 2012 2013 2014 2015
2,500
2,000
1,500
1000
500
0
1,00
0 to
nnes
UK Poultry meat balance sheet
84%
82%
80%
78%
76%
74%
72%
70%Se
lf-s
uffice
ncy
Uk poultry meat imports by source, 2015
Non EU
Ireland
Other EU
Germany
Poland
Netherlands
Uk poultry meat exports by destination, 2015
Non EU
Ireland
Other EU
Netherlands
France
1,000
900
800
700
600
500
400
300
200
100
0
4,500
4,000
3,500
3,000
2,500
2,000
1,500
1,000
500
0
Leading global poultry meat importers, 2015
Leading global poultry meat exporters, 2015
Saudi Mexico Hong Kong Japan South Africa China EU Arabia
Brazil US EU Hong Kong Turkey Argentina
Belgium
Germany
1,00
0 to
nnes
1,00
0 to
nnes
Current situation – tariffs and trade barriersPoultry imports into the EU are subject to tariffs of between €187 and €1,283 per tonne, depending on the cut and species, with breast meat towards the top end of this range. Processed poultry meat is also subject to import tariffs, of between €1,024 and €2,765 per tonne. As a result, most imports are through tariff rate quotas.
None of the existing EU Free Trade Agreements are significant for poultry meat trade. However, negotiations with the US and Mercosur (including Brazil) may provide them with increased access to the EU market once concluded. For the US, at least, this will require agreement on sanitary and phytosanitary (SPS) measures, which may prove challenging given different approaches adopted in these countries.
Poultry Meat
Sources: Defra, HMRC, AHDB
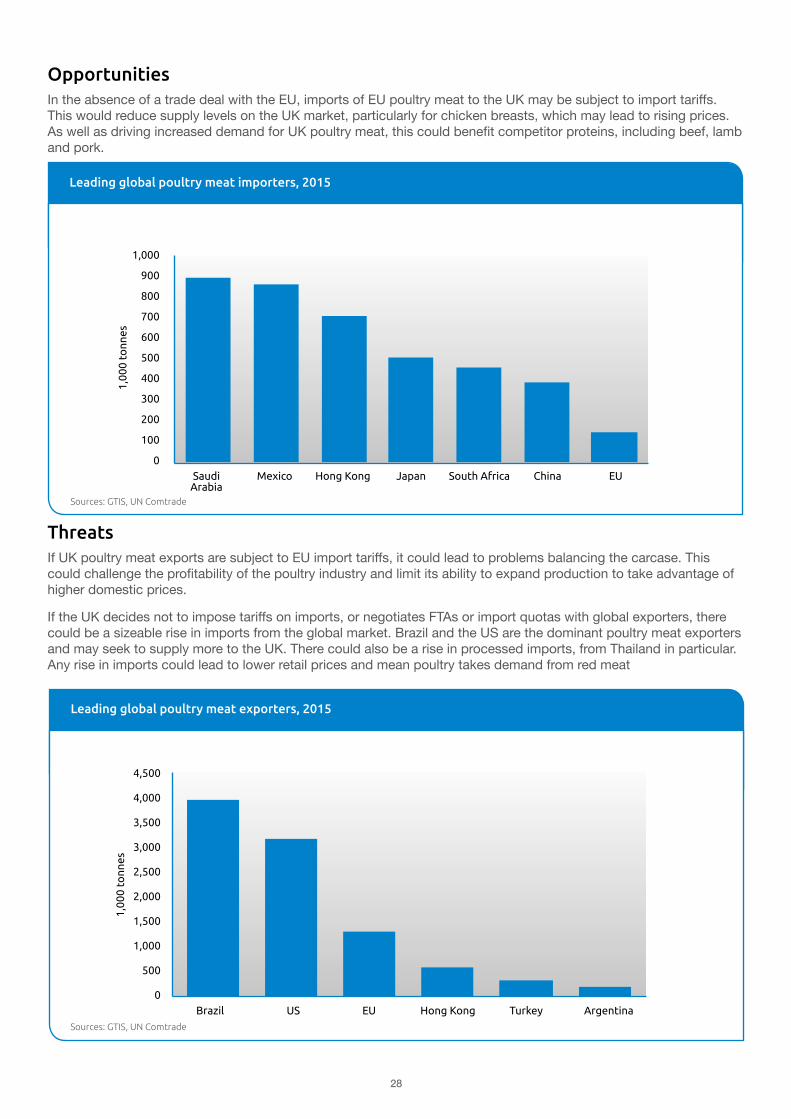
28
OpportunitiesIn the absence of a trade deal with the EU, imports of EU poultry meat to the UK may be subject to import tariffs. This would reduce supply levels on the UK market, particularly for chicken breasts, which may lead to rising prices. As well as driving increased demand for UK poultry meat, this could benefit competitor proteins, including beef, lamb and pork.
UK dairy exports, 2015
Self-sufficiency Production Imports Exports Consumption
44%
15%
9%
7%
7%
14%
5%
32%
14%
8%8%
16%
23%
2005 2006 2007 2008 2009 2010 2011 2012 2013 2014 2015
2,500
2,000
1,500
1000
500
0
1,00
0 to
nnes
UK Poultry meat balance sheet
84%
82%
80%
78%
76%
74%
72%
70%
Self
-suffi
cenc
y
Uk poultry meat imports by source, 2015
Non EU
Ireland
Other EU
Germany
Poland
Netherlands
Uk poultry meat exports by destination, 2015
Non EU
Ireland
Other EU
Netherlands
France
1,000
900
800
700
600
500
400
300
200
100
0
4,500
4,000
3,500
3,000
2,500
2,000
1,500
1,000
500
0
Leading global poultry meat importers, 2015
Leading global poultry meat exporters, 2015
Saudi Mexico Hong Kong Japan South Africa China EU Arabia
Brazil US EU Hong Kong Turkey Argentina
Belgium
Germany
1,00
0 to
nnes
1,00
0 to
nnes
Leading global poultry meat exporters, 2015
ThreatsIf UK poultry meat exports are subject to EU import tariffs, it could lead to problems balancing the carcase. This could challenge the profitability of the poultry industry and limit its ability to expand production to take advantage of higher domestic prices.
If the UK decides not to impose tariffs on imports, or negotiates FTAs or import quotas with global exporters, there could be a sizeable rise in imports from the global market. Brazil and the US are the dominant poultry meat exporters and may seek to supply more to the UK. There could also be a rise in processed imports, from Thailand in particular. Any rise in imports could lead to lower retail prices and mean poultry takes demand from red meat
UK dairy exports, 2015
Self-sufficiency Production Imports Exports Consumption
44%
15%
9%
7%
7%
14%
5%
32%
14%
8%8%
16%
23%
2005 2006 2007 2008 2009 2010 2011 2012 2013 2014 2015
2,500
2,000
1,500
1000
500
0
1,00
0 to
nnes
UK Poultry meat balance sheet
84%
82%
80%
78%
76%
74%
72%
70%
Self
-suffi
cenc
y
Uk poultry meat imports by source, 2015
Non EU
Ireland
Other EU
Germany
Poland
Netherlands
Uk poultry meat exports by destination, 2015
Non EU
Ireland
Other EU
Netherlands
France
1,000
900
800
700
600
500
400
300
200
100
0
4,500
4,000
3,500
3,000
2,500
2,000
1,500
1,000
500
0
Leading global poultry meat importers, 2015
Leading global poultry meat exporters, 2015
Saudi Mexico Hong Kong Japan South Africa China EU Arabia
Brazil US EU Hong Kong Turkey Argentina
Belgium
Germany
1,00
0 to
nnes
1,00
0 to
nnes
Leading global poultry meat importers, 2015
Sources: GTIS, UN Comtrade
Sources: GTIS, UN Comtrade

29
Poultry sector at a glanceChanges to trade conditions affecting poultry meat could have an impact on other meats
Loss of tariff-free trade between UK and EU could increase demand for UK poultry meat but limit the industry’s ability to balance demand for different parts of the carcase
Any opening up of the market could lead to increased competition from global exporters, for poultry and other meats

30
Current situation – exports
UK cereal exports fluctuate from season to season, due mainly to availability, price competitiveness and quality. Full season UK wheat exports for 2015/16 reached 2.8m tonnes, the highest since 2008/09. Total UK barley exports came to 1.99m tonnes, the highest since 1996/97. This strong export campaign was helped by the weakening of the sterling, which made UK grains more competitive internationally. Around 80 per cent of wheat exported in 2015/16 went to the EU, mainly to the Netherlands, Portugal and Spain. The latter has long been a key destination for UK wheat – Spain imports around 5m tonnes of wheat per year, of various grades. With a rise in animal production in Asia, there has been an increase in demand for feed grains, including wheat. Global freight rates are currently low, which has helped the UK to compete for demand against countries closer to Asia. Exporting grain to Asia requires huge vessels and the UK has port capability, particularly in the South, to load such ships.In the feed grain market, wheat has to compete with maize. In contrast to the UK, where wheat is the predominant feed grain, maize dominates at the global level. In 2015/16 maize accounted for 69 per cent of global animal feed demand of the four major grains (wheat, barley, maize, sorghum), according to the US Department of Agriculture (USDA). To secure a slice of the growing global feed demand, feed wheat has to be price competitive against maize – a crop that due to its biology can very efficiently convert
sunlight into stored energy. Advances in GM are likely to further drive the efficiency of maize as a source of energy. UK feed wheat has been sold to Asia in recent history but only during relatively narrow periods of price competitiveness.Two-thirds of barley exports in 2015/16 went to the EU, with the main destinations the same as for wheat. The UK exports both feed and malting barley, with a greater share of barley exports heading to non-EU destinations than wheat. Algeria, in particular, has been a growing market, driven by increased feed demand and drought impacts on the local crop. Saudi Arabia has also remained a key destination for UK barley exports.UK unroasted malt exports in 2015/16 reached 179,000 tonnes, the highest since 2012/13. The majority goes to Japan which, on average, has accounted for around 45 per cent of malt exports in the last ten years. For oilseeds, the UK is part of the wider European rapeseed market, with the UK’s two oilseed crushers also operating plants across mainland Europe. In 2015/16, exports of rapeseed were almost entirely to EU countries, accounting for 94 per cent of the 443,000 tonnes exported. Germany was the main destination within the EU, mainly for use in biofuels.
Current situation – imports
Grain imports into the UK are dominated by wheat and maize. On average over the past ten seasons, imports accounted for 11 per cent of domestic wheat demand, though this varied between seven and 20 per cent, influenced by UK crop size and quality. The main origins
UK wheat and barley exports, 2015/16
Production Imports Exports
Production Exports Imports
2005/06
2006/07
2007/08
2008/09
2009/10
2010/11
2011/12
2012/13
2013/14
2014/15
2015/16
17% 18%
16%
9%
8%7%6%
4%
16%
7%
37%
12%12%
8%
6%
16%
Wheat and barley exports for 2015/16Other non EU
Spain
Portugal
Other EU
Netherlands
0.8
0.7
0.6
0.5
0.4
0.3
0.2
0.1
0
5
4
3
2
1
0
Trad
e (M
illio
n to
nnes
)
25
24
23
22
21
20
19
18
17
16
15
Pro
duc
tio
n (M
illio
n to
nnes
)
Wheat and barley UK production, exports and imports
Mill
ion
tonn
es
UK's top suppliers of maize 2015/16
Wheat and barley imports 2015/16
Other Non-EU
Germany
France
Other EU
Canada
DenmarkIreland
Sweden
USA
Ukraine 1%
Algeria
Tunisia
Japan 2%
France
Ukrain
e
Ireland
Argentin
a
Romania
Canada
Russia
3.0
2.5
2.0
1.5
1.0
0.5
0.0
Mill
ion
tonn
es
Rapeseed Soyabeans Soyameal
UK production, exports and imports of rapeseed, soyabeans and soyameal
UK wheat and barley imports, 2015/16
Production Imports Exports
Production Exports Imports
2005/06
2006/07
2007/08
2008/09
2009/10
2010/11
2011/12
2012/13
2013/14
2014/15
2015/16
17% 18%
16%
9%
8%7%6%
4%
16%
7%
37%
12%12%
8%
6%
16%
Wheat and barley exports for 2015/16Other non EU
Spain
Portugal
Other EU
Netherlands
0.8
0.7
0.6
0.5
0.4
0.3
0.2
0.1
0
5
4
3
2
1
0
Trad
e (M
illio
n to
nnes
)
25
24
23
22
21
20
19
18
17
16
15
Pro
duc
tio
n (M
illio
n to
nnes
)
Wheat and barley UK production, exports and imports
Mill
ion
tonn
es
UK's top suppliers of maize 2015/16
Wheat and barley imports 2015/16
Other Non-EU
Germany
France
Other EU
Canada
DenmarkIreland
Sweden
USA
Ukraine 1%
Algeria
Tunisia
Japan 2%
France
Ukrain
e
Ireland
Argentin
a
Romania
Canada
Russia
3.0
2.5
2.0
1.5
1.0
0.5
0.0
Mill
ion
tonn
es
Rapeseed Soyabeans Soyameal
UK production, exports and imports of rapeseed, soyabeans and soyameal
Cereals & Oilseeds
Source: HMRC
Source: HMRC

31
Cereals & Oilseeds
for wheat imports are Germany, Canada and France, typically supplying around two-thirds of UK imports, primarily of milling grades. In particular, high protein wheat is often sourced from Germany and Canada.
Of UK maize imports, around two-thirds were imported from the EU in 2015/16. Ten years ago maize imports came almost exclusively from France. Increasing volumes are being imported from Ukraine and Eastern EU countries, such as Romania. Depreciating local currencies, as well as increased production of maize in the Black Sea region are factors behind the switch. As well as competing with feed wheat in the export market, it is evident that imported maize is also competing for demand in the UK marketplace.
In terms of oilseeds and their products, the UK mainly imports soyameal, with 2015/16 levels at 2.26m tonnes, the highest volume ever. The majority was from non-EU countries, in particular Argentina, as a critical raw material in the production of animal feed.
Current situation – tariffs and trade barriersFor oilseeds and protein crops, there are duties on EU imports of some vegetable oils (at rates up to 12.8 per cent), broad beans and sweet lupins. Imports of the raw oilseeds themselves and oilseed meals are duty free.
For cereal imports into the EU, tariffs depend on the commodity, grade and origin. Generally, the EU and UK are net exporters, which requires much of the market to operate at global price levels. However, for certain grades of commodity, in certain regions, at certain times there is a need to import. This is when import tariffs come into play.
For medium/low quality wheat, a duty of €12 per tonne is payable up to a maximum volume – the Tariff Rate Quota (TRQ) – with different volumes available for different origins. Ukraine is an exception, with duty free imports up to a maximum of 950,000 tonnes per year. Once the quota limit is reached, additional imports are subject to a tariff of €95 per tonne. For imports of high quality wheat, the import duty is derived by a calculation based on the global market price and the specification, which currently means imports are duty free. This type of import goes through a rigorous inspection process, with vessels met and sampled on arrival by customs officials.
The structure for EU barley import tariffs is similar to wheat. Just over 307,000 tonnes can be imported from any country each year at a tariff of €16 per tonne. An additional 250,000 tonnes can be imported duty-free from Ukraine. A separate TRQ for malting barley, enables 51,000 tonnes to be imported at a duty of €8 per tonne.
All imports of oats into the EU are subject to a duty of €89 per tonne, which is all but prohibitive.
For maize, a total of nearly 280,000 tonnes can be imported into the EU each year duty-free from any non-EU origin. Imported maize must meet the EU criteria relating to GM crops. Once the quota is reached, a variable formula duty is applied. This is currently at zero but has come close to being reintroduced. Again, Ukraine has a separate TRQ and can import up to 400,000 tonnes of maize into the EU duty free each year. Over the coming years, Ukraine’s TRQ into the EU will be subject to annual increases for all grains.

32
Wheat and barley UK production, exports and imports
Production Imports Exports
Production Exports Imports
2005/06
2006/07
2007/08
2008/09
2009/10
2010/11
2011/12
2012/13
2013/14
2014/15
2015/16
17% 18%
16%
9%
8%7%6%
4%
16%
7%
37%
12%12%
8%
6%
16%
Wheat and barley exports for 2015/16Other non EU
Spain
Portugal
Other EU
Netherlands
0.8
0.7
0.6
0.5
0.4
0.3
0.2
0.1
0
5
4
3
2
1
0
Trad
e (M
illio
n to
nnes
)
25
24
23
22
21
20
19
18
17
16
15
Pro
duc
tio
n (M
illio
n to
nnes
)
Wheat and barley UK production, exports and imports
Mill
ion
tonn
es
UK's top suppliers of maize 2015/16
Wheat and barley imports 2015/16
Other Non-EU
Germany
France
Other EU
Canada
DenmarkIreland
Sweden
USA
Ukraine 1%
Algeria
Tunisia
Japan 2%
France
Ukrain
e
Ireland
Argentin
a
Romania
Canada
Russia
3.0
2.5
2.0
1.5
1.0
0.5
0.0
Mill
ion
tonn
es
Rapeseed Soyabeans Soyameal
UK production, exports and imports of rapeseed, soyabeans and soyameal
OpportunitiesAt this time, with little detail of the relationship the UK will have with the EU market place, it is challenging to be specific on the opportunities that Brexit presents.
Compared to other agricultural goods, grains and oilseeds are relatively free-trading commodities globally. Accessing a market is more about price competitiveness, being able to supply the required specification and the ability to meet technical requirements (eg. phytosanitary measures).
The scenario where the UK maintains its own import tariffs would, in theory, allow it to flex them in response to the specific needs of the UK market and to protect the standards and traceability that domestic production represents. Whether this is indeed practical or politically acceptable is currently unclear.
ThreatsGiven the high level of integration the UK grain and oilseed markets have with the EU, it is currently more straightforward to identify the threats. Reduced access to the single market is one of the biggest risks facing the UK arable industry, especially if tariffs apply to UK exports to the EU. This would expose the UK industry more directly to raw global market forces.
Imposition of tariffs could have a particular impact on businesses processing cereals and oilseeds for export to the EU. For example, there are risks around exports of flour to Ireland, given tariffs are higher on flour than on wheat.
The same is true if tariffs on imports into the UK are removed. The proximity of the UK to increasingly dominant producers and the low cost of moving grain around the world could quickly expose the UK to global production gluts, undermining domestic production and in turn exposing supply chains to periods of global shortage.
Sources: Defra, HMRC
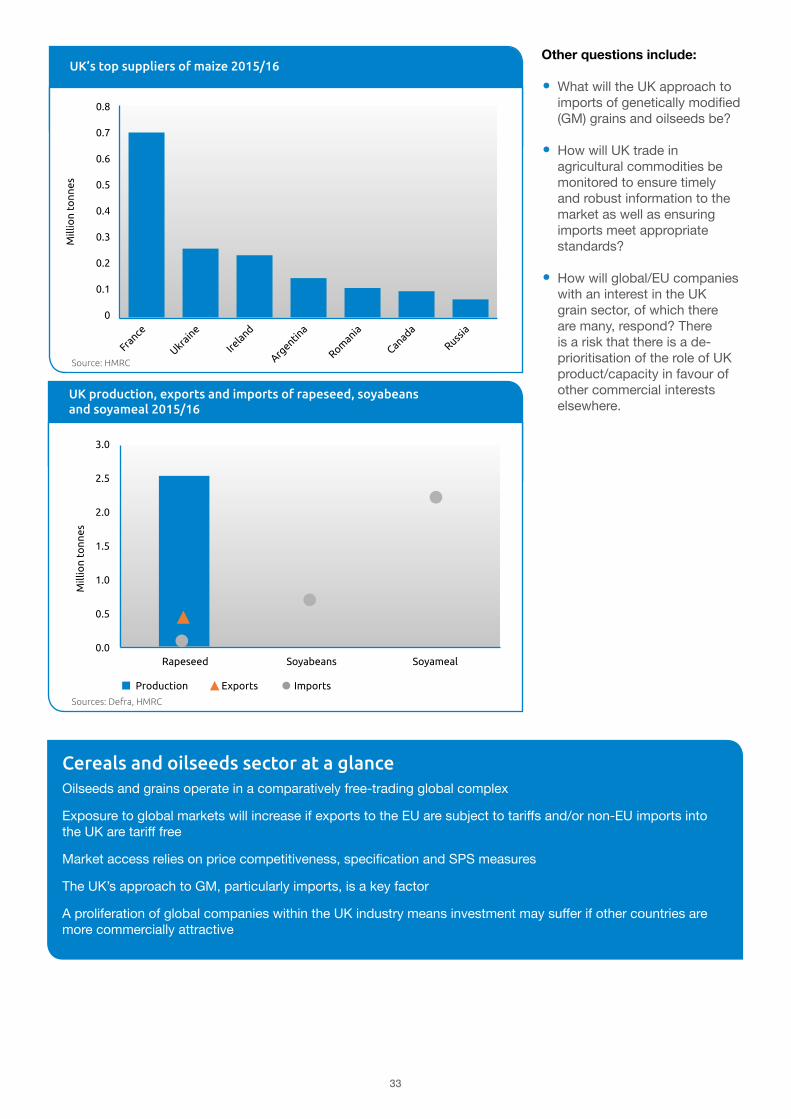
33
UK dairy exports, 2015
Production Imports Exports
Production Exports Imports
2005/06
2006/07
2007/08
2008/09
2009/10
2010/11
2011/12
2012/13
2013/14
2014/15
2015/16
17% 18%
16%
9%
8%7%6%
4%
16%
7%
37%
12%12%
8%
6%
16%
Wheat and barley exports for 2015/16Other non EU
Spain
Portugal
Other EU
Netherlands
0.8
0.7
0.6
0.5
0.4
0.3
0.2
0.1
0
5
4
3
2
1
0
Trad
e (M
illio
n to
nnes
)
25
24
23
22
21
20
19
18
17
16
15
Pro
duc
tio
n (M
illio
n to
nnes
)
Wheat and barley UK production, exports and imports
Mill
ion
tonn
es
UK's top suppliers of maize 2015/16
Wheat and barley imports 2015/16
Other Non-EU
Germany
France
Other EU
Canada
DenmarkIreland
Sweden
USA
Ukraine 1%
Algeria
Tunisia
Japan 2%
France
Ukrain
e
Ireland
Argentin
a
Romania
Canada
Russia
3.0
2.5
2.0
1.5
1.0
0.5
0.0
Mill
ion
tonn
es
Rapeseed Soyabeans Soyameal
UK production, exports and imports of rapeseed, soyabeans and soyameal
UK’s top suppliers of maize 2015/16
UK dairy exports, 2015
Production Imports Exports
Production Exports Imports
2005/06
2006/07
2007/08
2008/09
2009/10
2010/11
2011/12
2012/13
2013/14
2014/15
2015/16
17% 18%
16%
9%
8%7%6%
4%
16%
7%
37%
12%12%
8%
6%
16%
Wheat and barley exports for 2015/16Other non EU
Spain
Portugal
Other EU
Netherlands
0.8
0.7
0.6
0.5
0.4
0.3
0.2
0.1
0
5
4
3
2
1
0
Trad
e (M
illio
n to
nnes
)
25
24
23
22
21
20
19
18
17
16
15
Pro
duc
tio
n (M
illio
n to
nnes
)
Wheat and barley UK production, exports and imports
Mill
ion
tonn
es
UK's top suppliers of maize 2015/16
Wheat and barley imports 2015/16
Other Non-EU
Germany
France
Other EU
Canada
DenmarkIreland
Sweden
USA
Ukraine 1%
Algeria
Tunisia
Japan 2%
France
Ukrain
e
Ireland
Argentin
a
Romania
Canada
Russia
3.0
2.5
2.0
1.5
1.0
0.5
0.0
Mill
ion
tonn
es
Rapeseed Soyabeans Soyameal
UK production, exports and imports of rapeseed, soyabeans and soyameal
UK production, exports and imports of rapeseed, soyabeans and soyameal 2015/16
Other questions include:
• What will the UK approach to imports of genetically modified (GM) grains and oilseeds be?
• How will UK trade in agricultural commodities be monitored to ensure timely and robust information to the market as well as ensuring imports meet appropriate standards?
• How will global/EU companies with an interest in the UK grain sector, of which there are many, respond? There is a risk that there is a de-prioritisation of the role of UK product/capacity in favour of other commercial interests elsewhere.
Cereals and oilseeds sector at a glanceOilseeds and grains operate in a comparatively free-trading global complex
Exposure to global markets will increase if exports to the EU are subject to tariffs and/or non-EU imports into the UK are tariff free
Market access relies on price competitiveness, specification and SPS measures
The UK’s approach to GM, particularly imports, is a key factor
A proliferation of global companies within the UK industry means investment may suffer if other countries are more commercially attractive
Source: HMRC
Sources: Defra, HMRC

34
Potatoes
Current situation – exports
Trade patterns for potatoes are quite distinct between fresh potatoes, seed potatoes and various processed products. UK fresh exports are primarily to well-established markets such as Ireland and the Canary Islands. These tend to be for specific needs (eg. frying supplies for Ireland). However, as fresh potatoes are a relatively inefficient and expensive commodity to transport long distances, exports are a minor part of the industry, worth £43 million in 2015 – though they can be a key component of individual businesses.
Seed exports have traditionally been the focus of most UK export development activity and they are worth a similar amount to the UK as other fresh exports. Egypt has long been the main destination for UK seed exports, and is also the largest destination for its main competitor
(the Netherlands). This is the only product for which non-EU destinations are a significant UK export market – in 2015/16, 73 per cent of UK seed exports were to non-EU countries.
Among processed products, the most noticeable growth for UK exports is in crisps, which were valued at £63 million in 2015. These have been growing, faster than other EU countries’ crisp exports, against a backdrop of strong and consistent EU demand growth over the past 20 years. The added value of processed potato products means they have a higher value to volume ratio than fresh potatoes, making them more efficient to trade. Furthermore, crisps have among the highest value per tonne of all processed products.
UK seed potato exports, 2015
UK production
Imports
Exports
Fresh imports
Fresh exports
Processed imports
Processed exports
Netherlands Belgium France Germany Canada USA
13%
55%
9%
7%
4%
12%
33%
63%
4%
13%
11%
50%
10%
10%
7%
Seed exports by destination
Other EU
Egypt
Other Non-EU
Morocco
Crisp exports by destination
Other Non-EU
Other EU
Ireland
France
Netherlands
Germany
Spain (Inc. Canaries)
Netherlands
Frozen imports by supplier
Belgium
Netherlands
Non-EUOther EU
Fresh (x10)
Seed
Crisped/other processed
Frozen Processed
4
3
2
1
0
1
2
3
Mill
ion
tonn
es
UK production, imports and exports of potatoes and processsed potato products
Major global potato importers & exporters
4.8 million tonnes
200 0 200 400 600 800 1000 1200
1,000 tonnes
UK crisp exports, 2015
UK production
Imports
Exports
Fresh imports
Fresh exports
Processed imports
Processed exports
Netherlands Belgium France Germany Canada USA
13%
55%
9%
7%
4%
12%
33%
63%
4%
13%
11%
50%
10%
10%
7%
Seed exports by destination
Other EU
Egypt
Other Non-EU
Morocco
Crisp exports by destination
Other Non-EU
Other EU
Ireland
France
Netherlands
Germany
Spain (Inc. Canaries)
Netherlands
Frozen imports by supplier
Belgium
Netherlands
Non-EUOther EU
Fresh (x10)
Seed
Crisped/other processed
Frozen Processed
4
3
2
1
0
1
2
3
Mill
ion
tonn
es
UK production, imports and exports of potatoes and processsed potato products
Major global potato importers & exporters
4.8 million tonnes
200 0 200 400 600 800 1000 1200
1,000 tonnes
Current situation – importsFresh potatoes are mostly imported by the UK industry at specific times of year and for specific uses. For a buyer, this either fills gaps in supply or allows access to new season crop before domestic product is available. In some cases, it also meets consumer demand (eg. for Jersey Royal potatoes). Mediterranean countries are often the largest sources of fresh imports for the UK, peaking in the spring, with Israel a particularly prominent origin in 2016.Frozen processed potatoes, such as frozen chips, account for by far the largest proportion of UK imports, worth £315 million last year. In 2013, and each year since, more were imported than produced in the UK. Average prices are lower for imported frozen products than domestically produced and the average price gap has been widening.
Frozen potato imports, 2015
UK production
Imports
Exports
Fresh imports
Fresh exports
Processed imports
Processed exports
Netherlands Belgium France Germany Canada USA
13%
55%
9%
7%
4%
12%
33%
63%
4%
13%
11%
50%
10%
10%
7%
Seed exports by destination
Other EU
Egypt
Other Non-EU
Morocco
Crisp exports by destination
Other Non-EU
Other EU
Ireland
France
Netherlands
Germany
Spain (Inc. Canaries)
Netherlands
Frozen imports by supplier
Belgium
Netherlands
Non-EUOther EU
Fresh (x10)
Seed
Crisped/other processed
Frozen Processed
4
3
2
1
0
1
2
3
Mill
ion
tonn
es
UK production, imports and exports of potatoes and processsed potato products
Major global potato importers & exporters
4.8 million tonnes
200 0 200 400 600 800 1000 1200
1,000 tonnes
Source: HMRC
Source: HMRC
Source: HMRC

35
Current situation – tariffs and trade barriersThe standard external tariffs levied by the EU on imports of potatoes and potato products range from 4.5 per cent to 17.6 per cent, depending on the product involved. These are modified by the various EU trade agreements in place. The one most likely to be having an impact on current UK imports is for fresh and new potatoes from Israel tariff-free, although the volume of new potatoes which can be imported under the quota is limited to 33,900 tonnes.
Relatively few countries in the world dominate production and exports of frozen potato products. Outside the EU, the USA and Canada are the only other major world sources. It is possible that access to EU markets could increase for frozen imports from North America as a result of trade agreements currently in negotiations.
The key non-tariff barriers are plant health measures. Even within the EU, there are some differences in regulation (such as when exporting to the Canary Islands). Imports from non-EU countries must meet EU plant health regulations and imports must be accompanied by a plant health certificate to demonstrate freedom from certain pests and diseases. Individual agreements between the EU and other countries mean that the exact regulations differ from case to case. Similarly, non-EU countries importing EU products will have similar agreements in place at both EU- and UK- level, altering regulations from case to case.
UK production, imports and exports of potatoes and processed potato products, 2015
UK production
Imports
Exports
Fresh imports
Fresh exports
Processed imports
Processed exports
Netherlands Belgium France Germany Canada USA
13%
55%
9%
7%
4%
12%
33%
63%
4%
13%
11%
50%
10%
10%
7%
Seed exports by destination
Other EU
Egypt
Other Non-EU
Morocco
Crisp exports by destination
Other Non-EU
Other EU
Ireland
France
Netherlands
Germany
Spain (Inc. Canaries)
Netherlands
Frozen imports by supplier
Belgium
Netherlands
Non-EUOther EU
Fresh (x10)
Seed
Crisped/other processed
Frozen Processed
4
3
2
1
0
1
2
3
Mill
ion
tonn
es
UK production, imports and exports of potatoes and processsed potato products
Major global potato importers & exporters
4.8 million tonnes
200 0 200 400 600 800 1000 1200
1,000 tonnes
Seed imports into the UK are minor compared to domestic production but tend to fulfil demand for new (usually processing) varieties, often bred in the Netherlands. Seed breeding takes place in both Scotland and the Netherlands, leading to an amount of trade both ways. Typically, it takes a number of years for a variety to become established in the domestic seed industry, meaning growers must often import to access certain newer varieties in the meantime.
Potatoes
Sources: ONS, AHDB, HMRC

36
OpportunitiesGrowth in exports is likely to continue to focus on products with a higher value and/or where the UK has a competitive advantage. Onto both EU and non-EU markets, the UK’s main opportunities exist for seed potatoes and crisps, and growing the access of these to non-EU markets post-Brexit is a source of great opportunity. On a season-by-season basis, opportunities for growing fresh exports into nearby countries exist but not necessarily consistently. The key here is maintaining the option to take advantage of opportunities as necessary.
Expanding seed exports is mostly constrained by non-tariff barriers, such as phytosanitary controls imposed by importing countries. Gaining access rests on being able to satisfy individual countries’ authorities that UK seed can be certified free of a range of pests and diseases. Opportunities to continue to grow seed exports may be greater if the UK gains increased flexibility to negotiate on phytosanitary regulations with potential trade partners. A similar, albeit less substantial benefit, could come for fresh exports too.
The UK industry is likely to gain limited benefit from tariffs being imposed on imports from the EU, should the UK Government choose this path. In the fresh and seed sectors in particular, imports fulfil specific needs the UK is less able to meet.
For processed products, however, there could be some benefits from imposing tariffs on EU product. For example, imported frozen products undercut the average price of UK production, making these more competitive in a larger segment of the UK market than domestic frozen products. Introducing tariffs could help UK production compete, though it is important to see this as a one-off windfall for price competitiveness, not a real driver of efficiency. To make the most of this opportunity, UK production would need to consolidate any market share it can gain and remain competitive against Dutch and Belgian frozen products.
UK exports of processed products, such as crisps, could be increased if the UK gains more flexibility to negotiate on trade deals. Exports to non-EU countries are still only a small part of the UK crisp export mix. However, over the past few years, driven principally by individual brands, markets have been growing – principally in the Far East, Middle East and North America. If the UK Government chooses to pursue trade deals with these economies, there may be opportunities to reduce or remove tariff barriers on products such as crisps as part of these negotiations.
UK dairy exports, 2015
UK production
Imports
Exports
Fresh imports
Fresh exports
Processed imports
Processed exports
Netherlands Belgium France Germany Canada USA
13%
55%
9%
7%
4%
12%
33%
63%
4%
13%
11%
50%
10%
10%
7%
Seed exports by destination
Other EU
Egypt
Other Non-EU
Morocco
Crisp exports by destination
Other Non-EU
Other EU
Ireland
France
Netherlands
Germany
Spain (Inc. Canaries)
Netherlands
Frozen imports by supplier
Belgium
Netherlands
Non-EUOther EU
Fresh (x10)
Seed
Crisped/other processed
Frozen Processed
4
3
2
1
0
1
2
3
Mill
ion
tonn
es
UK production, imports and exports of potatoes and processsed potato products
Major global potato importers & exporters
4.8 million tonnes
200 0 200 400 600 800 1000 1200
1,000 tonnes
Major global potato importers & exporters
Source: UN Comtrade

37
ThreatsIf no trade deal has been agreed with the EU when the UK leaves, UK potatoes and products being exported to EU countries would be subject to tariffs. This is most likely to have the largest impact on those sectors that are orientated towards exports to EU countries. Crisps are most likely to be affected, with 22 per cent of UK non-frozen processed production (of which crisps are a major part) being exported. Of UK crisp exports, 87 per cent go to other EU countries. However, while almost all UK fresh exports head to EU countries, they still only amount to four per cent of UK production. The other main exporting sector, seed, is primarily non-EU focused.
There is also a risk from greater non-tariff barriers into EU countries too. For example, in the absence of an agreement, the EU or UK could impose additional phytosanitary controls on fresh and seed trade. This would make it more difficult for UK exports to enter EU countries – at the very least making the certification process longer, so increasing the cost of doing business for exporting companies.
There are also a number of existing trade agreements between the EU and other countries that benefit the UK potato sector. The EU has agreements in place with many countries around the Mediterranean, which are important UK seed export destinations, such as Egypt and Morocco. In addition, Israel is (in some seasons) the principal source of fresh imports into the UK, as it provides new season potatoes earlier in the year than the UK can.
For Morocco and Egypt, tariffs on seed potato exports from the EU have been completely removed, meaning the UK seed industry would be at a major disadvantage compared to EU competitors should access to these deals be lost. While Egypt has a standard seed potato tariff of only 2 per cent, Morocco levies 40 per cent outside any trade agreements, which would make UK seed exports there virtually impossible. If the UK loses access to tariff-free fresh imports from Israel, certain buyers looking to specifically source new season potatoes in the spring may find costs rising. It is unlikely these would simply be replaced with domestic supply.
Potatoes sector at a glanceThree-quarters of seed potato exports are to non-EU countries and EU agreements give tariff-free access to important markets
UK-produced processed frozen products are currently uncompetitive on price with EU imports but the situation could change if tariffs are imposed
Crisps are a growth exports market but currently trade is predominantly with EU countries and could be affected if tariff-free access is lost
Relationship with Israel will determine new season availability of fresh potatoes
Any additional phytosanitary controls imposed on fresh and seed potatoes could impact exporters’ profitability

38
Current situation – importsImports of fruits to the UK in 2015 were valued at £3.1 billion. The quantity of fruit imported was 3.7 million tonnes. Around 40 per cent of these imports came from elsewhere in the EU, with the remainder sourced from other countries. The suppliers of fruit to the UK are diverse, reflecting the different climate requirements of each crop. The largest part of these imports was made up of fruits which are not generally grown in the UK, such as bananas (which made up nearly a third of the total value), citrus fruit and melons. However, the UK also imports significant quantities of most of the fruits which are grown domestically. To some extent this is required to ensure year-round supply of fruit which can only be produced seasonally in the UK. Imports make up the majority of supplies for apples (60 per cent imported), pears (85 per cent) and plums (80 per cent). They make up a lower, but
still significant, proportion of supply for soft fruits.The value of UK imports of fresh vegetables (excluding potatoes) was £2.1 billion in 2015, with a further £196 million worth of dried vegetable imports. The quantity of vegetables imported was just under 2.5 million tonnes, with 2.3 million of this fresh produce. More than 80 per cent of vegetable imports came from the EU, with Spain, the Netherlands and, for some crops, Ireland the major suppliers.A large proportion of imports are salad crops, such as tomatoes, sweet peppers, lettuce and cucumbers. Most of these are also grown in the UK, predominantly in protected environments. However, for most of these crops, the clear majority of produce consumed in the UK is imported.Among field crops, the most significant imports to the UK are cauliflowers/broccoli and onions. Around 60 per cent of supplies of cauliflowers/broccoli are imported and about half of the latter. For other field crops, such as cabbages and other brassicas, carrots and other root crops, imports form a much smaller proportion of supply.The figures provided above exclude processed fruit and vegetable products, including fruit juices and preserves. These amounted to over two million tonnes worth of imports in 2015, with a value of close to £2 billion.
Current situation – exports Most of the UK horticulture sector is focused on the domestic market, so its exports are minimal. Total UK exports of fruit and vegetables were valued at just £199 million in 2015, less than four per cent of the value of imports. This figure includes re-exports, so the importance of exports to the UK sector will be lower still. Exports of ornamentals totalled £56 million, also a fraction of the value of imports.
The figures above exclude dried vegetables – exports of dried legumes (mainly to Egypt) and other vegetables add a further £77 million. The UK also exports processed products, such as fruit juices, jams and pickles, although these are not necessarily derived from domestic produce.
The only other horticultural crop for which exports form a significant proportion of production are Narcissus bulbs. Exports of these are worth £3–5 million annually and the major market is the US.
Exports of horticultural products, 2015
75%
12%
4%
4%
5%
27%
23%
6%5%
17%
23%
42%
18%
11%
6%
5%
5%14%
35%
13%12%
7%
19%
14%
Imports of fruit, 2015
Spain
South AfricaOther Non-EU
Other EU
Imports of plants and cut flowers, 2015
Other Non-EU
Other EU
Netherlands
Colombia
Germany
Imports of vegetables, 2015
Belgium
Netherlands
Other Non-EU
Kenya
Ireland
Other EU
Spain
Netherlands
Chile
Exports of horticultural products, 2015
Ireland
Other Non-EU
Netherlands
France
Other EU
Egypt
Supplies of fruit and vegetables in the UK
Home production Imports Exports
2010 2011 2012 2013 2014 2015
4,000
3,000
2,000
1,000
0
2010 2011 2012 2013 2014 2015
1,00
0 to
nnes
vegetables fruit
Imports of fruit, 2015
75%
12%
4%
4%
5%
27%
23%
6%5%
17%
23%
42%
18%
11%
6%
5%
5%14%
35%
13%12%
7%
19%
14%
Imports of fruit, 2015
Spain
South AfricaOther Non-EU
Other EU
Imports of plants and cut flowers, 2015
Other Non-EU
Other EU
Netherlands
Colombia
Germany
Imports of vegetables, 2015
Belgium
Netherlands
Other Non-EU
Kenya
Ireland
Other EU
Spain
Netherlands
Chile
Exports of horticultural products, 2015
Ireland
Other Non-EU
Netherlands
France
Other EU
Egypt
Supplies of fruit and vegetables in the UK
Home production Imports Exports
2010 2011 2012 2013 2014 2015
4,000
3,000
2,000
1,000
0
2010 2011 2012 2013 2014 2015
1,00
0 to
nnes
vegetables fruit
Horticulture
Source: HMRC
Source: HMRC

39
In 2015, the UK imported £1.1 billion worth of ornamental horticultural produce. Over 60 per cent of this was made up of cut flowers. Most of the remainder was live plants, cuttings or bulbs. Nearly 90 per cent of ornamental imports come from elsewhere in the EU. Most non-EU imports are of cut flowers, most notably roses, with Colombia and Kenya the two key suppliers. However, imports of cut flowers are dominated by the Netherlands, which accounted for around three-quarters of imports, although this may be somewhat exaggerated by the ‘Rotterdam effect’. The Netherlands is also the dominant supplier of other ornamental products.
Current situation – tariffs and trade barriersImports of horticultural produce into the EU are generally subject to import tariffs. In most cases, these are ad valorem tariffs of below 20 per cent and for some products they vary seasonally. It is clear from the levels of imports which occur that these tariffs are not sufficiently high to prevent imports. However, they will provide a degree of protection for EU growers from the extremes of price competition from other global suppliers. Processed fruit and vegetable products are also subject to import tariffs when entering the EU. These are usually somewhat higher than for the raw produce, which provides some support to the processing industries in the EU.The EU has trade agreements in place with many of the countries supplying fresh horticultural produce to the EU, including the UK. These grant tariff-free access to the countries involved for most products. Countries with such agreements in place include many in Africa, Latin America and the rest of Europe.
OpportunitiesHow trade between the UK and EU develops post-Brexit will depend on whether a trade deal is in place and on what terms. One possibility, if there is no such deal, is that import tariffs will be imposed on trade between the UK and the rest of the EU. As the UK is such a major net importer of horticultural produce, this will have a bigger impact on its imports than on exports. If the UK chooses to impose the same tariffs as the EU currently applies to imports from third countries, it would effectively increase the price of imported produce. This should mean that domestic produce becomes more competitive and could allow UK production of some horticultural crops to expand and displace some imports.The extent to which the UK industry is able to expand production will depend on a wide range of factors. As well as availability of funds for investment, seasonality will also be a factor. Input costs will also be an important consideration in an industry where margins are typically tight. Many inputs to horticultural production are imported. Therefore, the costs involved will depend on the extent of any tariffs imposed on them and on the exchange rate.
Imports of vegetables, 2015
75%
12%
4%
4%
5%
27%
23%
6%5%
17%
23%
42%
18%
11%
6%
5%
5%14%
35%
13%12%
7%
19%
14%
Imports of fruit, 2015
Spain
South AfricaOther Non-EU
Other EU
Imports of plants and cut flowers, 2015
Other Non-EU
Other EU
Netherlands
Colombia
Germany
Imports of vegetables, 2015
Belgium
Netherlands
Other Non-EU
Kenya
Ireland
Other EU
Spain
Netherlands
Chile
Exports of horticultural products, 2015
Ireland
Other Non-EU
Netherlands
France
Other EU
Egypt
Supplies of fruit and vegetables in the UK
Home production Imports Exports
2010 2011 2012 2013 2014 2015
4,000
3,000
2,000
1,000
0
2010 2011 2012 2013 2014 2015
1,00
0 to
nnes
vegetables fruit
Imports of plants and cut flowers, 2015
75%
12%
4%
4%
5%
27%
23%
6%5%
17%
23%
42%
18%
11%
6%
5%
5%14%
35%
13%12%
7%
19%
14%
Imports of fruit, 2015
Spain
South AfricaOther Non-EU
Other EU
Imports of plants and cut flowers, 2015
Other Non-EU
Other EU
Netherlands
Colombia
Germany
Imports of vegetables, 2015
Belgium
Netherlands
Other Non-EU
Kenya
Ireland
Other EU
Spain
Netherlands
Chile
Exports of horticultural products, 2015
Ireland
Other Non-EU
Netherlands
France
Other EU
Egypt
Supplies of fruit and vegetables in the UK
Home production Imports Exports
2010 2011 2012 2013 2014 2015
4,000
3,000
2,000
1,000
0
2010 2011 2012 2013 2014 2015
1,00
0 to
nnes
vegetables fruit
Horticulture
Source: HMRC Source: HMRC

40
UK dairy exports, 2015
75%
12%
4%
4%
5%
27%
23%
6%5%
17%
23%
42%
18%
11%
6%
5%
5%14%
35%
13%12%
7%
19%
14%
Imports of fruit, 2015
Spain
South AfricaOther Non-EU
Other EU
Imports of plants and cut flowers, 2015
Other Non-EU
Other EU
Netherlands
Colombia
Germany
Imports of vegetables, 2015
Belgium
Netherlands
Other Non-EU
Kenya
Ireland
Other EU
Spain
Netherlands
Chile
Exports of horticultural products, 2015
Ireland
Other Non-EU
Netherlands
France
Other EU
Egypt
Supplies of fruit and vegetables in the UK
Home production Imports Exports
2010 2011 2012 2013 2014 2015
4,000
3,000
2,000
1,000
0
2010 2011 2012 2013 2014 2015
1,00
0 to
nnes
vegetables fruit
Supplies of fruit and vegetables in the UK
Threats A number of UK horticultural businesses have made investments in overseas production to supplement their domestic supply. The majority of this investment has been made in southern parts of the EU, although there has also been some investment in Africa. The products involved are predominantly salad crops and fruits. At present, these crops from elsewhere in the EU can be imported into the UK without tariffs. However, this would change if the UK Government decides to impose import tariffs. While these may not be high enough to prevent trade of this kind, it could discourage some such investments in the future. This could limit expansion plans for these businesses, which may have a knock-on effect on their UK operations.Although it is possible that the UK Government may decide to put import tariffs in place in the absence of an EU trade deal, this could mean consumers would have to pay more for fruit and vegetables. This may be politically unacceptable and, therefore, the Government may prefer to reduce or remove tariffs. While this would make little difference to existing trade with the EU, which is already tariff-free, it would also apply to shipments from non-EU countries.In this situation, UK produce may face increased competition from supplies from elsewhere. This may not be too disruptive, given that most imports of products which are competing with UK produce are sourced from the EU or from countries with preferential access to the EU market. However, for some products the UK currently imports from the EU, it may lead to suppliers from elsewhere increasing their sales to the UK. This would be because their produce would be more competitive than previously or because they could get a better price in the UK than elsewhere in the EU. The extent to which this happened would also depend on exchange rates, however, as well as factors such as sanitary and phytosanitary (SPS) controls.
Labour is a key component, accounting for 30–70 per cent of total costs depending on the crop. It has been well documented that the horticulture sector faces particularly challenges around labour. If there is no longer free movement of workers between the UK and the rest of the EU, post-Brexit, availability and cost of labour may be challenging and so the industry may not be in a position to expand production. These issues are discussed in detail in a previous edition of Horizon, available at ahdb.org.ukUnlike most other sectors, the domestic focus of most horticultural production means that there is unlikely to be much scope to open up new markets outside the EU through negotiating preferential trade deals.
Horticulture at a glanceThe UK is hugely reliant on imports to satisfy high consumer demand, as well as out-of-season products and produce that cannot be grown in the UK
Current EU tariffs on horticultural imports offer a degree of market protection but not enough to deter non-EU imports
UK tariffs on imports could make domestic produce more competitive but also raise prices for consumers
Any opportunities to expand production to displace imports may be tempered by labour availability and seasonal nature of production
There is uncertainty around continued collaboration and investment between UK producers and overseas partners
Sources: Defra, HMRC
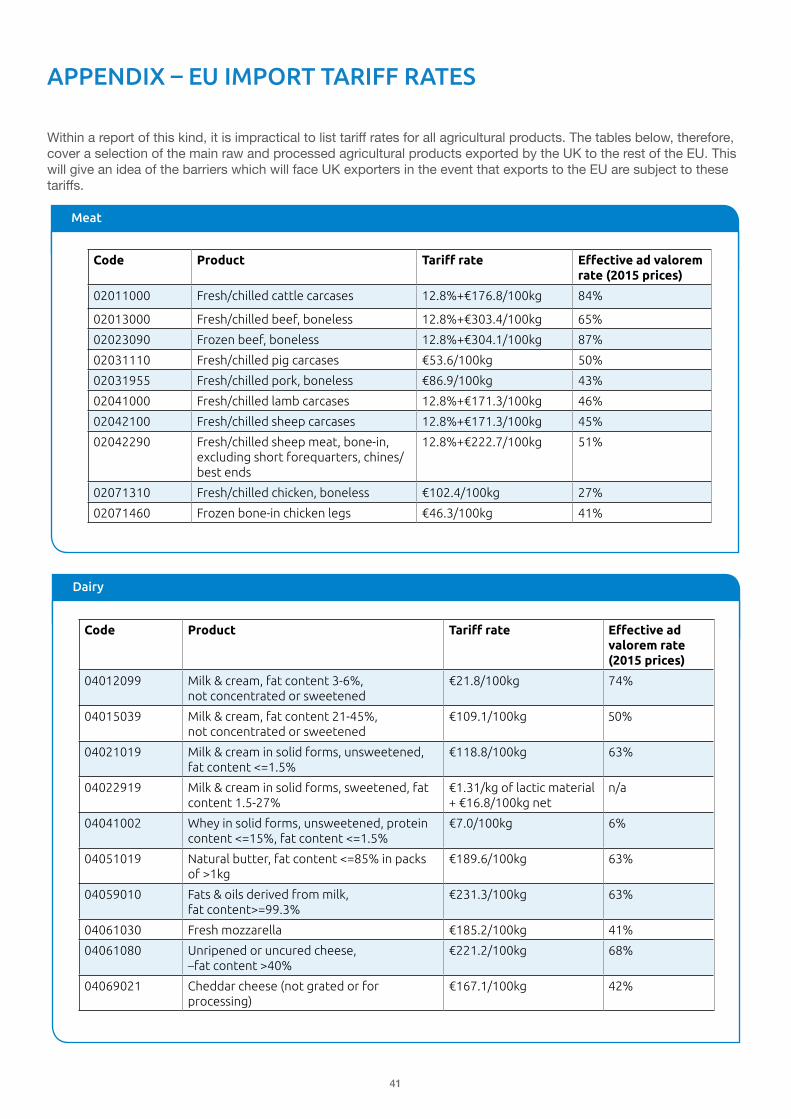
41
APPENDIX – EU IMPORT TARIFF RATES
Within a report of this kind, it is impractical to list tariff rates for all agricultural products. The tables below, therefore, cover a selection of the main raw and processed agricultural products exported by the UK to the rest of the EU. This will give an idea of the barriers which will face UK exporters in the event that exports to the EU are subject to these tariffs.
Meat
Code Product Tariff rate Effective ad valorem rate (2015 prices)
02011000 Fresh/chilled cattle carcases 12.8%+€176.8/100kg 84%
02013000 Fresh/chilled beef, boneless 12.8%+€303.4/100kg 65%
02023090 Frozen beef, boneless 12.8%+€304.1/100kg 87%
02031110 Fresh/chilled pig carcases €53.6/100kg 50%
02031955 Fresh/chilled pork, boneless €86.9/100kg 43%
02041000 Fresh/chilled lamb carcases 12.8%+€171.3/100kg 46%
02042100 Fresh/chilled sheep carcases 12.8%+€171.3/100kg 45%
02042290 Fresh/chilled sheep meat, bone-in, excluding short forequarters, chines/best ends
12.8%+€222.7/100kg 51%
02071310 Fresh/chilled chicken, boneless €102.4/100kg 27%
02071460 Frozen bone-in chicken legs €46.3/100kg 41%
Dairy
Code Product Tariff rate Effective ad valorem rate (2015 prices)
04012099 Milk & cream, fat content 3-6%, not concentrated or sweetened
€21.8/100kg 74%
04015039 Milk & cream, fat content 21-45%, not concentrated or sweetened
€109.1/100kg 50%
04021019 Milk & cream in solid forms, unsweetened, fat content <=1.5%
€118.8/100kg 63%
04022919 Milk & cream in solid forms, sweetened, fat content 1.5-27%
€1.31/kg of lactic material + €16.8/100kg net
n/a
04041002 Whey in solid forms, unsweetened, protein content <=15%, fat content <=1.5%
€7.0/100kg 6%
04051019 Natural butter, fat content <=85% in packs of >1kg
€189.6/100kg 63%
04059010 Fats & oils derived from milk, fat content>=99.3%
€231.3/100kg 63%
04061030 Fresh mozzarella €185.2/100kg 41%
04061080 Unripened or uncured cheese, –fat content >40%
€221.2/100kg 68%
04069021 Cheddar cheese (not grated or for processing)
€167.1/100kg 42%
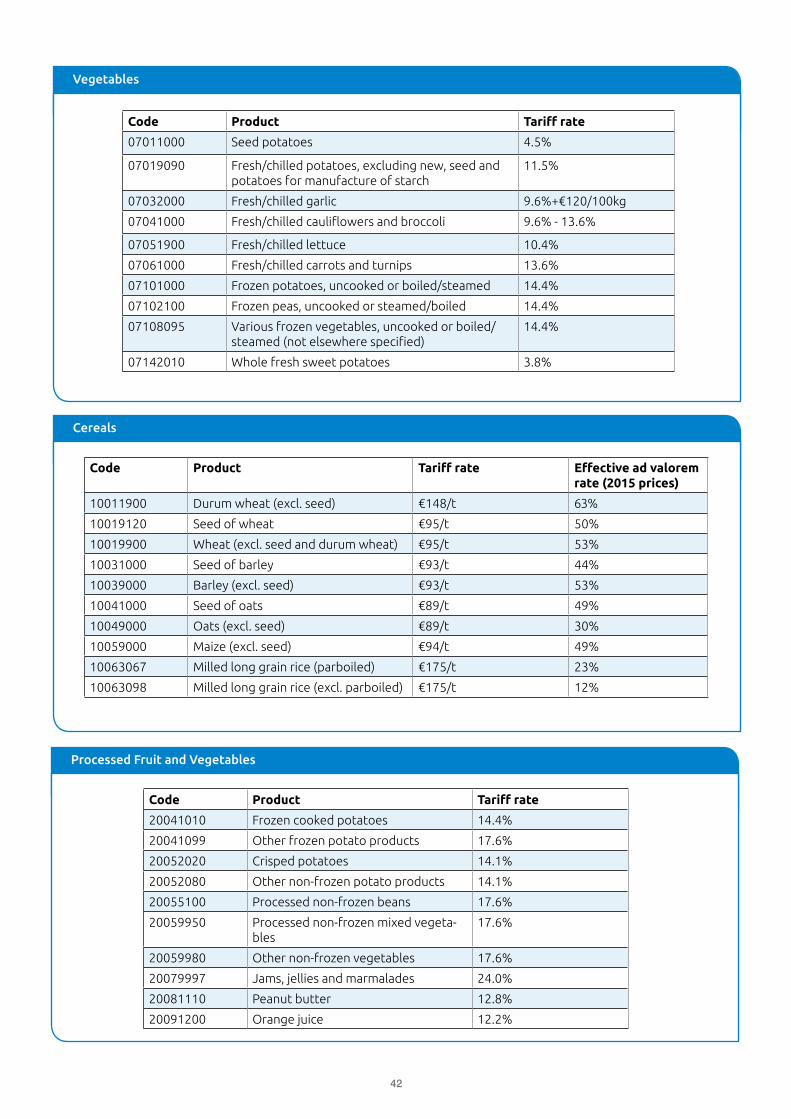
42
Vegetables
Code Product Tariff rate
07011000 Seed potatoes 4.5%
07019090 Fresh/chilled potatoes, excluding new, seed and potatoes for manufacture of starch
11.5%
07032000 Fresh/chilled garlic 9.6%+€120/100kg
07041000 Fresh/chilled cauliflowers and broccoli 9.6% - 13.6%
07051900 Fresh/chilled lettuce 10.4%
07061000 Fresh/chilled carrots and turnips 13.6%
07101000 Frozen potatoes, uncooked or boiled/steamed 14.4%
07102100 Frozen peas, uncooked or steamed/boiled 14.4%
07108095 Various frozen vegetables, uncooked or boiled/steamed (not elsewhere specified)
14.4%
07142010 Whole fresh sweet potatoes 3.8%
Cereals
Code Product Tariff rate Effective ad valorem rate (2015 prices)
10011900 Durum wheat (excl. seed) €148/t 63%
10019120 Seed of wheat €95/t 50%
10019900 Wheat (excl. seed and durum wheat) €95/t 53%
10031000 Seed of barley €93/t 44%
10039000 Barley (excl. seed) €93/t 53%
10041000 Seed of oats €89/t 49%
10049000 Oats (excl. seed) €89/t 30%
10059000 Maize (excl. seed) €94/t 49%
10063067 Milled long grain rice (parboiled) €175/t 23%
10063098 Milled long grain rice (excl. parboiled) €175/t 12%
Processed Fruit and Vegetables
Code Product Tariff rate
20041010 Frozen cooked potatoes 14.4%
20041099 Other frozen potato products 17.6%
20052020 Crisped potatoes 14.1%
20052080 Other non-frozen potato products 14.1%
20055100 Processed non-frozen beans 17.6%
20059950 Processed non-frozen mixed vegeta-bles
17.6%
20059980 Other non-frozen vegetables 17.6%
20079997 Jams, jellies and marmalades 24.0%
20081110 Peanut butter 12.8%
20091200 Orange juice 12.2%

43
Authors
Stephen Howarth | Market Specialist ManagerT: 024 7647 8856 E: [email protected]
Sarah Baker | Senior AnalystT: 024 7647 8845 E: [email protected]
Code Product Tariff rate
07011000 Seed potatoes 4.5%
07019090 Fresh/chilled potatoes, excluding new, seed and potatoes for manufacture of starch
11.5%
07032000 Fresh/chilled garlic 9.6%+€120/100kg
07041000 Fresh/chilled cauliflowers and broccoli 9.6% - 13.6%
07051900 Fresh/chilled lettuce 10.4%
07061000 Fresh/chilled carrots and turnips 13.6%
07101000 Frozen potatoes, uncooked or boiled/steamed 14.4%
07102100 Frozen peas, uncooked or steamed/boiled 14.4%
07108095 Various frozen vegetables, uncooked or boiled/steamed (not elsewhere specified)
14.4%
07142010 Whole fresh sweet potatoes 3.8%
Processed Meat
Code Product Tariff rate Effective ad valorem rate (2015 prices)
16010099 Cooked sausages (excluding liver sausages)
€100.5/100kg 36%
16023211 Uncooked processed chicken (>=57% meat)
€276.5/100kg 66%
16023219 Cooked chicken (>=57% meat) €102.4/100kg 27%
16023230 Processed chicken (25-57% meat) €276.5/100kg 88%
16023290 Processed chicken (<25% meat) €276.5/100kg 88%
16023929 Other cooked poultry meat (>=57% meat)
€276.5/100kg 51%
16024110 Processed hams €156.8/100kg 27%
16024950 Processed pig meat (<40% meat) €54.3/100kg 26%
16025010 Uncooked processed beef €303.4/100kg 71%
16025095 Cooked beef (excluding corned beef) 16.6% n/a
Code Product Tariff rate
20041010 Frozen cooked potatoes 14.4%
20041099 Other frozen potato products 17.6%
20052020 Crisped potatoes 14.1%
20052080 Other non-frozen potato products 14.1%
20055100 Processed non-frozen beans 17.6%
20059950 Processed non-frozen mixed vegeta-bles
17.6%
20059980 Other non-frozen vegetables 17.6%
20079997 Jams, jellies and marmalades 24.0%
20081110 Peanut butter 12.8%
20091200 Orange juice 12.2%
With thanks to Vikki Campbell, Luke Crossman, Chris Gooderham, Mark Kozloswki, Arthur Marshall, Isobel Robinson, David Swales and Jack Watts

44
While the Agriculture and Horticulture Development Board seeks to ensure that the information contained within this document is accurate at the time of printing, no warranty is given in respect thereof and, to the maximum extent permitted by law, the Agriculture and Horticulture Development Board accepts no liability for loss, damage or injury howsoever caused (including that caused by negligence) or suffered directly or indirectly in relation to information and opinions contained in or omitted from this document.
Reference herein to trade names and proprietary products without stating that they are protected does not imply that they may be regarded as unprotected and thus free for general use. No endorsement of named products is intended, nor is any criticism implied of other alternative, but unnamed products.
Agriculture and Horticulture Development BoardStoneleigh ParkWarwickshireCV8 2TL
© Agriculture and Horticulture Development Board 2016All rights reserved