Embed Size (px)
Citation preview
Hong Kong is a beautiful city
Sunday 1 August 2004Photo: Edward Stokes; Hong Kong Conservation Photography Foundation
However, sometimes less so…
Tuesday 4 January 2005Photo: Edward Stokes; Hong Kong Conservation Photography Foundation
AIR POLLUTION IN HONG KONG and the PEARL RIVER DELTA
AJ Hedley1, SM McGhee1, W Barron2, PYK Chau1, J Chau1, TQ Thach1, TW Wong3, C Loh4, CM Wong1
1 University of Hong Kong 2 University of Science and Technology 3 Chinese University of Hong Kong
4 Civic Exchange
Department of Community Medicine, School of Public Health, University of Hong Kong
Department of Community Medicine, School of Public Health, University of Hong Kong
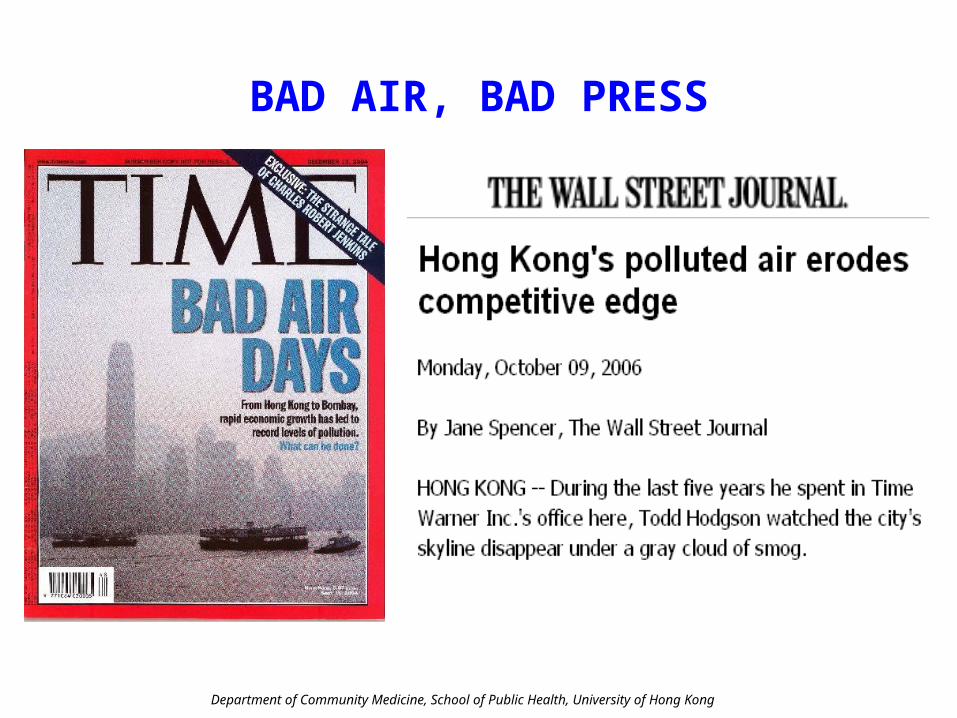
BAD AIR, BAD PRESS
Department of Community Medicine, School of Public Health, University of Hong Kong
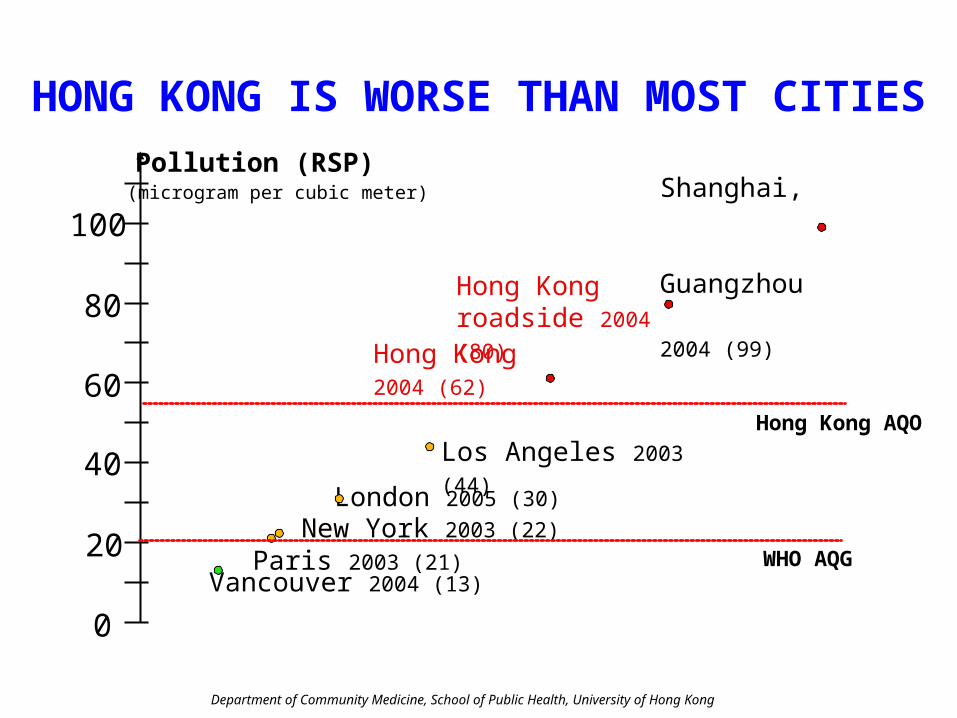
(microgram per cubic meter)
Pollution (RSP)
0
20
40
60
80
100
Vancouver 2004 (13)
Shanghai, Guangzhou
2004 (99)
London 2005 (30)
Paris 2003 (21) New York 2003 (22)
Los Angeles 2003 (44)
Hong Kong 2004 (62)
Hong Kong AQO
WHO AQG
Hong Kong roadside 2004 (80)
HONG KONG IS WORSE THAN MOST CITIES
Department of Community Medicine, School of Public Health, University of Hong Kong
02
04
06
08
01
00
Jan01 Jan02 Jan03 Jan04 Jan05
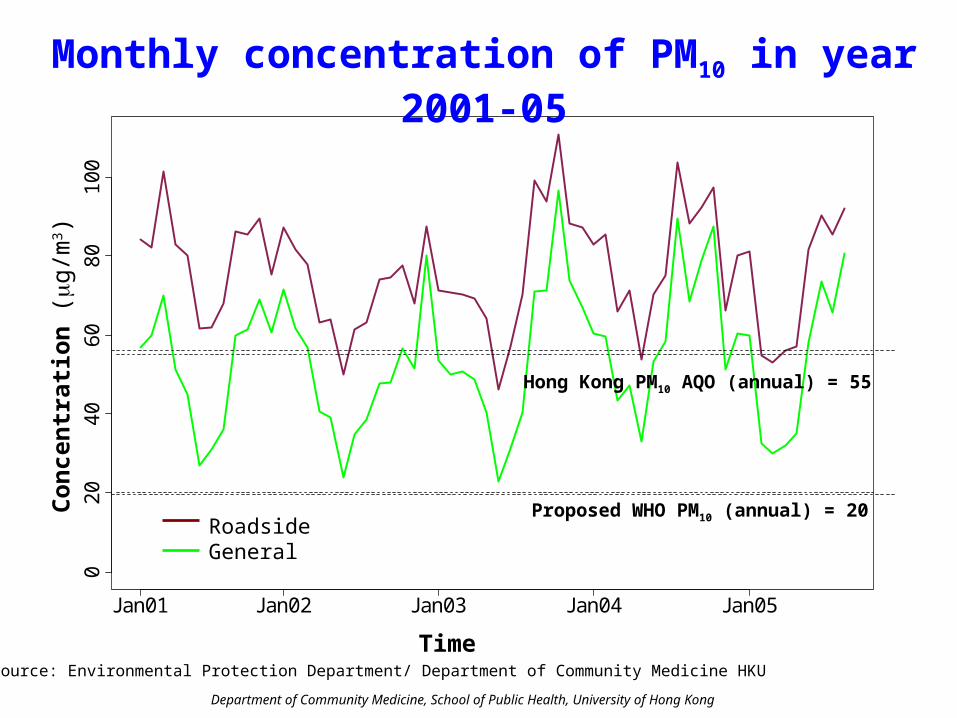
Monthly concentration of PM10 in year 2001-05
Time
Co
nce
ntr
atio
n (g
/m3 )
RoadsideGeneral
Source: Environmental Protection Department/ Department of Community Medicine HKU
Proposed WHO PM10 (annual) = 20
Hong Kong PM10 AQO (annual) = 55
Department of Community Medicine, School of Public Health, University of Hong Kong
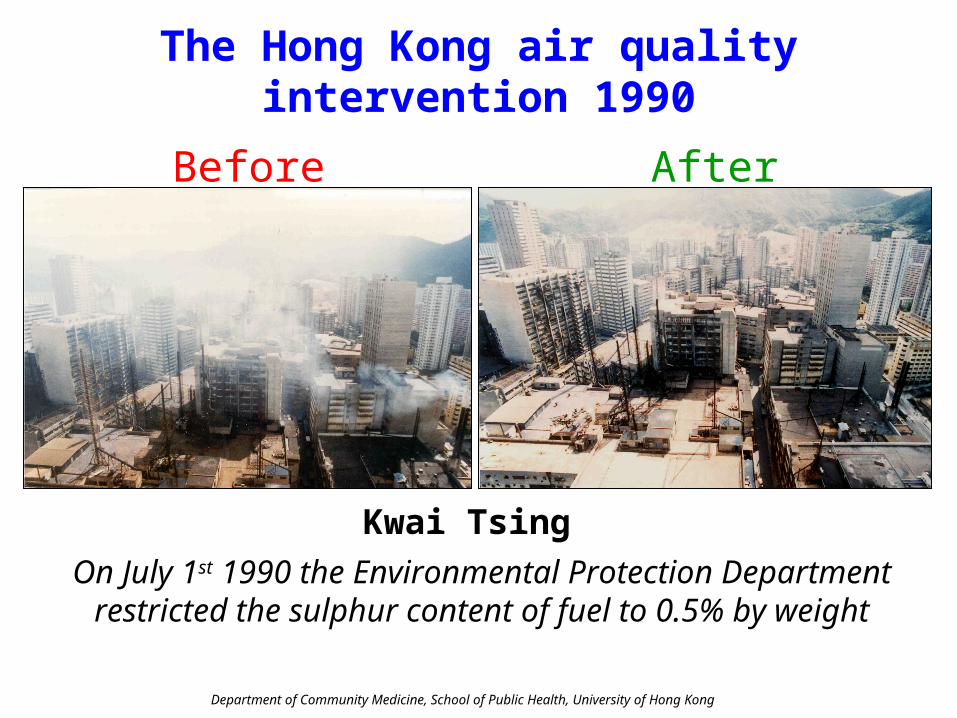
Before After
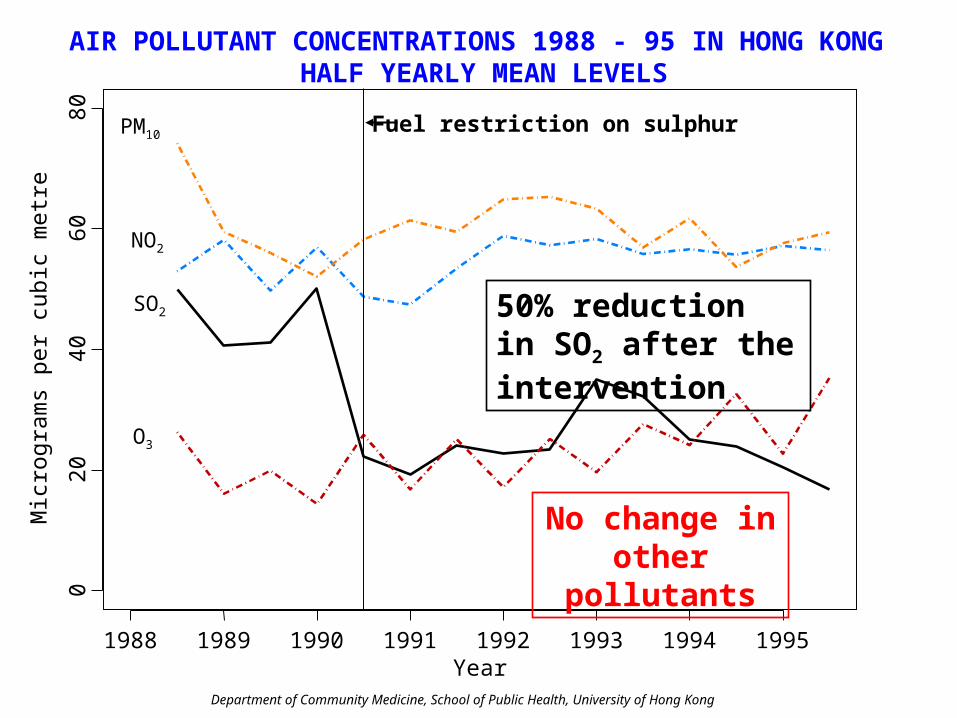
On July 1st 1990 the Environmental Protection Department restricted the sulphur content of fuel to 0.5% by weight
The Hong Kong air quality intervention 1990
Kwai Tsing
Department of Community Medicine, School of Public Health, University of Hong Kong
AIR POLLUTANT CONCENTRATIONS 1988 - 95 IN HONG KONG HALF YEARLY MEAN LEVELS
1988 1989 1990 1991 1992 1993 1994 1995
020
4060
80
NO2
SO2
O3
PM10
Mic
rogr
am
s pe
r cu
bic
met
re
Year
Fuel restriction on sulphur
50% reduction in SO2 after the intervention
No change in other pollutants
Department of Community Medicine, School of Public Health, University of Hong Kong
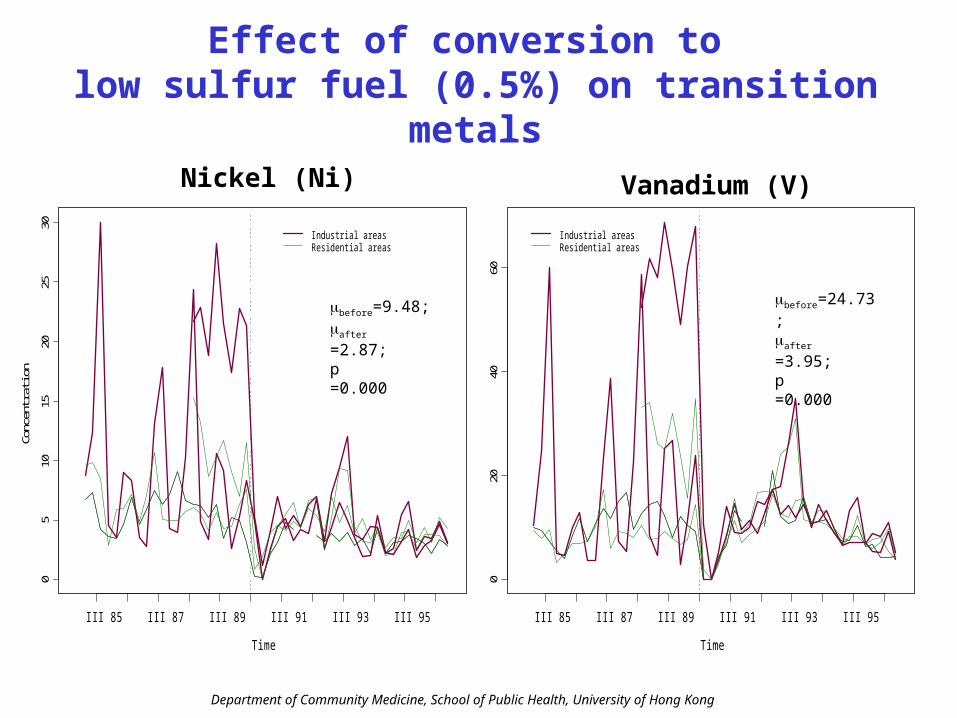
Effect of conversion to low sulfur fuel (0.5%) on transition metals
Time
Conc
entra
tion
05
1015
2025
30
III 85 III 87 III 89 III 91 III 93 III 95
Industrial areasResidential areas
Nickel (Ni)
Time
Conc
entra
tion
020
4060
III 85 III 87 III 89 III 91 III 93 III 95
Industrial areasResidential areas
Vanadium (V)
before=9.48;after =2.87;p =0.000
before=24.73;after =3.95;p =0.000
Department of Community Medicine, School of Public Health, University of Hong Kong
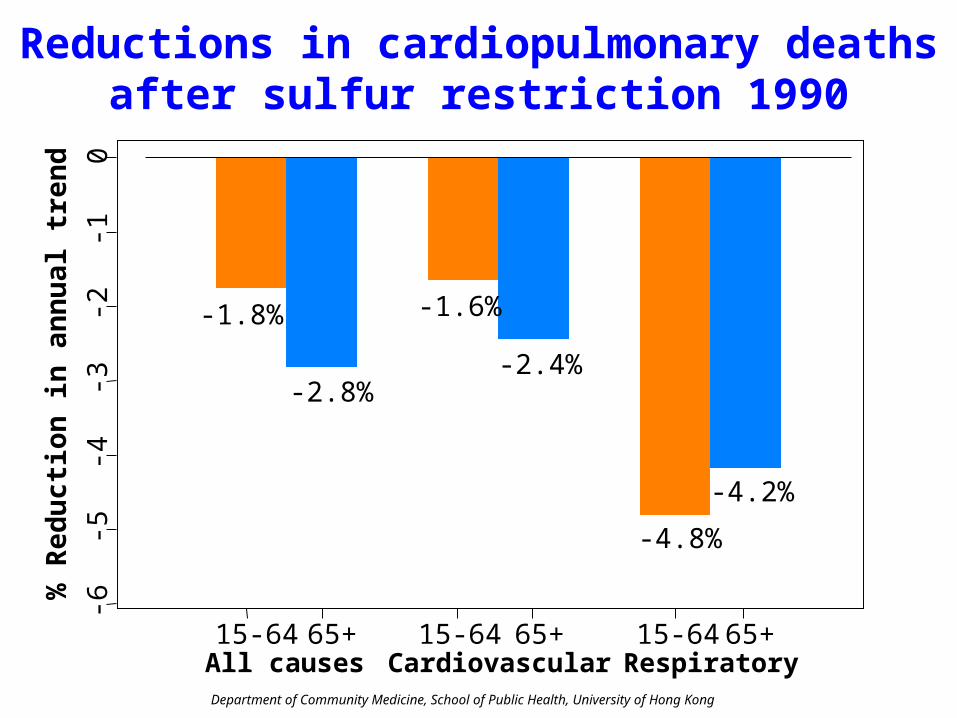
Reductions in cardiopulmonary deathsafter sulfur restriction 1990
All causes Cardiovascular Respiratory
% R
edu
ctio
n i
n a
nn
ual
tre
nd
-6-5
-4-3
-2-1
0
15-64 65+ 15-64 65+ 15-64 65+
-1.8%
-2.8%
-1.6%
-2.4%
-4.8%
-4.2%
Department of Community Medicine, School of Public Health, University of Hong Kong
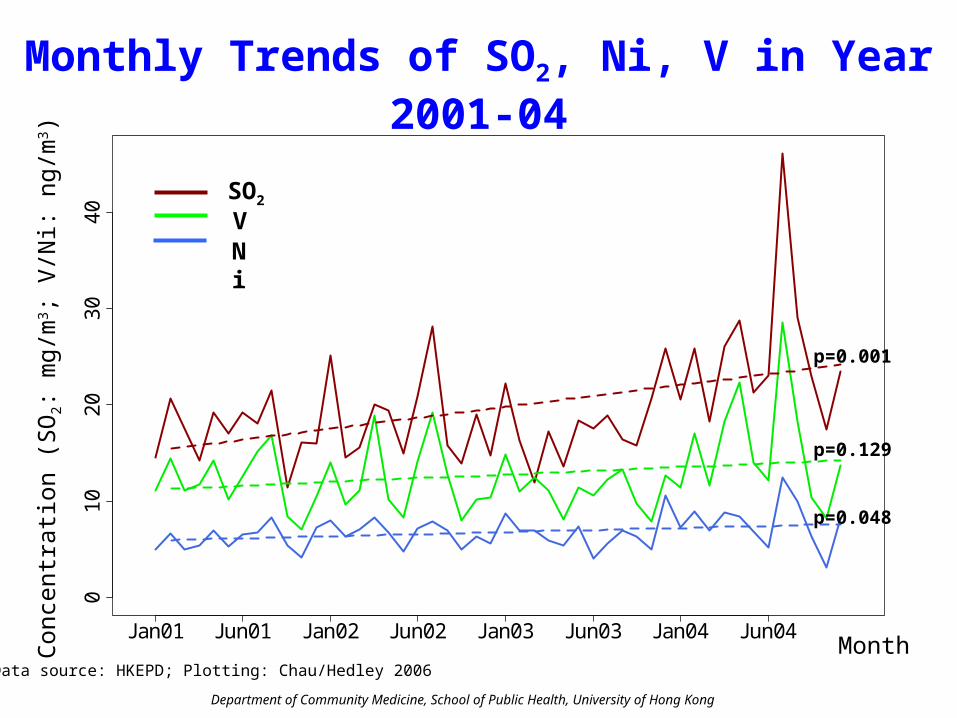
Monthly Trends of SO2, Ni, V in Year 2001-040
10
20
30
40
Jan01 Jun01 Jan02 Jun02 Jan03 Jun03 Jan04 Jun04
Con
cent
ratio
n (S
O2:
mg/
m3 ;
V/N
i: ng
/m3 )
MonthData source: HKEPD; Plotting: Chau/Hedley 2006
p=0.001
p=0.129
p=0.048
SO2
NiV
Department of Community Medicine, School of Public Health, University of Hong Kong
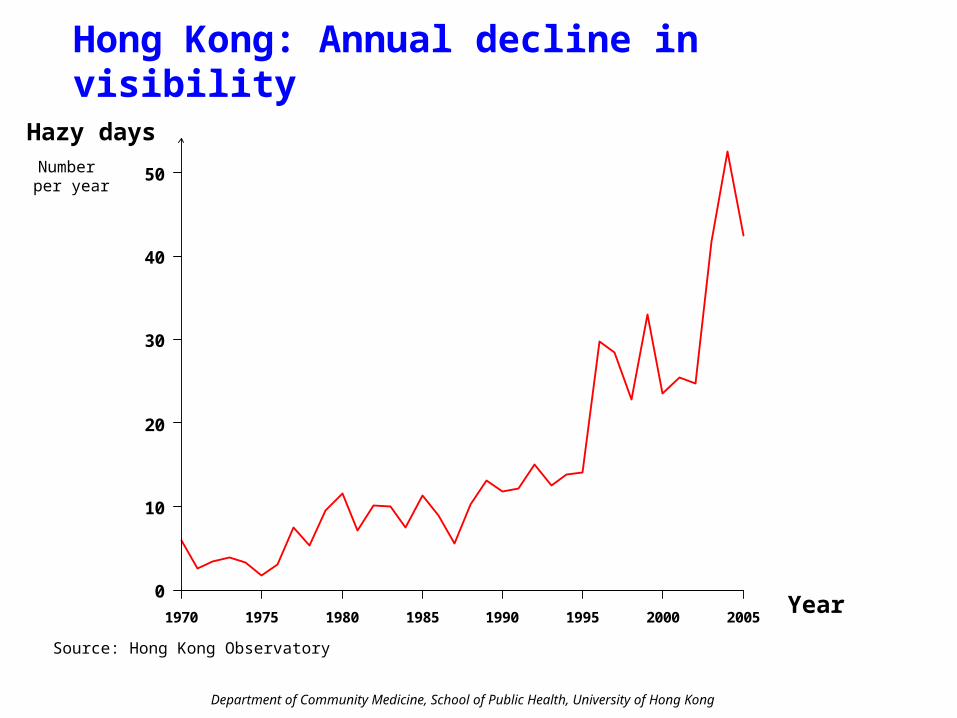
1970 1975 1980 1985 1990 1995 2000 2005
0
10
20
30
40
50
Hazy daysNumber per year
Year
Source: Hong Kong Observatory
Hong Kong: Annual decline in visibility
Department of Community Medicine, School of Public Health, University of Hong Kong
An analysis directed to GovernmentLegislators, media and public
Understanding the connection between visibility, air pollution and health costs
in pursuit of accountability, environmental justice and health protection

Department of Community Medicine, School of Public Health, University of Hong Kong
Visibility and pollutants in Hong Kong
Tsim Sha Tsui to Victoria Harbour Average pollutant levels across Hong Kong
Sunday 1 August 2004
Tuesday 4 Jan 2005
MIC
RO
GR
AM
PE
R C
UB
IC M
ET
ER
Source of data: Environmental Protection Department
Department of Community Medicine, School of Public Health, University of Hong Kong
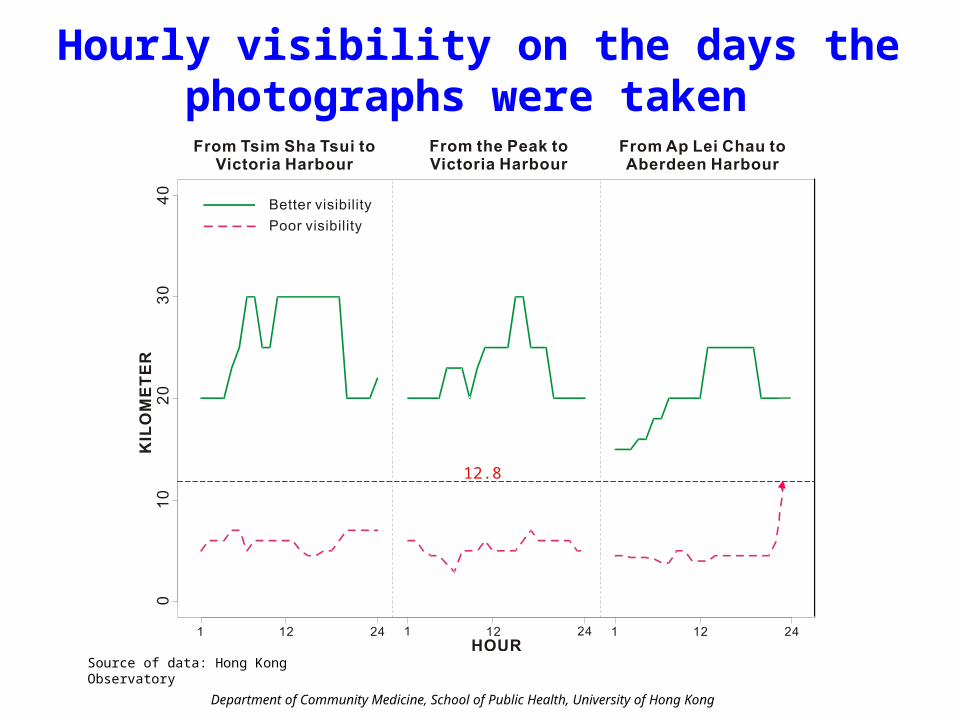
Hourly visibility on the days the photographs were taken
Source of data: Hong Kong Observatory
12.8
Department of Community Medicine, School of Public Health, University of Hong Kong
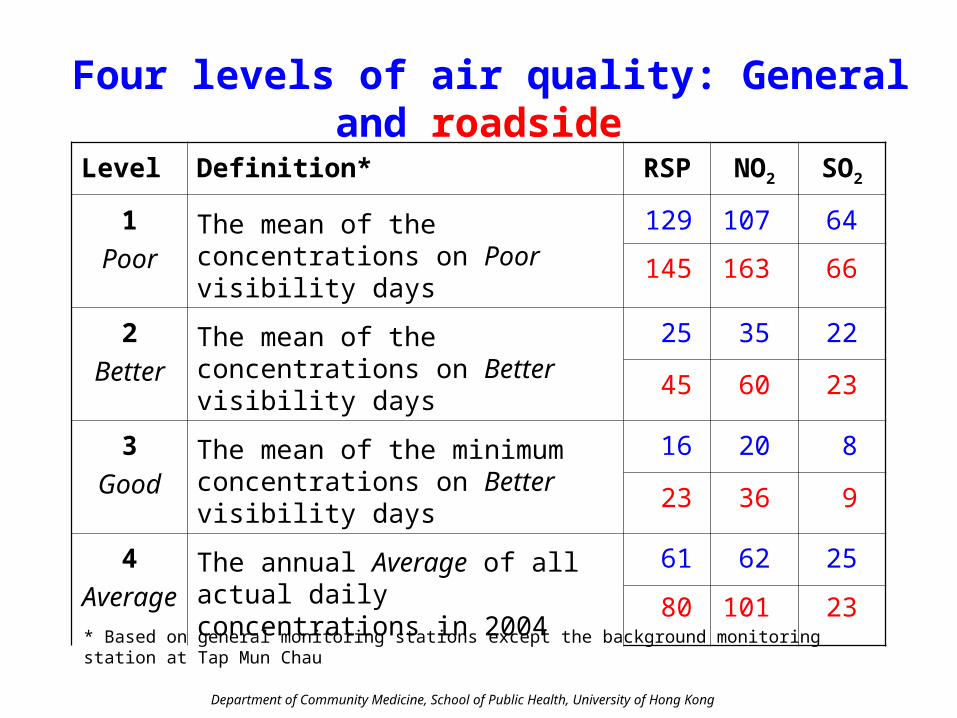
Four levels of air quality: General and roadside
* Based on general monitoring stations except the background monitoring station at Tap Mun Chau
Level Definition* RSP NO2 SO2
1Poor
The mean of the concentrations on Poor visibility days
129 107 64
145 163 66
2Better
The mean of the concentrations on Better visibility days
25 35 22
45 60 23
3Good
The mean of the minimum concentrations on Better visibility days
16 20 8
23 36 9
4Average
The annual Average of all actual daily concentrations in 2004
61 62 25
80 101 23
Department of Community Medicine, School of Public Health, University of Hong Kong
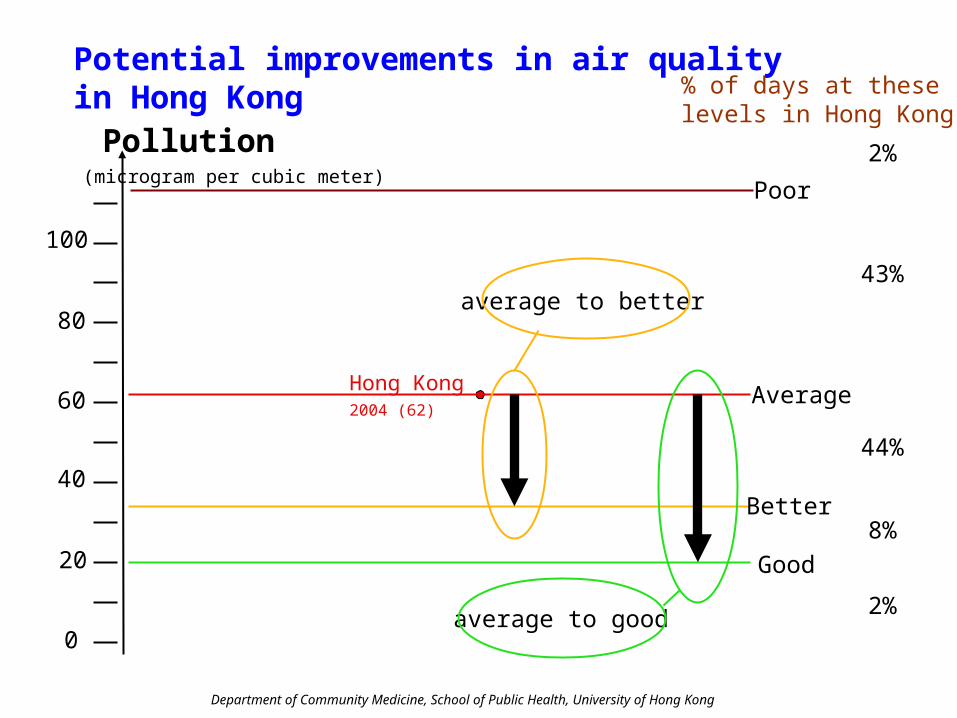
Potential improvements in air quality in Hong Kong
0
20
40
60
80
100
(microgram per cubic meter)
Pollution
Hong Kong2004 (62)
Good
Better
Average
average to better
average to good
Poor
% of days at these levels in Hong Kong
2%
8%
44%
43%
2%
Department of Community Medicine, School of Public Health, University of Hong Kong
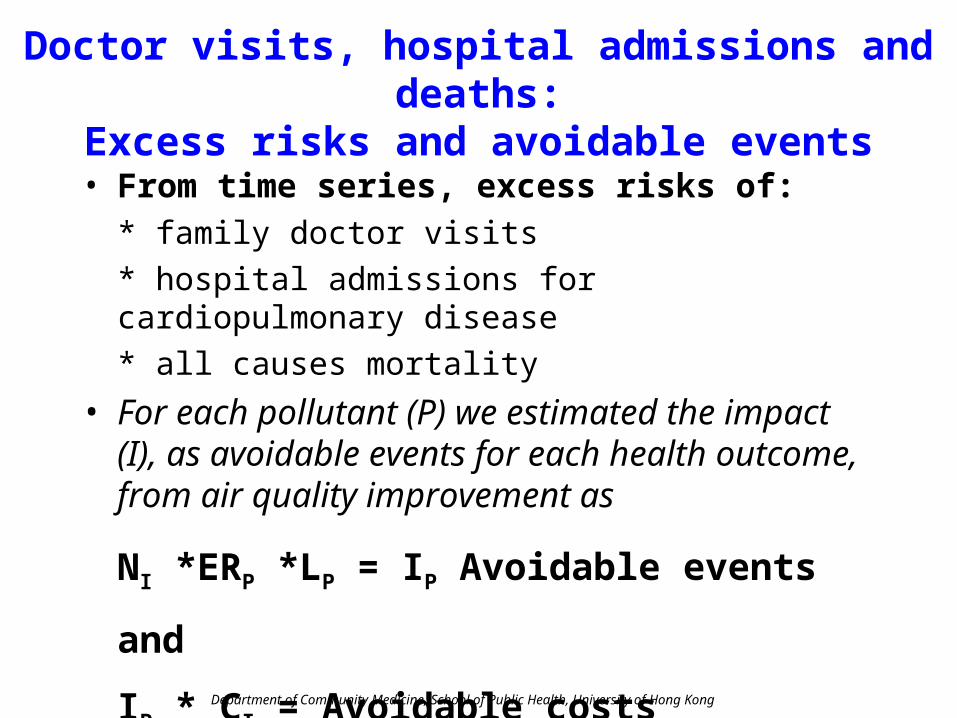
Doctor visits, hospital admissions and deaths:Excess risks and avoidable events
• From time series, excess risks of:
* family doctor visits
* hospital admissions for cardiopulmonary disease
* all causes mortality
• For each pollutant (P) we estimated the impact (I), as avoidable events for each health outcome, from air quality improvement as
NI *ERP *LP = IP Avoidable events
and
IP * CI = Avoidable costs
Department of Community Medicine, School of Public Health, University of Hong Kong
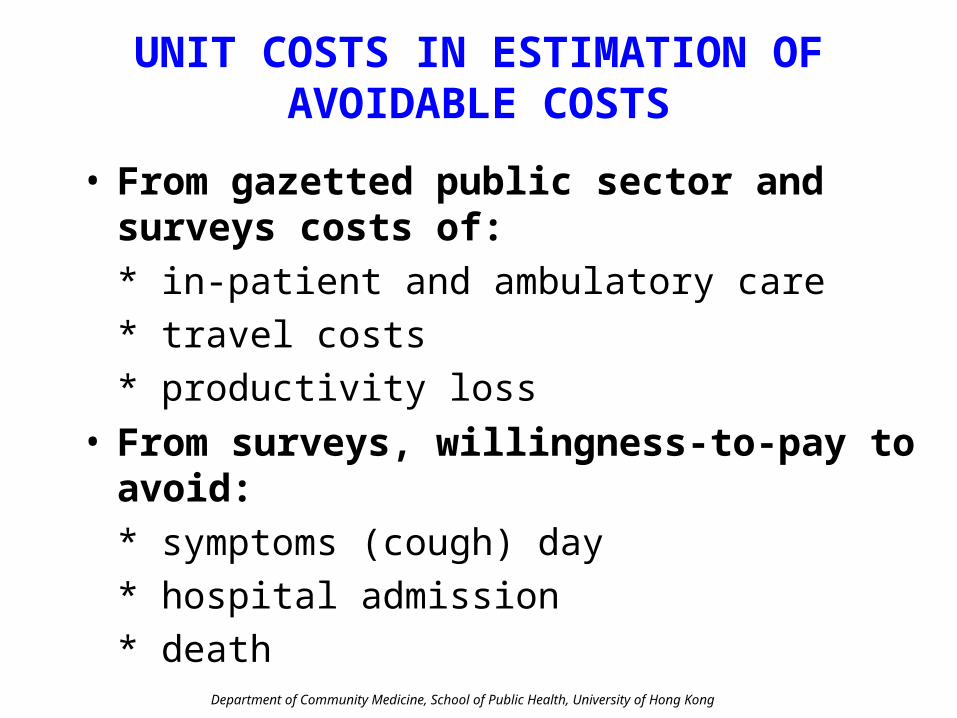
UNIT COSTS IN ESTIMATION OF AVOIDABLE COSTS
• From gazetted public sector and surveys costs of:
* in-patient and ambulatory care
* travel costs
* productivity loss
• From surveys, willingness-to-pay to avoid:
* symptoms (cough) day
* hospital admission
* death
Department of Community Medicine, School of Public Health, University of Hong Kong
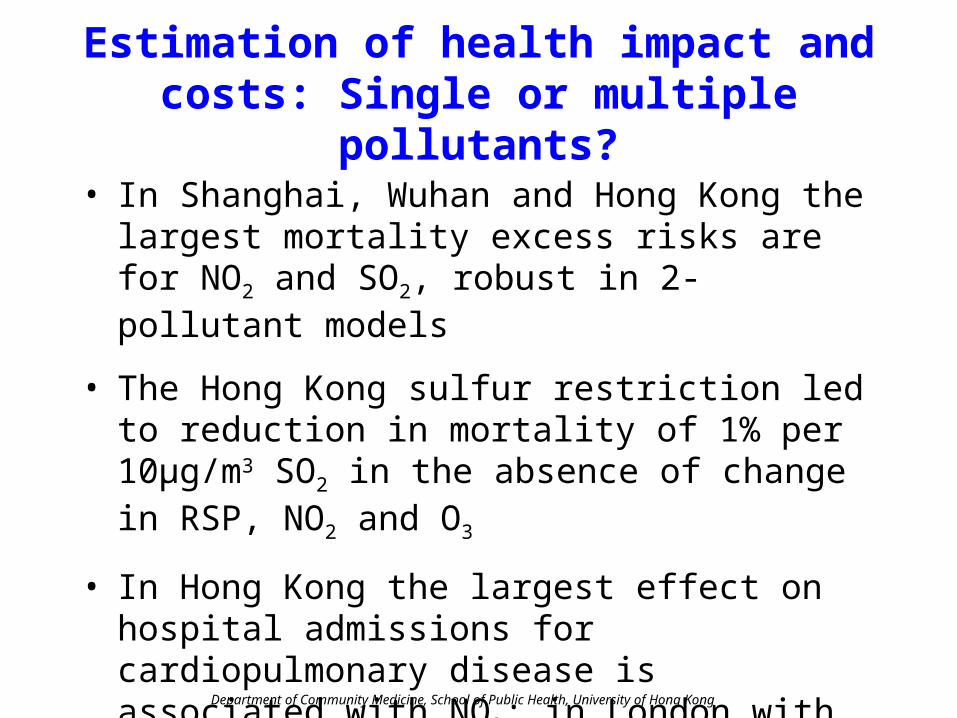
Estimation of health impact and costs: Single or multiple pollutants?
• In Shanghai, Wuhan and Hong Kong the largest mortality excess risks are for NO2 and SO2, robust in 2-pollutant models
• The Hong Kong sulfur restriction led to reduction in mortality of 1% per 10µg/m3 SO2 in the absence of change in RSP, NO2 and O3
• In Hong Kong the largest effect on hospital admissions for cardiopulmonary disease is associated with NO2; in London with RSP

Department of Community Medicine, School of Public Health, University of Hong Kong
SO2
NO2RSP
(84%)
(41%)
Correlation between pollutants
Correlation between NO2 and RSP
Partial correlation between NO2 and SO2 adjusted by RSP
Partial correlation between RSP and SO2 adjusted by NO2
(1-[0.768]2) = 0.41 NO2
(1-[0.067]2 – [0.39]2) = 0.84 SO2
Department of Community Medicine, School of Public Health, University of Hong Kong
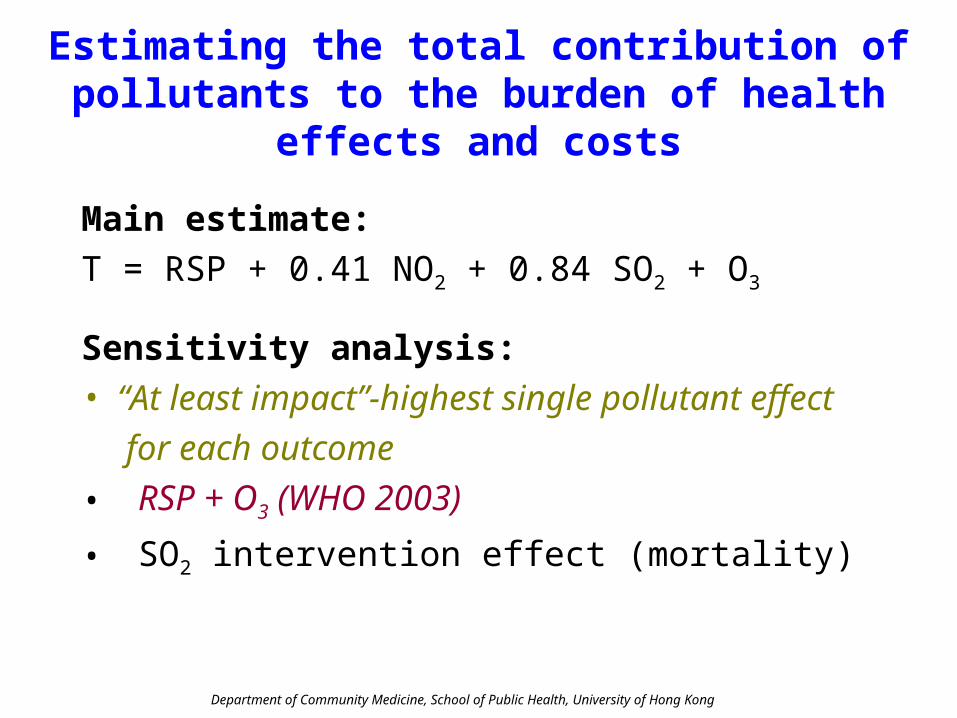
Estimating the total contribution of pollutants to the burden of health effects and costs
Main estimate:
T = RSP + 0.41 NO2 + 0.84 SO2 + O3
Sensitivity analysis:• “At least impact”-highest single pollutant effect
for each outcome
• RSP + O3 (WHO 2003)
• SO2 intervention effect (mortality)
Department of Community Medicine, School of Public Health, University of Hong Kong
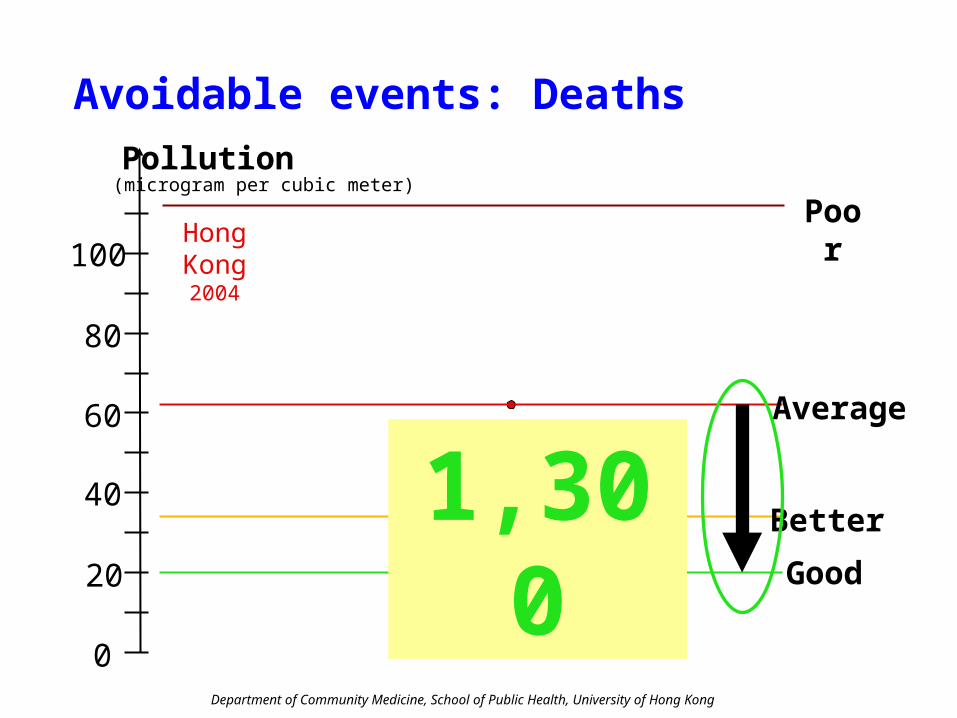
Poor
Avoidable events: Deaths
0
20
40
60
80
100
(microgram per cubic meter)Pollution
Hong Kong2004
Good
Better
Average
1,300
Department of Community Medicine, School of Public Health, University of Hong Kong
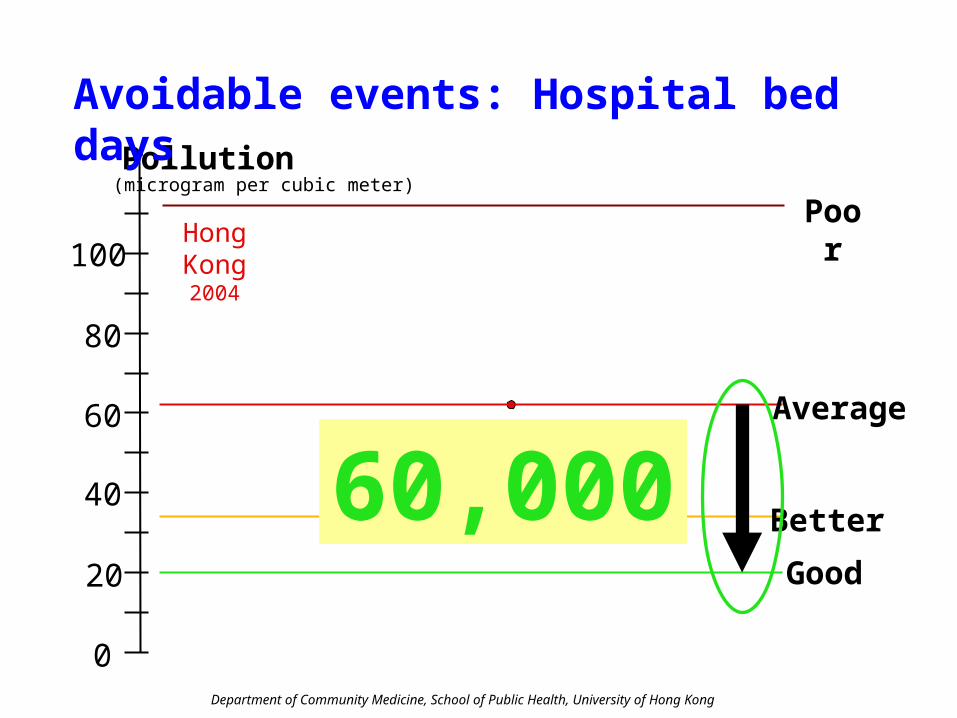
Poor
0
20
40
60
80
100
(microgram per cubic meter)Pollution
Hong Kong2004
Good
Better
Average
60,000
Avoidable events: Hospital bed days

Department of Community Medicine, School of Public Health, University of Hong Kong
Poor
0
20
40
60
80
100
(microgram per cubic meter)Pollution
Hong Kong2004
Good
Better
Average
6,700,000
Avoidable events: Doctor visits
Department of Community Medicine, School of Public Health, University of Hong Kong
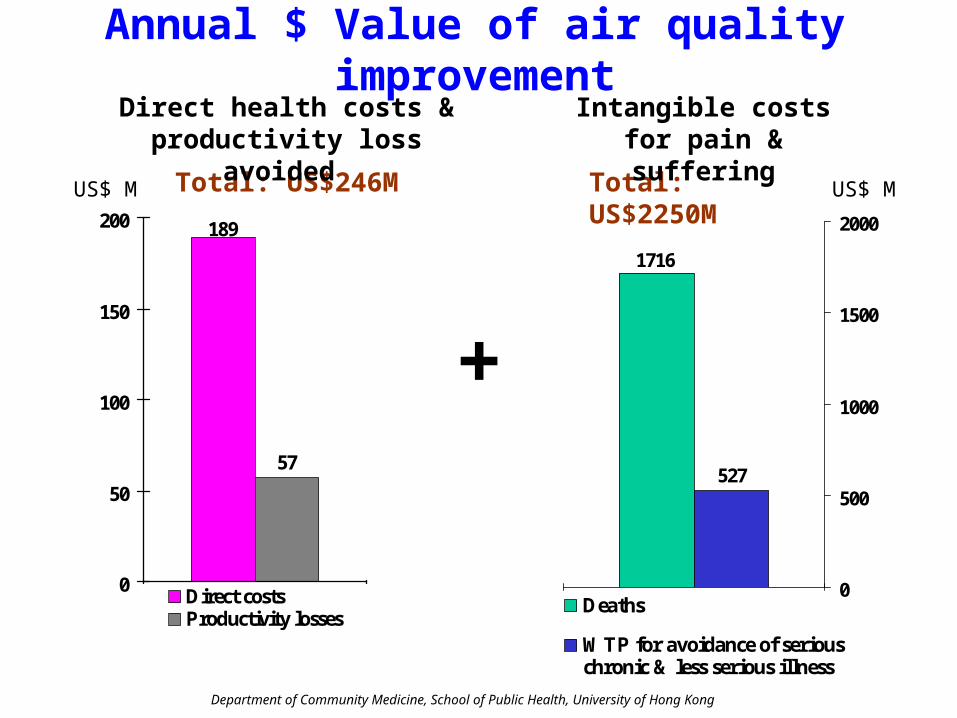
57
189
0
50
100
150
200
Direct costsProductivity losses
Annual $ Value of air quality improvement
US$ M Total: US$2250MTotal: US$246M
Direct health costs & productivity loss avoided
Intangible costs for pain & suffering
+527
1716
0
500
1000
1500
2000
Deaths
WTP for avoidance of seriouschronic & less serious illness
US$ M

Department of Community Medicine, School of Public Health, University of Hong Kong
Results of sensitivity analysis on annual avoidable mortality and costs if pollution levels reduce from Average to Good levels
Sensitivity analysisNo. of
avoidable deaths
Direct cost
US$ M
Productivity loss
US$ M
Intangible cost
US$ M
General stations 1,335 189 57 2,250
Single pollutant with the largest effect* for each outcome
860 103 35 1442
RSP + O3 348 136 23 926
SO2 only 600 - - -
Roadside pollutant levels 1,505 198 63 2,435
* Mortality NO2; Admissions NO2; Family doctor visits RSP
Department of Community Medicine, School of Public Health, University of Hong Kong
THE HKSAR GOVERNMENT RESPONSE
• “The costs are indirect”
• “Other cities have worse levels of pollution”
• “More evidence is needed on health effects”
• People need to understand that “clearer skies may cost consumers more”

Department of Community Medicine, School of Public Health, University of Hong Kong
Department of Community Medicine, School of Public Health, University of Hong Kong
02
04
06
08
01
00
1990 1992 1994 1996 1998 2000 2002 2004 2006 2008 2010 2012 2014 2016 2018 2020 2022 2024 2026 2028 2030
Year
mic
rog
ram
s p
er
cub
ic m
ete
r
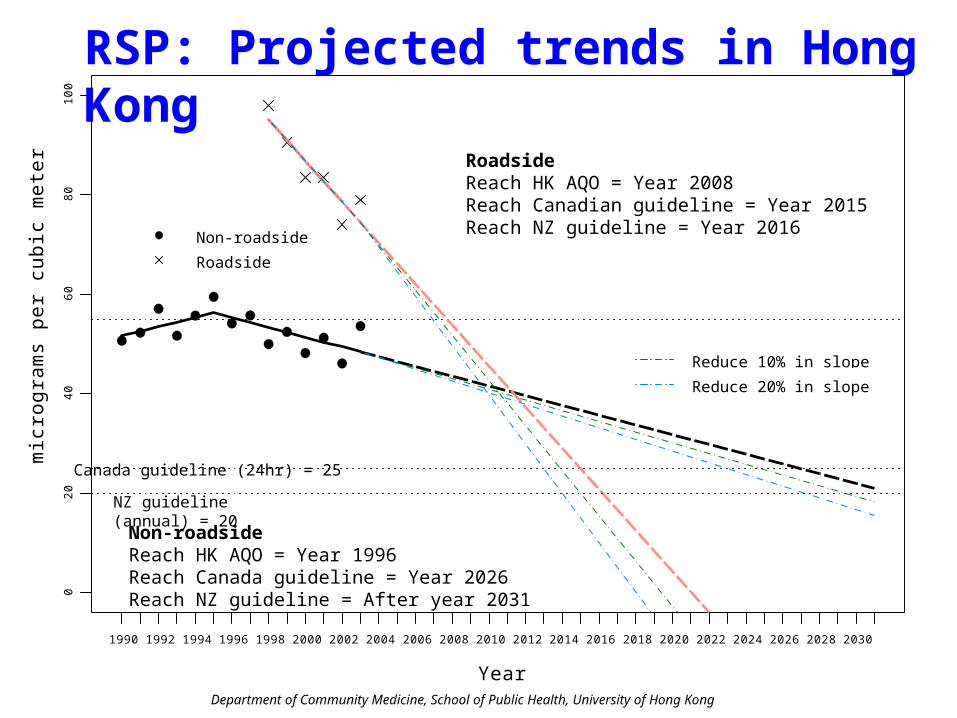
Non-roadside
Roadside
Reduce 10% in slope
Reduce 20% in slope
Canada guideline (24hr) = 25
NZ guideline (annual) = 20
Non-roadsideReach HK AQO = Year 1996Reach Canada guideline = Year 2026Reach NZ guideline = After year 2031
RoadsideReach HK AQO = Year 2008Reach Canadian guideline = Year 2015Reach NZ guideline = Year 2016
RSP: Projected trends in Hong Kong

Department of Community Medicine, School of Public Health, University of Hong Kong
THE NEED for EFFECTIVE MULTI-SECTORAL STRATEGIES
• Local and regional sources• Near term technical solutions
Mid term technical prioritiesLong term structural solutions
* Cleaner fuels * Urban design* Euro IV & V * Manufacturing* Flue gas sulpurization * Power sector* Rail rather than roads * Transport
Department of Community Medicine, School of Public Health, University of Hong Kong