Embed Size (px)
Citation preview

1 | P a g e
WE COUNT Because Everyone Matters
Bridging the Gap Homeless Point-in-Time Count
January 26, 2020
Report Prepared By: Ka Mana O Na Helu May 2020
2 | P a g e
Table of Contents Acknowledgements ....................................................................................................................................... 3
Executive Summary ...................................................................................................................................... 4
Definition of Key Terms ............................................................................................................................... 7
Overview ....................................................................................................................................................... 9
Bridging The Gap (BTG) Summary ........................................................................................................... 11
BTG Homeless Subpopulations .............................................................................................................. 14
Mean Length of Stay (LOS): Active HMIS Sheltered Clients ............................................................... 17
BTG Active Clients by Project Type as of the PIT Count Date ............................................................. 19
Hawaii Island Summary .............................................................................................................................. 20
Hawaii Homeless Subpopulations .......................................................................................................... 23
Hawaii Unsheltered Homelessness ......................................................................................................... 26
Hawaii Additional 2020 Unsheltered Questions ................................................................................. 27
Hawaii Unsheltered Error Estimates ................................................................................................... 29
Hawaii Unsheltered Clients Persisting from 2018-2020 ..................................................................... 29
Kauai Summary .......................................................................................................................................... 30
Kauai Homeless Subpopulations ............................................................................................................ 33
Kauai Unsheltered Homelessness ........................................................................................................... 36
Kauai Unsheltered Error Estimates ..................................................................................................... 37
Kauai Unsheltered Clients Persisting from 2018-2020 ....................................................................... 37
Maui Summary............................................................................................................................................ 38
Maui Homeless Subpopulations ............................................................................................................. 41
Maui Unsheltered Homelessness ............................................................................................................ 44
Maui Unsheltered Error Estimates ...................................................................................................... 45
Maui Unsheltered Clients Persisting from 2018-2020 ........................................................................ 45
Appendix 1: Sheltered Project Listings ...................................................................................................... 46
Appendix 2: LOS for Active PIT Clients in HMIS Sheltered ES, TH Projects .......................................... 47
Appendix 3: Unsheltered Regional Summary ............................................................................................ 48
Appendix 4: Unsheltered Regional Maps ................................................................................................... 49
Appendix 5: HUD HDX Reporting Tables ................................................................................................. 52
3 | P a g e
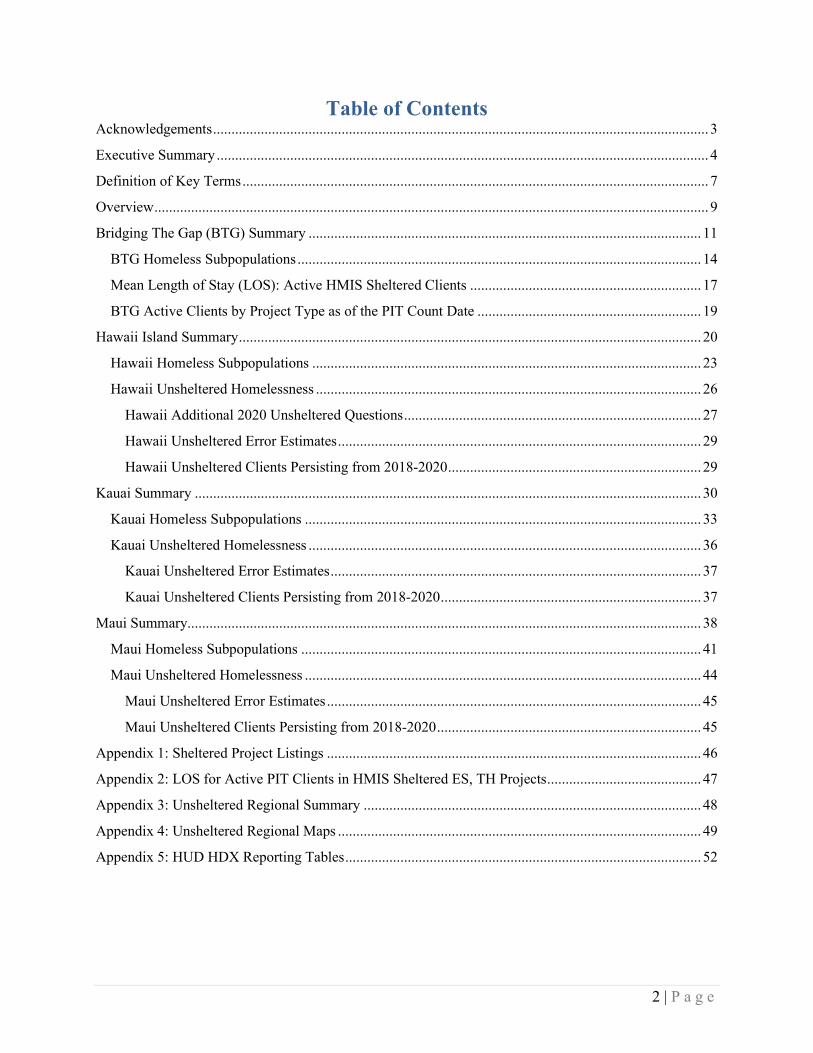
Acknowledgements Bridging the Gap (BTG), the Continuum of Care (CoC) for the neighbor islands, would like to thank the following agencies and individuals who contributed their time and resources to make the 2020 Point-in-Time (PIT) Count successful. Hawaii Maui Kauai Epic Ohana Department of Housing
and Human Concerns Catholic Charities Hawaii
Hawaii Community College
Family Life Center Family Life Center
Hawaii County Public Health Nursing
Feed My Sheep Hale Opio Kauai
Hawaii Island HIV/AIDS Foundation
Ka Hale A Ke Ola Ho`ola Lahui Hawaii
HOPE Services Hawaii Mental Health Kokua Kauai County Dept. of Health
Kona Piano Club Salvation Army Maui Kauai County Housing Agency
Neighborhood Place of Puna
Share Your Mana Kauai Economic Opportunity
Queen Liliuokalani Trust U.S. Dept. of Veterans Affairs
Malama Pono Health Services
Salvation Army Salvation Army UH Manoa School of
Social Work U.S. Dept. of Veterans
Affairs United Healthcare U.S. VETS U.S. Dept. Of Veterans
Affairs Women In Need
West Hawaii Community Health Center
Mahalo to the following individuals, who contributed their time, expertise, and resources to enhance this year’s count with geographic and other data visualizations. A special mahalo to Mr. Dan Sereno, who contributed many hours towards the GIS dashboards and analysis for the neighbor islands this year. Tien Lum, Hybrid International, LLC County of Maui, Dan Sereno, Geographic Services Manager County of Kauai, Garrett Johnson, Senior GIS Analyst County of Hawaii, Asia Wasser, Senior GIS Analyst

4 | P a g e
Executive Summary Background
Why do we count people experiencing homelessness? Everyone has seen them…encamped on our sidewalks, parks and beaches, crowded into shelters, and lined up for meals. These visuals create a sense of sorrow, pity, and yes, sometimes anger and disgust, all fused into our collective consciousness. As a caring community, we know that the homeless are people just like us but are significantly more vulnerable and desperately in need of assistance. This is why we count…because everyone matters.
Ka Mana O Na Helu (KMNH), the Collaborative Applicant and Homeless Management Information System (HMIS) Lead Agency for BTG, is responsible for conducting and reporting the findings of the local Point-in-Time Count in the annual funding application to the U.S. Department of Housing and Urban Development (HUD). KMNH prepared this report to provide comprehensive data from the neighbor island 2020 Point-in-Time Count. This report presents an in-depth look at the region’s homelessness, including demographic information and county profiles of homelessness by sub-population for the rural counties of Hawaii, Kauai and Maui. The goal of this report is to educate the broad-based community, elected officials, government agencies, and other stakeholders to improve awareness of the immediate homeless situation. The PIT report also endeavors to provide comprehensive data to promote informed decision-making for funding activities, local strategic planning, capacity building, and program development and implementation in the jurisdiction. Findings from local PIT counts will ultimately assist the federal government in better understanding the extent and nature of homelessness across the nation. Major Findings
Sunday, January 26th, 2020, was the official night of the 2020 Point-In-Time Count. Some encouraging data indicate that efforts to end homelessness are taking hold in some communities. However, contrasting data also shows that there is still much work to be done.
Results from the 2020 Neighbor Islands Homeless PIT Count revealed less than a one percent increase in total one-day homelessness from 1,995 persons in 2019 to 2,010 persons in 2020. This modest increase can be attributed to an overall increase on the island of Hawaii (16%). Kauai realized a four percent decrease in total homelessness, while Maui declined nine percent overall; these decreases were more than offset by the increase noted for Hawaii island.
The 2020 overall increase was fueled by a five percent increase in unsheltered homelessness to 1,304 persons compared to 1,237 in 2019. Unsheltered homelessness climbed on two of the Neighbor Islands, Hawaii (17%) and Kauai (6%); and declined six percent on the island of Maui. This is the first annual increase in total unsheltered homelessness since 2016. The count of homeless persons living in emergency shelters or transitional housing facilities decreased seven percent from 758 to 706 persons, with decreases registering on Maui (-11%), and Kauai (-42%). In October 2019, the new Keolahou emergency shelter opened in Hilo, Hawaii, which accounted for 24 of the sheltered homeless. This shelter opened as part of the

5 | P a g e
Ohana Zone initiative and was included in the 2020 sheltered count. (In 2018, the Hawaii State Legislature appropriated $30 million in Ohana Zone funds to address homelessness statewide. Projects receiving Ohana Zone funds are required to have a connection to state and county land and provide services to assist homeless individuals and families to access permanent housing.)
An assessment of the type of individuals experiencing homelessness in 2020 found that
of the 2,010 total persons enumerated, 1,341 were individuals representing 67 percent of the total one-day homelessness. Individuals are defined throughout this report as people in households (single or multiple adults) without the presence of children under the age of 18. A total of 669 family individuals within 184 families were homeless, including 67 families with a total of 253 persons living unsheltered. The 67 unsheltered families identified in 2020 translates to a 56 percent increase compared to 2019. A total of 136 children were found living unsheltered within these families. In 2020, 117 sheltered families were counted (50 in emergency shelters and 67 in transitional housing facilities) encompassing 416 total persons, which included 233 children and 183 adults. Sheltered families decreased by 17 (13%) compared to 2019, with the largest decline attributed to Maui (15 total families).
A review of key subpopulations indicates that the total number of self-reported sheltered
and unsheltered homeless veterans on the Neighbor Islands increased nine percent to 132 veterans compared to the 2019 total of 121 veterans. A total of 98 unsheltered veterans were encountered in 2020, nearly identical to the 96 counted in 2019. 2020 marks the first year that total veteran homelessness has increased since 2016. Fifty-two unsheltered chronically homeless veteran non-family households were tallied in 2020, 55 percent of the 95 enumerated.
Data from the 2020 report supports an increase in the level of chronic homelessness, with
631 individuals and 78 family individuals, for a total of 709 persons in chronically homeless households. This represents a 13 percent increase compared to the 627 surveyed in 2019. The overall increase reflected a 15 percent increase in chronically homeless individuals, and a one percent increase in chronically homeless family individuals.
This report tabulates data on two additional subpopulations of increasing significance:
unaccompanied youth and parenting youth households (see Appendix 5, Tables 5-6). Unaccompanied youth are defined by HUD as people in households without children who are not part of a family with children or accompanied by their parent or guardian during their episode of homelessness, and who are all 24 years or younger. The Neighbor Islands reported 62 total unaccompanied youth households in 2020, with 51 households (82%) living unsheltered, and 11 residing in emergency shelters. The 2020 unaccompanied youth count increased by 22 households (55%) compared to the estimated 40 households in 2019. There were zero unsheltered unaccompanied youth under the age of 18 reported in the 2020 count.
A parenting youth household is defined as a household that contains only persons aged 24
years or younger with one or more dependent children. In 2020, the Neighbor Islands parenting youth households were reported at 14 households with 41 total persons, including 17 children. The number of parenting youth households reported in 2020 increased by four compared to the 2019 count of 10 households.

6 | P a g e
Given the numbers of homeless found in these counts and the state and federal initiatives to reduce homelessness, continued recommendations to improve the overall implementation of the count include the planning, supervision and execution of the count’s efforts, the training of count staff and volunteers, the handling and verification of all survey forms and electronic data, and the introduction of data quality controls by outreach funders or the CoC.
7 | P a g e
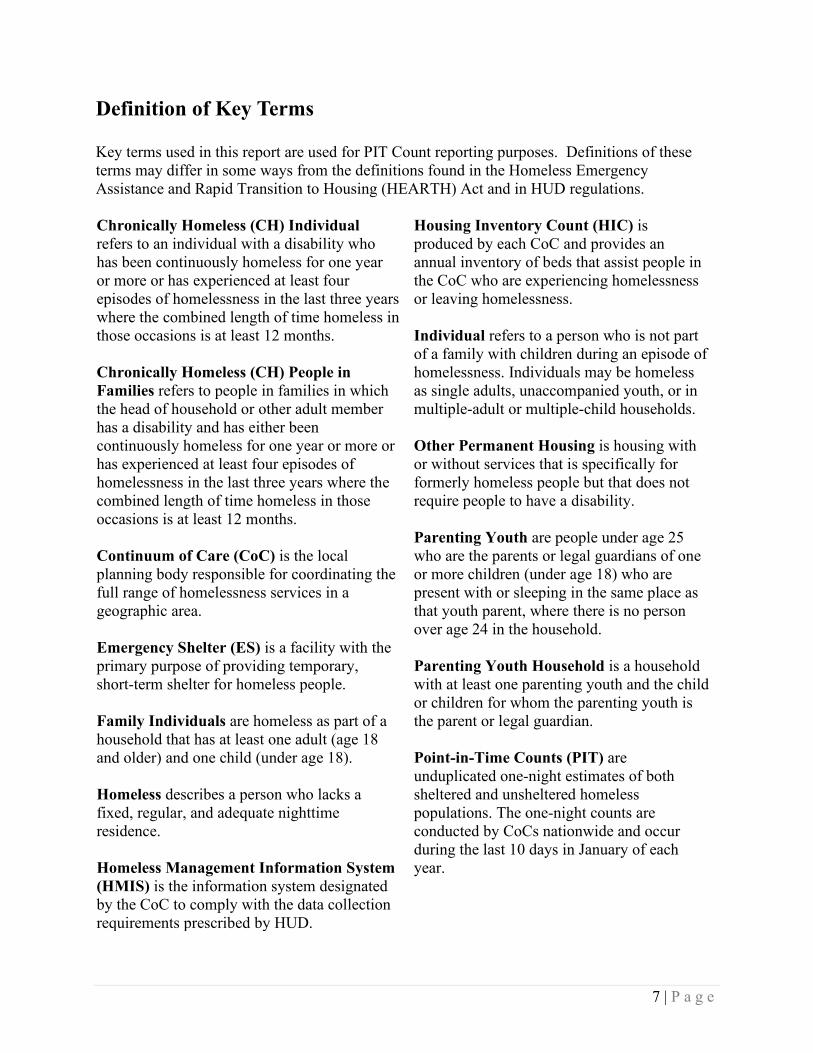
Definition of Key Terms Key terms used in this report are used for PIT Count reporting purposes. Definitions of these terms may differ in some ways from the definitions found in the Homeless Emergency Assistance and Rapid Transition to Housing (HEARTH) Act and in HUD regulations. Chronically Homeless (CH) Individual refers to an individual with a disability who has been continuously homeless for one year or more or has experienced at least four episodes of homelessness in the last three years where the combined length of time homeless in those occasions is at least 12 months. Chronically Homeless (CH) People in Families refers to people in families in which the head of household or other adult member has a disability and has either been continuously homeless for one year or more or has experienced at least four episodes of homelessness in the last three years where the combined length of time homeless in those occasions is at least 12 months. Continuum of Care (CoC) is the local planning body responsible for coordinating the full range of homelessness services in a geographic area. Emergency Shelter (ES) is a facility with the primary purpose of providing temporary, short-term shelter for homeless people. Family Individuals are homeless as part of a household that has at least one adult (age 18 and older) and one child (under age 18). Homeless describes a person who lacks a fixed, regular, and adequate nighttime residence. Homeless Management Information System (HMIS) is the information system designated by the CoC to comply with the data collection requirements prescribed by HUD.
Housing Inventory Count (HIC) is produced by each CoC and provides an annual inventory of beds that assist people in the CoC who are experiencing homelessness or leaving homelessness. Individual refers to a person who is not part of a family with children during an episode of homelessness. Individuals may be homeless as single adults, unaccompanied youth, or in multiple-adult or multiple-child households. Other Permanent Housing is housing with or without services that is specifically for formerly homeless people but that does not require people to have a disability. Parenting Youth are people under age 25 who are the parents or legal guardians of one or more children (under age 18) who are present with or sleeping in the same place as that youth parent, where there is no person over age 24 in the household. Parenting Youth Household is a household with at least one parenting youth and the child or children for whom the parenting youth is the parent or legal guardian. Point-in-Time Counts (PIT) are unduplicated one-night estimates of both sheltered and unsheltered homeless populations. The one-night counts are conducted by CoCs nationwide and occur during the last 10 days in January of each year.

8 | P a g e
Permanent Supportive Housing (PSH) is a housing model designed to provide housing assistance and supportive services on a long-term basis to formerly homeless people. HUD’s Continuum of Care program, authorized by the McKinney-Vento Act, funds PSH and requires that the client have a disability for eligibility. Rapid Re-housing (RRH) is a housing model designed to provide temporary housing assistance to people experiencing homelessness, moving them quickly out of homelessness and into permanent housing. Sheltered Homelessness refers to people who are staying in emergency shelters or transitional housing programs. Transitional Housing (TH) Programs provide people experiencing homelessness a place to stay combined with supportive services for a longer duration of time than emergency shelters. Unaccompanied Homeless Youth (under 18) are people in households with only children who are not part of a family with children or accompanied by their parent or guardian during their episode of homelessness, and who are under the age of 18.
Unaccompanied Homeless Youth (18-24) are people in households without children who are not part of a family with children or accompanied by their parent or guardian during their episode of homelessness, and who are between the ages of 18 and 24. Unsheltered Homelessness refers to people whose primary nighttime location is a public or private place not designated for, or ordinarily used as, a regular sleeping accommodation for people (for example, the streets, vehicles, beaches, or parks). Veteran refers to any person who served on active duty in the armed forces of the United States. This includes Reserves and National Guard members who were called up to active duty.
9 | P a g e
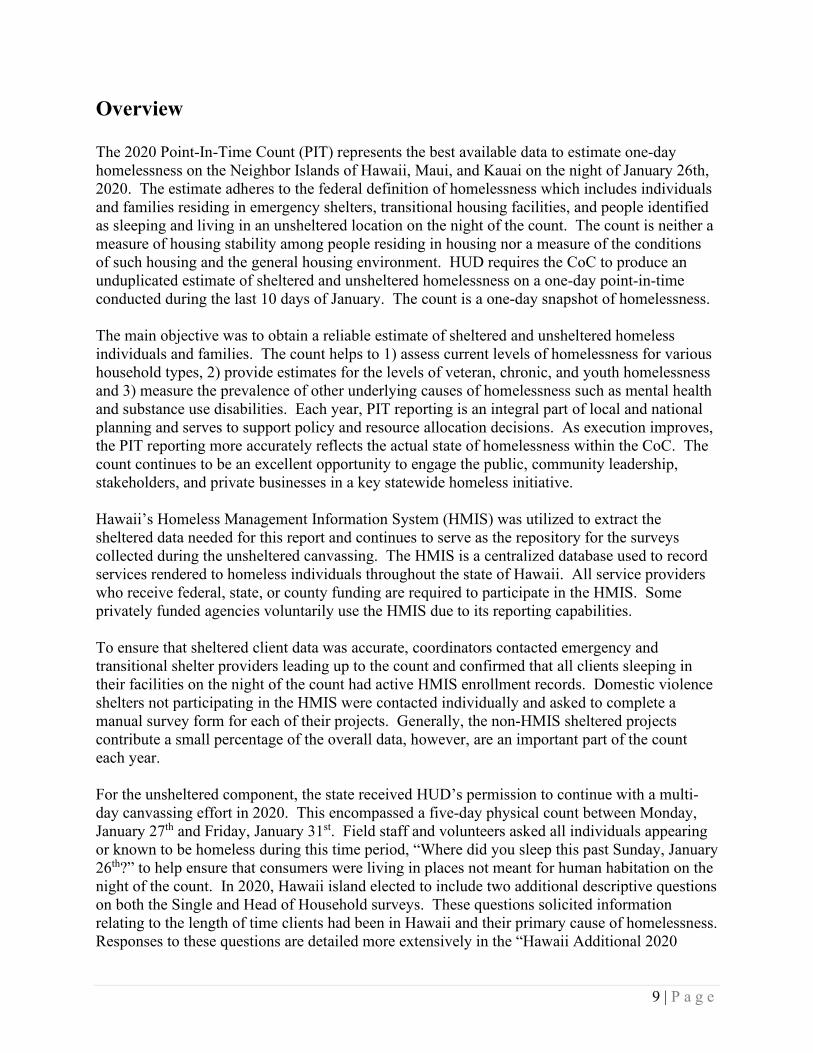
Overview The 2020 Point-In-Time Count (PIT) represents the best available data to estimate one-day homelessness on the Neighbor Islands of Hawaii, Maui, and Kauai on the night of January 26th, 2020. The estimate adheres to the federal definition of homelessness which includes individuals and families residing in emergency shelters, transitional housing facilities, and people identified as sleeping and living in an unsheltered location on the night of the count. The count is neither a measure of housing stability among people residing in housing nor a measure of the conditions of such housing and the general housing environment. HUD requires the CoC to produce an unduplicated estimate of sheltered and unsheltered homelessness on a one-day point-in-time conducted during the last 10 days of January. The count is a one-day snapshot of homelessness. The main objective was to obtain a reliable estimate of sheltered and unsheltered homeless individuals and families. The count helps to 1) assess current levels of homelessness for various household types, 2) provide estimates for the levels of veteran, chronic, and youth homelessness and 3) measure the prevalence of other underlying causes of homelessness such as mental health and substance use disabilities. Each year, PIT reporting is an integral part of local and national planning and serves to support policy and resource allocation decisions. As execution improves, the PIT reporting more accurately reflects the actual state of homelessness within the CoC. The count continues to be an excellent opportunity to engage the public, community leadership, stakeholders, and private businesses in a key statewide homeless initiative. Hawaii’s Homeless Management Information System (HMIS) was utilized to extract the sheltered data needed for this report and continues to serve as the repository for the surveys collected during the unsheltered canvassing. The HMIS is a centralized database used to record services rendered to homeless individuals throughout the state of Hawaii. All service providers who receive federal, state, or county funding are required to participate in the HMIS. Some privately funded agencies voluntarily use the HMIS due to its reporting capabilities. To ensure that sheltered client data was accurate, coordinators contacted emergency and transitional shelter providers leading up to the count and confirmed that all clients sleeping in their facilities on the night of the count had active HMIS enrollment records. Domestic violence shelters not participating in the HMIS were contacted individually and asked to complete a manual survey form for each of their projects. Generally, the non-HMIS sheltered projects contribute a small percentage of the overall data, however, are an important part of the count each year. For the unsheltered component, the state received HUD’s permission to continue with a multi-day canvassing effort in 2020. This encompassed a five-day physical count between Monday, January 27th and Friday, January 31st. Field staff and volunteers asked all individuals appearing or known to be homeless during this time period, “Where did you sleep this past Sunday, January 26th?” to help ensure that consumers were living in places not meant for human habitation on the night of the count. In 2020, Hawaii island elected to include two additional descriptive questions on both the Single and Head of Household surveys. These questions solicited information relating to the length of time clients had been in Hawaii and their primary cause of homelessness. Responses to these questions are detailed more extensively in the “Hawaii Additional 2020

10 | P a g e
Unsheltered Questions” section of this report. The CoC continued to collect geolocation data based on the site of interview. This data was analyzed with the generous help of Maui County’s Geographic Services Manager, Dan Sereno, and can be accessed from the following webpage: https://www.hawaiihomelessprogramshmis.org/reports-publications/hawaii-homeless-point-in-count-reports/. The unsheltered survey form is largely based on HUD-defined data collection. All surveys collected during the count were cleaned, entered in the PIT module of the HMIS, unduplicated, and analyzed to obtain the final data included in this report. The final 2020 unsheltered survey forms can be accessed through the link below. The following unsheltered surveys were not included in the final unsheltered tally.
• Clients who reported living in a sheltered situation on the night of January 26th, 2020 • Duplicate surveys or records that were already counted in the sheltered component
Stakeholders, regional leaders, homeless service providers, and volunteers attended several planning meetings and in-person trainings leading up to the unsheltered canvassing. The purpose was to convey the count’s methodology to all involved, provide background and instructions, and to answer any questions regarding the surveys used during the unsheltered count. Multiple in-person trainings preceded the 2020 count. Trainees received an overview of the count and its methodology, safety tips, data quality topics, and key points to consider during this year’s surveying based on the 2019 results. Regional leadership provided ad hoc field training before and during the count to ensure that outreach personnel and volunteers understood how to administer the survey. Many of the resources that were used leading up to the 2020 count are accessible through the weblink noted above. Field staff were composed of workers from service agencies that regularly perform outreach to unsheltered homeless individuals. Survey teams were assigned to familiar regions to ensure that many of the high-density areas frequented by unsheltered homeless were surveyed. Skilled outreach staff accustomed to specific areas and clients are more likely to obtain accurate information. Service-based locations, such as food pantries or drop-in centers were also covered extensively during the count to reach additional unsheltered homeless. The first day of the unsheltered count was conducted with substantial participation from all organizations and volunteers and focused on reaching as many unsheltered homeless individuals as possible. As the week progressed, agencies independently scheduled dates and times for field staff to visit all known locations.

11 | P a g e
Bridging The Gap (BTG) Summary The sections that follow provide summary PIT data for the neighbor islands. Table 1 summarizes the total number of sheltered and unsheltered homeless over the last five years, while also providing the proportion for each housing component relative to the total. Table 1: BTG Summary, 2016-2020 Sheltered Unsheltered Total # % # % # 2020 706 35.1% 1,304 64.9% 2,010 2019 758 38.0% 1,237 62.0% 1,995 2018 705 34.6% 1,330 65.4% 2,035 2017 785 34.7% 1,476 65.3% 2,261 2016 846 28.4% 2,135 71.6% 2,981
Figure 1 illustrates the slight increase in the level of total homelessness over the last year. The 2020 sheltered count declined by seven percent, while the unsheltered count rose by five percent or 67 total persons. Appendix 1 provides the comprehensive shelter listing for all ES and TH projects that comprised the sheltered count. Appendix 3 includes the unsheltered summary by region for Hawaii, Kauai, and Maui. Appendix 4 shows the regional maps of Hawaii, Kauai and Maui. Each of the annual counts through 2016 have been implemented using the same general methodology, thus preserving a level of consistency from year to year. The total number of unsheltered homeless this year was estimated to be 1,304.
846 785 705 758 706
2135
1476 1330 1237 1304
2981
22612035 1995 2010
0
500
1000
1500
2000
2500
3000
3500
2016 2017 2018 2019 2020
Figure 1: BTG Summary, 2016-2020
Sheltered Unsheltered Total
12 | P a g e
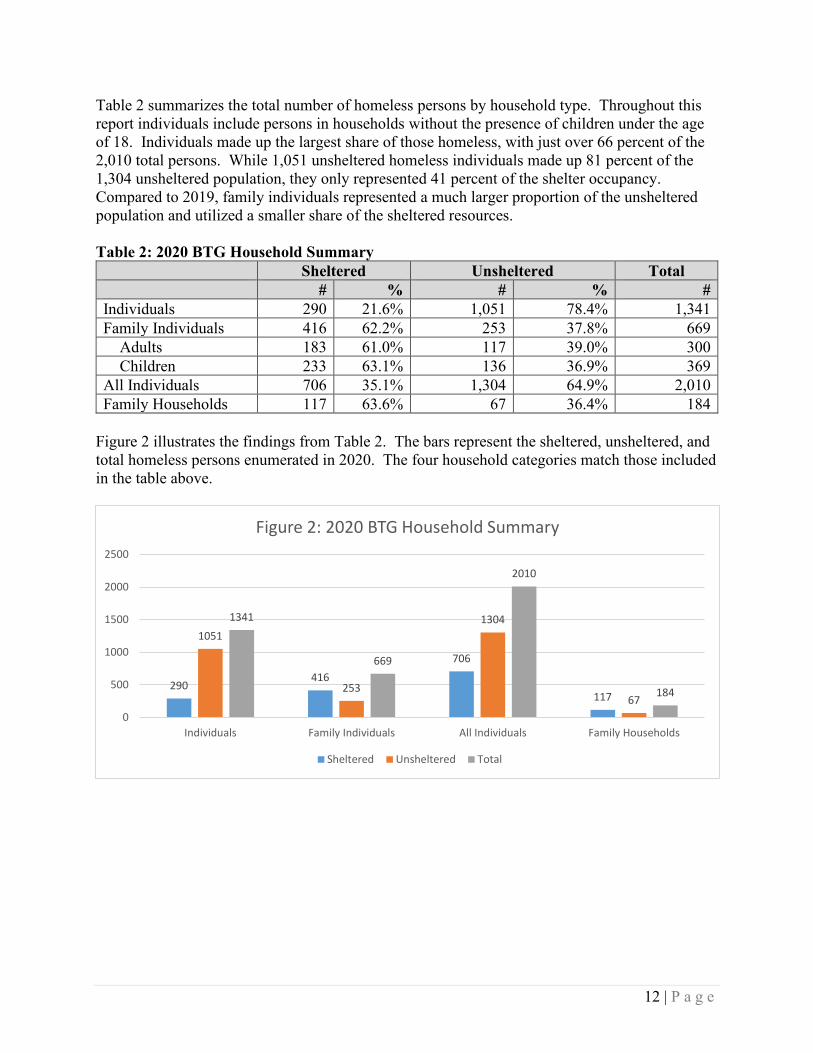
Table 2 summarizes the total number of homeless persons by household type. Throughout this report individuals include persons in households without the presence of children under the age of 18. Individuals made up the largest share of those homeless, with just over 66 percent of the 2,010 total persons. While 1,051 unsheltered homeless individuals made up 81 percent of the 1,304 unsheltered population, they only represented 41 percent of the shelter occupancy. Compared to 2019, family individuals represented a much larger proportion of the unsheltered population and utilized a smaller share of the sheltered resources. Table 2: 2020 BTG Household Summary Sheltered Unsheltered Total # % # % # Individuals 290 21.6% 1,051 78.4% 1,341 Family Individuals 416 62.2% 253 37.8% 669
Adults 183 61.0% 117 39.0% 300 Children 233 63.1% 136 36.9% 369
All Individuals 706 35.1% 1,304 64.9% 2,010 Family Households 117 63.6% 67 36.4% 184
Figure 2 illustrates the findings from Table 2. The bars represent the sheltered, unsheltered, and total homeless persons enumerated in 2020. The four household categories match those included in the table above.
290416
706
117
1051
253
1304
67
1341
669
2010
184
0
500
1000
1500
2000
2500
Individuals Family Individuals All Individuals Family Households
Figure 2: 2020 BTG Household Summary
Sheltered Unsheltered Total

13 | P a g e
Figure 3 presents summary household data over the last five years for BTG.
1793
1423
12261324 1341
1188
838 809671 669
292208 216 177 184
0
200
400
600
800
1000
1200
1400
1600
1800
2000
2016 2017 2018 2019 2020
Figure 3: BTG Individuals and Family Households, 2016-2020
Ind
Fam Ind
Fam HHs

14 | P a g e
BTG Homeless Subpopulations BTG was required to collect information on specific homeless subpopulations in 2020. These subpopulations and the data for BTG are outlined in Tables 3 through 6. The data presented aligns with HUD reporting specifications. Chronic Homelessness Table 3 displays the 2020 self-reported chronically homeless estimates for BTG. In total, there were 120 chronically homeless persons in BTG’s emergency shelters, encompassing 76 chronic individuals and 44 chronic persons in families. Persons in transitional housing facilities are not counted as chronically homeless for the purposes of the PIT reporting. Among the unsheltered population there were a total of 589 chronically homeless persons, which includes 555 individuals and 34 persons in families. Eleven of the 67 unsheltered families, or 16 percent, reported as being chronically homeless. Table 3: BTG Chronically Homeless, 2020 Emergency Shelter Unsheltered Total CH Individuals 76 555 631 CH Families 13 11 24 Persons in CH Families
44 34 78
Figures 4 and 5 illustrate the proportion of individuals living in emergency shelters and in places not meant for human habitation that were reported as chronically homeless this year. 224 individuals resided in emergency shelters on the night of the count, with just over one third presenting as chronically homeless. 1,051 individuals resided in places not meant for human habitation, with just over half reporting as chronically homeless, up slightly compared to 2019.
555496
Figure 5: BTG Unsheltered CH Individuals
BTG Unshltd CH Ind BTG Unshltd Non-CH Ind
76
148
Figure 4: BTG ES CH Individuals
BTG ES CH Ind BTG ES Non-CH Ind
15 | P a g e
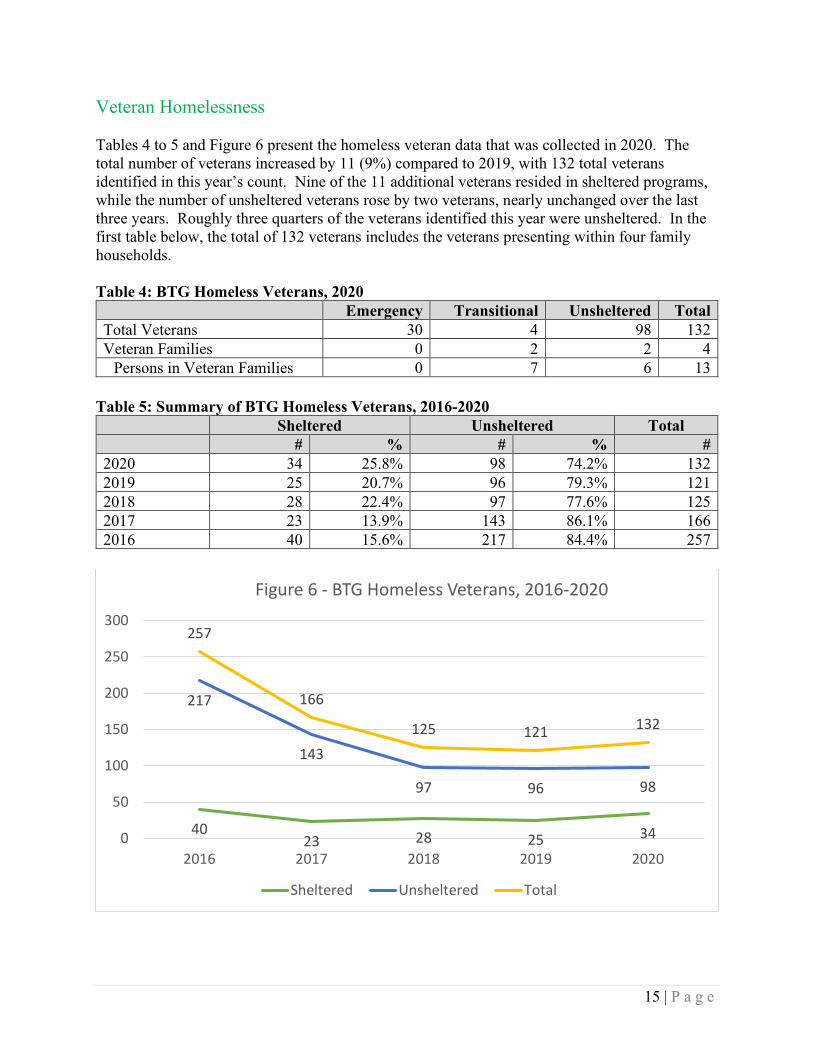
Veteran Homelessness Tables 4 to 5 and Figure 6 present the homeless veteran data that was collected in 2020. The total number of veterans increased by 11 (9%) compared to 2019, with 132 total veterans identified in this year’s count. Nine of the 11 additional veterans resided in sheltered programs, while the number of unsheltered veterans rose by two veterans, nearly unchanged over the last three years. Roughly three quarters of the veterans identified this year were unsheltered. In the first table below, the total of 132 veterans includes the veterans presenting within four family households. Table 4: BTG Homeless Veterans, 2020 Emergency Transitional Unsheltered Total Total Veterans 30 4 98 132 Veteran Families 0 2 2 4
Persons in Veteran Families 0 7 6 13 Table 5: Summary of BTG Homeless Veterans, 2016-2020 Sheltered Unsheltered Total # % # % # 2020 34 25.8% 98 74.2% 132 2019 25 20.7% 96 79.3% 121 2018 28 22.4% 97 77.6% 125 2017 23 13.9% 143 86.1% 166 2016 40 15.6% 217 84.4% 257
4023 28 25 34
217
143
97 96 98
257
166
125 121 132
0
50
100
150
200
250
300
2016 2017 2018 2019 2020
Figure 6 - BTG Homeless Veterans, 2016-2020
Sheltered Unsheltered Total

16 | P a g e
Additional Homeless Subpopulations Table 6 highlights additional subpopulation data for BTG that was required to be reported by HUD. As indicated in the table header, the Serious Mental Illness (SMI), Substance Use, Human Immunodeficiency Virus / Acquired Immune Deficiency Syndrome (HIV/AIDS) and fleeing domestic violence (DV) data applies only to adults within the sheltered and unsheltered counts. Children under the age of 18 are not included in these statistics. This year there were 297 adults in ES projects, 176 adults in TH, and 1,168 unsheltered adults. Table 6: BTG Adult Homeless Populations, 2020 Emergency Transitional Unsheltered Total Serious Mental Illness 119 28 474 621 Substance Use Disorder 70 23 367 460 HIV/AIDS 2 0 14 16 Fleeing DV (Optional in 2020) 47 8 NA 55
Figure 7 presents the four largest subpopulation groups: Chronically Homeless, Veteran, SMI, and Substance Use data from Tables 3, 4-5, and 6 above. The data are grouped by project type, and then totaled in the far-right group of the figure.
76
0
555
631
30 4
98132119
28
474
621
7023
367
460
0
100
200
300
400
500
600
700
ES TH Unsheltered Total
Figure 7: BTG Homeless Subpopulations
Chronic Individuals Veterans Serious Mental Illness Substance Use Disorder

17 | P a g e
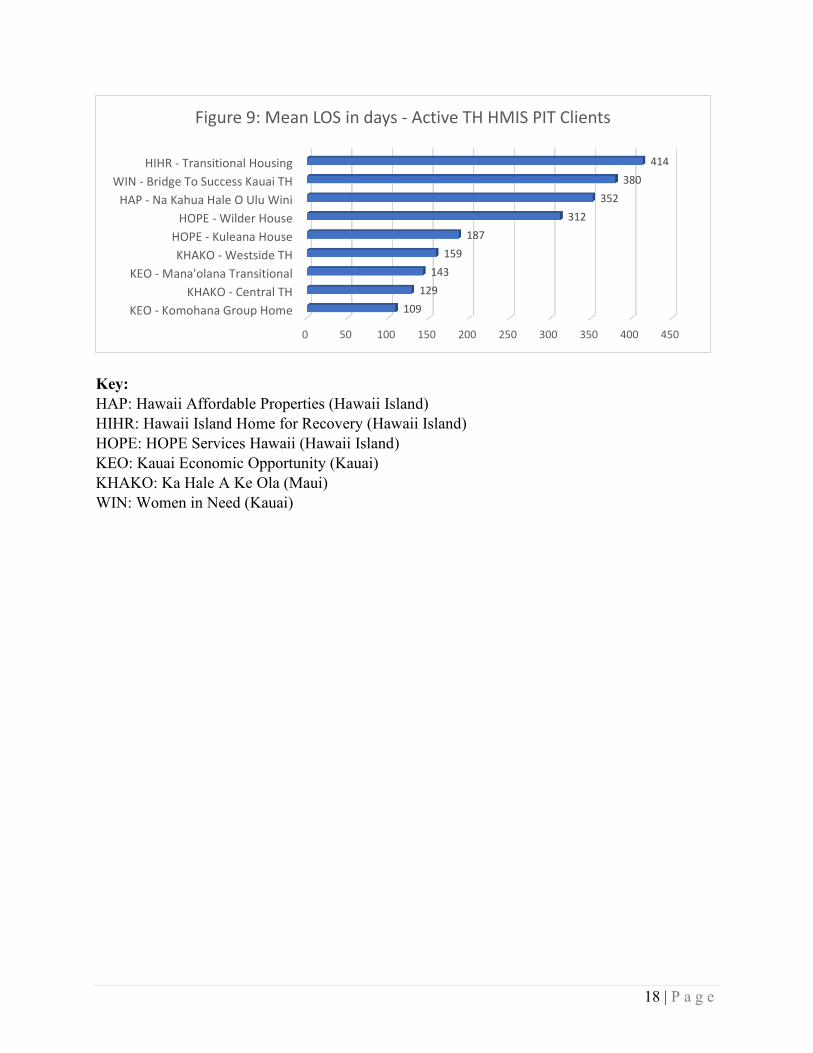
Mean Length of Stay (LOS): Active HMIS Sheltered Clients Figures 8 and 9 present mean LOS data for the active clients living in the 13 ES and 9 TH HMIS projects included in this year’s count. These data are taken from the table in Appendix 2, which displays other descriptive LOS statistics for each of these projects. Within each project type, projects are ordered from longest to shortest mean LOS for all active clients. LOS is measured from enrollment date to the PIT date. Homeless services providers are encouraged to review these data in relation to overall HMIS data quality, since projects with many clients and long mean LOS heavily influence CoC LOS System Performance. System Performance Measures are evaluated by HUD annually and assist in CoC funding determinations. BTG must measure its progress in meeting the needs of people experiencing homelessness in their community and report this progress to HUD. Upon brief review, HOPE Services Hawaii (HOPE) operates the three ES projects with the longest mean LOS; while Hawaii Island Home for Recovery (HIHR), Women In Need (WIN), and Hawaii Affordable Properties (HAP) operate the top three on the TH side. Appendix 2 data also indicates that one client has resided at HIHR for nearly five years.
Key: FLC: Family Life Center (Maui) HOPE: HOPE Services Hawaii (Hawaii Island) KEO: Kauai Economic Opportunity (Kauai) KHAKO: Ka Hale A Ke Ola (Maui) NPP: Neighborhood Place of Puna (Hawaii Island) USVETS: United States Veterans Initiative (Hawaii Island and Kauai)
0 50 100 150 200 250
HOPE - East Hawaii Emergency Men's ProgramHOPE - KeolahouFLC - Ho'olanani
KEO - Mana'olana EmergencyUSVETS - BP Hilo HOPTEL
USVETS - BP Kauai HOPTELUSVETS - BP Kailua Kona
KHAKO - Central ESNPP - Family Assessment Center at Hale Iki
KHAKO - Westside ESHOPE - Kiheipua
HOPE - West Hawaii Emergency Housing ProgramHOPE - Sacred Hearts Pahoa
565659
707377
94104
119129130
181217
Figure 8: Mean LOS in days - Active ES HMIS PIT Clients
18 | P a g e
Key: HAP: Hawaii Affordable Properties (Hawaii Island) HIHR: Hawaii Island Home for Recovery (Hawaii Island) HOPE: HOPE Services Hawaii (Hawaii Island) KEO: Kauai Economic Opportunity (Kauai) KHAKO: Ka Hale A Ke Ola (Maui) WIN: Women in Need (Kauai)
0 50 100 150 200 250 300 350 400 450
KEO - Komohana Group HomeKHAKO - Central TH
KEO - Mana'olana TransitionalKHAKO - Westside TH
HOPE - Kuleana HouseHOPE - Wilder House
HAP - Na Kahua Hale O Ulu WiniWIN - Bridge To Success Kauai TH
HIHR - Transitional Housing
109129
143159
187312
352380
414
Figure 9: Mean LOS in days - Active TH HMIS PIT Clients

19 | P a g e
BTG Active Clients by Project Type as of the PIT Count Date Table 7 displays the total number of unduplicated active clients as of the PIT Count date within the five main HMIS homeless services project types by county and in total for the CoC. In addition to the homeless types included in the PIT analysis (Unsheltered, ES, TH) it is also important to present the number of clients that are actively housed via PSH and RRH resources based on HMIS data, as these clients were homeless prior to being housed and should be included to demonstrate the success of permanent housing initiatives within the CoC. Figure 10 shows that the PSH/RRH clients represent just under one quarter of the currently enrolled, while ES/TH encompass slightly over one quarter. Homeless clients identified via the PIT unsheltered canvassing comprise nearly one half of those active. The RRH project type had a total of 275 active HMIS enrollments as of the PIT Count date. Of these enrollments, 259 had moved into housing prior to the PIT date, while the other 16 homeless clients were found in one of the homeless project types listed below (Unsheltered, ES, TH). RRH program providers are encouraged to evaluate households that remain actively enrolled yet have moved into housing through existing HMIS reports. Clients no longer requiring financial or supportive services should be discharged through standard HMIS workflows. Table 7: Active Clients by Project Type as of PIT Date Hawaii Kauai Maui Total Permanent Supportive Housing (PSH) 181 18 162 361 Rapid Re-Housing (RRH) 183 26 50 259 Transitional Housing (TH) 107 23 177 307 Emergency Shelter (ES) 169 32 198 399 Unsheltered (Unsh) 521 369 414 1,304 Total 1,161 468 1,001 2,630
Figure 10 illustrates the total clients by project type from the table above.
361
259
307
399
1304
Figure 10: Total Active Clients by Project Type
PSH
RRH
TH
ES
Unsh

20 | P a g e
Hawaii Island Summary Table 8 and Figure 11 displays the five-year trends in sheltered, unsheltered, and total homelessness for the island of Hawaii. For 2020, the proportion of unsheltered homeless remained consistent with the results from 2019, however, total homelessness increased by 107, from 690 to 797 persons. The percentage change from last year was nearly 16 percent, with much of the increase attributable to a rise in the level of unsheltered homelessness, up 74 persons, 447 in 2019 compared to 521 in 2020. Table 8: Hawaii Island Summary, 2016-2020
Sheltered Unsheltered Hawaii Total
# % # % # 2020 276 34.6% 521 65.4% 797 2019 243 35.2% 447 64.8% 690 2018 200 23.0% 669 77.0% 869 2017 275 28.9% 678 71.1% 953 2016 271 19.4% 1,123 80.6% 1,394
Figure 11 shows the Hawaii trends data and the increase in sheltered, unsheltered and total homelessness compared to 2019. There was a 14 percent increase in sheltered homelessness relative to 2019, from 243 persons to 276 in 2020. This was attributable to several new projects coming online, and increased occupancy among the existing facilities. Unsheltered homelessness increased by 17 percent, led by a 51 person increase in the level of unsheltered individuals.
271 275200 243 276
1123
678 669
447521
1394
953869
690797
0
200
400
600
800
1000
1200
1400
1600
2016 2017 2018 2019 2020
Figure 11 - Hawaii Island Summary, 2016-2020
Sheltered Unsheltered Total

21 | P a g e
Table 9 presents characteristics by PIT component and household type for Hawaii in 2020. Family individuals comprised 58 percent of the sheltered population (159 out of 276 sheltered family individuals). Individuals made up nearly 84 percent of the unsheltered estimate (436 out of 521 unsheltered individuals). Table 9: 2020 Hawaii Household Summary
Sheltered Unsheltered Hawaii Total
# % # % # Individuals 117 21.2% 436 78.8% 553 Family Individuals 159 65.2% 85 34.8% 244
Adults 76 67.9% 36 32.1% 112 Children 83 62.9% 49 37.1% 132
All Individuals 276 34.6% 521 65.4% 797 Family Households 46 67.6% 22 32.4% 68
Figure 12 illustrates the findings from Table 9. The bars represent the sheltered, unsheltered, and total homeless persons enumerated in 2020. The four household categories match those included in the table above.
117159
276
46
436
85
521
22
553
244
797
68
0
100
200
300
400
500
600
700
800
900
Individuals Family Individuals All Individuals Family Households
Figure 12: 2020 Hawaii Household Summary
Sheltered Unsheltered Total

22 | P a g e
Tables 10 through 12 summarize the Hawaii PIT estimates over the last five years. Figure 13 illustrates the trends data presented in Tables 10 through 12. Table 10: Hawaii Island Individuals, 2016-2020 Sheltered Unsheltered HI Total # % # % # 2020 117 21.2% 436 78.8% 553 2019 74 16.1% 385 83.9% 459 2018 76 14.6% 445 85.4% 521 2017 92 16.0% 482 84.0% 574 2016 90 12.0% 663 88.0% 753
Table 11: Hawaii Island Family Individuals, 2016-2020 Sheltered Unsheltered HI Total # % # % # 2020 159 65.2% 85 34.8% 244 2019 169 73.2% 62 26.8% 231 2018 124 35.6% 224 64.4% 348 2017 183 48.3% 196 51.7% 379 2016 181 28.2% 460 71.8% 641
Table 12: Hawaii Island Family Households, 2016-2020 Sheltered Unsheltered HI Total # % # % # 2020 46 67.6% 22 32.4% 68 2019 41 74.5% 14 25.5% 55 2018 33 37.9% 54 62.1% 87 2017 41 49.4% 42 50.6% 83 2016 49 32.0% 104 68.0% 153
753
574521
459553
641
379 348
231 244153
83 87 55 68
0
100
200
300
400
500
600
700
800
2016 2017 2018 2019 2020
Figure 13: Hawaii Island Individuals and Family HHs, 2016-2020
Ind
Fam Ind
Fam HHs

23 | P a g e
Hawaii Homeless Subpopulations Hawaii was required to collect information on specific homeless subpopulations in 2020. These subpopulations and the data for Hawaii are outlined in Tables 13 through 15. The data presented aligns with HUD reporting specifications. Chronic Homelessness Table 13 displays the 2020 self-reported chronically homeless estimates for the island of Hawaii. In total, there were 67 chronically homeless persons in Hawaii’s emergency shelters, including 46 chronic individuals and 21 chronic persons in families. Persons in transitional housing facilities are not counted as chronically homeless for the purposes of the PIT reporting. Among the unsheltered population there were a total of 239 chronically homeless persons, including 221 chronic individuals and 18 chronic persons in families. Six of the 22 total unsheltered families (27%) reported as chronically homeless. Table 13: Hawaii Island Chronically Homeless, 2020 Emergency Shelter Unsheltered Total CH Individuals 46 221 267 CH Families 7 6 13 Persons in CH Families
21 18 39
Figures 14 and 15 illustrate the proportion of Hawaii’s homeless individuals living in emergency shelters and in places not meant for human habitation that were reported as chronically homeless this year. Individuals residing in emergency shelters totaled 101 on the night of the count, with 46 percent presenting as chronically homeless. Individuals residing in places not meant for human habitation totaled 436, with just over 50 percent reporting as chronically homeless. This represents a nine percent unsheltered increase over 2019.
4655
Figure 14: Hawaii ES CH Individuals
Hawaii ES CH Ind Hawaii ES Non-CH Ind
221215
Figure 15: Hawaii Unsheltered CH Individuals
Hawaii Unshltd CH Ind Hawaii Unshltd Non-CH Ind

24 | P a g e
Veteran Homelessness Table 14 and Figure 16 present the homeless veteran data that was collected for Hawaii in 2020 and over the last five years, respectively. The total number of veterans increased by 12 (25%) compared to 2019, from 49 total veterans to 61 who were identified in this year’s count. Nine of the 12 additional veterans resided in sheltered programs, accounting for the increase from 8 sheltered veterans in 2019 to 17 in 2020. The number of unsheltered veterans rose slightly by three veterans, 44 in 2020 compared to the 41 counted last year. The 44 unsheltered veterans comprised 72 percent of the 61 total veterans identified this year. In the table below, the 61 total veterans include the veterans presenting within the three family households. Table 14: Hawaii Homeless Veterans, 2020 Emergency Transitional Unsheltered Total Total Veterans 14 3 44 61 Veteran Families 0 1 2 3
Persons in Veteran Families 0 5 6 11
8 8 12 817
105
57
37 41 44
113
65
49 4961
0
20
40
60
80
100
120
2016 2017 2018 2019 2020
Figure 16 - Hawaii Homeless Veterans, 2016-2020
Sheltered Unsheltered Total
25 | P a g e
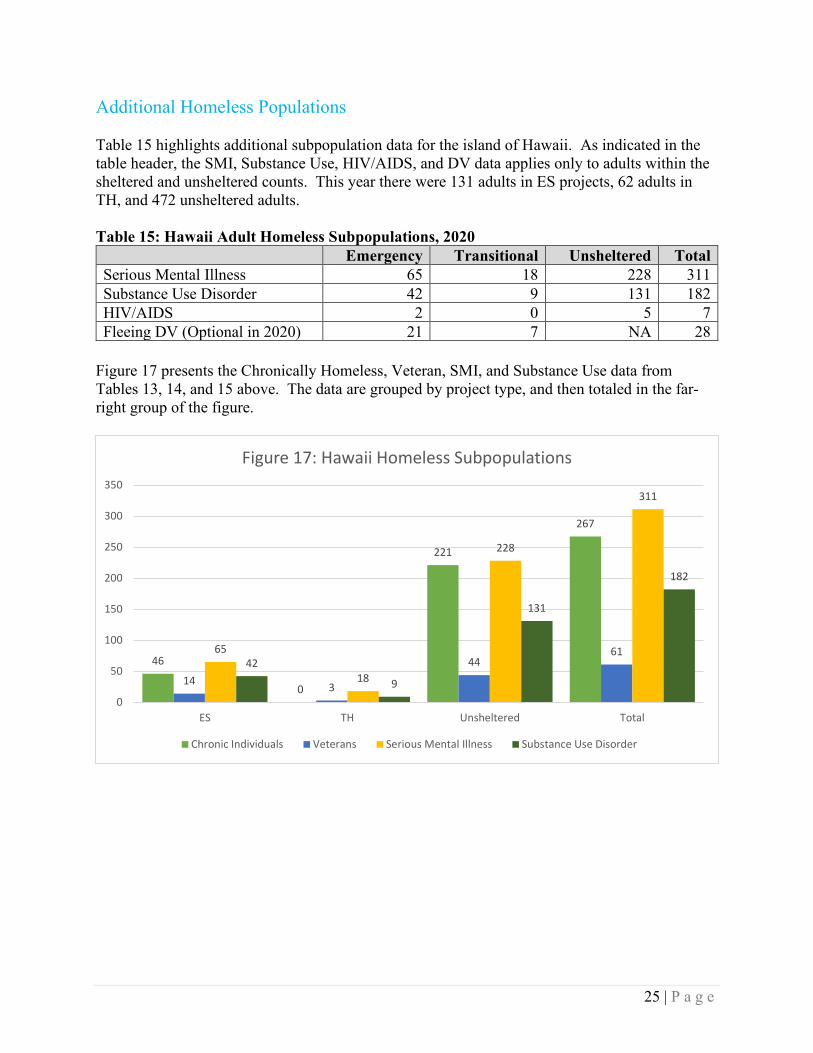
Additional Homeless Populations Table 15 highlights additional subpopulation data for the island of Hawaii. As indicated in the table header, the SMI, Substance Use, HIV/AIDS, and DV data applies only to adults within the sheltered and unsheltered counts. This year there were 131 adults in ES projects, 62 adults in TH, and 472 unsheltered adults. Table 15: Hawaii Adult Homeless Subpopulations, 2020 Emergency Transitional Unsheltered Total Serious Mental Illness 65 18 228 311 Substance Use Disorder 42 9 131 182 HIV/AIDS 2 0 5 7 Fleeing DV (Optional in 2020) 21 7 NA 28
Figure 17 presents the Chronically Homeless, Veteran, SMI, and Substance Use data from Tables 13, 14, and 15 above. The data are grouped by project type, and then totaled in the far-right group of the figure.
46
0
221
267
14 3
446165
18
228
311
42
9
131
182
0
50
100
150
200
250
300
350
ES TH Unsheltered Total
Figure 17: Hawaii Homeless Subpopulations
Chronic Individuals Veterans Serious Mental Illness Substance Use Disorder

26 | P a g e
Hawaii Unsheltered Homelessness Table 16 outlines the unsheltered homelessness by region for the island of Hawaii in 2020. Appendix 4 provides a map of Hawaii showing how each of the nine regions were partitioned. A total of 521 total persons were counted in 2020, up 17 percent from the 447 counted in 2019. Of the 521 total persons, 436 (84%) were individuals, while 85 were members of families. There were 22 families found this year, up eight from one year prior. Figure 18 displays the unsheltered regional data by type of individual. Based on this data, 88 percent (383 out of 436) of the individuals recorded sleeping in either the South Hilo, Puna, or North Kona regions. Fifty-six percent (48 out of 85) of the family individuals slept in either the South Hilo or North Kona regions. GIS analysis completed this year provides much greater geolocation detail based on the site of interview for the 521 clients included in the final unsheltered count and can be accessed from the website provided on page 10. Table 16: Hawaii Island Unsheltered Homelessness by Region, 2020
Individuals Family Individuals
All Individuals
Family Households
Region # % # % # % # % 1: North Kohala 0 0.0% 0 0.0% 0 0.0% 0 0.0% 2: Hamakua 19 4.4% 0 0.0% 19 3.6% 0 0.0% 3: North Hilo 1 0.2% 3 3.5% 4 0.8% 1 4.5% 4: South Hilo 185 42.4% 21 24.7% 206 39.5% 6 27.3% 5: Puna 66 15.1% 14 16.5% 80 15.4% 5 22.7% 6: Ka`u 11 2.5% 15 17.6% 26 5.0% 3 13.6% 7: South Kona 1 0.2% 5 5.9% 6 1.2% 1 4.5% 8: North Kona 132 30.3% 27 31.8% 159 30.5% 6 27.3% 9: South Kohala 21 4.8% 0 0.0% 21 4.0% 0 0.0% Total 436 100.0% 85 100.0% 521 100.0% 22 100.0%
Figure 18 presents the data from Table 16.
0 0 019
019
1 3 4
185
21
206
66
14
80
11 1526
1 5 6
132
27
159
210
21
0
50
100
150
200
250
Individuals Family Individuals All Individuals
Figure 18: Hawaii Island Unsheltered by Region
1: North Kohala
2: Hamakua
3: North Hilo
4: South Hilo
5: Puna
6: Ka`u
7: South Kona
8: North Kona
9: South Kohala

27 | P a g e
Hawaii Additional 2020 Unsheltered Questions In 2020, Hawaii island elected to collect data on two additional questions through the unsheltered survey. Both questions and response selections were proposed by HOPE Services Hawaii and were vetted by Community Alliance Partners, the local CoC chapter for Hawaii county.
• Did you move to Hawaii within the past year? • What led to your current living situation?
These new survey questions were included on the Single and Head of Household unsheltered survey forms and were only administered on Hawaii island. In total, there were 1,007 unsheltered households within BTG in 2020. Hawaii island accounted for 415 of these households (41%), which included 22 families and 393 individual households. Table 17 presents response data from the question “Did you Move to Hawaii within the past year?”. Only 37 of the 415 households (9%) surveyed indicated that they had moved to Hawaii within the past year. Tables 18 through 20 present follow-up data based on affirmative responses to this initial question. Table 17: Did you move to Hawaii within the past year? Fam HH Individual HH Total Yes 2 35 37 No 20 342 362 Refused 0 16 16 Total 22 393 415
Table 18: If Yes, what State/Country did you come from? Fam HH Individual HH Total AK 1 1 2 CA 1 8 9 CO 0 3 3 FL 0 2 2 KS 0 1 1 KY 0 1 1 MN 0 3 3 NV 0 1 1 NY 0 1 1 OR 0 3 3 PA 0 1 1 SC 0 1 1 SD 0 1 1 TX 0 2 2 WA 0 3 3 WI 0 1 1 Refused 0 2 2 Total 2 35 37

28 | P a g e
Of the 35 households providing valid responses, 18 came from what can be considered west coast states (CA, CO, OR, WA). Roughly one quarter of these households surveyed indicated that they would be interested in returning home. For the 37 households that arrived within the last year, Table 20 displays data on why they moved to Hawaii – all households selecting “other” as the primary reason did not elaborate in their response. Table 19: If Yes, are you interested in returning home? Fam HH Individual HH Total Yes 0 9 9 No 2 26 28 Total 2 35 37
Table 20: If Yes, why did you come to Hawaii? (Select one) Fam HH Individual HH Total Came for a work/trade living arrangement 0 6 6 Came for the beautiful weather 0 8 8 To move with family/friends and didn’t work out 2 8 10 Other 0 13 13 Total 2 35 37
Table 21 presents the data from the question “What led to your current living situation?”. This question allowed for only one selection, which was intended to be the primary reason that each household was living unsheltered on the night of the count. The most prevalent response leading to homelessness was a family/relationship conflict, followed by the inability to pay rent. In total, these comprised two thirds of the responses. The table below includes modified categories that differ from the choices on the final unsheltered survey tool. This provides more detail on the 170 “Other” responses which were initially collected during the unsheltered canvassing. Table 21: What led to your current living situation? (Select one) Fam HH Individual HH Total Choose to Live Unsheltered 1 28 29 Chronic Disability 0 5 5 Family/Relationship conflict 8 155 163 Incarceration 0 9 9 Kilauea eruption 1 6 7 Lack of Affordable Housing 1 13 14 Lost my job 0 13 13 Medical emergency 1 16 17 Mental Illness 0 4 4 Other 1 9 10 Substance Use 0 9 9 Unable to pay rent 8 105 113 Unknown 1 21 22 Total 22 393 415
29 | P a g e
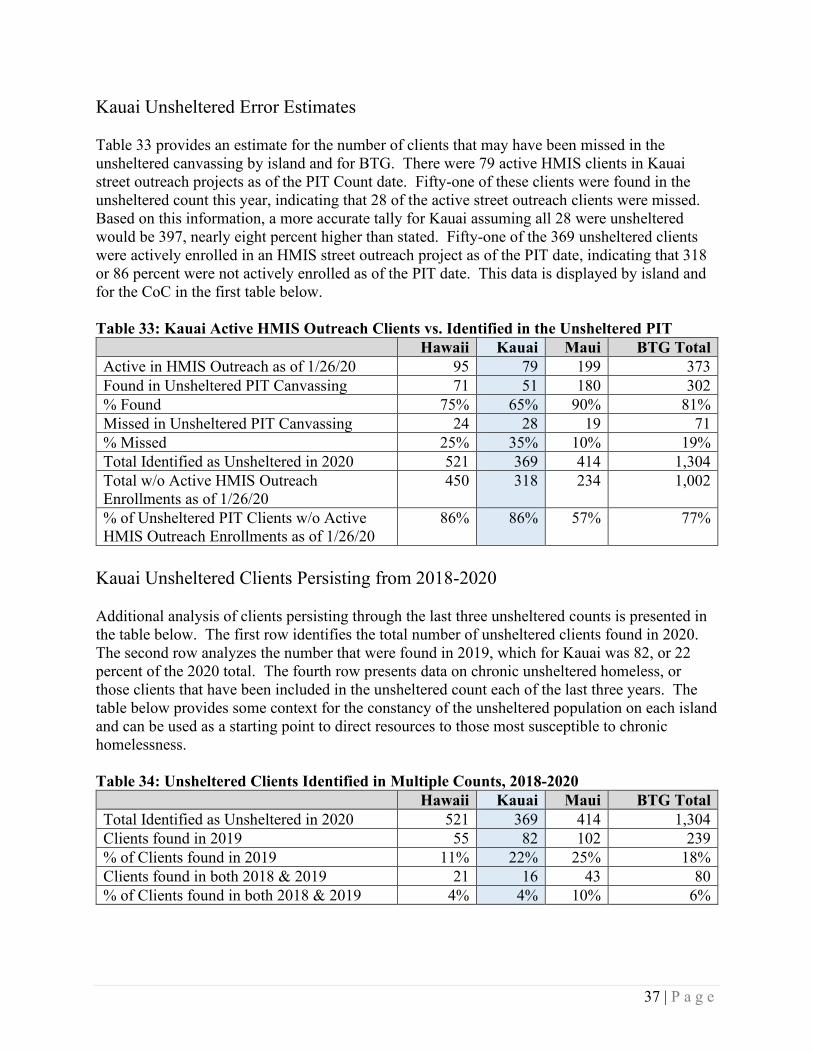
Hawaii Unsheltered Error Estimates Table 22 provides an estimate for the number of clients that may have been missed in the unsheltered canvassing by island and for BTG. There were 95 active HMIS clients in Hawaii street outreach projects as of the PIT Count date. Seventy-one of these clients were found in the unsheltered count this year, implying that 24 of the active street outreach clients were missed. Based on this information, a more accurate tally for Hawaii assuming all 24 were unsheltered would be 545, nearly five percent higher than stated. Seventy-one of the 521 unsheltered clients were actively enrolled in an HMIS street outreach project as of the PIT date, implying that 450 or 86 percent were not actively enrolled as of the PIT date. This data is displayed by island and for the CoC in the first table below. Table 22: Hawaii Active HMIS Outreach Clients vs. Identified in the Unsheltered PIT Hawaii Kauai Maui BTG Total Active in HMIS Outreach as of 1/26/20 95 79 199 373 Found in Unsheltered PIT Canvassing 71 51 180 302 % Found 75% 65% 90% 81% Missed in Unsheltered PIT Canvassing 24 28 19 71 % Missed 25% 35% 10% 19% Total Identified as Unsheltered in 2020 521 369 414 1,304 Total w/o Active HMIS Outreach Enrollments as of 1/26/20
450 318 234 1,002
% of Unsheltered PIT Clients w/o Active HMIS Outreach Enrollments as of 1/26/20
86% 86% 57% 77%
Hawaii Unsheltered Clients Persisting from 2018-2020 Additional analysis of clients persisting through the last three unsheltered counts is presented in the table below. The first row identifies the total number of unsheltered clients found in 2020. The second row analyzes the number that were found in 2019, which for Hawaii was 55, or 11 percent of the 2020 total. The fourth row presents data on chronic unsheltered homeless, or those clients that have been included in the unsheltered count each of the last three years. The table below provides some context for the constancy of the unsheltered population on each island and can be used as a starting point to direct resources to those most susceptible to chronic homelessness. Table 23: Unsheltered Clients Identified in Multiple Counts, 2018-2020 Hawaii Kauai Maui BTG Total Total Identified as Unsheltered in 2020 521 369 414 1,304 Clients found in 2019 55 82 102 239 % of Clients found in 2019 11% 22% 25% 18% Clients found in both 2018 & 2019 21 16 43 80 % of Clients found in both 2018 & 2019 4% 4% 10% 6%

30 | P a g e
Kauai Summary Table 24 and Figure 19 displays the five-year trends in sheltered, unsheltered, and total homelessness for the island of Kauai. In 2020, the proportion of unsheltered homeless rose considerably compared to the results in 2019. Kauai realized a 21 person increase in unsheltered homelessness, up six percent relative to 2019, from 348 to 369 unsheltered persons. Sheltered homelessness declined by 40 persons, from 95 in 2019 to 55 in 2020, which represents a year to year decrease of 42 percent. Due to the considerable drop in sheltered homelessness, the overall homeless count declined by four percent, from 443 persons in 2019 to 424 in 2020. Table 24: Kauai Summary, 2016-2020 Sheltered Unsheltered Kauai Total # % # % # 2020 55 13.0% 369 87.0% 424 2019 95 21.4% 348 78.6% 443 2018 106 36.2% 187 63.8% 293 2017 115 27.9% 297 72.1% 412 2016 91 20.6% 351 79.4% 442
Figure 19 shows the Kauai trends data and the decreases in sheltered and total homelessness compared to 2019. Sheltered homelessness was the lowest it has been over the five-year period. Unsheltered homelessness increased to the highest that it has been over the five-year period, also trending in the wrong direction.
91 115 106 9555
351297
187
348 369
442412
293
443 424
0
100
200
300
400
500
2016 2017 2018 2019 2020
Figure 19 - Kauai Summary, 2016-2020
Sheltered Unsheltered Total
31 | P a g e
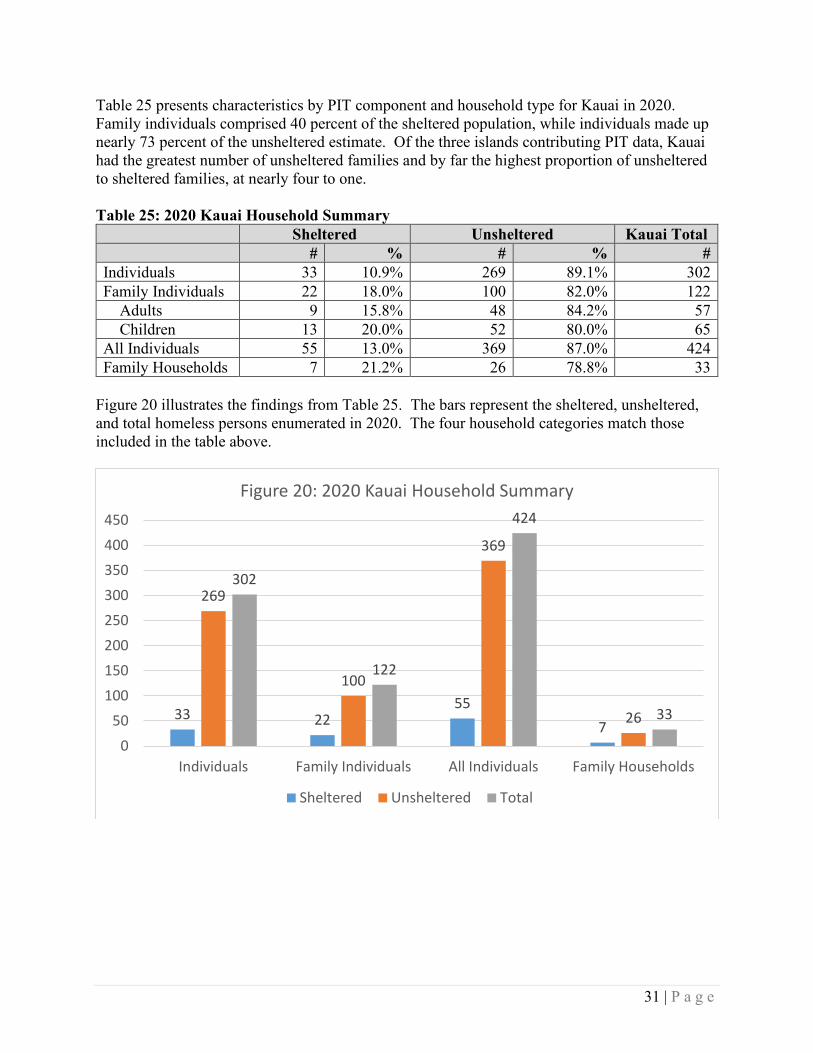
Table 25 presents characteristics by PIT component and household type for Kauai in 2020. Family individuals comprised 40 percent of the sheltered population, while individuals made up nearly 73 percent of the unsheltered estimate. Of the three islands contributing PIT data, Kauai had the greatest number of unsheltered families and by far the highest proportion of unsheltered to sheltered families, at nearly four to one. Table 25: 2020 Kauai Household Summary Sheltered Unsheltered Kauai Total # % # % # Individuals 33 10.9% 269 89.1% 302 Family Individuals 22 18.0% 100 82.0% 122
Adults 9 15.8% 48 84.2% 57 Children 13 20.0% 52 80.0% 65
All Individuals 55 13.0% 369 87.0% 424 Family Households 7 21.2% 26 78.8% 33
Figure 20 illustrates the findings from Table 25. The bars represent the sheltered, unsheltered, and total homeless persons enumerated in 2020. The four household categories match those included in the table above.
33 2255
7
269
100
369
26
302
122
424
33
050
100150200250300350400450
Individuals Family Individuals All Individuals Family Households
Figure 20: 2020 Kauai Household Summary
Sheltered Unsheltered Total

32 | P a g e
Tables 26 through 28 summarize the Kauai results over the last five years. Figure 21 illustrates the trends data presented in Tables 26 through 28. Table 26: Kauai Individuals, 2016-2020 Sheltered Unsheltered Kauai Total # % # % # 2020 33 10.9% 269 89.1% 302 2019 46 13.9% 286 86.1% 332 2018 43 24.7% 131 75.3% 174 2017 33 13.3% 216 86.7% 249 2016 27 9.9% 246 90.1% 273
Table 27: Kauai Family Individuals, 2016-2020 Sheltered Unsheltered Kauai Total # % # % # 2020 22 18.0% 100 82.0% 122 2019 49 44.1% 62 55.9% 111 2018 63 52.9% 56 47.1% 119 2017 82 50.3% 81 49.7% 163 2016 64 37.9% 105 62.1% 169
Table 28: Kauai Family Households, 2016-2020 Sheltered Unsheltered Kauai Total # % # % # 2020 7 21.2% 26 78.8% 33 2019 14 43.8% 18 56.3% 32 2018 18 60.0% 12 40.0% 30 2017 19 50.0% 19 50.0% 38 2016 18 46.2% 21 53.8% 39
273249
174
332302
169 163119 111 122
39 38 30 32 33
0
50
100
150
200
250
300
350
2016 2017 2018 2019 2020
Figure 21: Kauai Individuals and Family Households, 2016-2020
Ind
Fam Ind
Fam HHs

33 | P a g e
Kauai Homeless Subpopulations Kauai was required to collect information on specific homeless subpopulations in 2020. These subpopulations and the data for Kauai are outlined in Tables 29 through 31. The data presented aligns with HUD reporting specifications. Chronic Homelessness Table 29 displays the 2020 self-reported chronically homeless estimates for the island of Kauai. In total, there were seven chronically homeless persons in Kauai’s emergency shelters, including three chronic individuals and four chronic persons in families. Persons in transitional housing facilities are not counted as chronically homeless for the purposes of the PIT reporting. Among the unsheltered population there were a total of 137 chronically homeless persons, including 131 chronic individuals and 6 persons in CH families. Two of the 26 total unsheltered families (8%) reported as chronically homeless. Table 29: Kauai Chronically Homeless, 2020 Emergency Shelter Unsheltered Total CH Individuals 3 131 134 CH Families 1 2 3 Persons in CH Families
4 6 10
Figures 22 and 23 illustrate the proportion of Kauai’s homeless individuals living in emergency shelters and in places not meant for human habitation that were reported as chronically homeless this year. Individuals residing in emergency shelters numbered 19 on the night of the count, with 16 percent presenting as chronically homeless. Individuals residing in places not meant for human habitation totaled 269, with just under half (49%) reporting as chronically homeless. This represents a four percent increase over 2019 when the ratio was 130 unsheltered chronic individuals to 286 total unsheltered individuals (45%)
3
16
Figure 22: Kauai ES CH Individuals
Kauai ES CH Ind Kauai ES Non-CH Ind
131138
Figure 23: Kauai Unsheltered CH Individuals
Kauai Unshltd CH Ind Kauai Unshltd Non-CH Ind

34 | P a g e
Veteran Homelessness Table 30 and Figure 24 present the homeless veteran data that was collected for Kauai in 2020 and over the last five years, respectively. The total number of veterans decreased by three (-12%) compared to 2019, from 26 total veterans to 23 who were identified in this year’s count. Three of the 23 veterans (13%) resided in sheltered programs, while the number of unsheltered veterans remained unchanged, compared to the 20 counted last year. The 20 unsheltered veterans comprised 87 percent of the 23 total veterans identified this year. There were zero homeless veteran families identified on Kauai this year. Table 30: Kauai Homeless Veterans, 2020 Emergency Transitional Unsheltered Total Total Veterans 3 0 20 23 Veteran Families 0 0 0 0
Persons in Veteran Families 0 0 0 0
8
1
7 63
31
16
7
20 20
39
1714
2623
0
5
10
15
20
25
30
35
40
45
2016 2017 2018 2019 2020
Figure 24 - Kauai Homeless Veterans, 2016-2020
Sheltered
Unsheltered
Total

35 | P a g e
Additional Homeless Populations Table 31 highlights additional subpopulation data for the island of Kauai. As indicated in the table header, the SMI, Substance Use, HIV/AIDS, and DV data applies only to adults within the sheltered and unsheltered counts. This year there were 23 adults in ES projects, 19 adults in TH, and 317 unsheltered adults. Table 31: Kauai Adult Homeless Subpopulations, 2020 Emergency Transitional Unsheltered Total Serious Mental Illness 7 4 82 93 Substance Use Disorder 5 10 87 102 HIV/AIDS 0 0 2 2 Fleeing DV (Optional) 7 0 NA 7
Figure 25 presents the Chronically Homeless, Veteran, SMI, and Substance Use data from Tables 29, 30, and 31 above. The data are grouped by project type, and then totaled in the far-right group of the figure.
3 0
131 134
3 0
20 23
7 4
8293
5 10
87
102
0
20
40
60
80
100
120
140
160
ES TH Unsheltered Total
Figure 25: Kauai Homeless Subpopulations
Chronic Individuals Veterans Serious Mental Illness Substance Use Disorder

36 | P a g e
Kauai Unsheltered Homelessness Table 32 outlines the unsheltered homelessness by region for the island of Kauai in 2020. Appendix 4 provides a map of Kauai showing how each of the five regions were partitioned. A total of 369 total persons were counted in 2020, up six percent from the 348 accounted for in 2019. Of the 369 total persons, 269 (73%) were individuals, while 100 were members of families. There were 26 families counted this year, up eight from one year prior. Figure 26 displays the unsheltered regional data by type of individual. Based on this data, 87 percent (233) of the individuals recorded sleeping in either the West, South Central, or East regions. Eighty-five percent of the family individuals slept in either the West or South Central regions. GIS analysis completed this year provides much greater geolocation detail based on the site of interview for the 369 clients included in the final unsheltered count and can be accessed from the website provided on page 10. Table 32: Kauai Unsheltered Homelessness by Region
Individuals Family Individuals
All Individuals
Family Households
Zone # % # % # % # % 1: West 62 23.0% 53 53.0% 115 31.2% 13 50.0% 2: South 5 1.9% 0 0.0% 5 1.4% 0 0.0% 3: South Central 107 39.8% 32 32.0% 139 37.7% 9 34.6% 4: East 64 23.8% 6 6.0% 70 19.0% 2 7.7% 5: North 31 11.5% 9 9.0% 40 10.8% 2 7.7% Total 269 100.0% 100 100.0% 369 100.0% 26 100.0%
Figure 26 presents the data from Table 32.
6253
115
5 0 5
107
32
139
64
6
70
31
9
40
0
20
40
60
80
100
120
140
160
Individuals Family Individuals All Individuals
Figure 26: Kauai Unsheltered by Region
1: West
2: South
3: South Central
4: East
5: North
37 | P a g e
Kauai Unsheltered Error Estimates Table 33 provides an estimate for the number of clients that may have been missed in the unsheltered canvassing by island and for BTG. There were 79 active HMIS clients in Kauai street outreach projects as of the PIT Count date. Fifty-one of these clients were found in the unsheltered count this year, indicating that 28 of the active street outreach clients were missed. Based on this information, a more accurate tally for Kauai assuming all 28 were unsheltered would be 397, nearly eight percent higher than stated. Fifty-one of the 369 unsheltered clients were actively enrolled in an HMIS street outreach project as of the PIT date, indicating that 318 or 86 percent were not actively enrolled as of the PIT date. This data is displayed by island and for the CoC in the first table below. Table 33: Kauai Active HMIS Outreach Clients vs. Identified in the Unsheltered PIT Hawaii Kauai Maui BTG Total Active in HMIS Outreach as of 1/26/20 95 79 199 373 Found in Unsheltered PIT Canvassing 71 51 180 302 % Found 75% 65% 90% 81% Missed in Unsheltered PIT Canvassing 24 28 19 71 % Missed 25% 35% 10% 19% Total Identified as Unsheltered in 2020 521 369 414 1,304 Total w/o Active HMIS Outreach Enrollments as of 1/26/20
450 318 234 1,002
% of Unsheltered PIT Clients w/o Active HMIS Outreach Enrollments as of 1/26/20
86% 86% 57% 77%
Kauai Unsheltered Clients Persisting from 2018-2020 Additional analysis of clients persisting through the last three unsheltered counts is presented in the table below. The first row identifies the total number of unsheltered clients found in 2020. The second row analyzes the number that were found in 2019, which for Kauai was 82, or 22 percent of the 2020 total. The fourth row presents data on chronic unsheltered homeless, or those clients that have been included in the unsheltered count each of the last three years. The table below provides some context for the constancy of the unsheltered population on each island and can be used as a starting point to direct resources to those most susceptible to chronic homelessness. Table 34: Unsheltered Clients Identified in Multiple Counts, 2018-2020 Hawaii Kauai Maui BTG Total Total Identified as Unsheltered in 2020 521 369 414 1,304 Clients found in 2019 55 82 102 239 % of Clients found in 2019 11% 22% 25% 18% Clients found in both 2018 & 2019 21 16 43 80 % of Clients found in both 2018 & 2019 4% 4% 10% 6%

38 | P a g e
Maui Summary Table 35 and Figure 27 displays the five-year trends in sheltered, unsheltered, and total homelessness for the island of Maui. For 2020, the proportion of unsheltered homeless remained consistent with prior results, however, total homelessness on island declined by eight percent to 789 in 2020 from 862 in 2019. The decrease was fueled by declines in both sheltered and unsheltered homelessness. Sheltered homelessness was down by 45 people, from 420 in 2019 to 375 in 2020. Unsheltered homelessness saw a reduction of 28 people, from 442 in 2019 to 414 in 2020. Table 35: Maui Summary, 2016-2020 Sheltered Unsheltered Maui Total
# % # % # 2020 375 47.5% 414 52.5% 789 2019 420 48.7% 442 51.3% 862 2018 399 45.7% 474 54.3% 873 2017 395 44.1% 501 55.9% 896 2016 484 42.3% 661 57.7% 1,145
Figure 27 shows the Maui trends data and the decreases in sheltered, unsheltered and total homelessness compared to 2019. Unsheltered and total homelessness have declined annually each of the last four years. There was an 11 percent drop in sheltered homelessness relative to 2019, attributable in large part to a 19 percent (15 families) reduction in sheltered families to 64. Unsheltered homelessness declined by six percent, led by a 56-person decrease in the level of unsheltered individuals. Unsheltered families increased in 2020 by eight households to 19, including 68 individual household members, compared to 11 unsheltered households consisting of 40 individuals in 2019.
484395 399 420 375
661
501 474 442 414
1,145
896 873 862789
250
450
650
850
1,050
1,250
2016 2017 2018 2019 2020
Figure 27 - Maui Summary, 2016-2020
Sheltered Unsheltered Total
39 | P a g e
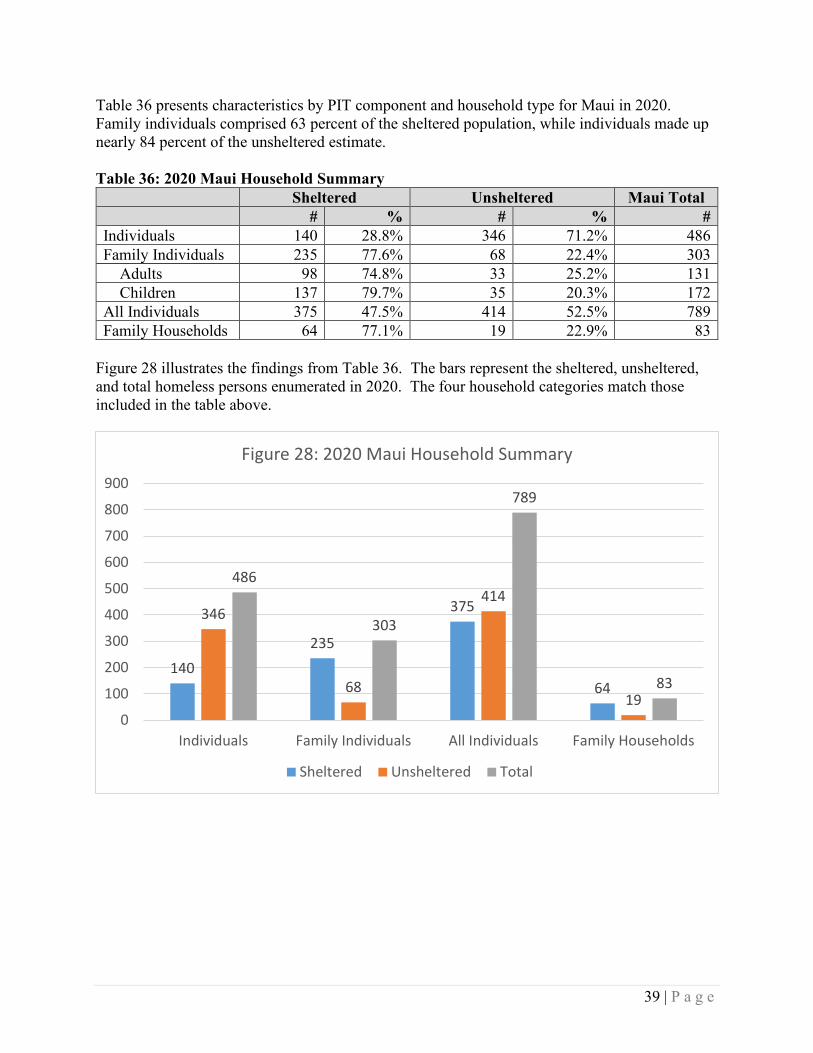
Table 36 presents characteristics by PIT component and household type for Maui in 2020. Family individuals comprised 63 percent of the sheltered population, while individuals made up nearly 84 percent of the unsheltered estimate. Table 36: 2020 Maui Household Summary Sheltered Unsheltered Maui Total # % # % # Individuals 140 28.8% 346 71.2% 486 Family Individuals 235 77.6% 68 22.4% 303
Adults 98 74.8% 33 25.2% 131 Children 137 79.7% 35 20.3% 172
All Individuals 375 47.5% 414 52.5% 789 Family Households 64 77.1% 19 22.9% 83
Figure 28 illustrates the findings from Table 36. The bars represent the sheltered, unsheltered, and total homeless persons enumerated in 2020. The four household categories match those included in the table above.
140235
375
64
346
68
414
19
486
303
789
83
0
100
200
300
400
500
600
700
800
900
Individuals Family Individuals All Individuals Family Households
Figure 28: 2020 Maui Household Summary
Sheltered Unsheltered Total
40 | P a g e
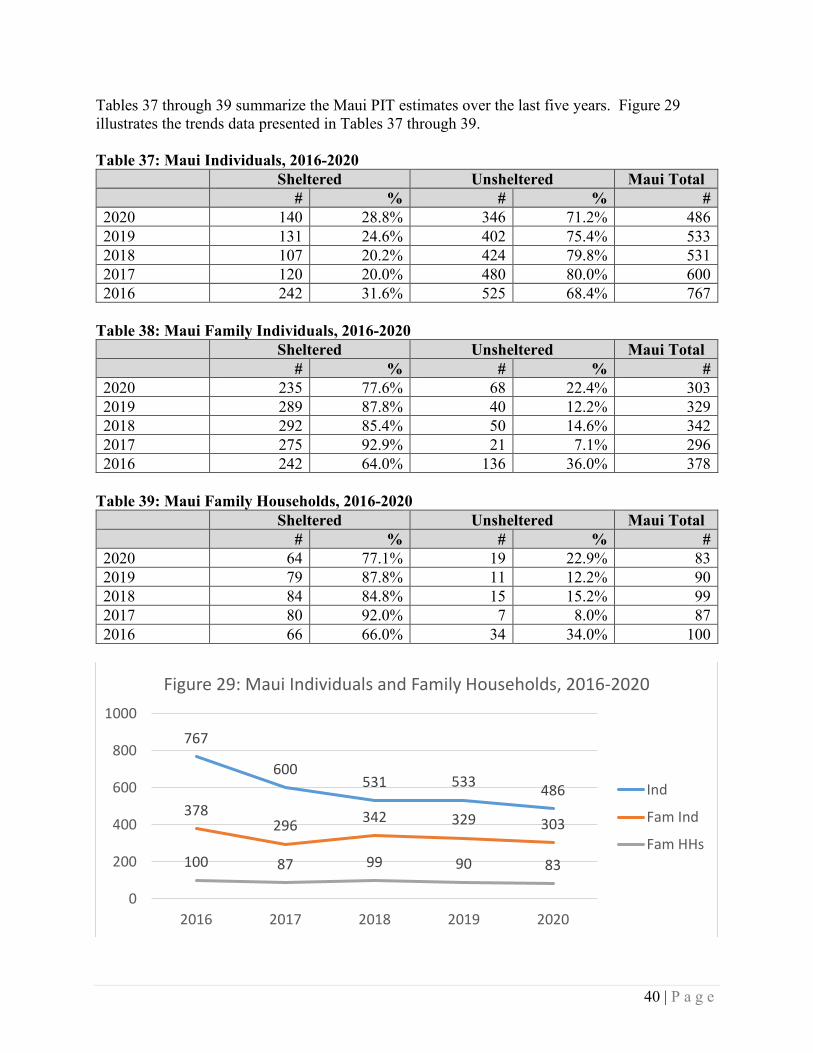
Tables 37 through 39 summarize the Maui PIT estimates over the last five years. Figure 29 illustrates the trends data presented in Tables 37 through 39. Table 37: Maui Individuals, 2016-2020 Sheltered Unsheltered Maui Total # % # % # 2020 140 28.8% 346 71.2% 486 2019 131 24.6% 402 75.4% 533 2018 107 20.2% 424 79.8% 531 2017 120 20.0% 480 80.0% 600 2016 242 31.6% 525 68.4% 767
Table 38: Maui Family Individuals, 2016-2020 Sheltered Unsheltered Maui Total # % # % # 2020 235 77.6% 68 22.4% 303 2019 289 87.8% 40 12.2% 329 2018 292 85.4% 50 14.6% 342 2017 275 92.9% 21 7.1% 296 2016 242 64.0% 136 36.0% 378
Table 39: Maui Family Households, 2016-2020 Sheltered Unsheltered Maui Total # % # % # 2020 64 77.1% 19 22.9% 83 2019 79 87.8% 11 12.2% 90 2018 84 84.8% 15 15.2% 99 2017 80 92.0% 7 8.0% 87 2016 66 66.0% 34 34.0% 100
767
600531 533 486
378296 342 329 303
100 87 99 90 83
0
200
400
600
800
1000
2016 2017 2018 2019 2020
Figure 29: Maui Individuals and Family Households, 2016-2020
Ind
Fam Ind
Fam HHs

41 | P a g e
Maui Homeless Subpopulations Maui was required to collect information on specific homeless subpopulations in 2020. These subpopulations and the data for Maui are outlined in Tables 40 through 42. The data presented aligns with HUD reporting specifications. Chronic Homelessness Table 40 displays the 2020 self-reported chronically homeless estimates for the island of Maui. In total, there were 46 chronically homeless persons in Maui’s emergency shelters, including 27 chronic individuals and 19 chronic persons in families. Persons in transitional housing facilities are not counted as chronically homeless for the purposes of the PIT reporting. Among the unsheltered population there were a total of 213 chronically homeless persons, with three of the 19 families (16%) reporting as chronically homeless. Table 40: Maui Chronically Homeless, 2020 Emergency Shelter Unsheltered Total CH Individuals 27 203 230 CH Families 5 3 8 Persons in CH Families
19 10 29
Figures 30 and 31 illustrate the proportion of Maui’s homeless individuals living in emergency shelters and in places not meant for human habitation that were reported as chronically homeless this year. Individuals residing in emergency shelters numbered 104 on the night of the count, with roughly one quarter presenting as chronically homeless. Individuals residing in places not meant for human habitation totaled 346, with 59 percent reporting as chronically homeless. This represents a three percent increase over 2019 when the ratio was 225 unsheltered chronic individuals to 402 total unsheltered individuals (56%).
27
77
Figure 30: Maui ES CH Individuals
Maui ES CH Ind Maui ES Non-CH Ind
203
143
Figure 31: Maui Unsheltered CH Individuals
Maui Unshltd CH Ind Maui Unshltd Non-CH Ind

42 | P a g e
Veteran Homelessness Table 41 and Figure 32 present the homeless veteran data that was collected for Maui in 2020 and over the last five years, respectively. The total number of veterans increased by two (4%) compared to 2019, from 46 total veterans to 48 total veterans identified in this year’s count. Compared to 2019, three additional veterans resided in sheltered programs, while the number of unsheltered veterans declined slightly by one veteran, compared to the 35 counted last year. Seventy-one percent of the veterans identified this year were unsheltered. In the table below, the total veterans (48) includes the one veteran presenting within a family household. Table 41: Maui Homeless Veterans, 2020 Emergency Transitional Unsheltered Total Total Veterans 13 1 34 48 Veteran Families 0 1 0 1
Persons in Veteran Families 0 2 0 2
2414
9 11 14
8170
53
35 34
105
84
62
46 48
0
20
40
60
80
100
120
2016 2017 2018 2019 2020
Figure 32 - Maui Homeless Veterans, 2016-2020
Sheltered Unsheltered Total

43 | P a g e
Additional Homeless Populations Table 42 highlights additional subpopulation data for the island of Maui. As indicated in the table header, the SMI, Substance Use, HIV/AIDS, and DV data applies only to adults within the sheltered and unsheltered counts. This year there were 143 adults in ES projects, 95 adults in TH, and 379 unsheltered adults. Table 42: Maui Adult Homeless Subpopulations, 2020 Emergency Transitional Unsheltered Total Serious Mental Illness 47 6 164 217 Substance Use Disorder 23 4 149 176 HIV/AIDS 0 0 7 7 Fleeing DV (Optional in 2020) 19 1 NA 20
Figure 33 presents the Chronically Homeless, Veteran, SMI, and Substance Use data from Tables 40, 41, and 42 above. The data are grouped by project type, and then totaled in the far-right group of the figure.
27
0
203
230
131
344847
6
164
217
234
149
176
0
50
100
150
200
250
ES TH Unsheltered Total
Figure 33: Maui Homeless Subpopulations
Chronic Individuals Veterans Serious Mental Illness Substance Use Disorder

44 | P a g e
Maui Unsheltered Homelessness Table 43 outlines the unsheltered homelessness by region for the island of Maui in 2020. Appendix 4 provides a map of Maui showing how each of the six regions were partitioned. A total of 414 total persons were counted in 2020, down six percent from the 442 accounted for in 2019. Of the 414 total persons, 346 (84%) were individuals, while 68 were members of families. There were 19 families found this year, up eight from one year prior. Figure 34 displays the unsheltered regional data by type of individual. Based on this data, 84 percent (292) of the individuals recorded sleeping in either the Central Maui, Lahaina, or Kihei regions. Sixty-six percent of the family individuals slept in either the Central Maui or Lower Waiehu regions. GIS analysis completed this year provides much greater geolocation detail based on the site of interview for the 414 clients included in the final unsheltered count and can be accessed from the website provided on page 10. Table 43: Maui Unsheltered Homelessness by Region
Individuals Family Individuals
All Individuals
Family Households
Region # % # % # % # % 1: Central Maui 144 41.6% 30 44.1% 174 42.0% 9 47.4% 2: Lower Waiehu 20 5.8% 15 22.1% 35 8.5% 3 15.8% 3: Up Country 34 9.8% 0 0.0% 34 8.2% 0 0.0% 4: Lahaina 73 21.1% 12 17.6% 85 20.5% 4 21.1% 5: Kihei 75 21.7% 11 16.2% 86 20.8% 3 15.8% 6: Hana 0 0.0% 0 0.0% 0 0.0% 0 0.0% Total 346 100.0% 68 100.0% 414 100.0% 19 100.0%
Figure 34 presents the data from Table 43.
144
30
174
20 15
3534
0
34
73
12
8575
11
86
0 0 00
20
40
60
80
100
120
140
160
180
200
Individuals Family Individuals All Individuals
Figure 34: Maui Unsheltered by Region
1: Central Maui
2: Lower Waiehu
3: Up Country
4: Lahaina
5: Kihei
6: Hana
45 | P a g e
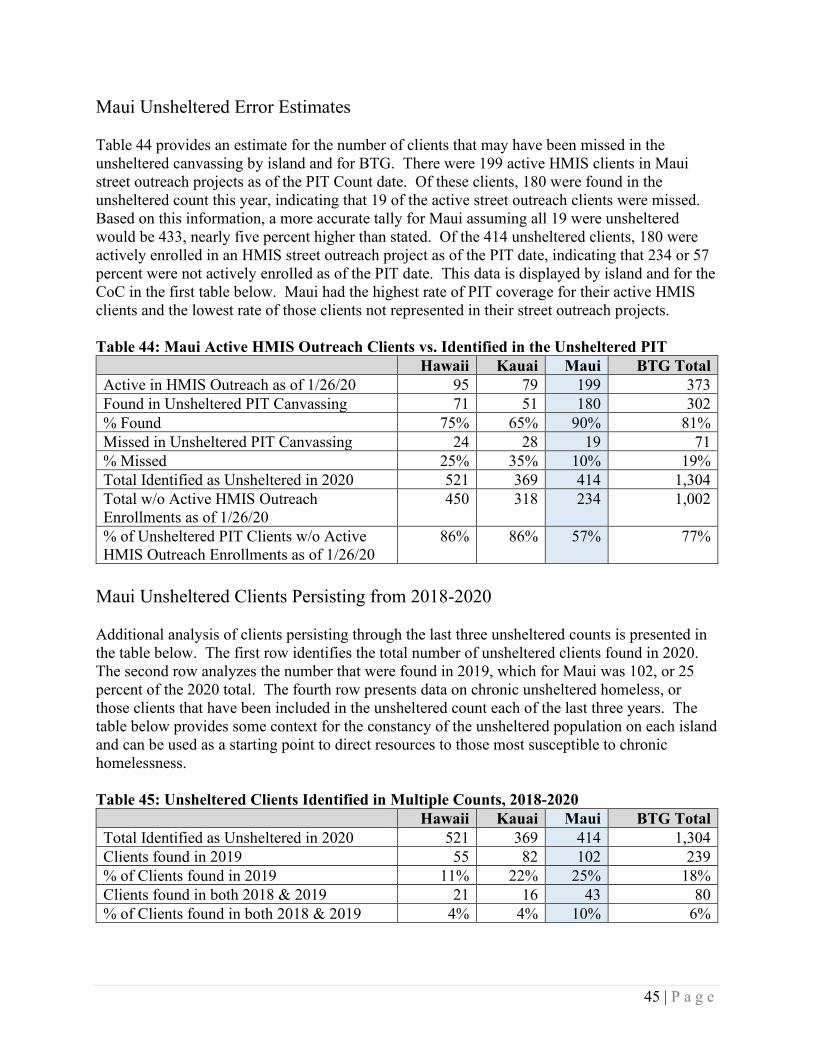
Maui Unsheltered Error Estimates Table 44 provides an estimate for the number of clients that may have been missed in the unsheltered canvassing by island and for BTG. There were 199 active HMIS clients in Maui street outreach projects as of the PIT Count date. Of these clients, 180 were found in the unsheltered count this year, indicating that 19 of the active street outreach clients were missed. Based on this information, a more accurate tally for Maui assuming all 19 were unsheltered would be 433, nearly five percent higher than stated. Of the 414 unsheltered clients, 180 were actively enrolled in an HMIS street outreach project as of the PIT date, indicating that 234 or 57 percent were not actively enrolled as of the PIT date. This data is displayed by island and for the CoC in the first table below. Maui had the highest rate of PIT coverage for their active HMIS clients and the lowest rate of those clients not represented in their street outreach projects. Table 44: Maui Active HMIS Outreach Clients vs. Identified in the Unsheltered PIT Hawaii Kauai Maui BTG Total Active in HMIS Outreach as of 1/26/20 95 79 199 373 Found in Unsheltered PIT Canvassing 71 51 180 302 % Found 75% 65% 90% 81% Missed in Unsheltered PIT Canvassing 24 28 19 71 % Missed 25% 35% 10% 19% Total Identified as Unsheltered in 2020 521 369 414 1,304 Total w/o Active HMIS Outreach Enrollments as of 1/26/20
450 318 234 1,002
% of Unsheltered PIT Clients w/o Active HMIS Outreach Enrollments as of 1/26/20
86% 86% 57% 77%
Maui Unsheltered Clients Persisting from 2018-2020 Additional analysis of clients persisting through the last three unsheltered counts is presented in the table below. The first row identifies the total number of unsheltered clients found in 2020. The second row analyzes the number that were found in 2019, which for Maui was 102, or 25 percent of the 2020 total. The fourth row presents data on chronic unsheltered homeless, or those clients that have been included in the unsheltered count each of the last three years. The table below provides some context for the constancy of the unsheltered population on each island and can be used as a starting point to direct resources to those most susceptible to chronic homelessness. Table 45: Unsheltered Clients Identified in Multiple Counts, 2018-2020 Hawaii Kauai Maui BTG Total Total Identified as Unsheltered in 2020 521 369 414 1,304 Clients found in 2019 55 82 102 239 % of Clients found in 2019 11% 22% 25% 18% Clients found in both 2018 & 2019 21 16 43 80 % of Clients found in both 2018 & 2019 4% 4% 10% 6%
46 | P a g e
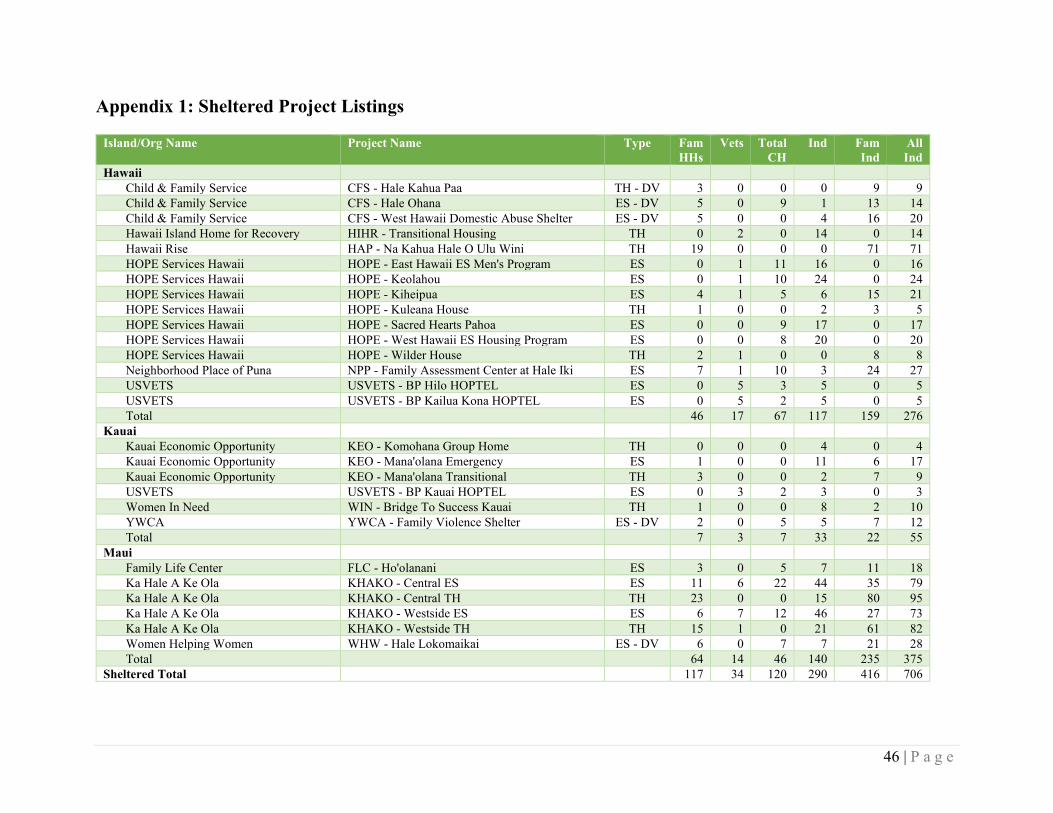
Appendix 1: Sheltered Project Listings
Island/Org Name Project Name Type Fam HHs
Vets Total CH
Ind Fam Ind
All Ind
Hawaii
Child & Family Service CFS - Hale Kahua Paa TH - DV 3 0 0 0 9 9 Child & Family Service CFS - Hale Ohana ES - DV 5 0 9 1 13 14 Child & Family Service CFS - West Hawaii Domestic Abuse Shelter ES - DV 5 0 0 4 16 20 Hawaii Island Home for Recovery HIHR - Transitional Housing TH 0 2 0 14 0 14 Hawaii Rise HAP - Na Kahua Hale O Ulu Wini TH 19 0 0 0 71 71 HOPE Services Hawaii HOPE - East Hawaii ES Men's Program ES 0 1 11 16 0 16 HOPE Services Hawaii HOPE - Keolahou ES 0 1 10 24 0 24 HOPE Services Hawaii HOPE - Kiheipua ES 4 1 5 6 15 21 HOPE Services Hawaii HOPE - Kuleana House TH 1 0 0 2 3 5 HOPE Services Hawaii HOPE - Sacred Hearts Pahoa ES 0 0 9 17 0 17 HOPE Services Hawaii HOPE - West Hawaii ES Housing Program ES 0 0 8 20 0 20 HOPE Services Hawaii HOPE - Wilder House TH 2 1 0 0 8 8 Neighborhood Place of Puna NPP - Family Assessment Center at Hale Iki ES 7 1 10 3 24 27 USVETS USVETS - BP Hilo HOPTEL ES 0 5 3 5 0 5 USVETS USVETS - BP Kailua Kona HOPTEL ES 0 5 2 5 0 5 Total
46 17 67 117 159 276
Kauai
Kauai Economic Opportunity KEO - Komohana Group Home TH 0 0 0 4 0 4 Kauai Economic Opportunity KEO - Mana'olana Emergency ES 1 0 0 11 6 17 Kauai Economic Opportunity KEO - Mana'olana Transitional TH 3 0 0 2 7 9 USVETS USVETS - BP Kauai HOPTEL ES 0 3 2 3 0 3 Women In Need WIN - Bridge To Success Kauai TH 1 0 0 8 2 10 YWCA YWCA - Family Violence Shelter ES - DV 2 0 5 5 7 12 Total
7 3 7 33 22 55
Maui
Family Life Center FLC - Ho'olanani ES 3 0 5 7 11 18 Ka Hale A Ke Ola KHAKO - Central ES ES 11 6 22 44 35 79 Ka Hale A Ke Ola KHAKO - Central TH TH 23 0 0 15 80 95 Ka Hale A Ke Ola KHAKO - Westside ES ES 6 7 12 46 27 73 Ka Hale A Ke Ola KHAKO - Westside TH TH 15 1 0 21 61 82 Women Helping Women WHW - Hale Lokomaikai ES - DV 6 0 7 7 21 28 Total
64 14 46 140 235 375
Sheltered Total
117 34 120 290 416 706

47 | P a g e
Appendix 2: LOS for Active PIT Clients in HMIS Sheltered ES, TH Projects Project Name Island Project Type N= Mean Median Min Max Hawaii
HOPE - Sacred Hearts Pahoa Hawaii ES 17 217 159 2 537 HOPE - West Hawaii Emergency Housing Program Hawaii ES 20 181 185 34 321 HOPE - Kiheipua Hawaii ES 21 130 108 31 311 NPP - Family Assessment Center at Hale Iki Hawaii ES 27 119 108 15 225 USVETS - BP Kailua Kona HOPTEL Hawaii ES 5 94 83 18 151 USVETS - BP Hilo HOPTEL Hawaii ES 5 73 75 2 131 HOPE - East Hawaii Emergency Men’s Program Hawaii ES 16 56 42 2 150 HOPE - Keolahou Hawaii ES 24 56 59 3 104 HIHR - Transitional Housing Hawaii TH 14 414 370 9 1,678 HAP - Na Kahua Hale O Ulu Wini Hawaii TH 71 352 419 24 703 HOPE - Wilder House Hawaii TH 8 312 174 174 566 HOPE - Kuleana House Hawaii TH 5 187 187 187 188
Kauai
USVETS - BP Kauai HOPTEL Kauai ES 3 77 68 46 118 KEO - Mana'olana Emergency Kauai ES 17 70 71 9 335 WIN - Bridge To Success Kauai Kauai TH 10 380 358 138 709 KEO - Mana'olana Transitional Kauai TH 9 143 65 4 312 KEO - Komohana Group Home Kauai TH 4 109 107 20 202
Maui
KHAKO - Westside ES Maui ES 73 129 47 4 450 KHAKO - Central ES Maui ES 79 104 89 2 317 FLC - Ho'olanani Maui ES 18 59 23 5 195 KHAKO - Westside TH Maui TH 82 159 135 6 643 KHAKO - Central TH Maui TH 95 129 116 3 320

48 | P a g e
Appendix 3: Unsheltered Regional Summary Island/Region Name Total
Veterans Total
CH Persons Individuals Family
Individuals Total
Persons Hawaii
1. North Kohala 0 0 0 0 0 2. Hamakua 2 7 19 0 19 3. North Hilo 0 0 1 3 4 4. South Hilo 15 102 185 21 206 5. Puna 5 46 66 14 80 6. Ka`u 2 2 11 15 26 7. South Kona 0 1 1 5 6 8. North Kona 19 70 132 27 159 9. South Kohala 1 11 21 0 21 Total 44 239 436 85 521
Kauai
1. West 5 32 62 53 115 2. South 0 2 5 0 5 3. South Central 9 63 107 32 139 4. East 5 31 64 6 70 5. North 1 9 31 9 40 Total 20 137 269 100 369
Maui
1. Central Maui 14 92 144 30 174 2. Lower Waiehu 2 15 20 15 35 3. Up Country 4 14 34 0 34 4. Lahaina 6 41 73 12 85 5. Kihei 8 51 75 11 86 6. Hana 0 0 0 0 0 Total 34 213 346 68 414
Unsheltered Total 98 589 1,051 253 1,304

49 | P a g e
Appendix 4: Unsheltered Regional Maps Hawaii

50 | P a g e
Maui

51 | P a g e
Kauai

52 | P a g e
Appendix 5: HUD HDX Reporting Tables HUD HDX Table 1 HI-500 Homeless Populations Households with At Least One Adult & One Child (Families) Persons in Households with at least one Adult and one Child
Sheltered Unsheltered Total Emergency Transitional Total # of households 50 67 67 184 Total # of Persons (Adults & Children) 175 241 253 669
# of Persons (under age 18) 102 131 136 369 # of Persons (18-24) 15 21 16 52 # of Persons (over age 24) 58 89 101 248
Gender (adults and children)
Sheltered Unsheltered Total Emergency Transitional Female 115 127 140 382 Male 60 114 113 287 Transgender 0 0 0 0 Gender Non-Conforming 0 0 0 0
Ethnicity (adults and children)
Sheltered Unsheltered Total Emergency Transitional Non-Hispanic/Non-Latino 149 202 215 566 Hispanic/Latino 26 39 38 103
Race (adults and children)
Sheltered Unsheltered Total Emergency Transitional White 32 26 29 87 Black or African American 1 4 9 14 Asian 2 10 16 28 American Indian or Alaska Native 6 0 6 12 Native Hawaiian or Other Pacific Islander 67 101 108 276 Multiple Races 67 100 85 252
Chronically Homeless
Sheltered Unsheltered Total Emergency Transitional Total # of households 13 NA 11 24 Total # of persons 44 NA 34 78

53 | P a g e
HUD HDX Table 2 HI-500 Homeless Populations Households with only Children Persons in Households with only Children
Sheltered Unsheltered Total Emergency Transitional Total # of households 0 0 0 0 Total # of children (under age 18) 0 0 0 0
Gender
Sheltered Unsheltered Total Emergency Transitional Female 0 0 0 0 Male 0 0 0 0 Transgender 0 0 0 0 Gender Non-Conforming (i.e. not exclusively male or female)
0 0 0 0
Ethnicity
Sheltered Unsheltered Total Emergency Transitional Non-Hispanic/Non-Latino 0 0 0 0 Hispanic/Latino 0 0 0 0
Race
Sheltered Unsheltered Total Emergency Transitional White 0 0 0 0 Black or African American 0 0 0 0 Asian 0 0 0 0 American Indian or Alaska Native 0 0 0 0 Native Hawaiian or Other Pacific Islander 0 0 0 0 Multiple Races 0 0 0 0
Chronically Homeless
Sheltered Unsheltered Total Emergency Transitional Total # of persons 0 NA 0 0

54 | P a g e
HUD HDX Table 3 HI-500 Homeless Populations Households without Children Persons in Households without Children
Sheltered Unsheltered Total Emergency Transitional Total # of households 216 61 940 1,217 Total # of Persons (Adults) 224 66 1,051 1,341
# of Persons (age 18-24) 11 0 62 73 # of Persons (over age 24) 213 66 989 1,268
Gender
Sheltered Unsheltered Total Emergency Transitional Female 88 32 361 481 Male 136 34 683 853 Transgender 0 0 0 0 Gender Non-Conforming (i.e. not exclusively male or female)
0 0 7 7
Ethnicity
Sheltered Unsheltered Total Emergency Transitional Non-Hispanic/Non-Latino 196 52 902 1,150 Hispanic/Latino 28 14 149 191
Race
Sheltered Unsheltered Total Emergency Transitional White 104 29 424 557 Black or African American 9 2 28 39 Asian 8 6 75 89 American Indian or Alaska Native 5 0 24 29 Native Hawaiian or Other Pacific Islander 30 14 229 273 Multiple Races 68 15 271 354
Chronically Homeless
Sheltered Unsheltered Total Emergency Transitional Total # of persons 76 NA 555 631
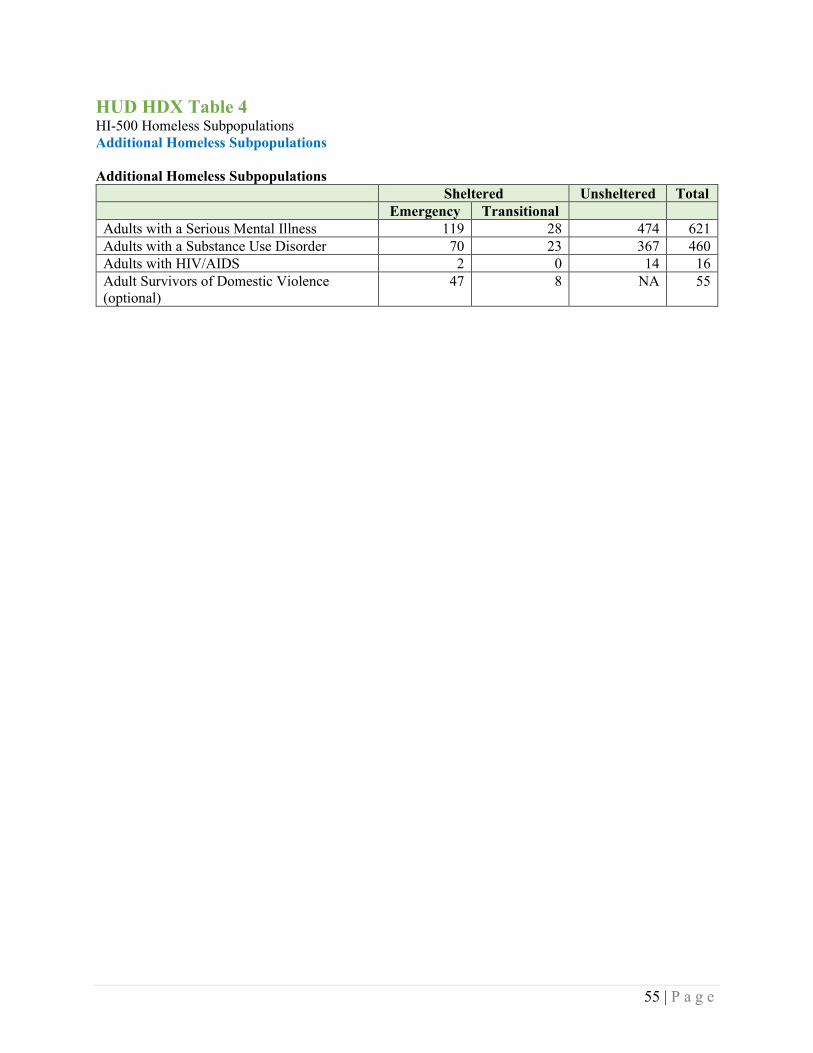
55 | P a g e
HUD HDX Table 4 HI-500 Homeless Subpopulations Additional Homeless Subpopulations Additional Homeless Subpopulations
Sheltered Unsheltered Total Emergency Transitional Adults with a Serious Mental Illness 119 28 474 621 Adults with a Substance Use Disorder 70 23 367 460 Adults with HIV/AIDS 2 0 14 16 Adult Survivors of Domestic Violence (optional)
47 8 NA 55

56 | P a g e
HUD HDX Table 5 HI-500 Youth Populations Unaccompanied Youth Households Unaccompanied Youth (UY) Households
Sheltered Unsheltered Total Emergency Transitional Total # of UY Households 11 0 51 62 Total # of UY Persons 11 0 52 63
# of unaccompanied children (under 18) 0 0 0 0 # of unaccompanied young adults (18 to 24) 11 0 52 63
Gender
Sheltered Unsheltered Total Emergency Transitional Female 4 0 21 25 Male 7 0 28 35 Transgender 0 0 0 0 Gender Non-Conforming 0 0 3 3
Ethnicity
Sheltered Unsheltered Total Emergency Transitional Non-Hispanic/Non-Latino 10 0 47 57 Hispanic/Latino 1 0 5 6
Race
Sheltered Unsheltered Total Emergency Transitional White 2 0 22 24 Black or African American 1 0 5 6 Asian 0 0 2 2 American Indian or Alaska Native 0 0 0 0 Native Hawaiian or Other Pacific Islander 5 0 10 15 Multiple Races 3 0 13 16
Chronically Homeless
Sheltered Unsheltered Total Emergency Transitional Total # of persons 0 NA 14 14

57 | P a g e
HUD HDX Table 6 HI-500 Youth Populations Parenting Youth Households Parenting Youth (PY) Households
Sheltered Unsheltered Total Emergency Transitional Total # of PY Households 5 5 4 14 Total # of persons in PY Households 16 14 11 41 Total PY (Youth Parents Only) 9 8 7 24 Total Children in PY Households 7 6 4 17
# of PY under age 18 0 0 0 0 # of children in households with parenting youth under age 18
0 0 0 0
# of PY ages 18 to 24 9 8 7 24 # of children in households with parenting youth aged 18 to 24
7 6 4 17
Gender (Youth Parents Only)
Sheltered Unsheltered Total Emergency Transitional Female 6 5 4 15 Male 3 3 3 9 Transgender 0 0 0 0 Gender Non-Conforming 0 0 0 0
Ethnicity (Youth Parents Only)
Sheltered Unsheltered Total Emergency Transitional Non-Hispanic/Non-Latino 8 7 7 22 Hispanic/Latino 1 1 0 2
Race (Youth Parents Only)
Sheltered Unsheltered Total Emergency Transitional White 2 0 1 3 Black or African American 0 0 0 0 Asian 0 0 0 0 American Indian or Alaska Native 0 0 0 0 Native Hawaiian or Other Pacific Islander 2 3 2 7 Multiple Races 5 5 4 14
Chronically Homeless
Sheltered Unsheltered Total Emergency Transitional Total # of households 1 NA 1 2 Total # of persons 3 NA 3 6

58 | P a g e
HUD HDX Table 7 HI-500 Veteran Populations Veteran Households with at least one Adult & one Child Persons in Households with At Least One Adult & One Child
Sheltered Unsheltered Total Emergency Transitional Total # of Households 0 2 2 4 Total # of Persons 0 7 6 13 Total # of Veterans 0 2 2 4
Gender (Veterans only)
Sheltered Unsheltered Total Emergency Transitional Female 0 0 0 0 Male 0 2 2 4 Transgender 0 0 0 0 Gender Non-Conforming (i.e. not exclusively male or female)
0 0 0 0
Ethnicity (Veterans only)
Sheltered Unsheltered Total Emergency Transitional Non-Hispanic/Non-Latino 0 1 2 3 Hispanic/Latino 0 1 0 1
Race (Veterans only)
Sheltered Unsheltered Total Emergency Transitional White 0 0 1 1 Black or African American 0 0 0 0 Asian 0 1 0 1 American Indian or Alaska Native 0 0 0 0 Native Hawaiian or Other Pacific Islander 0 0 0 0 Multiple Races 0 1 1 2
Chronically Homeless
Sheltered Unsheltered Total Emergency Transitional Total # of households 0 NA 1 1 Total # of Persons 0 NA 3 3

59 | P a g e
HUD HDX Table 8 HI-500 Veteran Populations Veteran Households without Children Persons in Households without Children
Sheltered Unsheltered Total Emergency Transitional Total # of Households 30 2 95 127 Total # of Persons 32 2 109 143 Total # of Veterans 30 2 96 128
Gender (Veterans only)
Sheltered Unsheltered Total Emergency Transitional Female 5 0 7 12 Male 25 2 87 114 Transgender 0 0 0 0 Gender Non-Conforming (i.e. not exclusively male or female)
0 0 2 2
Ethnicity (Veterans only)
Sheltered Unsheltered Total Emergency Transitional Non-Hispanic/Non-Latino 26 1 81 108 Hispanic/Latino 4 1 15 20
Race (Veterans only)
Sheltered Unsheltered Total Emergency Transitional White 12 1 46 59 Black or African American 2 0 3 5 Asian 2 1 8 11 American Indian or Alaska Native 1 0 4 5 Native Hawaiian or Other Pacific Islander 2 0 14 16 Multiple Races 11 0 21 32
Chronically Homeless
Sheltered Unsheltered Total Emergency Transitional Total # of persons 13 NA 57 70