Embed Size (px)
Citation preview

HOME CARE PACKAGES PROGRAM
Data Report 1st Quarter 2018-19
1 July – 30 September 2018 November 2018
Home Care Packages Program – Data Report
2
Table of Contents
Executive Summary ........................................................................................... 3
Introduction......................................................................................................... 4
Overview ............................................................................................................................. 4
Scope of the Report ............................................................................................................ 4
1. Eligibility and Assessment .............................................................................. 5
Distribution of Home care package levels .......................................................................... 5
Volume of Home care approvals ........................................................................................ 5
2. Home Care Service Delivery .......................................................................... 6
Number of people in a home care package ....................................................................... 6
Number of approved home care providers ......................................................................... 8
3. National Prioritisation System ...................................................................... 10
National Prioritisation System ........................................................................................... 10
Number of home care packages released ....................................................................... 14
4. Maximum Exit Amounts ............................................................................... 16
Glossary ........................................................................................................... 17
Appendices....................................................................................................... 18
Appendix A – Number of people in a home care package at 30 June 2018, by ACPR .. 18
Appendix B – Number of entries to home care in the June 2018 quarter, by ACPR ....... 21
Appendix C – Number of approved home care providers by ACPR ................................ 24
Appendix D – Number of people awaiting their approved level package at 30 September 2018, yet to be offered a lower level package, by ACPR ......................... 27
Appendix E – Number of home care packages released in the September 2018 quarter, by ACPR ........................................................................................................................... 30
Home Care Packages Program – Data Report
3
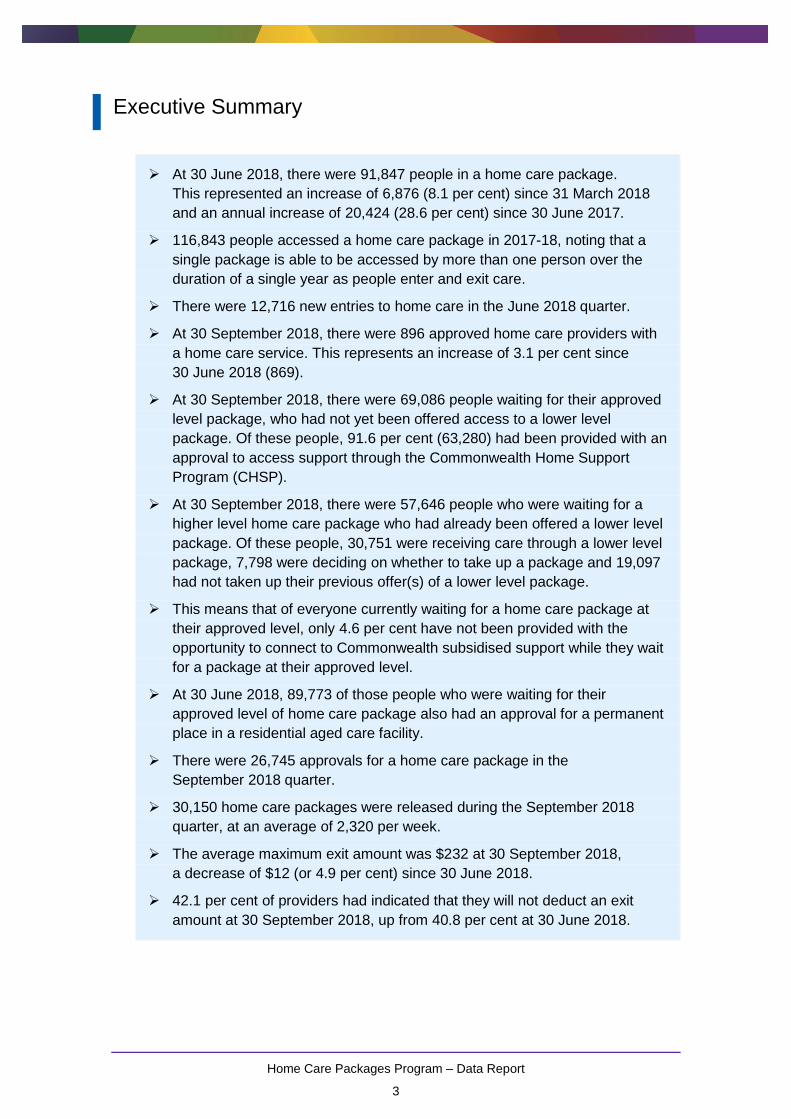
Executive Summary
At 30 June 2018, there were 91,847 people in a home care package.
This represented an increase of 6,876 (8.1 per cent) since 31 March 2018
and an annual increase of 20,424 (28.6 per cent) since 30 June 2017.
116,843 people accessed a home care package in 2017-18, noting that a
single package is able to be accessed by more than one person over the
duration of a single year as people enter and exit care.
There were 12,716 new entries to home care in the June 2018 quarter.
At 30 September 2018, there were 896 approved home care providers with
a home care service. This represents an increase of 3.1 per cent since
30 June 2018 (869).
At 30 September 2018, there were 69,086 people waiting for their approved
level package, who had not yet been offered access to a lower level
package. Of these people, 91.6 per cent (63,280) had been provided with an
approval to access support through the Commonwealth Home Support
Program (CHSP).
At 30 September 2018, there were 57,646 people who were waiting for a
higher level home care package who had already been offered a lower level
package. Of these people, 30,751 were receiving care through a lower level
package, 7,798 were deciding on whether to take up a package and 19,097
had not taken up their previous offer(s) of a lower level package.
This means that of everyone currently waiting for a home care package at
their approved level, only 4.6 per cent have not been provided with the
opportunity to connect to Commonwealth subsidised support while they wait
for a package at their approved level.
At 30 June 2018, 89,773 of those people who were waiting for their
approved level of home care package also had an approval for a permanent
place in a residential aged care facility.
There were 26,745 approvals for a home care package in the
September 2018 quarter.
30,150 home care packages were released during the September 2018
quarter, at an average of 2,320 per week.
The average maximum exit amount was $232 at 30 September 2018,
a decrease of $12 (or 4.9 per cent) since 30 June 2018.
42.1 per cent of providers had indicated that they will not deduct an exit
amount at 30 September 2018, up from 40.8 per cent at 30 June 2018.
Home Care Packages Program – Data Report
4
INTRODUCTION
OVERVIEW
The Government recognises that people want to remain living independently in their own homes
for as long as possible. To support this, the Government subsidises packages through the
Home Care Packages Program to provide home-based care that can improve older Australians’
quality of life and help them to remain active and connected to their communities.
This report provides an update on the operation of the Home Care Packages Program for the
period between 1 July 2018 and 30 September 2018 (referred to as the September 2018
quarter for the remainder of the report).
This report consists of four chapters:
Chapter 1: assessment for home care and the number of approvals.
Chapter 2: the delivery of home care services.
Chapter 3: the prioritisation of people in the national prioritisation system.
Chapter 4: maximum exit amounts.
Information on the Home Care Packages Program, including eligibility, fees and recent reforms
can be found at Home Care Packages Program | Ageing and Aged Care.
A Glossary is also provided at the end of the report explaining specific terminology and
abbreviations used throughout the report.
Data in this report was collected from information systems and records held by the
Department of Health (the department) and the Department of Human Services (DHS).
Data was valid on the date of extraction. Data extracted on a different date may vary from that in
this report.
SCOPE OF THE REPORT
Where possible, data is provided for the period between 1 July 2018 and 30 September 2018.
Due to a lag in data availability for some indicators, particularly those dependent on receipt of
provider claims by DHS, earlier time periods are reported on.
The impact of the increased investment in the 2018-19 Budget on the number of people in care
is yet to be reflected in these figures as the data available for this report was for the number
people who were in care at 30 June 2018. The additional investment from the 2018-19 Budget
measure commenced in July 2018 and continues to roll out.

Home Care Packages Program – Data Report
5
1. ELIGIBILITY AND ASSESSMENT
DISTRIBUTION OF HOME CARE PACKAGE LEVELS
There are four levels of home care packages to help meet the different levels of care
needs, which are determined by the outcome of an aged care assessment (Table 1).
Table 1: Home care package annual subsidy, by package level at 30 September 2018
Package level
Aged care services for people with: Annual amount ($) paid by the Australian
Government up to the approximate* value of
1 Basic care needs 8,271
2 Low-level care needs 15,045
3 Intermediate care needs 33,076
4 High-level care needs 50,286
Note: The maximum Government contribution increases each year. The amount will depend on a client’s income during the year.
Following the introduction of the Increasing Choice reforms, approvals are now made at
a specific package level (1, 2, 3 and 4) instead of being made in broad bands (level 1-2
or level 3-4). People with a level 1-2 or 3-4 approval (i.e. people who were approved
before 27 February 2017) were automatically deemed to be approved at the highest
level of their band, i.e. either at level 2 or level 4 as at 27 February 2017. This has
resulted in more people waiting for a level 2 package and in particular, a level 4
package.
VOLUME OF HOME CARE APPROVALS
There were 26,745 total home care approvals in the September 2018 quarter.
Table 2: Number of home care approvals in the September 2018 quarter, by state and territory of assessment, level
and priority
State/ territory
Level 1 Level 2 Level 3 Level 4 Total
Share by state/territory High Medium High Medium High Medium High Medium
NSW 8 618 78 3,425 306 2,991 443 1,098 8,967 33.5%
VIC 0 280 37 2,787 133 2,040 444 1,076 6,797 25.4%
QLD 1 246 45 1,731 265 1,749 539 630 5,206 19.5%
WA 0 50 10 617 62 776 252 530 2,297 8.6%
SA 0 93 1 783 23 963 65 408 2,336 8.7%
TAS 0 16 0 237 10 305 28 143 739 2.8%
ACT 0 8 0 107 1 82 26 72 296 1.1%
NT 0 0 0 28 2 28 17 32 107 0.4%
Subtotal 9 1,311 171 9,715 802 8,934 1,814 3,989 26,745 100.0%
Total 1,320 9,886 9,736 5,803 26,745
Share by level
4.9% 37.0% 36.4% 21.7% 100.0%
Key point:
There were 26,745 approvals for home care in the September 2018 quarter.
Home Care Packages Program – Data Report
6
2. HOME CARE SERVICE DELIVERY
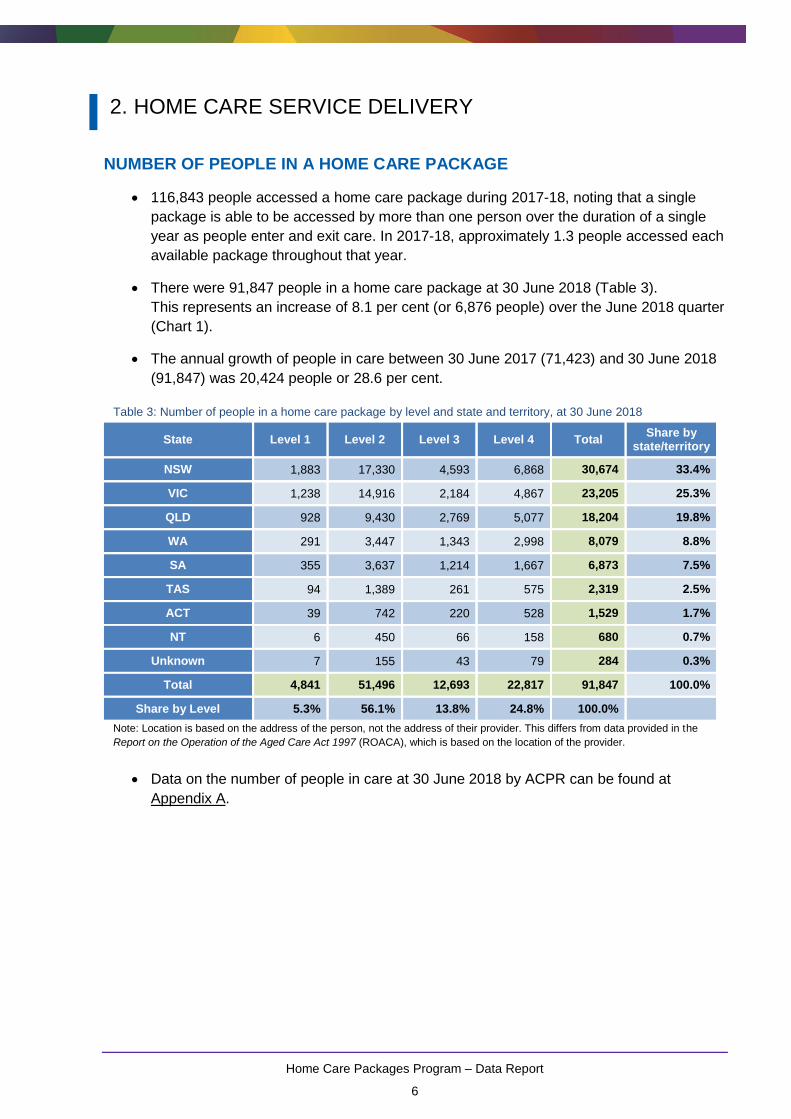
NUMBER OF PEOPLE IN A HOME CARE PACKAGE
116,843 people accessed a home care package during 2017-18, noting that a single
package is able to be accessed by more than one person over the duration of a single
year as people enter and exit care. In 2017-18, approximately 1.3 people accessed each
available package throughout that year.
There were 91,847 people in a home care package at 30 June 2018 (Table 3).
This represents an increase of 8.1 per cent (or 6,876 people) over the June 2018 quarter
(Chart 1).
The annual growth of people in care between 30 June 2017 (71,423) and 30 June 2018
(91,847) was 20,424 people or 28.6 per cent.
Table 3: Number of people in a home care package by level and state and territory, at 30 June 2018
State Level 1 Level 2 Level 3 Level 4 Total Share by
state/territory
NSW 1,883 17,330 4,593 6,868 30,674 33.4%
VIC 1,238 14,916 2,184 4,867 23,205 25.3%
QLD 928 9,430 2,769 5,077 18,204 19.8%
WA 291 3,447 1,343 2,998 8,079 8.8%
SA 355 3,637 1,214 1,667 6,873 7.5%
TAS 94 1,389 261 575 2,319 2.5%
ACT 39 742 220 528 1,529 1.7%
NT 6 450 66 158 680 0.7%
Unknown 7 155 43 79 284 0.3%
Total 4,841 51,496 12,693 22,817 91,847 100.0%
Share by Level 5.3% 56.1% 13.8% 24.8% 100.0%
Note: Location is based on the address of the person, not the address of their provider. This differs from data provided in the
Report on the Operation of the Aged Care Act 1997 (ROACA), which is based on the location of the provider.
Data on the number of people in care at 30 June 2018 by ACPR can be found at
Appendix A.
Home Care Packages Program – Data Report
7
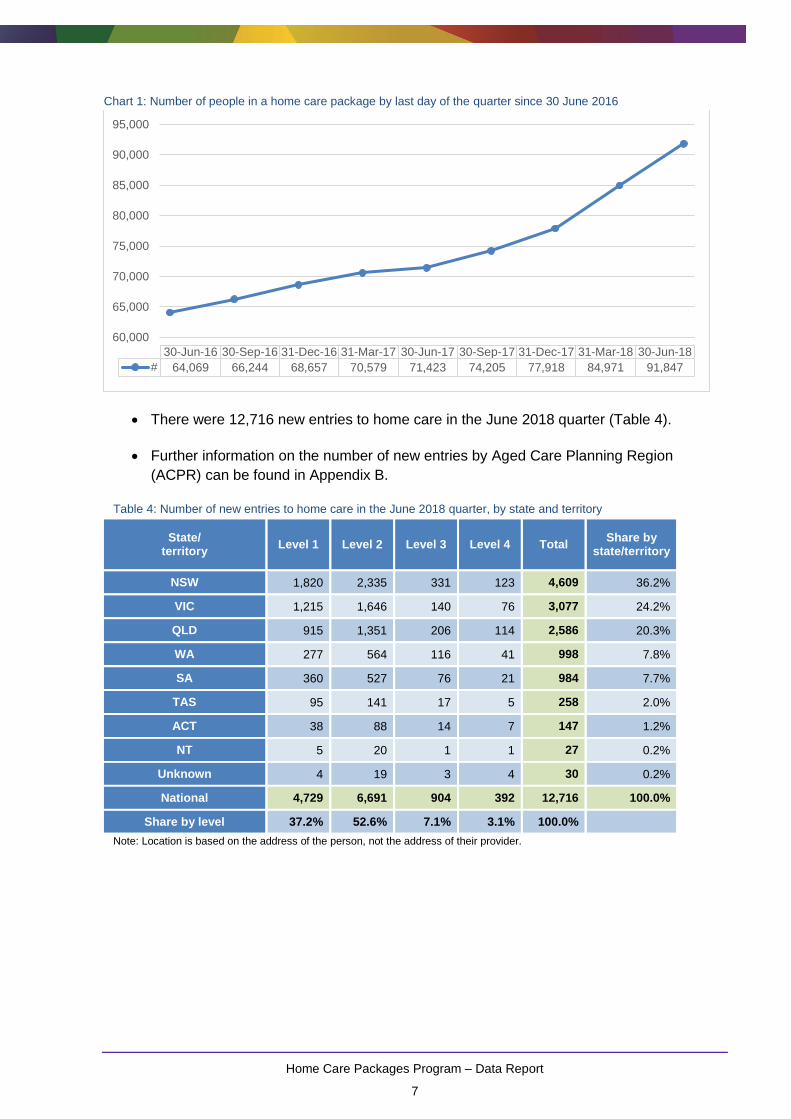
Chart 1: Number of people in a home care package by last day of the quarter since 30 June 2016
There were 12,716 new entries to home care in the June 2018 quarter (Table 4).
Further information on the number of new entries by Aged Care Planning Region
(ACPR) can be found in Appendix B.
Table 4: Number of new entries to home care in the June 2018 quarter, by state and territory
State/ territory
Level 1 Level 2 Level 3 Level 4 Total Share by
state/territory
NSW 1,820 2,335 331 123 4,609 36.2%
VIC 1,215 1,646 140 76 3,077 24.2%
QLD 915 1,351 206 114 2,586 20.3%
WA 277 564 116 41 998 7.8%
SA 360 527 76 21 984 7.7%
TAS 95 141 17 5 258 2.0%
ACT 38 88 14 7 147 1.2%
NT 5 20 1 1 27 0.2%
Unknown 4 19 3 4 30 0.2%
National 4,729 6,691 904 392 12,716 100.0%
Share by level 37.2% 52.6% 7.1% 3.1% 100.0%
Note: Location is based on the address of the person, not the address of their provider.
60,000
65,000
70,000
75,000
80,000
85,000
90,000
95,000
30-Jun-16 30-Sep-16 31-Dec-16 31-Mar-17 30-Jun-17 30-Sep-17 31-Dec-17 31-Mar-18 30-Jun-18
# 64,069 66,244 68,657 70,579 71,423 74,205 77,918 84,971 91,847
Home Care Packages Program – Data Report
8
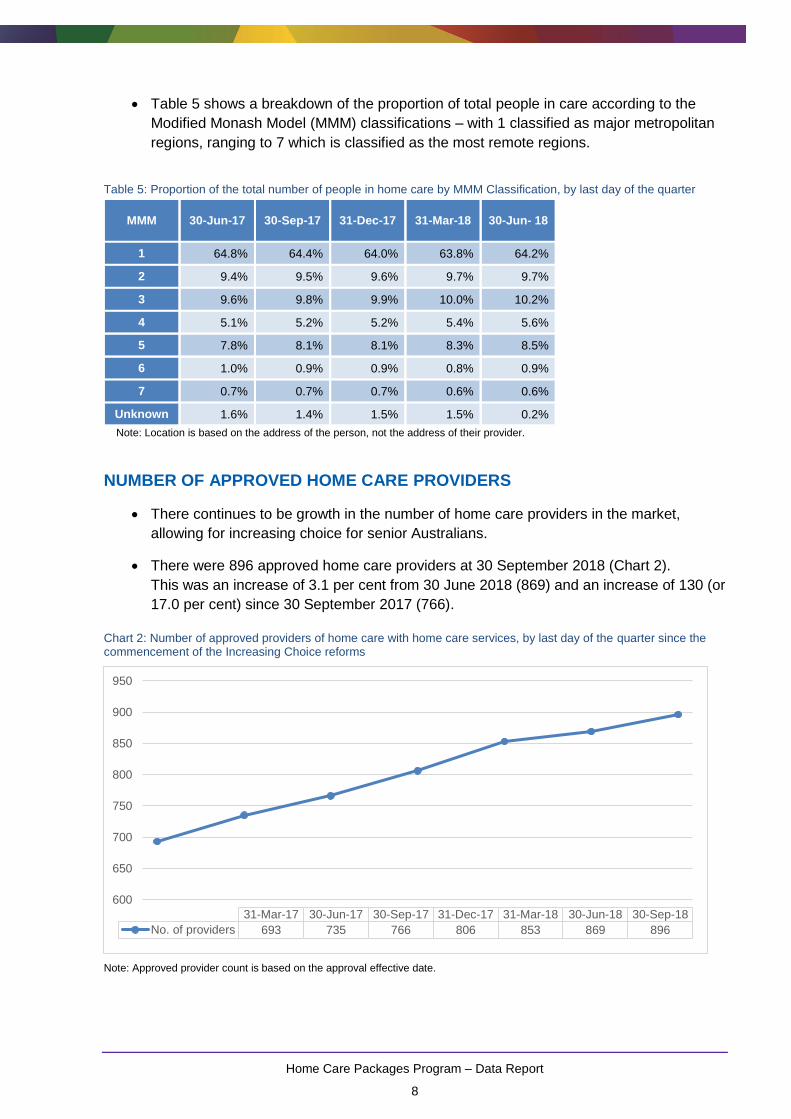
Table 5 shows a breakdown of the proportion of total people in care according to the
Modified Monash Model (MMM) classifications – with 1 classified as major metropolitan
regions, ranging to 7 which is classified as the most remote regions.
Table 5: Proportion of the total number of people in home care by MMM Classification, by last day of the quarter
MMM 30-Jun-17 30-Sep-17 31-Dec-17 31-Mar-18 30-Jun- 18
1 64.8% 64.4% 64.0% 63.8% 64.2%
2 9.4% 9.5% 9.6% 9.7% 9.7%
3 9.6% 9.8% 9.9% 10.0% 10.2%
4 5.1% 5.2% 5.2% 5.4% 5.6%
5 7.8% 8.1% 8.1% 8.3% 8.5%
6 1.0% 0.9% 0.9% 0.8% 0.9%
7 0.7% 0.7% 0.7% 0.6% 0.6%
Unknown 1.6% 1.4% 1.5% 1.5% 0.2%
Note: Location is based on the address of the person, not the address of their provider.
NUMBER OF APPROVED HOME CARE PROVIDERS
There continues to be growth in the number of home care providers in the market,
allowing for increasing choice for senior Australians.
There were 896 approved home care providers at 30 September 2018 (Chart 2).
This was an increase of 3.1 per cent from 30 June 2018 (869) and an increase of 130 (or
17.0 per cent) since 30 September 2017 (766).
Chart 2: Number of approved providers of home care with home care services, by last day of the quarter since the commencement of the Increasing Choice reforms
Note: Approved provider count is based on the approval effective date.
600
650
700
750
800
850
900
950
31-Mar-17 30-Jun-17 30-Sep-17 31-Dec-17 31-Mar-18 30-Jun-18 30-Sep-18
No. of providers 693 735 766 806 853 869 896

Home Care Packages Program – Data Report
9
Appendix C provides a full list of the count of approved home care providers in each
ACPR that provides services across all four package levels in that region at
30 September 2018.
Key points
At 30 June 2018, there were 91,847 people in a home care package. This was an
increase of 8.1 per cent (6,876 people) since 31 March 2018 and an increase of
28.6 per cent (20,424) since 30 June 2017.
116,843 people accessed a home care package during 2017-18.
There were 12,716 new entries to home care in the June 2018 quarter.
At 30 September 2018, there were 896 approved home care providers with a home care
service, an increase of 3.1 per cent since 30 June 2018.

Home Care Packages Program – Data Report
10
Have not yet been offered a home care package, but have
been approved for CHSP
Have been offered a home care package and have been
approved for CHSP
Have been offered a home care package, but have not been
approved for CHSP
Have not yet been offered a home care package, and have
not been approved for CHSP
3. NATIONAL PRIORITISATION SYSTEM
NATIONAL PRIORITISATION SYSTEM
The national prioritisation system allows for a nationally consistent and equitable process
for assigning home care packages based on people’s individual needs and
circumstances, regardless of where they live.
The national prioritisation system is complex and should be considered as more than a
single queue. For example, the national prioritisation system includes people who have
accepted a lower level home care package that allows them to connect with home care
services early, as well as others that have not accepted a lower level package. It also
includes people that have approvals for other care types such as CHSP and residential
care.
Changes have been made as part of this report to better reflect the range of factors that
influence home care, in order to provide a more accurate representation of the national
prioritisation system and peoples access to care.
ACCESS TO COMMONWEALTH HOME SUPPORT SERVICES
Over 85 per cent of people currently awaiting their approved level package have the
option of accessing services through the CHSP.
In addition to receiving an approval for a home care package as an outcome of their
assessment, most people are provided with approval to access CHSP to assist with
specific care needs identified during the assessment. Assessors provide these approvals
to ensure people have options to address care needs, whilst awaiting their approved
home care package.
Additionally, people retain the option of using some specific CHSP services after they
are offered a lower level home care package. This is highlighted in Diagram 1, which
highlights that 95.4 per cent of people have been offered a home care package or
approved for CHSP services as part of the national prioritisation system.
Diagram 1: Status of people in the National Prioritisation System at 30 September 2018 who are awaiting their
approved home care package
Home Care Packages Program – Data Report
11
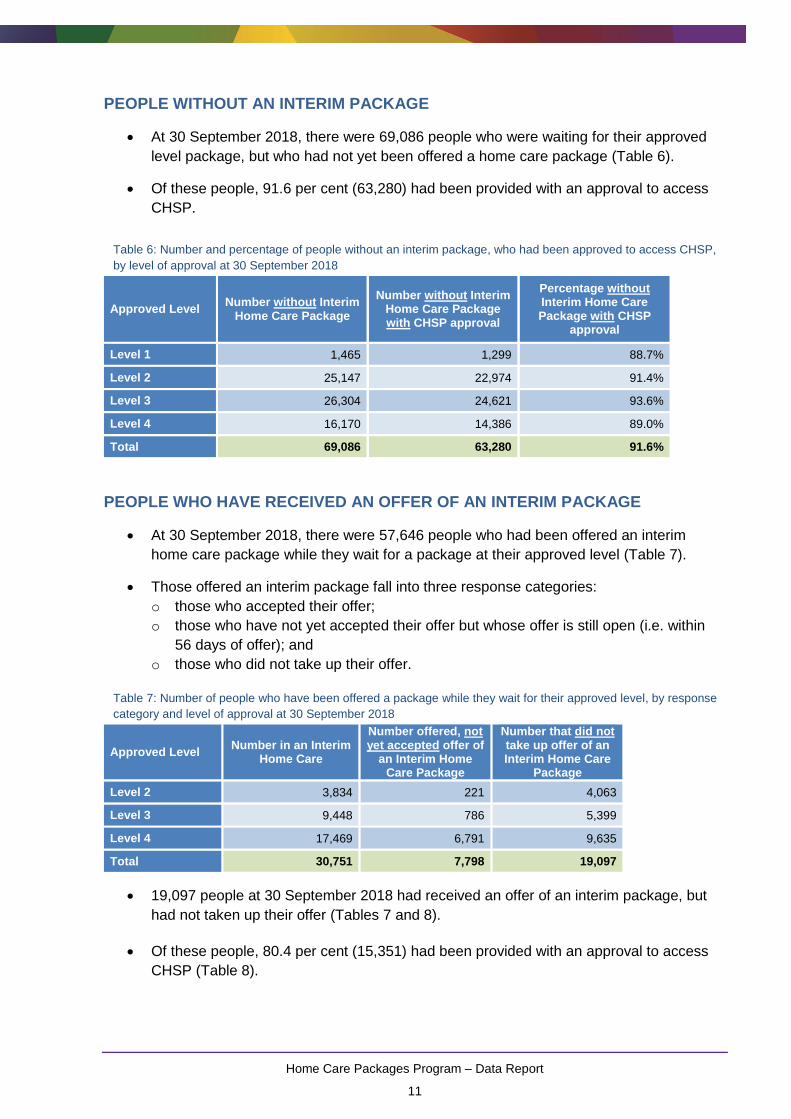
PEOPLE WITHOUT AN INTERIM PACKAGE
At 30 September 2018, there were 69,086 people who were waiting for their approved
level package, but who had not yet been offered a home care package (Table 6).
Of these people, 91.6 per cent (63,280) had been provided with an approval to access
CHSP.
Table 6: Number and percentage of people without an interim package, who had been approved to access CHSP,
by level of approval at 30 September 2018
Approved Level Number without Interim
Home Care Package
Number without Interim Home Care Package with CHSP approval
Percentage without Interim Home Care Package with CHSP
approval
Level 1 1,465 1,299 88.7%
Level 2 25,147 22,974 91.4%
Level 3 26,304 24,621 93.6%
Level 4 16,170 14,386 89.0%
Total 69,086 63,280 91.6%
PEOPLE WHO HAVE RECEIVED AN OFFER OF AN INTERIM PACKAGE
At 30 September 2018, there were 57,646 people who had been offered an interim
home care package while they wait for a package at their approved level (Table 7).
Those offered an interim package fall into three response categories:
o those who accepted their offer;
o those who have not yet accepted their offer but whose offer is still open (i.e. within
56 days of offer); and
o those who did not take up their offer.
Table 7: Number of people who have been offered a package while they wait for their approved level, by response
category and level of approval at 30 September 2018
Approved Level Number in an Interim
Home Care
Number offered, not yet accepted offer of
an Interim Home Care Package
Number that did not take up offer of an Interim Home Care
Package
Level 2 3,834 221 4,063
Level 3 9,448 786 5,399
Level 4 17,469 6,791 9,635
Total 30,751 7,798 19,097
19,097 people at 30 September 2018 had received an offer of an interim package, but
had not taken up their offer (Tables 7 and 8).
Of these people, 80.4 per cent (15,351) had been provided with an approval to access
CHSP (Table 8).

Home Care Packages Program – Data Report
12
Table 8: Number and percentage of people who did not take up an offer of a lower level package, who have been
provided approval to access CHSP, by level of approval at 30 September 2018
Approved Level Number did not take up offer of Interim Home
Care Package
Number did not take up offer of Interim Home Care Package, with
CHSP approval
Percentage did not take up offer of Interim
Home Care Package, with CHSP approval
Level 2 4,063 3,667 90.3%
Level 3 5,399 4,784 88.6%
Level 4 9,635 6,900 71.6%
Total 19,097 15,351 80.4%
PEOPLE APPROVED FOR RESIDENTIAL CARE
ACATs assess a person’s broader needs and, when making an approval for care,
they can approve people for home care packages, CHSP and residential care.
Therefore, based on need and choice, not everyone with a home care approval will enter
home care.
Many people have approvals for both home and residential aged care, and some will
choose to take up a residential place instead of a home care package. At 30 June 2018,
89,773 people had dual approvals, having been approved for a permanent place in a
residential aged care facility and also currently waiting for a home care package at their
approved level (Table 9).
Table 9: Number of people awaiting a home care package at their approved level who are also approved for
permanent residential care, by level of approval at 30 September 2018
Approved Level
Number waiting for an approved level package
with Residential Care Approval
Level 1 433
Level 2 18,943
Level 3 30,453
Level 4 39,944
Total 89,773
Home Care Packages Program – Data Report
13
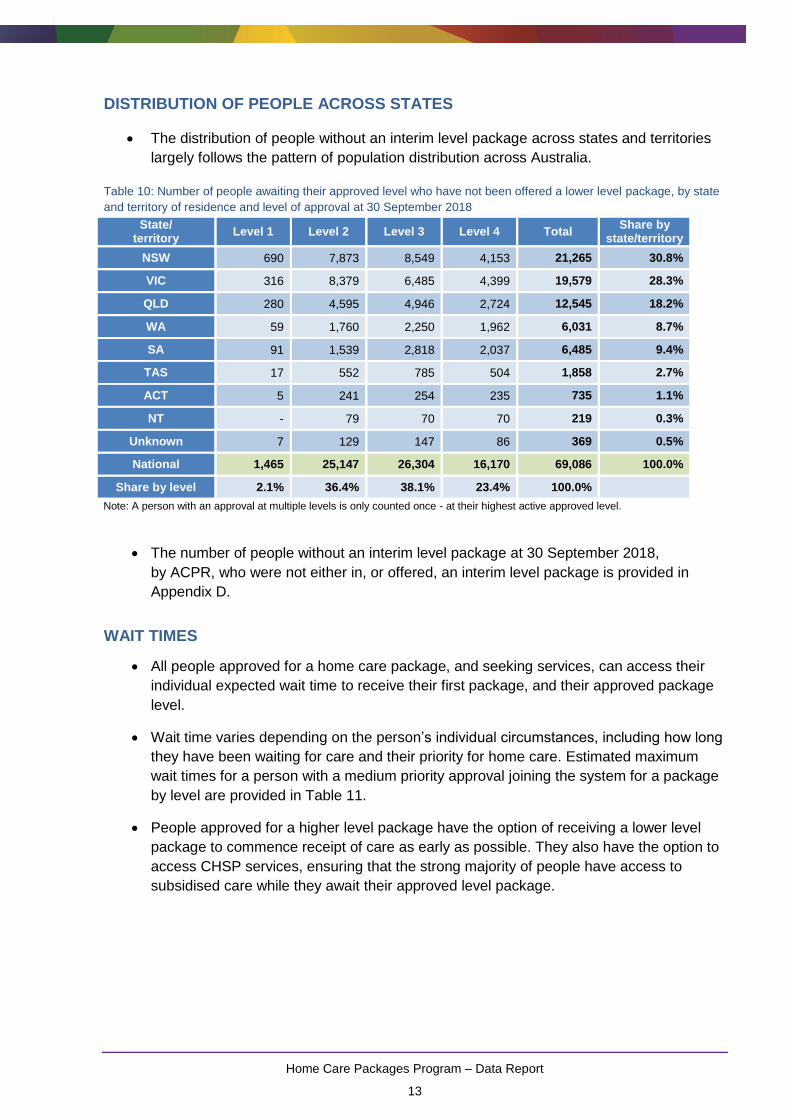
DISTRIBUTION OF PEOPLE ACROSS STATES
The distribution of people without an interim level package across states and territories
largely follows the pattern of population distribution across Australia.
Table 10: Number of people awaiting their approved level who have not been offered a lower level package, by state
and territory of residence and level of approval at 30 September 2018
State/ territory
Level 1 Level 2 Level 3 Level 4 Total Share by
state/territory
NSW 690 7,873 8,549 4,153 21,265 30.8%
VIC 316 8,379 6,485 4,399 19,579 28.3%
QLD 280 4,595 4,946 2,724 12,545 18.2%
WA 59 1,760 2,250 1,962 6,031 8.7%
SA 91 1,539 2,818 2,037 6,485 9.4%
TAS 17 552 785 504 1,858 2.7%
ACT 5 241 254 235 735 1.1%
NT - 79 70 70 219 0.3%
Unknown 7 129 147 86 369 0.5%
National 1,465 25,147 26,304 16,170 69,086 100.0%
Share by level 2.1% 36.4% 38.1% 23.4% 100.0%
Note: A person with an approval at multiple levels is only counted once - at their highest active approved level.
The number of people without an interim level package at 30 September 2018,
by ACPR, who were not either in, or offered, an interim level package is provided in
Appendix D.
WAIT TIMES
All people approved for a home care package, and seeking services, can access their
individual expected wait time to receive their first package, and their approved package
level.
Wait time varies depending on the person’s individual circumstances, including how long
they have been waiting for care and their priority for home care. Estimated maximum
wait times for a person with a medium priority approval joining the system for a package
by level are provided in Table 11.
People approved for a higher level package have the option of receiving a lower level
package to commence receipt of care as early as possible. They also have the option to
access CHSP services, ensuring that the strong majority of people have access to
subsidised care while they await their approved level package.

Home Care Packages Program – Data Report
14
Table 11: Estimated maximum wait time for people entering on 30 September 2018, by package level
NUMBER OF HOME CARE PACKAGES RELEASED
This section presents data on the volume of packages released during the September 2018
quarter.
The department released 30,150 home care packages during the September 2018 quarter
(Table 12), at an average of 2,320 per week.
Table 12: Number of home care packages released in the September 2018 quarter, by state and territory and level
Of people who were offered a package in the September 2018 quarter:
o 27.4 per cent (8,257) of packages were released as upgrades to people who had
previously been offered and accepted a lower level interim package.
o 72.6 per cent (21,893) of packages were offered to people who were not yet in care
and were entering care for the first time (Table 13). This included people who were
previously offered a package and did not take up the offer, as well as people who
were offered a package for the first time.
Package level First package assignment
Time to first package
Time to approved package
Level 1 Level 1 3-6 months 3-6 months
Level 2 Level 1 3-6 months 12+ months
Level 3 Level 1 3-6 months 12+ months
Level 4 Level 2 12+ months 12+ months
State/territory Level 1 Level 2 Level 3 Level 4 Total Share
NSW 548 2,043 5,973 2,377 10,941 36.3%
VIC 206 967 2,773 1,178 5,124 17.0%
QLD 227 1,380 3,556 1,602 6,765 22.5%
WA 105 541 1,828 872 3,346 11.1%
SA 99 351 1,675 689 2,814 9.3%
TAS 16 77 289 174 556 1.8%
ACT 11 91 251 106 459 1.5%
NT 2 21 49 43 115 0.4%
Unknown 1 3 17 9 30 0.0%
Total 1,215 5,474 16,411 7,050 30,150 100.0%

Home Care Packages Program – Data Report
15
Table 13: Home care packages released to people in the September 2018 quarter, by level and type of release
Level 1 Level 2 Level 3 Level 4 Total
New packages 1,215 5,401 11,689 3,588 21,893
Upgrades 0 74 4,721 3,462 8,257
Total 1,215 5,475 16,410 7,050 30,150
% that were new
100.0% 98.6% 71.2% 50.9% 72.6%
Information on the number of packages released by ACPR and level for the
September 2018 quarter can be found at Appendix E.
Key points
At 30 September 2018, there were 69,086 people who were awaiting their approved
level package who had not yet been offered a lower level home care package. Of these
people, 91.6 per cent (63,280) had been provided with an approval to access CHSP.
At 30 September 2018, there were 57,646 people who had been offered an interim home
care package while they wait for a package at their approved level.
30,150 home care packages were released during the September 2018 quarter with
21,893 (72.6 per cent) being offered to people who were not yet in an interim package.

Home Care Packages Program – Data Report
16
4. MAXIMUM EXIT AMOUNTS
An exit amount is an amount that can be deducted, by a home care provider from a person’s
unspent home care package amount if the person leaves their care. This may happen if the
person decides to change their home care provider or when they leave home care altogether.
The maximum exit amount represents the highest dollar value the provider can include in a
person’s home care agreement and must be published on the My Aged Care website.
The average published maximum exit amount of all providers at 30 September 2018 was
$232 (inclusive of amounts of $0 and where no amount is provided) (Chart 3) and had
dropped by $12 (or 4.9 per cent) over the September 2018 quarter and dropped by $47
(or 16.9 per cent) since 30 September 2017.
Chart 3: Average maximum exit amount published by home care providers as at the last day of the quarter since the commencement of the Increasing Choice reforms
Note: All approved providers, irrespective of whether or not they publish an amount, are included in determining the average.
42.1 per cent of providers had indicated that they would not deduct an exit amount, up
from 40.8 per cent at 30 June 2018.
The number of providers publishing a maximum exit amount of more than $1,000 at
30 September 2018 was 11 (Table 14).
Table 14: Number of approved providers with a maximum exit amount of $1,000 or more
30-Jun-17 30-Sep-17 31-Dec-17 31-Mar-18 30-Jun-18 30-Sep-18
(A) No. of providers with a published max. exit amount of more than $1,000
6 5 4 5 5 5
(B) No. of providers with a published max. exit amount of $1,000
9 10 11 7 6 6
Combined (A)+(B) 15 15 15 12 11 11
Key points:
At 30 September 2018, the average published maximum exit amount was $232.
At 30 September 2018, 42.1 per cent of all approved providers indicated that they would
not deduct an exit amount.
$150
$170
$190
$210
$230
$250
$270
$290
$310
31-Mar-17 30-Jun-17 30-Sep-17 31-Dec-17 31-Mar-18 30-Jun-18 30-Sep-18
Max exit amount $290 $280 $279 $266 $250 $244 $232
Home Care Packages Program – Data Report
17
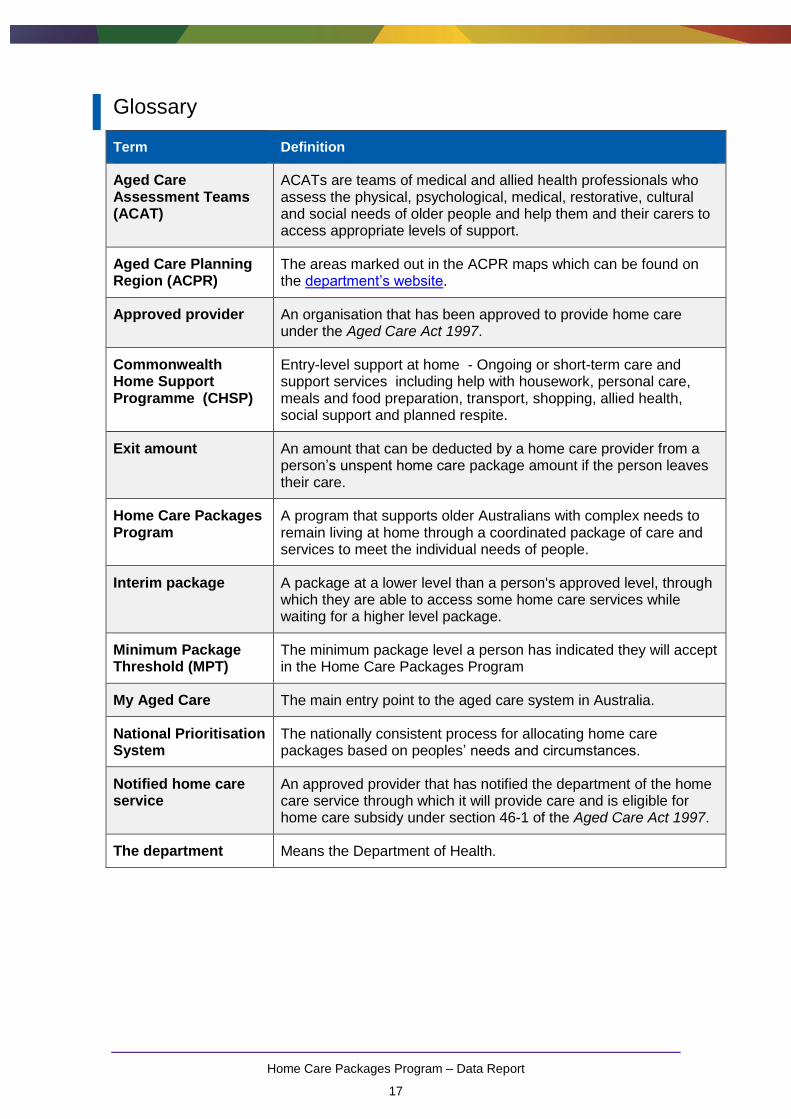
Glossary
Term Definition
Aged Care Assessment Teams (ACAT)
ACATs are teams of medical and allied health professionals who assess the physical, psychological, medical, restorative, cultural and social needs of older people and help them and their carers to access appropriate levels of support.
Aged Care Planning Region (ACPR)
The areas marked out in the ACPR maps which can be found on the department’s website.
Approved provider An organisation that has been approved to provide home care under the Aged Care Act 1997.
Commonwealth Home Support Programme (CHSP)
Entry-level support at home - Ongoing or short-term care and support services including help with housework, personal care, meals and food preparation, transport, shopping, allied health, social support and planned respite.
Exit amount An amount that can be deducted by a home care provider from a person’s unspent home care package amount if the person leaves their care.
Home Care Packages Program
A program that supports older Australians with complex needs to remain living at home through a coordinated package of care and services to meet the individual needs of people.
Interim package A package at a lower level than a person's approved level, through which they are able to access some home care services while waiting for a higher level package.
Minimum Package Threshold (MPT)
The minimum package level a person has indicated they will accept in the Home Care Packages Program
My Aged Care The main entry point to the aged care system in Australia.
National Prioritisation System
The nationally consistent process for allocating home care packages based on peoples’ needs and circumstances.
Notified home care service
An approved provider that has notified the department of the home care service through which it will provide care and is eligible for home care subsidy under section 46-1 of the Aged Care Act 1997.
The department Means the Department of Health.

Home Care Packages Program – Data Report
18
Appendices
Appendix A – Number of people in a home care package at 30 June 2018, by
ACPR
State/territory Level 1 Level 2 Level 3 Level 4 Total
NSW
Central Coast 118 1,182 393 395 2,088
Central West 78 466 104 177 825
Far North Coast 103 1,110 251 354 1,818
Hunter 168 1,680 568 828 3,244
Illawarra 87 1,132 234 390 1,843
Inner West 120 1,069 243 404 1,836
Mid North Coast 170 1,480 486 694 2,830
Nepean 52 605 87 166 910
New England 7 481 146 173 807
Northern Sydney 105 1,811 506 732 3,154
Orana Far West 119 464 106 131 820
Riverina/Murray 228 1,081 238 294 1,841
South East Sydney 123 1,512 349 649 2,633
South West Sydney 295 1,394 299 516 2,504
Southern Highlands 47 644 198 281 1,170
Western Sydney 63 1,219 385 684 2,351
Total across levels 1,883 17,330 4,593 6,868 30,674
VIC
Barwon-South Western 114 1,223 196 418 1,951
Eastern Metro 264 3,009 409 879 4,561
Gippsland 179 968 206 341 1,694
Grampians 62 737 87 192 1,078
Hume 99 913 160 270 1,442
Loddon-Mallee 59 923 82 297 1,361
Northern Metro 205 1,989 327 739 3,260
Southern Metro 194 3,411 451 1,031 5,087
Western Metro 62 1,743 266 700 2,771
Total across levels 1,238 14,916 2,184 4,867 23,205

Home Care Packages Program – Data Report
19
State/territory Level 1 Level 2 Level 3 Level 4 Total
QLD
Brisbane North 47 820 260 477 1,604
Brisbane South 29 1,148 371 708 2,256
Cabool 105 782 251 401 1,539
Central West 0 9 1 4 14
Darling Downs 127 718 229 421 1,495
Far North 33 546 121 198 898
Fitzroy 23 583 217 230 1,053
Logan River Valley 46 552 212 403 1,213
Mackay 8 179 47 87 321
North West 6 57 5 17 85
Northern 32 442 156 318 948
South Coast 144 1,048 253 559 2,004
South West 3 56 6 18 83
Sunshine Coast 186 1,370 375 714 2,645
West Moreton 93 347 65 182 687
Wide Bay 46 773 200 340 1,359
Total across levels 928 9,430 2,769 5,077 18,204
WA
Goldfields 11 25 6 28 70
Great Southern 6 81 54 114 255
Kimberley 1 71 23 22 117
Metro East 37 522 152 422 1,133
Metro North 102 959 301 766 2,128
Metro South East 23 567 228 464 1,282
Metro South West 26 768 377 747 1,918
Mid West 6 83 26 67 182
Pilbara 0 26 9 17 52
South West 46 234 92 242 614
Wheatbelt 33 111 75 109 328
Total across levels 291 3,447 1,343 2,998 8,079

Home Care Packages Program – Data Report
20
State/territory Level 1 Level 2 Level 3 Level 4 Total
SA
Eyre Peninsula 20 122 44 65 251
Flinders & Far North 1 47 14 26 88
Hills, Mallee & Southern 95 556 126 209 986
Metro East 22 446 164 208 840
Metro North 36 573 183 296 1,088
Metro South 75 764 304 388 1,531
Metro West 44 490 210 219 963
Mid North 9 60 32 26 127
Riverland 6 119 36 61 222
South East 15 190 35 50 290
Yorke, Lower North & Barossa
32 270 66 119 487
Total across levels 355 3,637 1,214 1,667 6,873
TAS
North Western 48 317 58 117 540
Northern 4 424 64 160 652
Southern 42 648 139 298 1,127
Total across levels 94 1,389 261 575 2,319
ACT
Total across levels 39 742 220 528 1,529
NT
Alice Springs 4 165 16 23 208
Barkly 1 31 1 5 38
Darwin 0 153 45 115 313
East Arnhem 1 56 3 7 67
Katherine 0 45 1 8 54
Total across levels 6 450 66 158 680
UNKNOWN ACPR
Total Unknown across levels 7 155 43 79 284
NATIONAL
Total across levels 4,841 51,496 12,693 22,817 91,847
Note: Data is based on the client’s suburb. As some suburbs cross ACPR boundaries, and in some instances state boundaries, a small number of people may be apportioned to a neighbouring jurisdiction.

Home Care Packages Program – Data Report
21
Appendix B – Number of entries to home care in the June 2018 quarter, by
ACPR
State/territory Level 1 Level 2 Level 3 Level 4 Total
NSW
Central Coast 112 140 12 2 266
Central West 68 38 12 2 120
Far North Coast 105 183 18 9 315
Hunter 159 247 42 20 468
Illawarra 92 151 12 4 259
Inner West 111 120 22 6 259
Mid North Coast 169 251 54 22 496
Nepean 51 66 4 0 121
New England 8 47 7 0 62
Northern Sydney 106 240 38 8 392
Orana Far West 109 67 6 1 183
Riverina/Murray 224 158 25 7 414
South East Sydney 110 212 25 17 364
South West Sydney 282 147 13 9 451
Southern Highlands 47 106 19 6 178
Western Sydney 67 162 22 10 261
Total across levels 1,820 2,335 331 123 4,609
VIC
Barwon-South Western 112 144 16 4 276
Eastern Metro 274 336 19 19 648
Gippsland 169 130 12 8 319
Grampians 65 80 8 1 154
Hume 91 119 9 5 224
Loddon-Mallee 56 90 5 4 155
Northern Metro 197 244 31 11 483
Southern Metro 190 348 26 14 578
Western Metro 61 155 14 10 240
Total across levels 1,215 1,646 140 76 3,077

Home Care Packages Program – Data Report
22
State/territory Level 1 Level 2 Level 3 Level 4 Total
QLD
Brisbane North 59 131 22 15 227
Brisbane South 26 159 21 13 219
Cabool 100 95 14 7 216
Central West 0 0 0 0 0
Darling Downs 115 127 27 5 274
Far North 34 80 7 4 125
Fitzroy 22 117 15 9 163
Logan River Valley 42 79 19 14 154
Mackay 10 34 9 1 54
North West 6 4 0 0 10
Northern 35 70 16 20 141
South Coast 141 166 17 6 330
South West 3 7 2 2 14
Sunshine Coast 193 153 20 11 377
West Moreton 91 29 1 4 125
Wide Bay 38 100 16 3 157
Total across levels 915 1,351 206 114 2,586
WA
Goldfields 11 8 1 0 20
Great Southern 6 9 6 2 23
Kimberley 1 5 1 0 7
Metro East 31 73 13 4 121
Metro North 99 153 18 5 275
Metro South East 21 81 18 8 128
Metro South West 25 152 45 14 236
Mid West 6 4 2 0 12
Pilbara 0 1 0 0 1
South West 45 57 9 5 116
Wheatbelt 32 21 3 3 59
Total across levels 277 564 116 41 998

Home Care Packages Program – Data Report
23
State/territory Level 1 Level 2 Level 3 Level 4 Total
SA
Eyre Peninsula 19 19 3 0 41
Flinders & Far North 1 0 1 1 3
Hills, Mallee & Southern 98 60 4 1 163
Metro East 21 73 15 3 112
Metro North 43 98 14 5 160
Metro South 74 105 15 0 194
Metro West 44 93 18 2 157
Mid North 9 14 2 0 25
Riverland 6 11 0 6 23
South East 14 22 2 2 40
Yorke, Lower North & Barossa 31 32 2 1 66
Total across levels 360 527 76 21 984
TAS
North Western 50 28 3 2 83
Northern 4 48 6 1 59
Southern 41 65 8 2 116
Total across levels 95 141 17 5 258
ACT
Total across levels 38 88 14 7 147
NT
Alice Springs 4 6 0 0 10
Barkly 0 1 0 0 1
Darwin 0 12 1 1 14
East Arnhem 1 0 0 0 1
Katherine 0 1 0 0 1
Total across levels 5 20 1 1 27
UNKNOWN ACPR
Total Unknown across levels 4 19 3 4 30
NATIONAL
Total across levels 4,729 6,691 904 392 12,716
Note: Data is based on the client’s suburb. As some suburbs cross ACPR boundaries, and in some instances state boundaries, a small number of people may be apportioned to a neighbouring jurisdiction.

Home Care Packages Program – Data Report
24
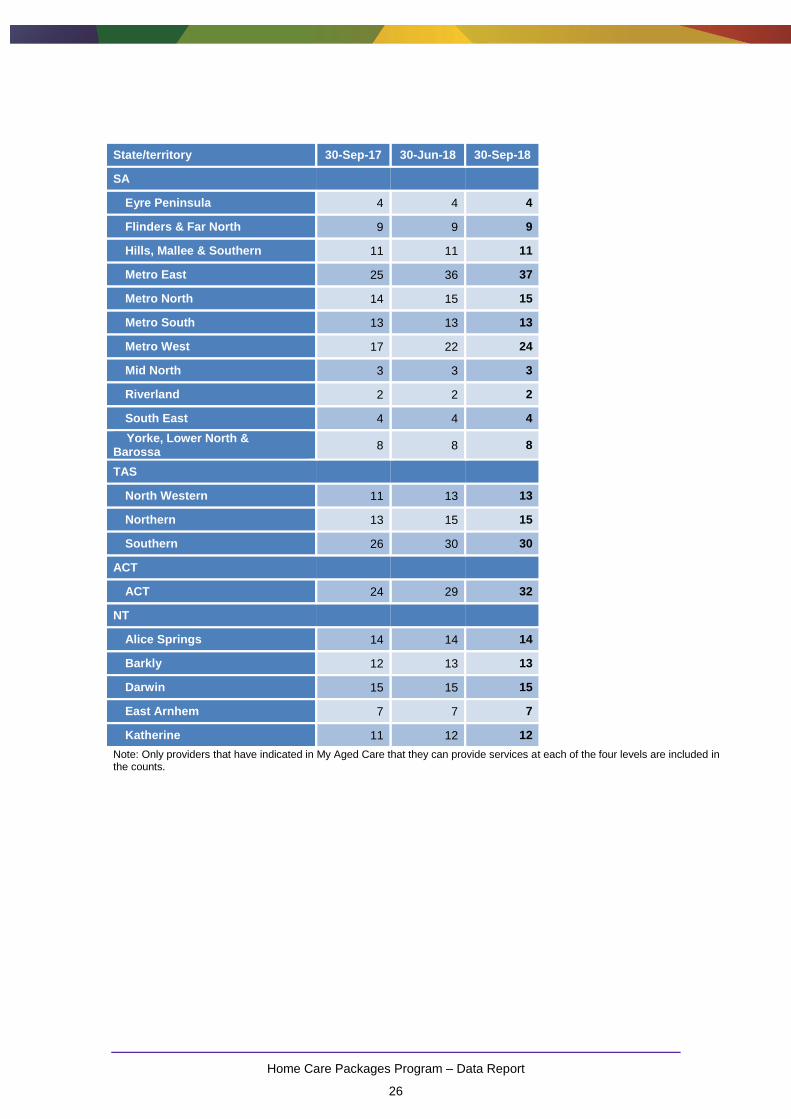
Appendix C – Number of approved home care providers by ACPR
State/territory 30-Sep-17 30-Jun-18 30-Sep-18
NSW
Central Coast 20 21 21
Central West 17 19 19
Far North Coast 28 32 32
Hunter 46 52 53
Illawarra 31 36 36
Inner West 30 31 32
Mid North Coast 38 42 44
Nepean 8 10 11
New England 18 19 19
Northern Sydney 31 37 38
Orana Far West 18 20 20
Riverina/Murray 29 31 30
South East Sydney 43 49 50
South West Sydney 36 40 42
Southern Highlands 22 24 24
Western Sydney 43 48 51
VIC
Barwon-South Western 25 27 27
Eastern Metro 42 50 53
Gippsland 17 20 20
Grampians 16 18 18
Hume 25 27 27
Loddon-Mallee 11 12 12
Northern Metro 30 33 35
Southern Metro 53 57 57
Western Metro 38 42 44

Home Care Packages Program – Data Report
25
State/territory 30-Sep-17 30-Jun-18 30-Sep-18
QLD
Brisbane North 35 40 43
Brisbane South 42 50 49
Cabool 19 20 20
Central West 8 8 8
Darling Downs 22 27 27
Far North 19 20 21
Fitzroy 18 19 21
Logan River Valley 22 24 24
Mackay 9 12 14
North West 7 7 7
Northern 16 20 21
South Coast 25 32 32
South West 3 3 3
Sunshine Coast 35 39 40
West Moreton 18 22 21
Wide Bay 18 19 19
WA
Goldfields 8 8 8
Great Southern 4 5 6
Kimberley 7 7 8
Metro East 26 26 28
Metro North 26 27 29
Metro South East 16 19 21
Metro South West 14 17 18
Mid West 5 5 5
Pilbara 8 8 8
South West 13 13 13
Wheatbelt 6 6 7
Home Care Packages Program – Data Report
26
Note: Only providers that have indicated in My Aged Care that they can provide services at each of the four levels are included in the counts.
State/territory 30-Sep-17 30-Jun-18 30-Sep-18
SA
Eyre Peninsula 4 4 4
Flinders & Far North 9 9 9
Hills, Mallee & Southern 11 11 11
Metro East 25 36 37
Metro North 14 15 15
Metro South 13 13 13
Metro West 17 22 24
Mid North 3 3 3
Riverland 2 2 2
South East 4 4 4
Yorke, Lower North & Barossa
8 8 8
TAS
North Western 11 13 13
Northern 13 15 15
Southern 26 30 30
ACT
ACT 24 29 32
NT
Alice Springs 14 14 14
Barkly 12 13 13
Darwin 15 15 15
East Arnhem 7 7 7
Katherine 11 12 12

Home Care Packages Program – Data Report
27
Appendix D – Number of people awaiting their approved level package at
30 September 2018, yet to be offered a lower level package, by ACPR
State/territory Level 1 Level 2 Level 3 Level 4 Total
NSW
Central Coast 16 451 585 126 1,178
Central West 15 176 177 66 434
Far North Coast 77 698 528 316 1,619
Hunter 64 740 856 610 2,270
Illawarra 80 597 613 273 1563
Inner West 17 372 494 270 1153
Mid North Coast 86 629 544 184 1,443
Nepean 16 294 239 65 614
New England 4 239 218 114 575
Northern Sydney 114 947 1,081 639 2,781
Orana Far West 19 165 149 63 396
Riverina/Murray 27 420 620 291 1,358
South East Sydney 61 819 965 410 2,255
South West Sydney 65 547 528 241 1,381
Southern Highlands 14 365 273 159 811
Western Sydney 15 414 679 326 1,434
Total across levels 690 7,873 8,549 4,153 21,265
VIC
Barwon-South Western 36 638 628 242 1,544
Eastern Metro 70 1,896 1,242 819 4,027
Gippsland 19 397 435 244 1,095
Grampians 25 577 252 101 955
Hume 14 462 500 157 1,133
Loddon-Mallee 7 435 358 297 1,097
Northern Metro 67 1,154 1,053 744 3,018
Southern Metro 47 1,863 1,265 1,308 4,483
Western Metro 31 957 752 487 2,227
Total across levels 316 8,379 6,485 4,399 19,579

Home Care Packages Program – Data Report
28
State/territory Level 1 Level 2 Level 3 Level 4 Total
QLD
Brisbane North 6 540 494 247 1,287
Brisbane South 39 607 631 348 1,625
Cabool 6 443 478 305 1,232
Central West 1 12 5 4 22
Darling Downs 39 314 317 214 884
Far North 9 278 129 88 504
Fitzroy 0 374 739 81 1,194
Logan River Valley 18 239 337 202 796
Mackay 15 141 65 32 253
North West 1 8 18 5 32
Northern 1 121 209 255 586
South Coast 62 398 584 367 1,411
South West 1 30 24 18 73
Sunshine Coast 23 655 586 352 1,616
West Moreton 25 102 77 73 277
Wide Bay 34 333 253 133 753
Total across levels 280 4,595 4,946 2,724 12,545
WA
Goldfields 0 11 14 14 39
Great Southern 0 29 96 73 198
Kimberley 0 23 23 8 54
Metro East 4 271 365 242 882
Metro North 20 607 541 497 1,665
Metro South East 15 412 364 337 1,128
Metro South West 5 255 581 473 1,314
Mid West 0 31 54 24 109
Pilbara 0 6 2 5 13
South West 14 76 150 207 447
Wheatbelt 1 39 60 82 182
Total across levels 59 1760 2,250 1,962 6,031

Home Care Packages Program – Data Report
29
State/territory Level 1 Level 2 Level 3 Level 4 Total
SA
Eyre Peninsula 18 103 95 42 258
Flinders & Far North 2 22 40 18 82
Hills, Mallee & Southern 21 208 222 72 523
Metro East 3 141 473 495 1,112
Metro North 15 294 690 466 1,465
Metro South 8 375 521 308 1,212
Metro West 3 118 425 449 995
Mid North 0 32 64 27 123
Riverland 1 66 80 30 177
South East 12 50 57 20 139
Yorke, Lower North & Barossa
8 130 151 110 399
Total across levels 91 1,539 2,818 2,037 6,485
TAS
North Western 2 92 126 93 313
Northern 11 183 209 167 570
Southern 4 277 450 244 975
Total across levels 17 552 785 504 1,858
ACT
Total across levels 5 241 254 235 735
NT
Alice Springs 0 17 6 4 27
Barkly 0 2 0 1 3
Darwin 0 49 57 59 165
East Arnhem 0 1 0 0 1
Katherine 0 10 7 6 23
Total across levels 0 79 70 70 219
UNKNOWN ACPR
Total Unknown across levels 7 129 147 86 369
NATIONAL
Total across levels 1,465 25,147 26,304 16,170 69,086
Note: Totals may not add as they include incomplete records requiring further address information.
Home Care Packages Program – Data Report
30
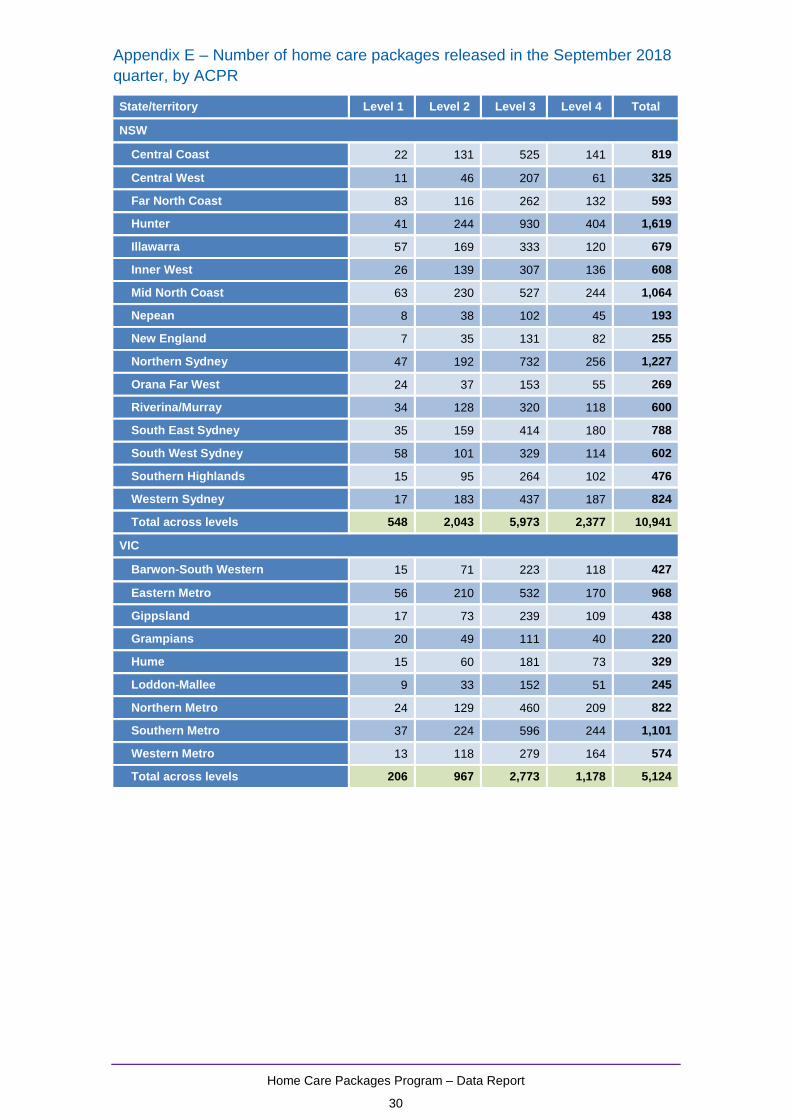
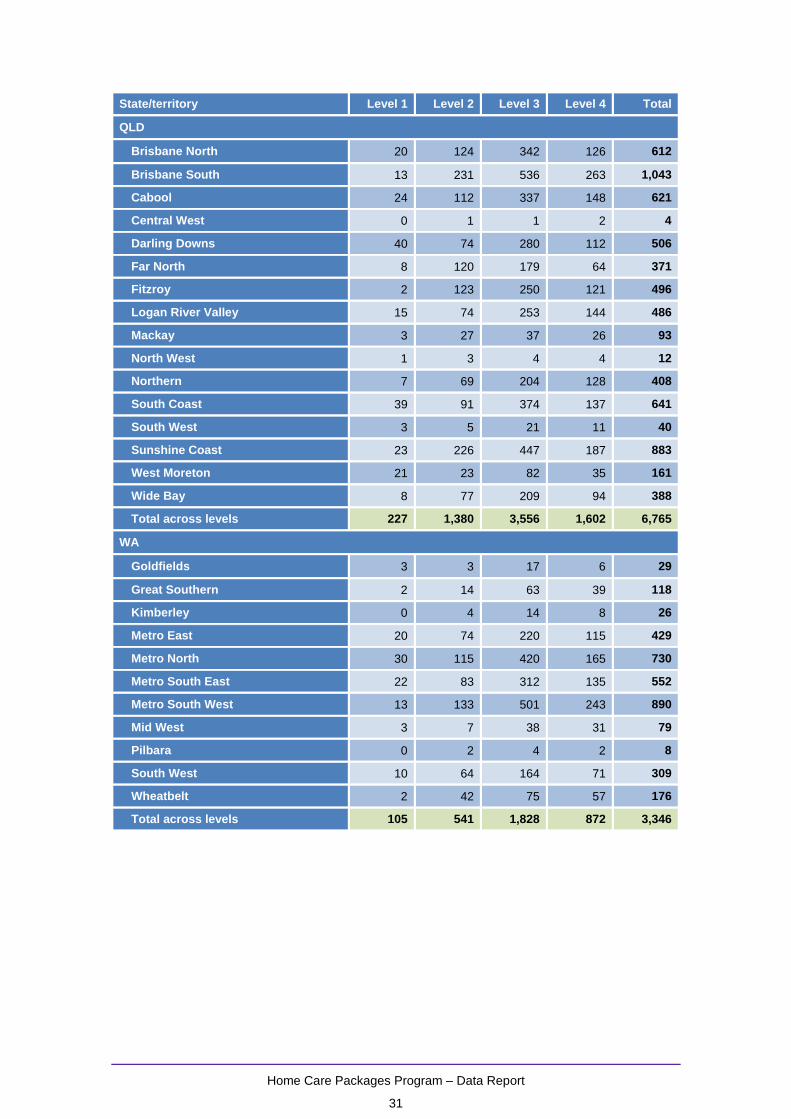
Appendix E – Number of home care packages released in the September 2018
quarter, by ACPR
State/territory Level 1 Level 2 Level 3 Level 4 Total
NSW
Central Coast 22 131 525 141 819
Central West 11 46 207 61 325
Far North Coast 83 116 262 132 593
Hunter 41 244 930 404 1,619
Illawarra 57 169 333 120 679
Inner West 26 139 307 136 608
Mid North Coast 63 230 527 244 1,064
Nepean 8 38 102 45 193
New England 7 35 131 82 255
Northern Sydney 47 192 732 256 1,227
Orana Far West 24 37 153 55 269
Riverina/Murray 34 128 320 118 600
South East Sydney 35 159 414 180 788
South West Sydney 58 101 329 114 602
Southern Highlands 15 95 264 102 476
Western Sydney 17 183 437 187 824
Total across levels 548 2,043 5,973 2,377 10,941
VIC
Barwon-South Western 15 71 223 118 427
Eastern Metro 56 210 532 170 968
Gippsland 17 73 239 109 438
Grampians 20 49 111 40 220
Hume 15 60 181 73 329
Loddon-Mallee 9 33 152 51 245
Northern Metro 24 129 460 209 822
Southern Metro 37 224 596 244 1,101
Western Metro 13 118 279 164 574
Total across levels 206 967 2,773 1,178 5,124
Home Care Packages Program – Data Report
31
State/territory Level 1 Level 2 Level 3 Level 4 Total
QLD
Brisbane North 20 124 342 126 612
Brisbane South 13 231 536 263 1,043
Cabool 24 112 337 148 621
Central West 0 1 1 2 4
Darling Downs 40 74 280 112 506
Far North 8 120 179 64 371
Fitzroy 2 123 250 121 496
Logan River Valley 15 74 253 144 486
Mackay 3 27 37 26 93
North West 1 3 4 4 12
Northern 7 69 204 128 408
South Coast 39 91 374 137 641
South West 3 5 21 11 40
Sunshine Coast 23 226 447 187 883
West Moreton 21 23 82 35 161
Wide Bay 8 77 209 94 388
Total across levels 227 1,380 3,556 1,602 6,765
WA
Goldfields 3 3 17 6 29
Great Southern 2 14 63 39 118
Kimberley 0 4 14 8 26
Metro East 20 74 220 115 429
Metro North 30 115 420 165 730
Metro South East 22 83 312 135 552
Metro South West 13 133 501 243 890
Mid West 3 7 38 31 79
Pilbara 0 2 4 2 8
South West 10 64 164 71 309
Wheatbelt 2 42 75 57 176
Total across levels 105 541 1,828 872 3,346

Home Care Packages Program – Data Report
32
State/territory Level 1 Level 2 Level 3 Level 4 Total
SA
Eyre Peninsula 1 15 34 16 66
Flinders & Far North 0 5 24 10 39
Hills, Mallee & Southern 20 52 170 63 305
Metro East 7 38 242 119 406
Metro North 15 53 372 99 539
Metro South 19 65 350 157 591
Metro West 7 43 221 133 404
Mid North 3 9 43 15 70
Riverland 3 10 55 21 89
South East 11 25 56 20 112
Yorke, Lower North & Barossa 13 36 108 36 193
Total across levels 99 351 1,675 689 2,814
TAS
North Western 7 25 63 42 137
Northern 7 29 82 44 162
Southern 2 23 144 88 257
Total across levels 16 77 289 174 556
ACT
Total across levels 11 91 251 106 459
NT
Alice Springs 1 6 11 7 25
Barkly 0 0 2 1 3
Darwin 0 12 27 27 66
East Arnhem 0 1 2 2 5
Flinders & Far North 0 1 2 5 8
Katherine 1 1 5 1 8
Total across levels 2 21 49 43 115
UNKNOWN ACPR
Total Unknown across levels 1 3 17 9 30
NATIONAL
Total across levels 1,215 5,474 16,411 7,050 30,150
Note: Data is based on the client’s suburb. As some suburbs cross ACPR boundaries, and in some instances state boundaries, a small number of people may be apportioned to a neighbouring jurisdiction.