Embed Size (px)
Citation preview

HOME CARE PACKAGES PROGRAM
Data Report
1 July – 30 September 2017 November 2017

Home Care Packages Program – Data Report
2
Table of Contents
Executive Summary ........................................................................................... 3
Introduction......................................................................................................... 4
Overview ............................................................................................................................. 4
Scope of the report ............................................................................................................. 4
1. Eligibility and assessment .............................................................................. 5
2. Prioritisation queue ........................................................................................ 7
Number of consumers on the national prioritisation queue ................................................ 7
Number of home care packages released ......................................................................... 9
Number of packages assigned by Aged Care Planning Region ...................................... 11
3. Service delivery ............................................................................................ 14
Number of consumers in home care ................................................................................ 14
Number of consumers in care across Aged Care Planning Regions……………………...15
Number of approved home care providers ....................................................................... 18
Approved Providers and potential consumers by Aged Care Planning Region .............. 18
4. Maximum exit amounts ................................................................................ 23
Glossary ........................................................................................................... 25

Home Care Packages Program – Data Report
3
Executive Summary
There were 31,698 approvals for home care between 1 July and
30 September 2017, bringing total approvals since the commencement of the
new arrangements to 69,716.
Overall demand for home care is increasing, with the average number of daily
approvals growing by 23.9% since March 2017.
As at 30 September 2017, there were 101,508 consumers in the queue, with
40.2% assigned an interim package.
32,722 home care packages were assigned to consumers between 1 July and
30 September 2017, taking the total number of packages released since the
commencement of the new arrangements to 80,451.
An additional 6,000 higher level home care packages were made available in
mid-September to help address demand for level 3 and 4 package levels.
As at 30 June 2017, there were 71,423 consumers in a home care package, an
increase of 1.2% since 31 March 2017.
There were approximately 6,900 new entries to home care between
1 April and 30 June 2017, and approximately 6,100 exits.
The proportion of consumers in care across metropolitan, rural and remote
regions remained steady to 30 June 2017 since the introduction of Increasing
Choice.
As at 30 September 2017, there were 766 approved home care providers with a
home care service, an increase of 4.2% since 30 June 2017.
The average maximum exit amount was $279 at 30 September 2017, remaining
relatively consistent over the reporting period.
35.9% of providers had indicated that they will not deduct an exit amount at
30 September 2017.
Home Care Packages Program – Data Report
4
INTRODUCTION
OVERVIEW
This report provides an update on the operation of the Home Care Packages Program following
the introduction of new arrangements for the program on 27 February 2017. It builds on the first
Home Care Packages Program Data Report, which was issued in September 2017 and covered
the period 27 February to 30 June 2017. It is available at https://agedcare.health.gov.au/ageing-
and-aged-care-publications-and-articles/ageing-and-aged-care-reports.
This report consists of four chapters:
Chapter 1 covers assessment for home care and the number of approvals.
Chapter 2 covers the prioritisation of home care consumers in the national queue.
Chapter 3 covers the delivery of home care services.
Chapter 4 covers maximum exit amounts.
Information on the Home Care Packages Program, including eligibility, fees and recent reforms
can be found at Home Care Packages Program | Ageing and Aged Care.
A Glossary is also provided at the end of the report explaining specific terminology and
abbreviations used throughout the report.
Data in this report was collected from departmental information systems and records.
SCOPE OF THE REPORT
Where possible, information for the period between 1 July and 30 September 2017 is reported
on, with the exception of data related to the number of consumers in home care. This
information is only available up to 30 June 2017, due to a lag in data availability. This lag is
primarily due to the time provided for consumers to make choices on assigned packages and
reporting allowance times for providers. Data from the previous reporting period is included
where relevant to give an indication of trends over time. The department expects that future
reporting on the home care system will evolve as more information becomes available, and in
response to stakeholder feedback.
Existing Government reporting on home care continues through a range of publications,
including:
the Report on the Operation of the Aged Care Act (ROACA);
the Department of Health Portfolio Budget Statements (PBS) and Annual Report;
the Productivity Commission’s annual Report on Government Services (ROGS); and
the Aged Care Financing Authority’s (ACFA) Report on the Funding and Financing of the
Aged Care Sector.

Home Care Packages Program – Data Report
5
1. ELIGIBILITY AND ASSESSMENT
Key points:
There were 31,698 approvals for home care between 1 July and 30 September 2017,
bringing total approvals since the commencement of the new arrangements to 69,716.
Overall demand for home care is increasing, with the average number of approvals for
home care per day growing by 23.9% since March 2017.
This section presents data on the number of approvals for home care made as an outcome of
assessments conducted by Aged Care Assessment Teams (ACATs).
There were 31,698 total home care approvals over the reporting period (Table 1):
o The most frequent home care approval was for level 4 (39.1% or 12,405).
o 28.7% (9,083 of 31,698) were high priority.
o There was a strong correlation between a higher level of approval (level 3 and 4)
and likelihood of the approval being a high priority. For level 4 approvals, 51.1%
(6,343 of 12,405) were high priority, compared to only 4.4% of level 1 approvals
(9 of 203).
Table 1: Number of home care approvals between 1 July and 30 September 2017 by level and priority
Level 1 Level 2 Level 3 Level 4 Total
High 9 663 2,068 6,343 9,083
Medium 194 8,051 8,308 6,062 22,615
Total 203 8,714 10,376 12,405 31,698
Table 2 (over page) demonstrates there is some variation between states and territories
in terms of the rate of high priority approvals.
Whilst recognising the role of clinical assessment, needs based advice and the
likelihood of variations over time, the variation has been raised with contracted
assessment services. A fundamental requirement of the national prioritisation system is
consistency of assessment, and that high priority approvals are applied only in
exceptional circumstances. Additional support and training has been provided to ACATs
to ensure a greater consistency of approach to approvals in the future. The department
will monitor this closely to ensure integrity of national approach and implementation of
the principles of assessment. This will allow the priority system to operate effectively and
ensure genuinely high priority consumers gain rapid access to home care.

Home Care Packages Program – Data Report
6
Table 2: Number of home care approvals by jurisdiction, level and priority
State/ Territory
Level 1 Level 2 Level 3 Level 4 Total
High Medium High Medium High Medium High Medium
NSW 7 62 283 2,580 1,023 2,938 2,234 1,752 10,879
VIC 1 51 74 2,452 202 1,647 1,082 1,177 6,686
QLD 1 49 244 1,531 576 1,668 1,622 1,050 6,741
WA 0 10 31 562 139 541 774 641 2,698
SA 0 13 23 524 93 1,072 416 1,078 3,219
TAS 0 5 5 245 21 323 101 216 916
ACT 0 3 3 119 9 87 72 111 404
NT 0 1 0 38 5 32 42 37 155
National 9 194 663 8,051 2,068 8,308 6,343 6,062 31,698
An upwards trend in the average daily number of approvals continued over the
July-September reporting period, reflecting strong demand for home care packages into
the future (Chart 1).
Between March and September there was a 23.9% increase in the average number of
approvals each day, from 401 to 497. This is well above historical population growth in
the over 70s category, which has averaged 3% annually over the past five years.
Potential drivers of growth in the number of approvals include an increase in promotional
activities within the home care market coinciding with the Increasing Choice reforms.
Chart 1: Average number of home care approvals between 27 February and 30 September 2017 for working days in month.
Note: Last 2 days of February have been included in average working days for March. Excludes national public holidays.
Mar Apr May Jun Jul Aug Sep
Daily Home CareApprovals
401 439 450 463 451 500 497
0
100
200
300
400
500
600

Home Care Packages Program – Data Report
7
2. PRIORITISATION QUEUE
Key points
As at 30 September 2017, there were 101,508 consumers in the national prioritisation
queue, with 40.2% assigned an interim package.
32,722 home care packages were assigned to consumers between 1 July and
30 September 2017, taking the total number of packages released since the
commencement of the new arrangements to 80,451.
An additional 6,000 higher level home care packages were made available in
mid-September to help address demand for level 3 and 4 package levels.
NUMBER OF CONSUMERS ON THE NATIONAL PRIORITISATION QUEUE
This section presents data on the number of consumers who are seeking a home care package
at their approved level on the national prioritisation queue (the queue).
As at 30 September 2017, there were 101,508 consumers queued for home care.
This number represents an increase of 14.2% (12,402) since 30 June 2017 (Chart 2).
40.2% (40,894) of queued consumers were assigned an interim package while waiting
to receive a package at their approved level. This rate remained relatively steady from
30 June 2017, when 39.5% of consumers on the queue were assigned an interim
package.
The queue continued to grow overall in the July-September reporting period.
This was driven by two main factors:
o The upwards trend in the average daily number of approvals over the
July-September reporting period, suggesting strong demand for home care
packages into the future (Chart 1 in previous section).
o High demand for level 3 and 4 packages, leading to consumers approved for these
levels remaining on the queue, either with an interim package or waiting for their
approved level of package without an interim package.

Home Care Packages Program – Data Report
8
Chart 2: Number of consumers on the national prioritisation queue, over time
Consumers waiting for higher level 3 and 4 packages totalled 77.3% of the queue at
30 September (Table 4).
o Demand for level 4 packages represented 59.2% of the total queue, down from
63.6% at 30 June 2017.
Growth on the queue continues to be strongest at level 3, as the transition to four
distinct approval categories on 27 February 2017 flows through the system. Prior to this
date, consumers were approved in broad-banded categories at either level 1-2 or
level 3-4.
In acknowledgement of the demand for higher level packages, the Government
announced on 14 September 2017 that a total 6,000 packages at levels 3 and 4 would
be made available to consumers. As at the end of the reporting period, the department
had commenced releasing these through the system, with the remainder to be released
by the end of November in the subsequent period. These packages have been released
through the system in line with the release methodology, which was adjusted on a
weekly basis during the period.
0
20,000
40,000
60,000
80,000
100,000
120,000
31-Mar 30-Apr 30-May 30-Jun 31-Jul 31-Aug 30-Sep
All consumers awaitingapproved level package
78,331 81,683 86,294 88,904 93,960 98,898 101,508
Consumers not assigned ahome care package, awaiting
approved level53,632 55,269 56,680 53,750 55,623 56,907 60,615
Consumers assigned aninterim (lower) level package,
awaiting approved level24,699 26,414 29,614 35,154 38,337 41,991 40,893

Home Care Packages Program – Data Report
9
Table 3: Total number of consumers on the national prioritisation queue, by level of approval and state and territory of residence as at 30 September 2017
State/Territory Level 1 Level 2 Level 3 Level 4 Grand Total
NSW 71 7,342 6,874 20,246 34,533
VIC 54 7,257 3,610 10,642 21,563
QLD 44 3,806 3,662 11,794 19,306
WA 11 1,362 1,351 7,184 9,908
SA 12 1,543 2,033 7,786 11,374
TAS 3 577 516 1,295 2,391
ACT 3 341 217 1,067 1,628
NT 1 105 67 262 435
National 201 22,424 18,434 60,449 101,508
Note: National total may include incomplete records requiring further address information.
WAIT TIMES
On 14 September 2017, expected wait times to receive a home care package were
made available to home care consumers through the My Aged Care Contact Centre or
Client Portal.
All consumers approved for a home care package, and seeking services on the queue,
can access their individual expected wait times to receive their first package, and their
approved package level. Wait times vary depending on the consumer’s individual
circumstances, including how long they have been waiting for care and their priority for
home care.
NUMBER OF HOME CARE PACKAGES RELEASED
Home care packages are not released on a one-for-one basis. The department models the
number of packages to release at each level and priority in accordance with a number of
parameters including:
o The number of pre-existing packages in the system at each level.
o The turn-over of packages as consumers exit care. The department uses modelling
to anticipate exits from care, and re-releases these packages back into the system
accordingly.
o How many consumers will utilise a home care package and how quickly they will
enter into care. Not all consumers will take up their assigned home care package.
This is accounted for in the number of packages released to ensure maximum
reach. For example, some consumers automatically placed on the queue in the
transition to the new arrangements for home care may already have appropriate
care arrangements in place, but are yet to opt-out of the queue.
The department released 32,722 home care packages to consumers over the
July-September reporting period (Table 4).

Home Care Packages Program – Data Report
10
Table 4: Home care packages released to consumers between July and September 2017 by level and priority.
Month Level 1 Level 2 Level 3 Level 4
Total Med High Med High Med High Med High
July 1,339 23 4,896 1,513 510 204 643 324 9,452
August 1,694 5 7,337 1,262 893 318 999 462 12,970
September 818 2 4,794 851 734 951 1,380 770 10,300
Subtotal 3,851 30 17,027 3,626 2,137 1,473 3,022 1,556 32,722
Total 3,881 20,653 3,610 4,578
The department no longer decides the number of packages that will be delivered in each
jurisdiction. The assignment of packages across states and territories reflects how many
consumers reached the top of the queue from each jurisdiction over the reporting
period.
Table 5: Number of packages assigned to consumers residing in each state and territory by month
State/territory July August September Total
NSW 3,615 4,726 3,709 12,050
VIC 1,539 2,308 2,055 5,902
QLD 2,054 2,775 2,300 7,129
WA 910 1,294 915 3,119
SA 913 1,222 827 2,962
TAS 149 227 211 587
ACT 161 241 140 542
NT 38 55 35 128
National 9,452 12,970 10,300 32,722
Note: Totals may include incomplete records requiring further address information.
Over the July-September reporting period, 28.2% (9,233) of packages were assigned as
upgrades to consumers who had previously been assigned a lower level home care
package. These consumers either:
o were already in care with a provider at a lower level, and were automatically
upgraded to the higher level (3,854 of packages assigned as upgrades); or
o had not yet commenced care with a provider at the lower level package.
Table 6: Number assigned to consumers not previously accessing home care, and number assigned as upgrades
Month Assigned to consumers
not previously accessing home care
Assigned as package upgrades
Total
July 7,166 2,286 9,452
August 9,384 3,586 12,970
September 6,939 3,361 10,300
Total 23,489 9,233 32,722

Home Care Packages Program – Data Report
11
Over the reporting period at least 1.9% of packages assigned to consumers were assigned to those identifying as Aboriginal and Torres Strait Islander. A further 22.8% were assigned to consumers who met the criteria for being considered Culturally and Linguistically Diverse based on the Australian Bureau of Statistics’ country of birth definition.
Table 7: Percentage of packages assigned to Aboriginal and Torres Strait Islander or Culturally and Linguistically Diverse consumers
Percentage packages assigned
Aboriginal and Torres Strait Islanders
1.9%
Culturally and Linguistically Diverse
22.8%
NUMBER OF PACKAGES ASSIGNED BY AGED CARE PLANNING REGION
Totals for each Aged Care Planning Region (ACPR) will not match state totals, as not all consumers assigned a package could be mapped to an ACPR.
Table 8: Number of packages assigned by level in each Aged Care Planning Region between 1 July 2017 and 30 September 2017.
State/territory Level 1 Level 2 Level 3 Level 4
NSW
Central Coast 65 423 46 42
Central West 26 184 16 13
Far North Coast 72 358 39 28
Hunter 122 671 101 94
Illawarra 61 331 33 25
Inner West 52 333 40 43
Mid North Coast 83 506 69 92
Nepean 29 139 <10 12
New England 27 151 22 16
Northern Sydney 133 830 54 63
Orana Far West 59 178 13 15
Riverina/Murray 102 413 49 32
South East Sydney 104 477 63 70
South West Sydney 113 453 33 43
Southern Highlands 71 296 36 33
Western Sydney 46 394 32 39
Total across levels 12,050
VIC
Barwon-South Western 68 285 34 46
Eastern Metro 171 618 35 45
Gippsland 68 225 31 33
Grampians 46 179 22 12

Home Care Packages Program – Data Report
12
State/territory Level 1 Level 2 Level 3 Level 4
Hume 39 177 33 15
Loddon-Mallee 21 110 11 11
Northern Metro 102 444 57 85
Southern Metro 174 610 57 74
Western Metro 61 310 29 65
Total across levels 5,902
QLD
Brisbane North 79 375 28 38
Brisbane South 75 463 46 58
Cabool 106 333 20 33
Central West <10 <10 <10 <10
Darling Downs 53 301 41 42
Far North 27 171 12 20
Fitzroy 29 220 31 44
Logan River Valley 25 185 32 42
Mackay <10 41 <10 <10
North West <10 <10 <10 <10
Northern 29 218 40 47
South Coast 42 304 41 77
South West <10 16 <10 <10
Sunshine Coast 92 536 74 70
West Moreton 15 119 <10 12
Wide Bay 42 243 21 28
Total across levels 7,129
WA
Goldfields <10 12 <10 <10
Great Southern <10 42 <10 12
Kimberley <10 11 <10 <10
Metropolitan East 36 201 16 28
Metropolitan North 47 406 37 58
Metropolitan South East 45 334 34 42
Metropolitan South West 48 422 49 80
Mid West <10 31 <10 <10
Pilbara <10 <10 <10 <10
South West <10 105 21 14
Wheatbelt <10 51 <10 <10
Total across levels 3,119
SA
Eyre Peninsula <10 55 <10 <10
Flinders & Far North <10 20 <10 <10

Home Care Packages Program – Data Report
13
State/territory Level 1 Level 2 Level 3 Level 4
Hills, Mallee & Southern 36 205 22 23
Metropolitan East 21 212 31 33
Metropolitan North 26 197 25 <10
Metropolitan South 32 321 29 31
Metropolitan West <10 206 36 40
Mid North <10 40 <10 <10
Riverland 13 63 <10 <10
South East 25 97 <10 <10
Yorke, Lower North & Barossa 22 153 18 <10
Total across levels 2,962
TAS
North Western 15 79 <10 14
Northern 21 91 <10 <10
Southern 20 114 20 31
Total across levels 587
ACT
ACT 51 295 28 30
Total across levels 542
NT
Alice Springs <10 18 <10 <10
Barkly <10 <10 <10 <10
Darwin <10 23 <10 <10
East Arnhem <10 <10 <10 <10
Katherine <10 <10 <10 <10
Total across levels 128
NATIONAL Level 1 Level 2 Level 3 Level 4
3,881 20,653 3,610 4,578
TOTAL 32,722
Note: Totals may include incomplete records requiring further address information.

Home Care Packages Program – Data Report
14
3. SERVICE DELIVERY
Key points
As at 30 June 2017, there were 71,423 consumers in a home care package, an increase
of 1.2% since 31 March 2017.
There were approximately 6,900 new entries to home care between 1 April and
30 June 2017 and 6,100 exits.
The proportion of consumers in care across metropolitan, rural and remote regions
remained steady to 30 June 2017 since the introduction of Increasing Choice.
As at 30 September 2017, there were 766 approved home care providers with a home
care service, an increase of 4.2% since the previous reporting period.
NUMBER OF CONSUMERS IN HOME CARE
There were 71,423 consumers in home care as at 30 June 2017. Growth in the number
of consumers in home care slowed slightly over the March-June quarter (Chart 3) to
1.2%.
This comprises approximately 6,900 new entries to home care over the period, and
6,100 exits from care.
Chart 3: Number of consumers in home care over 2016-17
60,000
62,000
64,000
66,000
68,000
70,000
72,000
Nu
mb
er
of
co
ns
um
ers
in
ca
re
30-Jun-16 30-Sep-16 31-Dec-16 31-Mar-17 30-Jun-17
Number of consumers in care 64,069 66,244 68,657 70,579 71,423

Home Care Packages Program – Data Report
15
Analysis of the proportion of consumers in care across metropolitan, regional and
remoteness classifications shows the proportions across all areas have remained relatively
stable since the introduction of Increasing Choice.
Table 9 shows a breakdown of the proportion of total consumers in care according to the
Modified Monash Model classifications – with 1 describing major metropolitan regions and 7
describing the most remote regions.
Table 9: Proportion of total number of people in home care by MMMs: before and after Increasing Choice commenced.
MMM Proportion of total
in care as at 31 Dec
Proportion of total in care as at 31
March
Proportion of total in care as at 30
June
1 65.4% 65.3% 64.8%
2 9.2% 9.2% 9.4%
3 9.4% 9.5% 9.6%
4 5.2% 5.2% 5.1%
5 7.5% 7.5% 7.8%
6 0.9% 1.0% 1.0%
7 0.7% 0.7% 0.7%
NUMBER OF CONSUMERS IN CARE ACROSS AGED CARE PLANNING
REGIONS
Table 10: Number of consumers in home care as at 31 March 2017 by level and ACPR
State/territory Level 1 Level 2 Level 3 Level 4
NSW
Central Coast 28 1,008 149 304
Central West 16 464 56 125
Far North Coast 33 894 113 238
Hunter 59 1,667 200 440
Illawarra 28 1,038 127 305
Inner West 51 1,027 139 300
Mid North Coast 31 1,157 175 321
Nepean 11 556 75 152
New England <10 462 87 140
Northern Sydney 31 1,819 233 504
Orana Far West <10 376 53 110
Riverina/Murray 22 720 94 188
South East Sydney 53 1,590 225 462

Home Care Packages Program – Data Report
16
State/territory Level 1 Level 2 Level 3 Level 4
South West Sydney 36 1,330 184 460
Southern Highlands 26 578 71 164
Western Sydney 19 1,256 211 441
Total 452 16,050 2,199 4,686
VIC
Barwon-South Western 26 1,066 138 277
Eastern Metro 63 2,437 365 733
Gippsland 27 780 104 222
Grampians 19 563 78 171
Hume 20 757 102 202
Loddon-Mallee 17 830 99 240
Northern Metro 44 1,696 242 487
Southern Metro 90 2,921 360 817
Western Metro 41 1,512 216 421
Total 350 12,689 1,724 3,627
QLD
Brisbane North 14 756 112 266
Brisbane South 15 1,152 169 384
Cabool 4 736 113 260
Central West <10 14 <10 <10
Darling Downs 25 620 85 223
Far North <10 438 72 159
Fitzroy 18 416 61 138
Logan River Valley <10 525 82 201
Mackay <10 176 26 79
North West <10 64 <10 13
Northern <10 430 60 184
South Coast 11 1,010 133 378
South West <10 71 <10 15
Sunshine Coast 32 1,143 155 429
West Moreton <10 373 32 156
Wide Bay 27 691 116 230
Total 173 8,709 1,239 3,147
WA
Goldfields <10 35 <10 28
Great Southern <10 106 22 87
Kimberley <10 83 <10 25
Metropolitan East <10 531 107 366
Metropolitan North 13 833 184 668

Home Care Packages Program – Data Report
17
State/territory Level 1 Level 2 Level 3 Level 4
Metropolitan South East <10 538 111 374
Metropolitan South West <10 690 162 605
Mid West <10 115 17 76
Pilbara <10 39 <10 19
South West <10 215 25 199
Wheatbelt <10 114 28 98
Total 27 3,350 691 2,593
SA
Eyre Peninsula <10 139 30 43
Flinders & Far North <10 72 <10 <10
Hills, Mallee & Southern 21 463 68 131
Metropolitan East <10 479 70 136
Metropolitan North <10 555 101 224
Metropolitan South 17 828 102 226
Metropolitan West 25 570 72 128
Mid North <10 71 13 22
Riverland <10 129 16 39
South East <10 172 28 42
Yorke, Lower North & Barossa <10 314 34 87
Total 85 3,817 546 1,095
TAS
North Western <10 275 42 82
Northern 12 359 60 109
Southern 28 626 88 185
Total 49 1,265 191 382
ACT
ACT 24 773 116 486
Total 24 773 116 486
NT
Alice Springs <10 134 <10 13
Barkly <10 30 <10 <10
Darwin <10 164 17 100
East Arnhem <10 64 <10 <10
Katherine <10 44 <10 <10
Total <10 548 29 150
NATIONAL Level 1 Level 2 Level 3 Level 4
Total 1,166 47,242 6,742 16,177
Notes: 1. For privacy reasons, where a consumer count is less than or equal to ten, it is represented as <10. 2. Location of a home care consumer is based on the address of the consumer. 3. Totals do not add as they include incomplete records requiring further address information.

Home Care Packages Program – Data Report
18
NUMBER OF APPROVED HOME CARE PROVIDERS
There were 766 approved home care providers as at 30 September 2017. This is an
increase of 4.2% from 30 June 2017 (Chart 4).
Chart 4: Number of approved providers of home care with home care services, by month
Note: Approved provider count is based on the approval effective date.
APPROVED PROVIDERS AND POTENTIAL CONSUMERS BY AGED CARE
PLANNING REGION
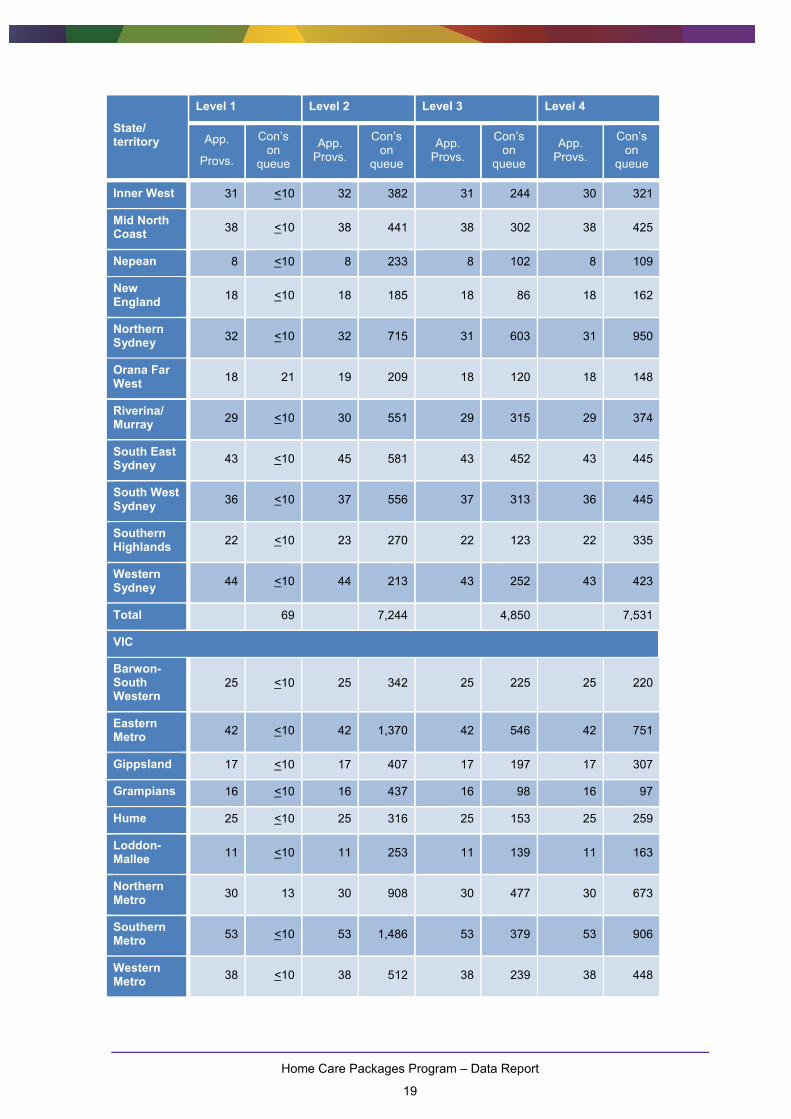
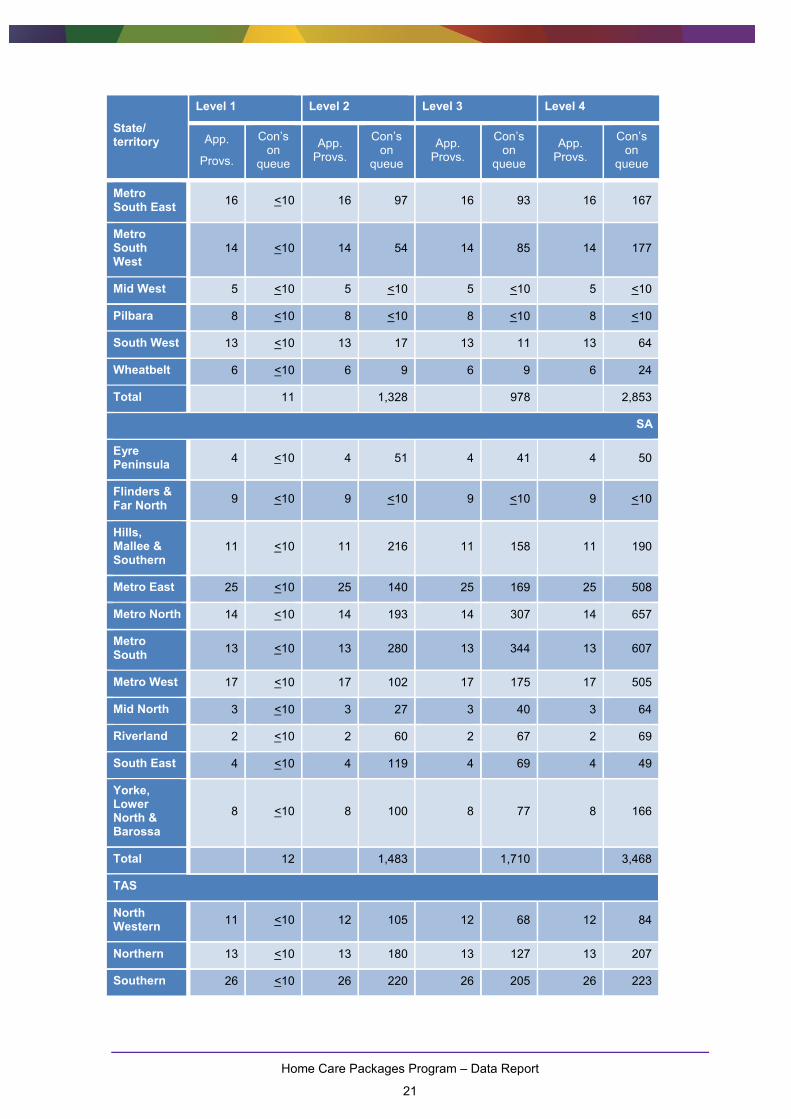
Table 11: Count of providers and potential consumers by ACPR as at 30 September 2017
State/ territory
Level 1 Level 2 Level 3 Level 4
App.
Provs.
Con’s on
queue
App. Provs.
Con’s on
queue
App. Provs.
Con’s on
queue
App. Provs.
Con’s on
queue
NSW
Central Coast
20 <10 20 346 20 292 20 315
Central West
17 <10 18 180 17 92 17 151
Far North Coast
28 <10 28 511 28 252 28 406
Hunter 47 <10 47 408 46 327 46 822
Illawarra 31 <10 31 346 31 284 31 321
650
670
690
710
730
750
770
790
31-Mar 30-Apr 31-May 30-Jun 31-Jul 31-Aug 30-Sep
Total approved providers 693 708 723 735 747 756 766
Home Care Packages Program – Data Report
19
State/ territory
Level 1 Level 2 Level 3 Level 4
App.
Provs.
Con’s on
queue
App. Provs.
Con’s on
queue
App. Provs.
Con’s on
queue
App. Provs.
Con’s on
queue
Inner West 31 <10 32 382 31 244 30 321
Mid North Coast
38 <10 38 441 38 302 38 425
Nepean 8 <10 8 233 8 102 8 109
New England
18 <10 18 185 18 86 18 162
Northern Sydney
32 <10 32 715 31 603 31 950
Orana Far West
18 21 19 209 18 120 18 148
Riverina/ Murray
29 <10 30 551 29 315 29 374
South East Sydney
43 <10 45 581 43 452 43 445
South West Sydney
36 <10 37 556 37 313 36 445
Southern Highlands
22 <10 23 270 22 123 22 335
Western Sydney
44 <10 44 213 43 252 43 423
Total 69 7,244 4,850 7,531
VIC
Barwon-South Western
25 <10 25 342 25 225 25 220
Eastern Metro
42 <10 42 1,370 42 546 42 751
Gippsland 17 <10 17 407 17 197 17 307
Grampians 16 <10 16 437 16 98 16 97
Hume 25 <10 25 316 25 153 25 259
Loddon-Mallee
11 <10 11 253 11 139 11 163
Northern Metro
30 13 30 908 30 477 30 673
Southern Metro
53 <10 53 1,486 53 379 53 906
Western Metro
38 <10 38 512 38 239 38 448

Home Care Packages Program – Data Report
20
State/ territory
Level 1 Level 2 Level 3 Level 4
App.
Provs.
Con’s on
queue
App. Provs.
Con’s on
queue
App. Provs.
Con’s on
queue
App. Provs.
Con’s on
queue
Total 55 7,151 2,931 4,751
QLD
Brisbane North
36 <10 35 421 35 285 35 426
Brisbane South
42 <10 42 410 42 250 42 490
Cabool 19 <10 20 289 20 166 20 360
Central West
8 <10 9 <10 8 <10 8 <10
Darling Downs
22 11 22 270 23 211 23 410
Far North 19 <10 20 136 19 61 19 108
Fitzroy 18 <10 18 146 18 189 18 167
Logan River Valley
22 <10 22 161 22 162 22 255
Mackay 10 <10 10 120 9 44 9 65
North West 7 <10 7 20 8 12 8 <10
Northern 17 <10 17 87 16 84 16 211
South Coast
25 <10 25 306 25 372 25 503
South West 3 <10 4 23 3 11 3 16
Sunshine Coast
35 <10 35 474 35 157 35 433
West Moreton
18 <10 18 112 18 80 18 127
Wide Bay 18 <10 18 131 18 103 18 219
Total 44 3,753 2,597 4,665
WA
Goldfields 8 <10 8 <10 8 <10 8 <10
Great Southern
4 <10 4 <10 4 12 4 32
Kimberley 7 <10 7 <10 7 <10 7 <10
Metro East 26 <10 27 57 27 26 27 74
Metro North 26 <10 26 67 26 58 26 167
Home Care Packages Program – Data Report
21
State/ territory
Level 1 Level 2 Level 3 Level 4
App.
Provs.
Con’s on
queue
App. Provs.
Con’s on
queue
App. Provs.
Con’s on
queue
App. Provs.
Con’s on
queue
Metro South East
16 <10 16 97 16 93 16 167
Metro South West
14 <10 14 54 14 85 14 177
Mid West 5 <10 5 <10 5 <10 5 <10
Pilbara 8 <10 8 <10 8 <10 8 <10
South West 13 <10 13 17 13 11 13 64
Wheatbelt 6 <10 6 9 6 9 6 24
Total 11 1,328 978 2,853
SA
Eyre Peninsula
4 <10 4 51 4 41 4 50
Flinders & Far North
9 <10 9 <10 9 <10 9 <10
Hills, Mallee & Southern
11 <10 11 216 11 158 11 190
Metro East 25 <10 25 140 25 169 25 508
Metro North 14 <10 14 193 14 307 14 657
Metro South
13 <10 13 280 13 344 13 607
Metro West 17 <10 17 102 17 175 17 505
Mid North 3 <10 3 27 3 40 3 64
Riverland 2 <10 2 60 2 67 2 69
South East 4 <10 4 119 4 69 4 49
Yorke, Lower North & Barossa
8 <10 8 100 8 77 8 166
Total 12 1,483 1,710 3,468
TAS
North Western
11 <10 12 105 12 68 12 84
Northern 13 <10 13 180 13 127 13 207
Southern 26 <10 26 220 26 205 26 223

Home Care Packages Program – Data Report
22
State/ territory
Level 1 Level 2 Level 3 Level 4
App.
Provs.
Con’s on
queue
App. Provs.
Con’s on
queue
App. Provs.
Con’s on
queue
App. Provs.
Con’s on
queue
Total <10 505 400 514
ACT
ACT 24 <10 24 306 24 164 24 366
Total <10 306 164 366
NT
Alice Springs
14 <10 14 13 14 <10 14 <10
Barkly 12 <10 12 <10 12 <10 12 <10
Darwin 15 <10 15 27 15 19 15 52
East Arnhem
7 <10 7 <10 7 <10 7 <10
Katherine 11 <10 11 <10 11 <10 11 <10
Total <10 106 36 81
NATIONAL
Total 198 22,043 13,762 24,420
Notes: 1. For privacy reasons, where a count of potential consumers is less than or equal to ten, it is represented as <10. 2. A potential consumer can only be counted once in the tables at their highest active approved level. 3. Totals do not add as they include incomplete records requiring further address information. 4. An AP can be represented in the counts of more than one ACPR, as they’re not limited to where they offer services.

Home Care Packages Program – Data Report
23
4. MAXIMUM EXIT AMOUNTS
Key points:
At 30 September 2017, the average maximum exit amount was $279, remaining
relatively consistent over the reporting period.
35.9% of providers had indicated that they will not deduct an exit amount at
30 September 2017.
An exit amount is an amount that can be deducted by a home care provider from a consumer’s
unspent home care package amount if the consumer leaves their care. This may happen if the
consumer decides to change to another home care provider or when the consumer leaves
home care. It is intended to allow providers to recover administrative costs.
The maximum exit amount represents the highest dollar value the provider can include in a
consumer’s home care agreement, and must be published on My Aged Care. Providers may
choose to publish a maximum exit amount of zero, or may not publish an amount at all, in which
case, they effectively have a maximum exit amount of zero and cannot deduct an amount.
The following data describes the maximum exit amounts providers have published.
Around two-thirds of providers (491) had published a maximum exit amount of more
than zero as at 30 September, with this remaining relatively stable since
27 February 2017.
Chart 5: Maximum exit amount behaviour of home care providers
0
100
200
300
400
500
600
Num
be
r o
f h
om
e c
are
pro
vid
ers
31-Mar 30-Apr 31-May 30-Jun 31-Jul 31-Aug 30-Sep
Published exit amount >$0
455 464 468 471 470 487 491
Published exit amount =$0
152 157 163 168 172 184 192
Did not publish an exitamount
86 87 92 96 105 85 83

Home Care Packages Program – Data Report
24
The average maximum exit amount of all providers has remained relatively stable over
the current reporting period and was $279 at 30 September 2017 (Chart 6).
Chart 6: Average maximum exit amounts for home care providers
The number of providers publishing a maximum exit amount of $1,000 or more (15)
remained the same between 30 June and 30 September 2017 (Table 12).
The highest published maximum exit amount has remained at $5,000 since
27 February 2017. Only one provider publishes this amount.
As at 30 September 2017, the most common published amount other than zero was
$500.
Table 12: Number of approved providers with a maximum exit amount of $1,000 or more
27-Feb-17 30-Jun-17 30-Sep-17
No. of providers with a published maximum exit amount of more than $1,000
9 6 5
No. of providers with a published maximum exit amount of $1,000
9 9 10
Combined 18 15 15
$-
$50
$100
$150
$200
$250
$300
$350
$400
$450
$500
31-Mar 30-Apr 31-May 30-Jun 31-Jul 31-Aug 30-Sep
Average maximum exitamount
$290 $289 $284 $280 $275 $277 $279

Home Care Packages Program – Data Report
25
Glossary
Term Definition
Aged Care Act 1997 The primary legislation governing the provision of aged care services.
Aged Care Assessment Teams (ACAT)
ACATs are teams of medical and allied health professionals who assess the physical, psychological, medical, restorative, cultural and social needs of older people and help them and their carers to access appropriate levels of support.
Aged Care Financing Authority (ACFA)
ACFA provides independent advice to the Government on funding and financing issues, informed by consultation with consumers, and the aged care and finance sectors.
Aged Care Planning Region (ACPR)
The areas marked out in the ACPR maps which can be found on the department’s website.
Aged Care provision ratio
A specified national provision level of 125 residential, home, and restorative care places for every 1,000 people aged 70 years or over, to be achieved by 2021-22.
Annual Report A report that provides Members of Parliament, Senators and the public with a detailed description of the department’s activities during each financial year. It reports against planning outcomes and performance targets identified in the department’s Portfolio Budget Statements and Portfolio Additional Estimates Statements.
Approved provider An organisation that has been approved to provide home care under the Aged Care Act 1997.
Commonwealth Home Support Program (CHSP)
A program which provides entry-level support services designed to help older people stay in their homes.
Consumer Refers to both existing and prospective recipients of home care services, and their informal carers and nominated representatives.
The department Means the Department of Health. The department has responsibility for administering the Aged Care Act 1997 and has responsibility for administering the Home Care Packages Program and approval of approved providers of home care under the Aged Care Act 1997.
Exit amount An amount that can be deducted by a home care provider from a consumer’s unspent home care package amount if the consumer leaves their care.
Home care agreement A contract made between the home care consumer and approved provider. It has the same meaning given in the Aged Care Act 1997.
Home Care Packages Program
A program that supports older Australians with complex needs to remain living at home through a coordinated package of care and services to meet the individual needs of consumers.

Home Care Packages Program – Data Report
26
Term Definition
Increasing Choice in Home Care
A package of home care reforms that commenced on 27 February 2017 to improve the way that home care services are delivered to older Australians.
Interim package A package at a lower level than a consumer's approved level, through which they are able to access some home care services while waiting on the queue for a higher level package to become available.
My Aged Care The main entry point to the aged care system in Australia. My Aged Care aims to make it easier for people to access information and services on ageing and aged care.
National Disability Insurance Scheme (NDIS)
A government-funded program to support a better life for Australians with a significant and permanent disability, and their family and carers.
National prioritisation queue (the queue)
The order in which consumers have been placed for a home care package assignment, according to the time and date of their approval for home care and their priority (either medium or high).
National prioritisation system (the system)
The nationally consistent process for allocating home care packages based on consumers’ needs and circumstances.
Notified home care service
An approved provider that has notified the department of the home care service through which it will provide care and is eligible for home care subsidy under section 46-1 of the Aged Care Act 1997
Portfolio Budget Statement
A statement that informs Senators and Members of Parliament of the proposed allocation of resources to Government outcomes by entities within the Health portfolio.
Report on Government Services
A report that provides information on the equity, effectiveness and efficiency of government services in Australia.
Report on the Funding and Financing of the Aged Care Sector
A report that examines the structure and operation of the Australian aged care sector and its key characteristics; early observations on the impacts of recent reforms; funding and financial performance of the sector based on a data within a financial year; and the emerging opportunities and challenges for the sector.
Report on the Operation of the Aged Care Act 1997 (ROACA)
A report that describes the operation of the Act during a financial year and includes additional information to aid an understanding of the aged care programs and policies.
Unspent home care amount
The unspent amount remaining in a person’s home care package when they cease care with a provider, as defined in the Aged Care Act 1997.