Embed Size (px)
Citation preview
Home+ Automation Localization Sensor (HAL sensor)
By
You Guan
Gregory Linkowski
Tianxi Zhao
Final Report for ECE 445, Senior Design, Fall 2015
TA: Cara Yang
09 December 2015
Project No. 35
ii
Abstract
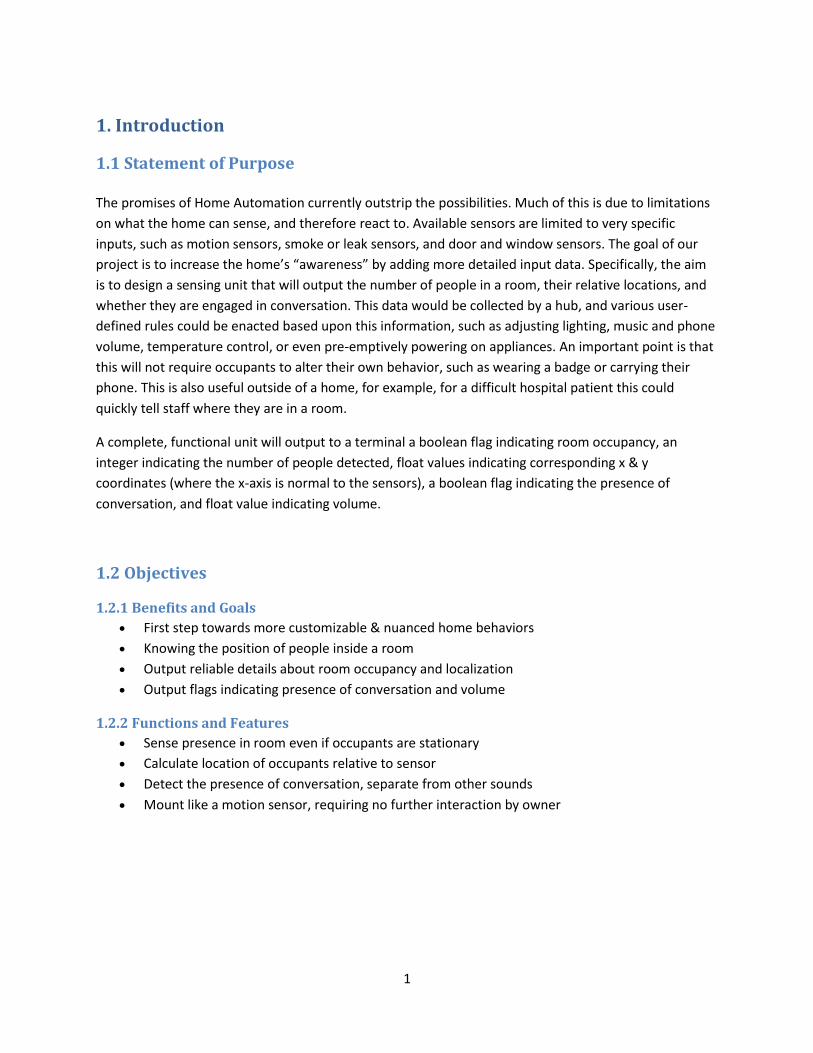
The sensor designed here is meant to provide data for use by a full home automation system. It returns
Boolean indicators of whether a room is occupied, and if conversation is detected. It also returns the
relative coordinates in feet of any detected occupant. An array of thermal sensors is used rather than a
full computer vision solution in order to reduce computational demand and cost. It is passive, requiring
no interaction from the occupants.
The results are encouraging. This relatively small and simple device can localize a person within +/- 2 ft
of their position and accurately detect the presence of human speech. Ideas are explored in the
conclusion which should improve the localization accuracy.
iii
Contents
1. Introduction .............................................................................................................................................. 1
1.1 Statement of Purpose ......................................................................................................................... 1
1.2 Objectives............................................................................................................................................ 1
1.2.1 Benefits and Goals ....................................................................................................................... 1
1.2.2 Functions and Features ................................................................................................................ 1
2 Design Procedure ....................................................................................................................................... 2
2.1 Thermal Sensing component .............................................................................................................. 2
2.1.1 Design ........................................................................................................................................... 2
2.1.2 Calculations .................................................................................................................................. 3
2.1.3 Circuit ........................................................................................................................................... 4
2.1.4 Summary ...................................................................................................................................... 4
2.2 Audio component ............................................................................................................................... 5
2.2.1 Calculations .................................................................................................................................. 5
2.2.2 Simulations ................................................................................................................................... 6
3 Design Details ............................................................................................................................................. 8
3.1 Block Diagram ..................................................................................................................................... 8
3.2 Electrical Design Schematic................................................................................................................. 9
4. Design Verification .................................................................................................................................. 10
4.1 Thermal Sensing component ............................................................................................................ 10
4.1.1 Thermal Pixel Temperature Detection ....................................................................................... 10
4.1.2 I2C Data Transmission ................................................................................................................ 10
3.1.2 Localization Algorithm output ................................................................................................... 11
3.2 Audio component ............................................................................................................................. 11
3.2.1 Microphone ................................................................................................................................ 11
3.2.2 Preamp circuitry module ........................................................................................................... 12
3.2 Power component............................................................................................................................. 13
4. Costs ........................................................................................................................................................ 14
4.1 Parts .................................................................................................................................................. 14
4.2 Labor ................................................................................................................................................. 14
iv
5. Conclusion ............................................................................................................................................... 15
5.1 Accomplishments .............................................................................................................................. 15
5.2 Uncertainties ..................................................................................................................................... 15
5.3 Ethical considerations ....................................................................................................................... 15
5.4 Future work ....................................................................................................................................... 15
References .................................................................................................................................................. 16
Appendix A Requirement and Verification Table ................................................................................... 17
Appendix B Localization Coordinate Look-up Table ............................................................................... 19
Appendix C Block Descriptions ............................................................................................................... 20
C.1 Thermal Sensing ................................................................................................................................ 20
C.2 Audio ................................................................................................................................................. 20
C.3 Microprocessor ................................................................................................................................. 20
C.4 Power Supply .................................................................................................................................... 21
C.5 Output ............................................................................................................................................... 21
Appendix D Logic Running on Microcontroller ....................................................................................... 22
D.1 Overall Flowchart ............................................................................................................................. 22
D.2 Flowcharts of Finer Details ............................................................................................................... 23
Appendix E Ethical Concerns .................................................................................................................. 24
1
1. Introduction
1.1 Statement of Purpose The promises of Home Automation currently outstrip the possibilities. Much of this is due to limitations
on what the home can sense, and therefore react to. Available sensors are limited to very specific
inputs, such as motion sensors, smoke or leak sensors, and door and window sensors. The goal of our
project is to increase the home’s “awareness” by adding more detailed input data. Specifically, the aim
is to design a sensing unit that will output the number of people in a room, their relative locations, and
whether they are engaged in conversation. This data would be collected by a hub, and various user-
defined rules could be enacted based upon this information, such as adjusting lighting, music and phone
volume, temperature control, or even pre-emptively powering on appliances. An important point is that
this will not require occupants to alter their own behavior, such as wearing a badge or carrying their
phone. This is also useful outside of a home, for example, for a difficult hospital patient this could
quickly tell staff where they are in a room.
A complete, functional unit will output to a terminal a boolean flag indicating room occupancy, an
integer indicating the number of people detected, float values indicating corresponding x & y
coordinates (where the x-axis is normal to the sensors), a boolean flag indicating the presence of
conversation, and float value indicating volume.
1.2 Objectives
1.2.1 Benefits and Goals
First step towards more customizable & nuanced home behaviors
Knowing the position of people inside a room
Output reliable details about room occupancy and localization
Output flags indicating presence of conversation and volume
1.2.2 Functions and Features
Sense presence in room even if occupants are stationary
Calculate location of occupants relative to sensor
Detect the presence of conversation, separate from other sounds
Mount like a motion sensor, requiring no further interaction by owner
2
2 Design Procedure
2.1 Thermal Sensing component
The goal of the thermal sensing module is first to detect presence of a person against a typical indoor
background at a range of up to 20 ft. By overlapping the field of view of two sensors, we are able to
identify the occupant’s position relative to our device.
2.1.1 Design
The localization algorithm utilized by our thermal sensor module is very similar to the approach used in
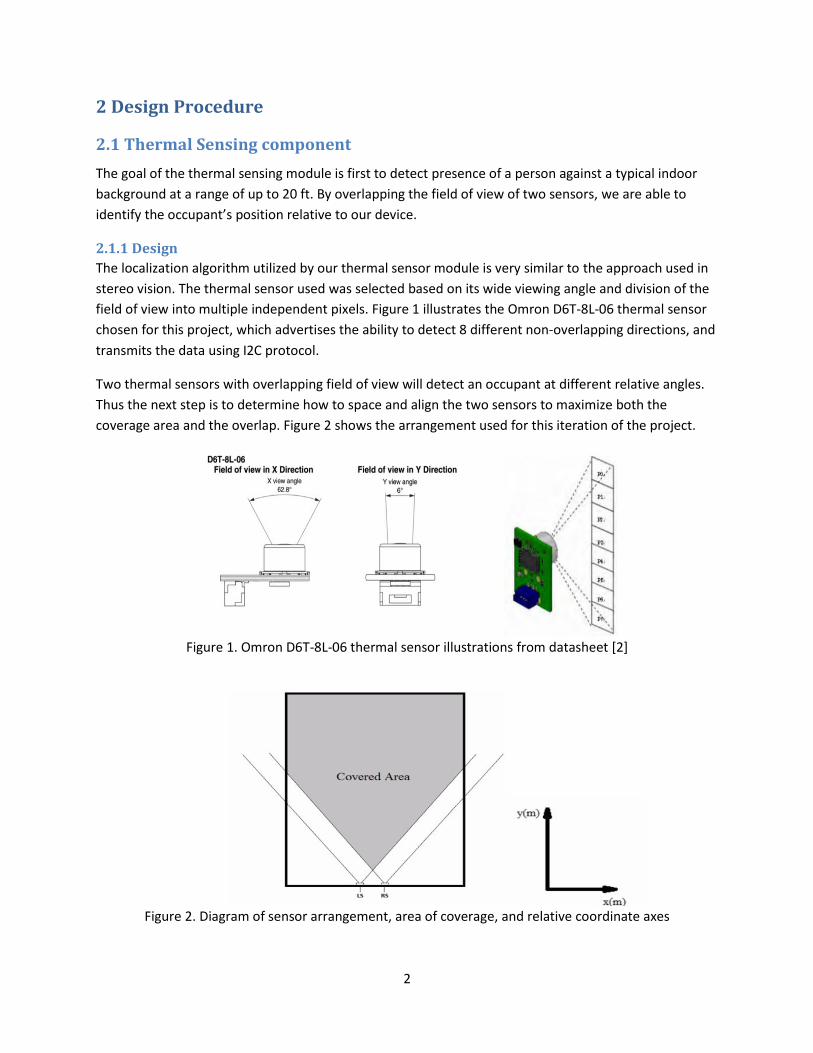
stereo vision. The thermal sensor used was selected based on its wide viewing angle and division of the
field of view into multiple independent pixels. Figure 1 illustrates the Omron D6T-8L-06 thermal sensor
chosen for this project, which advertises the ability to detect 8 different non-overlapping directions, and
transmits the data using I2C protocol.
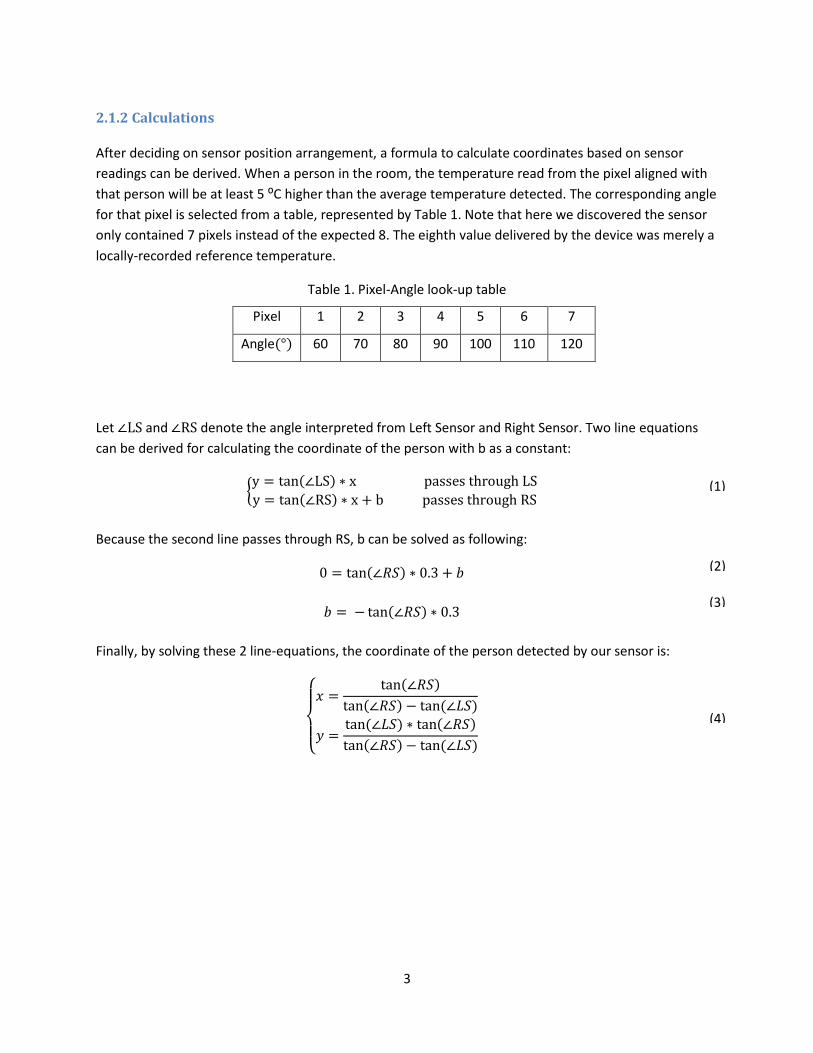
Two thermal sensors with overlapping field of view will detect an occupant at different relative angles.
Thus the next step is to determine how to space and align the two sensors to maximize both the
coverage area and the overlap. Figure 2 shows the arrangement used for this iteration of the project.
Figure 1. Omron D6T-8L-06 thermal sensor illustrations from datasheet [2]
Figure 2. Diagram of sensor arrangement, area of coverage, and relative coordinate axes
3
2.1.2 Calculations After deciding on sensor position arrangement, a formula to calculate coordinates based on sensor
readings can be derived. When a person in the room, the temperature read from the pixel aligned with
that person will be at least 5 ⁰C higher than the average temperature detected. The corresponding angle
for that pixel is selected from a table, represented by Table 1. Note that here we discovered the sensor
only contained 7 pixels instead of the expected 8. The eighth value delivered by the device was merely a
locally-recorded reference temperature.
Table 1. Pixel-Angle look-up table
Let ∠LS and ∠RS denote the angle interpreted from Left Sensor and Right Sensor. Two line equations
can be derived for calculating the coordinate of the person with b as a constant:
{y = tan(∠LS) ∗ x passes through LS
y = tan(∠RS) ∗ x + b passes through RS
Because the second line passes through RS, b can be solved as following:
0 = tan(∠𝑅𝑆) ∗ 0.3 + 𝑏
𝑏 = − tan(∠𝑅𝑆) ∗ 0.3
Finally, by solving these 2 line-equations, the coordinate of the person detected by our sensor is:
{
𝑥 =
tan(∠𝑅𝑆)
tan(∠𝑅𝑆) − tan (∠𝐿𝑆)
𝑦 =tan (∠𝐿𝑆) ∗ tan(∠𝑅𝑆)
tan(∠𝑅𝑆) − tan (∠𝐿𝑆)
Pixel 1 2 3 4 5 6 7
Angle(°) 60 70 80 90 100 110 120
(1)
(2)
(3)
(4)
4
2.1.3 Circuit
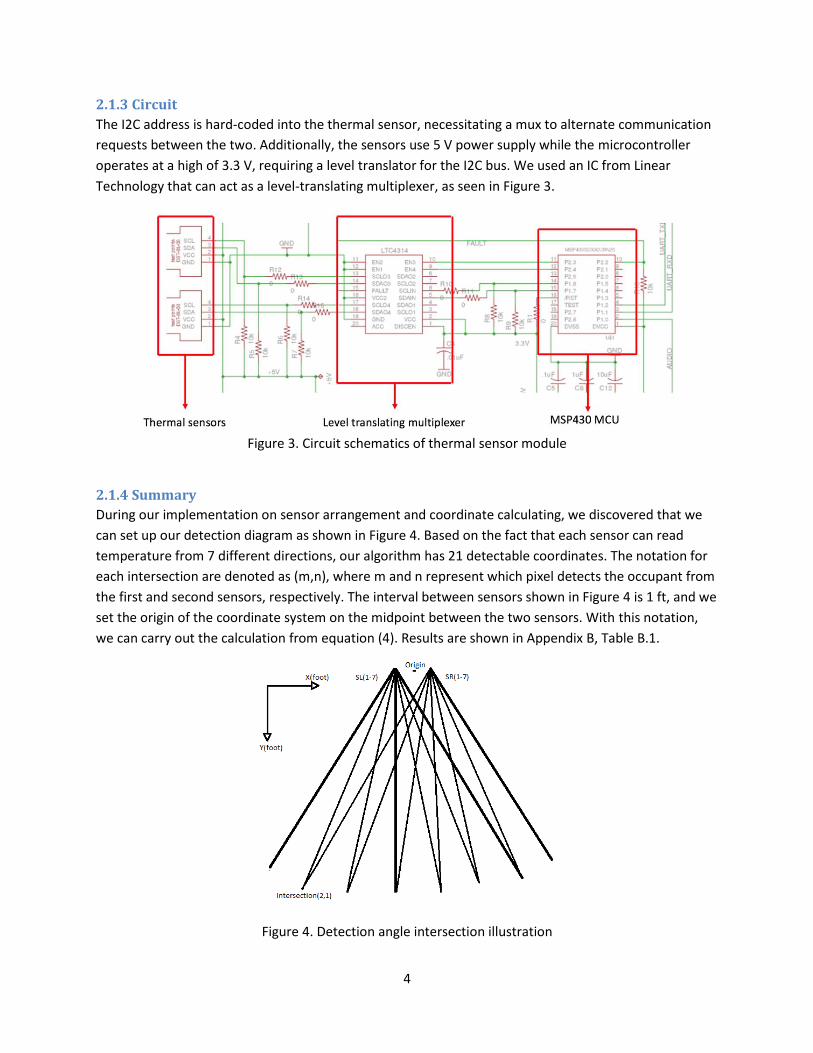
The I2C address is hard-coded into the thermal sensor, necessitating a mux to alternate communication
requests between the two. Additionally, the sensors use 5 V power supply while the microcontroller
operates at a high of 3.3 V, requiring a level translator for the I2C bus. We used an IC from Linear
Technology that can act as a level-translating multiplexer, as seen in Figure 3.
Figure 3. Circuit schematics of thermal sensor module
2.1.4 Summary
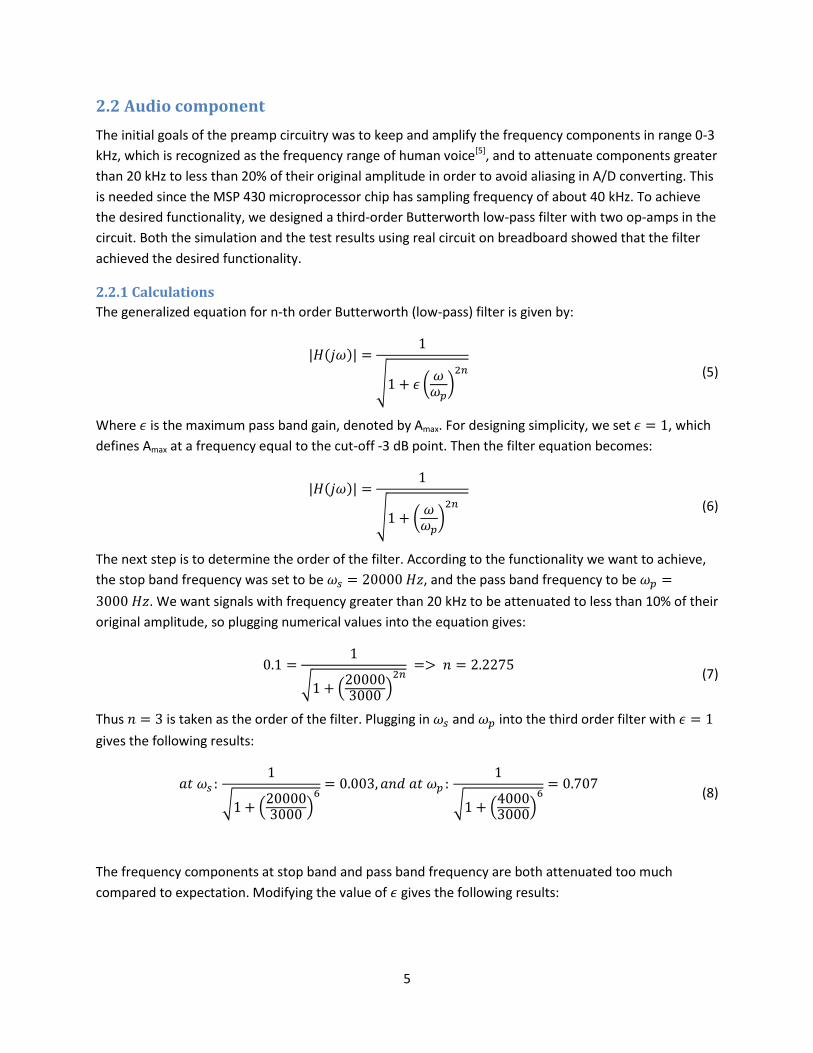
During our implementation on sensor arrangement and coordinate calculating, we discovered that we
can set up our detection diagram as shown in Figure 4. Based on the fact that each sensor can read
temperature from 7 different directions, our algorithm has 21 detectable coordinates. The notation for
each intersection are denoted as (m,n), where m and n represent which pixel detects the occupant from
the first and second sensors, respectively. The interval between sensors shown in Figure 4 is 1 ft, and we
set the origin of the coordinate system on the midpoint between the two sensors. With this notation,
we can carry out the calculation from equation (4). Results are shown in Appendix B, Table B.1.
Figure 4. Detection angle intersection illustration
5
2.2 Audio component
The initial goals of the preamp circuitry was to keep and amplify the frequency components in range 0-3
kHz, which is recognized as the frequency range of human voice[5], and to attenuate components greater
than 20 kHz to less than 20% of their original amplitude in order to avoid aliasing in A/D converting. This
is needed since the MSP 430 microprocessor chip has sampling frequency of about 40 kHz. To achieve
the desired functionality, we designed a third-order Butterworth low-pass filter with two op-amps in the
circuit. Both the simulation and the test results using real circuit on breadboard showed that the filter
achieved the desired functionality.
2.2.1 Calculations
The generalized equation for n-th order Butterworth (low-pass) filter is given by:
|𝐻(𝑗𝜔)| =1
√1 + 𝜖 (𝜔𝜔𝑝)2𝑛
(5)
Where 𝜖 is the maximum pass band gain, denoted by Amax. For designing simplicity, we set 𝜖 = 1, which
defines Amax at a frequency equal to the cut-off -3 dB point. Then the filter equation becomes:
|𝐻(𝑗𝜔)| =1
√1 + (𝜔𝜔𝑝)2𝑛
(6)
The next step is to determine the order of the filter. According to the functionality we want to achieve,
the stop band frequency was set to be 𝜔𝑠 = 20000 𝐻𝑧, and the pass band frequency to be 𝜔𝑝 =
3000 𝐻𝑧. We want signals with frequency greater than 20 kHz to be attenuated to less than 10% of their
original amplitude, so plugging numerical values into the equation gives:
0.1 =1
√1 + (200003000 )
2𝑛 => 𝑛 = 2.2275
(7)
Thus 𝑛 = 3 is taken as the order of the filter. Plugging in 𝜔𝑠 and 𝜔𝑝 into the third order filter with 𝜖 = 1
gives the following results:
𝑎𝑡 𝜔𝑠 : 1
√1 + (200003000 )
6= 0.003, 𝑎𝑛𝑑 𝑎𝑡 𝜔𝑝 :
1
√1 + (40003000)
6= 0.707
(8)
The frequency components at stop band and pass band frequency are both attenuated too much
compared to expectation. Modifying the value of 𝜖 gives the following results:

6
𝑤ℎ𝑒𝑛 𝜖 = 0.5 => |𝐻(𝑗𝜔𝑠)| = 0.0067, |𝐻(𝑗𝜔𝑝)| = 0.894
𝑤ℎ𝑒𝑛 𝜖 = 0.4 => |𝐻(𝑗𝜔𝑠)| = 0.008, |𝐻(𝑗𝜔𝑝)| = 0.928
𝑤ℎ𝑒𝑛 𝜖 = 0.3 => |𝐻(𝑗𝜔𝑠)| = 0.011, |𝐻(𝑗𝜔𝑝)| = 0.958
𝑤ℎ𝑒𝑛 𝜖 = 0.2 => |𝐻(𝑗𝜔𝑠)| = 0.016, |𝐻(𝑗𝜔𝑝)| = 0.98
(9)
In all the trials, 𝜖 = 0.3 gives the best results concerning the attenuating at both 𝜔𝑠 and 𝜔𝑝. Then
resistance and capacitance can be calculated as:
|𝐻(𝑗𝜔)| = −3 𝑑𝐵 =1
1.414 𝑎𝑡 𝜔 = 𝜔0
1
1.414=
1
√1 + 0.32 (𝜔03000
)6 => 𝜔0
3 =30003
0.3 => 𝜔0 = 4482𝐻𝑧
1
𝑅𝐶= 4482 ∗ 2𝜋 = 28161
𝑇𝑎𝑘𝑒 𝑅 = 10 𝑘Ω => 𝐶 = 3.55 𝑛𝐹
2.2.2 Simulations
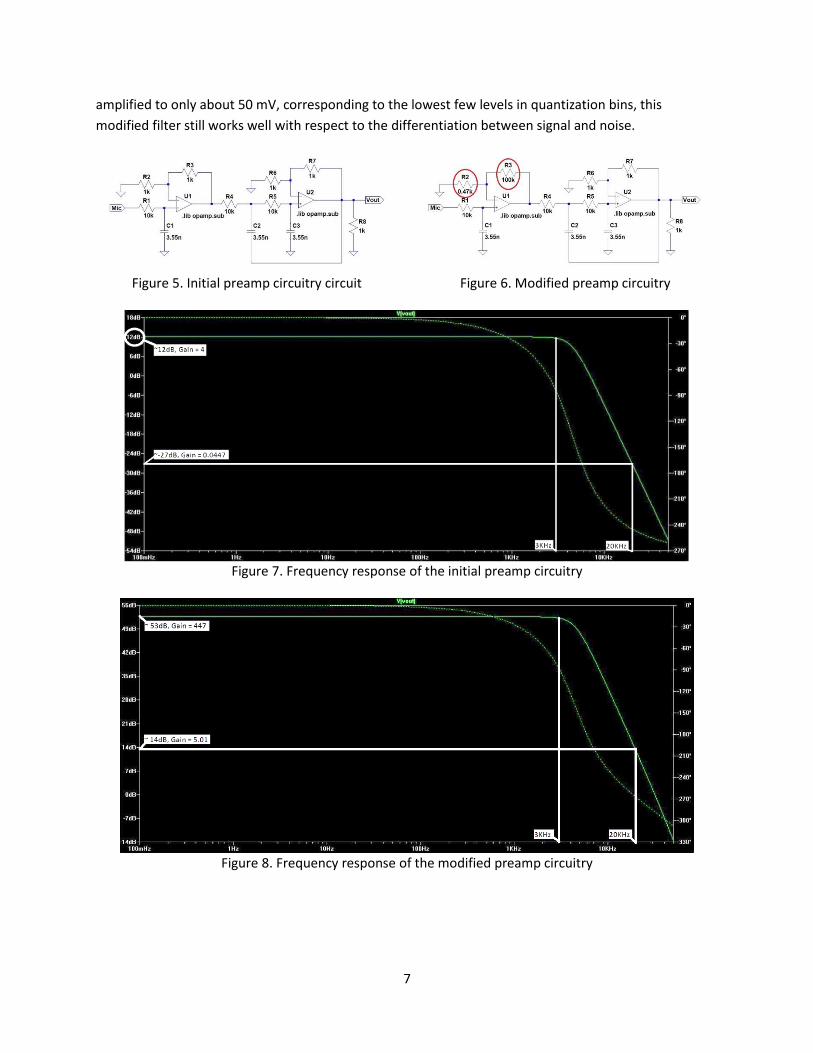
With the calculated resistance and capacitance, the circuit schematic of this initial design of preamp
circuitry is shown in Figure 5, and the frequency response is labeled in Figure 7. As shown in the
frequency response plot, the gain at frequencies 0–3 kHz is ~12 dB, and the gain at 20 kHz is ~-27 dB,
giving signal to noise ratio of about 39dB, which is 80 if converted to voltage gain.
Upon testing the microphone and the microprocessor, it was determined that the microphone outputs
an analog signal output of about 10 mV, and a gain of 4 by raises it to about 40 mV. However, the
microprocessor can read a signal in range -5 – +5 V as input, and it quantizes the input into 1024 bins in
this range. So an input of 40 mV will only occupy the lowest few bins, which is not optimal for input
reception and recognition. So a much higher gain is needed in the preamp circuitry. To achieve this,
minor modifications are made on two resistors in the preamp circuit, as shown in Figure 7 below. R3 is
changed from 1 kΩ to 100 kΩ, which result in a fifty-fold increase in the overall gain; R2 is changed from
1 kΩ to 0.47 kΩ, which is about half of its original resistance, and this gave a twice increase in the overall
gain. Compared to the original gain of 4, the modified gain is approximately 4 x 50 x 2 = 400. The
frequency response of this modified circuit is shown in Figure 6. The signal to noise ratio is kept at about
80, and since at frequency 0-3 kHz the signal is amplified to about 2-4 V, which correspond to
quantization level close to 1000 in the 1024 bins, while at frequencies greater than 20 kHz the signal is
7
amplified to only about 50 mV, corresponding to the lowest few levels in quantization bins, this
modified filter still works well with respect to the differentiation between signal and noise.
Figure 5. Initial preamp circuitry circuit
Figure 6. Modified preamp circuitry
Figure 7. Frequency response of the initial preamp circuitry
Figure 8. Frequency response of the modified preamp circuitry
8
3 Design Details
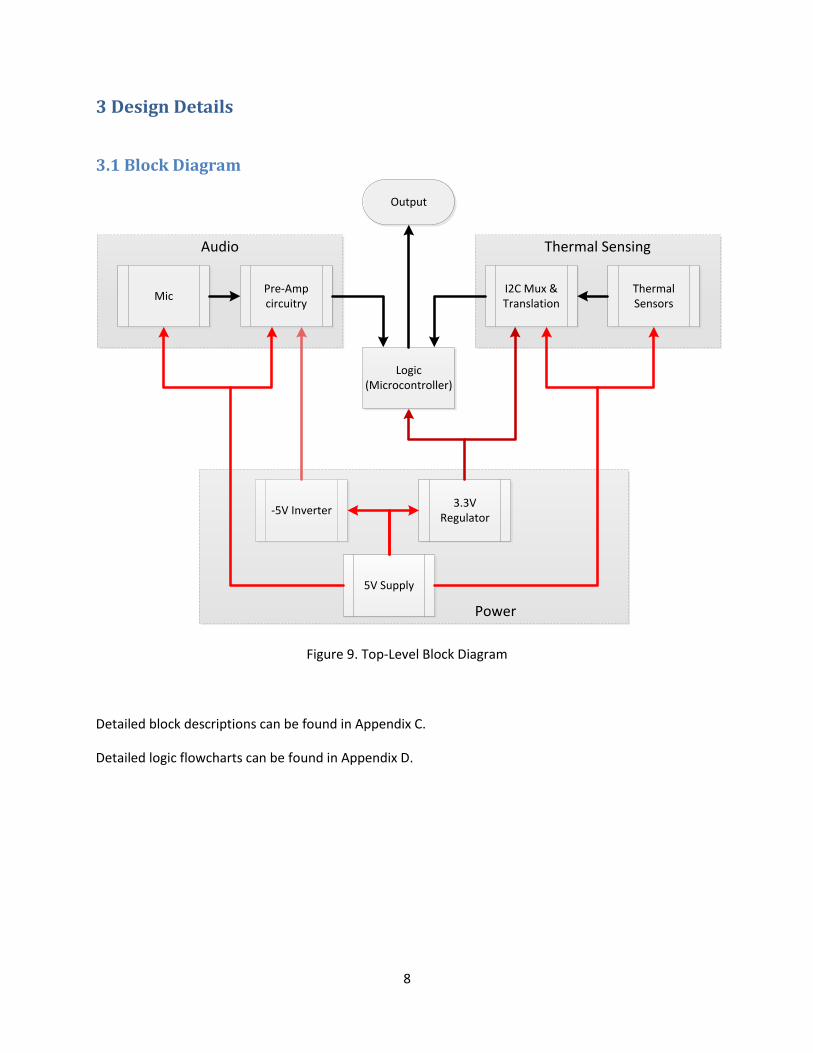
3.1 Block Diagram
Thermal Sensing
Power
5V Supply
3.3V Regulator
Audio
Thermal Sensors
I2C Mux & Translation
MicPre-Amp circuitry
Output
Logic (Microcontroller)
-5V Inverter
Figure 9. Top-Level Block Diagram
Detailed block descriptions can be found in Appendix C.
Detailed logic flowcharts can be found in Appendix D.
9
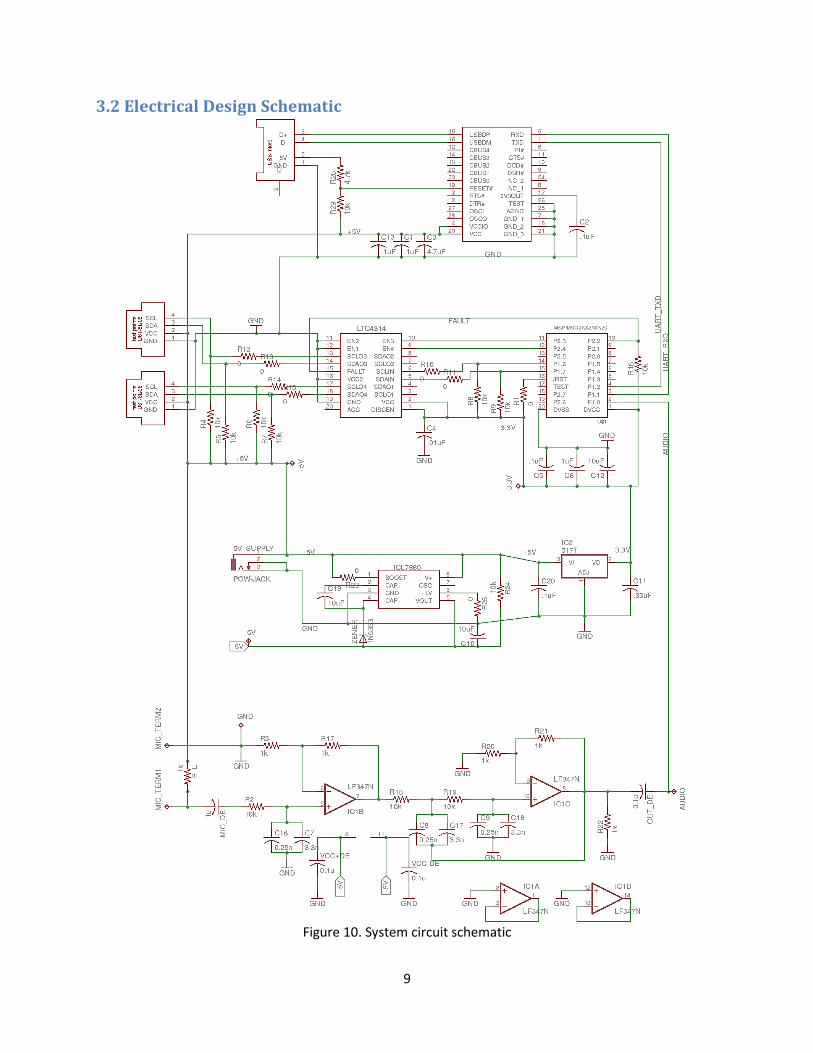
3.2 Electrical Design Schematic
Figure 10. System circuit schematic
10
4. Design Verification The Requirements and Verification table can be found in Appendix A.
4.1 Thermal Sensing component
For the thermal sensing module we have following requirements: (1) Each pixel detects temperature
within range [15, 45] ⁰C, with accuracy +/- 5 ⁰C; (2) I2C Communication; (3) localization algorithm
calculates the relative coordinate of a person within +/-2ft based on sensor reading.
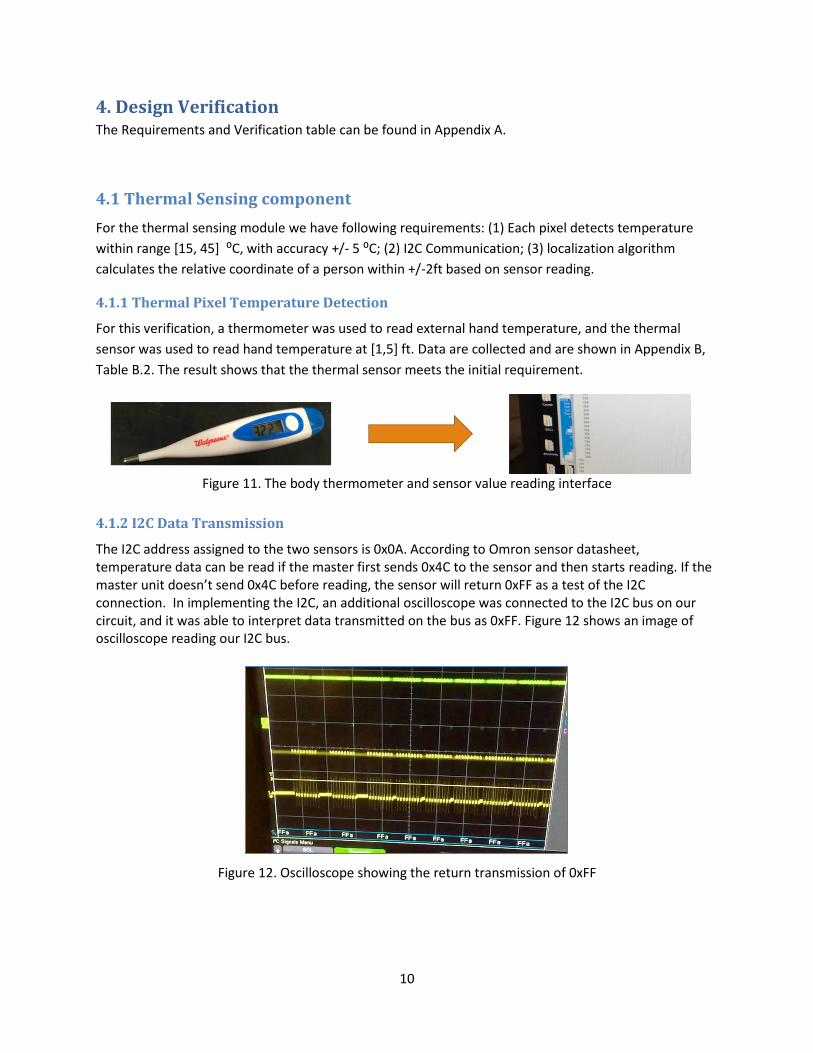
4.1.1 Thermal Pixel Temperature Detection
For this verification, a thermometer was used to read external hand temperature, and the thermal
sensor was used to read hand temperature at [1,5] ft. Data are collected and are shown in Appendix B,
Table B.2. The result shows that the thermal sensor meets the initial requirement.
Figure 11. The body thermometer and sensor value reading interface
4.1.2 I2C Data Transmission
The I2C address assigned to the two sensors is 0x0A. According to Omron sensor datasheet, temperature data can be read if the master first sends 0x4C to the sensor and then starts reading. If the master unit doesn’t send 0x4C before reading, the sensor will return 0xFF as a test of the I2C connection. In implementing the I2C, an additional oscilloscope was connected to the I2C bus on our circuit, and it was able to interpret data transmitted on the bus as 0xFF. Figure 12 shows an image of oscilloscope reading our I2C bus.
Figure 12. Oscilloscope showing the return transmission of 0xFF

11
3.1.2 Localization Algorithm output
The requirement for our localization algorithm is that it can calculate the relative coordinates of a
person within +/- 2 ft based on sensor data. For verification, one person was let stand close to
coordinate (0 ft, 1.5 ft) with no background object within 20 ft. The resulting sensor values are shown in
Table 2. In this situation, the algorithm picked out the 6th and 2nd pixel from left and right sensor as the
highest pixel reading from both sensors, which means the human presented are close to intersection
(6,2). By carrying out the calculation shown in equation (1) to (4), the coordinate calculated is (0ft, 1.37
ft). This experiment shows that with sensor inputs, the localization algorithm can determine a person’s
location within +/-2 ft.
Table 2. Sensor readings
3.2 Audio component
3.2.1 Microphone
There is no design work for the microphone, but the requirement on its functionality can be verified.
The requirement states that it should be able to detect audio in 60-70dBA range, which is a general
range in which human conversation usually exists. Shown below in Figure 13 is a snapshot from the
demonstration video. The green signal on oscilloscope is the raw output from the microphone, and the
yellow one is the amplified signal using the preamp circuitry. As shown here, at audio level 62dBA, there
is an obvious fluctuation in the signal, which shows that this sound level is detected by the microphone.
Figure 13. Microphone dBA range detection verification

12
3.2.2 Preamp circuitry module
The verification of preamp circuitry functionality is accomplished by inputting a sweeping signal and
plotting the frequency response of the output using FFT function on oscilloscope. The resulting
oscilloscope graph is shown in Figure 14. There is an offset on vertical axis so the dB values are negative,
but it clearly shows that the dB values at 3 kHz and 20 kHz produces a signal to noise ratio of about 35.5
dB, which is quite close to the simulation result of 39 dB. And the overall shape of the frequency
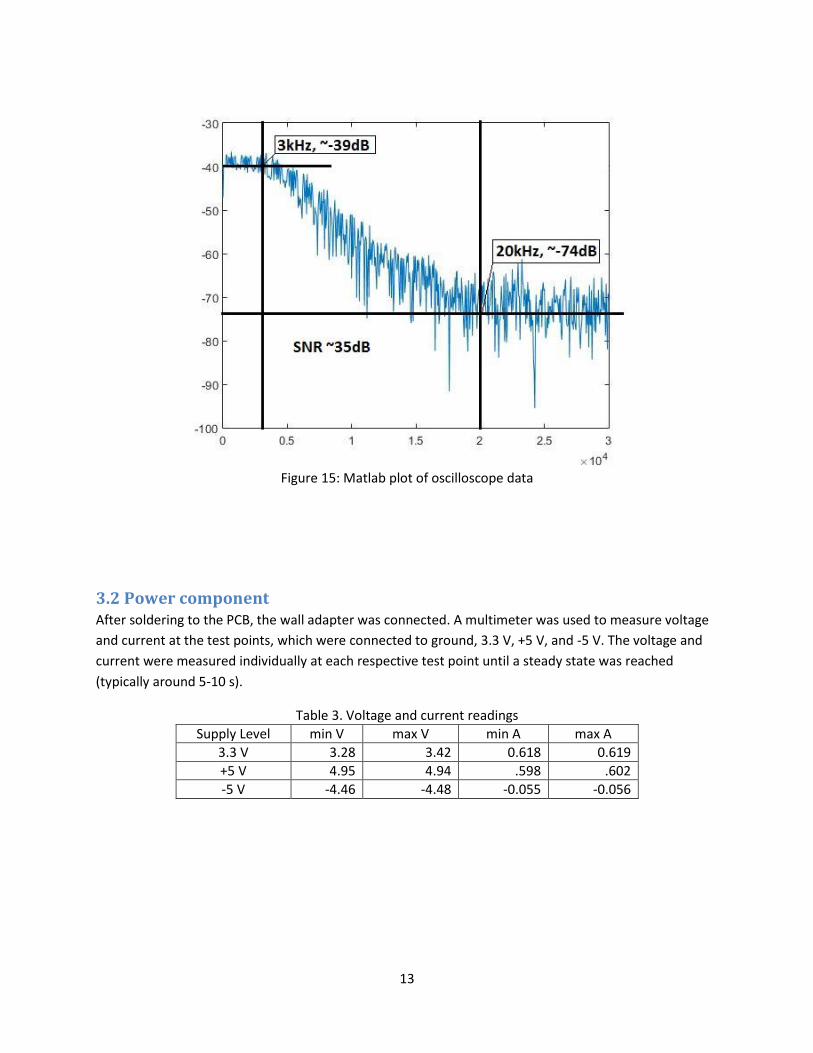
response is also similar to that in simulation. Figure 16 shows the Matlab plotting of the same set of data
outputted from the oscilloscope. There is less noise in this plotting and it also shows a similar signal to
noise ratio.
Figure 14. Frequency response of preamp circuitry on breadboard on oscilloscope
13
Figure 15: Matlab plot of oscilloscope data
3.2 Power component After soldering to the PCB, the wall adapter was connected. A multimeter was used to measure voltage
and current at the test points, which were connected to ground, 3.3 V, +5 V, and -5 V. The voltage and
current were measured individually at each respective test point until a steady state was reached
(typically around 5-10 s).
Table 3. Voltage and current readings
Supply Level min V max V min A max A
3.3 V 3.28 3.42 0.618 0.619
+5 V 4.95 4.94 .598 .602
-5 V -4.46 -4.48 -0.055 -0.056
14
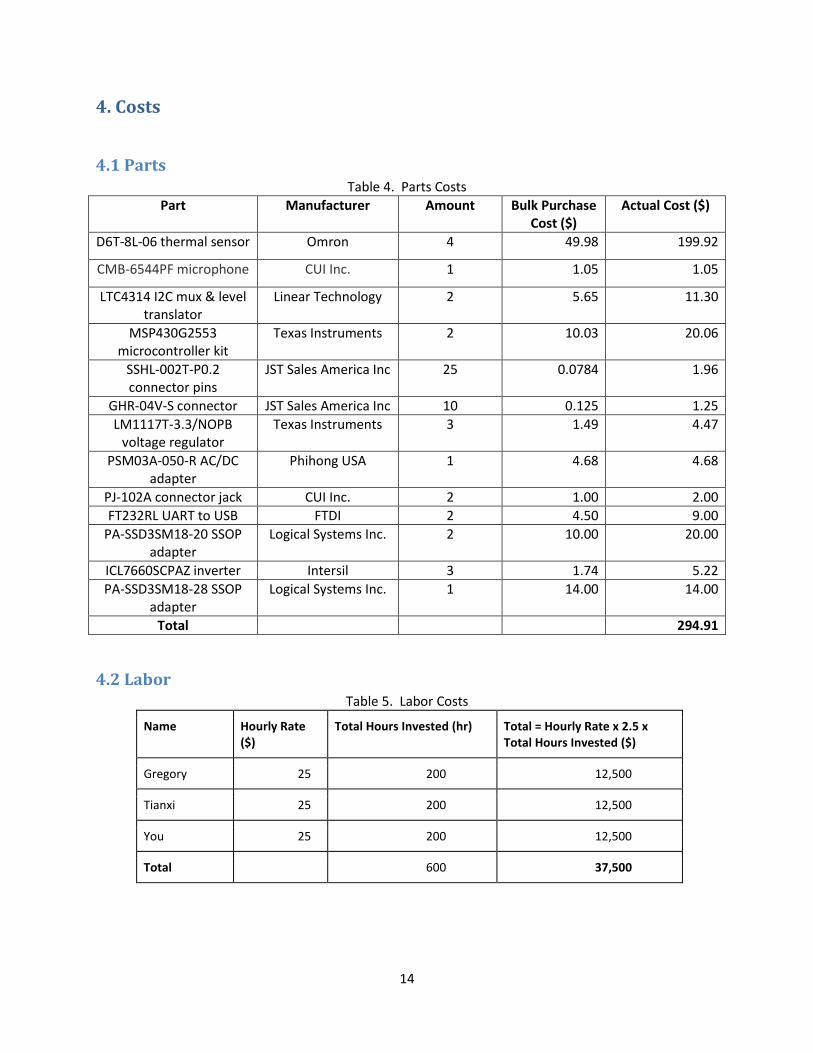
4. Costs
4.1 Parts Table 4. Parts Costs
Part Manufacturer Amount Bulk Purchase Cost ($)
Actual Cost ($)
D6T-8L-06 thermal sensor Omron 4 49.98 199.92
CMB-6544PF microphone CUI Inc. 1 1.05 1.05
LTC4314 I2C mux & level translator
Linear Technology 2 5.65 11.30
MSP430G2553 microcontroller kit
Texas Instruments 2 10.03 20.06
SSHL-002T-P0.2 connector pins
JST Sales America Inc 25 0.0784 1.96
GHR-04V-S connector JST Sales America Inc 10 0.125 1.25
LM1117T-3.3/NOPB voltage regulator
Texas Instruments 3 1.49 4.47
PSM03A-050-R AC/DC adapter
Phihong USA 1 4.68 4.68
PJ-102A connector jack CUI Inc. 2 1.00 2.00
FT232RL UART to USB FTDI 2 4.50 9.00
PA-SSD3SM18-20 SSOP adapter
Logical Systems Inc. 2 10.00 20.00
ICL7660SCPAZ inverter Intersil 3 1.74 5.22
PA-SSD3SM18-28 SSOP adapter
Logical Systems Inc. 1 14.00 14.00
Total 294.91
4.2 Labor Table 5. Labor Costs
Name Hourly Rate ($)
Total Hours Invested (hr) Total = Hourly Rate x 2.5 x Total Hours Invested ($)
Gregory 25 200 12,500
Tianxi 25 200 12,500
You 25 200 12,500
Total 600 37,500

15
5. Conclusion
5.1 Accomplishments Both the speech frequency range detection and localization components were a demonstrable success.
The audio component successfully captured sound within the 60-70 dBA range, properly amplified and
attenuated the respective frequencies, and was able to raise the appropriate flag in our logic software.
The localization component responded incredibly fast to small changes in temperature, and the data
was collected over I2C. Our logic software was able to identify the location of a person at the
localization points made available by our area of coverage.
5.2 Uncertainties We encountered two notable challenges while creating this sensor. The first was that the thermal
sensors only output values for 7 pixels, as opposed to the advertised 8, reducing the maximum number
of possible localization coordinates from 64 points to 49. The second is easier to address, but requires
major adjustments to our hardware design. The logic software fit into the memory of the
microcontroller, but the calculations we performed caused it to overflow. We were able to separate the
modules onto two microcontrollers and verify functionality in that manner.
5.3 Ethical considerations Ethical concerns are minor, but those which could be identified can be found in Appendix E.
5.4 Future work The main item we would like to improve is the accuracy and coverage of the localization component. We
identified three limiting factors.
First, we have since found a newer product with a finer resolution of an 8x8 pixel grid covering a 64⁰
field of view, both vertically and horizontally (the Panasonic AMG88xx). Orienting the sensor at 45⁰
would offer us a wider field with a greater number of horizontal pixels, and therefore a greater number
of potential intersections. The higher resolution also allows the opportunity to explore object
identification and separation methods similar to that done in computer vision applications.
Second, we would explore more variations in the physical arrangement of our sensors. Increasing the
distance between them would increase the range at which we could localize an occupant. Adjusting the
angles such that they are not parallel would alter the coverage area and allow more intersections, but
would make the calculation more complicated.
Third, we have considered improvements to the algorithm applied. Specifically, we currently only
choose the angle of the pixel with the highest reading. If instead the angle between pixels is considered,
for instance when an occupant is partially captured by two neighboring pixels, then the number of
potential intersections can be increased this way, too.
16
References
[1] Wilfrid Laurier University. “LTspice Tutorial.” Internet: http://denethor.wlu.ca/ltspice/#asweep,
Mar.12, 2015 [Sept.29, 2015]
[2] smackandy. “Intro to LTSpice.” Internet: https://www.youtube.com/watch?v=lyADW32wi10, Jan.7,
2009 [Sept.29, 2015]
[3] Linear Technology. “LTspice IV Getting Started Guide.” Internet:
http://cds.linear.com/docs/en/software-and-simulation/LTspiceGettingStartedGuide.pdf, 2011 [Sept.29,
2015]
[4] SIMONBRAMBLE.CO.UK. “LTspice Tutorials”. Internet:
http://www.simonbramble.co.uk/lt_spice/ltspice_lt_spice.htm, [Sept.29, 2015]
[5] Wikipedia. “Voice Frequency.” Internet: https://en.wikipedia.org/wiki/Voice_frequency, Mar.30,
2015 [Sept.29, 2015]
17
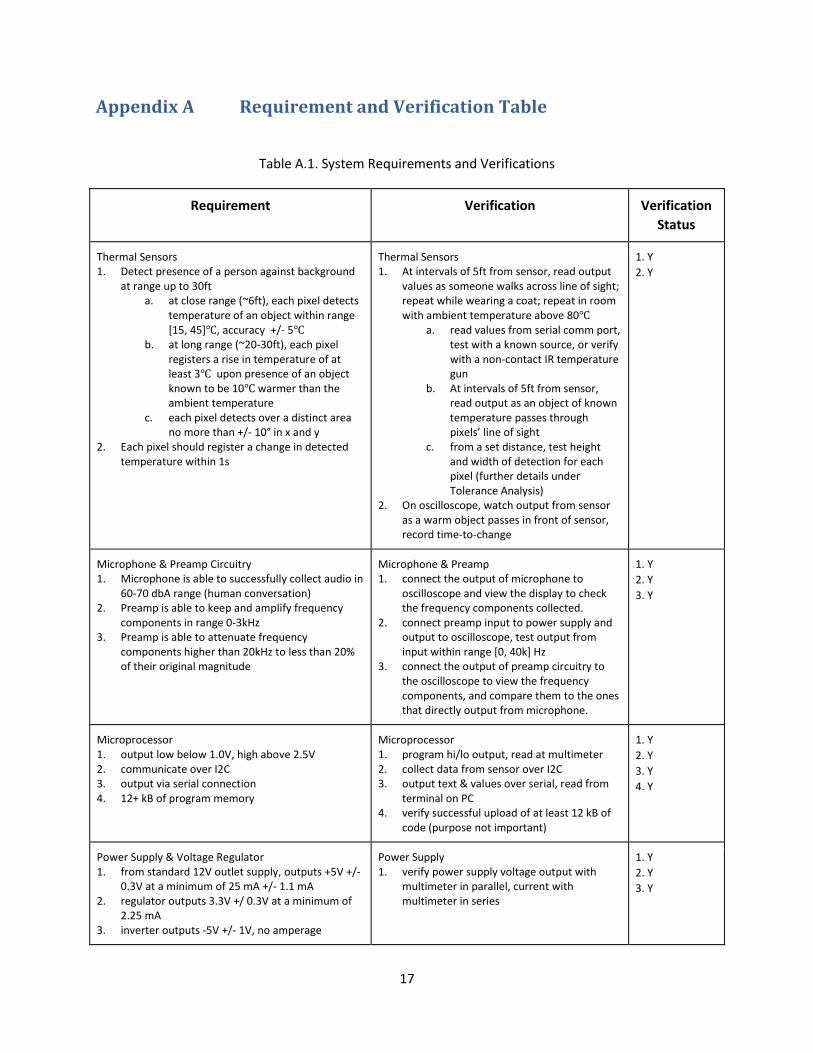
Appendix A Requirement and Verification Table
Table A.1. System Requirements and Verifications
Requirement Verification Verification
Status
Thermal Sensors 1. Detect presence of a person against background
at range up to 30ft a. at close range (~6ft), each pixel detects
temperature of an object within range [15, 45]℃, accuracy +/- 5℃
b. at long range (~20-30ft), each pixel registers a rise in temperature of at least 3℃ upon presence of an object known to be 10℃ warmer than the ambient temperature
c. each pixel detects over a distinct area no more than +/- 10° in x and y
2. Each pixel should register a change in detected temperature within 1s
Thermal Sensors 1. At intervals of 5ft from sensor, read output
values as someone walks across line of sight; repeat while wearing a coat; repeat in room with ambient temperature above 80℃
a. read values from serial comm port, test with a known source, or verify with a non-contact IR temperature gun
b. At intervals of 5ft from sensor, read output as an object of known temperature passes through pixels’ line of sight
c. from a set distance, test height and width of detection for each pixel (further details under Tolerance Analysis)
2. On oscilloscope, watch output from sensor as a warm object passes in front of sensor, record time-to-change
1. Y
2. Y
Microphone & Preamp Circuitry 1. Microphone is able to successfully collect audio in
60-70 dbA range (human conversation) 2. Preamp is able to keep and amplify frequency
components in range 0-3kHz 3. Preamp is able to attenuate frequency
components higher than 20kHz to less than 20% of their original magnitude
Microphone & Preamp 1. connect the output of microphone to
oscilloscope and view the display to check the frequency components collected.
2. connect preamp input to power supply and output to oscilloscope, test output from input within range [0, 40k] Hz
3. connect the output of preamp circuitry to the oscilloscope to view the frequency components, and compare them to the ones that directly output from microphone.
1. Y
2. Y
3. Y
Microprocessor 1. output low below 1.0V, high above 2.5V 2. communicate over I2C 3. output via serial connection 4. 12+ kB of program memory
Microprocessor 1. program hi/lo output, read at multimeter 2. collect data from sensor over I2C 3. output text & values over serial, read from
terminal on PC 4. verify successful upload of at least 12 kB of
code (purpose not important)
1. Y
2. Y
3. Y
4. Y
Power Supply & Voltage Regulator 1. from standard 12V outlet supply, outputs +5V +/-
0.3V at a minimum of 25 mA +/- 1.1 mA 2. regulator outputs 3.3V +/ 0.3V at a minimum of
2.25 mA 3. inverter outputs -5V +/- 1V, no amperage
Power Supply 1. verify power supply voltage output with
multimeter in parallel, current with multimeter in series
1. Y
2. Y
3. Y
18
requirement
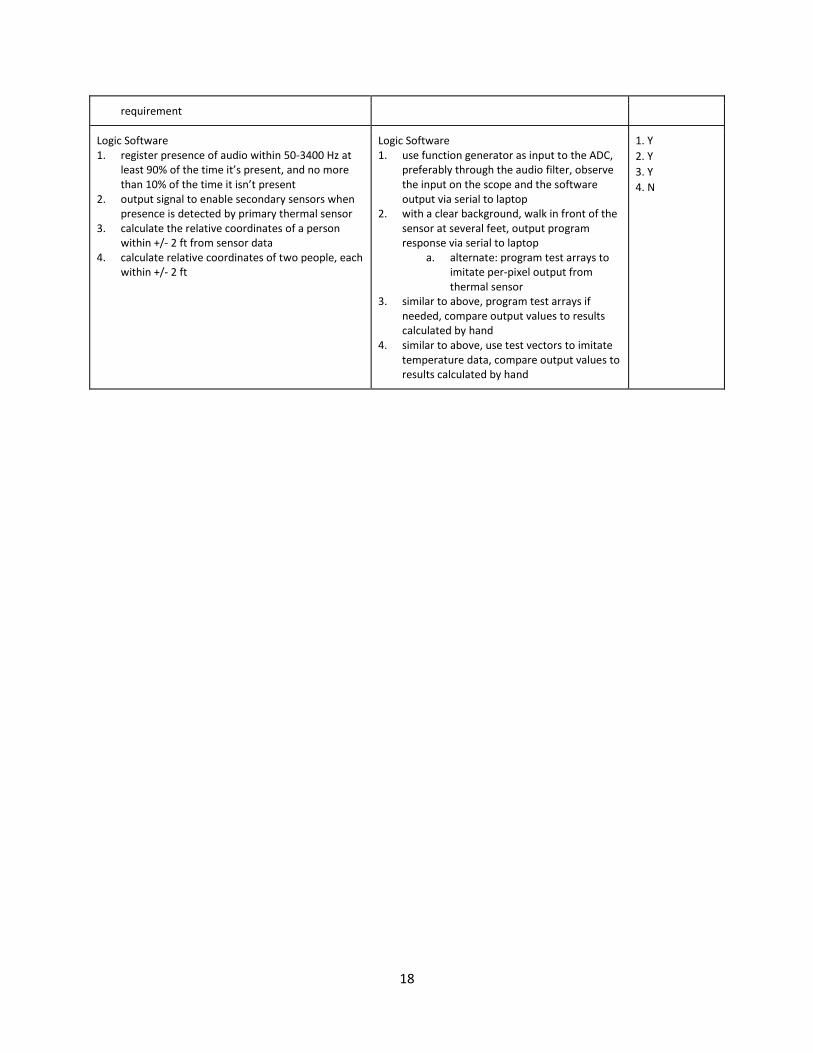
Logic Software 1. register presence of audio within 50-3400 Hz at
least 90% of the time it’s present, and no more than 10% of the time it isn’t present
2. output signal to enable secondary sensors when presence is detected by primary thermal sensor
3. calculate the relative coordinates of a person within +/- 2 ft from sensor data
4. calculate relative coordinates of two people, each within +/- 2 ft
Logic Software 1. use function generator as input to the ADC,
preferably through the audio filter, observe the input on the scope and the software output via serial to laptop
2. with a clear background, walk in front of the sensor at several feet, output program response via serial to laptop
a. alternate: program test arrays to imitate per-pixel output from thermal sensor
3. similar to above, program test arrays if needed, compare output values to results calculated by hand
4. similar to above, use test vectors to imitate temperature data, compare output values to results calculated by hand
1. Y
2. Y
3. Y
4. N
19
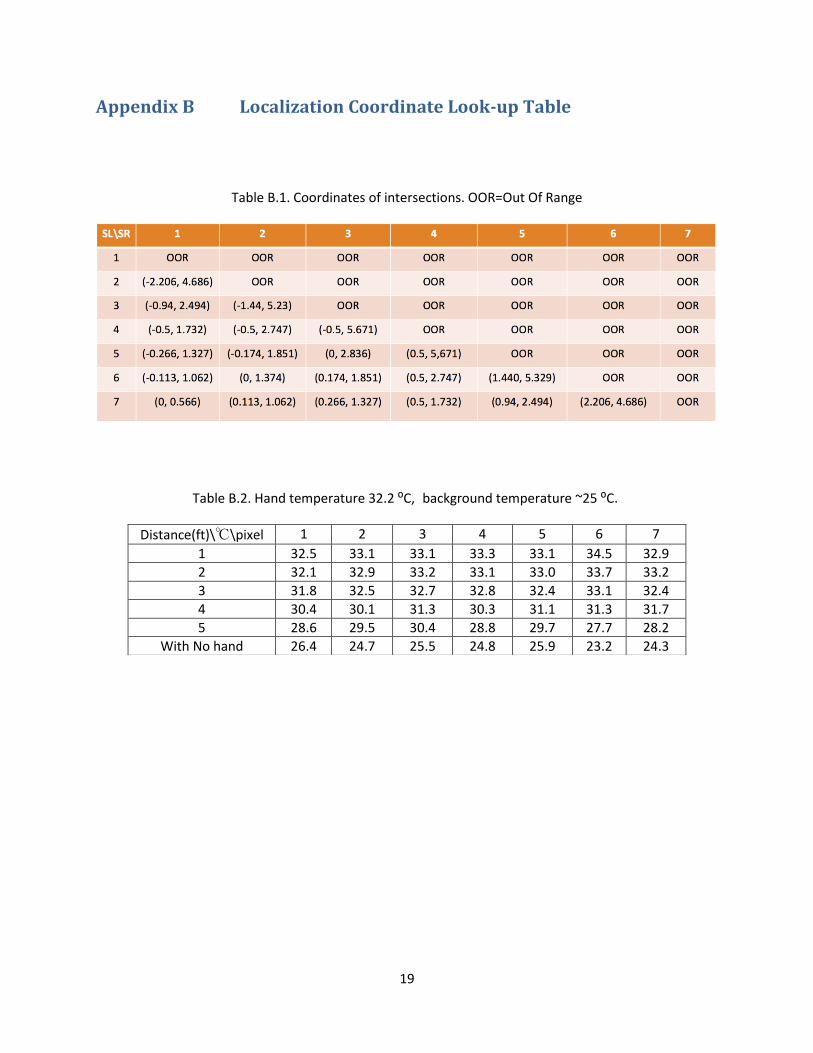
Appendix B Localization Coordinate Look-up Table
Table B.1. Coordinates of intersections. OOR=Out Of Range
Table B.2. Hand temperature 32.2 ⁰C, background temperature ~25 ⁰C.
Distance(ft)\℃\pixel 1 2 3 4 5 6 7
1 32.5 33.1 33.1 33.3 33.1 34.5 32.9
2 32.1 32.9 33.2 33.1 33.0 33.7 33.2
3 31.8 32.5 32.7 32.8 32.4 33.1 32.4
4 30.4 30.1 31.3 30.3 31.1 31.3 31.7
5 28.6 29.5 30.4 28.8 29.7 27.7 28.2
With No hand 26.4 24.7 25.5 24.8 25.9 23.2 24.3
20
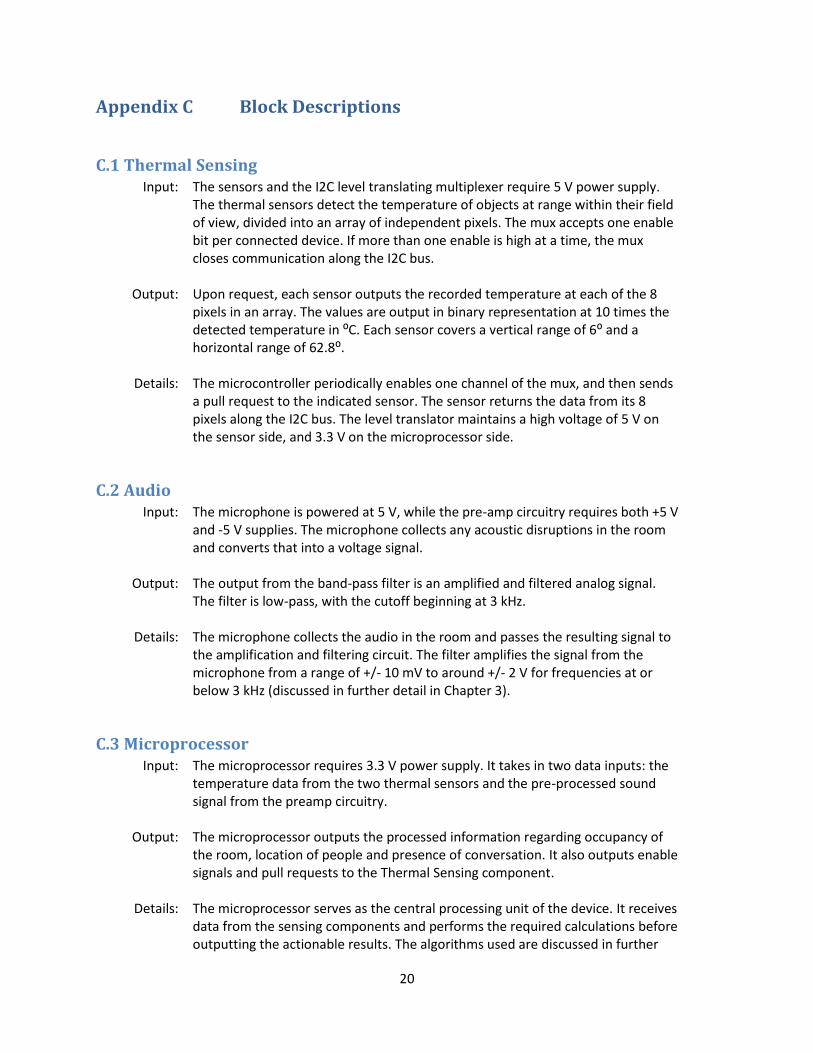
Appendix C Block Descriptions
C.1 Thermal Sensing Input: The sensors and the I2C level translating multiplexer require 5 V power supply.
The thermal sensors detect the temperature of objects at range within their field of view, divided into an array of independent pixels. The mux accepts one enable bit per connected device. If more than one enable is high at a time, the mux closes communication along the I2C bus.
Output: Upon request, each sensor outputs the recorded temperature at each of the 8 pixels in an array. The values are output in binary representation at 10 times the detected temperature in ⁰C. Each sensor covers a vertical range of 6⁰ and a horizontal range of 62.8⁰.
Details: The microcontroller periodically enables one channel of the mux, and then sends a pull request to the indicated sensor. The sensor returns the data from its 8 pixels along the I2C bus. The level translator maintains a high voltage of 5 V on the sensor side, and 3.3 V on the microprocessor side.
C.2 Audio Input: The microphone is powered at 5 V, while the pre-amp circuitry requires both +5 V
and -5 V supplies. The microphone collects any acoustic disruptions in the room and converts that into a voltage signal.
Output: The output from the band-pass filter is an amplified and filtered analog signal. The filter is low-pass, with the cutoff beginning at 3 kHz.
Details: The microphone collects the audio in the room and passes the resulting signal to the amplification and filtering circuit. The filter amplifies the signal from the microphone from a range of +/- 10 mV to around +/- 2 V for frequencies at or below 3 kHz (discussed in further detail in Chapter 3).
C.3 Microprocessor Input: The microprocessor requires 3.3 V power supply. It takes in two data inputs: the
temperature data from the two thermal sensors and the pre-processed sound signal from the preamp circuitry.
Output: The microprocessor outputs the processed information regarding occupancy of the room, location of people and presence of conversation. It also outputs enable signals and pull requests to the Thermal Sensing component.
Details: The microprocessor serves as the central processing unit of the device. It receives data from the sensing components and performs the required calculations before outputting the actionable results. The algorithms used are discussed in further
21
detail in a following section.
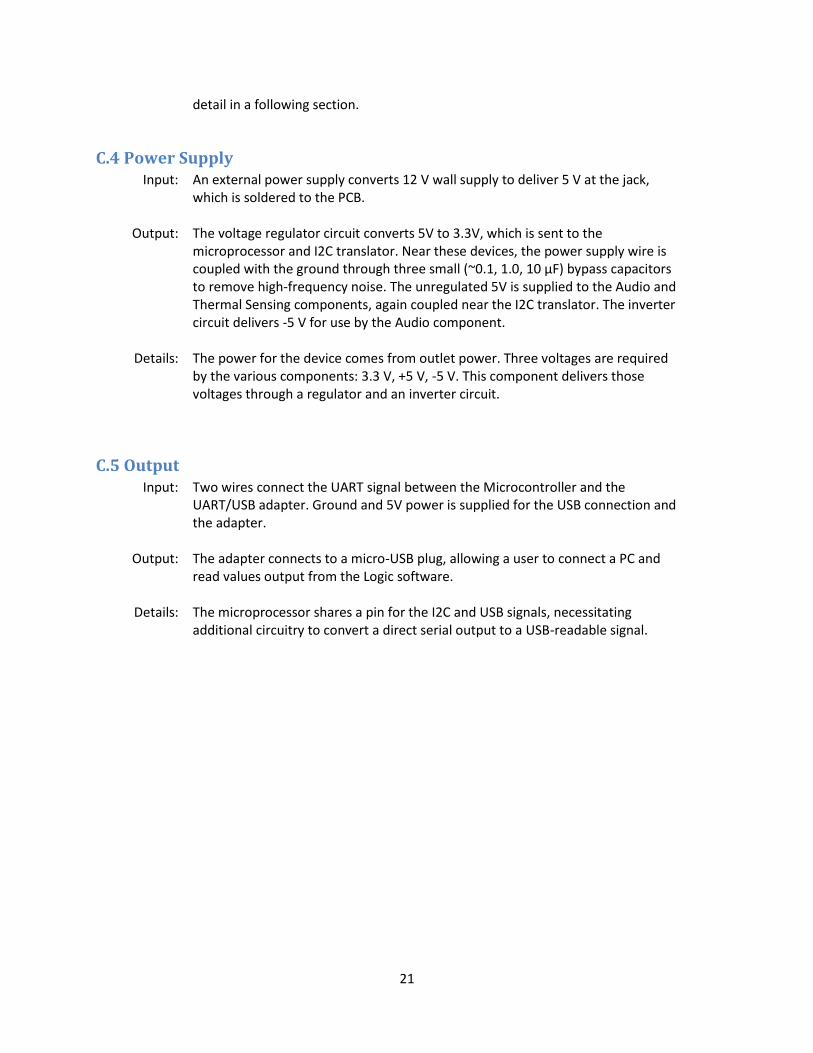
C.4 Power Supply Input: An external power supply converts 12 V wall supply to deliver 5 V at the jack,
which is soldered to the PCB.
Output: The voltage regulator circuit converts 5V to 3.3V, which is sent to the microprocessor and I2C translator. Near these devices, the power supply wire is coupled with the ground through three small (~0.1, 1.0, 10 μF) bypass capacitors to remove high-frequency noise. The unregulated 5V is supplied to the Audio and Thermal Sensing components, again coupled near the I2C translator. The inverter circuit delivers -5 V for use by the Audio component.
Details: The power for the device comes from outlet power. Three voltages are required by the various components: 3.3 V, +5 V, -5 V. This component delivers those voltages through a regulator and an inverter circuit.
C.5 Output Input: Two wires connect the UART signal between the Microcontroller and the
UART/USB adapter. Ground and 5V power is supplied for the USB connection and the adapter.
Output: The adapter connects to a micro-USB plug, allowing a user to connect a PC and read values output from the Logic software.
Details: The microprocessor shares a pin for the I2C and USB signals, necessitating additional circuitry to convert a direct serial output to a USB-readable signal.
22
Appendix D Logic Running on Microcontroller
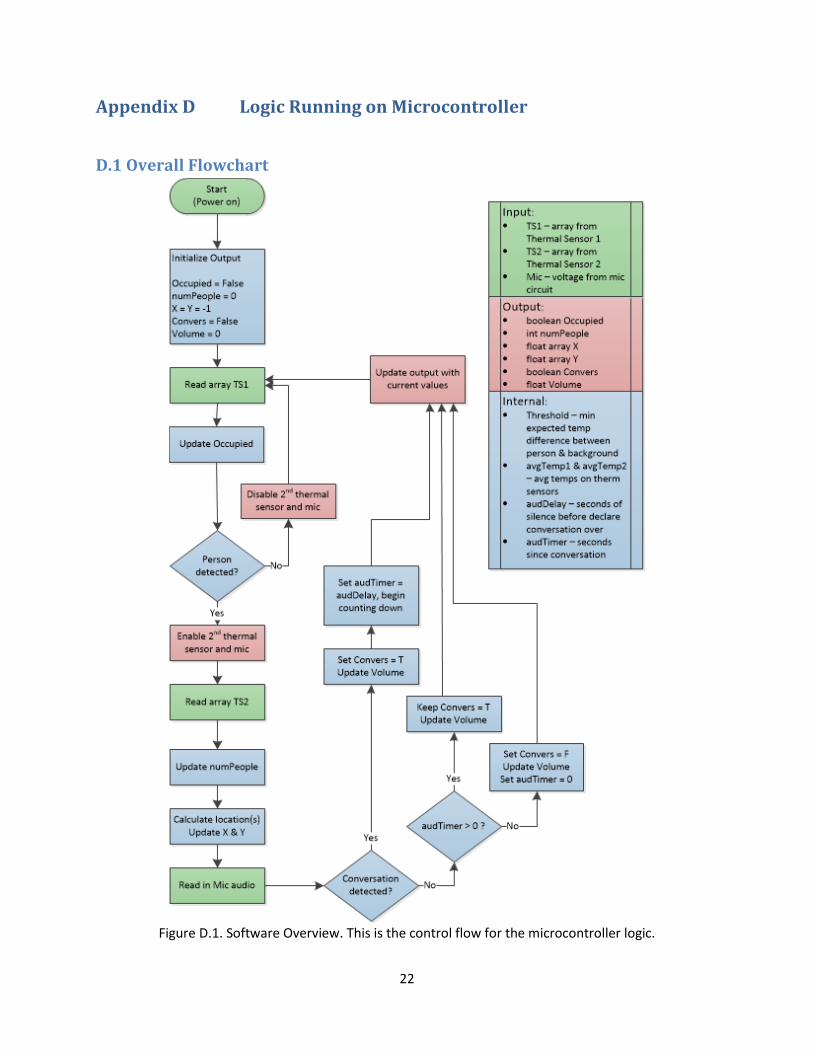
D.1 Overall Flowchart
Figure D.1. Software Overview. This is the control flow for the microcontroller logic.
23
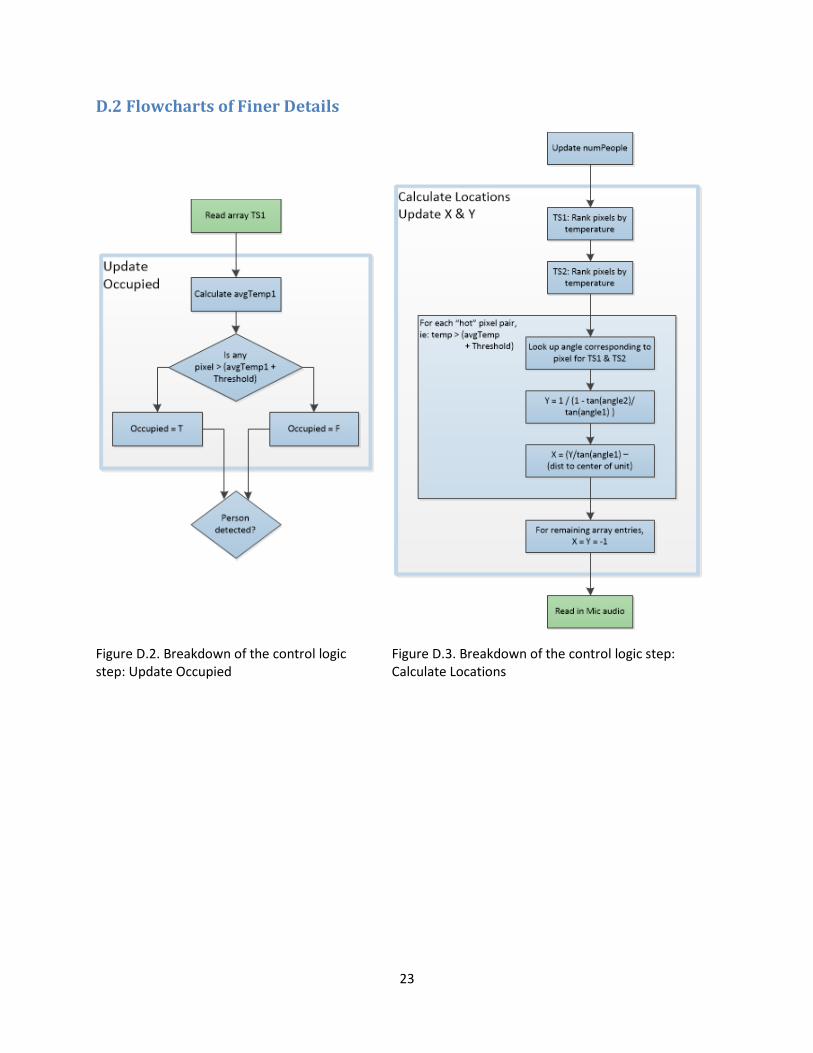
D.2 Flowcharts of Finer Details
Figure D.2. Breakdown of the control logic step: Update Occupied
Figure D.3. Breakdown of the control logic step: Calculate Locations

24
Appendix E Ethical Concerns
The IEEE Code of Ethics helps guide our approach towards integrating technology into our lives,
as well as our more general professional conduct. The following are the statements from the Code that
apply most directly to our project, and how we intend to remain consistent with them:
1 - to accept responsibility in making decisions consistent with the safety, health, and welfare of the
public, and to disclose promptly factors that might endanger the public or the environment;
Although our project has low power consumption, there is always a danger of electrical shock or
burns if certain parts, such as the voltage regulator, are not properly covered or insulated. As we
design and construct the device, care will be taken to design a protective housing and ensure
any exposed points of contact are properly concealed. Additionally, as this is meant to be an
always-on device, we intend to use low-power parts whenever possible, and will disable power-
consuming devices when they are not needed.
3 - to be honest and realistic in stating claims or estimates based on available data;
The thermal sensors used for this project are quite new, and some aspects of their capabilities
are not yet fully understood. As such, an integral part of our project over the semester is to
thoroughly test the sensors to understand their field of view, the sensing range (both
temperature and physical), and their behavior in various edge cases. Our goal is to enhance their
usefulness as much as possible, but in the end to be completely honest about what we can
achieve with them.
7 - to seek, accept, and offer honest criticism of technical work, to acknowledge and correct errors, and
to credit properly the contributions of others;
Seeking productive criticism will be vital throughout the course of this project to ensuring it
works to the best of our abilities when it is finished. We will gladly accept and attempt to
address any well-intentioned criticism.
10 - to assist colleagues and co-workers in their professional development and to support them in
following this code of ethics.

25
As a team, we will support each other. We will fill in gaps in understanding with our own unique
backgrounds, and will work together to maintain a positive, professional approach for the
duration of the project.