Embed Size (px)
Citation preview

PREAMBLE prepared by the AVMA/AAHA/AAVMC Joint Steering CommitteeAVMA: Drs. John I. Freeman, James E. Nave,
Sherbyn W. Ostrich, Bruce W. LittleAAHA: Drs. Jay W. Geasling, Michael A. Paul,
Margaret J. Rucker, John W. AlbersAAVMC: Drs. Lonnie J. King, Richard F. Ross,
James L. Voss, Curt J. Mann
As the profession of veterinary medicine sits at thebrink of the next century and millennium, we are truly ata crossroads in our professional history. Significant soci-etal problems, new driving forces, our economic viabili-ty, and technologic challenges have combined to createunprecedented opportunities and potential difficulties.Without question, our collective professional future is influx and the fundamental ways of how we work, what wework on, when we work, why we work, and with whomwe work, are all being called into question.
The AVMA, AAHA, and AAVMC commissionedKPMG LLP in April 1998 to analyze and prepare acomprehensive study of the profession as we approachthis watershed point in our history. Sensing the pro-found importance of this special time, the 3 organiza-tions wanted to ensure that the veterinary professionremains productive, responsive and economically suc-cessful. Just as important, the groups also understandthat our future success will be judged by our respon-siveness to the changing needs and expectations ofsociety and our ability to adapt and acquire newknowledge and skills in meeting these diverse needs.
The KPMG study is a comprehensive, far-reaching,and seminal work that contains in-depth analyses andspecial insights of veterinary medicine as we approach
the next century. Issues of supply, demand, income, gen-der, market forces and characteristics of successful prac-tices and public and private practitioners were expertlyexamined and clarified. The study suggests that there isa group of serious problems that need our special andsustained attention. These problems are frequently man-ifested by economic pressures in some segments of theprofession. At the same time, opportunities abound butmay not be realized unless we are able to reconcile theneed to adapt and change our current inefficient struc-tures, inappropriate business practices and attitudes,and habitual ways of delivering services that may beincompatible with our future success. Finally, the studysuggests that our traditional approaches and past requi-site skills and levels of knowledge may not be com-mensurate with the rapid changes and new demands offood-animal industries and the shifting requirementsneeded for the corporate and public opportunities ofthe future, including public health, biomedicalresearch, and the global food system.
The study disclosed compelling evidence forchange and the need for a proactive, comprehensiveplan that could be implemented to both counter theserious problems found and exploit a group of remark-able opportunities. To achieve the AVMA/AAHA/AAVMC’s goal of ensuring a productive, success-ful, responsive and economically viable profession, the3 organizations also interpreted the report as a “call toaction.” The groups are establishing plans for a nation-al dialogue on the critical issues of the report. A goal ofthe 3 associations is to develop and implement concreteand effective strategies to ensure our future relevance,direction, responsiveness, capacity, and economichealth that will lead us to a renaissance for the profes-sion and those we serve as we begin the next century.
161yrammuS evitucexE :ydutS tekraM yranireteV9991 ,51 yluJ ,2 .oN ,512 loV ,AMVAJ
The Current and Future Market for Veterinariansand Veterinary Medical Services
in the United States
Executive SummaryMay, 1999
John P. Brown, PhD, and Jon D. Silverman, PhD
KPMG LLP Economic Consulting Services
American Veterinary Medical Association
American Animal Hospital Association
Association of American Veterinary Medical Colleges
MEGA715C.QXD 1/18/2007 1:06 PM Page 161

The AVMA/AAHA/AAVMC Joint SteeringCommittee has reviewed the report prepared byKPMG, and has identified the following 6 criticalissues, all of which must be successfully addressed toimprove the economic health of the profession.
•Veterinarians’ IncomeThe income of individual veterinarians seriously
lags behind that of similar professions, and impactsthe ability to repay student loans, to attract the bestand brightest to the profession, and to invest in per-sonal and professional growth. Further, pricing of vet-erinary services may not be appropriate relative to thereal cost of the service and the value being delivered.
• Economic Impact of Large Numbers of Womenin the Profession
This study indicates that income of women vet-erinarians is seriously below that of their male col-leagues. There is additional evidence that womenwork fewer hours, are less likely to be practice own-ers, and may price their services below that of men.There is concern that these factors may be reducingthe income levels of all veterinarians.
• Global Demand for All Categories of VeterinaryServices
While consumer (animal owner) spending on vet-erinary services has been robust, there is substantialopportunity to further increase demand. There also isevidence that there is a potentially significant marketfor veterinarians and veterinary services, particularlyin nontraditional and nonprivate practice arenas.
• Inefficiency of the Delivery SystemThe majority of animal care is still being delivered
through a highly fragmented and inefficient system.This includes issues related to excess capacity, staffutilization, and use of capital resources.
• Supply of VeterinariansThere is evidence that in purely economic terms,
there is an excess of veterinarians, which is a cause ofdownward price pressure and is projected to result instagnant veterinary incomes over the next 10 years.More important, the characteristics of the supply maynot closely match the demand, and there is evidencethat modifications in the education of veterinarianswill enable the profession to capitalize on emergingmarkets and to create new services.
• Skills, Knowledge, Aptitude, and Attitude ofVeterinarians and Veterinary Students
While there is ample evidence that the scientificand clinical skills of the profession remain very high,there is also evidence that veterinarians lack some ofthe skills and aptitudes that result in economic suc-cess. Additionally there is evidence that veterinarians’self perception of their abilities and their perception ofwhat they can contribute to society potentially limitthe professional and economic growth of the veteri-nary medical profession.
162 Veterinary Market Study: Executive Summary JAVMA, Vol 215, No. 2, July 15, 1999
Table of ContentsExecutive Summary—Introduction . . . . . . . . . .163
Focus Groups: Key findings . . . . . . . . . . . . . . .163
Central Economic Issues . . . . . . . . . . . . . . . . . .163Demand . . . . . . . . . . . . . . . . . . . . . . . . . . . .164Supply . . . . . . . . . . . . . . . . . . . . . . . . . . . . .164Gap between supply and demand . . . . . . . .165Prices of elasticity of demand . . . . . . . . . . .165Income . . . . . . . . . . . . . . . . . . . . . . . . . . . .168Alternative scenarios . . . . . . . . . . . . . . . . . .168
Forces Having Impact in the Market for Veterinary Services . . . . . . . . . . . . . . . . .169Legal boundaries of the practice
of veterinary medicine . . . . . . . . . . . . . .169Role of women in veterinary medicine . . . .169Student debt . . . . . . . . . . . . . . . . . . . . . . . .169Trade in animal food products . . . . . . . . . .170Pet health insurance . . . . . . . . . . . . . . . . . .171
Other Factors Impacting the Market . . . . . . . . .171Human-animal bond . . . . . . . . . . . . . . . . . .172Changes in pet preferences . . . . . . . . . . . . .173Public perception of veterinarians . . . . . . .173Employers’ and veterinarians’ perceptions
of the factors driving demand . . . . . . . .173
Nonprivate Practice Areas . . . . . . . . . . . . . . . . .174Food safety . . . . . . . . . . . . . . . . . . . . . . . . .174Environment . . . . . . . . . . . . . . . . . . . . . . . .175Animal welfare . . . . . . . . . . . . . . . . . . . . . .175Usage of veterinarians and nonveterinarians
in emerging and scientific areas . . . . . .175
Skills and Knowledge . . . . . . . . . . . . . . . . . . . . .176
Aspects of the Veterinary Practice . . . . . . . . . . .177Capacity utilization . . . . . . . . . . . . . . . . . . .177Competition . . . . . . . . . . . . . . . . . . . . . . . .180Revenue and expense trends: food and
drug costs . . . . . . . . . . . . . . . . . . . . . . .180Staff utilization . . . . . . . . . . . . . . . . . . . . . .182
MEGA715C.QXD 1/18/2007 1:06 PM Page 162

Executive Summary—IntroductionThe veterinary services industry in the United
States has undergone substantial change over the lastgeneration. KPMG was asked to investigate some of thetrends that had been identified by the leadership of theprofession, including:
' flat or declining real incomes of veterinarians,a
' changes in the makeup of the labor force of theveterinary profession,
' substantial increases in veterinary student debt,' evidence of excess capacity in private animal
hospitals and clinics,' changes in the financing of animal health expen-
ditures,' emergence of large corporate organizations that
deliver veterinary services,' changes in how people view their pets and other
animals,' greater awareness of public health and environ-
mental issues,' continued consolidation in the agriculture sector,' more open world trading arrangements,' rapid advances in technology.
KPMG LLP’s Economic Consulting Services wasengaged by the American Veterinary MedicalAssociation, the American Animal Hospital Association,and the Association of American Veterinary MedicalColleges in April of 1998 to prepare a comprehensivestudy of the industry, including an analysis of thesetrends. After nearly 11 months of data collection, litera-ture review, and analysis, KPMG has produced a com-prehensive report that examines the major issues affect-ing the veterinary medical profession.
To carry out the study, KPMG has collected informa-tion from many secondary sources and has also collecteddata through surveys of all segments of the veterinary ser-vices industry. The final report is extensive and is intend-ed to integrate the results of several reports that have beenproduced as part of the project. The final report, which isover 700 pages long, includes results from the following:
' an extensive literature review,' 5 focus groups for veterinarians (private practice,
academics, government, industry, and early stageand students),
' 3 surveys of veterinary service suppliers (privatepractice veterinarians, nonprivate practice veteri-narians, early stage veterinarians, and students),
' 6 surveys of demanders of veterinarians and vet-erinary services (government, industry and largeagribusiness producers, livestock producers, petowners and non-pet-owners, and horse owners),
' an extensive effort to build models of the supplyand demand for veterinary services,
' use of these models to forecast the requirementsfor veterinarians and the available supply of vet-erinarians through the year 2015 for a “most like-ly” scenario and alternative scenarios,
' statistical analysis of factors associated withhealthy veterinary practices, performed usingAVMA Biennial Economic Survey data and theKPMG survey of private practice veterinarians,
' employers’ comments about their satisfaction withthe skills and knowledge that veterinarians have,and the types of skills and knowledge necessary toperform jobs in various areas
Here we will highlight the most important pointsof the study.
Focus Groups: Key findingsAt the beginning of the project, 5 focus group ses-
sions were held for different segments of the profes-sion. The objective of these sessions was to explorewhy participants decided to enter the field of veteri-nary medicine, satisfaction with the profession, per-ception of success within the profession, opinionsabout education and training, and opinions about thefuture of veterinary medicine. The major highlights ofthese sessions are summarized here.
' Established veterinarians were very satisfied withtheir choice of profession.
' Private practitioners love working with animalsand people.
' Industry and government veterinarians enjoy theintellectual content of their jobs.
' The norm for success is still seen as owning a pri-vate practice.
' Many participants said they were not prepared forthe clinical medical procedures and the manage-ment requirements of private practice.
' Most felt that the core basic science curriculumwas necessary and useful.
' Many said that they did not get enough manage-ment, communications, and other skills necessaryfor nonprivate practice.
' All agreed that it would be very difficult for theschools to provide such skills in an already crowd-ed curriculum.
' Many felt that it would be better to make such skillsa prerequisite for admittance to veterinary school.
' A notable comment from an industry participantwas, “From the very, very outset, communicate tostudents that there are all these different fields ofveterinary medicine and they are of equal value.”
' Faculty members were the most optimistic in theirview of the prospects for veterinarians working inmany different areas. They see many opportunitiesin nonprivate practice areas.
' Private practitioners worry about the future, espe-cially about the expense for new students to go toveterinary school.
' There was no obvious consensus about whetherthere were too few or too many veterinarians.
Central Economic IssuesThe center of the analysis is the core of the eco-
nomics of veterinary medicine in the recent past, cur-rently, and a view to the future. We organize the analy-sis into demand, supply, prices, and income.
JAVMA, Vol 215, No. 2, July 15, 1999 Veterinary Market Study: Executive Summary 163
aThere are many places in this report where we use the word “real.”The word “real” indicates that we are referring to inflation adjust-ed dollars.
MEGA715C.QXD 1/18/2007 1:06 PM Page 163
DemandThe estimates we have developed for expected
demand are derived from a variety of sources andanalyses. Companion animal and food animal demandprojections have been developed using sophisticatedeconometric models of demand that were developed byInforum, a consulting group associated with theUniversity of Maryland, that specializes in applicationsof a complex input-output econometric model of theeconomy of the United States. These models take intoaccount key demographic and income trends.Government, academic, and nonprivate practice esti-mates come principally from surveys of these employ-ment segments and from focus group discussion.
Demand for veterinary services has grown signifi-cantly faster than growth in the overall economy. Forthe period 1980 through 1997, there has been anincrease in expenditures on veterinary services of near-ly 7.2% annually in real (inflation-adjusted) dollars.This compares with a 2.9% annual real increase for allconsumer expenditures during the period 1980through 1997. Although the expected growth in veteri-nary services spending through the year 2015 is sub-stantial, it is expected to decline relative to the highgrowth period of the 1980s and 1990s. Still, a fairlyrobust annual real growth rate of 5.1% for expenditureson veterinary services is expected through the year2015. This growth rate is considerably higher than the2.0% expected growth in total consumer expendituresthrough the year 2015.
Part of the reason that the growth rate in demandfor veterinary services will slow is the aging of the pop-ulation. Older people have a lower likelihood of own-ing pets. However, the impact of an aging population ismitigated to some degree by the fact that although theprobability that a household will use veterinary ser-vices at all declines as the age of the household headincreases, the amount of spending on veterinary ser-vices increases with age for users of veterinary services.
The growth in demand for veterinarians that willoccur through the year 2015 is primarily driven bydemand for services for companion animals. Althoughthere are some increases in the demand for veterinariansexpected from nonprivate practice sources, these increas-es are small relative to the increase in demand for veteri-narians due to the demand for services to companionanimals. Growth in the number of companion animalveterinarians required to satisfy the increase in demandfor veterinary services is expected to be 32% through theyear 2015 when measured by the number of persons, and24% when measured by the number of full-time equiva-lent veterinarians (FTEs).
Because the average veterinarian works more thanthe standard (40 hour) week, the absolute number ofsmall animal private practice FTEs required (54,794 bythe year 2015) is greater than the absolute number ofpersons required (52,741 by the year 2015). Thegrowth in the number of persons required (32%) isgreater than growth in the number of FTEs required(24%) because trends in hours worked suggest thatveterinarians will work fewer hours in the future. Thereduction in hours worked in the future is due to 2forces. The first is that hours per week are expected to
fall slightly throughout the economy. The second, andmore powerful influence, is that the veterinarian workforce is becoming proportionally more female, andwomen tend to work in the market place fewer hoursthan men on average.
Other findings about demand in various segmentsof the veterinary services industry are as follows.
' Overall, the demand model predicts only 3% moreveterinarians working in the large animal practicesegment by the year 2015 and a 1.7% decline inFTE veterinarians required to provide services tothe large animal practice segment.
' We expect a modest increase in the demand forveterinary services by meat producers (beef, pork);however, the demand for veterinarians will remainflat due to continued consolidation in the live-stock producing sector.
' Demand for veterinarians serving the dairy indus-try will fall as consolidation continues.
' Expenditures on veterinary services by poultryand egg producers will increase significantly. Butdue to the very concentrated nature of the poultryand egg industry, we expect that only a small num-ber of new veterinarians will be required to pro-vide services for the poultry and egg industry.
' There is little or no growth expected in the acade-mic or government segments.
' Growth in demand for veterinarians in industry isexpected to be 24% through the year 2015 whenmeasured in persons and 17% when measured inFTEs.
' Some growth is expected in the small but impor-tant areas of public health, environment, and foodsafety. However, veterinarians must compete therewith scientists and medical doctors and their rep-resentation will be determined by their ability tocompete. We learned that veterinarians’ role inthese areas is not generally recognized or under-stood by consumers.
Table 1 summarizes the results for each major seg-ment of the industry by the number of veterinarians(persons), and the number of FTEs.
SupplyTo analyze the current and expected supply of vet-
erinarians, KPMG developed a sophisticated computermodel of the supply of veterinarians. The model tracksthe veterinary labor force through time according to anumber of dimensions such as age, industry segment,school where degree was conferred, geographic region,and gender. Additions and subtractions from the laborforce are based on the number of admissions at veteri-nary medical schools, historical and expected retire-ment rates, time off for childbirth, and time off forpost-veterinary medical degree training.
Growth in the supply of actively employed veteri-narians since 1980 has been especially robust. Supplyhas increased from 32,500 in 1980 to 63,751 in 1997.This represents an increase of 96% over the period or4% at an annualized rate of growth.
164 Veterinary Market Study: Executive Summary JAVMA, Vol 215, No. 2, July 15, 1999
MEGA715C.QXD 1/18/2007 1:06 PM Page 164

The supply model predicts that the growth rate hasslowed and will continue to slow until the supply ofveterinarians peaks around 76,600 in the year 2017.b
Table 2 illustrates the deceleration in growth expected.c
Over the period 1997 through 2005 we expect an aver-age net increase in veterinarians of 829 per year. For theyears 2005 through 2010, we expect the net increaseper year to slow to an average of 474 veterinarians; andfor the years 2010 through 2015, we expect the netincrease per year to further decline to 262. By 2017, weexpect the number of veterinarians to reach a steadystate such that entrants into the profession are justmatched by exits from the profession.d The reason forthe slowdown in the rate of growth in the population ofveterinarians is that the supply of new veterinarians hasbeen very stable due to the fairly constant number ofslots available at the 27 veterinary medical colleges. Thenumber of exits is increasing slowly as the populationincreases and ages and will approach (by the year 2017)the point where the number of exits will just match thenumber of entrants, resulting in a steady state popula-tion of 76,600.
Gap between supplyand demand
Figure 1 bringstogether the supply anddemand forecasts for FTEveterinarians. The figureindicates that our modelspredict a slightly highersupply than requireddemand in 1998. Themodels also predict thatthe difference betweensupply and demand isincreasing until it peaksin 2008 and then beginsto decline such thatdemand and supply bal-ance by the year 2014.The implications of theseresults are that there willcontinue to be downwardprice pressure on veteri-nary services' prices and
downward pressure on veterinarians' incomes. Relief,in the form of pressure for increased prices andincomes, will only arrive when supply and demandgrowth align late in the forecast period.
The notion of a gap between supply and demandshould be viewed only as an indicator of the pressureon the price of veterinarians' services (ie, veterinarianincomes). If supply exceeds demand and the distancebetween supply and demand widens, downward pres-sure is placed on veterinarians' incomes. Conversely, ifdemand were to exceed supply and this difference wereto grow over time, this would be indicative of upwardpressure on veterinarians' incomes.
PricesData collected by the Bureau of Economic Analysis
of the Department of Commerce show that veterinaryservice prices have not risen as fast as general con-sumer prices since at least 1972. Figure 2 shows a priceindex for veterinary services and the price index forpersonal consumption expenditures from 1972through 1998. The price of veterinary services washigh relative to the price of other consumer goods until1992. Throughout the period, the price of veterinaryservices has been declining relative to the price of all
JAVMA, Vol 215, No. 2, July 15, 1999 Veterinary Market Study: Executive Summary 165
Table 1—Demand for veterinarians—employment forecast by major employer segment
GrowthEmployment segment 1997 2000 2005 2010 2015 1997–2015
Persons Academic 5,784 5,792 5,829 5,865 5,900 2.0%Industry* 1,962 2,009 2,152 2,337 2,431 23.9%Government 3,986 3,989 4,021 4,049 4,064 2.0%Private practice
Small animal 39,875 41,416 44,667 48,415 52,741 32.3%Large animal 11,726 11,738 11,951 12,049 12,081 3.0%
Total veterinarians 63,351† 64,944 68,620 72,715 77,217 21.9%
Full-time equivalents Academic 7,056 7,056 7,056 7,056 7,056 0.0%Industry 2,406 2,456 2,577 2,742 2,824 17.4%Government 4,420 4,420 4,420 4,420 4,420 0.0%Private practice
Small animal 44,285 45,656 48,272 51,256 54,794 23.7%Large animal 15,377 15,288 15,311 15,217 15,122 –1.7%
Total veterinarians 73,544 74,876 77,636 80,691 84,216 14.5%
*The number of veterinarians employed in the industry segment is undercounted in 1997. We used AVMA membership dataand data from the Association of Industrial Veterinarians to develop the industry numbers. It has been reported that manyindustry veterinarians are not members of either of these associations and therefore the estimate of employment in indus-try is low. Conceivably, it could be twice as large as the estimate reported here. †Sum of persons in segments in 1997 do notadd exactly to total due to rounding.
bThe KPMG forecast includes a new California school of veterinarymedicine. This adds about 1,060 total additional veterinarians tothe supply by the year 2015.
cIt is important to note that although we expect a slowing down in therate of growth, we still expect an increase in the total number ofveterinarians until 2017. Think of the population as a stock and thegrowth rate as a flow into the stock. There is always a natural ten-dency for growth rates to slow as the stock gets larger since there isa larger base upon which the growth rate is estimated. Once thepopulation (stock) gets large enough and old enough, the retire-ment rates will naturally approach the number of new entrants ifthe number of entrants remain fixed. In the case of veterinarians,we have calculated the steady state population to be 76,600.
dNote that the 2017 estimate is not shown. The forecast period forthe models end in the year 2015. However, extension of the modelthrough 2017 showed that supply peaks in 2017.Figure 1—Supply and demand for FTE veterinarians forecast.
MEGA715C.QXD 1/18/2007 1:06 PM Page 165
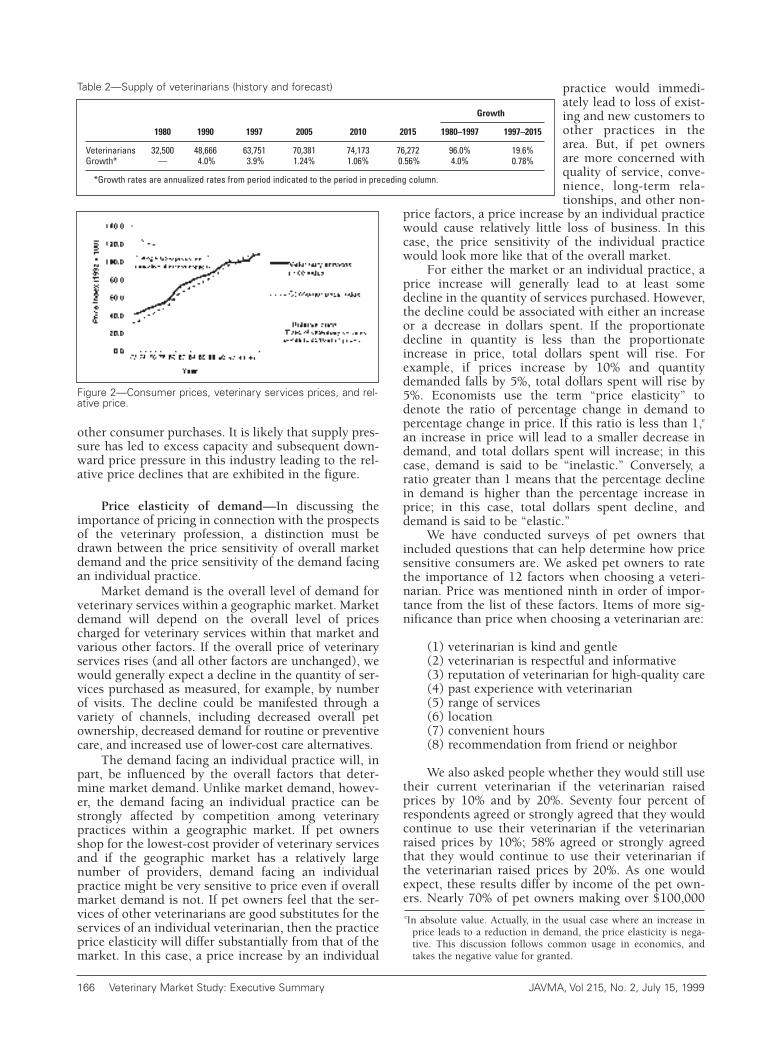
other consumer purchases. It is likely that supply pres-sure has led to excess capacity and subsequent down-ward price pressure in this industry leading to the rel-ative price declines that are exhibited in the figure.
Price elasticity of demand—In discussing theimportance of pricing in connection with the prospectsof the veterinary profession, a distinction must bedrawn between the price sensitivity of overall marketdemand and the price sensitivity of the demand facingan individual practice.
Market demand is the overall level of demand forveterinary services within a geographic market. Marketdemand will depend on the overall level of pricescharged for veterinary services within that market andvarious other factors. If the overall price of veterinaryservices rises (and all other factors are unchanged), wewould generally expect a decline in the quantity of ser-vices purchased as measured, for example, by numberof visits. The decline could be manifested through avariety of channels, including decreased overall petownership, decreased demand for routine or preventivecare, and increased use of lower-cost care alternatives.
The demand facing an individual practice will, inpart, be influenced by the overall factors that deter-mine market demand. Unlike market demand, howev-er, the demand facing an individual practice can bestrongly affected by competition among veterinarypractices within a geographic market. If pet ownersshop for the lowest-cost provider of veterinary servicesand if the geographic market has a relatively largenumber of providers, demand facing an individualpractice might be very sensitive to price even if overallmarket demand is not. If pet owners feel that the ser-vices of other veterinarians are good substitutes for theservices of an individual veterinarian, then the practiceprice elasticity will differ substantially from that of themarket. In this case, a price increase by an individual
practice would immedi-ately lead to loss of exist-ing and new customers toother practices in thearea. But, if pet ownersare more concerned withquality of service, conve-nience, long-term rela-tionships, and other non-
price factors, a price increase by an individual practicewould cause relatively little loss of business. In thiscase, the price sensitivity of the individual practicewould look more like that of the overall market.
For either the market or an individual practice, aprice increase will generally lead to at least somedecline in the quantity of services purchased. However,the decline could be associated with either an increaseor a decrease in dollars spent. If the proportionatedecline in quantity is less than the proportionateincrease in price, total dollars spent will rise. Forexample, if prices increase by 10% and quantitydemanded falls by 5%, total dollars spent will rise by5%. Economists use the term “price elasticity” todenote the ratio of percentage change in demand topercentage change in price. If this ratio is less than 1,e
an increase in price will lead to a smaller decrease indemand, and total dollars spent will increase; in thiscase, demand is said to be “inelastic.” Conversely, aratio greater than 1 means that the percentage declinein demand is higher than the percentage increase inprice; in this case, total dollars spent decline, anddemand is said to be “elastic.”
We have conducted surveys of pet owners thatincluded questions that can help determine how pricesensitive consumers are. We asked pet owners to ratethe importance of 12 factors when choosing a veteri-narian. Price was mentioned ninth in order of impor-tance from the list of these factors. Items of more sig-nificance than price when choosing a veterinarian are:
(1) veterinarian is kind and gentle(2) veterinarian is respectful and informative(3) reputation of veterinarian for high-quality care(4) past experience with veterinarian(5) range of services(6) location(7) convenient hours(8) recommendation from friend or neighbor
We also asked people whether they would still usetheir current veterinarian if the veterinarian raisedprices by 10% and by 20%. Seventy four percent ofrespondents agreed or strongly agreed that they wouldcontinue to use their veterinarian if the veterinarianraised prices by 10%; 58% agreed or strongly agreedthat they would continue to use their veterinarian ifthe veterinarian raised prices by 20%. As one wouldexpect, these results differ by income of the pet own-ers. Nearly 70% of pet owners making over $100,000
166 Veterinary Market Study: Executive Summary JAVMA, Vol 215, No. 2, July 15, 1999
eIn absolute value. Actually, in the usual case where an increase inprice leads to a reduction in demand, the price elasticity is nega-tive. This discussion follows common usage in economics, andtakes the negative value for granted.
Table 2—Supply of veterinarians (history and forecast)
Growth
1980 1990 1997 2005 2010 2015 1980–1997 1997–2015
Veterinarians 32,500 48,666 63,751 70,381 74,173 76,272 96.0% 19.6% Growth* — 4.0% 3.9% 1.24% 1.06% 0.56% 4.0% 0.78%
*Growth rates are annualized rates from period indicated to the period in preceding column.
Figure 2—Consumer prices, veterinary services prices, and rel-ative price.
MEGA715C.QXD 1/18/2007 1:06 PM Page 166

agreed that they would continue while only 50% of petowners making less than $40,000 said they would con-tinue to use their veterinarian if prices were raised by20%. For horse owners, the insensitivity to price maybe even stronger. Eighty nine percent of respondentsagreed or strongly agreed that they would continue touse their veterinarian if the veterinarian raised pricesby 10%; 77% agreed or strongly agreed that they wouldcontinue to use their veterinarian if the veterinarianraised prices by 20%.
Pet owners and horse owners were also askedwhether they strongly agreed, agreed, disagreed, orstrongly disagreed with a series of statements. Sixtyeight percent of pet owners and 73% of horse ownersagreed or strongly agreed that fees are very low com-pared with the value of the pet. In response to thequestion asked in the opposite way, 43% of pet ownersand 30% of horse owners agreed or strongly agreed thatthe fees their veterinarian charges are too high. Whenasked about what one improvement veterinarianscould make to the practice, the most frequently men-tioned response was to lower fees (36% of pet ownersand 26% of horse owners made this choice). Finally,review of the responses of the 47% of pet owners whosaid they had switched veterinary clinics revealed thethird most frequently cited reason for switching was tofind lower prices (21% of the 47% who switched saidthey had done so to find lower prices). This suggeststhat at least 10% of pet owners have switched to findlower prices; 37% of horse owners said they hadswitched veterinarians. Of these, only 7% claimed thatthey switched for price reasons.
Pet owners also stated they would be willing topay $688 on average if the pet had a 75% chance ofsuccessful treatment. The amount they stated theywould be willing to pay dropped to $356 when thechance of successful treatment is only 10%. Table 3includes some interesting differences in these amountsby pet type, gender, age, education, and income.
Horse owners would pay an average of $1,827 fora 75% chance of curing their horse and $828 for a 10%chance. Horse owners also say they would pay an aver-age of $3,314 to keep their favorite horse from dyingand $2,010 for their least favorite horse.
Responses to these survey questions providemixed results. While pet owners rank price low inimportance in terms of selecting a veterinarian, theyalso clearly express some concern about fees. Horseowners are less concerned about fees.
In addition to reporting what people say they willpay, we also analyzed data on actual expenditures. Weestimated the price elasticity of demand as part of theeffort to estimate the demand for veterinary services.
We used data from the Bureau of Labor StatisticsConsumer Expenditure Survey and Census Bureaudemographic data to develop price elasticity of demandand income-elasticity measures.
On the basis of models we have estimated, we havefound that demand for veterinary services is not veryresponsive to price changes. We estimate an aggregateprice elasticity of demand of –0.43. This means that forevery increase of 10% in price, demand declines byonly 4.3% resulting in a net increase of 5.7% in rev-enue. This is similar to the inelastic results that havebeen found by other studies. For example, Daneshvaryand Schwer found price elasticities of –0.18 for dogsand –0.28 for cats.1 A 1992 Ontario Veterinary MedicalAssociation study2 found an elasticity of –0.55 and the1984 AVMA study by Kushman and Wise3 found aprice elasticity of –0.2.
Consistent with the inelastic nature of demand,there is some evidence that practices that charge high-er prices earn more than practices that charge lowerprices. This evidence is found in private practice pric-ing data and financial data that were collected fromveterinarians. We compared pricing by the top 25 per-cent (financially healthy) of small animal practiceswith the bottom 25 percent (less healthy), as deter-mined by the ratio of net income per veterinarian.
Table 4 shows differences in the relative price indexfor the healthy (top 25%) and less healthy (bottom25%) practices. We created the relative price index tocompare key prices within a veterinary practice. Amongthe items we included when constructing this index arethe fees for examinations, surgery, radiology fees, spayand neuter fees, and vaccination fees. The price index isconstructed relative to local consumer prices for eachpractice. In this way, we adjust for geographic pricelevel differences. The index measures how high a prac-tice sets its prices relative to the local price level.
Healthy practices have an average price index of1.15, while the least healthy practices have an indexof 0.97.
The average value of the relative price index ishigher for the healthiest 25% of practices (as definedby the real net income per veterinarian) than for the25% least healthy. Thus, it would appear that healthierpractices charge higher prices relative to their local
JAVMA, Vol 215, No. 2, July 15, 1999 Veterinary Market Study: Executive Summary 167
Table 3—Average expenditures that pet owners report they will spend for successful treatment of apet by type of pet, income, age, education, and gender
Pet type Income Age Education Gender
treatment All owners Dog Cat �� $40 $40–$59 $60–$99 �� $100 �� 45 �� 45 HS College Male Female
75% 688 747 651 607 786 719 865 742 637 615 728 583 704 10% 356 382 358 318 401 351 515 381 331 292 386 428 344
HS = High school.
Chance ofsuccessful
Table 4—Relative price index for practices
Financial health group Average price index
Top 25% (healthiest) 1.15 Bottom 25% (least healthy) 0.97
Practices are assigned to the top 25% and bottom 25% groups on the basisof the practice’s amount of real net income per veterinarian.
MEGA715C.QXD 1/18/2007 1:06 PM Page 167

general price level for services, on average, than do theleast healthy. These results merit caution. We reliedentirely on the accuracy of the reported prices in con-structing the price indexes, but we believe a moreaccurate way to perform this type of analysis would beto use prices that have been audited for accuracy. Morework should be performed to verify these results usingan alternative data source.
IncomeStagnant real income is the most significant prob-
lem that veterinarians face. Income growth for veteri-narians has been far less than income growth in otherprofessions requiring similar education (eg, dentistry orhuman medicine). Table 5 shows veterinarians’incomes and the incomes of physicians and dentists incurrent and real 1996 dollars over the 10-year periodfrom 1985 through 1995. Incomes of veterinarians havefallen in real terms while the real incomes of physiciansand dentists have experienced considerable growth.
Although our models predict substantial continuedgrowth in the demand for companion animal services,supply growth (growth in the number of veterinarians)will exceed demand growth through much of the fore-cast period. The models predict that demand will notcatch up to supply until the year 2014. This meansthere is not likely to be significant upward pressure onveterinarian incomes until late in the forecast period.
Veterinarians do not rank income very highly on alist of reasons for entering the field of veterinary med-icine. New veterinarians and students rank incomeseventh in a list of 8 reasons for choosing the profes-sion of veterinary medicine. Among items ranked morehighly than income are desire to work with and care foranimals, interest in science and medicine, good stablecareer with steady work, desire to help people, honorand respect accorded to the veterinarian, and desire towork outdoors. Only the response for “influenced by afriend or relative” ranked lower than income on the listof reasons for choosing the profession.
While income did not rank highly as a reason forentering the field, its importance became apparentwhen respondents were asked to rank the most impor-
tant attributes of their jobs. Income came in 12th out of19 items in terms of importance for early stage veterinar-ians but rose to second for private and third for nonpri-vate practice veterinarians. Benefits were cited as the mostimportant job attribute for nonprivate practice veterinari-ans. These results suggest that there is considerable mis-perception on the part of early stage veterinarians aboutthe relatively low incomes earned by veterinarians. Wecan only surmise that when the reality of paying bills setsin, income becomes significantly elevated in importance.
Alternative scenariosA number of scenarios have been run using the sup-
ply and demand models that were developed. The pur-pose of running the scenarios was to see how sensitive theresults are to changes in some of the model assumptions.The results of some of these scenarios show the following:
' The effect of a 1% increase or 1% decrease in classsize is almost irrelevant, accounting for only anincrease or decrease of 273 veterinarians by theyear 2015.
' The effect of a 10% decrease in class size acceler-ates the date when supply and demand balance by4 years (from the year 2014 through 2010).Pressure for price increases for veterinary servicesand income increases for veterinarians will be felt4 years earlier in this scenario. The effect of a 10%increase in class size will postpone the date whenpressure for price and income increases will arriveuntil after the end of the forecast period.
' A higher human population forecast (which isbased on the Department of the Census high pop-ulation projections) results in a demand for nearly1,000 more veterinarians by the year 2005 and3,500 more by the year 2015.f
' Holding constant the percentage of female enroll-ment in veterinary medical colleges at 67%, ratherthan allowing it to rise to 78%, results in a 323 FTEincrease in the supply of veterinarians by the year2005 and a 1,025 FTE increase by the year 2015.g
' The baseline forecast assumes a fairly robust 5.1%growth rate in veterinary services through the year2015. A 1 percent higher growth rate in thedemand for veterinary services (over the entireforecast period), in inflation-adjusted dollars,would raise the demand for veterinarians by about9,800 veterinarians by the year 2015. A 1 percentlower growth rate in the demand for veterinaryservices (over the entire forecast period), in infla-tion-adjusted dollars, would lower the demand forveterinarians by about 9,000 veterinarians by theyear 2015. These scenarios demonstrate howimportant the rate of growth in demand is to theveterinary services industry.
168 Veterinary Market Study: Executive Summary JAVMA, Vol 215, No. 2, July 15, 1999
fThe census high population scenario assumes that the population ishigher by 26.6 million people by the year 2015.
gThis is solely due to the fact that women tend to work fewer hoursthan men. In our baseline scenario, female enrollment graduallyincreases throughout the forecast period until it peaks at 78% inthe year 2010 and remains constant through the year 2015.Therefore, in the alternative scenario where there are more men,there are a greater number of FTEs.
Table 5—Nominal and real income of veterinarians, physicians,and dentists
GrowthIncome 1985 1995 1985–1995
Current dollars Physicians (median) $92,000 $160,000 73.9% Veterinarians (median—owners) $51,064 $61,532 20.5% Veterinarians (mean—associates) $30,665 $47,543 55.0% Veterinarians (mean—
owners and associates) $42,498 $57,507 35.3% Dentists (generalist owners) $64,130 $122,860 91.6%
Real 1996 dollars Physicians (median) $133,139 $163,253 22.6% Veterinarians (median—owners) $73,898 $62,783 –15.0% Veterinarians (mean—associates) $44,377 $48,510 9.3% Veterinarians (mean—
owners and associates) $61,502 $58,676 –4.6% Dentists (generalist owners) $92,807 $125,358 35.1%
Sources: Income data come from the AVMA, American MedicalAssociation, Association of American Dental Schools, and Bureau of LaborStatistics.
MEGA715C.QXD 1/18/2007 1:06 PM Page 168

Forces Having Impact in the Market forVeterinary Services
A number of forces that are worth considering sep-arately will work their impact on the demand for, orthe supply of, veterinary services.
Legal boundaries of the practice of veterinarymedicine
In every state there are laws limiting the practice ofveterinary medicine to licensed veterinarians. The workwithin those limits has grown with population but thereis ongoing erosion. Substitution of capital, assistantsand technicians, effective drugs that reduce overalldemand for veterinary services, and over-the-counterproducts all erode the demand for veterinarians.
New areas with growth potential are often outsidethe legal boundaries. In these areas such as biotechnol-ogy, veterinarians have to compete without legaladvantage against all comers.
Role of women in veterinary medicineWomen are rapidly becoming a majority in the
profession. They now make up nearly 70% of veteri-nary students and 36 % of practicing veterinarians. Weexpect that their representation within the veterinarymedical schools will peak at 78% by 2015 and thefemale proportion of veterinarians will increase to 50%by the year 2004 and 67% by the year 2015.
On average, women currently work 3 to 4 fewerhours per week than males. In general, the surveyresults suggest that on average, women will providefewer hours than men in the future, have lower earn-ings expectations than men, are not as interested inpractice ownership, and may have a tendency to pricelower than men. Female private practice veterinariansalso have a lower self-evaluation of their business man-agement and financial skills. Female, nonprivate prac-tice veterinarians have a lower self-evaluation of theircommunication, personnel management, businessmanagement, and marketing skills than males.
There are some unexplained differences betweenmale and female earnings. The reason behind theapparent lower incomes of female practice owners isnot well understood. This is not a condition that is spe-cific to veterinary medicine. It is a fact in all medicalfields. Although there appears to be less of a genderwage gap in veterinary medicine than in other fieldssuch as dentistry or human medicine, a fair size gapdoes exist and seems to widen rather than decline asyears of experience increase. This lower income forwomen is apparent, even when accounting for differ-ences in hours worked and experience.
One possible explanation for at least a portion ofthe earnings gap is whether there are significant differ-ences in how female practice owners set their pricesrelative to how male practice owners set their prices.There is some weak evidence (marginally statisticallysignificant) that women may price as much as 9%lower than men on average.h
The profession would be wise to communicate toveterinarians in general, and women in particular, thebenefits of practice ownership and the importance ofvalue-based pricing. In addition, it may be wise to
encourage practice management skills more for womento elevate their sense of competency in some of theskills they seem to feel they are less competent in thanmen, such as business management, personnel man-agement, financial skills, and marketing.
The relationship between income and gender isone of concern to both men and women veterinarians.Our surveys have shown that women expect that theymay earn less than men. With regard to their overallwork experience, men’s and women’s priorities are sim-ilar in more respects than they differ. Those differingareas have an effect on both men and women, though,and so are not just a “woman’s issue.” For instance, alack of interest in practice ownership could have a sub-stantial effect on the future of veterinary practice,which is of concern and interest to all veterinarians.
Student debtIncreased student debt is a significant issue facing
many recent graduates, and current and future stu-dents in graduate and professional fields. Significantincreases in student debt have been occurring through-out the past decade. This is true for nearly all graduatefields, and is especially apparent in medicine, dentistry,veterinary medicine, and law.
Debt problem or income problem?—Veterinarymedicine is more adversely affected by increased stu-dent debt than other graduate degrees. This is princi-pally because veterinarians’ ability to repay studentloans is lagging behind other professions, becauseincreases in veterinarians’ incomes have not kept pacewith increases in their student debt. While physiciansand dentists have a higher absolute debt burden thanveterinarians ($71,500 for physicians, $75,700 for den-tists and $42,800 for veterinarians in the year 1996),physicians’ and dentists’ ability to carry the debt hasgenerally kept better pace with the increase in debt.Veterinarians, on the other hand, have experienced arise in debt burden that has surpassed the increase intheir incomes. Therefore, we believe that it is probablymore appropriate to characterize veterinarians’ debtproblem as not purely a debt problem but as an incomeproblem. The debt part of the problem is no differentthan the problem faced by other professional occupa-tions, such as human medicine and dentistry.
The implications of carrying higher levels of debtfor veterinarians are quite serious. As in dentistry, thenorm for the veterinary profession is for a veterinarianto eventually become a private practice owner. Unlikeother professions, such as law and medicine, where it ispossible for individuals to practice as employees with-out making substantial capital investments in office andequipment, veterinarians must secure financing to fundpractice ownership. With the levels of education debtthat they are carrying and the relatively limited incomeopportunities available, veterinarians will find it moredifficult to acquire financing that is necessary to start a
JAVMA, Vol 215, No. 2, July 15, 1999 Veterinary Market Study: Executive Summary 169
hGiven the crude price constructs that we have developed (we askedpeople to provide prices for various services and created an aggre-gate index), we think it may be useful to try and corroborate thisresult in some further work where audited price data would beused rather than relying on the accuracy of the reported prices.
MEGA715C.QXD 1/18/2007 1:06 PM Page 169
private practice. With more limited opportunity tostart a private practice, veterinarians (working asemployees) will find themselves in even worse finan-cial condition since there is a substantial disparity inpay between practice owners and employees. This, ofcourse, makes the student debt burden even moresevere for veterinarians because it contributes to avicious cycle. By limiting their ability to secure financ-ing and thereby reducing their ownership opportuni-ties, it thereby affects their ability to repay the debt thatthey have accumulated to enter the profession.
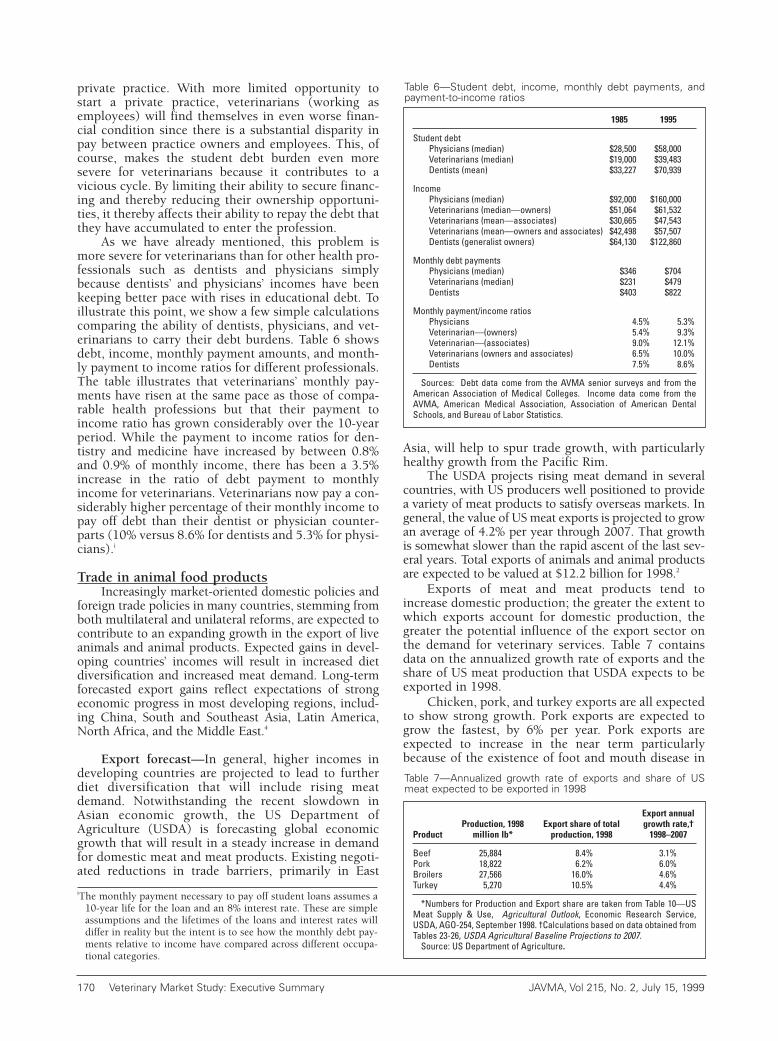
As we have already mentioned, this problem ismore severe for veterinarians than for other health pro-fessionals such as dentists and physicians simplybecause dentists’ and physicians’ incomes have beenkeeping better pace with rises in educational debt. Toillustrate this point, we show a few simple calculationscomparing the ability of dentists, physicians, and vet-erinarians to carry their debt burdens. Table 6 showsdebt, income, monthly payment amounts, and month-ly payment to income ratios for different professionals.The table illustrates that veterinarians’ monthly pay-ments have risen at the same pace as those of compa-rable health professions but that their payment toincome ratio has grown considerably over the 10-yearperiod. While the payment to income ratios for den-tistry and medicine have increased by between 0.8%and 0.9% of monthly income, there has been a 3.5%increase in the ratio of debt payment to monthlyincome for veterinarians. Veterinarians now pay a con-siderably higher percentage of their monthly income topay off debt than their dentist or physician counter-parts (10% versus 8.6% for dentists and 5.3% for physi-cians).i
Trade in animal food productsIncreasingly market-oriented domestic policies and
foreign trade policies in many countries, stemming fromboth multilateral and unilateral reforms, are expected tocontribute to an expanding growth in the export of liveanimals and animal products. Expected gains in devel-oping countries’ incomes will result in increased dietdiversification and increased meat demand. Long-termforecasted export gains reflect expectations of strongeconomic progress in most developing regions, includ-ing China, South and Southeast Asia, Latin America,North Africa, and the Middle East.4
Export forecast—In general, higher incomes indeveloping countries are projected to lead to furtherdiet diversification that will include rising meatdemand. Notwithstanding the recent slowdown inAsian economic growth, the US Department ofAgriculture (USDA) is forecasting global economicgrowth that will result in a steady increase in demandfor domestic meat and meat products. Existing negoti-ated reductions in trade barriers, primarily in East
Asia, will help to spur trade growth, with particularlyhealthy growth from the Pacific Rim.
The USDA projects rising meat demand in severalcountries, with US producers well positioned to providea variety of meat products to satisfy overseas markets. Ingeneral, the value of US meat exports is projected to growan average of 4.2% per year through 2007. That growthis somewhat slower than the rapid ascent of the last sev-eral years. Total exports of animals and animal productsare expected to be valued at $12.2 billion for 1998.2
Exports of meat and meat products tend toincrease domestic production; the greater the extent towhich exports account for domestic production, thegreater the potential influence of the export sector onthe demand for veterinary services. Table 7 containsdata on the annualized growth rate of exports and theshare of US meat production that USDA expects to beexported in 1998.
Chicken, pork, and turkey exports are all expectedto show strong growth. Pork exports are expected togrow the fastest, by 6% per year. Pork exports areexpected to increase in the near term particularlybecause of the existence of foot and mouth disease in
170 Veterinary Market Study: Executive Summary JAVMA, Vol 215, No. 2, July 15, 1999
Table 7—Annualized growth rate of exports and share of USmeat expected to be exported in 1998
Export annualProduction, 1998 Export share of total growth rate,†
Product million lb* production, 1998 1998–2007
Beef 25,884 8.4% 3.1% Pork 18,822 6.2% 6.0% Broilers 27,566 16.0% 4.6%Turkey 5,270 10.5% 4.4%
*Numbers for Production and Export share are taken from Table 10—USMeat Supply & Use, Agricultural Outlook, Economic Research Service,USDA, AGO-254, September 1998. †Calculations based on data obtained fromTables 23-26, USDA Agricultural Baseline Projections to 2007.
Source: US Department of Agriculture.
iThe monthly payment necessary to pay off student loans assumes a10-year life for the loan and an 8% interest rate. These are simpleassumptions and the lifetimes of the loans and interest rates willdiffer in reality but the intent is to see how the monthly debt pay-ments relative to income have compared across different occupa-tional categories.
Table 6—Student debt, income, monthly debt payments, andpayment-to-income ratios
1985 1995
Student debt Physicians (median) $28,500 $58,000 Veterinarians (median) $19,000 $39,483 Dentists (mean) $33,227 $70,939
Income Physicians (median) $92,000 $160,000 Veterinarians (median—owners) $51,064 $61,532 Veterinarians (mean—associates) $30,665 $47,543 Veterinarians (mean—owners and associates) $42,498 $57,507Dentists (generalist owners) $64,130 $122,860
Monthly debt payments Physicians (median) $346 $704 Veterinarians (median) $231 $479 Dentists $403 $822
Monthly payment/income ratios Physicians 4.5% 5.3% Veterinarian—(owners) 5.4% 9.3% Veterinarian—(associates) 9.0% 12.1% Veterinarians (owners and associates) 6.5% 10.0% Dentists 7.5% 8.6%
Sources: Debt data come from the AVMA senior surveys and from theAmerican Association of Medical Colleges. Income data come from theAVMA, American Medical Association, Association of American DentalSchools, and Bureau of Labor Statistics.
MEGA715C.QXD 1/18/2007 1:06 PM Page 170

Taiwan; long-term gains reflect environmental con-straints in competitor countries that limit productiongrowth. However, pork exports amount to only about6.2% of domestic pork production. Chicken andturkey exports are forecasted to grow 4.6% and 4.4%per year, respectively. Although the export growthnumbers represent substantial increases, their impacton domestic production is limited given their smalloverall share of total US production (with the possibleexception of broilers).
Import forecast—Growth in US imports of animalproducts is anticipated to slow from 5.9% annually infiscal years 1997 through 2000, to 3.2% annually in fis-cal 2000 through 2007. In fiscal 1999, live-animalimports are expected to drop. Because of expansion ofhog-packer capacity in Canada and the continuedrebuilding of cattle stock by Canada and Mexico, USimports of live hogs and live cattle are expected todecrease. Live-animal imports in fiscal 1999 are project-ed at $1.5 billion, $200 million below the fiscal 1998level. Imports of animals and products in fiscal 1998 willbe at $6.9 billion, 7% higher than in fiscal 1997. All agri-cultural imports in fiscal 1998 are expected be valued at$38 billion. Thus, the firms and organization that han-dle and produce animals and imports are not expectedto have substantial effect on US domestic production.
Trade effects on demand for veterinaryservices—The impact of foreign trade in live animalsand animal products on employment projections for theveterinary profession is twofold. To the extent that tradeincreases domestic production, it creates additionaldemand for use of veterinary services by animal produc-ers for the domestic and international marketplace (incontrast, a decrease in trade can decrease demand forsuch services). To the extent that changes in the level ofexports and imports require additional inspection ser-vices (to meet domestic and international require-ments), demand for veterinary services will increase.
While data are not collected on veterinarianemployment directly attributable to US trade in agri-cultural products, crude estimates can be piecedtogether to get a sense of just how strong or weak aninfluence trade plays in the demand for veterinary ser-vices. One such measure can be constructed by firstcalculating the share that US imports and exports rep-resent of total US supply of red meats and poultrymeats, a data series that is readily available. Then,assume that utilization of veterinarians for import andexport meat inspection together with export produc-tion is roughly the same as their utilization in relatedpractices overall.j Using trade data for 1997, this veryrough cut at trade related employment reveals thatalmost 15 percent (or 1,268 of 8,647) of veterinarians
involved in large animal practices and food safetyderive their employment from the trade sector.5
The United States has run a sizable positive tradebalance for years, although it has been declining. Thetrade-balance surplus for all agricultural goods was$21 billion in fiscal 1997, down from fiscal 1996’s $27billion. The forecasted surplus for fiscal 1998 is $17billion.5 The impact of increasing exports on demandfor veterinary employment is not likely to be substan-tial in the near term, for 2 reasons. First, exports aresmall compared with domestic production—greaterthan 10% only for chickens. Although the growth inexports of meats and animal products is strong, domes-tic employment of veterinarians will continue to bedetermined largely by domestic consumption. Second,the ability of federal and state inspection agencies toincrease the use of veterinarians is determined more bybudgets than by volume of agricultural products avail-able for export and import. It is likely that a largechange in the volume of products for inspection wouldneed to occur before the federal and state demand forveterinary services would increase substantially.
Much of the long-term growth in US exports iscontingent on an economic recovery in Asia beginningin 2001. If the Asian economic problems worsen or ifAsia drags other regions into recession, current exportforecasts could prove to be overoptimistic. Given cur-rent export-growth expectations, we do not expect alarge increase in the demand for veterinary servicesdue to export growth.
Pet health insuranceUsage of pet health insurance is extremely low in
the United States. Increased utilization could increasethe demand for services, especially by providing anoption to economic euthanasia.
In a survey of pet owners, we have asked howmuch pet owners would be willing to pay for pet healthinsurance. Of 617 respondents, 282 (45.7%) said theywere not interested and would pay nothing. 139(22.5%) said they would pay $5 per month, 93 (15.1%)said they would pay $10 per month, 53 (8.6%) saidthey would pay $15 per month and 33 (5.3%) said theywould pay $20 or more per month.
In a survey of horse owners, 45% of 285 respondentssaid they were not interested in insurance. 36% said theywould pay $20 per month, 8% said they would pay $30per month and 7% said they would pay $40 or more.
These results suggest that there is some potentialfor this market but that price is a significant issue forpet owners; 46% of pet owners are not prospects at all,22% are not good prospects because they will not paymuch, and 14% of pet owners are reasonable or goodprospects. For horse owners, the prospects seembrighter since they indicate that they are less price sen-sitive. Over 50% said they would pay $20 or more permonth. Fourteen percent of the pet owner populationand half of the horse owner population are still a siz-able market to pursue.
Other Factors Impacting the MarketThere are changes and attitudes among pet owners
and those who don’t own pets that have significant
JAVMA, Vol 215, No. 2, July 15, 1999 Veterinary Market Study: Executive Summary 171
jThe phrase “related practices” is taken here to be the sum of veteri-narians employed in the food safety sector and those who are selfemployed in practices classified as predominately or exclusivelylarge, and half of those in self practice that are classified as mixed.The figure for the former group comes from 1998 NationalAssociation of Federal Veterinarians. The figures on the latter aretaken from the Center for Information Management, AVMA mem-bership data, 1997.
MEGA715C.QXD 1/18/2007 1:06 PM Page 171

effects on the market for veterinary services. This sec-tion examines changes in the human-animal bond andchanges in pet preferences. We also report on the pub-lic’s perception of veterinarians and on veterinarians’and their employers’ perceptions of the factors impact-ing demand for veterinary services.
Human-animal bondThe phrase “human-animal bond” remains loosely
defined. It encompasses the many forms of people’sinteractions with animals, including companionship,pleasure, fun, physical security and protection, physi-cal health and service. The human-animal bond iscomplex and is the motivating factor in people’s main-taining pets in their homes at such a high rate.
An increasing interest in the human-animal bondhas been observed and described by veterinarians, petowners, and those working with service animals, suchas dogs for the handicapped and the elderly. Many vet-erinary teaching hospitals have instituted programsdevoted to exploration of the human-animal bond, andseveral organizations focus on it. In addition, a greatdeal of mass media attention is focused on pets. It isnow common to see pet-related cards in stores’ greet-ing-card sections, including birthday, “get well,” andsympathy cards. Health benefits of pets might reducehuman health-care costs and conceivably influence theincidence of pet-ownership. An increased interest inthe disabled, service dogs, and medical-assistance dogscan be documented, although the total number orchange in the number of these dogs is unknown. Allthose reported trends suggest a heightening attach-ment between people and animals.
People more attached to their pets are likely to bemore willing to spend money on veterinary services forpets. In veterinary private practice, recognition of thehuman-animal bond is an important determinant of asuccessful practice. There is a growing recognition thatprovision of veterinary services in a manner thatacknowledges the human-animal bond will lead to bet-ter outcomes for veterinary practices and their patients.
Several veterinary teaching hospitals now havedivisions or departments concerned with the human-animal bond. Their functions are to educate veterinarystudents and to perform research. Education about theramifications of the human-animal bond is importantfor veterinary students. Those who understand thebond apparently will be more successful in privatepractice than those who do not.
Commitment to pets—Most studies of pet owner-ship concentrate on numbers of pets. Results of nearlyall these studies agree that households with childrenare more likely to own pets than those without.
Families with elementary-school children mightbe more likely to own pets than families with older,younger, or no children.6 In one study, the age of chil-dren and the mother’s employment status were impor-tant predictors of pet-ownership and of children’sinvolvement with their pets.7
Results of several studies,6-8 show that families withchildren are more likely to own pets than those withoutchildren; about 58% of all households own pets com-
pared with 80% for households with children. Familieswith fewer children are more likely to own pets thanthose with many children. Children with no siblingsand both parents working might be perceived by theirparents to “need” a pet more than other children.
It is not known whether these families spend moreor less on veterinary services than other pet owners orwhether children’s attachment influences veterinaryexpenditures. It is possible that families with morechildren spend less on their pets either because oflower commitment or because of the financial obliga-tions that come with raising a larger family.
Pet owners’ willingness to pay for veterinary ser-vice is at least as important as the number of pets indetermining the demand for veterinary services. Factorsthat might contribute to willingness to pay include thetotal number of pets in the household, number of chil-dren, family income, and attachment to pets by the per-son making the spending decision. A greater number ofpets or children might dilute the resources available tospend on each pet or dilute the commitment of a givenchild to a given pet or of a parent to a pet.
Some analysts have begun to try to understand thebond better by separating it into measurable compo-nents: “attachment” and “commitment,” which aremeasured on the Miller-Rada Commitment to PetsScale.9 According to that study, attachment is the affec-tion for or status of a pet in the family, and commit-ment reflects the willingness to spend resources on thepet. Preliminary results indicate that the factors associ-ated with commitment—such as age, health, and num-ber of children—are different from the factors associat-ed with attachment. Of the factors that might be usefulin predicting expenditures on veterinary services,those associated with commitment might be betterindicators than those associated with attachment. Highcommitment was found in younger healthy personswho had few children. Income does not appear to be animportant contributor to commitment, but it doesaffect the probability of owning a pet.
Veterinarians who recognize that there is little orno correlation between people’s income and their com-mitment to their pets know that they cannot makeassumptions regarding pet owners’ willingness to payfor veterinary services. It is not known how muchmore income private practitioners could realize if theywere more able to recognize and provide the level ofservices necessary to satisfy the needs created by thehuman-animal bond.
The effect of a potentially heightened human-ani-mal bond on the demand for veterinarians and veteri-nary services is uncertain. Private practitioners mustrecognize the bond and provide services in a mannerthat acknowledges it if they are to be successful. Thephrase “human-animal bond” remains loosely defined.Such constructed indicators as the Miller-RadaCommitment-to-Pets scale help to define differentaspects of the human-animal bond. If, indeed, astrengthening of the human-animal bond translatesinto an increasing commitment to pets, that willincrease demand for veterinary services.
We asked pet owners and non-pet-owners somequestions that can be used to suggest the strength of
172 Veterinary Market Study: Executive Summary JAVMA, Vol 215, No. 2, July 15, 1999
MEGA715C.QXD 1/18/2007 1:06 PM Page 172

the relationship between people and their pets. On thebasis of these responses, we find that the human-ani-mal bond is strong as evidenced by the following:
' 93% of respondents say their families would beupset if anything happened to their pet.
' 85% of respondents believe people are moreattached to their pets now because pets are morelike members of the family now.
' Pet owners say they would pay $688 for a 75%chance of successfully treating their pet and $356for only a 10% chance of successful treatment.
' Pet owners say they would pay an average of$1,042 to keep their favorite pet (dog) from dyingand $657 to keep their favorite pet (cat) fromdying.
' Horse owners would pay an average of $1,827 fora 75% chance of successfully treating their horseand $828 for a 10% chance.
' Horse owners say they would pay an average of$3,314 to keep their favorite horse from dying and$2,010 for their least favorite horse.
' Pet owners also say they would pay an average of$92 per month to keep their pet healthy whilehorse owners say they would pay $165 per month.
Changes in pet preferencesPet population and ownership data from the 1980s
and 1990s suggest that some changes have been takingplace in the number and types of pets owned in theUnited States. There has been an overall increase in thenumber of pet-owning households, but, more impor-tant, there have been some substantial shifts in the typesof pets owned. Of some importance to the veterinaryservices industry is that there has been a reduction in theshare of households that own dogs and cats and anincrease in the share of households that own less tradi-tional pets, such as birds, fish, ferrets, rabbits, and otherreptiles. This is a noteworthy development because tra-ditional pets are more likely to receive veterinary care.
The dog population appears to be stable or increas-ing only slightly. The cat population has increasedappreciably relative to the dog population. The declinein dog-owning households relative to cat-owninghouseholds is a disturbing trend for the veterinary ser-vices industry because dog owners tend to spend moreon veterinary services than cat owners. In addition, catowners are more price sensitive than dog owners andare less likely to seek veterinary care than dog owners.
A more positive trend is that although householdownership rates for traditional pets have dropped thereis marginal evidence of an increase in the number ofpets per household.k
Public perception of veterinariansVeterinarians rate very favorably in public opinion
among their clientele relative to 7 other occupations(physician, accountant, chiropractor, lawyer, dentist,teacher, and pharmacist).
Horse owners rank veterinarians first among all ofthese professional occupations with respect to intelli-
gence, level of education (tied with physicians), com-passion, honesty, trustworthiness, and technical profi-ciency. Pet owners rank veterinarians first in compas-sion, honesty, and trustworthiness, second in intelli-gence, and third in level of education and technicalproficiency.
Non-pet-owners do not think as highly of veteri-narians. The only time veterinarians show up in thetop 3 ratings is for compassion. Non-pet-owners ratedveterinarians fifth in trustworthiness, seventh in intel-ligence, fifth in level of education, and fourth in hon-esty and technical proficiency.
Non-pet-owners are not generally aware that vet-erinarians work in areas other than animal health andwelfare, and wildlife protection; 28% of non-pet-own-ers and 33% of pet owners are aware that veterinarianswork in environmental health, 17% of non-pet-ownersand 24% of pet owners are aware that veterinarianswork in public health, 11% of non-pet-owners, and17% of pet owners are aware that veterinarians work infood safety.
Horse owners are somewhat more aware of veteri-narians’ varied areas of work; 47% of horse owners areaware that veterinarians work in environmentalhealth, 34% are aware that veterinarians work in pub-lic health, and 37% are aware that veterinarians workin food safety.
Employers’ and veterinarians’ perceptions of the fac-tors driving demand
This project carried out a large battery of surveysof various groups of veterinarians, their employers, andthe public. We surveyed and interviewed veterinariansand employers about growth and about their skills andtraining. In this section, we report some of the findingsfrom these surveys.
We asked small livestock producers, industry,and government employers their opinions about howthe demand for veterinary services would be affectedby the following factors. These factors were chosenon the basis of numerous discussions with knowl-edgeable people working in the veterinary servicesindustry. The factors are in Table 8. For example,while many employers believe that public healthissues will increase the demand for veterinary ser-vices, not many believe that alternative medicine willincrease the demand for services; 65% of small live-stock producers, 69% of industry employers, 68% ofgovernment employers, and 76% of nonprivate prac-tice veterinarians agree that public health/zoonoticdisease is one of the most important factors that willincrease the demand for veterinarians in the future.Other factors that are frequently mentioned aregrouped by various employment sectors (the frequen-cy with which each of these items was mentioned assomewhat or greatly increasing demand is shown inparentheses):
Government employers' use of new scientific, medical, or computer tech-
nology (65%)' public concern for food safety (65%)' animal welfare concerns or regulations (65%)
JAVMA, Vol 215, No. 2, July 15, 1999 Veterinary Market Study: Executive Summary 173
kAccording to AVMA and Pet Food Institute surveys.
MEGA715C.QXD 1/18/2007 1:06 PM Page 173

Industry/agribusiness employers' animal welfare concerns or regulations (73%)' use of new scientific, medical, or computer tech-
nology (69%)' biomedical science/research (69%)' animal drug regulations (66%)
Small livestock producers' use of new scientific, medical, or computer tech-
nology (62%)' animal drug regulations (62%)' use of clinical research tools (62%)' biomedical science/research (60%)
In addition to employers, we also asked veterinar-ians to identify growth areas using a slightly differentlist of factors. The factors most frequently mentionedas somewhat increasing, or greatly increasing, demandwere:
Nonprivate practice veterinarians' use of new scientific, medical, or computer tech-
nology (77%)' biomedical science/research (72%)' public concern for food safety (71%)
Private practice veterinarians' use of new scientific, medical, or computer tech-
nology (82%)' internet use by animal owners (76%)' human-animal bond (75%)' pet wellness/nutrition programs (74%)' animal behavior consulting (73%)' critical care (67%)' pet health insurance (66%)
Nonprivate Practice AreasSubstantial efforts were made to analyze opportu-
nities in the nonprivate practice areas of veterinarymedicine. Accumulating reliable data on the nonpri-vate practice segment was more difficult than for theprivate practice segment because there is such a varietyof nontraditional veterinary jobs that veterinarians per-
form and data sources are limited. We relied mainly onsurveys of nonprivate practice veterinarians to developour estimates for the prospects in the government, aca-demic, and industry segments.
Food safetyThe effect on the demand for veterinarians and vet-
erinary services due to heightened concern about foodsafety is uncertain. Although there are indications thatthere will be a need for more stringent oversight of thefood-safety process, there is no assurance that veteri-narians will be the primary beneficiaries of this change.
Overall, we see food safety as a field with potentialopportunity for the veterinary profession, but it isunlikely that numerous new opportunities for veteri-narians will emerge without substantial engagementand focus by the veterinary colleges and the veterinarymedical associations. It must be kept in perspectivethat although this is a potential growth field, veterinar-ians are not the only group capable of providing ser-vices in it. In addition, other forces are affecting thedemand for services that veterinarians are providing toagribusiness, including continued consolidation in theagricultural sector; these forces are ultimately at leastas important as potential increases in the demand forfood safety. Highlights from the surveys are presented.
Of all industry and agribusiness groups surveyed,25% felt that food safety or food inspection were veryto somewhat important functions within the jobs thatveterinarians performed in their organizations. Thisdiverse group included everything from medical sup-ply companies to meat processor/packers. About halfof the processors and livestock producers felt thesefunctions or skills were very to somewhat important.More of the processors and producers felt that food safe-ty knowledge was important for veterinarians to meettheir job responsibilities, and most of those were satisfiedwith their veterinarians’ food safety duties or functions.
Of those companies or organizations that said theywere involved in food safety, almost as many said theyused a nonveterinarian for that work as did those usinga veterinarian. Most of those using nonveterinarianssaid they hired scientists for food safety work or forinnovative processes in food safety; a few said theycould not find a veterinarian or that a veterinarian wasnot needed for that work. One producer (of 10) and 3(of 9) processors said that nonveterinarians had animportant role in performing food safety work in theirorganization. None of the producers and only oneprocessor thought that additional training in food safe-ty would be advantageous to veterinarians working forthem. Among industry and agribusiness companies,59% said that food safety concerns would greatly orsomewhat increase their demand for veterinary ser-vices. Those who felt that food safety concerns wouldincrease demand ranged from 90% of drug companiesto 78% of processor/packers, 60% of livestock produc-ers, and 22% of medical facilities.
Surveys of small livestock producers revealed that15% used their veterinarian as the main source forinformation about food safety (40% said they had noneed for this information). One-third or less felt thatfood safety duties of their veterinarian were very to
174 Veterinary Market Study: Executive Summary JAVMA, Vol 215, No. 2, July 15, 1999
Table 8—Factors* employers of veterinarians and veterinarianswere asked to rate in terms of their impact on demand for vet-erinary services
Factor Factor
Public health/zoonotic disease† Animal behavior consulting‡ Use of new scientific, medical, or Internet use by animal owners‡
computer technology† Regulation of international trade‡ Animal drug regulations† Use of clinical research tools†Biomedical science/research† E-mail for consulting or otherPublic concern for food safety† uses‡ Animal welfare concerns or regulations† Telemedicine‡ Environmental concerns† Competition from other countries‡
Production enhancing technology‡ Access to research grants‡ Continued consolidation in Direct state of federal funding‡
livestock agriculture‡ Agricultural price supports/Increased cost of veterinary services programs‡
Alternative medicine‡
*The factors are presented in roughly the order of importance that employ-ers of veterinarians attach to these factors.†Areas that were mentionedmost frequently as factors that would greatly increase, or somewhatincrease, demand. ‡Factors that are mentioned less frequently.
MEGA715C.QXD 1/18/2007 1:06 PM Page 174

somewhat important, that additional food safety train-ing would be beneficial for their veterinarian, that aveterinarian would be better than a nonveterinarian infood safety duties, or that a veterinarian would bemore cost-effective than a nonveterinarian for foodsafety duties. Despite their overall lukewarm responseto veterinarians’ role in food safety, 58% of respon-dents said that public concern for food safety wouldgreatly or somewhat increase demand for veterinaryservices.
Veterinarians themselves view the impact of foodsafety concerns on their jobs as more significant thando their employers or clients. Overall, 71% of nonpri-vate practitioners surveyed felt that public concern forfood safety would greatly to somewhat increasedemand for their services (all the agribusiness veteri-narians and most of the government veterinariansthought so). About half (47%) of private practitionersthought that food safety concerns would increasedemand for their services (ranging from 33% of smallanimal practitioners to 65% of food animal practition-ers. Pet and horse owners were both unlikely (17% ver-sus 37%) to select “food safety” as an area in whichthey thought veterinarians worked, although that con-cept occurred to horse owners somewhat more often.The veterinarian’s role in food safety is not well under-stood by the public.
EnvironmentAll veterinarians must be aware of environmental
issues in their everyday work. Animal tissues, chemi-cals, “sharps,” and other hazardous materials must bedisposed of properly. Veterinarians working in posi-tions involving environmental issues include those in:food production (where the emphasis is on waste man-agement), environmental toxicology (threats tohumans, domestic animals, and wildlife by environ-mental contamination), nonprofit work (wildlife reha-bilitation on an individual-case basis) consulting witha variety of private companies and government agen-cies on environmental issues that affect domestic andwild animals.
Work performed by state departments of publichealth and by the Army and Air Force can also involveenvironmental issues that affect human health.
The extent of an increase in the demand for vet-erinarians and veterinary services due to heightenedconcern about the environment is uncertain. The totalnumber of veterinarians working specifically anddirectly with environmental issues is small, and evenwith growth it will remain a small segment of the totalveterinary profession in the near future. However,motivated individual veterinarians with an interest inenvironmental issues should be able to find a niche fortheir work. Additional training will be required, andveterinarians will compete with nonveterinarian scien-tists for such jobs.
Animal welfareAnimal welfare is another area in which veterinar-
ians work. Although the exact numbers are not known,they are not very large. Only 50 of the AVMA’s mem-bership identify their principal field as animal welfare.
Our investigation into the area of animal welfare hasyielded the following main findings:
' Veterinarians and pet owners show increasinginterest in and concern for animal welfare.
' Most studies of animal welfare issues are qualita-tive, and most work of “animal welfare” groupsrevolves around gathering or disseminating infor-mation or around legislative efforts. Little of theirwork includes veterinarians.
' Increasing public concern for animal welfaremight increase donations to animal welfare andshelter groups.
' Government budget cutbacks and tax reductions(city, county, and federal) will tend to reduce fundsavailable to animal shelters.
' Most shelters use veterinarians on a part-time oras-needed basis. Shelters identify facility improve-ment as their number 1 priority if they have extrafunds.
' The major direct role for veterinarians concernedwith animal welfare is in enforcement of theAnimal Welfare Act (AWA) by the Animal CareDivision of the US Department of AgricultureAnimal and Plant Health Inspection Service.
' The Animal Care Division has reduced its veteri-nary staff, and projections include further budgetcuts.
' The AWA stipulates that animals kept in researchlaboratories receive veterinary services. Laboratoryanimal veterinarians and consultant veterinariansmight find opportunities in industry. However,industry consolidation and the “herd health”nature of laboratory animal work limit the numberand growth of those jobs.
' No changes to the AWA are expected, but, even ifchanges did occur, they would not result in sub-stantially increased demand for veterinarians.
' Over half of the agribusiness and industry groupscontacted said that increased concern for animalwelfare would increase their demand for veteri-nary services. Because this demand segment issmall, it will not have a large effect on the overalldemand for veterinarians.
Usage of veterinarians and nonveterinarians inemerging and scientific areas
Industry and government employers of veterinari-ans were also asked to identify whether veterinariansor other types of professionals were working in variousnonprivate practice areas. Table 9 shows the areas andthe percentage of respondents who said that their orga-nizations used veterinarians or other professionals forwork in these areas.
These results are suggestive of the very diverse setof areas that veterinarians are involved in. These resultsalso illustrate that many of these are niche areas whereveterinarians vie with other professionals for thesetypes of jobs. Although many of these areas will growsubstantially and there will be some opportunities forveterinarians, these areas are currently so small thateven rapid growth will not produce opportunities forlarge numbers of veterinarians through the year 2015.
JAVMA, Vol 215, No. 2, July 15, 1999 Veterinary Market Study: Executive Summary 175
MEGA715C.QXD 1/18/2007 1:06 PM Page 175
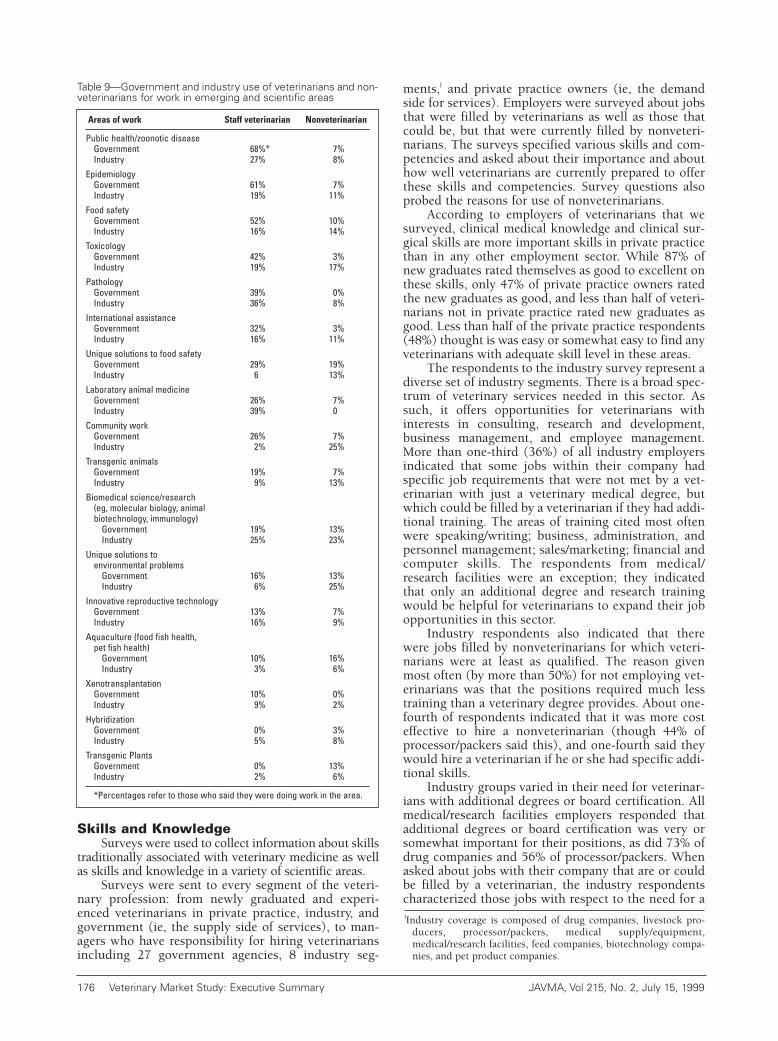
Skills and KnowledgeSurveys were used to collect information about skills
traditionally associated with veterinary medicine as wellas skills and knowledge in a variety of scientific areas.
Surveys were sent to every segment of the veteri-nary profession: from newly graduated and experi-enced veterinarians in private practice, industry, andgovernment (ie, the supply side of services), to man-agers who have responsibility for hiring veterinariansincluding 27 government agencies, 8 industry seg-
ments,l and private practice owners (ie, the demandside for services). Employers were surveyed about jobsthat were filled by veterinarians as well as those thatcould be, but that were currently filled by nonveteri-narians. The surveys specified various skills and com-petencies and asked about their importance and abouthow well veterinarians are currently prepared to offerthese skills and competencies. Survey questions alsoprobed the reasons for use of nonveterinarians.
According to employers of veterinarians that wesurveyed, clinical medical knowledge and clinical sur-gical skills are more important skills in private practicethan in any other employment sector. While 87% ofnew graduates rated themselves as good to excellent onthese skills, only 47% of private practice owners ratedthe new graduates as good, and less than half of veteri-narians not in private practice rated new graduates asgood. Less than half of the private practice respondents(48%) thought is was easy or somewhat easy to find anyveterinarians with adequate skill level in these areas.
The respondents to the industry survey represent adiverse set of industry segments. There is a broad spec-trum of veterinary services needed in this sector. Assuch, it offers opportunities for veterinarians withinterests in consulting, research and development,business management, and employee management.More than one-third (36%) of all industry employersindicated that some jobs within their company hadspecific job requirements that were not met by a vet-erinarian with just a veterinary medical degree, butwhich could be filled by a veterinarian if they had addi-tional training. The areas of training cited most oftenwere speaking/writing; business, administration, andpersonnel management; sales/marketing; financial andcomputer skills. The respondents from medical/research facilities were an exception; they indicatedthat only an additional degree and research trainingwould be helpful for veterinarians to expand their jobopportunities in this sector.
Industry respondents also indicated that therewere jobs filled by nonveterinarians for which veteri-narians were at least as qualified. The reason givenmost often (by more than 50%) for not employing vet-erinarians was that the positions required much lesstraining than a veterinary degree provides. About one-fourth of respondents indicated that it was more costeffective to hire a nonveterinarian (though 44% ofprocessor/packers said this), and one-fourth said theywould hire a veterinarian if he or she had specific addi-tional skills.
Industry groups varied in their need for veterinar-ians with additional degrees or board certification. Allmedical/research facilities employers responded thatadditional degrees or board certification was very orsomewhat important for their positions, as did 73% ofdrug companies and 56% of processor/packers. Whenasked about jobs with their company that are or couldbe filled by a veterinarian, the industry respondentscharacterized those jobs with respect to the need for a
176 Veterinary Market Study: Executive Summary JAVMA, Vol 215, No. 2, July 15, 1999
lIndustry coverage is composed of drug companies, livestock pro-ducers, processor/packers, medical supply/equipment,medical/research facilities, feed companies, biotechnology compa-nies, and pet product companies.
Table 9—Government and industry use of veterinarians and non-veterinarians for work in emerging and scientific areas
Areas of work Staff veterinarian Nonveterinarian
Public health/zoonotic disease Government 68%* 7% Industry 27% 8%
Epidemiology Government 61% 7% Industry 19% 11%
Food safety Government 52% 10% Industry 16% 14%
Toxicology Government 42% 3% Industry 19% 17%
Pathology Government 39% 0% Industry 36% 8%
International assistance Government 32% 3% Industry 16% 11%
Unique solutions to food safety Government 29% 19% Industry 6 13%
Laboratory animal medicine Government 26% 7% Industry 39% 0
Community work Government 26% 7% Industry 2% 25%
Transgenic animals Government 19% 7% Industry 9% 13%
Biomedical science/research (eg, molecular biology, animal biotechnology, immunology)
Government 19% 13% Industry 25% 23%
Unique solutions to environmental problems
Government 16% 13% Industry 6% 25%
Innovative reproductive technology Government 13% 7% Industry 16% 9%
Aquaculture (food fish health, pet fish health)
Government 10% 16% Industry 3% 6%
Xenotransplantation Government 10% 0% Industry 9% 2%
Hybridization Government 0% 3% Industry 5% 8%
Transgenic Plants Government 0% 13% Industry 2% 6%
*Percentages refer to those who said they were doing work in the area.
MEGA715C.QXD 1/18/2007 1:06 PM Page 176

veterinary medical degree as follows: required (46%);highly desirable (17%); helpful, but not required(18%); and irrelevant (19%). The percentage of thosepositions for which industry groups considered boardcertification to be required was reported as: required(23%); highly desirable (28%); helpful (23%); andirrelevant (27%). The percentage of those positions forwhich a PhD or masters degree was considered to berequired was 13% (though 28% for drug companies);highly desirable (24%); helpful (34%; though only10% for processors); and irrelevant (29%).
Regarding positions that are or could be filled by aveterinarian, 27 government employers characterizedthe need for a veterinary medical degree as: required(57%); highly desirable (13%); helpful, but notrequired (13%); and irrelevant (17%). Governmentrespondents described the need for board certificationin their positions as: required (14%); highly desirable(22%); helpful, but not required (29%); and irrelevant(35%). Additionally, those agencies said that a PhD ormasters degree was required in 24% of those positions;highly desirable in 19%; helpful, but not required in30%; and irrelevant in 27%.
Of 12 government respondents (10 federal) thatsaid they had jobs with specific requirements thatwould not be met by a veterinarian, but could be withadditional training, 6 said an additional degree orboard certification were very or somewhat importantfor those jobs. The skill sets noted most often forwhich veterinarians would need additional trainingwere: research skills; speaking/writing; computerskills; personnel management and administration;teaching; epidemiology; or a specific additional degree.
When asked about positions that could possibly befilled by a veterinarian but are not, 39% of governmentemployers said those positions require much less train-ing than a veterinary degree provides, and 35% wouldhire a veterinarian if he or she had specific skills orknowledge. This contrasts with the view of those whowork as veterinarians in government (via the nonpri-vate practice survey), where over half (53%) said therewere on average 23 jobs within their agency that werecurrently filled by nonveterinarians but for which vet-erinarians are at least as or better qualified.
Problem solving abilities, as represented by criticalthinking skills, are in high demand across all employ-ing sectors, especially in private practice. While newgraduates and currently employed veterinarians ratethemselves very highly on this skill, employers are notas satisfied. Less than half of private practice employ-ers (40%), and only 28% of veterinarians not in privatepractice, rate new graduates as having good criticalthinking skills. However, almost all of those respon-dents rate themselves good to excellent on criticalthinking skills (87% and 91% respectively).
Business related skills are widely perceived by allgroups as required skills to succeed in a traditional vet-erinarian job, as well as, to better compete for veteri-nary related jobs for which a veterinary medical degreeis not a prerequisite.
Although nonprivate practice employment issmall, there are some opportunities for veterinarians toexpand into jobs currently held by nonveterinarians,
but doing so will require either additional training oranother degree.
Aspects of the Veterinary PracticeAnother part of our work was to take a careful
look at the business aspects of the veterinary practice.
Capacity utilizationThe issue of whether there is excess capacity in the
veterinary services industry is a complex issue.m
Anecdotes from some private practitioners suggest thatthere is excess capacity, but there is also evidence thatmany practices are resource constrained because theyare unable to hire new associates. To get a better under-standing of this issue, we assembled as much availableinformation as we could find and also asked practi-tioners a number of questions that would help us bet-ter understand the issue.
The AAHA has reported that many of its membershave extended hours without substantially increasing thevolume of business, in effect stretching out case volumeinto longer operating hours. An AAHA study, prepared in1995, made the conjecture that excess capacity in theindustry may be the explanation for why veterinarians’incomes are low, while at the same time, there appears tobe plentiful employment opportunities for veterinarians.This conjecture is based on the notion that the demandfor veterinarians is in part determined by the need tocover the longer hours that the practice must remainopen in order to provide convenient hours of operation.
To test this hypothesis, we looked at the relation-ship between hours open and reported excess capacitywith the belief that practices that were open longershould report greater excess capacity if practices need-ed more labor to cover longer operating hours. Theresults do not suggest that there is a positive relation-ship between how much excess capacity is reportedand hours open. This suggests that practices are notnecessarily staying open longer, and just performingthe same amount or little additional work within thoselonger hours of operation.
Survey results for capacity utilizationquestions—KPMG’s 1998 survey of veterinarians askedprivate practice owners to specify how much of anincrease in caseload that they could handle withoutextending hours of operation or hiring. The survey alsoasked how much their caseload would have to increasefor them to hire an additional assistant or technician,and an additional veterinarian. The objective of thesequestions was to determine how much excess capacitythere is in the delivery of veterinary services. Theresults for these questions are displayed in Table 10.
As the table shows, small animal practices reportthat they could increase caseload by 20% beforeextending hours, 22% before hiring a new technician,and 42% before hiring a new veterinarian. Large animalpractices report that they could increase caseload by20% before extending hours, 31% before hiring a newtechnician, and 45% before hiring a new veterinarian.
JAVMA, Vol 215, No. 2, July 15, 1999 Veterinary Market Study: Executive Summary 177
mExcess capacity is defined as a situation where more services couldbe delivered without expanding the use of inputs such as veteri-narians, technicians, or facilities and equipment.
MEGA715C.QXD 1/18/2007 1:06 PM Page 177
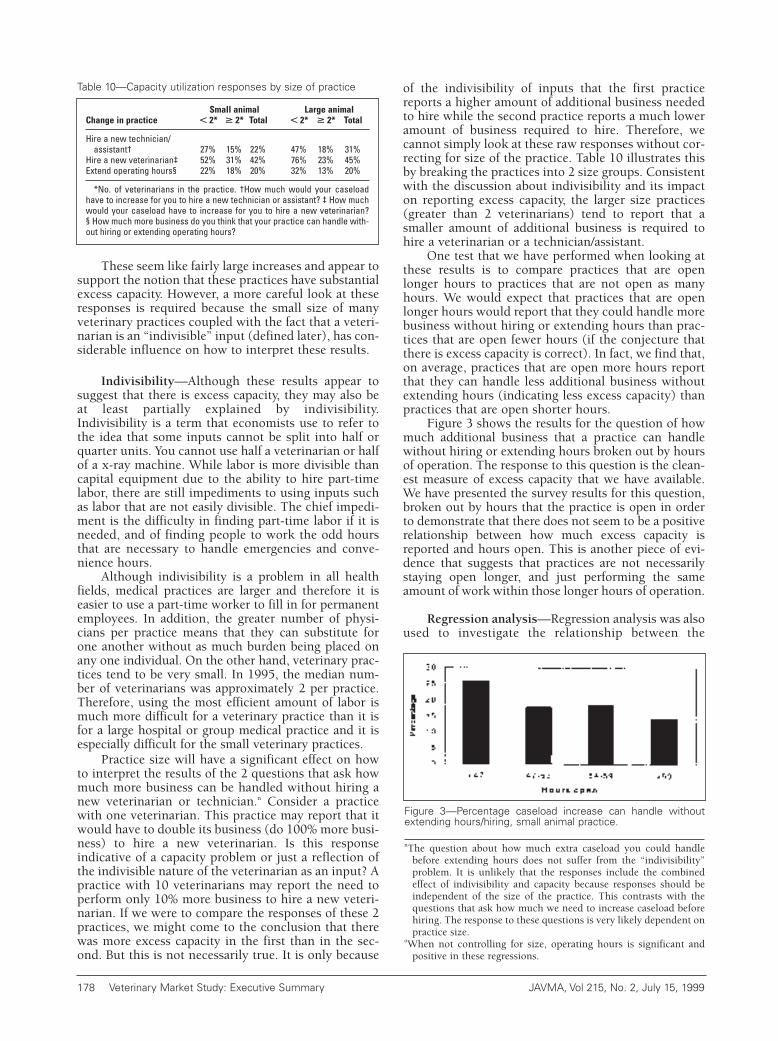
These seem like fairly large increases and appear tosupport the notion that these practices have substantialexcess capacity. However, a more careful look at theseresponses is required because the small size of manyveterinary practices coupled with the fact that a veteri-narian is an “indivisible” input (defined later), has con-siderable influence on how to interpret these results.
Indivisibility—Although these results appear tosuggest that there is excess capacity, they may also beat least partially explained by indivisibility.Indivisibility is a term that economists use to refer tothe idea that some inputs cannot be split into half orquarter units. You cannot use half a veterinarian or halfof a x-ray machine. While labor is more divisible thancapital equipment due to the ability to hire part-timelabor, there are still impediments to using inputs suchas labor that are not easily divisible. The chief impedi-ment is the difficulty in finding part-time labor if it isneeded, and of finding people to work the odd hoursthat are necessary to handle emergencies and conve-nience hours.
Although indivisibility is a problem in all healthfields, medical practices are larger and therefore it iseasier to use a part-time worker to fill in for permanentemployees. In addition, the greater number of physi-cians per practice means that they can substitute forone another without as much burden being placed onany one individual. On the other hand, veterinary prac-tices tend to be very small. In 1995, the median num-ber of veterinarians was approximately 2 per practice.Therefore, using the most efficient amount of labor ismuch more difficult for a veterinary practice than it isfor a large hospital or group medical practice and it isespecially difficult for the small veterinary practices.
Practice size will have a significant effect on howto interpret the results of the 2 questions that ask howmuch more business can be handled without hiring anew veterinarian or technician.n Consider a practicewith one veterinarian. This practice may report that itwould have to double its business (do 100% more busi-ness) to hire a new veterinarian. Is this responseindicative of a capacity problem or just a reflection ofthe indivisible nature of the veterinarian as an input? Apractice with 10 veterinarians may report the need toperform only 10% more business to hire a new veteri-narian. If we were to compare the responses of these 2practices, we might come to the conclusion that therewas more excess capacity in the first than in the sec-ond. But this is not necessarily true. It is only because
of the indivisibility of inputs that the first practicereports a higher amount of additional business neededto hire while the second practice reports a much loweramount of business required to hire. Therefore, wecannot simply look at these raw responses without cor-recting for size of the practice. Table 10 illustrates thisby breaking the practices into 2 size groups. Consistentwith the discussion about indivisibility and its impacton reporting excess capacity, the larger size practices(greater than 2 veterinarians) tend to report that asmaller amount of additional business is required tohire a veterinarian or a technician/assistant.
One test that we have performed when looking atthese results is to compare practices that are openlonger hours to practices that are not open as manyhours. We would expect that practices that are openlonger hours would report that they could handle morebusiness without hiring or extending hours than prac-tices that are open fewer hours (if the conjecture thatthere is excess capacity is correct). In fact, we find that,on average, practices that are open more hours reportthat they can handle less additional business withoutextending hours (indicating less excess capacity) thanpractices that are open shorter hours.
Figure 3 shows the results for the question of howmuch additional business that a practice can handlewithout hiring or extending hours broken out by hoursof operation. The response to this question is the clean-est measure of excess capacity that we have available.We have presented the survey results for this question,broken out by hours that the practice is open in orderto demonstrate that there does not seem to be a positiverelationship between how much excess capacity isreported and hours open. This is another piece of evi-dence that suggests that practices are not necessarilystaying open longer, and just performing the sameamount of work within those longer hours of operation.
Regression analysis—Regression analysis was alsoused to investigate the relationship between the
178 Veterinary Market Study: Executive Summary JAVMA, Vol 215, No. 2, July 15, 1999
Figure 3—Percentage caseload increase can handle withoutextending hours/hiring, small animal practice.
nThe question about how much extra caseload you could handlebefore extending hours does not suffer from the “indivisibility”problem. It is unlikely that the responses include the combinedeffect of indivisibility and capacity because responses should beindependent of the size of the practice. This contrasts with thequestions that ask how much we need to increase caseload beforehiring. The response to these questions is very likely dependent onpractice size.
oWhen not controlling for size, operating hours is significant andpositive in these regressions.
Table 10—Capacity utilization responses by size of practice
Small animal Large animal Change in practice �� 2* �� 2* Total �� 2* �� 2* Total
Hire a new technician/assistant† 27% 15% 22% 47% 18% 31%
Hire a new veterinarian‡ 52% 31% 42% 76% 23% 45% Extend operating hours§ 22% 18% 20% 32% 13% 20%
*No. of veterinarians in the practice. †How much would your caseloadhave to increase for you to hire a new technician or assistant? ‡ How muchwould your caseload have to increase for you to hire a new veterinarian? § How much more business do you think that your practice can handle with-out hiring or extending operating hours?
MEGA715C.QXD 1/18/2007 1:06 PM Page 178

required increase in caseload and operating hours. Thistechnique allows us to look at this relationship whilesimultaneously adjusting for practice size. The size ofpractice variable (number of veterinarians) is signifi-cant. The variable for hours of operation is insignifi-cant in explaining reported excess capacity when con-trolling for size of practice.o This leads us to believethat reported excess capacity is explained by indivisi-bility rather than by longer operating hours (withinwhich additional work could be performed).
Revenue per veterinarian—If practices mustremain open longer hours and are not commensurate-ly increasing cases as is conjectured, then this wouldimply that revenue per veterinarian should be lower forpractices that are open longer hours, ceteris paribus.Falling revenue per veterinarian would lead to lowerwages despite increased demand for labor to coverlonger operating hours.
The practice level revenue data collected from theKPMG survey does not support this hypothesis. In par-ticular, these data indicate that there is a positive rela-tionship between revenue per veterinarian and thenumber of hours that the practice is open. This rela-tionship can be seen in Figure 4. If practices haveexpanded hours without commensurately increasingrevenue per veterinarian, then we would not expect toobserve higher revenue per veterinarian in practiceswith longer operating hours.
Visits—There is another feature of private prac-tices over the past 20 years that does not support theassertion that there is significant underutilization with-in veterinary practices today. The AVMA BiennialEconomic Surveys provide information on the numberof visits per week reported by private practice owners.These data reveal a gradual upward trend in the aver-age and median number of visits per week for privatepractices. For small animal practices, as can be seen inFigure 5, the average number of visits per week risesfrom 117 in 1984 to 162 in 1994. The increase in thenumber of visits could simply reflect an increase in theaverage size of veterinary practices over this period. Tocontrol for this potential scale effect, we also looked at
the average and median number of visits per veterinar-ian. Figure 6 shows that there is an upward trend invisits per veterinarian as well. This suggests that vet-erinarians are being used more intensively and is con-sistent with evidence that technician and assistantlabor are being used more extensively.
Final thoughts on capacity utilization issue—Responses to KPMG’s survey of veterinarians suggestthat there is some, but not a lot, of excess capacity inthe provision of veterinary services. The most directquestion that attempted to gather information on thisissue was the question of how much more business apractice could handle without extending hours or hir-ing. Respondents from small animal and large animalpractices said that, on average, they could handle 20%more business without extending hours or hiring.
Responses for some of the questions requiredadjustment of the responses to separate out indivisibil-ity from true excess capacity. How much more businessa practice can handle without extending hours is leastaffected by size of practice, and therefore we did notadjust the responses. However, we believe that there isstill some upward bias in the reported responsesbecause of some degree of indivisibility that we havenot adjusted for. Therefore, we believe that 20% is theupper limit of actual excess capacity. We are uncertainas to just how much higher than actual excess capaci-ty this 20% estimate is. Other evidence that we have
JAVMA, Vol 215, No. 2, July 15, 1999 Veterinary Market Study: Executive Summary 179
Figure 4—Revenue per veterinarian, by hours open, small animalpractice.
Figure 6—Visits per week per veterinarian, small animal prac-tices.
Figure 5—Visits per week, small animal practices.
MEGA715C.QXD 1/18/2007 1:06 PM Page 179

presented is not consistent with the notion that there isa high degree of excess capacity in the provision of vet-erinary services. However, our analysis has drawn outthe importance of indivisibility and the fact that, whatmay be viewed as substantial excess capacity, is reallyindivisibility that is an artifact of the small size of vet-erinary services.
The small size of practices and the indivisibility ofa veterinarian are also the reason that veterinarians arerequired to work the long hours. In a small practice,owners cannot justify hiring until some thresholdincrease in demand is apparent. If they cannot hire,they must work extra hours to cover whateverdemand cannot be satisfied by more standard workhours.
Larger practices have a better capability to managethe problem of delivering the appropriate amount oflabor hours to meet the amount demanded. With alarger number of veterinarians per practice, it does nottake as great a change in demand to add a position.Larger practices have a better capability to manage theproblem of delivering the appropriate amount of laborhours to meet the amount demanded.
Some thought should be given to developingarrangements that more effectively share labor (andcapital) across practices. Consolidation of practices isunlikely to alleviate this problem because most consol-idation has not affected the smallest of practices. Thisis because most consolidation has been initiated bylarge corporate veterinary organizations. These organi-zations have expressed their preference for adding totheir organization by purchasing clinics with revenuesof at least $750,000 per year and will not affect thesmallest of practices.
CompetitionVeterinary practices report robust competition for
customers. Half of private practitioners see competi-tion as either stronger or somewhat stronger than itwas 5 years ago, whereas 37% see competition as aboutthe same, and 8% see competition as weaker or some-what weaker. By practice type, equine, small, andmixed animal practitioners observe stronger competi-tion than large animal practitioners do; 59% of equine,52% of small, and 50% of mixed animal practitionersdescribe competition as stronger versus 41% of largeanimal practitioners.
Among practice owners who have seen a decline inrevenue (1 of every 7 respondents to our survey),about 53% of them point to the reason for the declineas attributable to a reduction in demand for their ser-vices (20%), new competition moved into area (17%),or more aggressive pricing by their competitors (16%).Those are all suggestive of increased competition ordeclining demand.p
Thirty-eight percent of the practice owners whoresponded to our survey said that they had observedpractice failures. The 5 most frequently mentioned rea-sons for practice failure are insufficient client base(39%), new competition (25%), poor client manage-
ment (24%), poor office management (22%), and poorcommunication skills (20%).
Revenue and expense trends: food and drug costsWe have examined detailed revenue and expense
data using AVMA Biennial Economic Survey data fromthe years 1983 through 1995. We constructed a timeseries to reveal trends in these data. The resulting timepatterns for the revenue and expense data we haveexamined are in Table 11.
Total revenue—Real revenue has been rising mod-estly for small animal practices and slightly faster formixed animal practices. It has been rising only slightlyfor large animal practices and has fallen for equinepractices.
Total expenses—Total expenses have approxi-mately mirrored the pattern of real revenue growth,increasing fastest for mixed and small animal practices,modestly (but outstripping revenue growth) for largeanimal practices, and declining for equine practices.
Net income—The pattern of revenue and expensechanges has resulted in only a small increase in real netincome for small animal practices and to declines inreal net income for large animal and equine practices.Only mixed animal practices have seen a significantincrease in real net income, bringing them closer inrange to the net incomes observed for the 3 other prac-tice types.
Costs of goods and services—Real costs of goodsand services have risen about twice as fast as total rev-enue for small animal and mixed animal practices. Forequine practices, these costs have declined, but notnearly as fast as revenues have declined. For large ani-mal practices, these costs have grown modestly, butgiven the almost nonexistent growth in revenues, thesecost increases have still significantly exceeded theircorresponding revenue increases.
Labor costs—Labor costs have increased modestlyover this 12-year period but considerably slower thantotal expenses for small animal and large animal prac-tices. Labor costs have fallen for equine practices at afaster rate than total costs have fallen for these prac-tices. Labor costs have risen somewhat faster for mixedanimal practices but have still risen much slower thanother expenses. Labor cost detail is also available forveterinarian and other staff labor costs. Labor costs (inconstant dollars) for veterinarian employees have fall-en for small animal practices while labor costs for otherstaff have increased for these practices. Labor costincreases for veterinarians at large animal and equinepractices have surpassed the change in labor costs forall other staff. At mixed animal practices, labor costincreases for veterinarian employees have laggedbehind the increase in labor costs for other staff.
Overhead expenses—All practice types except formixed animal practice show a decline in real overheadexpenses. A small increase in real overhead expense has
180 Veterinary Market Study: Executive Summary JAVMA, Vol 215, No. 2, July 15, 1999
pBut the main reason cited for a reduction in revenue was that theychose to reduce volume of business (21%).
MEGA715C.QXD 1/18/2007 1:06 PM Page 180

occurred for mixed animal practices. Although we arenot completely certain why overhead expenses havedeclined in real terms, the most likely answer is due tothe decline in interest rates. Interest payments on debtare included in fixed overhead and these paymentsmust have declined considerably over this period.
The most notable issue revealed by these data isthat the costs of goods and services have increasedsignificantly faster than all other costs over the 12-year period covered by these surveys. This is true forall practice types, but is most significant for small andmixed animal practices. Costs of goods and servicesinclude drugs, pet food supplies, and laboratory diag-nostic and radiology fees. In terms of importance to
total costs, these costsare larger than all othercost categories for allpractice types exceptsmall animal practice.For small animal prac-tice, labor costs exceedthe costs of goods andservices. However, thegap between labor costsand the costs of goodsand services is narrowingbecause costs of goodsand services are risingsignificantly faster thanlabor costs.
As shown in Table11, the costs of goods andservices have grown inreal dollars significantlyfaster than total real dol-lar revenue for all prac-tice types. For example,for small animal practice,costs of goods and ser-vices have risen by atleast 50% from 1983 to1995.
At the same time,real revenue hasincreased by only 25%.This could possiblyimply a negative drag onnet income due to costsof goods and services ris-ing faster than revenue.This is not entirelyunambiguous, however,because it could possiblybe the case that revenueassociated with thesecosts may be increasingfaster than the coststhemselves and fasterthan other revenue. Onlyreliable data on thesource of revenues wouldbe able to definitivelydetermine whether the
costs of goods and services are exceeding the revenuesattributable to these costs.
To examine this point, we have used AVMABiennial Economic Survey data. Since 1985, practiceshave been asked to attribute their revenues to thesource of those revenues. However, we do not have asmuch confidence in this particular part of the AVMABiennial Economic Surveys because the reporting ratesfor these data are low and significant cleaning andelimination of outliers was necessary to use these data.
Nevertheless, we have compared the growth in rev-enue that is attributed to the cost of goods to theexpenses attributed to the goods and found that, in gen-eral, cost increases have exceeded revenue increases.
JAVMA, Vol 215, No. 2, July 15, 1999 Veterinary Market Study: Executive Summary 181
Table 11—Real revenues and expenses (medians in dollars) deflated using Consumer Price Index (CPI;1982–1984 = 1.00)
Growth1985* 1987* 1989* 1993* 1995* 1983–1995
Small animal practice Revenue 255,811 264,269 277,671 317,804 316,517 23.7%Total expenses†‡ 178,820 180,930 198,828 227,811 227,418 27.2%
Labor 77,014 75,537 81,967 93,598 90,840 18.0% Goods and services 45,617 48,040 54,521 66,517 68,929 51.1% Overhead 42,604 42,669 45,437 45,123 40,963 –3.9%
Fixed 22,065 23,249 24,724 22,131 17,439 –21.0% Variable 13,455 12,655 12,961 14,056 14,194 5.5% Discretionary 7,083 6,765 7,752 8,936 9,329 31.7%
Net income 76,991 83,339 78,789 89,992 89,099 15.7%
Large animal practice Revenue 346,377 346,859 368,824 353,951 358,313 3.4% Total Expenses†‡ 235,267 247,599 260,623 260,662 277,766 18.1%
Labor 65,970 70,568 79,384 76,833 74,960 13.6% Goods and services 107,911 110,930 117,627 120,822 124,482 15.4% Overhead 38,722 38,567 40,715 38,382 33,932 –12.4%
Fixed 13,023 13,485 14,461 11,997 8,493 –34.8% Variable 19,868 19,043 19,199 19,532 19,094 –3.9% Discretionary 5,832 6,039 7,055 6,854 6,345 8.8%
Net income 111,109 99,260 108,201 93,289 80,546 –27.5%
Mixed animal practice Revenue 261,160 269,008 281,376 296,922 341,007 30.6% Total expenses†‡ 196,693 202,837 204,181 220,530 247,916 26.0%
Labor 66,124 69,963 72,819 74,985 85,919 29.9% Goods and services 60,717 66,367 78,487 90,622 100,785 66.0% Overhead 34,737 36,174 38,895 41,003 40,726 17.2%
Fixed 14,609 16,512 18,397 17,086 13,266 –9.2% Variable 15,372 15,059 14,923 17,327 20,147 31.1% Discretionary 4,756 4,603 5,576 6,590 7,314 53.8%
Net income 64,468 66,171 77,196 76,392 93,091 44.4%
Equine practice Revenue 327,655 352,901 327,094 310,823 298,757 –8.8% Total expenses†‡ 232,141 261,034 244,680 241,774 223,501 –3.7%
Labor costs 83,300 103,397 94,438 80,624 75,382 –9.5% Goods and services 86,847 84,026 67,292 76,143 84,834 –2.3% Overhead 45,274 52,870 49,780 41,184 39,677 –12.4%
Fixed 13,400 16,050 17,092 13,989 12,276 –8.4% Variable 24,122 27,809 24,490 19,816 18,508 –23.3% Discretionary 7,752 9,011 8,198 7,378 8,894 14.7%
Net income 95,514 91,867 82,414 69,049 75,256 –21.2%
*Two-year averages. †Labor costs include associate veterinarians’ salaries, ancillary staff salaries, pension and profitsharing, payroll taxes, medical and liability insurance. Cost of goods and services include drugs/medical supplies, pet foodand other feed, laboratory and radiology fees. Fixed overhead includes office rent, equipment rental, building equipmentrepair and maintenance, property taxes and insurance, and interest (all liabilities). Variable overhead includes vehicleexpense, telephone and utilities, computer and office expense. Discretionary overhead includes accounting and legal fees,promotion and advertising, continuing education, and miscellaneous expenses. ‡The sum of expense detail will not add tototal expenses. Total expenses have been collected from the total expense response from biennial surveys. The detailedexpense items have also been collected from these line items from the AVMA Biennial Economic Surveys. Respondents donot always accurately report detailed expense items such that they sum to reported total expenses. Where there were sig-nificant discrepancies, these respondents were dropped from the analysis. However, there are still numerous cases wheredetailed expenses do not add exactly to reported totals; hence the sum of detailed expense items do not add to totals report-ed in these tables.
Source: AVMA Biennial Economic Surveys.
MEGA715C.QXD 1/18/2007 1:06 PM Page 181

Although we have less confidence in the results forthe components of revenues than we have for total rev-enue, there is nothing in these data to cause us torefute the basic premise that costs of goods and ser-vices are rising faster than the revenues associated withthese costs. Table 12 shows the revenue data that prac-tices have stated as coming from food, drug, and labo-ratory fees, as well as corresponding costs attributed tothese same items. Expenses are growing considerablyfaster than fees for large animal, mixed animal, andequine practices. Expenses are growing at about thesame rate as fees for small animal practices. More workneeds to be done to verify this preliminary finding.
More research should be undertaken to study themargins that veterinarians are receiving on drugs and petfood products. Since these costs are such a large portionof total costs, it is exceedingly important that appropriatemargins are earned on these products. The evidence fromthese data is that it is questionable whether veterinariansare getting sufficient mark up on this category of revenue.
Consistent with the previous finding that food anddrug costs have been rising faster than revenues is thefact that practices that depend more on food and drugsales are not as likely to be as financially healthy aspractices with lesser dependence on food and drugsales. We put forth this finding on the basis of analysisthat we performed using private practice financial datafrom the AVMA’s Biennial Survey. In this analysis, wehave compared the top 25 percent of practices in termsof financial health with the bottom 25 percent. (Forthis analysis, we measured financial health as the ratioof net income per veterinarian). Table 13 shows theaverage ratio of food and drug expenses to total rev-enues for small and large animal practices.
Staff utilizationFigure 7 is based on published Bureau of Labor
Statistics, Office of Employment Surveys data on tech-
nicians and assistants and a constructed comprehensiveemployment series for veterinarians. The chart displaysBureau of Labor Statistics information for 1992, 1995,and 1996 (1996 is the most recent year for which dataare available). In the 5-year period presented, the use oftechnicians and assistants has been steadily, althoughmodestly, increasing, from 0.94 per veterinarian in 1992to 1.15 per veterinarian in 1996. There has been a slightchange in the type of assistance used more intensively.The data suggest that as veterinarians have increasedthe use of technicians and assistants in the delivery ofservices, there has been a slight preference for the use oftechnicians over assistants. The use of techniciansaccounted for 40% of the total measure in 1992 (0.38 of0.94) and 43% of the total in 1996 (0.49 of 1.15).
There is some evidence that practices that utilizetechnicians and assistants more are financially betteroff than those who are less reliant on staff labor.Practices that use technicians and assistants more havea higher probability of being financially healthy thanpractices with lesser utilization of technicians andassistants. We come to this conclusion on the basis ofanalysis that we performed using private practicefinancial data and data on usage of assistants and tech-nicians that we collected in our veterinarian survey. Inthis analysis, we have compared the top 25 percent ofpractices in terms of financial health with the bottom25 percent (for this analysis, we measured financialhealth as the ratio of net income per veterinarian).Table 14 shows the ratio for small animal practices.
The average number of technicians and assistantsto veterinarians for the top 25% (healthiest) practicesis 2.3, whereas the average ratio of technicians andassistants to veterinarians for the least healthy prac-tices is only 1.6. The healthier practices are utilizingmore nonveterinarians, in comparison to the leasthealthy practices.
182 Veterinary Market Study: Executive Summary JAVMA, Vol 215, No. 2, July 15, 1999
Figure 7—Utilization of veterinary technicians and veterinaryassistants per veterinarian.
Table 14—Ratio of technicians and assistants to veterinarians
Financial health group Ratio
Top 25% (healthiest) 2.3 Bottom 25% (least healthy) 1.6
Practices are assigned to the top 25% and bottom 25% groups based onthe practice’s amount of real net income per veterinarian.
Table 13—Food and drug expenses as a share of total revenues(small and large animal practices)
Financial health group Small animal Large animal
Top 25% (healthiest) 19.1% 26.5% Bottom 25% (least healthy) 25.4% 40.0%
Practices are assigned to the top 25% and bottom 25% groups based onthe practice’s amount of net income per veterinarian.
Table 12—Revenue sources and expenses (in dollars): medianfood, drug, radiology and laboratory fees
Growth1985 1987 1989 1993 1995 1985–1995
Small animal Revenue 76,297 81,641 111,846 119,413 145,618 90.9% Expenses 52,976 54,950 77,465 104,407 101,705 92.0%
Large animalRevenue 159,385 171,331 163,965 140,982 203,769 27.8% Expenses 116,535 133,001 151,339 177,356 195,457 67.7%
Mixed animalRevenue 88,495 94,000 110,905 74,921 114,514 29.4% Expenses 70,200 79,066 111,557 135,284 167,000 137.9%
EquineRevenue 111,072 123,429 77,692 90,000 120,244 8.3%Expenses 109,391 78,447 84,000 124,923 128,935 17.9%
Source: AVMA Biennial Economic Surveys
MEGA715C.QXD 1/18/2007 1:06 PM Page 182

References1. Daneshvary N, Schwer RK. The nature of demand for com-
panion pet health care. J Appl Bus Res 1993;9:24–32.2. R. K. House & Associates Ltd. Results of the 1992 econom-
ic survey. Ontario, Canada: Ontario Veterinary Medical Association.3. Wise JK, Kushman JE. Synopsis of US veterinary medical
manpower study: demand and supply from 1980 to 2000. J Am VetMed Assoc 1985;187:358–361.
4. USDA agricultural baseline projections to 2007, Tables23–26, 34, Office of the Chief Economist, USDA, Staff ReportWAOB-98-1, February 1998.
5. US Meat Supply & Use. Agricultural outlook, Tables 10 and25, Economic Research Service, USDA, AGO-254, September 1998.
6. Melson G, Schwarz R, Beck AM. Importance of companionanimals in children’s lives—implications for veterinary practice. J AmVet Med Assoc 1997;211:1512–1518.
7. Melson GF. Availability of and involvement with pets bychildren: determinants and correlates. Anthrozoos 1988;2:45–52.
8. Rost DH, Hartmann A. Children and their pets. Anthrozoos1994;7:242–254.
9. Staats A, Miller D, Carnot MJ, et al. The Miller-RadaCommitment to Pets Scale. Anthrozoos 1996;9:88–94.
JAVMA, Vol 215, No. 2, July 15, 1999 Veterinary Market Study: Executive Summary 183
MEGA715C.QXD 1/18/2007 1:06 PM Page 183