Embed Size (px)
Citation preview
Comprehensive Summaries of Uppsala Dissertationsfrom the Faculty of Science and Technology 1039
Macromolecules at Interfaces
BY
HELÉN LARSERICSDOTTER
ACTA UNIVERSITATIS UPSALIENSISUPPSALA 2004

To my beloved Micke and my beloved Family

List of Papers
This thesis is based upon the following papers and manuscripts, which will be referred to in the text by their Roman numerals:
I.Thermodynamic Analysis of Proteins Adsorbed on Silica Particles: Electro-static Effects. Larsericsdotter H, Oscarsson S, Buijs J. J Colloid Interface Sci 2001; 237:98-103
II.Localized changes in the structural stability of myoglobin upon adsorption onto silica particles, as studied with hydrogen/deuterium exchange mass spectrometry. Buijs J, Ramström M, Danfelter M, Larsericsdotter H, Håkansson P, Oscars-son S. J Colloid Interface Sci 2003; 263:441-448
III.Thermodynamic analysis of lysozyme adsorbed to silica. Larsericsdotter H, Oscarsson S, Buijs J. J Colloid Interface Sci 2004; 276:261-268
IV.Structure, Stability, and Orientation of BSA Adsorbed to Silica. Larsericsdotter H, Oscarsson S, Buijs J. Submitted to Journal of Colloid and Interface Science.
V.Combining Surface Plasmon Resonance and Mass Spectrometry in Func-tional Proteomics: How to avoid and utilize non-specific adsorption. Larsericsdotter H, Jansson Ö, Zhukov A, Areskoug D, Oscarsson S, Buijs J. Submitted to Proteomics.
My contribution to the papers included in this thesis was: I and III: Responsible for experimental work, analysis of results and writing of the paper. II: Participated in experimental work, analysis of results and writing of the paper.IV and V: Responsible for experimental work concerning DSC and SPR, participated in the experimental work concerning MS, responsible for analy-sis of results and writing of the paper.
Contents
1. Introduction.................................................................................................7
2. Protein adsorption .....................................................................................102.1 Protein structure .................................................................................102.2 Adsorption induced changes in the protein structure .........................13
2.2.1 Hydrophobic and electrostatic interactions.................................132.2.2 Protein stability...........................................................................152.2.3 Surface coverage.........................................................................152.2.4 Summary.....................................................................................16
3. How to study proteins and their structures in the adsorbed state ..............173.1 Quantification of adsorbed amount ....................................................183.2 Protein stability ..................................................................................19
3.2.1 Thermodynamic analysis ............................................................193.2.2 Hydrogen deuterium exchange mass spectrometry ....................223.2.3 Limited proteolysis .....................................................................29
4. Discussion of the papers ...........................................................................304.1 Proteins...............................................................................................314.2 Paper I ................................................................................................324.3 Paper II ...............................................................................................344.4 Paper III..............................................................................................364.5 Paper IV..............................................................................................394.6 Paper V...............................................................................................414.7 Future outlooks...................................................................................43
5. Description of Instruments........................................................................445.1 Differential Scanning Calorimetry .....................................................445.2 Mass Spectrometry .............................................................................46
5.2.1 Matrix Assisted Laser Desorption and Ionization ......................465.2.2 Electrospray Ionization...............................................................475.2.3 Time-of-Flight ............................................................................485.2.4 Fourier Transform-Ion Cyclotron Resonance.............................49
5.3 Surface Plasmon Resonance...............................................................51
6. Acknowledgements...................................................................................53
7. Summary in Swedish ................................................................................54
8. References.................................................................................................58
Abbreviations
Cp Partial heat capacity CTAB Hexadecyltrimethylammonium bro-
mideDSC Differential Scanning Calorimetry ESI Electrospray Ionization FT Fourier Transform FWHM Full With at Half Maximum of the
transition peak G Gibbs free energy H Enthalpy HDX Hydrogen/Deuterium exchange Hepes N-[2-Hydroxyethyl]piperazine-N´-[2-
ethane-sulfonic acid] ICR Ion Cyclotron Resonance i.e.p. Iso-electric point MALDI Matrix-Assisted Laser Desorption
and Ionisation MS Mass Spectrometry m/z Mass-to-charge n-OGP n-octyl glucopyranoside PDMS Polydimethylsiloxane S Entropy SPR Surface Plasmon Resonance Tm Temperature at which the denatura-
tion transition is half completed TOF Time-of-Flight

7
1. Introduction
There are a large variety of different proteins existing in nature. Each pro-tein has a special biological function and purpose, and the ability to carry out its task is highly related to its structural conformation. For example, enzymes catalyze chemical reactions, immunoproteins defend organisms against for-eign intruders, and proteins in muscles convert chemical energy into me-chanical work. Proteins are relatively large biomolecules and have a ten-dency to accumulate at the interface between solutions and solid surfaces [1]. The adsorption of protein molecules has interested and fascinated re-searchers worldwide for several decades. This phenomenon is a part of our everyday life, for example, plaque formation on teeth [2, 3], fouling of con-tact lenses [4], and food processing equipment [5-9]. Another costly area is the fouling of ship hulls [10-12]. The cleaning of ship hulls constitutes a significant part of the budget for both the military and the shipping business [13]. Within medical science, protein adsorption plays an important role in fields such as protein purification [14-17], biomaterials [18, 19], biosensors [20-23], diagnostic test systems [24-27], and drug delivery systems[28-31], just to mention some. Whether protein adsorption is desirable or not, knowl-edge of the underlying principles is required in order to control the interac-tion between proteins and interfaces.
Over the years, research has outlined several forces of interaction as the most important and underlying reasons that proteins to adsorb onto surfaces [32, 33]. A major driving force for adsorption onto hydrophobic surfaces is hydrophobic interactions, which cause dehydration of the sorbent surface. This leads to more favorable surroundings around hydrophobic areas by exclusion of water molecules both from areas on the protein and the sorbent surface. Electrostatic interactions play an important role for adsorption onto hydrophilic surfaces due to the attraction between positive and negative charges. These interactions are not only affected by the chemical composi-tion of the protein and sorbent surface, but also by environmental conditions like pH and ionic strength of the surrounding solution. Other important as-pects are the structural stability and flexibility of proteins. The various inter-actions responsible for the adsorption of proteins to solid surfaces are out-lined in Chapter 2 of this thesis.
When proteins are folded into their native structure, they are folded in well defined and highly ordered structures often with high atomic packing
8
densities [34-36]. This tight packing is stabilized by the formation of intra-molecular bonds, such as hydrophobic and electrostatic interactions. The formation of these bonds, intra-molecular hydrogen bonds in secondary structure elements and interactions between fixed and induced dipoles con-tributes to the restriction of rotational mobility along the polypeptide chain within the protein. This provides the protein molecules with low conforma-tional entropy, which is a favorable structural state for proteins. However, these compact and well-defined structures are not static. All protein struc-tures have a certain degree of fluctuation [37-41]. This behavior requires that some bonds are broken while others are formed, which is a constant process.
As hydrophobic and electrostatic interactions also are the main driving forces for adsorption [42-47], it is not surprising that the interaction between proteins and sorbent surfaces can result in structural changes within a protein molecule. At the same time, the structural flexibility of proteins allows the proteins to adapt their structure to optimize the interactions with the sorbent surfaces. Depending on the stability of the proteins and the affinity of the protein molecules for the sorbent surfaces, the magnitude of perturbation will affect the structure to different extents [38, 48].
These adsorption-induced structural changes make it not only difficult to understand the protein adsorption process but also have a great impact on many applications that rely on the functionality of proteins in the adsorbed state. If the perturbation is high, proteins may lose their activity through disruption of their active site within the protein molecule [38, 49-51]. In certain application areas, it is desirable to adsorb proteins onto surfaces without losing activity. For example, immunological tests can detect specific biomolecules called antigens. These tests can indicate if the specific antigen of interest is present in a blood or serum sample or not by visualizing the antibody/antigen interaction [52, 53]. For this visualization process to be successful, the interaction between the antibody and the antigen has to occur at a defined position meaning that the antibody has to be attached to a solid surface while retaining its biological active conformation. The same applies for surface bound enzymes that provide essential catalytic functions in bio-reactors.
A better understanding of the adsorption-induced structural changes of proteins is a key to understanding the overall adsorption process and the structures that proteins adopt in the adsorbed state. Therefore, the present thesis is focused on generating more insight in the structure and stability of proteins in the adsorbed state. As no single experimental or theoretical ap-proach has all the answers to the questions that concern this area of interest, it is important to combine conclusions drawn from experimental results that are obtained with various techniques. Each experimental method contributes with information on different aspects of the protein, such as structure, stabil-

9
ity, and orientation, in relation to the various interactions involved in the adsorption process. The various methods used in this thesis are described in Chapter 3.
The first part of this thesis concerns structural changes and structural sta-bility of proteins in solution and in the adsorbed state on hydrophilic silica particles as function of the electrostatic interactions involved. This first part focuses mainly on the structural stability of the proteins as investigated with Differential Scanning Calorimetry (DSC). DSC is described as a method in Chapter 3, as well as its instrumental characteristics in Chapter 5. The pro-teins investigated were lysozyme, -lactalbumin, and ribonuclease A. A relatively new method for the investigation of structural changes and stabil-ity of proteins is hydrogen/deuterium exchange (HDX) monitored with Mass Spectrometry (MS), which is described in Chapters 3 and 5. Myoglobin was used as a model protein within this part of the thesis. In order to increase the structural resolution, limited proteolysis was added to the investigation, which is described in Chapter 3. This work continues with the investigations of structural changes of lysozyme and bovine serum albumin in solution and adsorbed to silica. Both proteins were examined with DSC and lysozyme was additionally investigated with HDX while albumin was further exam-ined with limited proteolysis. Both HDX and limited proteolysis were moni-tored with MS. The combination of the methods used contributed to a more complete picture of the adsorption-induced structural stability of these pro-teins and the structural changes that occur within these proteins.
The final part of this thesis is centered on the practical approach in which proteins are affinity purified and identified. This so-called ligand fishing process was performed by combining Surface Plasmon Resonance (SPR) with MS, using bovine serum albumin as a model protein. The instrumenta-tion used in the SPR method is described in Chapter 5. Knowledge on pro-tein surface interactions were utilized in a practical approach to optimize the experimental procedure of ligand fishing as applied in the field of functional proteomics.

10
2. Protein adsorption
To be able to understand how and why proteins adsorb to different sur-faces, it is important to understand their structural properties and to delineate the interactions that lead to these structural properties. These are outlined below, followed by an overview of the various interactions involved in the adsorption of proteins to solid surfaces and the effect of these interactions on the final structure of proteins in the adsorbed state.
2.1 Protein structure Proteins are hetero-polymers built from some 20 different amino acids.
All of the amino acids occurring in proteins have in common a central car-bon atom (C), to which a hydrogen atom (-H), an amino group (-NH2), a carboxyl group (-COOH), and a side chain (-R) are attached, see Figure 1. The only exceptions are proline and 4-hydroxyproline, which have cyclic structures due to the covalent binding between the side chains and the nitro-gen of the amino group. They are all –amino acids, and there is asymmetry around the central carbon atom. The amino acids in proteins are L-stereoisomers. What distinguishes one amino acid from another is the side chain attached to the central carbon atom, giving each amino acid differing properties such as size, charge and polarity. Amino acids are joined together during protein synthesis by the formation of peptide bonds, which means that the carboxy group of one amino acid condenses with the amino group of the next and water is eliminated. Figure 1 illustrates the formation of a pep-tide bond (a) and a schematic description of a peptide (b). The equilibrium of this reaction lies on the side of hydrolysis rather than synthesis. Hence, the biosynthesis of peptide bonds requires an input of free energy, whereas their hydrolysis is thermodynamically favored. However, there exists a large acti-vation energy barrier between the linked and unlinked forms, thereby mak-ing the peptide chain reasonably resistant to hydrolysis.

11
a
C C
R1
H+H3N
O
OC C
R 2
H+H3N
O
OC C
R2
H O
OC C
R1
H+H3N
O
N
H+
Peptide bond
+ H2O
b
C
R 5
H
C
O
N
H
C
R 4
H
C
O
N
H
C
R 3
H
C
O
N
H
C
R 2
H
C C
R 1
H
N
O
N
HFigure 1. The formation of a peptide bond through condensation of the carboxy group of one amino acid with the amino group of another amino acid while water is eliminated (a) and a schematic representation of the chemical structure of a peptide (b), R1, R2, R3, R4, and R5 represent the side groups that are specific for the type of amino acid.
The complexity of protein molecules, with both acidic and basic compo-nents, and hydrophobic and hydrophilic regions, can make them very flexi-ble in their behavior. The three-dimensional structure that a protein molecule adopts is the result of various interactions, such as hydrophobic interaction, hydrogen bonding, electrostatic interactions, disulfide bonds, etc., inside the protein molecule as well as between the protein and its environment [54-61].
Four levels of structure are frequently used in discussion of protein archi-tecture. Primary structure is a complete description of the covalent connec-tions of a protein molecule. Secondary structure refers to the spatial ar-rangement of the close-lying amino acid residues within a polypeptide chain. Due to hydrogen bonding between the carbonyl oxygen of the amino acid and the amine hydrogen of the nearby amino acid on the protein backbone, specific spatial arrangements as –helices, –sheets, collagen helices and turns can occur. Tertiary structure is formed by the folding of secondary structural elements into one or more compact globular unit(s). These units are referred to as domains. Quaternary structure exists in those protein mole-cules that consist of more than one polypeptide chain and refers to the spatial arrangement of those domains relative to each other and their nature of con-tacts.
Due to the compact structure of globular proteins, the conformational en-tropy of the molecule is low. As mentioned earlier, this low entropy is coun-teracted by hydrophobic interactions and formation of hydrogen bonds and interactions between fixed and induced dipoles. Atomic packing densities for globular proteins, expressed in volume fractions, are normally between 0.7 and 0.8 [36]. The net result of this compact folding is that the stabilization

12
energy of a globular protein is generally in the order of a few to a few tenths kJ per molar quantity [62, 63]. This stabilization energy is very little when compared with the energy required to break different types of bonds, for example hydrogen bonds or covalent bonds. The energy required for break-ing a hydrogen bond between uncharged groups within a protein molecule is in the range 2-6 kJ/mol, while approximately 16 kJ/mol is required to break a hydrogen bond between charged groups. This could be compared to the energy required to break a hydrogen bond between two water molecules, which is almost 19 kJ/mol. Binding energies within covalent bonds are high compared to hydrogen bonds. The binding energy between two carbon atoms (C-C) is 347 kJ/mol, between carbon and hydrogen (C-H) 413 kJ/mol, and for the double bond between carbon and oxygen with CO2 attached to the oxygen (C=O(CO2)) 805 kJ/mol, respectively.
Figure 2. Schematic figures showing the three-dimensional structures of hen egg white lysozyme, 1DPX, from Protein Data Bank (PDB) [64]. The figure displays –helixes in the darkest colour, -sheets in medium grey, and loops in the lightest colour. The picture on the left shows the backbone structure in ribbon mode, while the picture on the right shows the same structure in the space fill mode.
For protein molecules surrounded with an aqueous environment, the most favorable conformational structure has the hydrophobic parts of the molecule buried within the interior of the molecule, leaving as much as possible of their hydrophilic parts facing the aqueous environment [38, 50]. Usually, many of the amide hydrogen atoms of different amino acids on the protein backbone are able to form hydrogen bonds with the oxygen within the car-

13
boxyl group of other amino acids, provided that no steric hindrance is pre-sent. In this way, polar groups on the protein backbone are buried within the protein molecule while at the same time retaining a favorable hydrogen bond interaction.
2.2 Adsorption induced changes in the protein structure In the last few decades, extensive research has lead to a number of general
trends that relate the various physical and chemical properties of the protein, the sorbent surface, and the surrounding solution of the system to adsorp-tion-induced changes in the protein structure. A number of these general trends are discussed in this chapter.
2.2.1 Hydrophobic and electrostatic interactions As mentioned earlier, it is the same type of interactions that causes pro-
teins to adsorb onto solid surfaces that cause proteins to fold into their con-formational structures. It should therefore not be surprising that strong inter-action between a protein molecule and a sorbent surface leads to higher probability that perturbation will occur within the protein structure [42, 44, 65].
When introducing a hydrophobic surface to the protein solution, hydro-phobic interactions are the driving force for adsorption, mainly due to dehy-dration of the sorbent surface [66, 67]. The hydrophobic interactions within the protein molecule are also an important force for keeping the polypeptide chains tightly folded, and exposing the hydrophobic parts within the protein to the hydrophobic surface can be favorable. One should consider that the reduction of intra-molecular hydrophobic interactions and hydrogen bonds may induce a decrease in the secondary and tertiary structure of the protein, allowing the hydrophilic components of the protein to orient towards the solution in a more flexible and thus entropically favorable conformation. Furthermore, a higher flexibility in the protein structure allows more attrac-tive contact points between the molecule and the surface [68].
Various studies have shown that more conformational perturbations occur within globular proteins when adsorbed onto hydrophobic surfaces than to hydrophilic surfaces [49, 50, 69] and that the extent of structural rearrange-ments within protein molecules depends on environmental conditions as well as the characteristics of the adsorbing protein [68, 70].
When adsorbing proteins to hydrophilic surfaces, electrostatic interactions play a dominating role. If the protein and the surface have electrically oppo-site signs, a strong attraction is present between them and adsorption will

14
take place with high affinity [71]. High affinity between the protein and the sorbent surface often leads to a large extent to structural changes within the protein molecule, and increasing electrostatic attraction leads to more exten-sive changes in the protein structure. This trend is for example observed for adsorption of positively charged proteins on negatively charged silica sur-faces [32, 49, 72].
Electrostatic interactions depend strongly on the pH and ionic strength of the surrounding solutions as the pH can affect the charge on both the pro-teins and sorbent surface while the ionic strength affects the distance over which electrostatic interactions are effective [73, 74]. For example, when the ionic strength of the solvent is increased, the electrostatic attraction between a negatively charged silica surface and a positive charged protein decreases and results in a decreased amount of adsorbed proteins per surface area. As the electrostatic attraction is reduced at higher ionic strength, the extent of structural alterations was reduced as well [45, 74]. Changes in the pH of a solution also influence the electrostatic interactions between a protein in solution and the sorbent surface, either to enhance adsorption or to diminish it [75].
In protein adsorption studies, it has also been found that co-adsorption of small ions prevents charge accumulation in the inner region of the low-dielectric layer, which, in turn, would lead to energetically unfavorable high electrostatic potentials [76, 77]. Bivalent cations are more efficient in pre-venting this accumulation of net charge than monovalent cations [76]. With respect to protein structure, it has been shown that addition of bivalent ions diminishes the conformational heterogeneity within adsorbed protein popula-tions compared to a similar concentration of monovalent cations [74].
Another important observation that relates the adsorption behavior of pro-teins to the electrostatic interactions involved is that the amount of adsorbed protein onto hydrophilic surfaces is highest at the iso-electric point (i.e.p.) of the protein. A study made with several globular proteins using adsorption isotherms and Circular Dichroism showed that an increase or decrease in pH away from the i.e.p. leads to decrease in the adsorbed amount when using ultrafine silica particles, along with more structural perturbations within the protein molecules. The more flexible proteins in that study, hemoglobin and bovine serum albumin, showed larger structural perturbations than the more rigid ones, cytochrome C and ribonuclease A. Additionally, the adsorbed amount of bovine serum albumin decreased with a factor of more than three when increasing the pH from 5 to 10, along with an indication of major loss of –helix structure [72]. Another similar study investigating human hemo-globin and horse myoglobin showed an increase in the amount of structural alterations within the protein molecules, both with decreasing pH and ad-sorbed amount [48]. An explanation of this phenomenon could be found in

15
the increasing net charge density on the protein at pH values that are shifted from the i.e.p. of the protein. This charge increase can lead both to less sta-ble conformations of the protein [69] resulting in a higher surface area cov-erage per protein and in a stronger electrostatic repulsion between adjacent adsorbed proteins [78].
It has also be seen, however, that the maximum in the adsorbed amount is actually located at pH values where the protein is marginally electrostatic attracted by the sorbent surface. This observation indicated that it is not only the net charge density on the proteins but also the total charge density in the inner layer of the protein surface complex that needs to be minimal for the proteins to adsorb in the highest packing density [79].
2.2.2 Protein stability If the protein and a hydrophilic surface have the same electrical polarity
and favorable hydrophobic interactions are absent, electrostatic repulsion will occur and for some proteins little or no adsorption will take place [74]. However, structurally less stable proteins do adsorb on hydrophilic surfaces under conditions of electrostatic repulsion and it has been demonstrated that the driving force is entropic and related to the loss in structure of the ad-sorbed proteins [80]. This observation, made in the late 1970s led to the in-troduction of the terms soft and hard proteins. Soft proteins are those pro-teins that adsorb under conditions where both hydrophobic and electrostatic interactions are not the driving forces for adsorption. Observations were made that these soft proteins had a relative low structural stability. Hard proteins are classified as proteins with high structural stability, which do not adsorb onto hydrophilic surfaces under conditions of electrostatic repulsion [1]. A study that utilized Circular Dichroism to study the adsorption of both soft proteins (myoglobin, hemoglobin, and bovine serum albumin) and hard proteins (ribonuclease A and peroxidase) onto ultrafine polystyrene particles showed that the structural perturbation of –helix content was higher in the soft proteins than in the hard ones [81].
2.2.3 Surface coverage It has also been shown that the amount of adsorbed protein on sorbent
surfaces affects the extent of structural changes within the protein molecules. A general trend has been outlined that structural perturbations are higher at low surface coverage, and soft proteins are more affected than hard ones [71]. For example, the remaining part of native –helix content of bovine serum albumin (considered a soft protein) adsorbed onto ultrafine polysty-rene particles increased with increased surface coverage [81]. The effect of the amount of lysozyme (considered a hard protein) adsorbed onto nano-
16
sized silica particles showed a slight increase in thermal enthalpy with in-creasing surface coverage using DSC [82]. The general trend that the extent of structural perturbations in protein structure is larger at lower surface cov-erage can be explained by the mechanism that proteins have more space to spread at lower surface coverage [83].
2.2.4 Summary From the discussion above, it can be concluded that protein adsorption is
a complex process with a variety of factors contributing to the protein struc-ture in the adsorbed state. A clear trend is that strong protein/sorbent interac-tions promote adsorption-induced changes in the protein structure and that the extent of structural changes is often higher for proteins that have a rela-tive low native structural stability.
However, several of the above mentioned factors influence each other, and this makes the process even more difficult to investigate and predict. For example, the protein stability itself depends strongly on solution conditions as pH and ionic strength. At the same time, the protein structure affects the electrostatic and hydrophobic interactions involved in the adsorption proc-ess, while the flexibility of the protein affects the number of contact points a protein can make with the sorbent surface. On top of that, structural rear-rangements of the protein affect the total entropy of the system, a process that alone can cause proteins to adsorb.

17
3. How to study proteins and their structures in the adsorbed state
A variety of methods are available today for studying different aspects of protein adsorption. For example, an optical methods like ellipsometry [84] or the quartz crystal microbalance [85] can be used to study the average density and thickness of an adsorbed protein film, thereby yielding information on rates of adsorption and adsorbed amounts. The same type of information can be obtained from spectroscopic techniques based on total reflection of light beams, such as Total Internal Reflection Fluorescence [86], Internal Reflec-tion Infrared Spectroscopy [69], and SPR [85], if the signal strength is cali-brated. Even Atomic Force Microscopy can be used to gain information on adsorbed amounts of proteins as well as to give an indication of the orienta-tion of the adsorbed macromolecules [87, 88].
To study structural properties of proteins in the adsorbed state various techniques are available. For example, the above-mentioned Total Internal Reflection Fluorescence spectroscopy can be used to generate information on the local surroundings and solvent accessibility of fluorescent groups in a protein, such as tryptophan residues or haem groups [45, 89]. To study sec-ondary structures, infrared spectroscopy and Circular Dichroism are com-monly used with infrared spectroscopy being more sensitive to measure changes in –sheet structures [69], while Circular Dichroism has a higher sensitivity for the –helix content [72, 90]. Calorimetry, in particular DSC, can be used for the investigation of the energy that is involved in the stabili-zation of the protein structure by comparing the measured specific heat as a function of temperature between a sample with and without protein, both in the adsorbed state and in solution [38, 91].
Most of the techniques applied to study protein structures in the adsorbed state generate average information on structural properties and do not reveal the location of the structural alterations within the protein structure. Only the structural properties of the active site of a protein can easily be studied by monitoring the biological functioning of a protein in the adsorbed state [38, 92].
A technique that actually does generate structural information on an atomic level is Nuclear Magnetic Resonance spectroscopy [93]. Unfortu-

18
nately, the use of Nuclear Magnetic Resonance Spectrometry within the investigation of protein conformation is limited to studies of relatively small proteins of which complete 1H, 13C, and 15N assignments of the native pro-tein structure are known and do not work when macroscopic surfaces are present in the sample. However, Nuclear Magnetic Resonance can success-fully be combined with HDX experiments to probe the solvent accessibility of exchangeable amide hydrogen atoms in the protein structure that are lo-cated on the protein backbone. HDX experiments can, for example, reveal which parts of the protein structure that are in contact with a sorbent surface and therefore are less accessible for the deuterated solvent in the adsorbed state [94]. HDX experiments can also reveal which parts of the protein struc-ture that are buried inside the molecule and stabilized by hydrogen bonding in secondary structure elements [95]. As the exchange between hydrogen and deuterium atoms involves a mass change as well as a change in nuclear spin, the HDX process can also be probed with MS [96, 97]. MS on intact proteins does not generate residue specific information but a higher struc-tural specificity can be obtained by applying an enzymatic digestion step prior to MS analysis [82]. The various techniques employed in the present thesis are discussed below.
3.1 Quantification of adsorbed amount As mentioned in Chapter 2, proteins adsorb to different surfaces due to
the various interactions involved. In order to be able to relate structural properties of proteins in the adsorbed state to these interactions, it is impor-tant to know how much protein adsorbs under various conditions and with how much affinity the adsorption takes place. Adsorption isotherms are one way to examine the adsorbed amount of protein on a certain area of surface, as well as investigate the affinity. Experimentally, different concentrations of protein are mixed with fixed amount of surface in solution. The mixtures are allowed to reach adsorption equilibrium, after which the protein concentra-tion left in solution is measured. The adsorbed amount is equal to the origi-nal protein concentration minus the concentration remaining in solution. The adsorption isotherm is created by plotting the adsorbed amount versus the residual protein concentration in solution, see Figure 3. From the plot, sev-eral conclusions can be extracted [49, 68]. The initial slope of the curve dis-plays information about the affinity of the protein for the surface, i.e., a steep slope implies high affinity for the surface. If a plateau is reached, informa-tion can be obtained on the spatial arrangement of protein molecules on the surface. For example, one can learn if the protein adsorbs as a monolayer or not. Early studies also utilized the adsorbed amounts at plateau levels to obtain indirect information about the protein structure and orientation in the adsorbed state by calculating how much surface area a protein covers assum-ing that proteins adsorb in a tightly packed monolayer [98, 99].

19
0
0,2
0,4
0,6
0,8
0 0,05 0,1 0,15 0,2 0,25
Protein concentration
(am
ount
pro
tein
/ su
rfac
e ar
ea)
Figure 3. Adsorption isotherms of a protein adsorbed to silica at various ionic strengths. In an adsorption isotherm, the adsorbed amount is plotted versus the pro-tein concentration remaining in solution.
In the studies presented in this thesis, other techniques were also em-ployed to quantify the amount of adsorbed proteins. The adsorbed amounts of proteins to various materials, as applied in a biosensor system, were quan-tified by fluorescence spectroscopy and utilizing fluorescently labeled pro-teins. The biosensor itself is an instrument that has a detection principle based on SPR. The SPR response was used to quantify proteins that were adsorbed, chemically attached, and captured on a sensor surface.
3.2 Protein stability
3.2.1 Thermodynamic analysis DSC provides information on the temperature dependence of the partial
heat capacity (Cp) over a broad temperature range, which is recorded and shown as a thermogram. An example of a thermogram is shown in Figure 4. During the temperature interval over which unfolding of a protein occurs, the partial heat capacity will increase drastically which is ascribed to the energy required for the unfolding to take place. At this point, the denatura-tion curve will separate from the baseline of the system, and if energy is required it means that the reaction is endothermic. After the denaturation
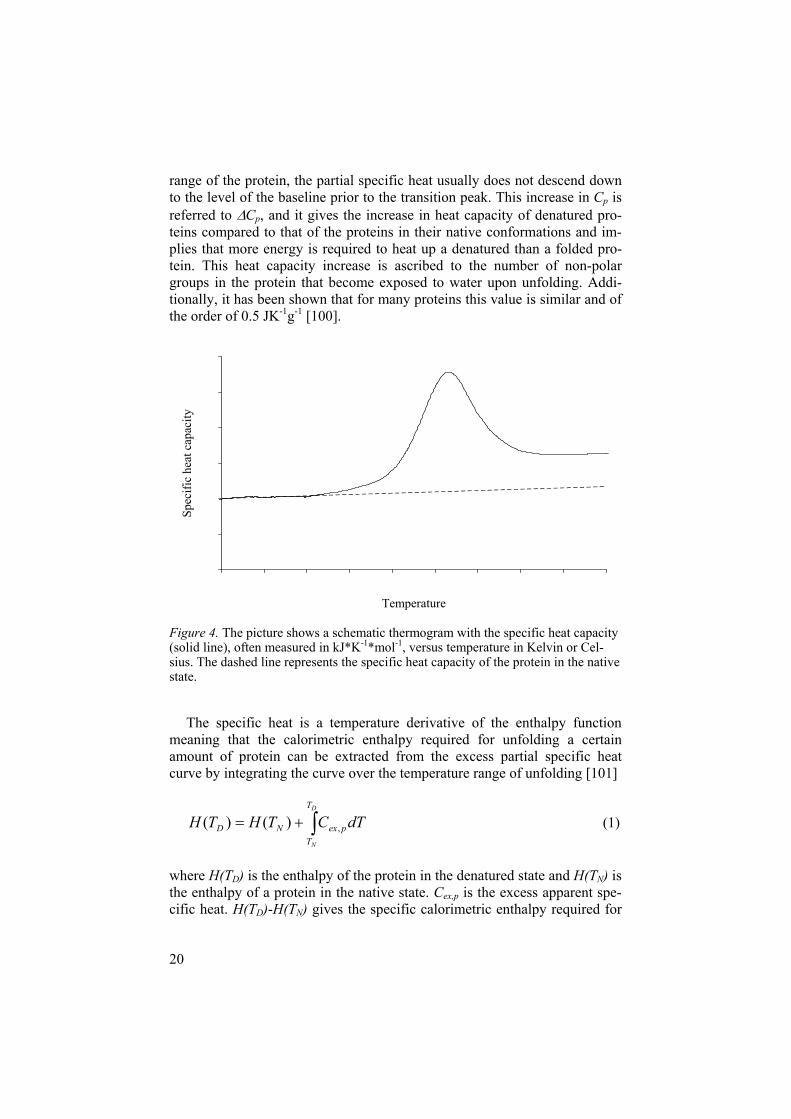
20
range of the protein, the partial specific heat usually does not descend down to the level of the baseline prior to the transition peak. This increase in Cp is referred to Cp, and it gives the increase in heat capacity of denatured pro-teins compared to that of the proteins in their native conformations and im-plies that more energy is required to heat up a denatured than a folded pro-tein. This heat capacity increase is ascribed to the number of non-polar groups in the protein that become exposed to water upon unfolding. Addi-tionally, it has been shown that for many proteins this value is similar and of the order of 0.5 JK-1g-1 [100].
0
20
40
60
80
100
120
310 315 320 325 330 335 340 345 350 355
Temperature
Spec
ific
heat
cap
acity
Figure 4. The picture shows a schematic thermogram with the specific heat capacity (solid line), often measured in kJ*K-1*mol-1, versus temperature in Kelvin or Cel-sius. The dashed line represents the specific heat capacity of the protein in the native state.
The specific heat is a temperature derivative of the enthalpy function meaning that the calorimetric enthalpy required for unfolding a certain amount of protein can be extracted from the excess partial specific heat curve by integrating the curve over the temperature range of unfolding [101]
D
N
T
TpexND dTCTHTH ,)()( (1)
where H(TD) is the enthalpy of the protein in the denatured state and H(TN) is the enthalpy of a protein in the native state. Cex,p is the excess apparent spe-cific heat. H(TD)-H(TN) gives the specific calorimetric enthalpy required for

21
the denaturation process and is further denoted as H. Experimentally, this value is extracted from the thermogram by the calculating the area under the denaturation peak with a baseline that is based on the specific heat capacity function of the protein under investigation. This specific heat capacity func-tion takes into account that the specific heat capacity of a protein increases from that of the native state to that of the denatured state depending on the population of proteins that are actually in the native state or denatured at a certain temperature.
Besides the excess enthalpy, H, required for the protein to unfold and the specific heat difference, Cp, other characteristics such as the tempera-ture at which the denaturation transition is half completed (Tm) and the full with at half maximum of the transition peak (FWHM) are extracted from the thermogram. By combining these data, an extensive thermodynamic descrip-tion of the systems investigated can be obtained.
Although DSC has primarily been applied to study the denaturation en-thalpy of proteins in solution, this method can also be used to study the dena-turation process of proteins in the adsorbed state. It has been shown that when using DSC for investigation of structural changes of protein molecules adsorbed onto sorbent surfaces, the amount of protein on the surface during the experimental process of temperature induced denaturation remains unal-tered [49, 92]. Another advantage of DSC is that it is suitable for using small colloidal particles that allow for a relative high protein concentration in the sample [43, 49, 102], thereby enhancing the reliability of the recorded data. Nevertheless, care should be taken when evaluating DSC data obtained from adsorbed proteins as in these systems. Proteins are often closely packed at surfaces which imply that protein/protein interactions can influence the de-naturation process.
A large H means that a large amount of thermal energy is required for unfolding, which in turn implies that the protein in the native state exhibits a large structural stability. Tm indicates the temperature at which the denatura-tion process is half completed. A high value of Tm often indicates that the proteins have a large structural stability. The width of the transition at half maximum of the transition peak gives an insight in the heterogeneity of the protein population during the denaturation process. A larger FWHM value implies that the denaturation process proceeds over a larger temperature range. This can be explained by a lower co-operativity in the unfolding proc-ess or by a larger structural heterogeneity in the structural population. A broadening has often been observed upon adsorption of proteins compared to that in solution [50, 74].
When a protein undergoes the transition from the folded to the unfolded state under the input of energy, the shape of the transition curve depends
22
upon the proteins structure. Such a transition can either be a two-state transi-tion or it can consist of several states. To evaluate the denaturation process, the enthalpy of denaturation required for unfolding a protein, as calculated according Eq. 1, can be compared with the van’t Hoff enthalpy, which ap-plies for a two-state transition process [103]. The van’t Hoff enthalpy can also be calculated from data extracted from a thermogram [103]. If these two values are equal, the experimentally investigated denaturation transition can be described as a two-state transition. Divergence of approximately 5% is usually allowed within the comparison of these models due to experimental and instrumental errors [104].
The thermodynamic properties of macromolecules can be described as a combination of the temperature dependencies of the enthalpy and entropy. By thermally unfolding proteins under ordered conditions, the energetics of the system can be extracted. The amount of energy required for thermal un-folding, native state to denatured state, of a certain amount of protein in a system is equal to the amount of enthalpy that stabilizes that amount of pro-tein in the native state. The entropy describes the disorder of that system [101]. The Gibbs free energy ( G(T)) of a system can be described as a function of enthalpy ( H(T)) and entropy ( S(T)),
)()()( TSTTHTG . (2)
3.2.2 Hydrogen deuterium exchange mass spectrometry One way to investigate the conformation and structural stability of a pro-
tein is to exchange hydrogen atoms in the protein with hydrogen atoms in the surrounding environment under controlled conditions [105]. The hydrogen atoms bound to N, O, and S are weakly bound and readily switch place with hydrogen atoms from the solvent molecules that surround the protein. Above pH 4, this exchange process is primarily catalyzed by hydroxide ions mean-ing that the exchange rate increases with a factor of ten for each increase in pH unit [106]. If an isotope of hydrogen is used in the solvent, for example by using deuterium oxide instead of water, deuterium will be incorporated in the protein. As the mass and nuclear spin of the protein changes during this process, it is possible to measure the degree of deuterium incorporation with MS and Nuclear Magnetic Resonance Spectroscopy. The exchange of hy-drogen atoms occurs at a specific rate, which is a function of the solvent accessibility and thus related to the proteins structure and stability [107]. A relatively strong reluctance towards exchange occurs when hydrogen atoms are involved in hydrogen bonding that occurs in secondary elements such as
–helices and –sheets. By measuring HDX rates, it is possible to draw
23
conclusions about the dynamics of the secondary structure elements in pro-tein structures.
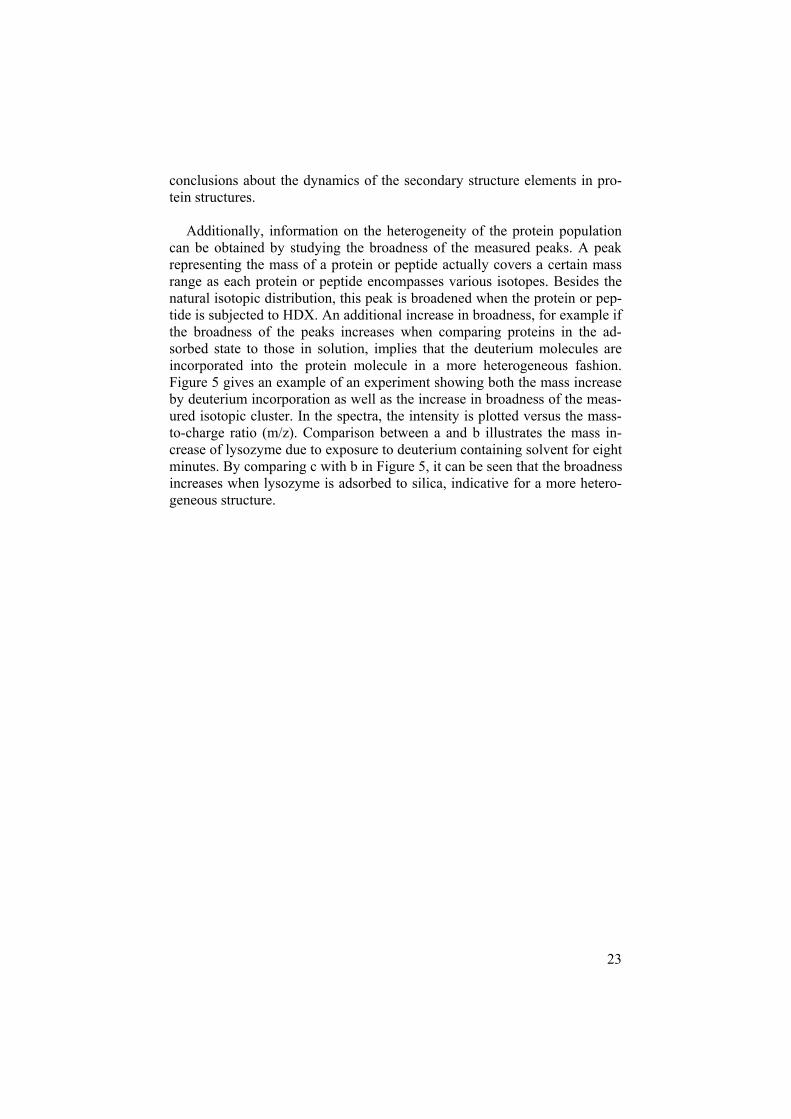
Additionally, information on the heterogeneity of the protein population can be obtained by studying the broadness of the measured peaks. A peak representing the mass of a protein or peptide actually covers a certain mass range as each protein or peptide encompasses various isotopes. Besides the natural isotopic distribution, this peak is broadened when the protein or pep-tide is subjected to HDX. An additional increase in broadness, for example if the broadness of the peaks increases when comparing proteins in the ad-sorbed state to those in solution, implies that the deuterium molecules are incorporated into the protein molecule in a more heterogeneous fashion. Figure 5 gives an example of an experiment showing both the mass increase by deuterium incorporation as well as the increase in broadness of the meas-ured isotopic cluster. In the spectra, the intensity is plotted versus the mass-to-charge ratio (m/z). Comparison between a and b illustrates the mass in-crease of lysozyme due to exposure to deuterium containing solvent for eight minutes. By comparing c with b in Figure 5, it can be seen that the broadness increases when lysozyme is adsorbed to silica, indicative for a more hetero-geneous structure.
24
a
1788 1790 1792 1794 1796 1798 1800
m/z
Inte
nsity
b
1788 1790 1792 1794 1796 1798 1800
m/z
Inte
nsity
c
1788 1790 1792 1794 1796 1798 1800
m/z
Inte
nsity
Figure 5. Isotopic clusters in the mass spectra of lysozyme (+8 charge state) in solu-tion (a), exposed to a deuterated solution for 8 minutes (b), and adsorbed to silica particles and exposed to deuterated solution for 8 minutes (c) [82].
In the present study, the mass increase versus exposure time to deuterium containing solvent has been investigated leading to insight in the structure and conformational dynamics of proteins in solution and in the adsorbed state. In these experiments, proteins were dissolved in deuterium-containing solutions and, at certain exchange times, an aliquot was taken and prepared for mass spectrometric analysis. The mass increase as a function of the expo-

25
sure time to deuterated solvent can be used to calculate the stability of the secondary structure elements of the proteins. To avoid further HDX during the sample preparation, the pH and the temperature of the sample was low-ered which effectively quenched the HDX process [108].
There are basically three different categories of hydrogen atoms in pro-teins [109]. The first category is hydrogen atoms covalently bonded to car-bon, which essentially do not exchange. The second category is hydrogen atoms in the side chains bound to N, O, or S that exchange very fast and adapt to the hydrogen/deuterium ratio in solution before mass spectrometric analysis can be performed. The third category of hydrogen atoms are those attached to the amide positions in the protein backbone, and it is these hy-drogen atoms that are monitored with HDX if their exchange rate is slower than a few tenths of a second. These lower exchange rates are obtained for the hydrogen atoms that are stabilized by hydrogen bonding as occurs in secondary structure elements. If the amide hydrogen atoms are not involved in secondary structure elements, the so-called unprotected amide hydrogen atoms, they are difficult to detect by HDX due to the high exchange rate at neutral pH values. These unprotected amide hydrogen atoms, as well as the hydrogen atoms in the side chains bound to N, O, or S, respectively, ex-change within seconds at pH 7 and at room temperature. Bai et al have suc-cessfully investigated the exchange rates of the non-protected labile hydro-gen atoms in amino acids and small peptides by monitoring hydro-gen/hydrogen exchange with Nuclear Magnetic Resonance Spectroscopy [108]. This investigation includes the effect of pH and temperature on the exchange process.
Each amino acid, except proline, contains one amide hydrogen atom, which means that amide hydrogen exchange rates can be investigated more or less along the entire protein backbone. The amide hydrogen atoms are also involved in formation of hydrogen bonds in secondary structure ele-ments and therefore their exchange rates are a reflection of structure and structural stability within a protein [105].
For amine hydrogen atoms that are located in secondary structure ele-ments, exchange takes only place when hydrogen bonds are broken. This means that the protein has to unfold locally or globally for exchange to take place. The fluctuation then occurring within the protein molecule is given by
uk
k
p NHNHop
op
1 (3)
where Hp corresponds to the protected amide hydrogen atoms, Hu to the unprotected amide hydrogen atoms, and N to the nitrogen atom in the protein
26
backbone. kop is the rate of opening the protein structure, while kop-1 corre-sponds to the rate of closing of the protein structure. The equilibrium con-stant of this process is given by Kop, which equals kop/kop-1. The second proc-ess, i.e., the exchange from an amide hydrogen atom to a deuterium atom is given by
uk
u NDNH int (4)
where kint corresponds to the rate for replacing amide hydrogen with deu-terium in the opened protein structure which can be calculated if the protein sequence is known [108].
In order for a hydrogen atom to be exchanged by a deuterium atom, both steps described in Eq. 3 and Eq. 4 must be executed. If kop-1 is significantly slower than kint, the process is limited by the opening of the protein mole-cule. This scenario is referred to as the EX1 mechanism, or correlated ex-change. If kop-1 is significantly larger than kint, the process is limited by the exchange from hydrogen atom to deuterium atom. This process is often seen for proteins at physiological conditions and is referred to as the EX2 mecha-nism, or uncorrelated exchange [105, 109, 110]. With this assumption and by combining Eq. 3 and Eq. 4, the exchange rate for protected amide hydrogen atoms (kex) can be expressed as
intkKk opex (5)
It is possible to extract the local Gibbs free energy difference ( Gop) of the protein structure for this process due to the relation between Kop and
Gop by
opop KRTG ln (6)
In order to calculate the mass increase of a protein as a function of the ex-change time, the relationship between the exchange rate kex and the mass increase of the protein can be obtained by integrating the HDX process over time, i.e. the mass increase per time unit equals the exchange rate multiplied by the number of masses involved. By expressing this process as a summa-tion over all the exchangeable amide hydrogen atoms, the following expres-sion can be obtained [105]
)exp(1)( , tkmtM iexi i (7)
M(t) is the mass increase of the protein at a certain time, t, due to re-placement of the amide hydrogen atoms with deuterium, mi represents the

27
number of hydrogen atoms with corresponding exchange rate kex,i, and is the fraction of deuterium atoms in the solution relative to the total number of exchangeable hydrogen atoms in the solution. However, experimental meas-urements have shown that data quality is not sufficient in order to extract the exchange rates from all labile hydrogen atoms individually. Therefore, the labile hydrogen atoms are divided in several classes of exchangeable hydro-gen atoms and the average exchange rates of these classes of hydrogen at-oms are calculated. This classification can be done by extending Eq. 7 to
)]exp(1[)( 21 tkmmtM ex . (8)
The term m1 correlates to the labile, fast exchangeable hydrogen atoms that are not involved in secondary structure elements. At pH 7, the intrinsic exchange rate for the amide hydrogen atoms when they are not protected against exchange by any secondary or tertiary structure is in the order of 600 min-1 [108]. This high exchange rate implies that these hydrogen atoms are exchanged before the mass measurement is performed on the shortest ex-change time in the present experiments, which amounts to 15 seconds. The second term is correlated to the contribution of the mass increase from the protected hydrogen atoms involved in secondary elements in the protein exchanging at the rate kex. It should be noted that kex represents the mean value of the summation of the exchangeable hydrogen atoms within its cate-gory. This equation describes the mass increase as a result of HDX taking place within a protein that undergoes a cooperative, global unfolding of the local structure that protects amide hydrogen atoms from exchange.
In the event of diversion from the above described cooperative, global un-folding of the local structure, a correction of Eq. 8 is required, as in the case of HDX process within a protein containing two domains that unfold at dif-ferent rates. Each domain is treated as a unit that is assumed to unfold in a cooperative global process within the local structure. Eq. 8 can then be re-written as follows:
)]exp(1[)]exp(1[)( 3,32,21 tkmtkmmtM exex (9)
The first term still correlates to the mass increase due to the rapid ex-change of the unprotected hydrogen atoms in the side chains, as well as the unprotected hydrogen atoms in the secondary structure. The second term now represents the mass increase due to the exchange of the protected hy-drogen atoms in one domain with a cooperative global unfolding process where the exchange rate (kex,2) is represented as a mean value of the summa-tion of the exchange rates within that domain. The third term represents the same as the second term, but for the other domain within the protein.

28
By measuring the time-dependent mass increase, it is possible to extract the exchange rates kex,2 and kex,3 (Eq. 9). Having those values and the calcu-lated value for kex,i [108], a value for the Gibbs free energy ( Gop) (Eq. 6) can be obtained. By comparing the Gop values for adsorbed proteins and those obtained from proteins in solution, the adsorption-induced destabiliza-tion of a protein can be estimated.
The deuterium incorporation in a protein lysozyme as function of the time the protein was exposed to a deuterium-containing solvent is illustrated in Figures 6 and 7. The same experimental results are fitted to both a global and a two-domain folding/unfolding process, demonstrating that for lysozyme the experimental results are best described if a two-domain folding/unfolding process is assumed.
40
50
60
70
80
90
100
110
0,1 1 10 100 1000 10000
Time [min]
Mas
s [D
a]
Figure 6. The results of HDX experiments with lysozyme in 10 mM hepes buffer, pH 7.0, both in solution ( ) and adsorbed onto nano sized silica particles ( ) [82]. The solid lines represent the results of fitting a one-domain folding model for ly-sozyme (Eq. 8) to the experimental data.

29
40
50
60
70
80
90
100
110
0,1 1 10 100 1000 10000
Time [min]
Mas
s [D
a]
Figure 7. The results of HDX experiments with lysozyme in 10 mM hepes buffer, pH 7.0, both in solution ( ) and adsorbed onto nano sized silica particles ( ) [82]. The solid lines represent the results of fitting a two-domain folding model for ly-sozyme (Eq. 9) to the experimental data.
3.2.3 Limited proteolysis The HDX process for intact macromolecules can be analyzed with MS,
leading to a spectrum showing the mass of a protein. However, this informa-tion does not reveal at which positions within the protein molecule the deute-rium incorporation takes place. Higher structural specificity can be obtained if the proteins are fragmented after the HDX step. This could be done with, for example, enzymatic digestion [110, 111]. Digestion with an enzyme can be carried out, and the collected spectrum will show fragments of the pro-tein. This will give insight in the structural stability of the various segments of the protein. This procedure can also be performed when the protein is adsorbed onto a surface.
Enzymatic digestion of a protein can also yield direct information on the orientation and structure of a protein in the adsorbed state, as well as the structure of a protein in solution, as the accessibility of enzymatic cleavage sites can be studied when performing limited proteolysis. MS can be used to locate the cleavage sites as the masses of the peptides that are obtained from enzymatically cleaving the intact proteins can be used to identify the position of the peptides in the original protein.

30
4. Discussion of the papers
The main goal of this thesis has been to create a better understanding of what happens to proteins in the interfacial layer when adsorbed onto a sur-face. Five different model proteins have been investigated when adsorbed to silica particles in order to pinpoint trends in the adsorption-induced struc-tural changes of these proteins. The proteins chosen and their characteristics are described later in this chapter. Silica has been chosen as the model sur-face in this work, and silica possesses a negatively charged hydrophilic sur-face. By combining methods, such as DSC, HDX, MS (both Matrix-Assisted Laser Desorption and Ionization Time-of-Flight (MALDI-TOF) and Elec-trospray Ionization Fourier Transform Ion Cyclotron Resonance (ESI FT-ICR)), and limited proteolysis a more all encompassing view of structural stability and conformational changes within these proteins upon adsorption has been obtained. Additionally, the affinity and adsorbed amount of pro-teins to silica have been investigated with adsorption isotherms, SPR, and fluorescence. The techniques and instruments used within this thesis are described in Chapters 3 and 5.
Some of the techniques utilized have been newly developed in order to generate new types of information on proteins in the adsorbed state. DSC contributed with thermodynamic information on the stability of a chosen protein in a certain environment, both in solution and adsorbed onto silica. HDX and limited proteolysis in combination with MS have contributed with both information of structural stability of secondary structure elements of proteins and with identification of solution accessible parts of the proteins in the adsorbed state. Additionally, the latter also gave insight in the orientation of the proteins adsorbed to silica.
The knowledge on protein adsorption has also been applied in a practical example and led to the optimization of the so-called ligand fishing procedure as applied in the field of functional proteomics. This ligand fishing proce-dure utilizes an SPR based optical biosensor to monitor the affinity purifica-tion of de novo interaction partners that bind to biomolecules that are immo-bilized on a sensor chip. After a ligand is fished from a protein-containing solution and captured on the sensor chip, the ligand is eluted and identified with MS. The micro-fluidic channels within this kind of device have a large surface-to-volume ratio that can create difficulties with respect to non-specific adsorption of proteins. It is therefore important to have control over
31
carry-over effects from the initial protein solution to the eluted solution. Furthermore, it is important to minimize ligand losses as adsorption onto the walls of the fluidic system will cause a lower yield of the ligand protein in the eluted sample. In order to avoid sample losses of the ligand, colloidal silica particles were introduced into the eluting solution. The principle being that the silica particles carry the ligands from the sensor chip surface, and transport them out of the system. Another potential benefit is that silica par-ticles not only function as a transport agent but also as a concentrating agent. As both ligand proteins and enzymes adsorb onto the surface the protein concentration is increased locally. This procedure will thus facilitate the enzymatic digestion of the protein, which is a prerequisite for identification by MS.
4.1 Proteins Some characteristics of the proteins used in this study are described be-
low. Lysozyme, ribonuclease A, -lactalbumin, and myoglobin are small globular proteins. Lysozyme and ribonuclease A are considered hard pro-teins, while -lactalbumin and myoglobin are considered soft proteins. Bo-vine serum albumin is a larger protein, which is also considered to be of soft character.
Lysozyme from chicken egg white is a small globular protein containing one single polypeptide chain folded into two structural domains with the active site situated between them. One of the domains consists mainly of –helixes and the other mainly of –sheets. Lysozyme also contains two disul-fide bonds. [61]. The molar mass of lysozyme is 14300 g mol-1 and the i.e.p. is 11.1 pH units [67].
Ribonuclease A from bovine pancreas is a small globular protein with one single chain mainly folded into two -sheets [112]. The molecule is stabi-lized with four disulfide bonds, has a molar mass of 13700 g mol-1 and an i.e.p at 9.4 pH units [72].
-Lactalbumin from bovine milk is a small, globular protein that is stabi-lized by four disulfide bonds and contains two structural domains. One of the domains is rich in –helices and the other is rich in –sheet elements and also includes a calcium binding site.[113] The molar mass of -lactalbumin from bovine milk is 14200 g mol-1 and the i.e.p. is 4.3 pH units [32]. -Lactalbumin is known to form a well populated molten globule state, and the
–domain is more structured in this state than the –domain [114].

32
Myoglobin from sheep skeletal muscle is an oxygen transport and storage protein in the muscle. Structurally, it contains one single polypeptide chain that is tightly folded into mainly –helixes, with a heme group non-covalently bound in a hydrophobic pocket. More than 70% of the main chain is folded into -helices, and much of the rest of the chain forms turns be-tween the helices [115]. The molar mass of myoglobin is 17800 g mol-1 and the i.e.p is 7.0 pH units [68].
Bovine serum albumin is a protein folded into three domains, and each domain consists of two sub-domains cross-linked with 17 disulfide bridges [116, 117]. The three-dimensional structure for human serum albumin has been determined crystallograpically. From a structural point of view, human serum albumin and bovine serum albumin are similar with over 70% homol-ogy in amino acid sequence [116, 118, 119]. Bovine serum albumin is con-sidered a soft protein with a molar mass of 67000 g mol-1 and the i.e.p. is 4.7 pH units [71].
4.2 Paper I This paper (Paper I) involves a study of three proteins, free in solution
and adsorbed onto nano-sized silica particles. Buffer solutions with three different ionic strengths at pH 7 were used, in order to examine the influence of ionic strength on the protein molecules. Lysozyme and ribonuclease A are known to be hard proteins, while –lactalbumin is known to be of soft char-acter. See Chapter 2 for discussion of the characterization of hard and soft proteins. Under the conditions of investigation, lysozyme and ribonuclease A are positively charged, while –lactalbumin is negatively charged. Adsorp-tion characteristics such as the affinity and the plateau values for the ad-sorbed amount at higher protein concentrations under the different condi-tions were investigated with adsorption isotherms. This procedure is de-scribed in Chapter 3. Adsorption-induced changes in the structural stability of these proteins were investigated with DSC, which is described in Chapters 3 and 5.
The study revealed that electrostatic interactions play an important role when dealing with adsorption of proteins to hydrophilic surfaces. The struc-ture of protein molecules adsorbed onto hydrophilic surfaces is difficult to predict as some studies demonstrated that no major structural perturbations occur in the protein molecule due to adsorption [89, 120, 121], while other studies pointed out differences [49, 50]. However, a general trend has been outlined that fewer structural perturbations occur with higher surface cover-age of proteins on the surface [50, 71, 89]. Additionally, it has been shown that structural perturbations within hard proteins upon adsorption are more

33
or less negligible [71, 72] compared to those occurring in soft proteins [32]. Our results do not support that trend concerning the results for the soft pro-tein –lactalbumin, where overall structural stabilization rather then destabi-lization occurred upon adsorption onto silica at higher ionic strength.
Results from the adsorption isotherms in the study showed that both ly-sozyme and ribonuclease A have high affinity for the silica surface at low ionic strength, and that the affinity decreases with increasing ionic strength. At the pH used in this study, both proteins are positively charged and the decrease in affinity due to changes in the ionic strength indicates that elec-trostatic interactions play an important role for adsorption to take place. The addition of calcium ions did not increase the ionic strength significantly, but had a profound influence on the adsorption characteristics as both the affin-ity and adsorbed amounts of lysozyme and ribonuclease A decreased. –Lactalbumin is negatively charged at the pH investigated and basically no adsorption takes place, also indicating that the main driving force for adsorp-tion is electrostatic interaction.
From the DSC results the following parameters could be evaluated: calo-rimetric enthalpy of denaturation ( H), temperature at which the denatura-tion transition is half completed (Tm), and the full with at half maximum of the transition peak (FWHM). Investigations of proteins in solution produced the following results. Increase of the ionic strength from 10 mM hepes, pH 7.0 to 100 mM hepes, pH 7.0 resulted in a reduction in H and FWHM, while Tm increased slightly. A further slight increase of the ionic strength by addition of 10 mM calcium ions to the 100 mM hepes buffer, pH 7.0 did not affect the H -value, but resulted in a slight increase in Tm, while FWHM decreased slightly. These data indicate that increasing ionic strength de-creases the structural stability in these proteins, and that the perturbations level out at higher ionic strength. Additionally, the decrease in FWHM at higher ionic strengths indicates that a stronger cooperativity is present in the denaturation process [104]. Investigations of –lactalbumin at low ionic strength did not result in a measurable denaturation enthalpy, while increase in the ionic strength resulted in a thermal transition curve at low tempera-tures. This thermal transition peak was shifted approximately 30 degrees higher with the addition of calcium ions to the solution. This shift in denatu-ration temperature has been seen in other studies [122], and it was accompa-nied with a large increase in H. This large increase in H has also been observed for –lactalbumin using other buffer salts [55].
The surface coverage used in this study was less than one protein mole-cule per silica particle in order to minimize protein-protein interactions. It has been reported that low surface coverage leads to larger structural pertur-bations [50, 71, 89]. This implies that at low surface concentrations differ-

34
ences in structural properties of adsorbed proteins are more distinct. Adsorp-tion-induced effects within the three proteins differed as function of the pa-rameters investigated. At low ionic strength, lysozyme and ribonuclease A showed a decrease in H upon adsorption, accompanied with a decrease in Tm and an increase in FWHM, indicating structural perturbations, less struc-tural stability, and more heterogeneity within the protein populations, com-pared to the respective proteins in solution. These effects are less striking at high ionic strength, where the affinity for the silica surface is lower than at low ionic strength.
Addition of calcium ions had a minor effect on the H -values for ly-sozyme and ribonuclease A in solution and adsorbed to silica. However, upon calcium addition the FWHM for lysozyme and ribonuclease A in the adsorbed state reduced to values that are close to those obtained for the pro-teins in solution. This decrease in FWHM upon addition of calcium indicates a larger conformational homogeneity within the protein populations in the adsorbed state. Protein adsorption studies have shown that addition of small ions can prevent charge accumulation within the inner region of the low-dielectric bilayer leading to lower and more energetically favorable electro-static potentials [76, 77]. Additionally, it has been shown that bivalent cations are more efficient in the screening of electrostatic potentials [76]. Apparently, the reduction in electrostatic potentials also results in a more homogeneous structural population of the proteins in the adsorbed state.
4.3 Paper II Investigation of the structural stability of protein molecules can be per-
formed with various instruments and techniques, as mentioned in Chapter 3. In the previous paper (Paper I), adsorption isotherms were combined with DSC, yielding information about the affinity of proteins for a silica surface, as well as the structural stability of the protein molecule and heterogeneity within the protein population. In this paper (Paper II), adsorption isotherms, HDX, limited proteolysis, and ESI FTICR-MS were combined to obtain information about structural changes due to the adsorption process of a pro-tein molecule. Adsorption isotherms, HDX, and limited proteolysis are de-scribed in Chapter 3. Adsorption isotherms were used for determining the surface coverage used in the experiments within this paper (Paper II), which were subsequently chosen at a coverage where all myoglobin molecules were adsorbed on the silica particles. FR-ICR MS is a powerful and very informative tool with high resolution [97, 123] and a description of the tech-nique can be found in Chapter 5.
The combination of HDX and FT-ICR MS is a relative new approach in the analysis of protein structures and stabilities. In this study (Paper II), my-

35
oglobin has been used as a model protein to illustrate the power of the method. FT-ICR MS can be used to identify a protein molecule or fragments of a protein molecule based on their exact masses. In combination with HDX, it yields an accurate determination of the deuterium incorporation rate that can be used to extract information on the average structural stability of the protein molecule or fragments as well as insight in the structural hetero-geneity in the protein or fragment population. Investigation of the secondary structure is possible due to the involvement of the amide hydrogen atoms in
–helices and –sheets, which mean that they are protected against ex-change in the secondary structure, see Chapter 3 for details. HDX measured over time gives information about the opening and closing equilibrium in the protein structure, and hence information on the structural stability of it.
In order to achieve a higher specificity of the structural changes within the protein structure, limited proteolysis was performed after HDX, but prior to the mass analyzing step [110, 111]. In this study, limited proteolysis was performed by fragmentation of the myoglobin molecules with enzymatic digestion. Myoglobin was digested with Pepsin A from porcine stomach mucosa yielding four peptic fragments covering over 90% of the complete myoglobin structural sequence. These fragments were investigated after various times of HDX with FT-ICR MS and the mass increases over time were recorded. The mass analysis yielded an isotopic cluster of peaks repre-senting the various isotopic states of fragments investigated. These peaks were analyzed in order to determine the center of mass and broadness by fitting the peaks to a Gaussian distribution [124]. The peaks were identified by comparing their monoisotopic masses to those of a database (Prospector, msdigest) containing known sequences of fragmented proteins.
The mass increase of the myoglobin fragments were investigated with HDX over time and for myoglobin adsorbed to silica particles and in solu-tion. By fitting the measured data to Eq. 8 given in Chapter 3, the average exchange rates for the different fragments and hence the Gibbs free energy of opening the protein structure in these fragments were calculated. The cal-culations supported a cooperative, global unfolding of the structure of inves-tigation at their specific exchange rates. If sub-global and/or local unfolding is taking place in the protein or fragment, their exchange rates will deviate from the calculation model. An indication of this behavior is shown for two of the four fragments investigated.
The investigation of myoglobin with HDX in solution revealed large variations in the structural stability for the four fragments. Additionally, the four myoglobin fragments were affected in different ways by adsorption. The most stable part of the native structure, which encompasses the C-terminal end, showed a great degree of destabilization upon adsorption and also an increase in heterogeneity. The fragment involving the N-terminal

36
showed two distinct populations upon adsorption with different structural stability. One of the populations showed a similar structural stability as that in solution, while the other population showed a large destabilization. The two remaining fragments encompass the structure around the heme and they were more or less unaltered in their structural stability upon adsorption. Overall, deuterium was incorporated in the protein structure in a more unor-dered fashion for myoglobin in the adsorbed state compared to that in solu-tion indicating that an increase in heterogeneity was experienced in the fragments due to adsorption. Nevertheless, the results concerning mass in-crease due to incorporation of deuterium into the myoglobin structure indi-cated that the amount of protected amide hydrogen atoms were approxi-mately the same for the myoglobin molecule, as a whole, in solution com-pared to those bound to silica. This indicates that the adsorption process does not affect the total amount of secondary structure. On page 446 in this paper (Paper II) it is written “The overall mass increase in the measured time range was somewhat higher for myoglobin in solution than for myoglobin ad-sorbed onto silica, indicating that upon adsorption fewer amide hydrogen atoms are protected against exchange in the myoglobin structure.” A correc-tion should be made as the results refer to the fragment containing residues 30-69 and not the whole myoglobin molecule.
It has generally been observed that less stable proteins show a larger ten-dency to undergo structural changes upon adsorption to silica surfaces [71, 125]. Our results, however, show that the fragment that destabilized strong-est upon adsorption is considered to be the more stable part of the myoglobin molecule. Other studies have shown that many proteins lose part of their secondary structure upon adsorption to silica [50, 71] or that the proteins become destabilized due to the adsorption process [74, 91]. However, lower structural stability in the adsorbed state compared to that in solution does not automatically mean that secondary structure is lost [91]. It has been reported in studies using similar surface coverage that less than 5% of the amount of secondary and tertiary structure was lost upon adsorption to silica particles compared to the amount measured in the native state [48]. The investigation within this study (Paper II) indicated that adsorption of myoglobin onto sil-ica particles mainly affected the structural stability and heterogeneity of the myoglobin molecule, not the quantity of the secondary structure.
4.4 Paper III In order to achieve a full thermodynamic analysis of protein adsorption
onto silica surfaces, the combination of DSC, HDX, and FT-ICR MS was used within this study (Paper III). This combination yields both the thermo-dynamic enthalpy of unfolding as well as the Gibbs free energy of unfolding, which gives insight into the thermodynamic parameters describing the global
37
domain structure of protein molecules in the adsorbed state, as well as the effect on heterogeneity within the protein population upon adsorption. De-scription of the DSC instrument used can be found in Chapter 5. Thermody-namic analysis has been described in Chapter 3, as well as in Paper I. The parameters examined were H, Tm, and FWHM. HDX in combination with FT-ICR MS has been described in Chapter 3, as well as in Paper II, and in-strumental description of FT-ICR MS can be found in Chapter 5.
Lysozyme from chicken egg white free in solution and adsorbed onto nano-sized silica particles was used for this investigation. Buffer used in the experiments was 10 mM hepes, pH 7.0. For the DSC experiments, three different amounts of surface coverage were used, namely 2, 4, and 6 ly-sozyme molecules per silica particle, respectively. This procedure gave an insight into the effect surface coverage has in the thermodynamic enthalpy of unfolding, and hence the structural stability of the lysozyme molecules. For HDX FT-ICR MS measurements surface coverage of 6 lysozyme molecules adsorbed onto silica particles were compared to lysozyme in solution, in order to investigate the incorporation of deuterium in lysozyme in the ad-sorbed state compared to that in solution.
DSC showed a decrease in H upon adsorption to silica particles com-pared to that in solution, which also was shown in Paper I, where lysozyme was used as an example of a hard protein. In this study (Paper III), a de-crease in H was experienced as the surface coverage was decreased. A decrease in H indicates that the protein structure is destabilized, and vari-ous studies have shown the trend of higher losses in the protein structure as the surface coverage is decreased [48, 50, 72]. Comparison of the data for lysozyme in the adsorbed state in this paper (Paper III) to that in Paper I for lysozyme (in 10 mM hepes, pH 7.0, in solution and adsorbed to silica parti-cles) showed that the decrease in H continued even at lower surface cover-age, as the amount of lysozyme molecules adsorbed to silica particles was less than 1 in the experiments in Paper I. Additionally, the heterogeneity within the protein population increased with decreasing surface coverage throughout the various levels of surface coverage investigated, indicating that the fraction of native-like structure in lysozyme decreases with decreas-ing surface coverage.
In the present study (Paper III) HDX was used in combination with FT-ICR MS to investigate the mass increase over time for lysozyme in solution and adsorbed onto silica particles, but in contrast to the investigation in Pa-per II, no limited proteolysis was used prior to the FT-ICR MS analysis. From the results, the Gibbs free energy of unfolding could be calculated, as described in Chapter 3, Paper II and this Paper (Paper III). The outcome of the calculations showed that G for lysozyme in the adsorbed state com-
38
pared to that in solution did not differ significantly, indicating that the over-all structural stability was only marginally affected. Additionally, the results pointed out that deuterium are incorporated in a more heterogeneous way in lysozyme molecules adsorbed to silica. After 8 minutes of HDX, the FWHM increased by a factor of 1.4 when comparing lysozyme adsorbed to silica particles with lysozyme in solution. This observation is indicative of an in-crease in the heterogeneity of the lysozyme structure upon adsorption to silica as HDX in a stable fraction progresses more slowly than in a less sta-ble one [124].
As mentioned above, DSC indicates changes in H, and HDX FT-ICR MS indicates changes in G. By combining these methods, it should be pos-sible to extract values of the entropy of the system using the eq. G= H-T S. [80]. However, one should be careful when calculating with values extracted from two different methods as the measurements are carried out under different conditions. Additionally, even though DSC is able to give values of S as G =0 when the unfolding transition is half completed (at Tm
for a Gaussian distributed curve) [101], H and S are relatively large com-pared to G, which means that small errors in H and/or S have very large impact on G. Nevertheless, it is possible to establish global trends of what is happening with lysozyme upon adsorption from a thermodynamic point of view. A decrease in the thermodynamic enthalpy upon adsorption in combi-nation with more or less unaltered value for Gibbs free energy of unfolding indicates that the entropy of the system is changed. The increase in entropy should then be of the same magnitude as the decrease in enthalpy for the system. Furthermore, HDX is sensitive to changes in the secondary structure and the results obtained from this method demonstrated that more or less no change in the Gibbs free energy of unfolding occurred while DSC data showed that changes in the thermodynamic enthalpy of unfolding occurred. It may thus be concluded that the changes seen for lysozyme in the adsorbed state are due to changes in the tertiary structure.
It has been shown that it is possible to distinguish between protein popu-lations that differ in their structural stability by mass determination of the HDX process in protein populations, due to the difference in the HDX prop-erties [110, 124, 126]. Our results clearly displayed that two structural popu-lations exist in lysozyme and that these two populations unfold at distinct exchange rates. Therefore, further development of the calculation model used in Paper II was required as described in Chapter 3 and in this paper (Paper III). This model involves going from a cooperative global unfolding model representing one domain to a model representing two domains that have a cooperative global unfolding procedure with different exchange rates. This means that there are three populations of amide hydrogen atoms with different exchange rates in the calculations. The first populations represent
39
the unprotected amide hydrogen atoms that exchange with an average intrin-sic exchange rate kint. These amide hydrogen atoms exchange too fast to detect under the experimental conditions in this paper (Paper III). With re-spect to these fast-exchanging hydrogen atoms a correction should be made in this paper (Paper III). On page 263, it is written that the shortest time for measurements is 0.25 s while it should be 0.25 min. The second and third populations represent protected amide hydrogen atoms in the two structural populations in the lysozyme molecule that each undergoes a cooperative global unfolding at an average exchange rate kex,2 and kex,3 , respectively.
These populations most likely represent two different segments of the ly-sozyme structure and have a similar amount of secondary structure. The difference in stability between these two populations is roughly 8 kJ/mol, both for lysozyme adsorbed onto silica particles and in solution. Lysozyme consists of two domains, one consisting mainly of –helix structure and the other mainly of –sheet structure. The –helix domain folds prior to the -sheet domain [127-129]. These two domains are well-defined structural units, but it has been shown that they are not well oriented relative to each other [130]. Earlier investigations of temperature-induced unfolding of ly-sozyme have shown that lysozyme is unfolded in a two-state transition under various conditions [103, 131]. However, a later calculation model has indi-cated that experimental data deviated from a two-state transition process, and by combining experimental data with a three-state calculation model made the experimental data and the calculated values indistinguishable from each other [104]. Deviation from a two-state transition for lysozyme has been reported to be less than 5% in earlier studies and this deviation was ac-counted to the presence of highly unstable intermediates [101, 132]. Our results from HDX FT-ICR MS analysis clearly indicated that two popula-tions with distinct folding/unfolding rates are present in lysozyme, which means that the three-state calculation model [104] is a more accurate de-scription of what happens, and that these highly unstable intermediates could very well correspond to a scenario where the –domain is folded while the
– domain is not yet completed.
4.5 Paper IV This study (Paper IV) focused on presenting more detailed information on
adsorption-induced conformational changes within proteins. This was achieved by combining results obtained by DSC and limited proteolysis. Descriptions concerning the methods involved can be found in Chapter 3, and instrumental information in Chapter 5. DSC provides information of heat induces average conformational changes within a protein population, and in this study bovine serum albumin was investigated in three different

40
buffers, both in solution and adsorbed to silica particles. Bovine serum al-bumin is considered a more flexible protein than for example lysozyme and ribonuclease A [1], which were used in Paper I.
Many adsorption studies have been performed with phosphate buffer [71, 72, 78, 81, 133, 134]. In the present study (Paper IV), the buffers investi-gated were 10 mM hepes, pH 7.0, 50 mM ammonium bicarbonate, pH 8.0, and 10 mM phosphate, pH 7.0. These different buffers were investigated to evaluate the effect of the surrounding environment on the structural stability of the protein. The ammonium bicarbonate buffer was used in limited prote-olysis experiments, as MS analysis of the limited proteolysis process re-quires an MS-compatible buffer like ammonium bicarbonate that evaporates during MS sample preparation.
Investigations were made concerning the affinity of albumin for the nega-tively charged hydrophilic silica particles by measuring adsorption iso-therms. The results demonstrated that the affinity of albumin for the surface did not significantly differ between the various buffer-solutions investigated, although albumin adsorbed to a larger extent onto silica in 10 mM phosphate buffer than in 10 mM hepes or 50 mM ammonium bicarbonate before a pla-teau value was reached. Albumin is negatively charged at the two pH-values used, i.e., pH 7.0 and pH 8.0, but the flexibility within the protein molecule is considered the main factor for adsorption of albumin to the negatively charged silica surface [134]. The larger adsorbed amount of albumin onto silica in phosphate buffer could be an indication that the protein molecules adsorb to the surface in a more compact conformation in that buffer com-pared to albumin adsorbed onto silica in 10 mM hepes or 50 mM ammonium bicarbonate. The study showed that albumin in solution has the largest ther-mal stabilization enthalpy in 10 mM phosphate. The lowest value for stabili-zation enthalpy was obtained for albumin in 50 mM ammonium bicarbonate, i.e., approximately 550 kJ/mol compared with 720 kJ/mol for albumin in 10 mM phosphate. Albumin free in 10 mM phosphate buffer did not only have the highest value of thermal enthalpy, but also the lowest value of FWHM, indicating the lowest heterogeneity or the most cooperative denaturation process. Additionally, the thermal transition curves for the three systems investigated differed in their shapes. Albumin free in 50 mM ammonium bicarbonate showed two transitions peaks overlapping accompanied with the largest FWHM. This indicated that albumin does not thermally unfold in a clear two-state transition.
Upon adsorption, the thermal transition peaks reduced to undetectable levels for albumin adsorbed to silica in 10 mM hepes as well as in 50 mM ammonium bicarbonate, while some indication of a thermal transition could be seen for albumin adsorbed to silica particles in 10 mM phosphate. How-ever, the signal was estimated to be less than 10% of the transition enthalpy

41
when compared to albumin in phosphate buffer solution. This is not in agreement with the study made by Giacomelli and Norde [78], where it was reported that no thermal transition was observed in the adsorbed state for albumin on silica in 10 mM phosphate buffer.
Partial proteolysis was performed on the albumin molecules, both in solu-tion and in the adsorbed state using trypsin and chymotrypsin as cleaving enzymes. The enzymatic digestion process was analyzed with MS. Trypsin cleaves on the c-terminal side of negatively charged residues while chy-motrypsin cleaves on the c-terminal side of the more hydrophobic aromatic residues. By performing limited proteolysis the accessibility of these resi-dues within albumin for the enzymes can be studied. By using trypsin and chymotrypsin, both the charged residues located on the albumin surface as well as the hydrophobic residues often buried within the native structure can be studied.
The results showed that albumin in solution and albumin adsorbed to sil-ica were cleaved at the same sequence positions. However, a clear difference was seen in the relative intensity of the different mass peaks belonging to the various cleavage products. The albumin molecule consists of three domains [116, 117] and upon adsorption, more cleavages were observed at sites posi-tioned in domains 1 and 3, while less cleavage was observed in domain 2. This effect was seen regardless of whether the digestion was performed with trypsin or chymotrypsin. This indicates that the second domain of albumin is less accessible for proteolytic enzymes suggesting that albumin molecules are oriented with domain 2 towards the silica surface. The number of ob-served cleavage sites does not increase upon adsorption and this number is small compared to the total number of potential cleavage sites within albu-min. This indicates that the structure of albumin is not affected in such a way that it opens up its structure enough to enhance enzymatic cleavage at posi-tions buried within the albumin structure. Here, it has been shown that the use of limited proteolysis in combination with MS can be used to achieve information on protein orientation and structure on surfaces. Additionally, DSC gives information on the overall structural stability of the investigated protein. For albumin, a strong reduction in the overall structural stability is observed upon adsorption to silica while the structure is not unfolded to such an extent that residues within the native albumin structure become fully ex-posed to the solvent.
4.6 Paper V Papers II, III, and IV have shown the power of using MS as a method of
identification, both with (Paper II and IV) and without (Paper III) limited proteolysis prior to analysis with MS. Some difficulties with MS as a detec-

42
tion method in these applications are its sensitivity to the presence of salts and detergents in the sample solutions, which can causes a reduction in sen-sitivity of the MS signal. However, the power of MS for identification of proteins is outstanding, and MS is well appreciated for this purpose. Within biomedical research, there is a driving force towards automated chip-based devices for separation and analyses of small quantities of biomolecular sam-ples [135-137]. However, these trends are accompanied with several difficul-ties. The development of microfluidic devices brings problems with sample losses due to the large surface-to-volume ratio within such systems. This study (Paper V) focused on investigation of carry-over effects of proteins and salts in buffer solutions that contaminate eluted samples, and sample loss due to unspecific adsorption of proteins in microfluidic channels. These problems are well recognized within this area [138, 139]. A system that combines SPR for protein purification with MS for identification was inves-tigated and optimized. This combination is widely used in the field of func-tional proteomics to fish for novel interaction partners from complex pro-tein-containing samples such as cell lysates and tissue extracts. Both FITC (fluorescein isothiocyanate) labeled bovine serum albumin, as well as the antibody/antigen complex of anti- bovine serum albumin antibody/bovine serum albumin was used in the various experiments.
Contamination of the eluted sample was investigated by washing the mi-cro-fluidic system with various solutions. A sample solution containing al-bumin was injected into the system upon which the channels were then washed with one of the wash solution under investigation. Of the wash solu-tions tested, CTAB (hexadecyltrimethylammonium bromide) and high con-centrations of organic acids showed extremely poor washing qualities. It has been shown that strong acids dissolve the material of the fluidic system that consists of PDMS (polydimethylsiloxane) [140], which could be an explana-tion for the poor results. Solutions that showed good qualities in washing the PDMS were 1% acetic acid and 50 mM n-OGP (n-octyl glucopyranoside). n-OGP has an additional advantage as it is compatible with MS analysis [141, 142].
In order to investigate sample losses due to non-specific adsorption of protein to the PDMS channel walls, anti- albumin antibodies were immobi-lized on the sample surface into which sample solution containing the poten-tial target molecule was injected. The microfluidic PDMS channels were then washed with 1% acetic acid and 50 mM n-OGP. To prevent the protein molecules from adsorbing to the channel walls, silica particles were intro-duced in the solution for recovering the albumin from the sample surface. This procedure increased the eluted amount of albumin with nearly two-fold, compared to those experiments where silica particles were not used as carri-ers. The principle of using colloidal particles as carriers is a new trend in microfluidic devices [143] and the results in this study (Paper V) clearly

43
show their potential. Today, colloidal particles are manufactured with a vari-ety of characteristics, and the future for this concept is promising.
4.7 Future outlooks It is of great interest that research dealing with protein adsorption behav-
ior continues. Increasing knowledge on protein adsorption would benefit a wide range of fields. The more we understand about protein adsorption, the more we are able to use it for making our daily lives better.
The work performed within this thesis has contributed to the research area of protein adsorption, concerning both the understanding of the process and the use of new techniques for studying the phenomenon. Both research and application areas seek new ways of gaining knowledge. Areas such nanotechnology, proteomics, biosensors, and drug delivery systems require more information about protein adsorption in order to further develop. Fu-ture studies will inevitably focus upon the combination of various methods to study protein adsorption, which also lead to more automated, time saving, smaller devices in order to be able to handle the processes.
What about not having to change contact lenses due to fouling by protein buildup? What about not having to wait for answers on diagnostic tests, be-cause new techniques will provide the results immediately? What about medicines that specifically target only the damaged area, as in the treatment of cancer tumors? These are just a few examples of what could be a reality as a result of further research in the field of protein adsorption.

44
5. Description of Instruments
5.1 Differential Scanning Calorimetry DSC is a powerful tool for the investigation of the structural stability of
proteins. The method combines traditional equilibrium calorimetry with the dynamic analysis of thermal processes. DSC makes it possible to determine both the thermodynamic parameters of substances and the kinetic character-istics of the processes under a linearly programmed temperature range. It has been shown that temperature perturbations do not alter the amount of pro-teins on most surfaces, which is an important aspect when it comes to inves-tigations of such systems [49, 92].
There are two main types of DSCs, the heat flux DSC and the power compensation DSC. In heat flux DSCs a defined exchange of the heat to be measured with the environment takes place via a thermal resistance. The measured signal is the temperature difference, which describes the intensity of the exchange and is proportional to the heat flow rate. The second type of DSCs is power compensation DSCs. The heat to be measured is compen-sated with electric energy, by increasing or decreasing an adjustable Joule‘s heat. In this thesis, all experimental work with DSC has been performed with a power compensation DSC.
The experimental basis in power compensation DSC is heating or cooling of a sample and a reference at a given rate of increasing or decreasing tem-perature. The measuring system consists of one reference furnace and one or more sample furnaces, each of them containing a temperature sensor and a heating resistor. For the experimental work within this thesis, the DSC used contained one reference furnace and three sample furnaces. Within each furnace, a stainless steel sample ampoule with a sample volume of 0.6 ml is positioned. All furnaces are positioned in a block with constant temperature and thermally separated from each other. Nitrogen flows through the cham-ber where the block is positioned to prevent condensation induced distortion in the experiments. The instrument is programmed with start temperature, heating rate, and end temperature for the temperature interval of interest. During heating, the same heating power is supplied to all furnaces via a con-
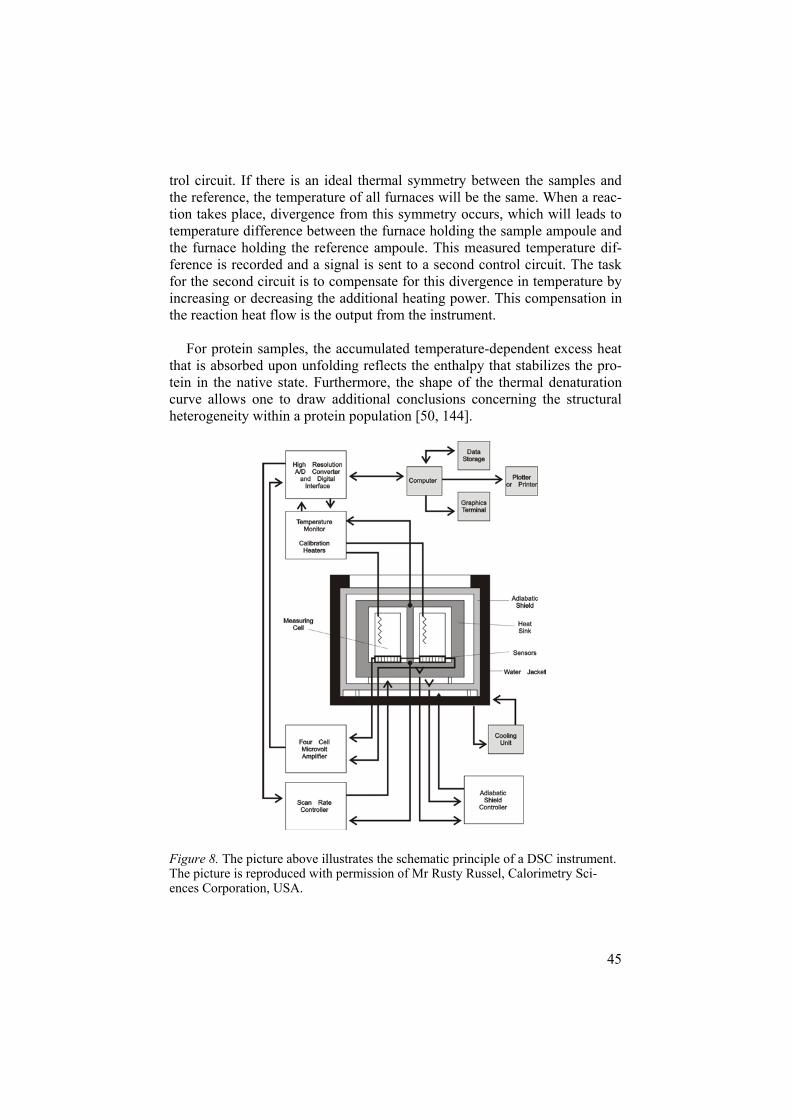
45
trol circuit. If there is an ideal thermal symmetry between the samples and the reference, the temperature of all furnaces will be the same. When a reac-tion takes place, divergence from this symmetry occurs, which will leads to temperature difference between the furnace holding the sample ampoule and the furnace holding the reference ampoule. This measured temperature dif-ference is recorded and a signal is sent to a second control circuit. The task for the second circuit is to compensate for this divergence in temperature by increasing or decreasing the additional heating power. This compensation in the reaction heat flow is the output from the instrument.
For protein samples, the accumulated temperature-dependent excess heat that is absorbed upon unfolding reflects the enthalpy that stabilizes the pro-tein in the native state. Furthermore, the shape of the thermal denaturation curve allows one to draw additional conclusions concerning the structural heterogeneity within a protein population [50, 144].
Figure 8. The picture above illustrates the schematic principle of a DSC instrument. The picture is reproduced with permission of Mr Rusty Russel, Calorimetry Sci-ences Corporation, USA.

46
5.2 Mass Spectrometry MS has over the past decades shown to be an important detection system
in chemical and biochemical analysis, and new possibilities are continuously added to the technique. In the mass spectrometer, the sample is converted into ions and neutral particles. The ions have either a negative or a positive charge, and are separated from each other by their m/z. The pattern of ions formed from a compound can be used to identify this compound.
There are some basic parts of which all mass spectrometers consist. First, there is a device for sample introduction, followed by an ionization source, where the sample is ionized at atmospheric pressure or vacuum. After that, the ions are separated and detected in vacuum by an analyzer, which sepa-rates the charged molecules according to their mass-to-charge ratios by ap-plying electric or magnetic fields. Two of these analyzers that were utilized in the experiments presented in this thesis, namely the TOF and ICR detec-tors are to be described further down in this chapter. A pumping system is needed to achieve high vacuum and a computer system to control the in-strument for the acquisition, display, data manipulation, and interpretation.
However, until relatively recently, it was not possible to perform MS on all but the smallest proteins because the energy required to get proteins from a solid or liquid sample into the gas phase is high which caused the proteins to break apart. Today, however, it is possible to perform MS on relatively large proteins, mainly thanks to two non-destructive ionization techniques developed in the end of the 1980’s. These are MALDI [145, 146] and ESI [147, 148], both described below.
5.2.1 Matrix Assisted Laser Desorption and Ionization In MALDI, biomolecules are desorbed from the sample and ionized by a
short and intense pulse of laser irradiation. The majority of the molecules are singly ionized, and a single peak corresponding to each component is ob-tained. Basically, MALDI is achieved in two steps. First, the sample to be analyzed is mixed with a solution containing small organic molecules, which is called a matrix, and applied onto a target plate. These organic molecules have strong absorption at the laser wavelength used. The mixture is allowed to dry, resulting in the sample molecules being embedded throughout the matrix crystals in a way that the sample molecules are isolated from each other. Secondly, the target plate is bombarded with laser pulses, usually in the time range 1-100 ns, causing desorption and ionization of the matrix containing the sample molecules. The matrix molecules adsorb the energy from the laser. This energy is transferred indirectly to the biological sample in a controlled manner, thereby avoiding sample decomposition. The
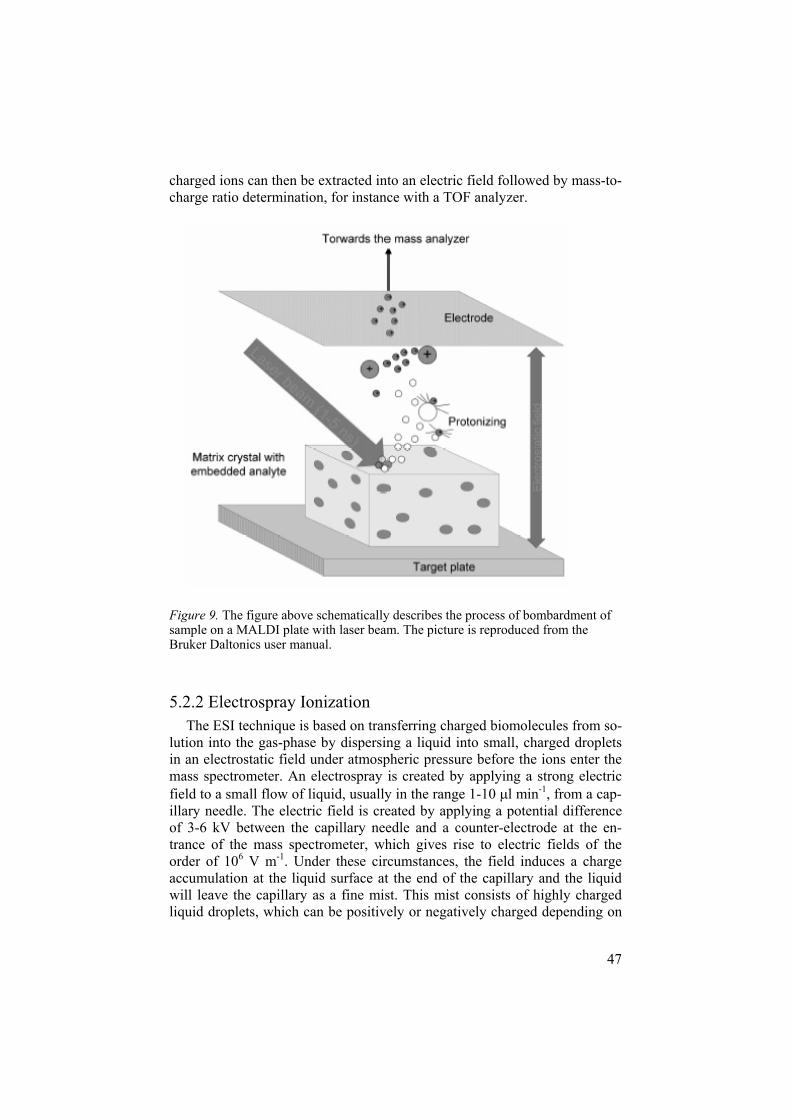
47
charged ions can then be extracted into an electric field followed by mass-to-charge ratio determination, for instance with a TOF analyzer.
Figure 9. The figure above schematically describes the process of bombardment of sample on a MALDI plate with laser beam. The picture is reproduced from the Bruker Daltonics user manual.
5.2.2 Electrospray Ionization The ESI technique is based on transferring charged biomolecules from so-
lution into the gas-phase by dispersing a liquid into small, charged droplets in an electrostatic field under atmospheric pressure before the ions enter the mass spectrometer. An electrospray is created by applying a strong electric field to a small flow of liquid, usually in the range 1-10 l min-1, from a cap-illary needle. The electric field is created by applying a potential difference of 3-6 kV between the capillary needle and a counter-electrode at the en-trance of the mass spectrometer, which gives rise to electric fields of the order of 106 V m-1. Under these circumstances, the field induces a charge accumulation at the liquid surface at the end of the capillary and the liquid will leave the capillary as a fine mist. This mist consists of highly charged liquid droplets, which can be positively or negatively charged depending on

48
the sign of the voltage applied to the capillary. During the process of evapo-ration, the charged droplets are reduced in size to the point where the repel-ling coulombic forces come close to their cohesion ruptures, which will yield smaller and smaller highly charged droplets. Under the influence of a strong electric field, this procedure will force sample molecules to desorb as ions from the droplet surface due to charge accumulation at the surface of the droplets. The charged sample molecules are carried by an electric field through the orifice and then into an ion analyzer. Generally, the molecules are volatilized with many charges, and a large cluster of peaks representing the various charge states is obtained for each protein. In the present study, ESI is coupled with FT-ICR MS.
Figure 10. The figure schematically describes the ionization of sample solution in an ESI ion source.
5.2.3 Time-of-Flight The concept of the TOF analyzer is that a collection of ions is accelerated
to a fixed kinetic energy by an electric potential, proportional to the number of charges present. As the kinetic energy of a charged molecule is propor-tional to its mass multiplied by the square of its velocity, it means that heav-ier molecules have a lower velocity than the lighter ones. The ions are then allowed to pass through a field-free region where they separate into different series of individual ion collections, which travel with a velocity characteris-tic of their mass and charge state. The resolution and mass precision depend mainly on the length of the flight region. The longer the flight region, the larger the time differences between the ion collections will be and hence, they will hit the detector with larger time gaps. In principle, the upper mass range of the TOF method has no limit, which makes it especially suitable for soft ionization techniques. Another advantage of this method is its high transmission efficiency, which leads to very high sensitivity. Samples with

49
masses above 800000 g mol-1 [149] and concentrations as low as femtomoles have been recorded [148, 150].
Figure 11. The figure above illustrates schematic description of a MALDI-TOF Mass Spectrometer. The picture is reproduced from the Bruker Daltonics user man-ual.
5.2.4 Fourier Transform-Ion Cyclotron Resonance FT-ICR instruments belong to the category of ion storage devices. They
can reach extremely high mass resolution, and are also capable of providing mass accuracies of the order of a few ppm over a fairly wide m/z range [151, 152]. Mass resolution in the range of 106 is observed with most instruments and resolutions in the 104 to 105 range are routinely available.
The technique is based on magnetic trapping of ions and excita-tion/detection of their cyclotron frequencies. FT-ICR MS is probably the most complex method of mass analysis. The technique has gone through a
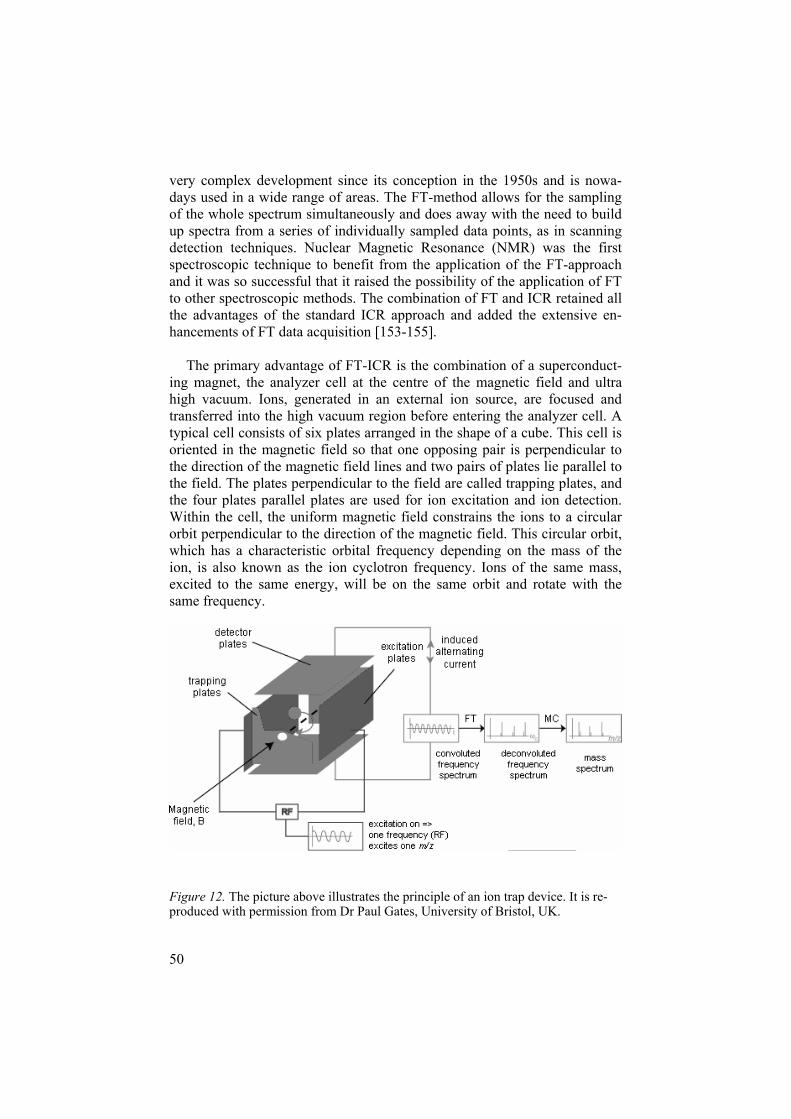
50
very complex development since its conception in the 1950s and is nowa-days used in a wide range of areas. The FT-method allows for the sampling of the whole spectrum simultaneously and does away with the need to build up spectra from a series of individually sampled data points, as in scanning detection techniques. Nuclear Magnetic Resonance (NMR) was the first spectroscopic technique to benefit from the application of the FT-approach and it was so successful that it raised the possibility of the application of FT to other spectroscopic methods. The combination of FT and ICR retained all the advantages of the standard ICR approach and added the extensive en-hancements of FT data acquisition [153-155].
The primary advantage of FT-ICR is the combination of a superconduct-ing magnet, the analyzer cell at the centre of the magnetic field and ultra high vacuum. Ions, generated in an external ion source, are focused and transferred into the high vacuum region before entering the analyzer cell. A typical cell consists of six plates arranged in the shape of a cube. This cell is oriented in the magnetic field so that one opposing pair is perpendicular to the direction of the magnetic field lines and two pairs of plates lie parallel to the field. The plates perpendicular to the field are called trapping plates, and the four plates parallel plates are used for ion excitation and ion detection. Within the cell, the uniform magnetic field constrains the ions to a circular orbit perpendicular to the direction of the magnetic field. This circular orbit, which has a characteristic orbital frequency depending on the mass of the ion, is also known as the ion cyclotron frequency. Ions of the same mass, excited to the same energy, will be on the same orbit and rotate with the same frequency.
Figure 12. The picture above illustrates the principle of an ion trap device. It is re-produced with permission from Dr Paul Gates, University of Bristol, UK.
51
The radius of an ion’s cyclotron orbit when first trapped is usually small compared to the dimensions of the cell. The ions are then excited into coher-ent motion by applying continuous voltage to the excitation plates. The ions spiral outwards when their cyclotron frequency is in resonance with the fre-quency of the applied field and will finally strike an excitation or detection plate which will give rise to a signal. Ions which are not in resonance will not adsorb energy and remain at the center of the cell.
5.3 Surface Plasmon Resonance SPR sensing has been demonstrated in the past twenty years to be an ex-
ceedingly powerful and quantitative probe of the interactions of a variety of biopolymers with various ligands, biopolymers, and membranes [156, 157]. Systems, such as protein/ligand, protein/protein, protein/DNA, and pro-tein/membrane binding, respectively, can be studied with a very sensitive and label-free biochemical assay. Over the years SPR has developed into a useful technique for immunosensing and biospecific interaction analysis [158-160].
An instrument based on the SPR technique, such as the Biacore instru-ment used for experimental work in this thesis, contains the following basic parts. Firstly, there is the sensor chip, which consists of a glass surface coated with a thin layer of gold. From this surface, a wide range of special-ized surfaces can be designed for various applications. A target molecule, for example an antibody, can be immobilized on the surface and quantitative measurements of an analyte can then be performed on the sensor chip. Sec-ondly, there is a micro-fluidic system which allows the analyte to pass over the surface in a continuous, pulse-free and controlled flow over the sensor chip surface. Thirdly, the mass increase on the sensor chip surface is meas-ured with an optical technique, described below, which essentially detects changes in mass in the aqueous layer close to the sensor chip surface by measuring changes in the refractive index. When molecules bind to target molecules a mass increase occurs and dissociation of the molecules leads to a mass decrease. This leads to a signal, which forms a sensogram, providing quantitative information in real-time on the specificity of binding, the active concentration of molecules in a sample, as well as kinetics and affinity [161, 162].
At an interface between two transparent media of different refractive in-dex, for example glass and water, light coming from the side of higher re-fractive index is partly reflected and partly refracted. Above a certain critical angle of incidence, there will be no refracted light across the interface. This phenomenon is called internal reflection. While the incident light is totally reflected, the electromagnetic field component penetrates a short distance

52
into the medium of a lower refractive index. The penetration is of the order of tens of nanometers, and creates an exponentially detenuating evanescent wave. If the interface between the two media is coated with a thin layer of gold, and the incident light is monochromatic and p-plane polarized, the intensity of the reflected light is reduced at a specific incident angle, which will produce a sharp shadow, called surface plasmon resonance. This is due to the resonance energy transfer between the evanescent wave surface plas-mons. The resonance conditions are influenced by the material adsorbed onto the thin gold film. A linear relationship exists between the resonance energy and mass concentration on the surface, for example proteins, sugars, and DNA. The SPR signal is expressed in resonance units is therefore a measure of mass concentration at the sensor chip surface. This means that an analyte and ligand association and dissociation can be observed, and ulti-mately rate constants as well as equilibrium constants can be calculated [156, 162].
Figure 13. The principle of the SPR technique, adopted from Biacore (http://biacore.com).

53
6. Acknowledgements
First of all I would like to thank Prof. Sven Oscarsson and Dr. Jos Buijs, my supervisors, who have introduced me to this area and supported me over the years. It has really been a joy working with you. Oscarsson, I thank you for your enthusiasm and somewhat wild contributions to our discussions. Jos, I want to express great appreciation for your never ending optimism and down-to-earth logical discussions. You have really helped me to keep my focus. Both of you have always been there for me, whenever I needed guid-ance.
I would also like to thank all of you at the Department of Biology and Chemical Engineering at Mälardalen University, for your friendship, sup-port, and happy moments. Likewise, I would like to express big thanks to Prof. Karin Caldwell and all of you at the Center for Surface Biotechnology. I would like to express appreciation to you at Ånström laboratory for the use of the FTICR, and Biacore for the use of instrumentation and supporting me with expertise. A big hug goes out to former and present members of the surface biotechnology group, Arjan, Elisabeth, Magnus, Greger, Åsa. It has been really great working with you.
My love goes to my family. Lucky me for having you. Mom, for your never ending optimism, nothing is impossible, and Dad for lending me your ear, whenever I needed it. My brothers, Mikael and John, for always believ-ing in me. You have always been supporting me 110%. My cousin, Maria, for taking my mind off research once in a while by calling to say hello. An-nika, for fruitful discussions about things that are important in life, other than research.
Danka, my dearest friend! My appreciation goes over all limits. You have always encouraged and supported me, no matter what. You have a special place in my heart.
At last, but not least, Micke… Thank you for your love and support. I’m overwhelmed over the person you are. You rock my world!

54
7. Summary in Swedish
Svensk titel: Makromolekyler på ytor
Proteiner är viktiga byggstenar och hjälpmedel i naturen, och de har alla sin speciella funktion. Det finns proteiner som agerar som katalysatorer i kemiska reaktioner, proteiner som försvarar kroppen mot främmande ämnen och proteiner som omvandlar kemisk energi till mekanisk energi i muskler, för att bara nämna några. Proteiner i gränsskikt mellan olika material, såsom mellan en yta och omgivande lösning, och proteinadsorption har intresserat och fascinerat forskare över hela världen i flera årtionden. Hur proteiner agerar och beter sig är en del av vårt dagliga liv. Vem tycker att det är roligt att besöka tandläkaren för att det bildas plack på tänderna? Hur kostsamt är det inte att byta ut kontaktlinser med jämna mellanrum för att de blir grumli-ga? Vad tycker båtägare om att göra rent båtskroven varje säsong för att det växer havstulpaner och alger på det? Ett område som verkligen nyttjar prote-iners specifika egenskaper är det medicinska, t ex i reningsprocesser av pro-teiner till mediciner, mot avstötningseffekter av biomaterial som inplantat och i diagnostiska tester såsom graviditetstest eller allergitester.
Ett problem med forskning om proteiner är att de är så komplexa. Än idag kan man inte med säkerhet förutspå den tredimensionella strukturen av ett protein, trots att man vet hela aminosyra-sekvensen. Proteiner är uppbyggda av ca 20 olika aminosyror, både hydrofila och hydrofoba aminosyror, med olika storlek, laddning och polaritet. Vanligtvis beskrivs proteiners struktur i termer av primär, sekundär, tertiär och kvartär struktur. Den primära struktu-ren beskriver aminosyrasekvensen. Sekundär struktur talar man om när man vill beskriva hur närliggande aminosyror är orienterade gentemot varandra. Tertiär struktur beskriver hur aminosyror som i den primära strukturen sitter långt ifrån varandra är orienterade jämfört med varandra. Definitionsgränsen mellan sekundär och tertiär struktur är något godtycklig. Slutligen, om ett protein består av flera aminosyrakedjor, beskriver den kvartära strukturen hur dessa är orienterade jämfört med varandra.
När proteiner är i sina nativa stadier, är de veckade i en mycket väldefini-erad och ordnad struktur. Krafter som styr detta är intra-molekylära bind-ningar, såsom hydrofoba och elektrostatiska interaktioner. Dessa interaktio-ner uppstår mellan olika aminosyror inom proteinmolekylen, vilket ger pro-teinet dess specifika tredimensionella struktur. Dock är denna välordnade

55
struktur inte statisk, utan proteinet har en viss flexibilitet. Denna flexibilitet fordrar att bindningar inom proteinet bryts medan andra formas, och detta är en ständigt pågående process inom varje proteinmolekyl.
Genom åren har man kommit fram till vissa generella krafter som styr proteinadsorption på olika ytor. En stark drivkraft inom proteinadsorption till hydrofoba ytor är hydrofob interaktion, vilket orsakar dehydrering av den adsorberande ytan. Denna interaktion leder till omstrukturering av vattenmo-lekyler, både runt proteinmolekylen och den adsorberande ytan, vilket leder till en mer gynnsam omgivning för både proteinmolekylen och ytan. En stark drivkraft gällande hydrofila ytor är elektrostatisk interaktion. Attraktion mel-lan positiva och negativa laddningar mellan proteinet och ytan beror inte bara på proteinets och ytans kemiska sammansättning, utan också på omgi-vande faktorer såsom pH och jonstyrka hos omgivande lösning.
För att öka förståelsen för adsorptionsprocessen och strukturen som prote-iner får när de adsorberas till olika ytor, är det viktigt att studera de föränd-ringar som proteiner genomgår då de adsorberas. Denna avhandling fokuse-rar på att generera mer information och insikt om strukturella förändringar i proteiner och deras stabilitet när de är adsorberade till ytor. Eftersom detta är ett mycket komplext område, kan ingen experimentell metod eller teoretisk kalkyl ensam besvara de frågor som finns. Därför används olika metoder, vars resultat kan kombineras för att få en bättre bild av vad som verkligen händer och varför.
I denna avhandling behandlas fem olika modellproteiner, -lactalbumin, lysozym, ribonuclease A, myoglobin och bovin serumalbumin. Dessa har undersökts med olika metoder, både fria i lösning och adsorberade på hydro-fil kiselyta. Av de utvalda proteinerna är -lactalbumin, lysozym, ribonucle-ase A och myoglobin små globulära proteiner. Av dessa är -lactalbumin och myoglobin mer flexibla i sina strukturer än lysozym och ribonuclease A. Bovin serumalbumin är ett större protein med ganska hög flexibilitet. Genom kombination av flera metoder, har olika aspekter av proteinadsorption kun-nat studeras. Dessa metoder är Differential Scanning Calorimetry (DSC), väte/deuterium i utbyte (HDX), Mass Spektrometri (MS), enzymatisk klyv-ning av proteiner och Surface Plasmon Resonance (SPR).
DSC ger information om den strukturella stabiliteten hos proteiner genom att man termodynamiskt denaturerar dem, vilket ger information om den totala strukturella stabiliteten hos proteinet. Om man jämför förändringar i den mängd energi som behövs för att denaturera proteiner i olika system, till exempel adsorberade jämfört med fria i lösning, erhålls främst information om förändringar i den tertiära strukturen hos proteiner.
56
En annan metod för att undersöka förändringar i proteiner, som är relativt ny, är HDX i kombination med masspektrometri. Metoden innebär, att man detekterar massökningen i proteinmolekyler med avseende på tiden då prote-inmolekylerna befinner sig in en lösning med överskott av deuterium. Över-skott av deuteriumatomer i lösningsmedlet medför att dessa byter plats med väteatomerna i proteinmolekylen. Det kommer att ta längre tid för en väte-atom som sitter långt inne i det veckade proteinet att bytas ut mot deuterium än för en väteatom som sitter nära ytan. Beroende på hur flexibelt proteinet är, kommer denna massökning att ske olika fort. Om proteinet dessutom är adsorberat på en yta, kan det innebära att vissa delar av proteinmolekylen är blockerad av ytan. Detta kan i sin tur innebära att deuteriumatomerna inte kan komma åt att byta ut väteatomerna. Metoden är känslig för förändringar i den sekundära strukturen hos proteinmolekylerna. Kombination av DSC och HDX-MS i detta arbete visade att förändringar i lysozym på grund av adsorption främst berodde på förändringar i den tertiära strukturen, inte den sekundära.
Masspektrometri är en kraftfull metod för identifiering av proteiner. För att öka känsligheten i analysen kan man klyva proteinmolekylen med enzym före analys, och de erhållna fragmenten kan då jämföras med resultaten i befintliga databaser. Metoden ger inte bara högre känslighet i analyserna, utan kan också ge information om orientering av proteinmolekylerna på ytan om den kombineras med HDX. I en studie gällande adsorption av albumin på kiselpartiklar, i denna avhandling, visade resultaten att albumin orienterar sig på ett sådant sätt, att det sker mer enzymatisk klyvning i vissa delar av det adsorberade proteinet medan minskning inträffar i andra.
Kunskapen om adsorption av proteiner till olika fasta ytor är av stor vikt när det gäller rening av proteiner, till exempel inom medicinska analyser eller läkemedelstillverkning. Med hjälp av SPR kan man i realtid följa ad-sorption av proteiner till ytor genom att detektera massökningen på ytan. Ytorna kan vara modifierade kemiskt eller ha antikroppar inbundna. Från en lösning kan då specifika proteiner sorteras ut från komplexa blandningar med hjälp av den modifierade ytan, och sedan analyseras med masspektro-metri. Det finns i dagens läge problem med att proteiner även fastnar på andra tillgängliga ytor än den avsedda provytan. Detta kan medföra att den adsorberade mängden av det önskade proteinet inte blir tillfredställande samt att utbytet inte blir tillräckligt högt för fortsatta analyser efter reningssteget. En studie i denna avhandling nyttjade konceptet att de undersökta proteiner-na visade affinitet till kiselpartiklar. Genom att introducera kiselpartiklar som transportmedel hjälptes proteinerna genom systemet. Detta minskade den ospecifika proteinadsorptionen i reningsprocessen avsevärt, och den erhållna proteinkoncentrationen med kiselpartiklar som bärarmolekyler öka-des med nästan det dubbla jämfört med experiment utan kiselpartiklar. Ki-selpartiklar kan dessutom användas för att anrika proteiner genom att protei-

57
nerna får en lokalt högre koncentration på ytan av partikeln än i den omgi-vande lösningen. Det blir då möjligt att genomföra analyser med lägre initi-alkoncentration av proteiner med kiselpartiklar än utan. Detta underlättar identifiering av proteiner med masspektrometri. Tillvägagångssättet under-lättar även utförandet av enzymatisk klyvning, eftersom processen blir mer effektiv vid den lokalt högre proteinkoncentrationen på partiklarna. Det in-nebär även en ökad känslighet i hela processen.
Forskningen inom proteinadsorption går snabbt framåt, både med hjälp av nya teorier och känsligare analysmetoder. Det är viktigt att denna utveckling fortsätter för att vi ska kunna tillämpa våra kunskaper inom de många områ-den som fortfarande är hämmade av brist på insikt om vad som händer och varför. Mer kunskap och förbättrade metoder behövs för att kunna lösa de problem som kvarstår inom detta område.

58
8. References
1. Norde, W., Lyklema, J., J. Biomater. Sci. Polymer Edn. 2 (1991) 183.
2. Hannig, M., Clinical Oral Investigations. 3 (1999) 88. 3. Gocke, R., Gerath, F., von Schwanewede, H., Clinical Oral Investi-
gations. 6 (2002) 227. 4. Caldwell, K.D., Li, J.M., Li, J.T., Dalgleish, D.G., J. Chromatogr.
604 (1992) 63. 5. Del Blanco, L.F., Rodriguez, M.S., Schulz, P.C., Agullo, E., Colloid
Polym. Sci. 277 (1999) 1087. 6. Makkar, R.S., Cameotra, S.S., Appl. Microbiol. Biotechnol. 58
(2002) 428. 7. Ribeiro, M.H.L., Silveira, D., Ferreira-Dias, S., Eur. Food Res.
Technol. 215 (2002) 462. 8. Christiano, S.P., Fey, K.C., J. Ind. Microbiol. Biotechnol. 30 (2003)
13.9. Medina, I., Gonzalez, M.J., Pazos, M., Della Medaglia, D., Sacchi,
R., Gallardo, J.M., Eur. Food Res. Technol. 217 (2003) 301. 10. Ista, L.K., Lopez, G.P., J. Ind. Microbiol. Biotechnol. 20 (1998) 121. 11. Dahlstrom, M., Martensson, L.G.E., Jonsson, P.R., Arnebrant, T.,
Elwing, H., Biofouling. 16 (2000) 191. 12. Dahlstrom, M., Jonsson, P.R., Lausmaa, J., Arnebrant, T., Sjogren,
M., Holmberg, K., Martensson, L.G.E., Elwing, H., Biotechnol. Bi-oeng. 86 (2004) 1.
13. Callow, M.E., Callow, J.A., Biologist. 49 (2002) 1. 14. Styriak, I., Laukova, A., Fallgren, C., Wadstrom, T., Curr. Micro-
biol. 39 (1999) 327. 15. Wiles, C., World J.Surg. 25 (2001) 649. 16. Guntinas, M., Bordin, G., Rodriguez, A.R., Anal. Bioanal. Chem.
374 (2002) 369. 17. Li, M., Su, Z.G., Janson, J.C., Protein Expr. Purif. 33 (2004) 1. 18. Ratner, B.D., Hoffman, A.S., Schoen, F.J., Lemons, J.E., Biomate-
rials science: An introduction to materials in medicine. 1 ed. 1996, San Diego: Academic Press.
19. Tilles, A.W., Berthiaume, F., Yarmush, M.L., Tompkins, R.G., To-ner, M., Journal of Hepatobiliary and Pancreatic Surgery. 9 (2002) 686.
59
20. Wisniewski, N., Moussy, F., Reichert, W.M., Fresenius J. Anal. Chem. 366 (2000) 611.
21. Keusgen, M., Naturwissenschaften. 89 (2002) 433. 22. Bilitewski, U., Genrich, M., Kadow, S., Mersal, G., Anal. Bioanal.
Chem. 377 (2003) 556. 23. Homola, J., Anal. Bioanal. Chem. 377 (2003) 528. 24. Davidson, M.M., Ling, C.L., Chisholm, S.M., Wiseman, A.D., Joss,
A.W.L., Ho-Yen, D.O., Eur. J. Clin. Microbiol. Infect. Dis. 18 (1999) 484.
25. Minatani, M., Aotsuka, S., Satoh, T., Modern Rheumatology. 11 (2001) 127.
26. Choudhry, V., Saxena, R.K., Eur. J. Clin. Microbiol. Infect. Dis. 21 (2002) 1.
27. Abraham, E., Andrews, P., Antonelli, M., Brochard, L., Brun-Buisson, C., Dobb, G., Fagon, J.Y., Groeneveld, J., Mancebo, J., Metnitz, P., Nava, S., Pinsky, M., Radermacher, P., Ranieri, M., Ri-chard, C., Tasker, R., Vallet, B., Intensive Care Med. 30 (2004) 1017.
28. Dard, M., Sewing, J., Meyer, J., Verrier, S., Roessler, S., Scharnwe-ber, D., Clinical Oral Investigations. 4 (2000) 126.
29. Volkov, A.G., Liquid Interfaces in Chemical, Biological, and Phar-maceutical Applications. Vol. 95. 2001, New York: Marcel Dekker. 872.
30. Lee, J.W., Gardella, J.A., Anal. Bioanal. Chem. 373 (2002) 526. 31. Goldenberg, D.M., Cancer Immunol. Immunother. 52 (2003) 281. 32. Haynes, C.A., Norde, W., Colloid Surf. B-Biointerfaces. 2 (1994)
517.33. Norde, W., Colloids and Interfaces in Life Sciences. 2003, New
York: Marcel Dekker. 34. Privalov, P.L., Adv. Protein Chem. 33 (1979) 167. 35. Miyazawa, S., Jernigan, R.L., J. Mol. Biol. 256 (1996) 623. 36. Kurochkina, N., Privalov, G., Protein Sci. 7 (1998) 897. 37. Akasaka, K., Tezuka, T., Yamada, H., J. Mol. Biol. 271 (1997) 671. 38. Norde, W., Zoungrana, T., Biotechnol. Appl. Biochem. 28 (1998)
133.39. Matsumoto, A., Tomimoto, M., Go, N., Eur. Biophys. J. Biophys.
Lett. 28 (1999) 369. 40. Keskin, O., Durell, S.R., Bahar, I., Jernigan, R.L., Covell, D.G.,
Biophys. J. 83 (2002) 663. 41. Jeney, S., Stelzer, E.H.K., Grubmuller, H., Florin, E.L., ChemPhy-
sChem. 5 (2004) 1150. 42. Staunton, S., Quiquampoix, H., J. Colloid Interface Sci. 166 (1994)
89.43. Galisteo, F., Norde, W., Colloid Surf. B-Biointerfaces. 4 (1995) 375. 44. Norde, W., Cells Mat. 5 (1995) 97. 45. Buijs, J., Hlady, V., J. Colloid Interface Sci. 190 (1997) 171.

60
46. Ortega-Vinuesa, J.L., Tengvall, P., Lundstrom, I., Thin Solid Films. 324 (1998) 257.
47. Vermonden, T., Giacomelli, C.E., Norde, W., Langmuir. 17 (2001) 3734.
48. Kondo, A., Mihara, J., J. Colloid Interface Sci. 177 (1996) 214. 49. Steadman, B.L., Thompson, K.C., Middaugh, C.R., Matsuno, K.,
Vrona, S., Lawson, E.Q., Lewis, R.V., Biotechnol. Bioeng. 40 (1992) 8.
50. Zoungrana, T., Findenegg, G.H., Norde, W., J. Colloid Interface Sci. 190 (1997) 437.
51. Baron, M.H., Revault, M., Servagent-Noinville, S., Abadie, J., Qui-quampoix, H., J. Colloid Interface Sci. 214 (1999) 319.
52. Stefan, R.I., van Staden, J.F., Aboul-Enein, H.Y., Fresenius J. Anal. Chem. 366 (2000) 659.
53. Abreu-Velez, A.M., Yepes, M.M., Patino, P.J., Bollag, W.B., Mon-toya, F., Arch. Dermatol. Res. 295 (2004) 434.
54. Bryant, C., Spencer, D.B., Miller, A., Bakaysa, D.L., McCune, K.S., Maple, S.R., Pekar, A.H., Brems, D.N., Biochemistry. 32 (1993) 8075.
55. Griko, Y.V., Freire, E., Privalov, P.L., Biochemistry. 33 (1994) 1889.
56. Woodward, C.K., Curr. Opin. Struct. Biol. 4 (1994) 112. 57. KomsaPenkova, R., Koynova, R., Kostov, G., Tenchov, B.G., Bio-
chim. Biophys. Acta-Protein Struct. Molec. Enzym. 1297 (1996) 171.
58. Miranker, A.D., Dobson, C.M., Curr. Opin. Struct. Biol. 6 (1996) 31.
59. Oliveberg, M., Tan, Y.J., Fersht, A.R., Proc. Natl. Acad. Sci. U. S. A. 92 (1995) 8926.
60. Schulman, B.A., Kim, P.S., Dobson, C.M., Redfield, C., Nat. Struct. Biol. 4 (1997) 630.
61. Liu, H.L., Hsieh, W.C., Liu, H.S., Biotechnol. Prog. 20 (2004) 930. 62. Trikulenko, A.V., Biochem.-Moscow. 61 (1996) 860. 63. Chakravarty, S., Bhinge, A., Varadarajan, R., J. Biol. Chem. 277
(2002) 31345. 64. Weiss, M.S., Palm, G.J., Hilgenfeld, R., Acta Crystallogr. Sect. D-
Biol. Crystallogr. 56 (2000) 952. 65. Tilton, R.D., Robertson, C.R., Gast, A.P., Langmuir. 7 (1991) 2710. 66. Duinhoven, S., Poort, R., Vandervoet, G., Agterof, W.G.M., Norde,
W., Lyklema, J., J. Colloid Interface Sci. 170 (1995) 340. 67. Haynes, C.A., Norde, W., J. Colloid Interface Sci. 169 (1995) 313. 68. Arai, T., Norde, W., Colloids Surf. 51 (1990) 1. 69. Buijs, J., Norde, W., Lichtenbelt, J.W.T., Langmuir. 12 (1996) 1605. 70. Kondo, A., Higashitani, K., J. Colloid Interface Sci. 150 (1992) 344. 71. Norde, W., Favier, J.P., Colloids Surf. 64 (1992) 87. 72. Kondo, A., Oku, S., Higashitani, K., J. Colloid Interface Sci. 143
(1991) 214.

61
73. Su, T.J., Lu, J.R., Thomas, R.K., Cui, Z.F., Penfold, J., Langmuir. 14 (1998) 438.
74. Larsericsdotter, H., Oscarsson, S., Buijs, J., J. Colloid Interface Sci. 237 (2001) 98.
75. Galisteo, F., Norde, W., Colloid Surf. B-Biointerfaces. 4 (1995) 389. 76. Dulm, P.v., Norde, W., Lyklema, J., J. Colloid Interface Sci. 82
(1981) 77. 77. Norde, W., Colloids Surf. 10 (1984) 21. 78. Giacomelli, C.E., Norde, W., J. Colloid Interface Sci. 233 (2001)
234.79. Buijs, J., Lichtenbelt, J.W.T., Norde, W., Lyklema, J., Colloid Surf.
B-Biointerfaces. 5 (1995) 11. 80. Norde, W., Lyklema, J., J. Colloid Interface Sci. 71 (1979) 350. 81. Kondo, A., Murakami, F., Higashitani, K., Biotechnol. Bioeng. 40
(1992) 889. 82. Larsericsdotter, H., Oscarsson, S., Buijs, J., J. Colloid Interface Sci.
276 (2004) 261. 83. Daly, S.M., Przybycien, T.M., Tilton, R.D., Langmuir. 19 (2003)
3848. 84. de Feijter, J.A., Benjamins, J., Veer, F.A., Biopolymers. 17 (1978)
1759. 85. Vikinge, T.P., Hansson, K.M., Sandstrom, P., Liedberg, B., Lindahl,
T.L., Lundstrom, I., Tengvall, P., Hook, F., Biosens. Bioelectron. 15 (2000) 605.
86. Hlady, V., Appl. Spectrosc. 45 (1991) 246. 87. Quist, A.P., Bjorck, L.P., Reimann, C.T., Oscarsson, S.O., Sund-
qvist, B.U.R., Surf. Sci. 325 (1995) L406. 88. Bergkvist, M., Carlsson, J., Karlsson, T., Oscarsson, S., J. Colloid
Interface Sci. 206 (1998) 475. 89. Maste, M.C.L., Norde, W., Visser, A.J.W.G., J. Colloid Interface
Sci. 196 (1997) 224. 90. McMillin, C.R., Walton, A.G., J. Colloid Interface Sci. 48 (1974)
345.91. Billsten, P., Carlsson, U., Jonsson, B.H., Olofsson, G., Hook, F.,
Elwing, H., Langmuir. 15 (1999) 6395. 92. Kondo, A., Urabe, T., J. Colloid Interface Sci. 174 (1995) 191. 93. Benko, B., Vuk-Pavlovic, S., Dezelic, G., Maricic, S., J. Colloid
Interface Sci. 52 (1975) 444. 94. Nagadome, H., Kawano, K., Terada, Y., FEBS Lett. 317 (1993) 128. 95. Engel, M.F.M., Visser, A.J.W.G., Van Mierlo, C.P.M., Proc. Natl.
Acad. Sci. U. S. A. 101 (2004) 11316. 96. Singh, B.R., Fuller, M.P., Appl. Spectrosc. 45 (1991) 1017. 97. Thevenonemeric, G., Kozlowski, J., Zhang, Z.Q., Smith, D.L., Anal.
Chem. 64 (1992) 2456. 98. Jonsson, U., Ivarsson, B., Lundstrom, I., Berghem, L., J. Colloid
Interface Sci. 90 (1982) 148.

62
99. Suzawa, T., Shirahama, H., Adv. Colloid Interface Sci. 35 (1991) 139.
100. Privalov, P.L., Tiktopulo, E.I., Venyaminov, S.Y., Griko, Y.V., Makhatadze, G.I., Khechinashvili, N.N., J. Mol. Biol. 205 (1989) 737.
101. Privalov, P.L., Annual Review of Biophysics and Biophysical Che-mistry. 18 (1989) 47.
102. Yan, G.Y., Li, J.T., Huang, S.C., Caldwell, K.D., Proteins at Inter-faces Ii. 602 (1995) 256.
103. Privalov, P.L., Khechinashvili, N.N., J. Mol. Biol. 86 (1974) 665. 104. Privalov, G., Kavina, V., Freire, E., Privalov, P.L., Anal. Biochem.
232 (1995) 79. 105. Hvidt, A., Nielsen, S.O., Adv. Protein Chem. 21 (1966) 287. 106. Berger, A., Loewenstein, A., Meiboom, S., J. Am. Chem. Soc. 81
(1959) 62. 107. Woodward, C., J. Am. Soc. Mass Spectrom. 10 (1999) 672. 108. Bai, Y.W., Milne, J.S., Mayne, L., Englander, S.W., Proteins. 17
(1993) 75. 109. Englander, S.W., Sosnick, T.R., Englander, J.J., Mayne, L., Curr.
Opin. Struct. Biol. 6 (1996) 18. 110. Smith, D.L., Deng, Y.Z., Zhang, Z.Q., J. Mass Spectrom. 32 (1997)
135.111. Zhang, Z.Q., Smith, D.L., Protein Sci. 2 (1993) 522. 112. Sadasivan, C., Nagendra, H.G., Vijayan, M., Acta Crystallogr. Sect.
D-Biol. Crystallogr. 54 (1998) 1343. 113. Hendrix, T.M., Griko, Y., Privalov, P., Protein Sci. 5 (1996) 923. 114. Demarest, S.J., Zhou, S.Q., Robblee, J., Fairman, R., Chu, B., Ra-
leigh, D.P., Biochemistry. 40 (2001) 2138. 115. Reymond, M.T., Merutka, G., Dyson, H.J., Wright, P.E., Protein Sci.
6 (1997) 706. 116. Peters, T., Adv. Protein Chem. 37 (1985) 161. 117. Carter, D.C., Ho, J.X., Structure of Serum-Albumin, in Advances in
Protein Chemistry, Vol 45. 1994, ACADEMIC PRESS INC: San Diego. p. 153.
118. He, X.M., Carter, D.C., Nature. 358 (1992) 209. 119. Huang, B.X., Kim, H.Y., Dass, C., J. Am. Soc. Mass Spectrom. 15
(2004) 1237. 120. Buijs, J., Vera, C.C., Ayala, E., Steensma, E., Håkansson, P., Os-
carsson, S., Anal. Chem. 71 (1999) 3219. 121. Buijs, J., Speidel, M., Oscarsson, S., J. Colloid Interface Sci. 226
(2000) 237. 122. Hendrix, T., Griko, Y.V., Privalov, P.L., Biophys. Chem. 84 (2000)
27.123. Katta, V., Chait, B.T., J. Am. Chem. Soc. 115 (1993) 6317. 124. Chung, E.W., Nettleton, E.J., Morgan, C.J., Gross, M., Miranker, A.,
Radford, S.E., Dobson, C.M., Robinson, C.V., Protein Sci. 6 (1997) 1316.

63
125. Billsten, P., Wahlgren, M., Arnebrant, T., McGuire, J., Elwing, H., J. Colloid Interface Sci. 175 (1995) 77.
126. Buijs, J., Ramstrom, M., Danfelter, M., Larsericsdotter, H., Hakans-son, P., Oscarsson, S., J. Colloid Interface Sci. 263 (2003) 441.
127. Radford, S.E., Dobson, C.M., Evans, P.A., Nature. 358 (1992) 302. 128. Miranker, A., Robinson, C.V., Radford, S.E., Aplin, R.T., Dobson,
C.M., Science. 262 (1993) 896. 129. Canet, D., Sunde, M., Last, A.M., Miranker, A., Spencer, A., Robin-
son, C.V., Dobson, C.M., Biochemistry. 38 (1999) 6419. 130. Smith, L.J., Sutcliffe, M.J., Redfield, C., Dobson, C.M., J. Mol.
Biol. 229 (1993) 930. 131. Khechinashvili, N.N., Privalov, P.L., Tiktopulo, E.I., FEBS Lett. 30
(1973) 57. 132. Griko, Y.V., Freire, E., Privalov, G., van Dael, H., Privalov, P.L., J.
Mol. Biol. 252 (1995) 447. 133. Norde, W., Anusiem, A.C.I., Colloids Surf. 66 (1992) 73. 134. Norde, W., Giacomelli, C.E., J. Biotechnol. 79 (2000) 259. 135. de Mello, A.J., Lab Chip. 1 (2001) 7N. 136. Mitchell, P., Nat. Biotechnol. 20 (2002) 225. 137. Mouradian, S., Curr. Opin. Chem. Biol. 6 (2002) 51. 138. Nelson, R.W., Krone, J.R., J. Mol. Recognit. 12 (1999) 77. 139. Natsume, T., Nakayama, H., Isobe, T., Trends Biotechnol. 19 (2001)
S28.140. Lee, J.N., Park, C., Whitesides, G.M., Anal. Chem. 75 (2003) 6544. 141. Cadene, M., Chait, B.T., Anal. Chem. 72 (2000) 5655. 142. Gobom, J., Schuerenberg, M., Mueller, M., Theiss, D., Lehrach, H.,
Nordhoff, E., Anal. Chem. 73 (2001) 434. 143. Verpoorte, E., Lab Chip. 3 (2003) 60N. 144. Zoungrana, T., Norde, W., Colloid Surf. B-Biointerfaces. 9 (1997)
157.145. Karas, M., Hillenkamp, F., Anal. Chem. 60 (1988) 2299. 146. Karas, M., Hillenkamp, F., Abstr. Pap. Am. Chem. Soc. 200 (1990)
140.147. Fenn, J.B., Mann, M., Meng, C.K., Wong, S.F., Whitehouse, C.M.,
Science. 246 (1989) 64. 148. Wilm, M.S., Mann, M., Int. J. Mass Spectrom. Ion Processes. 136
(1994) 167. 149. Rostom, A.A., Robinson, C.V., J. Am. Chem. Soc. 121 (1999) 4718. 150. Vorm, O., Roepstorff, P., Mann, M., Anal. Chem. 66 (1994) 3281. 151. Amster, I.J., J. Mass Spectrom. 31 (1996) 1325. 152. Palmblad, M., Hakansson, K., Hakansson, P., Feng, X.D., Cooper,
H.J., Giannakopulos, A.E., Green, P.S., Derrick, P.J., Eur. J. Mass Spectrom. 6 (2000) 267.
153. Comisarow, M.B., Marshall, A.G., J. Mass Spectrom. 31 (1996) 581.
154. Comisarow, M.B., Marshall, A.G., J. Mass Spectrom. 31 (1996) 586.

64
155. Comisarow, M.B., Marshall, A.G., J. Mass Spectrom. 31 (1996) 588.
156. Lofas, S., Johnsson, B., Edstrom, A., Hansson, A., Lindquist, G., Hillgren, R.M.M., Stigh, L., Biosens. Bioelectron. 10 (1995) 813.
157. Liedberg, B., Nylander, C., Lundstrom, I., Biosens. Bioelectron. 10 (1995) R1.
158. Malmqvist, M., Karlsson, R., Curr. Opin. Chem. Biol. 1 (1997) 378. 159. Catimel, B., Domagala, T., Nerrie, M., Weinstock, J., White, S.,
Abud, H., Heath, J., Nice, E., Protein Pept. Lett. 6 (1999) 319. 160. Catimel, B., Rothacker, J., Nice, E., Journal of Biochemical and
Biophysical Methods. 49 (2001) 289. 161. Johnsson, B., Lofas, S., Lindquist, G., Anal. Biochem. 198 (1991)
268.162. Nice, E.C., Catimel, B., BioEssays. 21 (1999) 339.


Acta Universitatis UpsaliensisComprehensive Summaries of Uppsala Dissertations
from the Faculty of Science and TechnologyEditor: The Dean of the Faculty of Science and Technology
Distribution:Uppsala University Library
Box 510, SE-751 20 Uppsala, Swedenwww.uu.se, [email protected]
ISSN 1104-232XISBN 91-554-6089-5
A doctoral dissertation from the Faculty of Science and Technology, UppsalaUniversity, is usually a summary of a number of papers. A few copies of thecomplete dissertation are kept at major Swedish research libraries, while thesummary alone is distributed internationally through the series ComprehensiveSummaries of Uppsala Dissertations from the Faculty of Science and Technology.(Prior to October, 1993, the series was published under the title “ComprehensiveSummaries of Uppsala Dissertations from the Faculty of Science”.)