Embed Size (px)
Citation preview

EA40CH07-Zeebe ARI 1 April 2012 7:44
History of Seawater CarbonateChemistry, Atmospheric CO2,and Ocean AcidificationRichard E. ZeebeSchool of Ocean and Earth Science and Technology, Department of Oceanography,University of Hawaii at Manoa, Honolulu, Hawaii 96822; email: [email protected]
Annu. Rev. Earth Planet. Sci. 2012. 40:141–65
First published online as a Review in Advance onJanuary 3, 2012
The Annual Review of Earth and Planetary Sciences isonline at earth.annualreviews.org
This article’s doi:10.1146/annurev-earth-042711-105521
Copyright c© 2012 by Annual Reviews.All rights reserved
0084-6597/12/0530-0141$20.00
Keywords
carbon dioxide, paleochemistry, fossil fuels
Abstract
Humans are continuing to add vast amounts of carbon dioxide (CO2) to theatmosphere through fossil fuel burning and other activities. A large fractionof the CO2 is taken up by the oceans in a process that lowers ocean pHand carbonate mineral saturation state. This effect has potentially seriousconsequences for marine life, which are, however, difficult to predict. Oneapproach to address the issue is to study the geologic record, which mayprovide clues about what the future holds for ocean chemistry and marineorganisms. This article reviews basic controls on ocean carbonate chemistryon different timescales and examines past ocean chemistry changes and oceanacidification events during various geologic eras. The results allow evaluationof the current anthropogenic perturbation in the context of Earth’s history. Itappears that the ocean acidification event that humans are expected to causeis unprecedented in the geologic past, for which sufficiently well-preservedrecords are available.
141
Ann
u. R
ev. E
arth
Pla
net.
Sci.
2012
.40:
141-
165.
Dow
nloa
ded
from
ww
w.a
nnua
lrev
iew
s.or
g A
cces
s pr
ovid
ed b
y U
nive
rsity
of
Cal
ifor
nia
- Sa
nta
Cru
z on
01/
22/1
8. F
or p
erso
nal u
se o
nly.

EA40CH07-Zeebe ARI 1 April 2012 7:44
INTRODUCTION
Since the beginning of the industrial era, anthropogenic emissions of carbon dioxide (CO2) haveincreased the concentration of CO2 in Earth’s atmosphere by ∼40%. Anthropogenic emissionsare primarily due to fossil fuel burning and to a lesser extent due to land use change and cementmanufacturing. Increasing levels of CO2 in the atmosphere are causing changes in the radiativeforcing of Earth’s climate. Until recently, much of the scientific and public discussion has beenfocused on the impacts of anthropogenic CO2 on climate. However, recent studies underline asecond, major impact of CO2 emissions: ocean acidification.
The term ocean acidification commonly refers to the ongoing decrease in ocean pH owing tothe ocean’s uptake of anthropogenic CO2. Over the period from 1750 to 2000, the oceans haveabsorbed approximately one-third of the CO2 emitted by humans; this absorption has caused adecrease of surface-ocean pH by ∼0.1 units from ∼8.2 to ∼8.1. Surface-ocean pH has probably notbeen below ∼8.1 during the past 2 million years (Honisch et al. 2009). If CO2 emissions continueunabated, surface-ocean pH could decline by approximately 0.7 units by the year 2300 (Zeebeet al. 2008). In a more general sense, ocean acidification may also refer to a decrease in ocean pHdue to other causes and to timescales that are not limited to the present or near future. The phrase“ocean acidification event” should be used in the context of Earth’s history to describe an episodethat involved geologically rapid changes of ocean carbonate chemistry on specific timescales, tobe detailed below.
With increasing CO2 and decreasing pH, the concentration of carbonate ion ([CO2−3 ]) de-
creases, whereas that of bicarbonate ion ([HCO−3 ]) increases (see sidebar, Carbonate Chemistry).
With declining [CO2−3 ], the stability of calcium carbonate (CaCO3), the mineral used by many
marine organisms to build shells and skeletons, is reduced. Laboratory, shipboard, and mesocosmexperiments indicate that many marine organisms react to changes in their geochemical environ-ment that might occur by the end of this century (e.g., Raven et al. 2005, Gattuso & Hansson2011). Frequently, calcifying organisms produce less CaCO3, whereas some may produce moreorganic carbon. Extrapolating such experiments would lead us to expect potentially significantchanges in ecosystem structure and nutrient cycling. However, several questions arise: Is it ap-propriate to extrapolate instantaneous environmental changes under experimental conditions tochanges occurring on a century timescale? Do organisms have the ability to adapt to ongoing andfuture ocean acidification, which is occurring on a much shorter timescale than in the laboratory?Simultaneous changes in ocean temperature and nutrient supply as well as in an organism’s preda-tion environment may create further stresses or work to ameliorate the effect of changes in oceanchemistry. Either way, the actual future impact on marine organisms may further diverge fromprojections that are based on simple manipulation experiments.
There is little doubt that the chemistry of the ocean has varied significantly in the past (seebelow). The geologic record hence may provide clues about what the future will hold for oceanchemistry changes and their effects on marine life. When studying the geologic record, however,the critical task is to identify an appropriate analog for the future. Among other things, this requiresa basic understanding of ocean chemistry controls during long-term steady states versus transientevents because carbonate chemistry parameters do not have to vary with the same relationshipif either the rate of change or the initial chemistry is different. Future versus past comparisonsconducted without sufficient knowledge about how the carbon cycle and ocean chemistry areregulated on geologic timescales may ultimately lead to invalid conclusions. In the case of tran-sient events, knowledge of the magnitude and timescale of the acidification event is necessary.Otherwise, geologic periods or events may be studied that are unsuitable for comparison with thefuture.
142 Zeebe
Ann
u. R
ev. E
arth
Pla
net.
Sci.
2012
.40:
141-
165.
Dow
nloa
ded
from
ww
w.a
nnua
lrev
iew
s.or
g A
cces
s pr
ovid
ed b
y U
nive
rsity
of
Cal
ifor
nia
- Sa
nta
Cru
z on
01/
22/1
8. F
or p
erso
nal u
se o
nly.

EA40CH07-Zeebe ARI 1 April 2012 7:44
CARBONATE CHEMISTRY
Dissolved carbon dioxide (CO2) in the ocean occurs mainly in three inorganic forms: free aqueous carbon dioxide(CO2(aq)), bicarbonate ion (HCO−
3 ), and carbonate ion (CO2−3 ). A minor form is true carbonic acid (H2CO3),
whose concentration is less than 0.3% of [CO2(aq)] (brackets denote concentrations). The sum of [CO2(aq)] and[H2CO3] is denoted as [CO2]. The majority of dissolved inorganic carbon in the modern ocean is in the form ofHCO−
3 (>85%). In thermodynamic equilibrium, gaseous carbon dioxide [CO2(g)] and [CO2] are related by Henry’slaw:
CO2(g)K0= [CO2]
where K0 is the temperature- and salinity-dependent solubility coefficient of CO2 in seawater (Weiss 1974). Theconcentration of dissolved CO2 and the fugacity of gaseous CO2, f CO2, then obey the equation [CO2] = K0 ×f CO2, where the fugacity is virtually equal to the partial pressure, pCO2 (within ∼1%). The dissolved carbonatespecies react with water, hydrogen ions (pH = −log([H+])), and hydroxyl ions and are related by these equilibria:
CO2 + H2OK ∗
1= HCO−3 + H+
HCO−3
K ∗2= CO2−
3 + H+.
The pK∗s [ = −log(K∗)] of the stoichiometric dissociation constants of carbonic acid in seawater are pK1∗ = 5.94
and pK∗2 = 9.13 at temperature Tc = 15◦C, salinity S = 35, and surface pressure P = 1 atm (Prieto & Millero
2001). At typical surface-seawater pH of 8.2, the speciation between [CO2], [HCO−3 ], and [CO2−
3 ] is 0.5%, 89%,and 10.5%, respectively, showing that most of the dissolved CO2 is in the form of HCO−
3 and not in the form ofCO2. The sum of the dissolved carbonate species is denoted as total dissolved inorganic carbon (TCO2):
TCO2 = [CO2] + [HCO−3 ] + [CO2−
3 ].
This quantity is also referred to as DIC, CT, TIC, and �CO2, all symbols meaning total dissolved inorganiccarbon.
Another essential parameter to describe the carbonate system in seawater is the total alkalinity (TA), a measureof the charge balance in seawater:
TA = [HCO−3 ] + 2[CO2−
3 ] + [B(OH)−4 ] + [OH−] − [H+] + minor compounds.
TCO2 and TA are conservative quantities, i.e., their concentrations measured in gravimetric units (mol kg−1) areunaffected by changes in pressure or temperature, for instance, and they obey the linear mixing law. Therefore,they are the preferred tracer variables in numerical models of the ocean’s carbon cycle (cf. Figure 1). Of allthe carbonate species and carbonate system parameters described above, only pCO2, pH, TCO2, and TA can bedetermined analytically (Dickson et al. 2007). However, if any two parameters and total dissolved boron are known,all parameters ( pCO2, [CO2], [HCO−
3 ], [CO2−3 ], pH, TCO2, and TA) can be calculated for a given T, S, and P (cf.
Zeebe & Wolf-Gladrow 2001).The CaCO3 saturation state of seawater is expressed by �:
� = [Ca2+]sw × [CO2−3 ]sw
K ∗sp
(Continued )
www.annualreviews.org • History of CO2 Chemistry 143
Ann
u. R
ev. E
arth
Pla
net.
Sci.
2012
.40:
141-
165.
Dow
nloa
ded
from
ww
w.a
nnua
lrev
iew
s.or
g A
cces
s pr
ovid
ed b
y U
nive
rsity
of
Cal
ifor
nia
- Sa
nta
Cru
z on
01/
22/1
8. F
or p
erso
nal u
se o
nly.

EA40CH07-Zeebe ARI 1 April 2012 7:44
where [Ca2+]sw and [CO2−3 ]sw are the concentrations of Ca2+ and CO2−
3 in seawater, and K∗sp is the solubility product
of calcite or aragonite, the two major forms of CaCO3, at the in situ conditions of temperature, salinity, and pressure.Values of � > 1 signify supersaturation, and � < 1 signifies undersaturation. Because K∗
sp increases with pressure(the temperature effect is small), there is a transition of the saturation state from � > 1 (calcite-rich) to � < 1(calcite-depleted) in sediments and seawater with depth.
The depth at which � = 1 occurs in the ocean is termed the calcite saturation horizon (a water-column property).Although calcite becomes thermodynamically unstable just below this, dissolution proceeds only slowly. The greaterdepth at which dissolution impacts become noticeable is termed the lysocline (a sediment property). In practice,this is taken as the inflection point in the trend of sedimentary CaCO3 content versus water depth. The depth atwhich the dissolution flux balances the rain flux of calcite to the sediments is known as the calcite compensationdepth (CCD). The CCD is operationally defined and variously taken as the depth at which the CaCO3 content isreduced to values such as 2 or 10 weight percent (wt%).
Furthermore, studying past changes of ocean chemistry allows us to evaluate the current an-thropogenic perturbation in the context of Earth’s history. For instance, we can ask questionssuch as: What was the amplitude of natural variations in ocean chemistry immediately prior toindustrialization (e.g., during the Holocene, over the past 12,000 years)? Are there past eventsthat are comparable in magnitude and timescale with the present ocean acidification caused byhumans, or is it unprecedented in Earth’s history? How did the carbon cycle, climate, and oceanchemistry respond to massive carbon input in the past, and on what timescale was the carbonremoved from the ocean-atmosphere system by natural sequestration?
This article starts with a brief review of the chemistry of CO2 in seawater and the basic controlson ocean carbonate chemistry on different timescales. Ocean chemistry changes during variousgeologic eras are investigated, and past ocean acidification events are examined. Evidence of bioticresponses to past changes of ocean chemistry is also discussed (for more information, see Knoll &Fischer 2011, Zeebe & Ridgwell 2011, Honisch et al. 2012). In the following, Mya (million yearsago) and Ma (mega annum) are used to denote geological dates and durations, respectively.
CHEMISTRY OF CO2 IN SEAWATER
A few basics of seawater carbonate chemistry are summarized in the sidebar, Carbonate Chemistry,and in Figure 1. Additional information can be found elsewhere (e.g., Stumm & Morgan 1996,Zeebe & Wolf-Gladrow 2001, Millero 2006, Dickson et al. 2007). In this section, I emphasize onlya few fundamentals and subtleties of seawater carbonate chemistry to aid the discussion below.
Two Out of Six
The carbonate system can be described by six fundamental parameters in thermodynamic equi-librium: total dissolved inorganic carbon (TCO2), total alkalinity (TA), [CO2], [HCO−
3 ], [CO2−3 ],
and [H+] (see sidebar, Carbonate Chemistry). The concentrations of OH− and partial pressureof carbon dioxide ( pCO2) can be readily calculated using the dissociation constant of water andHenry’s law. Given the first and second dissociation constants of carbonic acid and the definitionsof TCO2 and TA, we have four equations with six unknowns. Thus, if the values of two parametersare known, we are left with four equations and four unknowns, and the system can be solved. Itfollows the fundamental rule that two carbonate system parameters are required to determine thecarbonate chemistry. One parameter is insufficient.
144 Zeebe
Ann
u. R
ev. E
arth
Pla
net.
Sci.
2012
.40:
141-
165.
Dow
nloa
ded
from
ww
w.a
nnua
lrev
iew
s.or
g A
cces
s pr
ovid
ed b
y U
nive
rsity
of
Cal
ifor
nia
- Sa
nta
Cru
z on
01/
22/1
8. F
or p
erso
nal u
se o
nly.

EA40CH07-Zeebe ARI 1 April 2012 7:44
1.95 2.00 2.05 2.10 2.15
2.30
2.35
2.40
2.45
To
tal
alk
ali
nit
y (
mm
ol
kg
–1)
Total dissolved inorganic carbon (mmol kg–1)
6
8
8
8
10
10
10
10 12
12
12
12
5
15
1520
20
30
CaCO3 dissolution
CaCO3 formation
Respiration
Photosynthesis
CO2 invasion CO2 release
CaCO3 dissolution
CaCO3 formation
Respiration
Photosynthesis
CO2 invasion CO2 release
[CO 2
]
Figure 1Effects of various processes on the carbonate chemistry parameters total dissolved inorganic carbon (TCO2),total alkalinity (TA), and [CO2] at temperature Tc = 15◦C (Tc denotes temperature in ◦C), salinity S = 35,and pressure P = 1 atm (see sidebar, Carbonate Chemistry, for definitions). Contours indicate lines ofconstant [CO2] in μmol kg−1. Invasion and release of CO2 into/from the ocean changes only TCO2,whereas photosynthesis and respiration also slightly change TA owing to nitrate uptake and release. CaCO3formation decreases TCO2 and TA in a ratio of 1:2, and, counterintuitively, increases [CO2], although thetotal inorganic carbon concentration has decreased. CaCO3 dissolution has the reverse effect. Modified fromBroecker & Peng (1989) and Zeebe & Wolf-Gladrow (2001).
This rule is frequently ignored, which has led to misinformation in the literature. For in-stance, future atmospheric CO2 concentrations have been compared with pCO2 levels during theCretaceous (∼145 to ∼65 Mya), which may have been as high as 2,000 parts per million byvolume (ppmv). Although at some point in the future, atmospheric CO2 levels might approachvalues similar to those during the Cretaceous, this by no means implies similar surface-oceanchemistry. A surface ocean with TCO2 = 2.4 mmol kg−1 in equilibrium with an atmosphereat pCO2 = 2,000 ppmv would have a calcite saturation state (�c) of 1.1 [Tc = 15◦C (Tc de-notes temperature in ◦C), S = 35]. However, at a higher TCO2 value of 4.9 mmol kg−1, thecalcite saturation state �c would be 4.5 (same Tc and S). The latter example illustrates pos-sible Cretaceous seawater conditions and shows that such an ocean would have had surfacewaters with a favorable carbonate mineral saturation state, despite high pCO2. For simplicity, theabove numbers are based on modern calcium concentrations (for variable calcium, see Tyrrell &Zeebe 2004). The important point is that seawater chemistry comparisons between the Creta-ceous, for instance, and the near future cannot be based on one carbonate system parameter alone(see below).
www.annualreviews.org • History of CO2 Chemistry 145
Ann
u. R
ev. E
arth
Pla
net.
Sci.
2012
.40:
141-
165.
Dow
nloa
ded
from
ww
w.a
nnua
lrev
iew
s.or
g A
cces
s pr
ovid
ed b
y U
nive
rsity
of
Cal
ifor
nia
- Sa
nta
Cru
z on
01/
22/1
8. F
or p
erso
nal u
se o
nly.

EA40CH07-Zeebe ARI 1 April 2012 7:44
Temperature and Salinity
Temperature and salinity are important factors in setting the carbonate chemistry state, particu-larly at the surface. For instance, CO2 is less soluble at higher temperatures, leading to outgassingto the atmosphere and hence locally reduced TCO2 (Figure 1). Conversely, CO2 uptake takesplace predominantly in colder waters, and TCO2 is higher. Hence, warm regions tend to havehigher [CO2−
3 ] and be more saturated with respect to carbonate minerals than colder regions. Assurface-ocean temperatures have varied in the past, both globally as well as regionally (latitudi-nally), so has carbonate chemistry. Also related to changes in climate is the importance of adding(subtracting) freshwater to (from) the oceans as this will reduce (increase) the concentration ofTCO2 and TA in a 1:1 ratio (they are conservative quantities). For instance, the larger ice volumeat the time of the last glacial period, equivalent to the removal of approximately 3% of the waterfrom the ocean (and storage primarily in the great ice sheets of the Northern Hemisphere), wouldhave acted to increase [CO2] and hence atmospheric pCO2—just at a time when ice core recordsof pCO2 show it was at a record low. A multitude of other factors must then come into play tocounter the salinity effect and further drive pCO2 down to glacial concentrations (see Kohfeld &Ridgwell 2009).
CaCO3 Precipitation and Dissolution
The precipitation of CaCO3 decreases TCO2 and TA in a ratio of 1:2, and, counterintuitively, in-creases [CO2], although the inorganic carbon concentration has decreased (Figure 1). Dissolutionhas the reverse effect. For a qualitative understanding, consider the reaction
Ca2+ + 2HCO−3 → CaCO3 + CO2 + H2O, (1)
which indicates that CO2 is liberated during CaCO3 precipitation. Quantitatively, however, theconclusion that [CO2] in solution is increasing by one mole per mole CaCO3 precipitated isincorrect because of buffering. The correct analysis takes into account the decreases of TCO2 andTA in a ratio of 1:2 and the buffer capacity of seawater. That is, the medium gets more acidicbecause the decrease in TA outweighs that of total inorganic carbon; hence, [CO2] increases(Figure 1). For instance, at surface-seawater conditions [TCO2 = 2,000 μmol kg−1, pHT = 8.2(total pH scale), Tc = 15◦C, S = 35], [CO2] increases by only ∼0.03 μmol per μmol CaCO3
precipitated (for more details, see Zeebe & Wolf-Gladrow 2001).Thus, CaCO3 production in the surface ocean and its transport to depth tend to increase
atmospheric CO2. This process represents one component of the ocean’s biological carbon pumpand has been dubbed the CaCO3 counterpump because of its reverse effect relative to the organiccarbon pump, which tends to reduce atmospheric CO2. One ironic consequence of this is that ifmarine calcifiers were to disappear, the resulting drop in the CaCO3 counterpump would constitutea small negative feedback on rising atmospheric CO2 levels in the short term (Zondervan et al.2001, Ridgwell et al. 2007). It is also important that the ocean’s carbonate pump on the timescalediscussed above leads merely to shifts in the vertical distributions of the ocean’s TCO2 and TArather than changes in their inventories. This process can be important in changing surface-ocean chemistry and reducing atmospheric CO2 on timescales shorter than ∼10,000 years (seebelow). On a million-year timescale, on the other hand, the burial of CaCO3 in marine sedimentsrepresents one major pathway to remove carbon from the ocean-atmosphere system.
OCEAN CARBONATE CHEMISTRY CONTROLS
The ocean inventories of TCO2 and TA determine the whole-ocean carbonate chemistry undermost natural conditions. Changes in the TCO2 and TA inventories over time therefore constitute
146 Zeebe
Ann
u. R
ev. E
arth
Pla
net.
Sci.
2012
.40:
141-
165.
Dow
nloa
ded
from
ww
w.a
nnua
lrev
iew
s.or
g A
cces
s pr
ovid
ed b
y U
nive
rsity
of
Cal
ifor
nia
- Sa
nta
Cru
z on
01/
22/1
8. F
or p
erso
nal u
se o
nly.

EA40CH07-Zeebe ARI 1 April 2012 7:44
Atmosphere600
a b
Corg
oxidation
Volcanism
Carbonate/silicate
weathering
Carbonateburial
Corg
burial
AtmosphereBiosphere
Ocean~ 40,000 Pg C
Long- term (rock) reservoir~ 108 Pg C
Deep ocean37,000
Sediments5,000
Biosphere+ soils2,000
Surface ocean1,000
Fossil fuels5,000
Timescale: 101 – 102 years
Timescale:
102 – 103 years
Timescale:
103 – 105 years
Timescale:
> 105 years
Figure 2(a) Surface (exogenic) carbon cycle. Approximate reservoir sizes are in units of petagrams of carbon, Pg C (1 Pg = 1015 g). The grayboxes demarcate reservoirs involved in carbon exchange on the respective timescales. Modified from Zeebe & Ridgwell (2011).(b) Long-term carbon cycle. Note that whereas the silicate weathering feedback is critical in controlling atmospheric CO2, weatheringof silicate rocks does not transfer carbon from the rock reservoir to the surface reservoirs. Abbreviation: Corg, organic carbon.
the major control on the evolution of the carbonate system in seawater (for carbon cycling, seeFigure 2). The characterization of the dominant carbon and TA fluxes to and from the oceanon different timescales is hence fundamental to understanding controls on ocean CO2 chemistry(e.g., Sundquist 1986).
10- to 100-Year Timescale
On timescales shorter than approximately 100 years, the natural reservoirs that exchange carbon atEarth’s surface include the atmosphere [preanthropogenic inventory, ∼600 petagrams of carbon(Pg C); 1 Pg = 1015 g], the biosphere (∼500 Pg C), soils (∼1,500 Pg C), and the surface ocean(TCO2 ∼ 1,000 Pg C). Combined, these reservoirs hold less than ∼4,000 Pg C (see Figure 2a).Fossil fuel reserves, on the other hand, have been estimated at ∼5,000 Pg C (excluding hydrates).It is thus immediately clear that the release of several thousands of petagrams of carbon over a fewhundred years will overwhelm the capacity of these surface reservoirs to absorb carbon.
1,000-Year Timescale
On timescales on the order of ∼1,000 years, the deep ocean reservoir becomes an importantcomponent of the surface carbon cycle (modern whole-ocean inventory, TCO2 ∼ 38,000 Pg C;see Figure 2a). In fact, most of the anthropogenic carbon will eventually be absorbed by theocean and neutralized by reaction with carbonate sediments. Once emissions have ceased andthe ocean has had time to fully mix on a ∼1,000-year timescale, a new equilibrium is establishedbetween ocean and atmosphere, and the CO2 is partitioned in a ∼1:3 ratio between atmosphereand ocean (Archer et al. 1998, Archer 2005). The greater the total release, the larger the exhaustion
www.annualreviews.org • History of CO2 Chemistry 147
Ann
u. R
ev. E
arth
Pla
net.
Sci.
2012
.40:
141-
165.
Dow
nloa
ded
from
ww
w.a
nnua
lrev
iew
s.or
g A
cces
s pr
ovid
ed b
y U
nive
rsity
of
Cal
ifor
nia
- Sa
nta
Cru
z on
01/
22/1
8. F
or p
erso
nal u
se o
nly.

EA40CH07-Zeebe ARI 1 April 2012 7:44
of oceanic buffering, and hence the greater the final airborne fraction. It is thought that climatechange will both warm the ocean surface and increase net precipitation and ice melting at highlatitudes, with the result that vertical stratification in the ocean will increase at both low and highlatitudes. This is expected to slow the propagation of the TCO2 and carbonate chemistry anomalyinto the ocean interior on a timescale of decades to centuries. Furthermore, a warmer overall oceanwill result in a higher airborne CO2 fraction because of the effects of temperature on the solubilityof CO2. After ∼1,000 years, with no additional process operating, the ocean would be left with areduced pH (i.e., increased hydrogen ion activity), and the atmosphere would be left with a higherlevel of pCO2. The carbon has been distributed (or partitioned) between atmosphere and ocean.The subsequent steps of fossil fuel neutralization include carbonate sediment dissolution in thedeep sea and terrestrial weathering of carbonate and silicate minerals. Note that near-completeremoval of fossil fuel carbon from the atmosphere will take tens to hundreds of thousands of years(e.g., Archer 2005, Uchikawa & Zeebe 2008, Zachos et al. 2008).
The oceanic inventories of TCO2 and TA can be considered essentially constant on a timescaleof ∼1,000 years under natural steady-state conditions. Exceptions to this are rapid carbon inputsfrom otherwise long-term storage reservoirs such as methane hydrates or fossil fuels, which arecurrently combusted by humans. Other examples include catastrophic events from possible impactsover carbonate platforms, or other abrupt carbon releases from geologic reservoirs (e.g., during thePaleocene-Eocene Thermal Maximum, or PETM; see below). In the case of rapid CO2 additionto the ocean-atmosphere system, carbonate sediment dissolution may occur on timescales shorterthan the usual response time of >1,000 years (see next section).
1,000- to 100,000-Year Timescale
On timescales of 1,000 to 100,000 years, fluxes between reactive carbonate sediments (∼5,000 PgC) and the ocean’s inventories of TCO2 and TA must also be considered. For instance, oceanicinventories may vary during glacial-interglacial cycles (see Calcite Compensation, below). Themagnitude of these changes is, however, limited, as are the associated changes in ocean chemistryand atmospheric CO2. The fate of anthropogenic CO2 on this timescale involves reaction withdeep-sea carbonate sediments and terrestrial carbonates; this reaction will ultimately facilitate car-bon removal from the ocean-atmosphere system. (This process is termed fossil fuel neutralization;see Broecker & Takahashi 1977, Sundquist 1986, and Archer et al. 1998.)
Changes in the ocean’s carbon pumps can also affect ocean carbonate chemistry on the 1,000-to 100,000-year timescale. Changes in the strength of the pumps can lead to shifts in the verticaldistribution of the ocean’s TCO2 and TA, while not affecting their inventories. This process is be-lieved to be important for understanding changes of surface-ocean chemistry and atmospheric CO2
on glacial-interglacial timescales. Whereas surface-ocean changes during the glacial-interglacialcycles were ∼80 ppmv in pCO2 and ∼0.2 units in pH, deep-ocean carbonate chemistry changeswere probably much smaller (see below and Zeebe & Marchitto 2010).
>100,000-Year Timescale
A large amount of carbon is locked up in Earth’s crust as carbonate carbon (∼70 × 106 Pg C) and aselemental carbon in shales and coals (∼20 × 106 Pg C). On tectonic timescales (>100,000 years),this reservoir is active; imbalances in the fluxes to and from this pool can lead to large changesin TCO2, TA, and atmospheric CO2 (Figure 2b). The balance among long-term carbon fluxescontrols atmospheric CO2 and ocean inventories of TCO2 and TA on this timescale (e.g., Walkeret al. 1981, Berner et al. 1983, Caldeira 1992, Zeebe & Caldeira 2008).
148 Zeebe
Ann
u. R
ev. E
arth
Pla
net.
Sci.
2012
.40:
141-
165.
Dow
nloa
ded
from
ww
w.a
nnua
lrev
iew
s.or
g A
cces
s pr
ovid
ed b
y U
nive
rsity
of
Cal
ifor
nia
- Sa
nta
Cru
z on
01/
22/1
8. F
or p
erso
nal u
se o
nly.

EA40CH07-Zeebe ARI 1 April 2012 7:44
Figure 2 illustrates the fundamental difference between short-term carbon cycling(Figure 2a)—on, for example, a 10- to 100-year timescale—and long-term carbon cycling(Figure 2b). The two distinct cycles involve vastly different reservoir sizes and different sets ofcontrols on atmospheric CO2 and ocean chemistry. Therefore, carbon cycling and ocean chem-istry conditions during long-term steady states (e.g., over millions of years) cannot be comparedwith rapid, transient events (e.g., over the next few centuries).
Biological Pump
Changes in the strength of the biological pump in the past have modulated the TCO2 concentrationand, by inference, the acidity (pH) at the surface. For instance, it has been hypothesized that duringthe last glacial period, the strength of the biological pump was greater, meaning lower atmosphericpCO2 and higher pH. Reconstructions of changes in ocean surface pH based on the boron isotopecomposition of marine carbonates (boron speciation in seawater being pH-sensitive) suggest thatthe glacial surface ocean had a pH of 0.1 to 0.2 units higher compared with the pH of interglacialperiods (e.g., Sanyal et al. 1995, Honisch & Hemming 2005, Foster 2008). Of course, rather thanchanging the inventory of TCO2, the strength of the biological pump only repartitions TCO2,primarily vertically.
Calcite Compensation
Calcite compensation maintains the balance between CaCO3 weathering fluxes into the ocean andCaCO3 burial fluxes in marine sediments on a timescale of 5,000 to 10,000 years (e.g., Broecker& Peng 1987, Zeebe & Westbroek 2003). In steady state, the riverine flux of Ca2+ and CO2−
3 ionsfrom weathering must be balanced by burial of CaCO3 in the sea; otherwise, [Ca2+] and [CO2−
3 ]would rise or fall. The feedback that maintains this balance works as follows. Assume there is anexcess weathering influx of Ca2+ and CO2−
3 over burial of CaCO3 (system is out of steady state).Then, the concentrations of Ca2+ and CO2−
3 in seawater increase, leading to an increase of theCaCO3 saturation state. This increase, in turn, leads to a deepening of the saturation horizon andto an increased burial of CaCO3 just until the burial again balances the influx. The new steady-statebalance is restored at higher [CO2−
3 ] than before.
Weathering of Carbonate and Silicate Rocks
Carbonate mineral weathering on continents may be represented by
CaCO3 + CO2 + H2O → Ca2+ + 2HCO−3 (2)
whereas the reverse reaction (Equation 1) represents the precipitation and subsequent burialof carbonates in marine sediments. As described above, carbonate weathering (input to theocean) and burial (output) are balanced via calcite compensation on a relatively short timescale(∼10,000 years). For each mole of CO2 taken up during CaCO3 weathering, one mole of CO2
is also released during CaCO3 precipitation. The net carbon balance for the combined ocean-atmosphere system on timescales over which carbonate weathering is balanced by carbonateburial is therefore zero. For this reason, carbonate weathering and burial are often ignoredin models of the long-term carbon cycle over millions of years (see, however, Ridgwell et al.2003).
www.annualreviews.org • History of CO2 Chemistry 149
Ann
u. R
ev. E
arth
Pla
net.
Sci.
2012
.40:
141-
165.
Dow
nloa
ded
from
ww
w.a
nnua
lrev
iew
s.or
g A
cces
s pr
ovid
ed b
y U
nive
rsity
of
Cal
ifor
nia
- Sa
nta
Cru
z on
01/
22/1
8. F
or p
erso
nal u
se o
nly.
EA40CH07-Zeebe ARI 1 April 2012 7:44
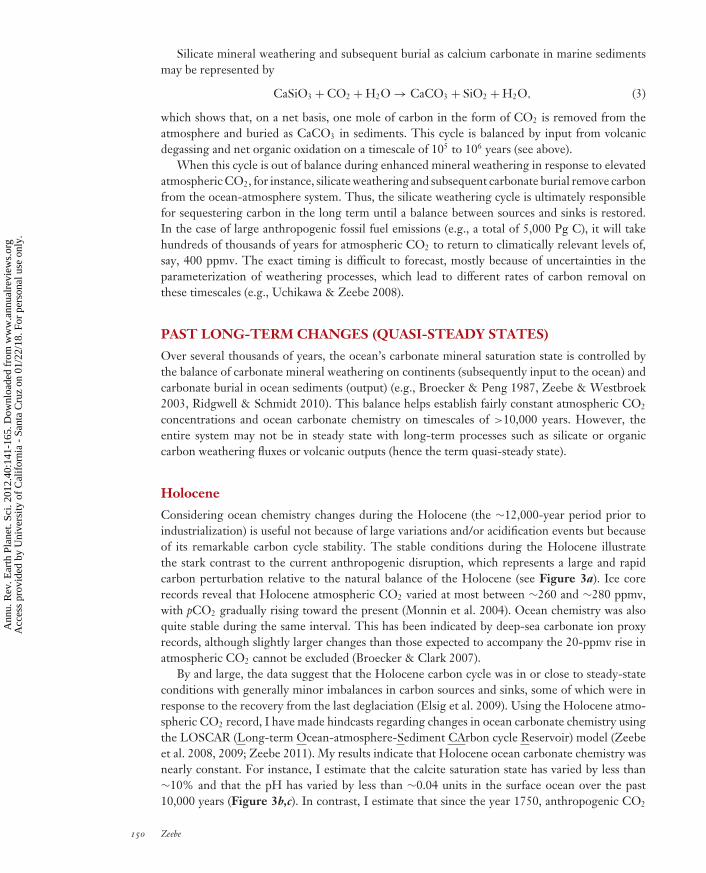
Silicate mineral weathering and subsequent burial as calcium carbonate in marine sedimentsmay be represented by
CaSiO3 + CO2 + H2O → CaCO3 + SiO2 + H2O, (3)
which shows that, on a net basis, one mole of carbon in the form of CO2 is removed from theatmosphere and buried as CaCO3 in sediments. This cycle is balanced by input from volcanicdegassing and net organic oxidation on a timescale of 105 to 106 years (see above).
When this cycle is out of balance during enhanced mineral weathering in response to elevatedatmospheric CO2, for instance, silicate weathering and subsequent carbonate burial remove carbonfrom the ocean-atmosphere system. Thus, the silicate weathering cycle is ultimately responsiblefor sequestering carbon in the long term until a balance between sources and sinks is restored.In the case of large anthropogenic fossil fuel emissions (e.g., a total of 5,000 Pg C), it will takehundreds of thousands of years for atmospheric CO2 to return to climatically relevant levels of,say, 400 ppmv. The exact timing is difficult to forecast, mostly because of uncertainties in theparameterization of weathering processes, which lead to different rates of carbon removal onthese timescales (e.g., Uchikawa & Zeebe 2008).
PAST LONG-TERM CHANGES (QUASI-STEADY STATES)
Over several thousands of years, the ocean’s carbonate mineral saturation state is controlled bythe balance of carbonate mineral weathering on continents (subsequently input to the ocean) andcarbonate burial in ocean sediments (output) (e.g., Broecker & Peng 1987, Zeebe & Westbroek2003, Ridgwell & Schmidt 2010). This balance helps establish fairly constant atmospheric CO2
concentrations and ocean carbonate chemistry on timescales of >10,000 years. However, theentire system may not be in steady state with long-term processes such as silicate or organiccarbon weathering fluxes or volcanic outputs (hence the term quasi-steady state).
Holocene
Considering ocean chemistry changes during the Holocene (the ∼12,000-year period prior toindustrialization) is useful not because of large variations and/or acidification events but becauseof its remarkable carbon cycle stability. The stable conditions during the Holocene illustratethe stark contrast to the current anthropogenic disruption, which represents a large and rapidcarbon perturbation relative to the natural balance of the Holocene (see Figure 3a). Ice corerecords reveal that Holocene atmospheric CO2 varied at most between ∼260 and ∼280 ppmv,with pCO2 gradually rising toward the present (Monnin et al. 2004). Ocean chemistry was alsoquite stable during the same interval. This has been indicated by deep-sea carbonate ion proxyrecords, although slightly larger changes than those expected to accompany the 20-ppmv rise inatmospheric CO2 cannot be excluded (Broecker & Clark 2007).
By and large, the data suggest that the Holocene carbon cycle was in or close to steady-stateconditions with generally minor imbalances in carbon sources and sinks, some of which were inresponse to the recovery from the last deglaciation (Elsig et al. 2009). Using the Holocene atmo-spheric CO2 record, I have made hindcasts regarding changes in ocean carbonate chemistry usingthe LOSCAR (Long-term Ocean-atmosphere-Sediment CArbon cycle Reservoir) model (Zeebeet al. 2008, 2009; Zeebe 2011). My results indicate that Holocene ocean carbonate chemistry wasnearly constant. For instance, I estimate that the calcite saturation state has varied by less than∼10% and that the pH has varied by less than ∼0.04 units in the surface ocean over the past10,000 years (Figure 3b,c). In contrast, I estimate that since the year 1750, anthropogenic CO2
150 Zeebe
Ann
u. R
ev. E
arth
Pla
net.
Sci.
2012
.40:
141-
165.
Dow
nloa
ded
from
ww
w.a
nnua
lrev
iew
s.or
g A
cces
s pr
ovid
ed b
y U
nive
rsity
of
Cal
ifor
nia
- Sa
nta
Cru
z on
01/
22/1
8. F
or p
erso
nal u
se o
nly.

EA40CH07-Zeebe ARI 1 April 2012 7:44
0
500
1,000
1,500
2,000A
tmo
sph
eri
c C
O2 (
pp
mv
)
a
Ice core data Mauna Loa data
5,000 Pg C
Projections:
Calcite
Aragonite
0
2
4
6
Ca
CO
3 s
atu
rati
on
bReconstruction
7.4
7.6
7.8
8.0
8.2
8.4
Su
rfa
ce-o
cea
n p
H
cReconstruction
Ocean data (HOT)
−0.8
−0.6
−0.4
−0.2
0
pH
de
cline
3,500 Pg C
6000 BCE 4000 BCE 2000 BCE 0 2000 CE
Year
Figure 3Holocene versus Anthropocene. (a) Dark yellow diamonds: Holocene atmospheric CO2 concentrations fromice cores (Monnin et al. 2004); red diamonds: CO2 measured at Mauna Loa Observatory, Hawaii (Tans2009); lines: projections based on carbon input of 5,000 Pg C (blue) and 3,500 Pg C ( green) over ∼500 yearsusing the LOSCAR (Long-term Ocean-atmosphere-Sediment CArbon cycle Reservoir) carbon cycle model(Zeebe et al. 2008, 2009; Zeebe 2011). (b) Modeled (reconstructed for the past and projected for the future at5,000 Pg C and 3,500 Pg C) CaCO3 saturation state of surface seawater. Solid lines: calcite saturation;dashed line: aragonite saturation. (c) Surface-ocean pH. Lines: model results of reconstructed and future pHfor 5,000 Pg C and 3,500 Pg C; red diamonds: Hawaii Ocean Time-series (HOT) pH data at 25◦C (Doreet al. 2009).
emissions have led to a decrease of surface-ocean pH by ∼0.1 units. If CO2 emissions continueunabated, surface-ocean calcite saturation state will drop to approximately one-third of its prein-dustrial value by the year 2300, whereas pH will decline by approximately 0.7 units (Figure 3b,c).
Late Pleistocene Glacial-Interglacial Changes
Atmospheric CO2 has varied periodically between ∼200 and ∼280 ppmv over the past800,000 years (Siegenthaler et al. 2005, Luthi et al. 2008). These glacial-interglacial cycles wereaccompanied by periodic changes in surface-ocean carbonate chemistry, whereas deep-sea pHand carbonate ion concentration are believed to have been relatively stable (Zeebe & Marchitto2010). Compared with interglacials, glacial surface-ocean conditions were characterized by lowertemperatures, higher pH, and higher carbonate ion concentration (e.g., Sanyal et al. 1995,
www.annualreviews.org • History of CO2 Chemistry 151
Ann
u. R
ev. E
arth
Pla
net.
Sci.
2012
.40:
141-
165.
Dow
nloa
ded
from
ww
w.a
nnua
lrev
iew
s.or
g A
cces
s pr
ovid
ed b
y U
nive
rsity
of
Cal
ifor
nia
- Sa
nta
Cru
z on
01/
22/1
8. F
or p
erso
nal u
se o
nly.

EA40CH07-Zeebe ARI 1 April 2012 7:44
Honisch & Hemming 2005, Foster 2008). For example, an interglacial surface-seawater sam-ple at Tc = 15◦C, S = 35, TCO2 = 2,000 μmol kg−1, and TA = 2,284 μmol kg−1 has a pCO2
of 280 ppmv, pHT = 8.17, and [CO2−3 ] = 198 μmol kg−1. Corresponding glacial conditions may
have been Tc = 12◦C, S = 36, TCO2 = 2,006 μmol kg−1, and TA = 2,353 μmol kg−1, whichyield a pCO2 of 200 ppmv, pHT = 8.30, and [CO2−
3 ] = 238 μmol kg−1. These values indicatea difference in glacial-interglacial saturation state of approximately 20%. Whereas this scenarioassumes a 3% higher glacial TA, various other scenarios are possible, which would also modifythe calculated pH change (e.g., Archer et al. 2000). Nevertheless, it illustrates the sign and orderof magnitude of glacial-interglacial changes in surface-ocean carbonate chemistry.
Considering the time evolution of the system over glacial-interglacial cycles, it is clear thatsurface-ocean pH and saturation state declined during the course of a deglaciation. One mightthus think of a deglaciation as an acidification event, albeit a truly slow and moderate one. In termsof rate and magnitude, it is important to realize that a deglaciation is not a past analog for thecurrent anthropogenic perturbation. For example, the rate of surface-ocean pH change during themost recent deglaciation may be estimated as 0.1–0.2 units per 10,000 years, or 0.001–0.002 unitsper century on average. In contrast, under Business-as-USual CO2 emissions, humans may causea surface-ocean pH change of 0.7 units per 500 years, or 0.14 units per century on average. Thus,surface-ocean chemistry changes during the Anthropocene are expected to be approximately threeto seven times larger and 70 times faster than during a deglaciation.
The late Pleistocene changes in surface-ocean carbonate chemistry have been invoked to explainchanges in shell weights of surface-dwelling foraminifera. For example, calcite shells of differentplanktonic foraminiferal species recovered from deep-sea sediment cores in the North AtlanticOcean and Indian Ocean show higher shell weights during the last glacial period compared withthe Holocene (e.g., Barker & Elderfield 2002, de Moel et al. 2009). The authors of these studiessuggest that lower pCO2 and elevated surface [CO2−
3 ] caused higher initial shell weights duringthe last glacial stage. On the other hand, shell weights of planktonic foraminifera have been usedas an indicator of carbonate sediment dissolution and thus as a proxy for [CO2−
3 ] in the deepsea rather than at the surface (e.g., Broecker & Clark 2003). Clearly, the issue is complicated byvarious factors, including possible effects of growth temperature, [CO2−
3 ], nutrients, and otherenvironmental parameters on initial shell weight, as well as dissolution in sediments and/or thewater column (e.g., Bijma et al. 2002). Interrelations among coccolithophore species, coccolithweight/chemistry, primary production, and the carbon cycle appear to be even more complex (fordiscussions, see Zondervan et al. 2001, Beaufort et al. 2007, Rickaby et al. 2007).
Pleistocene and Pliocene
Records of atmospheric CO2 in ice cores are limited to the oldest samples available in Antarcticice cores, which go back at most ∼1 Ma. Beyond that, estimates of paleo-pCO2 levels and oceanchemistry must rely on other proxies. On the basis of stable boron isotopes in foraminifera,glacial pCO2 levels before the Mid-Pleistocene Transition (∼1 Mya) were estimated to have beenapproximately 30 ppmv higher than after the transition. Estimates of interglacial values before theMid-Pleistocene Transition appear similar to those obtained from ice cores during the late Pleis-tocene (Honisch et al. 2009). Stable boron isotopes are actually a proxy for seawater pH, and oneother CO2 system parameter is required to reconstruct atmospheric CO2. Regardless, the boronisotope data indicate that surface-ocean pH over the past 2 Ma has varied periodically between∼8.1 and ∼8.3 (Honisch et al. 2009). So far, no major excursions or ocean acidification events havebeen identified during the Pleistocene. The available Pleistocene data indicate periodic variationsin ocean carbonate chemistry during the past 2 Ma. These variations are part of the natural
152 Zeebe
Ann
u. R
ev. E
arth
Pla
net.
Sci.
2012
.40:
141-
165.
Dow
nloa
ded
from
ww
w.a
nnua
lrev
iew
s.or
g A
cces
s pr
ovid
ed b
y U
nive
rsity
of
Cal
ifor
nia
- Sa
nta
Cru
z on
01/
22/1
8. F
or p
erso
nal u
se o
nly.

EA40CH07-Zeebe ARI 1 April 2012 7:44
glacial-interglacial climate cycles and are restricted within remarkably stable lower and upperlimits (between ∼180 and ∼300 ppmv for pCO2 and between ∼8.1 and ∼8.3 for surface-oceanpHT).
More estimates of surface-ocean pH and atmospheric CO2 are now becoming available for thePliocene epoch (Pagani et al. 2010, Bartoli et al. 2011). Stable boron isotopes indicate variationsin surface-ocean pHT between ∼8.0 and ∼8.3 and a gradual pCO2 decline from 4.5 Mya to 2 Mya,with extreme values ranging between ∼200 and ∼400 ppmv (Bartoli et al. 2011). Over the sametime interval, alkenone data suggest a similar pCO2 decline, with extreme pCO2 values rangingbetween ∼200 and ∼525 ppmv (Pagani et al. 2010). Alkenone-based pCO2 estimates derive fromrecords of the carbon isotope fractionation that occurred during marine photosynthetic carbonfixation. Several lines of evidence suggest that the carbon isotope fractionation depends on CO2
levels (e.g., Pagani et al. 2010). These reconstructions have large uncertainties. Nevertheless,taking the results at face value, one may estimate the maximum change in surface-ocean saturationstate of calcite over the past 4 Ma. The cold periods may be characterized by pHT = 8.3 andpCO2 = 200 ppmv, which yield �c = 6.1 (Tc = 15◦C, S = 35). The warm Pliocene periods(∼4◦C warmer than the preindustrial period) may be characterized by pHT = 8.0 and pCO2 =525 ppmv, which yield �c = 4.6 (Tc = 19◦C, S = 35). By and large, the combined evidence forthe Pliocene and Pleistocene periods suggests that over the past 4 Ma, ocean carbonate chemistryhas experienced relatively slow changes on timescales of >10,000 years, with atmospheric CO2
varying roughly between 200 and 500 ppmv.
Cenozoic and Phanerozoic
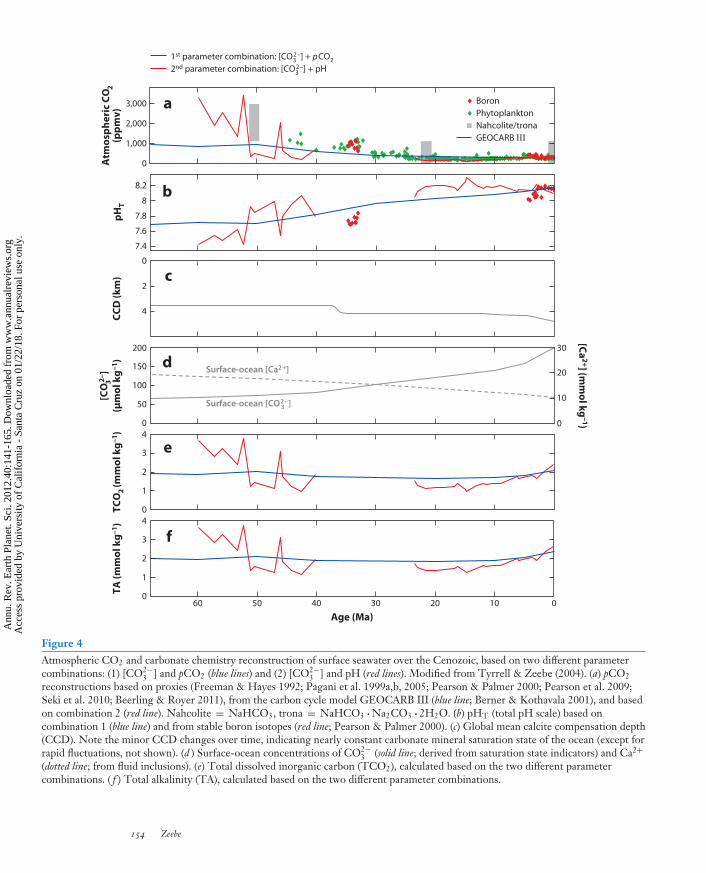
One approach to reconstruct ocean chemistry over the Cenozoic (the past ∼65 Ma) is based onestimates of past atmospheric CO2 concentrations and the ocean’s carbonate mineral saturationstate (e.g., Sundquist 1986, Broecker & Sanyal 1998, Zeebe 2001). Deep-sea sediment coresreveal that the long-term steady-state position of the calcite compensation depth (CCD) overthe past 100 to 150 Ma did not vary dramatically; rather, it gradually deepened slightly towardthe present (for a summary, see Tyrrell & Zeebe 2004 and Figure 4). This suggests a moreor less constant carbonate mineral saturation state of the ocean over the Cenozoic, except forthe Eocene-Oligocene transition (∼34 Mya), when the CCD rapidly deepened permanently byseveral hundred meters. A recent study indicates a more dynamic CCD on shorter timescales—for instance, during the Eocene in the Equatorial Pacific (Palike et al. 2009). Nevertheless, onlong timescales, the ocean’s carbonate chemistry over the Cenozoic may be reconstructed on thebasis of saturation state estimates and paleo-pCO2 reconstructions (e.g., Tyrrell & Zeebe 2004,Ridgwell 2005, Goodwin et al. 2009, Stuecker & Zeebe 2010).
Although the details of the reconstructions can vary substantially—mostly depending onthe different paleo-pCO2 estimates—several trends appear to be robust. Atmospheric CO2
concentrations were higher during the early Cenozoic and have declined from a few thousandparts per million by volume to 200–300 ppmv during the late Pleistocene (Figure 4). Whereassurface-ocean saturation state was nearly constant over this period of time, surface-ocean pHT
was lower during the early Cenozoic (perhaps ∼7.6) and has gradually increased to its mod-ern value of approximately 8.2 (see Figure 4 and Tyrrell & Zeebe 2004, Ridgwell & Zeebe2005). These are long-term trends that do not resolve possible large short-term variations duringocean acidification events such as the PETM (see below). Furthermore, low surface-ocean pHduring multimillion-year periods of the Paleocene or Cretaceous, for instance, are no analogsfor the centuries to come because of different seawater carbonate mineral saturation states (seebelow).
www.annualreviews.org • History of CO2 Chemistry 153
Ann
u. R
ev. E
arth
Pla
net.
Sci.
2012
.40:
141-
165.
Dow
nloa
ded
from
ww
w.a
nnua
lrev
iew
s.or
g A
cces
s pr
ovid
ed b
y U
nive
rsity
of
Cal
ifor
nia
- Sa
nta
Cru
z on
01/
22/1
8. F
or p
erso
nal u
se o
nly.
EA40CH07-Zeebe ARI 1 April 2012 7:44
0
1,000
2,000
3,000A
tmo
sph
eri
c C
O2
(pp
mv
) a Boron
Phytoplankton
Nahcolite/trona
GEOCARB III
1st parameter combination: [CO32–] + pCO2
2nd parameter combination: [CO32–] + pH
Surface-ocean [CO2–]3
Surface-ocean [Ca2+]
7.4
7.6
7.8
8
8.2
pH
T
b
0
2
4
CC
D (
km
) c
0
50
100
150
200
[CO
32–]
(µm
ol
kg
–1) d
0
10
20
30
[Ca
2+] (m
mo
l kg
–1)
0
1
2
3
4
TC
O2
(mm
ol
kg
–1)
e
01020304050600
1
2
3
4
Age (Ma)
TA
(m
mo
l k
g–
1)
f
Figure 4Atmospheric CO2 and carbonate chemistry reconstruction of surface seawater over the Cenozoic, based on two different parametercombinations: (1) [CO2−
3 ] and pCO2 (blue lines) and (2) [CO2−3 ] and pH (red lines). Modified from Tyrrell & Zeebe (2004). (a) pCO2
reconstructions based on proxies (Freeman & Hayes 1992; Pagani et al. 1999a,b, 2005; Pearson & Palmer 2000; Pearson et al. 2009;Seki et al. 2010; Beerling & Royer 2011), from the carbon cycle model GEOCARB III (blue line; Berner & Kothavala 2001), and basedon combination 2 (red line). Nahcolite = NaHCO3, trona = NaHCO3 · Na2CO3 · 2H2O. (b) pHT (total pH scale) based oncombination 1 (blue line) and from stable boron isotopes (red line; Pearson & Palmer 2000). (c) Global mean calcite compensation depth(CCD). Note the minor CCD changes over time, indicating nearly constant carbonate mineral saturation state of the ocean (except forrapid fluctuations, not shown). (d ) Surface-ocean concentrations of CO2−
3 (solid line; derived from saturation state indicators) and Ca2+(dotted line; from fluid inclusions). (e) Total dissolved inorganic carbon (TCO2), calculated based on the two different parametercombinations. ( f ) Total alkalinity (TA), calculated based on the two different parameter combinations.
154 Zeebe
Ann
u. R
ev. E
arth
Pla
net.
Sci.
2012
.40:
141-
165.
Dow
nloa
ded
from
ww
w.a
nnua
lrev
iew
s.or
g A
cces
s pr
ovid
ed b
y U
nive
rsity
of
Cal
ifor
nia
- Sa
nta
Cru
z on
01/
22/1
8. F
or p
erso
nal u
se o
nly.

EA40CH07-Zeebe ARI 1 April 2012 7:44
The question arises whether the long-term trends in ocean carbonate chemistry through-out the Cenozoic had any effect on the evolution of marine calcifying organisms. However, ifspecies evolution were sensitive to carbonate mineral saturation state, little effect is to be expectedbecause saturation state appears to have been nearly constant over the Cenozoic. Regarding coc-colithophores, a trend toward smaller cell sizes in the Oligocene (∼34 to ∼23 Mya) relative tothe Eocene (∼55 to ∼34 Mya) has been suggested on the basis of deep-sea sediment records(Henderiks & Pagani 2008). Henderiks & Pagani (2008) speculated that the size trend in thehaptophyte algae may reflect a response to increased CO2 limitation associated with the de-cline in atmospheric CO2 across the Eocene-Oligocene transition. If so, this would representa CO2-related effect on photosynthesis and cell growth rather than on calcification. Regardingplanktonic foraminifera, a trend toward larger test sizes in low-latitude species has been reported,particularly since the end of the Miocene (Schmidt et al. 2004). Schmidt et al. (2004) suggestedthat the size increase was a response to intensified surface-water stratification in low latitudes.Changes in Cenozoic carbonate chemistry appear unlikely to have caused the shell-size increasein foraminifera, emphasizing the importance of other functional correlations with shell size. Forexample, surface-water changes in CO2 at the end of the Miocene (∼23 to ∼5 Mya) seem rathersmall compared with those during the Paleogene. Thus, if dissolved CO2 or pH were importantfactors in determining shell size in planktonic foraminifera, one would expect large changes duringthe Paleogene (∼65 to ∼23 Mya). This is not the case.
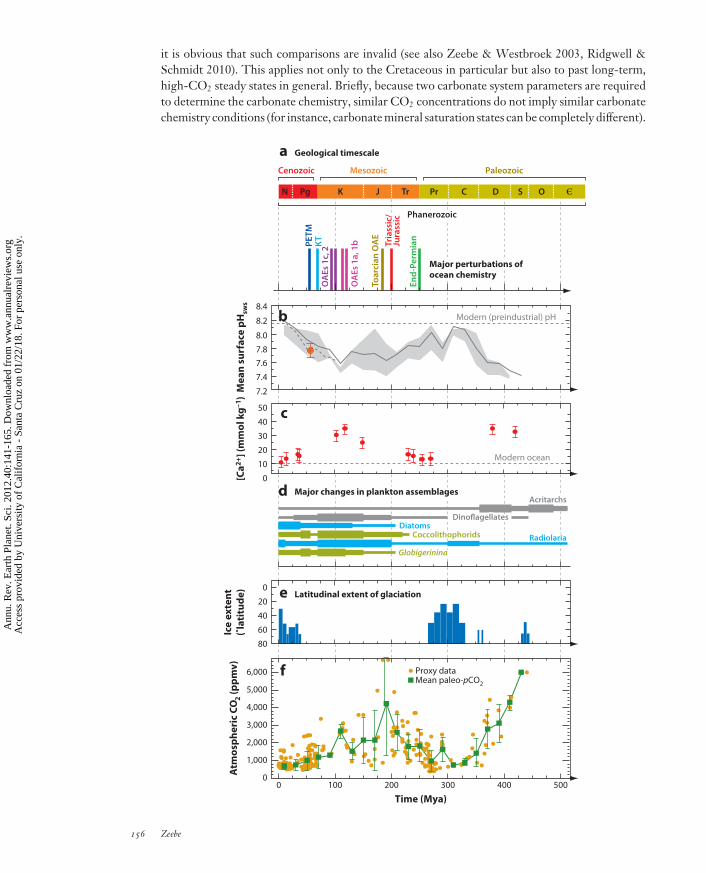
Lastly, one could ask whether long-term changes in ocean carbonate chemistry could haveinfluenced features such as the distribution of coral reefs throughout the Cenozoic. On the basisof geologic evidence in the continental United States, Opdyke & Wilkinson (1993) suggesteda ∼10◦ latitudinal reduction in areal extent of reefal/oolitic carbonate accumulation betweenthe Cretaceous and the Holocene, with a gradual decrease toward the present. These authorsfocused mostly on carbonate mineral saturation state and sea-surface temperature as environmentalparameters that control the latitudinal extent of reefs. In this context, a recent study suggestsrapid poleward range expansion of tropical reef corals around Japan over the past 80 years inresponse to rising sea-surface temperatures (Yamano et al. 2011). In contrast, on the basis of anextensive data set of paleolatitudinal distribution of reef sites, Kiessling (2001) concluded thatneither the width of the tropical reef zone nor the total latitudinal range of reefs is correlated withpaleotemperature estimates. He inferred a fairly wide reef zone during the Cretaceous and earlyPaleogene and an exceptionally wide tropical reef zone in the late Paleocene and Eocene, relativeto the modern latitudinal boundaries. The bottom line is that these studies do not seem to indicateany obvious relationships between the distribution of reefs and changes in seawater CO2 or pH,for example, over the Cenozoic (see Figure 4). As mentioned above, no significant relationshipsare to be expected because the ocean’s long-term saturation state appears to have been nearlyconstant throughout the Cenozoic. In contrast, rapid short-term ocean acidification events suchas the PETM (∼55 Mya) have been identified as the cause for ancient reef crises (e.g., Kiessling& Simpson 2011). Long-term changes in ocean carbonate chemistry over the past 500 Ma aresummarized in Figure 5 (see Ridgwell 2005, Ridgwell & Zeebe 2005, Kump et al. 2009).
The Cretaceous Is Not an Analog for the Near Future
As pointed out above, comparisons between the Cretaceous and the near future are frequently madeto suggest that marine calcification will not be impaired in a future high-CO2 world. The evidencecited for this is usually based on the occurrence of massive carbonate deposits during the Cretaceoussuch as the White Cliffs of Dover—carbonate formations that consist of coccolithophore calcite.Given the basics of carbon cycling and controls on seawater carbonate chemistry as reviewed above,
www.annualreviews.org • History of CO2 Chemistry 155
Ann
u. R
ev. E
arth
Pla
net.
Sci.
2012
.40:
141-
165.
Dow
nloa
ded
from
ww
w.a
nnua
lrev
iew
s.or
g A
cces
s pr
ovid
ed b
y U
nive
rsity
of
Cal
ifor
nia
- Sa
nta
Cru
z on
01/
22/1
8. F
or p
erso
nal u
se o
nly.
EA40CH07-Zeebe ARI 1 April 2012 7:44
it is obvious that such comparisons are invalid (see also Zeebe & Westbroek 2003, Ridgwell &Schmidt 2010). This applies not only to the Cretaceous in particular but also to past long-term,high-CO2 steady states in general. Briefly, because two carbonate system parameters are requiredto determine the carbonate chemistry, similar CO2 concentrations do not imply similar carbonatechemistry conditions (for instance, carbonate mineral saturation states can be completely different).
Cenozoic Mesozoic Paleozoic
PhanerozoicPhanerozoic
Major perturbations ofMajor perturbations ofocean chemistryocean chemistry
Phanerozoic
GlobigerininaGlobigerinina
CoccolithophoridsCoccolithophorids RadiolariaRadiolaria
DinoflagellatesDinoflagellates
AcritarchsAcritarchs
Globigerinina
Coccolithophorids Radiolaria
DinoflagellatesDiatoms
AcritarchsMajor changes in plankton assemblagesMajor changes in plankton assemblagesMajor changes in plankton assemblagesd
0
4,000
3,000
Proxy data
2,000
1,000
5,000
6,000
0
Time (Mya)
Mean paleo-pCO2
100 200 300 400 500
f
Atm
osp
he
ric
CO
2 (
pp
mv
)
Latitudinal extent of glaciation
Geological timescale
80
60
40
20
0 e
Ice
ex
ten
t
(˚la
titu
de
)
c
0
10
20
30
40
50
Modern ocean
[Ca
2+
] (m
mo
l k
g–
1)
Modern (preindustrial) pH
Me
an
su
rfa
ce p
H sw
s 8.4
8.2
8.0
7.8
7.6
7.4
7.2
Major perturbations ofocean chemistry
a
PE
TM
OA
Es
1c,
2
OA
Es
1a
, 1bK
T
Toa
rcia
n O
AE
Tria
ssic
/Ju
rass
ic
En
d-P
erm
ian
Tr PrPgN K J C D S O Є
b
156 Zeebe
Ann
u. R
ev. E
arth
Pla
net.
Sci.
2012
.40:
141-
165.
Dow
nloa
ded
from
ww
w.a
nnua
lrev
iew
s.or
g A
cces
s pr
ovid
ed b
y U
nive
rsity
of
Cal
ifor
nia
- Sa
nta
Cru
z on
01/
22/1
8. F
or p
erso
nal u
se o
nly.

EA40CH07-Zeebe ARI 1 April 2012 7:44
The anthropogenic perturbation represents a transient event with massive carbon release over afew hundred years. In contrast, the Cretaceous, for instance, represents a long-term steady-stateinterval over millions of years. As a result, the timescales involved (centuries versus millions ofyears), reservoir sizes (a few thousand petagrams of carbon versus 108 Pg C), and controls oncarbonate chemistry are fundamentally different (see above).
The carbonate mineral saturation state of the ocean is generally well regulated by the require-ment that on long (>10,000 years) timescales, CaCO3 sources (weathering) and sinks (shallow-and deep-water CaCO3) must balance (Ridgwell & Schmidt 2010). In contrast, as pH reflectsthe balance between dissolved CO2 and carbonate ion concentration, it is governed primarily bypCO2 (controlling CO2 for a given temperature) and Ca2+/Mg2+ (controlling CO2−
3 for a given�) rather than by weathering. It follows, for instance, that there was no late Mesozoic carbonatecrisis because � was probably high and decoupled from pH. Only events involving geologicallyrapid (<10,000 years) CO2 release overwhelm the ability of the ocean and sediments to regulate �,producing a coupled decline in both pH and saturation state and hence providing a future-relevantocean acidification analog.
PAST OCEAN ACIDIFICATION EVENTS
I use the term ocean acidification event to describe episodes in Earth’s history that involve geolog-ically rapid changes of ocean carbonate chemistry, including reductions in both pH and CaCO3
saturation states on timescales shorter than ∼10,000 years. I limit the discussion to a few episodesthat appear most relevant in relation to the ongoing anthropogenic acidification event. The list isnot comprehensive, and other events in Earth’s history may deserve more attention in the contextof ocean acidification (see, e.g., Kump et al. 2009, Knoll & Fischer 2011, Honisch et al. 2012).
Aptian Oceanic Anoxic Event
The Aptian Oceanic Anoxic Event (OAE1a, ∼120 Mya; see Figure 5) is characterized by thewidespread deposition of organic-rich sediments and represents a possible ocean acidificationexample. It has been suggested that a marine calcification crisis occurred during OAE1a (e.g.,
←−−−−−−−−−−−−−−−−−−−−−−−−−−−−−−−−−−−−−−−−−−−−−−−−−−−−−−−−−−−−−−−−−−−−−−−−Figure 5The geological context for past changes in ocean carbonate chemistry. Modified from Kump et al. (2009).(a) Major global carbon cycle events during the past ∼500 Ma. Abbreviations: , Cambrian; C,Carboniferous; D, Devonian; J, Jurassic; K, Cretaceous; KT, Cretaceous-Tertiary boundary; N, Neogene;O, Ordovician; OAE, Oceanic Anoxic Event; PETM, Paleocene-Eocene Thermal Maximum; Pg,Paleogene; Pr, Permian; S, Silurian; Tr, Triassic. (b) Evolution of ocean surface pHsws (seawater pH scale)(Tyrrell & Zeebe 2004, Ridgwell 2005, Ridgwell & Zeebe 2005, Ridgwell & Schmidt 2010). Gray line:response of the global carbonate cycle to the mean paleo-pCO2 reconstruction; gray-filled envelope:response to the uncertainty (one standard deviation) in paleo-pCO2; orange-filled circle: estimates for thelate Paleocene. (c) Reconstructed Ca2+ concentrations (Lowenstein et al. 2001). (d ) Major changes inplankton assemblages (Martin 1995). Calcifying taxa are highlighted in green; noncalcifying taxa are shownin gray and blue. The rise during the early- to mid-Mesozoic of the importance of Globigerinina is shown asbroadly representative of the timing of changes of planktonic foraminiferal taxa in general, although theevolution of the first foraminifera taxon occurred somewhat earlier in the mid-Paleozoic (Martin 1995).(e) Latitudinal extent of glaciation (Crowley & Burke 1998). ( f ) Phanerozoic evolution of atmospheric pCO2reconstructed from proxy records (orange-filled circles) by Royer et al. (2004). Paleo-pCO2 data have beenbinned into 20-Ma intervals, with the mean indicated by green squares and one standard deviation indicatedby error bars. The geological timescale for all panels is shown in panel a.
www.annualreviews.org • History of CO2 Chemistry 157
Ann
u. R
ev. E
arth
Pla
net.
Sci.
2012
.40:
141-
165.
Dow
nloa
ded
from
ww
w.a
nnua
lrev
iew
s.or
g A
cces
s pr
ovid
ed b
y U
nive
rsity
of
Cal
ifor
nia
- Sa
nta
Cru
z on
01/
22/1
8. F
or p
erso
nal u
se o
nly.

EA40CH07-Zeebe ARI 1 April 2012 7:44
Erba & Tremolada 2004). However, rather than being transient (e.g., showing a decay patternafter an initial perturbation), the event was long-lasting, with a total duration of ∼1 Ma. Thetimescale of its onset has been estimated at ∼20,000 to 44,000 years ago (Li et al. 2008, Mehayet al. 2009), and the onset was most likely slower than the onset of the PETM, for example.Also, the substantial decline in nannoconid abundance (calcareous nannoplankton, proposed asan indicator of the calcification crisis) started ∼1 Ma prior to the onset of the event (Erba &Tremolada 2004, Mehay et al. 2009). As the ocean carbonate mineral saturation state is gener-ally well buffered on timescales of >10,000 years, it is improbable that effects on calcificationwould have lasted over millions of years (Gibbs et al. 2011). This view is supported by the factthat other heavily calcified taxa peaked in abundance precisely during the interval of minimumnannoconid abundance (Erba & Tremolada 2004). Some species such as the coccolithophoreWatznaueria barnesiae show little change in abundance during the onset of the event (Mehay et al.2009).
End-Permian and Cretaceous-Tertiary Boundary
The end-Permian mass extinction (∼252 Mya) is believed to have invoked rapid and massive inputof CO2 to the ocean-atmosphere system, which is associated with one of the largest eruptions offlood basalts documented in the geologic record. The extinctions appear to show a pattern ofselectivity with respect to physiological and ecological features of the biota. For example, hyper-calcifiers with limited ability to pump ions across membranes show nearly complete extinction,whereas other groups that can modulate the composition of the calcifying fluid survived compara-tively well. A comprehensive summary of the end-Permian mass extinction can be found elsewhere(e.g., Knoll 2003, Kump et al. 2009, Knoll & Fischer 2011, Payne & Clapham 2012). Unfortu-nately, no direct proxy records of seawater carbonate chemistry changes for the end-Permianappear to be available at this time.
The Paleocene-Eocene Thermal Maximum
The PETM (∼55 Mya) is probably the closest analog for the future that has been identified inthe geologic record. The onset of the PETM was marked by a global increase in surface temper-atures by 5–9◦C within a few thousand years (e.g., Kennett & Stott 1991, Thomas & Shackleton1996, Zachos et al. 2003, Sluijs et al. 2006). At nearly the same time, a substantial carbon releaseoccurred, as evidenced by a large drop in the 13C/12C ratios of surficial carbon reservoirs. Thecarbon release led to ocean acidification and widespread dissolution of deep-sea carbonates (e.g.,Zachos et al. 2005, Zeebe et al. 2009, Ridgwell & Schmidt 2010). Different sources for the carboninput have been suggested, leading to speculations concerning the mechanism. Some mechanisms,such as volcanic intrusion, imply that the carbon drove the warming. Others, such as the destabi-lization of oceanic methane hydrates, imply that the carbon release is a feedback mechanism thatcan exacerbate warming (Dickens et al. 1995, Dickens 2000, Pagani et al. 2006, Dickens 2011).With respect to ocean acidification, whether the carbon source was CO2 or methane is of minorimportance, as methane would have been oxidized rapidly to CO2 in the water column and/orthe atmosphere. Remarkably, even the lower estimates for the carbon release during the onset ofthe PETM (∼1 Pg C per year) appear to be of similar order of magnitude to that over the past50 years from anthropogenic sources.
The PETM shows several characteristics that are essential for a meaningful comparison withthe anthropogenic perturbation. First, it was a transient event with a rapid onset (not a long-term steady state); second, it was associated with a large and rapid carbon input. In contrast to
158 Zeebe
Ann
u. R
ev. E
arth
Pla
net.
Sci.
2012
.40:
141-
165.
Dow
nloa
ded
from
ww
w.a
nnua
lrev
iew
s.or
g A
cces
s pr
ovid
ed b
y U
nive
rsity
of
Cal
ifor
nia
- Sa
nta
Cru
z on
01/
22/1
8. F
or p
erso
nal u
se o
nly.

EA40CH07-Zeebe ARI 1 April 2012 7:44
aberrations that occurred in the more distant past, the PETM is relatively well studied becausenumerous well-preserved terrestrial and marine paleorecords for this time interval are available(on the marine side accessible through ocean drilling). The PETM may therefore serve as a casestudy for ocean acidification caused by CO2 released by human activities. However, it is importantto keep in mind that the climatic and carbon cycle boundary conditions before the PETM weresignificantly different from those today—including different continental configuration, absenceof continental ice, and a different baseline climate. Moreover, ocean carbonate chemistry prior tothe event was different from modern conditions, and the sensitivity to a carbon perturbation waslikely reduced (Goodwin et al. 2009, Stuecker & Zeebe 2010). These aspects limit the PETM’ssuitability as the perfect future analog. Nevertheless, the PETM provides invaluable informationon the response of the carbon cycle, climate, and ocean carbonate chemistry to massive carboninput. It also allows us to estimate the timescale over which carbon was removed from the ocean-atmosphere system by natural sequestration.
For the PETM, different carbon input scenarios have been proposed (e.g., Dickens et al. 1995,Panchuk et al. 2008, Zeebe et al. 2009). For example, the scenario proposed by Zeebe et al. (2009)requires an initial carbon pulse of approximately 3,000 Pg C over ∼6,000 years to be consistentwith the timing and magnitude of stable carbon isotope records and the deep-sea dissolutionpattern (Zachos et al. 2005, Leon-Rodriguez & Dickens 2010). I have compared this PETMscenario with a Business-as-USual scenario of fossil fuel emissions of 5,000 Pg C over ∼500 years(Figure 6). The results show that if the proposed PETM scenario roughly resembles the actualconditions during the onset of the event, then the effects on ocean chemistry, including surface-ocean saturation state, were less severe during the PETM than would be expected for the future
0
5
10
15
20
25
Re
lea
se (
Pg
C y
ea
r–1) a
0 2 4 6 80
1
2
3
4
5
6
7
Time (thousands of years)
Su
rfa
ce c
alc
ite
satu
rati
on
b
5,000 Pg C
3,000 Pg C
PETM scenario
Business-as-USualscenario
Figure 6Paleocene-Eocene Thermal Maximum (PETM) versus Anthropocene. Modified from Zeebe & Ridgwell(2011). (a) Carbon emission scenarios as projected for the future under the Business-as-USual scenario[5,000 Pg C over ∼500 years (Zeebe et al. 2008)] and as observed for the PETM [3,000 Pg C over6,000 years (Zeebe et al. 2009)]. The onset of industrialization has been aligned with the onset of the PETM.(b) Changes in surface-ocean calcite saturation state (�c) simulated with the LOSCAR (Long-termOcean-atmosphere-Sediment CArbon cycle Reservoir) model (Zeebe 2011) in response to the carbon inputshown in panel a.
www.annualreviews.org • History of CO2 Chemistry 159
Ann
u. R
ev. E
arth
Pla
net.
Sci.
2012
.40:
141-
165.
Dow
nloa
ded
from
ww
w.a
nnua
lrev
iew
s.or
g A
cces
s pr
ovid
ed b
y U
nive
rsity
of
Cal
ifor
nia
- Sa
nta
Cru
z on
01/
22/1
8. F
or p
erso
nal u
se o
nly.
EA40CH07-Zeebe ARI 1 April 2012 7:44
(Zeebe & Zachos 2007, Ridgwell & Schmidt 2010). As pointed out above, both the magnitudeand the timescale of the carbon input are critical for its effect on ocean carbonate chemistry. Thetimescale of the anthropogenic carbon input is so short that the natural capacity of the surfacereservoirs to absorb carbon is overwhelmed (Figure 2a). As a result of a 5,000–Pg C input over∼500 years, the surface-ocean calcite saturation state (�c) would drop from approximately 5.4to <2 within a few hundred years. In contrast, the PETM scenario suggests a correspondingdecline of �c from 5.5 to ∼4 within a few thousand years. I emphasize, however, that the PETMscenario may be subject to revision, depending on the outcome of future studies that will helpbetter constrain the timescale of the carbon input.
Our suggestion that the PETM carbon input had a moderate impact on surface-ocean satu-ration state (Zeebe et al. 2009) is consistent with the results of Gibbs et al. (2006), who studiednannoplankton origination and extinction during the PETM. They concluded that the perturba-tion of the surface-water saturation state across the PETM was not detrimental to the survival ofmost calcareous nannoplankton taxa. In contrast, the Paleocene-Eocene boundary marks a ma-jor extinction event of benthic foraminifera, affecting 30–50% of species globally (e.g., Thomas1990, 2007). It is not clear, however, whether the benthic extinction was caused by changes inoxygenation, bottom water temperatures, carbonate undersaturation as a result of the carbon in-put, and/or other factors (for discussion, see Ridgwell & Schmidt 2010). In summary, the directeffects of ocean acidification on surface calcifiers during the PETM may have been limited becauseof a relatively slow carbon input rate (slow on human timescales, rapid on geologic timescales).Possible acidification effects on benthic organisms are difficult to quantify because of competingeffects from other environmental changes (see also Knoll & Fischer 2011).
Among the ocean acidification events hitherto identified in Earth’s history, the PETM may bethe closest analog for the future. Yet the evidence suggests that the carbon input rate from humanactivities may exceed that during the PETM. Thus, it seems that the ocean acidification event thathumans may cause over the next few centuries is unprecedented in the geologic past for whichsufficiently well-preserved paleorecords are available.
SUMMARY
The geologic record provides valuable information about the response of the Earth system tomassive and rapid carbon input. Analyses and evaluation of the information should ultimately leadto improved future predictions. In particular, studies of past changes in ocean chemistry teach us alesson about the effects that ocean acidification may have on marine life in the future. In addition,they provide the necessary background to assess the current anthropogenic perturbation in thecontext of Earth’s history. The assessment presented in this review shows that when studyingthe past, a good understanding of the relevant timescales involved is of utmost importance. Forinstance, short-term carbon cycling on a timescale of 10 to 100 years and long-term carbon cyclingon a timescale of millions of years involve two distinct cycles with vastly different reservoir sizesand different sets of controls on atmospheric CO2 and ocean chemistry (Figure 2). Thus, thepertinent timescales of paleo-pCO2 and paleochemistry records require thorough examination ifthese records are to qualify as appropriate future analogs.
The survey of long-term changes of ocean carbonate chemistry during Earth’s history (quasi-steady states) revealed that natural variations are generally slow and small on timescales rele-vant to the near future (see Figure 7 for a summary). Because ocean saturation state is usuallywell regulated and decoupled from pH over tens of thousands of years, past events that involvegeologically rapid changes of ocean carbonate chemistry are of particular interest. Among theocean acidification events discussed here, the PETM may be the closest analog for the future.
160 Zeebe
Ann
u. R
ev. E
arth
Pla
net.
Sci.
2012
.40:
141-
165.
Dow
nloa
ded
from
ww
w.a
nnua
lrev
iew
s.or
g A
cces
s pr
ovid
ed b
y U
nive
rsity
of
Cal
ifor
nia
- Sa
nta
Cru
z on
01/
22/1
8. F
or p
erso
nal u
se o
nly.

EA40CH07-Zeebe ARI 1 April 2012 7:44
100100 200200 500500 1,0001,000 2,0002,000 5,0005,000 10,00010,00010101
10102
10103
10104
10105
10106
10107
Atmospheric CAtmospheric CO2 (ppmv) (ppmv)
Tim
e i
nte
rva
l (y
ea
r) t
o a
pp
roa
ch C
Tim
e i
nte
rva
l (y
ea
r) t
o a
pp
roa
ch C
O2
0.20.20
−0.2−0.2
−0.4−0.4
−0.6−0.6
−0.8−0.8
−1.0−1.0
−1.2−1.2
100 200 500 1,000 2,000 5,000 10,000101
102
103
104
105
106
107
Atmospheric CO2 (ppmv)
Tim
e i
nte
rva
l (y
ea
rs)
to a
pp
roa
ch C
O2
lev
el
0.20
−0.2
−0.4
−0.6
−0.8
−1.0
−1.2a
b
c
d
e
Figure 7Estimated maximum change in surface-ocean pH ( gray labeled contour lines) as a function of final atmosphericCO2 partial pressure, and the transition time over which this CO2 partial pressure is linearly approachedfrom 280 ppmv. Modified from Caldeira & Wickett (2003). (a) Glacial-interglacial CO2 changes. (b) Slowchanges over the past 300 Ma. (c) Historical changes in ocean surface waters. (d ) Unabated fossil fuelburning over the next few centuries. (e) The range of the timescale of carbon input and pCO2 estimatesduring the Paleocene-Eocene Thermal Maximum (PETM), which was likely approached from a CO2 levelsignificantly higher than 280 ppmv. Surface-ocean pH changes were probably much smaller during thePETM than suggested in the figure because of lower sensitivity to carbon perturbations and substantiallyhigher initial pCO2 (e.g., Zeebe et al. 2009, Stuecker & Zeebe 2010).
However, the anthropogenic rate of carbon input appears to be greater than during any of theocean acidification events identified so far, including the PETM.
DISCLOSURE STATEMENT
The author is not aware of any affiliations, memberships, funding, or financial holdings that mightbe perceived as affecting the objectivity of this review.
ACKNOWLEDGMENTS
I thank A. Ridgwell, J.-P. Gattuso, L. Hansson, J. Bijma, A. Knoll, and K. Caldeira for discussionand comments. This work was supported by NSF grants OCE09-02869 and OCE09-27089.
LITERATURE CITED
Archer D. 2005. Fate of fossil fuel CO2 in geologic time. J. Geophys. Res. 110:C09S05Archer D, Kheshgi H, Maier-Reimer E. 1998. Dynamics of fossil fuel CO2 neutralization by marine CaCO3.
Global Biogeochem. Cycles 12:259–76Archer D, Winguth A, Lea D, Mahowald N. 2000. What caused the glacial/interglacial atmospheric pCO2
cycles? Rev. Geophys. 38:159–89
www.annualreviews.org • History of CO2 Chemistry 161
Ann
u. R
ev. E
arth
Pla
net.
Sci.
2012
.40:
141-
165.
Dow
nloa
ded
from
ww
w.a
nnua
lrev
iew
s.or
g A
cces
s pr
ovid
ed b
y U
nive
rsity
of
Cal
ifor
nia
- Sa
nta
Cru
z on
01/
22/1
8. F
or p
erso
nal u
se o
nly.
EA40CH07-Zeebe ARI 1 April 2012 7:44
Barker S, Elderfield H. 2002. Foraminiferal calcification response to glacial-interglacial changes in atmosphericCO2. Science 297:833–36
Bartoli G, Honisch B, Zeebe RE. 2011. Atmospheric CO2 decline during the Pliocene intensification ofNorthern Hemisphere glaciations. Paleoceanography 26:PA4213
Beaufort L, Probert I, Buchet N. 2007. Effects of acidification and primary production on coccolith weight: im-plications for carbonate transfer from the surface to the deep ocean. Geochem. Geophys. Geosyst. 8(8):Q08011
Beerling DJ, Royer DL. 2011. Convergent Cenozoic CO2 history. Nat. Geosci. 4:418–20Berner RA, Kothavala Z. 2001. GEOCARB III: A revised model of atmospheric CO2 over Phanerozoic time.
Am. J. Sci. 301:182–204Berner RA, Lasaga AC, Garrels RM. 1983. The carbonate-silicate geochemical cycle and its effect on atmo-
spheric carbon dioxide over the past 100 million years. Am. J. Sci. 283:641–83Bijma J, Honisch B, Zeebe RE. 2002. Impact of the ocean carbonate chemistry on living foraminiferal shell
weight: comment on “Carbonate ion concentration in glacial-age deep waters of the Caribbean Sea” byW.S. Broecker and E. Clark. Geochem. Geophys. Geosyst. 3(11):1064
Broecker WS, Clark E. 2003. Glacial-age deep sea carbonate ion concentrations. Geochem. Geophys. Geosyst.4(6):1047
Broecker WS, Clark E. 2007. Is the magnitude of the carbonate ion decrease in the abyssal ocean over the last8 kyr consistent with the 20 ppm rise in atmospheric CO2 content? Paleoceanography 22:PA1202
Broecker WS, Peng T-H. 1987. The role of CaCO3 compensation in the glacial to interglacial atmosphericCO2 change. Global Biogeochem. Cycles 1:5–29
Broecker WS, Peng T-H. 1989. The cause of the glacial to interglacial atmospheric CO2 change: a polaralkalinity hypothesis. Global Biogeochem. Cycles 3:215–39
Broecker WS, Sanyal A. 1998. Does atmospheric CO2 police the rate of chemical weathering? Global Bio-geochem. Cycles 12(3):403–408
Broecker WS, Takahashi T. 1977. Neutralization of fossil fuel CO2 by marine calcium carbonate. In The Fateof Fossil Fuel CO2 in the Oceans, ed. NR Andersen, A Malahoff, pp. 213–41. New York: Plenum
Caldeira K. 1992. Enhanced Cenozoic chemical weathering and the subduction of pelagic carbonate. Nature357:578–81
Caldeira K. 2007. What corals are dying to tell us about CO2 and ocean acidification. Oceanography 20(2):188–95
Caldeira K, Wickett ME. 2003. Anthropogenic carbon and ocean pH. Nature 425:365Crowley TJ, Burke KC, eds. 1998. Tectonic Boundary Conditions for Climate Reconstructions. New York: Oxford
Univ. Press. 285 pp.de Moel H, Ganssen GM, Peeters FJC, Jung SJA, Brummer GJA, et al. 2009. Planktic foraminiferal shell
thinning in the Arabian Sea due to anthropogenic ocean acidification? Biogeosciences 6:1917–25Dickens GR. 2000. Methane oxidation during the late Palaeocene Thermal Maximum. Bull. Soc. Geol. Fr.
171(1):37–49Dickens GR. 2011. Methane release from gas hydrate systems during the Paleocene-Eocene thermal maximum
and other past hyperthermal events: setting appropriate parameters for discussion. Clim. Past Discuss.7:1139–74
Dickens GR, O’Neil JR, Rea DK, Owen RM. 1995. Dissociation of oceanic methane hydrate as a cause of thecarbon isotope excursion at the end of the Paleocene. Paleoceanography 10:965–71
Dickson AG, Sabine CL, Christian JR. 2007. Guide to Best Practices for Ocean CO2 Measurements. PICES Spec.Publ. 3. Sidney, Can.: North Pac. Mar. Sci. Org. 191 pp.
Dore JE. 2009. Hawaii Ocean Time-series surface CO2 system data product, 1988–2009. http://hahana.soest.hawaii.edu/hot/products/products.html
Elsig J, Schmitt J, Leuenberger D, Schneider R, Eyer M, et al. 2009. Stable isotope constraints onHolocene carbon cycle changes from an Antarctic ice core. Nature 461:507–10
Erba E, Tremolada F. 2004. Nannofossil carbonate fluxes during the Early Cretaceous: phytoplankton re-sponse to nutrification episodes, atmospheric CO2, and anoxia. Paleoceanography 19:PA1008
Foster GL. 2008. Seawater pH, pCO2 and [CO2−3 ] variations in the Caribbean Sea over the last 130 kyr: a
boron isotope and B/Ca study of planktic foraminifera. Earth Planet. Sci. Lett. 271:254–66
162 Zeebe
Ann
u. R
ev. E
arth
Pla
net.
Sci.
2012
.40:
141-
165.
Dow
nloa
ded
from
ww
w.a
nnua
lrev
iew
s.or
g A
cces
s pr
ovid
ed b
y U
nive
rsity
of
Cal
ifor
nia
- Sa
nta
Cru
z on
01/
22/1
8. F
or p
erso
nal u
se o
nly.

EA40CH07-Zeebe ARI 1 April 2012 7:44
Freeman KH, Hayes JM. 1992. Fractionation of carbon isotopes by phytoplankton and estimates of ancientCO2 levels. Global Biogeochem. Cycles 6:185–98
Gattuso J-P, Hansson L. 2011. Ocean acidification: history and background. In Ocean Acidification, ed.J-P Gattuso, L Hansson, pp. 1–20. New York: Oxford Univ. Press
Gibbs SJ, Bown PR, Sessa JA, Bralower TJ, Wilson PA. 2006. Nannoplankton extinction and originationacross the Paleocene-Eocene Thermal Maximum. Science 314:1770–73
Gibbs SJ, Robinson SA, Bown PR, Jones TD, Henderiks J. 2011. Comment on “Calcareous nannoplanktonresponse to surface-water acidification around Oceanic Anoxic Event 1a.” Science 332:175
Goodwin P, Williams RG, Ridgwell A, Follows MJ. 2009. Climate sensitivity to the carbon cycle modulatedby past and future changes in ocean chemistry. Nat. Geosci. 2:145–50
Henderiks J, Pagani M. 2008. Coccolithophore cell size and the Paleogene decline in atmospheric CO2. EarthPlanet. Sci. Lett. 269:575–83
Honisch B, Hemming NG. 2005. Surface ocean pH response to variations in pCO2 through two full glacialcycles. Earth Planet. Sci. Lett. 236:305–314
Honisch B, Hemming NG, Archer D, Siddall M, McManus JF. 2009. Atmospheric carbon dioxide concen-tration across the mid-Pleistocene transition. Science 324:1551–54
Honisch B, Ridgwell A, Schmidt DN, Thomas E, Gibbs SJ, et al. 2012. The geological record of oceanacidification. Science 335:1058–63
Kennett JP, Stott LD. 1991. Abrupt deep-sea warming, palaeoceanographic changes and benthic extinctionsat the end of the Palaeocene. Nature 353:225–29
Kiessling W. 2001. Paleoclimatic significance of Phanerozoic reefs. Geology 29(8):751–54Kiessling W, Simpson C. 2011. On the potential for ocean acidification to be a general cause of ancient reef
crises. Global Change Biol. 17:56–67Knoll AH. 2003. Biomineralization and evolutionary history. Rev. Mineral. Geochem. 54:329–56Knoll AH, Fischer WW. 2011. Skeletons and ocean chemistry: the long view. In Ocean Acidification, ed.
J-P Gattuso, L Hansson, pp. 67–82. New York: Oxford Univ. PressKohfeld KE, Ridgwell A. 2009. Glacial-interglacial variability in atmospheric CO2. In Surface Ocean—Lower
Atmosphere Processes, ed. S Le Quere, ES Saltzman, Geophys. Monogr. 187:251–86. Washington, DC: AGUKump LR, Bralower TJ, Ridgwell A. 2009. Ocean acidification in deep time. Oceanography 22(4):
94–107Leon-Rodriguez L, Dickens GR. 2010. Constraints on ocean acidification associated with rapid and massive
carbon injections: the early Paleogene record at ocean drilling program site 1215, equatorial PacificOcean. Palaeogeogr. Palaeoclimatol. Palaeoecol. 298:409–20
Li Y-X, Bralower TJ, Montanez IP, Osleger DA, Arthur MA, et al. 2008. Toward an orbital chronology forthe early Aptian Oceanic Anoxic Event (OAE1a, ∼120 Ma). Earth Planet. Sci. Lett. 271:88–100
Lowenstein TK, Timofeeff MN, Brennan ST, Hardie LA, Demicco RV. 2001. Oscillations in Phanerozoicseawater chemistry: evidence from fluid inclusions. Science 294:1086–88
Luthi D, Le Floch M, Bereiter, Blunier T, Barnola J-M, et al. 2008. High-resolution carbon dioxide concen-tration record 650,000–800,000 years before present. Nature 453:379–82
Martin RE. 1995. Cyclic and secular variation in microfossil biomineralization: clues to the biogeochemicalevolution of Phanerozoic oceans. Global Planet. Change 11:1–23
Mehay S, Keller CE, Bernasconi SM, Weissert H, Erba E, et al. 2009. A volcanic CO2 pulse triggered theCretaceous Oceanic Anoxic Event 1a and a biocalcification crisis. Geology 37:819–22
Millero FJ. 2006. Chemical Oceanography. Boca Raton, FL: CRC. 496 pp. 3rd ed.Monnin E, Steig EJ, Siegenthaler U, Kawamura K, Schwander J, et al. 2004. EPICA Dome C ice core high-
resolution Holocene and transition CO2 data. IGBP PAGES/World Data Cent. Paleoclimatol., Data Contrib.Ser. #2004-055, NOAA/NGDC, Boulder, Colo.
Opdyke BN, Wilkinson BH. 1993. Carbonate mineral saturation state and cratonic limestone accumulation.Am. J. Sci. 293:217–34
Pagani M, Caldeira K, Archer D, Zachos JC. 2006. An ancient carbon mystery. Science 314:1556–57Pagani M, Arthur MA, Freeman KH. 1999a. Miocene evolution of atmospheric carbon dioxide.
Paleoceanography 14:273–92
www.annualreviews.org • History of CO2 Chemistry 163
Ann
u. R
ev. E
arth
Pla
net.
Sci.
2012
.40:
141-
165.
Dow
nloa
ded
from
ww
w.a
nnua
lrev
iew
s.or
g A
cces
s pr
ovid
ed b
y U
nive
rsity
of
Cal
ifor
nia
- Sa
nta
Cru
z on
01/
22/1
8. F
or p
erso
nal u
se o
nly.

EA40CH07-Zeebe ARI 1 April 2012 7:44
Pagani M, Freeman KH, Arthur MA. 1999b. Late Miocene atmospheric CO2 concentrations and the expansionof C4 grasses. Science 285:876–79
Pagani M, Liu Z, LaRiviere J, Ravelo AC. 2010. High Earth-system climate sensitivity determined fromPliocene carbon dioxide concentrations. Nat. Geosci. 3:27–30
Pagani M, Zachos JC, Freeman KH, Tipple B, Bohaty S. 2005. Marked decline in atmospheric carbon dioxideconcentrations during the Paleogene. Science 309:600–3
Palike H, Nishi H, Lyle M, Raffi I, Klaus A, Gamage K. 2009. The PACIFIC EQUATORIAL AGE TRAN-SECT (‘PEAT’): new insights into the Cenozoic link between climate and calcium carbonate compensa-tion. Eos Trans. AGU 90(52), Fall Meet. Suppl., Abstr. PP43C-06
Panchuk K, Ridgwell A, Kump LR. 2008. Sedimentary response to Paleocene-Eocene Thermal Maximumcarbon release: a model-data comparison. Geology 36(4):315–18
Payne JL, Clapham ME. 2012. End-Permian mass extinction in the oceans: an ancient analog for the twenty-first century? Annu. Rev. Earth Planet. Sci. 40:89–111
Pearson PN, Foster GL, Wade BS. 2009. Atmospheric carbon dioxide through the Eocene-Oligocene climatetransition. Nature 461:1110–13
Pearson PN, Palmer MR. 2000. Atmospheric carbon dioxide concentrations over the past 60 million years.Nature 406:695–99
Prieto FJM, Millero FJ. 2001. The values of pK1 and pK2 for the dissociation of carbonic acid in seawater.Geochim. Cosmochim. Acta 66(14):2529–40
Raven J, Caldeira K, Elderfield H, Hoegh-Guldberg O, Liss P, et al. 2005. Ocean acidification due to increasingatmospheric carbon dioxide. Policy Document 12/05, The Royal Society, London
Rickaby REM, Bard E, Sonzogni C, Rostek F, Beaufort L, et al. 2007. Coccolith chemistry reveals secularvariations in the global ocean carbon cycle? Earth Planet. Sci. Lett. 253:83–95
Ridgwell A. 2005. A Mid Mesozoic Revolution in the regulation of ocean chemistry. Mar. Geol. 217:339–57Ridgwell A, Schmidt D. 2010. Past constraints on the vulnerability of marine calcifiers to massive carbon
dioxide release. Nat. Geosci. 3:196–200Ridgwell A, Zeebe RE. 2005. The role of the global carbonate cycle in the regulation and evolution of the
Earth system. Earth Planet. Sci. Lett. 234:299–315Ridgwell A, Zondervan I, Hargreaves JC, Bijma J, Lenton TM. 2007. Assessing the potential long-term
increase of oceanic fossil fuel CO2 uptake due to CO2-calcification feedback. Biogeosciences 4:481–92Ridgwell AJ, Kennedy MJ, Caldeira K. 2003. Carbonate deposition, climate stability, and Neoproterozoic ice
ages. Science 302:859–62Royer DL, Berner RA, Montanez IP, Tabor NJ, Beerling DJ. 2004. CO2 as a primary driver of Phanerozoic
climate change. GSA Today 14(3):4–10Sanyal A, Hemming NG, Hanson GN, Broecker WS. 1995. Evidence for a higher pH in the glacial ocean
from boron isotopes in foraminifera. Nature 373:234–36Schmidt DN, Thierstein HR, Bollmann J, Schiebel R. 2004. Abiotic forcing of plankton evolution in the
Cenozoic. Science 303:207–10Seki O, Foster GL, Schmidt DN, Mackensen A, Kawamura K, Pancost RD. 2010. Alkenone and boron-based
Pliocene pCO2 records. Earth Planet. Sci. Lett. 292:201–211Siegenthaler U, Stocker TF, Monnin E, Luthi D, Schwander J, et al. 2005. Stable carbon cycle–climate
relationship during the Late Pleistocene. Science 310:1313–17Sluijs A, Schouten S, Pagani M, Woltering M, Brinkhuis H, et al. 2006. Subtropical Arctic Ocean temperatures
during the Palaeocene/Eocene thermal maximum. Nature 441:610–13Stuecker MF, Zeebe RE. 2010. Ocean chemistry and atmospheric CO2 sensitivity to carbon perturbations
throughout the Cenozoic. Geophys. Res. Lett. 37:L03609Stumm W, Morgan JJ. 1996. Aquatic Chemistry. New York: Wiley. 1022 pp. 3rd ed.Sundquist ET. 1986. Geologic analogs: their value and limitations in carbon dioxide research. In The Changing
Carbon Cycle: A Global Analysis, ed. JR Trabalka, DE Reichle, pp. 371–402. New York: Springer-VerlagTans P. 2009. Trends in atmospheric carbon dioxide. Boulder, CO: NOAA/ESRL. http://www.esrl.noaa.gov/
gmd/ccgg/trendsThomas E. 1990. Late Cretaceous–early Eocene mass extinctions in the deep sea. Geol. Soc. Lond. Spec. Publ.
247:481–95
164 Zeebe
Ann
u. R
ev. E
arth
Pla
net.
Sci.
2012
.40:
141-
165.
Dow
nloa
ded
from
ww
w.a
nnua
lrev
iew
s.or
g A
cces
s pr
ovid
ed b
y U
nive
rsity
of
Cal
ifor
nia
- Sa
nta
Cru
z on
01/
22/1
8. F
or p
erso
nal u
se o
nly.

EA40CH07-Zeebe ARI 1 April 2012 7:44
Thomas E. 2007. Cenozoic mass extinctions in the deep sea: What disturbs the largest habitat on Earth?Geol. Soc. Am. Spec. Pap. 424:1–23
Thomas E, Shackleton NJ. 1996. The Paleocene-Eocene benthic foraminiferal extinction and stable isotopeanomalies. Geol. Soc. Lond. Spec. Publ. 101:401–41
Tyrrell T, Zeebe RE. 2004. History of carbonate ion concentration over the last 100 million years. Geochim.Cosmochim. Acta 68(17):3521–30
Uchikawa J, Zeebe RE. 2008. Influence of terrestrial weathering on ocean acidification and the next glacialinception. Geophys. Res. Lett. 35:L23608
Walker JCG, Hays PB, Kasting JF. 1981. A negative feedback mechanism for the long-term stabilization ofEarth’s surface temperature. J. Geophys. Res. 86:9776–82
Weiss RF. 1974. Carbon dioxide in water and seawater: the solubility of a non-ideal gas. Mar. Chem. 2:203–15Yamano H, Sugihara K, Nomura K. 2011. Rapid poleward range expansion of tropical reef corals in response
to rising sea surface temperatures. Geophys. Res. Lett. 38:L04601Zachos JC, Dickens GR, Zeebe RE. 2008. An early Cenozoic perspective on greenhouse warming and carbon-
cycle dynamics. Nature 451:279–83Zachos JC, Rohl U, Schellenberg SA, Sluijs A, Hodell DA, et al. 2005. Rapid acidification of the ocean during
the Paleocene-Eocene Thermal Maximum. Science 308:1611–15Zachos JC, Wara MW, Bohaty S, Delaney ML, Petrizzo MR, et al. 2003. A transient rise in tropical sea surface
temperature during the Paleocene-Eocene Thermal Maximum. Science 302:1551–54Zeebe RE. 2001. Seawater pH and isotopic paleotemperatures of Cretaceous oceans. Palaeogeogr. Palaeoclimatol.
Palaeoecol. 170:49–57Zeebe RE. 2011. LOSCAR: Long-term Ocean-atmosphere-Sediment CArbon cycle Reservoir Model. Geosci.
Model Dev. Discuss. 4:1435–76Zeebe RE, Caldeira K. 2008. Close mass balance of long-term carbon fluxes from ice-core CO2 and ocean
chemistry records. Nat. Geosci. 1:312–15Zeebe RE, Marchitto TM Jr. 2010. Atmosphere and ocean chemistry. Nat. Geosci. 3:386–87Zeebe RE, Ridgwell A. 2011. Past changes of ocean carbonate chemistry. In Ocean Acidification, ed. J-P Gattuso,
L Hansson, pp. 21–42. New York: Oxford Univ. PressZeebe RE, Westbroek P. 2003. A simple model for the CaCO3 saturation state of the ocean: The “Strangelove,”
the “Neritan,” and the “Cretan” Ocean. Geochem. Geophys. Geosyst. 4(12):1104Zeebe RE, Wolf-Gladrow D. 2001. CO2 in Seawater: Equilibrium, Kinetics, Isotopes. Amsterdam: Elsevier.
346 pp.Zeebe RE, Zachos JC. 2007. Ocean acidification in the early Eocene and Anthropocene. Eos Trans. AGU
88(52), Fall Meet. Suppl., Abstr. OS14A-04Zeebe RE, Zachos JC, Caldeira K, Tyrrell T. 2008. Oceans: carbon emissions and acidification. Science 321:51–
52Zeebe RE, Zachos JC, Dickens GR. 2009. Carbon dioxide forcing alone insufficient to explain Palaeocene-
Eocene Thermal Maximum warming. Nat. Geosci. 2:576–80Zondervan I, Zeebe RE, Rost B, Riebesell U. 2001. Decreasing marine biogenic calcification: a negative
feedback on rising atmospheric pCO2. Global Biogeochem. Cycles 15(2):507–16
www.annualreviews.org • History of CO2 Chemistry 165
Ann
u. R
ev. E
arth
Pla
net.
Sci.
2012
.40:
141-
165.
Dow
nloa
ded
from
ww
w.a
nnua
lrev
iew
s.or
g A
cces
s pr
ovid
ed b
y U
nive
rsity
of
Cal
ifor
nia
- Sa
nta
Cru
z on
01/
22/1
8. F
or p
erso
nal u
se o
nly.

EA40-FrontMatter ARI 1 April 2012 7:38
Annual Reviewof Earth andPlanetary Sciences
Volume 40, 2012 Contents
Reminiscences From a Career in GeomicrobiologyHenry L. Ehrlich � � � � � � � � � � � � � � � � � � � � � � � � � � � � � � � � � � � � � � � � � � � � � � � � � � � � � � � � � � � � � � � � � � � � � � � � � � � � � � � 1
Mixing and Transport of Isotopic Heterogeneityin the Early Solar SystemAlan P. Boss � � � � � � � � � � � � � � � � � � � � � � � � � � � � � � � � � � � � � � � � � � � � � � � � � � � � � � � � � � � � � � � � � � � � � � � � � � � � � � � � � � � �23
Tracing Crustal Fluids: Applications of Natural 129I and 36ClUdo Fehn � � � � � � � � � � � � � � � � � � � � � � � � � � � � � � � � � � � � � � � � � � � � � � � � � � � � � � � � � � � � � � � � � � � � � � � � � � � � � � � � � � � � � �45
SETI@home, BOINC, and Volunteer Distributed ComputingEric J. Korpela � � � � � � � � � � � � � � � � � � � � � � � � � � � � � � � � � � � � � � � � � � � � � � � � � � � � � � � � � � � � � � � � � � � � � � � � � � � � � � � �69
End-Permian Mass Extinction in the Oceans: An Ancient Analogfor the Twenty-First Century?Jonathan L. Payne and Matthew E. Clapham � � � � � � � � � � � � � � � � � � � � � � � � � � � � � � � � � � � � � � � � � � � � � �89
Magma Oceans in the Inner Solar SystemLinda T. Elkins-Tanton � � � � � � � � � � � � � � � � � � � � � � � � � � � � � � � � � � � � � � � � � � � � � � � � � � � � � � � � � � � � � � � � � � � � 113
History of Seawater Carbonate Chemistry, Atmospheric CO2,and Ocean AcidificationRichard E. Zeebe � � � � � � � � � � � � � � � � � � � � � � � � � � � � � � � � � � � � � � � � � � � � � � � � � � � � � � � � � � � � � � � � � � � � � � � � � � � � 141
Biomimetic Properties of Minerals and the Search for Life in theMartian Meteorite ALH84001Jan Martel, David Young, Hsin-Hsin Peng, Cheng-Yeu Wu, and John D. Young � � � � 167
Archean Subduction: Fact or Fiction?Jeroen van Hunen and Jean-Francois Moyen � � � � � � � � � � � � � � � � � � � � � � � � � � � � � � � � � � � � � � � � � � � � � 195
Molecular Paleohydrology: Interpreting the Hydrogen-IsotopicComposition of Lipid Biomarkers fromPhotosynthesizing OrganismsDirk Sachse, Isabelle Billault, Gabriel J. Bowen, Yoshito Chikaraishi, Todd E. Dawson,
Sarah J. Feakins, Katherine H. Freeman, Clayton R. Magill, Francesca A. McInerney,Marcel T.J. van der Meer, Pratigya Polissar, Richard J. Robins, Julian P. Sachs,Hanns-Ludwig Schmidt, Alex L. Sessions, James W.C. White, Jason B. West,and Ansgar Kahmen � � � � � � � � � � � � � � � � � � � � � � � � � � � � � � � � � � � � � � � � � � � � � � � � � � � � � � � � � � � � � � � � � � � � � 221
viii
Ann
u. R
ev. E
arth
Pla
net.
Sci.
2012
.40:
141-
165.
Dow
nloa
ded
from
ww
w.a
nnua
lrev
iew
s.or
g A
cces
s pr
ovid
ed b
y U
nive
rsity
of
Cal
ifor
nia
- Sa
nta
Cru
z on
01/
22/1
8. F
or p
erso
nal u
se o
nly.

EA40-FrontMatter ARI 1 April 2012 7:38
Building Terrestrial PlanetsA. Morbidelli, J.I. Lunine, D.P. O’Brien, S.N. Raymond, and K.J. Walsh � � � � � � � � � � � � 251
Paleontology of Earth’s MantleNorman H. Sleep, Dennis K. Bird, and Emily Pope � � � � � � � � � � � � � � � � � � � � � � � � � � � � � � � � � � � � � � 277
Molecular and Fossil Evidence on the Origin of AngiospermsJames A. Doyle � � � � � � � � � � � � � � � � � � � � � � � � � � � � � � � � � � � � � � � � � � � � � � � � � � � � � � � � � � � � � � � � � � � � � � � � � � � � � � 301
Infrasound: Connecting the Solid Earth, Oceans, and AtmosphereM.A.H. Hedlin, K. Walker, D.P. Drob, and C.D. de Groot-Hedlin � � � � � � � � � � � � � � � � � � � � 327
Titan’s Methane WeatherHenry G. Roe � � � � � � � � � � � � � � � � � � � � � � � � � � � � � � � � � � � � � � � � � � � � � � � � � � � � � � � � � � � � � � � � � � � � � � � � � � � � � � � 355
Extratropical Cooling, Interhemispheric Thermal Gradients,and Tropical Climate ChangeJohn C.H. Chiang and Andrew R. Friedman � � � � � � � � � � � � � � � � � � � � � � � � � � � � � � � � � � � � � � � � � � � � � 383
The Role of H2O in Subduction Zone MagmatismTimothy L. Grove, Christy B. Till, and Michael J. Krawczynski � � � � � � � � � � � � � � � � � � � � � � � � 413
Satellite GeomagnetismNils Olsen and Claudia Stolle � � � � � � � � � � � � � � � � � � � � � � � � � � � � � � � � � � � � � � � � � � � � � � � � � � � � � � � � � � � � � � 441
The Compositions of Kuiper Belt ObjectsMichael E. Brown � � � � � � � � � � � � � � � � � � � � � � � � � � � � � � � � � � � � � � � � � � � � � � � � � � � � � � � � � � � � � � � � � � � � � � � � � � � 467
Tectonics of the New Guinea RegionSuzanne L. Baldwin, Paul G. Fitzgerald, and Laura E. Webb � � � � � � � � � � � � � � � � � � � � � � � � � 495
Processes on the Young Earth and the Habitats of Early LifeNicholas T. Arndt and Euan G. Nisbet � � � � � � � � � � � � � � � � � � � � � � � � � � � � � � � � � � � � � � � � � � � � � � � � � � � 521
The Deep, Dark Energy Biosphere: Intraterrestrial Life on EarthKatrina J. Edwards, Keir Becker, and Frederick Colwell � � � � � � � � � � � � � � � � � � � � � � � � � � � � � � � � 551
Geophysics of Chemical Heterogeneity in the MantleLars Stixrude and Carolina Lithgow-Bertelloni � � � � � � � � � � � � � � � � � � � � � � � � � � � � � � � � � � � � � � � � � � 569
The Habitability of Our Earth and Other Earths: Astrophysical,Geochemical, Geophysical, and Biological Limits on PlanetHabitabilityCharles H. Lineweaver and Aditya Chopra � � � � � � � � � � � � � � � � � � � � � � � � � � � � � � � � � � � � � � � � � � � � � � � 597
The Future of Arctic Sea IceWieslaw Maslowski, Jaclyn Clement Kinney, Matthew Higgins,
and Andrew Roberts � � � � � � � � � � � � � � � � � � � � � � � � � � � � � � � � � � � � � � � � � � � � � � � � � � � � � � � � � � � � � � � � � � � � � � 625
The Mississippi Delta Region: Past, Present, and FutureMichael D. Blum and Harry H. Roberts � � � � � � � � � � � � � � � � � � � � � � � � � � � � � � � � � � � � � � � � � � � � � � � � � � 655
Contents ix
Ann
u. R
ev. E
arth
Pla
net.
Sci.
2012
.40:
141-
165.
Dow
nloa
ded
from
ww
w.a
nnua
lrev
iew
s.or
g A
cces
s pr
ovid
ed b
y U
nive
rsity
of
Cal
ifor
nia
- Sa
nta
Cru
z on
01/
22/1
8. F
or p
erso
nal u
se o
nly.

EA40-FrontMatter ARI 1 April 2012 7:38
Climate Change Impacts on the Organic Carbon Cycle at theLand-Ocean InterfaceElizabeth A. Canuel, Sarah S. Cammer, Hadley A. McIntosh,
and Christina R. Pondell � � � � � � � � � � � � � � � � � � � � � � � � � � � � � � � � � � � � � � � � � � � � � � � � � � � � � � � � � � � � � � � � � 685
Indexes
Cumulative Index of Contributing Authors, Volumes 31–40 � � � � � � � � � � � � � � � � � � � � � � � � � � � 713
Cumulative Index of Chapter Titles, Volumes 31–40 � � � � � � � � � � � � � � � � � � � � � � � � � � � � � � � � � � � 717
Errata
An online log of corrections to Annual Review of Earth and Planetary Sciences articlesmay be found at http://earth.annualreviews.org
x Contents
Ann
u. R
ev. E
arth
Pla
net.
Sci.
2012
.40:
141-
165.
Dow
nloa
ded
from
ww
w.a
nnua
lrev
iew
s.or
g A
cces
s pr
ovid
ed b
y U
nive
rsity
of
Cal
ifor
nia
- Sa
nta
Cru
z on
01/
22/1
8. F
or p
erso
nal u
se o
nly.


![History of Seawater Carbonate Chemistry, Atmospheric CO2, and … drafts/articles... · 2] are related by Henry’s law: CO 2 (g) K=0 [CO ] where K 0 is the temperature- and salinity-dependent](https://img.dokumen.tips/doc/110x75/604cfa7e5bf1fb0e5a56b121/history-of-seawater-carbonate-chemistry-atmospheric-co2-and-draftsarticles.jpg)