Embed Size (px)
Citation preview


His Royal Highness Prince Khalifabin Salman Al KhalifaThe Prime Minister of the Kingdom of Bahrain
His Majesty King Hamad bin Isa Al KhalifaThe King of the Kingdom of Bahrain
His Royal Highness Prince Salmanbin Hamad Al KhalifaThe Crown Prince, Deputy Supreme Commander and First Deputy Prime Minister

Board of Directors ................................................................... 4Executive Management ................................................... 5Letter to our Shareholders ........................................... 6-7CEO’s Message ............................................................................. 8-11Operational Highlights ..................................................... 12-13Financial Highlights .............................................................. 14-15Corporate Governance ..................................................... 16-23Products and Markets ........................................................ 24-27 Clientele ............................................................................................... 28-31Safety, Health and Environment ........................... 32-35Training and Development ......................................... 36-39Corporate Social Responsibility ............................ 40-43Financial Statements ........................................................... 44-81
Contents

ChairmanMahmood
HashimAl Kooheji
Board of Directors
Fawzi A.Kanoo
Sh. Mohammadbin Khalifa
Al Khalifa
Ossama M. Al Arrayedh
Mutlaq H. Al Morished
David E. Meen
Abduaziz S. Al Humaid
Yousif A. Taqi
Dr. Talaat Aldafer
Alqahtani
Annual Report 2013 (4)
Chief Financial Officer
Ali Al Baqali
Chief Operations Officer
Isa Abdul Latif Al Ansari
Chief Marketing Officer
Jean-BaptisteLucas
ExecutiveManagement
Chief Executive Officer
Tim Murray
Annual Report 2013 (5)

Dear Shareholders,
Alba made history in 2013, continuing to raise the bar amid challenging conditions in the aluminium industry and in the world economy at large. We were able to deliver an unparalleled performance, breaking our all-time records of production (with 912,700 metric tonnes, a 2.5% increase year-on-year) and sales (with 919,722 metric tonnes, a 3.3% increase year-on-year).
Letter to ourShareholders
Annual Report 2013 (6)
“Alba made history in 2013,
continuing to raise the bar”
Mahmood Hashim Al Kooheji
Chairman
Annual Report 2013 (7)
Taking a closer look at our main financial indicators, revenues totalled US$ 1,993 million (BD 749.3 million) with EBITDA (excluding one-off costs) of US$ 385 million (BD 145 million), reflecting Alba’s structured approach to improve its underlying performance despite lower LME prices and to deliver sound bottom-line results. This performance allowed us to offer sustainable returns and pay regular dividends to our shareholders while maintaining a solid balance sheet. Alba declared a total dividend of BD 50.7 million (US$ 135 million), equivalent to Fils 36 per share.
2013 was a difficult year for the aluminium industry, but I can affirm that Alba more equipped to prevail in difficult market conditions with the launch of Project Titan, which aims to streamline our cash cost structure by US$ 150 per metric tonnes (equates to US$ 135 million annually). This cost improvement program will provide us not only with a cutting-edge to strengthen our competitive position in the industry but also meet new challenges by optimizing our existing operations.
Looking ahead, our overarching objective of profitable growth remains a key focal point, with the expected completion of the bankable feasibility study for Alba’s sixth pot line (Line 6) in the 1st half of 2014 (and subject to our
Letter to our Shareholders
Board’s approval). Line 6 will help us realize our ambition to remain one of the largest smelters in the world by bringing Alba’s total production output to around 1.3 million metric tonnes per annum. I would like to thank our shareholders for the trust they have placed in Alba over the years. I hope that your confidence in us continues. Also, I am grateful to Alba’s Board of Directors for their strategic guidance and support in helping us build a successful Alba for the years to come; the executive management team for their leadership in reinforcing Alba’s commitment to sustainable and equitable growth; and to all employees who delivered exceptional results in 2013.
In conclusion, it gives me great pleasure to express my sincere gratitude to His Majesty the King of Bahrain, King Hamad bin Isa Al Khalifa; for the guidance of His Royal Highness the Prime Minister, Prince Khalifa bin Salman Al Khalifa; for the support of His Royal Highness the Crown Prince and Chairman of the Bahrain Economic Development Board, Prince Salman bin Hamad Al Khalifa, and to the Government of the Custodian of the Two Holy Mosques, His Majesty King Abdullah Ibn Abdul Aziz Al Saud of the Kingdom of Saudi Arabia, without whose support Alba’s accomplishments would not have been possible.
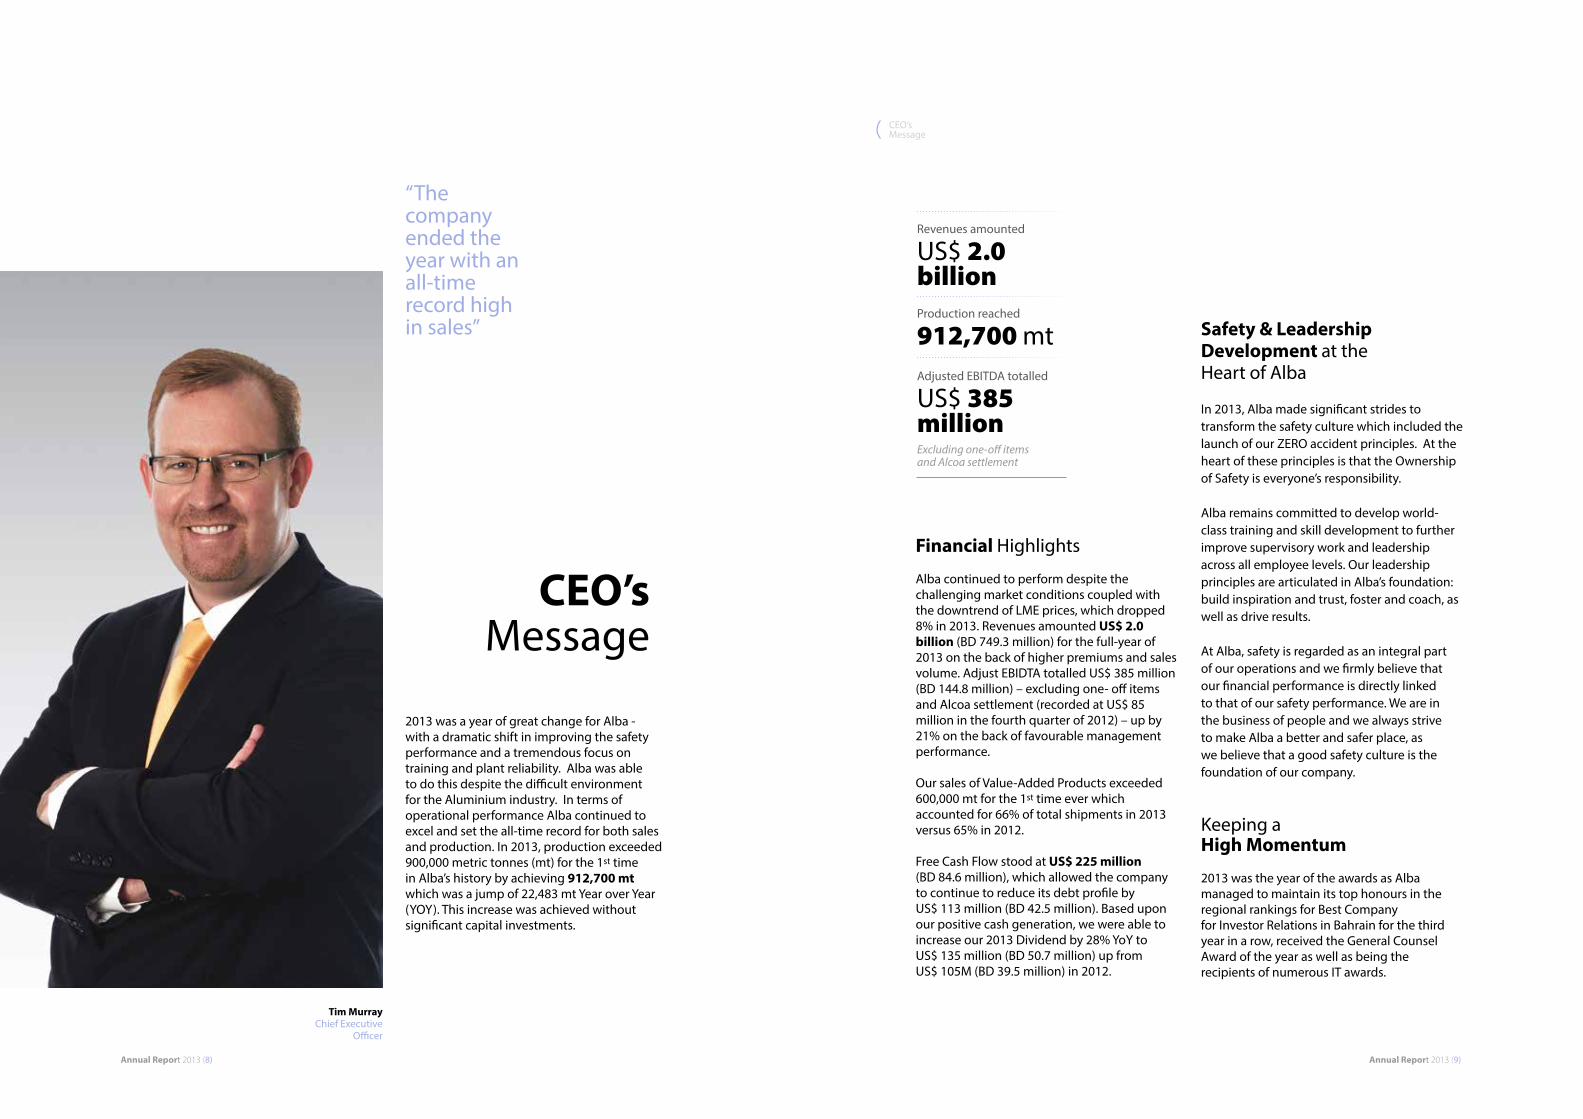
2013 was a year of great change for Alba - with a dramatic shift in improving the safety performance and a tremendous focus on training and plant reliability. Alba was able to do this despite the difficult environment for the Aluminium industry. In terms of operational performance Alba continued to excel and set the all-time record for both sales and production. In 2013, production exceeded 900,000 metric tonnes (mt) for the 1st time in Alba’s history by achieving 912,700 mt which was a jump of 22,483 mt Year over Year (YOY). This increase was achieved without significant capital investments.
CEO’s Message
Annual Report 2013 (8)
“The company ended the year with an all-time record high in sales”
Tim MurrayChief Executive
Officer
Annual Report 2013 (9)
Financial Highlights
Alba continued to perform despite the challenging market conditions coupled with the downtrend of LME prices, which dropped 8% in 2013. Revenues amounted US$ 2.0 billion (BD 749.3 million) for the full-year of 2013 on the back of higher premiums and sales volume. Adjust EBIDTA totalled US$ 385 million (BD 144.8 million) – excluding one- off items and Alcoa settlement (recorded at US$ 85 million in the fourth quarter of 2012) – up by 21% on the back of favourable management performance.
Our sales of Value-Added Products exceeded 600,000 mt for the 1st time ever which accounted for 66% of total shipments in 2013 versus 65% in 2012.
Free Cash Flow stood at US$ 225 million (BD 84.6 million), which allowed the company to continue to reduce its debt profile by US$ 113 million (BD 42.5 million). Based upon our positive cash generation, we were able to increase our 2013 Dividend by 28% YoY to US$ 135 million (BD 50.7 million) up from US$ 105M (BD 39.5 million) in 2012.
CEO’s Message
Safety & LeadershipDevelopment at the Heart of Alba
In 2013, Alba made significant strides to transform the safety culture which included the launch of our ZERO accident principles. At the heart of these principles is that the Ownership of Safety is everyone’s responsibility.
Alba remains committed to develop world-class training and skill development to further improve supervisory work and leadership across all employee levels. Our leadership principles are articulated in Alba’s foundation: build inspiration and trust, foster and coach, as well as drive results.
At Alba, safety is regarded as an integral part of our operations and we firmly believe that our financial performance is directly linked to that of our safety performance. We are in the business of people and we always strive to make Alba a better and safer place, as we believe that a good safety culture is the foundation of our company.
Keeping a High Momentum
2013 was the year of the awards as Alba managed to maintain its top honours in the regional rankings for Best Company for Investor Relations in Bahrain for the third year in a row, received the General Counsel Award of the year as well as being the recipients of numerous IT awards.
Revenues amounted
US$ 2.0 billionProduction reached
912,700 mtAdjusted EBITDA totalled
US$ 385 millionExcluding one-off items and Alcoa settlement

The Journey Continues
We believe that Alba’s strong foundations will represent the force for good in addressing the challenging conditions of aluminium industry in 2014 and the years to come. We have launched Project Titan in the last quarter of 2013 - a 2 year program which aims to improve our cash cost by US$ 150 per mt (which equates to US$ 135 million annually upon completion). This cost improvement program will help us weather the downtrend of LME prices as well as strengthen Alba’s position as a 1st quartile producer.
Continuous development is crucial to expand our operations. As global demand for aluminium products remains strong, we believe that Alba will be well-positioned to pursue further momentum and actively develop its operations with the completion of the bankable feasibility study (BFS) for Alba’s sixth pot line (Line 6) in 1st half of 2014 which will then be subject to our Board’s approval. With the addition of Line 6 we have the potential to reach a production output that will top 1.3 million metric tonnes per year.
“We have launched
Project Titan in the last quarter of
2013”
People’s Business
Alba’s achievements over the last four decades is attributable to our workforce and the Alba Labour Union. I would like to extend my sincere thanks to them, to our people who make things happen.
I also would like to take the opportunity to thank our Board of Directors for steering the company to where it is today and for their strategic guidance throughout the years.
As we enter 2014, we plan to accelerate the positive momentum from 2013 through the use of Speed, Agility and Simplicity to ensure we deliver value to all our stakeholders.
“We pledge to keep the good
momentum of 2013”
Annual Report 2013 (11)
CEO’s Message
Annual Report 2013 (10)

Annual Report 2013 (12) Annual Report 2013 (13)
Operational Highlights
2 Alba appoints Line 6 Smelter Project Director
6 Alba achieves 4 million work hours without Loss Time Injury (LTI)
9 Alba appoints Amin Sultan as the Power Station Director
13 Alba Laboratory wins top accolade
17 Alba wins Best Company for Investor Relations in Bahrain for the 3rd year at the Middle East Investor Relations Society (ME-IR) Annual Conference 2013
11 Alba Power marks the completion of Pot Lines 1 & 2 Rectiformers Replacement 15 Alba’s IT Manager wins the CIO
of the Year Award at the 9th Annual Arabian Computer News Arab Technology Awards 2013
1 Alba received the Gulf Aluminium Council (GAC)’s maiden SHE Award
5 Alba wins top award for excellence in Vocational Training
8 Alba upgrades Pot Line 5 to AP37 technology
12 Alba Board takes part in a tailored programme on effective Board practices with the GCC Board Directors Institute
16 Alba boosts efficiency with new technology at Lines 1-3
10 Alba appoints Ali Al-Baqali as the Chief Financial Officer (CFO)
3 Alba becomes member of Aluminum Extrusion Council
7 Alba’s General Counsel wins top regional award
14 Alba wins IT Team of the Year Award at the ICT Achievement Awards 2013
18 Alba sets production record of 912, 700 metric tonnes per annum (mtpa) in 2013
4 Alba wins top technology award (e-Government Excellence Award 2013)
OperationalHighlights

2012: US$ 317 million
* excluding one-off items and Alcoa SettlementEBITDA (excluding one-off items and Alcoa Settlement) up by 21% on the back of favorable management performance
2012: US$ 468 million*
* 2012 Net Debt was reclassified Net Debt down by (23%) compared to 2012This decrease is mainly attributed to repayments of long-term loans
Annual Report 2013 (14)
FinancialHighlights
Revenues
US$ 1,976 million(-0.10% Y-o-Y growth)
Free Cash Flow
US$ 225 million(-34% Y-o-Y growth)
Adjusted EBITDA*
US$ 385 million(21% Y-o-Y growth)
Net Debt
US$ 362 million(-23% Y-o-Y growth)
2012: US$ 1,978 million
Revenues down by 0.10% due to low LME prices (US$ 1,846 in FY 2013 vs. US$ 2,019 in FY 2012)
2012: US$ 341 million
Free Cash Flow amounted US$ 225 million on the back of low LME prices and high CAPEX
2012: US$ 203 million
Cash Payback to Shareholders impacted by low LME prices (8% decrease year-on-year)
2012: 1.5%
Almost stable ratio allowing the company to handle its debt burden with the ability to add on additional debt if needed
Annual Report 2013 (15)
Equity Ratio
74%(9% Y-o-Y growth)
Leverage Ratio
26%(-19% Y-o-Y growth)
Net Profit
US$ 212 million(-18% Y-o-Y growth)
Shareholders’ Equity
US$ 2,310 million(5% Y-o-Y growth)
Cash Payback to Shareholders
US$ 105 million(-48% Y-o-Y growth)
Net Debt to EBIDTA
0.94%(-36% Y-o-Y growth)
2012: 68%
Total Assets down by 3% versus 2012Shareholders’ Equity up by 5% resulting in a boost in Equity ratio
2012: 32%
Leverage ratio improved on the back of higher Equity Ratio and lower Net Debt
2012: US$ 257 million
Net Profit amounted US$212 millionThis drop is due to low LME prices and the one-time gain of Alcoa settlement in 2012
2012: US$ 2,206 million
Shareholders’ Equity up by 5% YoY to stand at US$ 2,310 million, on the back of an increase in Retained Earnings
FinancialHighlights
Description of the Company’s management and supervisory bodies
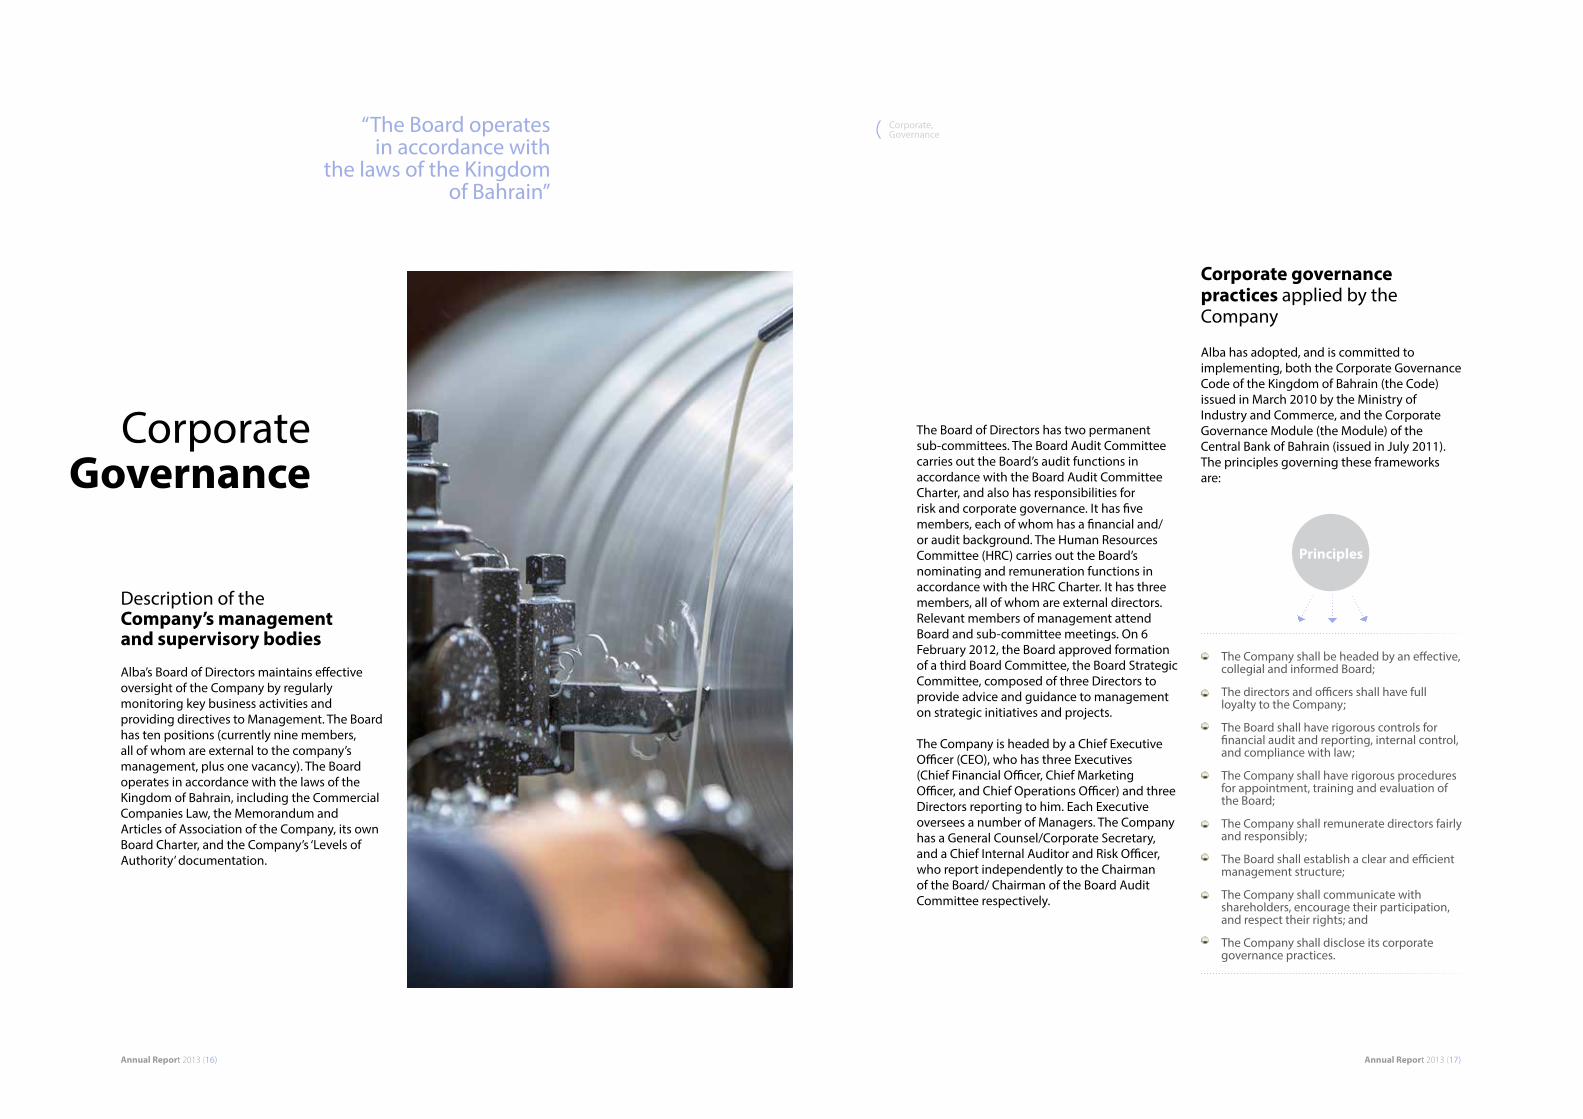
Alba’s Board of Directors maintains effective oversight of the Company by regularly monitoring key business activities and providing directives to Management. The Board has ten positions (currently nine members, all of whom are external to the company’s management, plus one vacancy). The Board operates in accordance with the laws of the Kingdom of Bahrain, including the Commercial Companies Law, the Memorandum and Articles of Association of the Company, its own Board Charter, and the Company’s ‘Levels of Authority’ documentation.
CorporateGovernance
Annual Report 2013 (16)
“The Board operates in accordance with
the laws of the Kingdom of Bahrain”
Annual Report 2013 (17)
The Board of Directors has two permanent sub-committees. The Board Audit Committee carries out the Board’s audit functions in accordance with the Board Audit Committee Charter, and also has responsibilities for risk and corporate governance. It has five members, each of whom has a financial and/or audit background. The Human Resources Committee (HRC) carries out the Board’s nominating and remuneration functions in accordance with the HRC Charter. It has three members, all of whom are external directors. Relevant members of management attend Board and sub-committee meetings. On 6 February 2012, the Board approved formation of a third Board Committee, the Board Strategic Committee, composed of three Directors to provide advice and guidance to management on strategic initiatives and projects.
The Company is headed by a Chief Executive Officer (CEO), who has three Executives (Chief Financial Officer, Chief Marketing Officer, and Chief Operations Officer) and three Directors reporting to him. Each Executive oversees a number of Managers. The Company has a General Counsel/Corporate Secretary, and a Chief Internal Auditor and Risk Officer, who report independently to the Chairman of the Board/ Chairman of the Board Audit Committee respectively.
Corporate, Governance
Corporate governance practices applied by the Company
Alba has adopted, and is committed to implementing, both the Corporate Governance Code of the Kingdom of Bahrain (the Code) issued in March 2010 by the Ministry of Industry and Commerce, and the Corporate Governance Module (the Module) of the Central Bank of Bahrain (issued in July 2011). The principles governing these frameworks are:
Principles
The Company shall be headed by an effective, collegial and informed Board;
The directors and officers shall have full loyalty to the Company;
The Board shall have rigorous controls for financial audit and reporting, internal control, and compliance with law;
The Company shall have rigorous procedures for appointment, training and evaluation of the Board;
The Company shall remunerate directors fairly and responsibly;
The Board shall establish a clear and efficient management structure;
The Company shall communicate with shareholders, encourage their participation, and respect their rights; and
The Company shall disclose its corporate governance practices.

Annual Report 2013 (18)
“Compliancewith the Code ofConduct ismonitored by Alba’s Integrity Task Force”
The Company seeks, where applicable, to exceed the minimum requirements of the Code and Module, and to implement the additional recommendations and guidance of the Code, as well as other international best practice in Corporate Governance.
The following are some of the key improvements in corporate governance instituted by the Company in recent years:
Corporate Governance Guidelines - The Company operates in line with a set of Board approved ‘Corporate Governance Guidelines’. This document is fully aligned with the above Code, and is published on Alba’s website.
Corporate Governance Report - The Board has presented a comprehensive annual ‘Corporate Governance Report’ at each Shareholders Meeting since March 2011. This report, (also available on Alba’s website), sets out Alba’s compliance with the Code and with the additional guidelines, along with explanations for areas of non-application and required disclosures.
Annual Report 2013 (19)
Code of Conduct - A Board approved ‘Code of Conduct’, on par with leading international codes of ethics, and setting-out required ethical conduct for all employees and representatives of the Company, has been launched across the Company by the Executive team through a comprehensive communication and training program. Compliance with the Code of Conduct is monitored by Alba’s Integrity Task Force, which comprises the Chief Internal Auditor, General Counsel and Director of Administration, and which reports directly to the Board Audit Committee. Monitoring tools include an independently operated confidential hotline and reporting system that provides for reporting in multiple languages by phone and intranet 24 hours a day, every day. In the fourth quarter of 2012, Alba’s development and roll-out of the Code of Conduct and confidential employee reporting system was used as a best practice case study in a Pearl Initiative/ University of Cambridge study on transparency and ethics in the Middle East.
Independent external Board survey, evaluation and training - An independent external Board survey and a training workshop were conducted in late 2013 by the GCC Board Directors Institute. Feedback from the GCC Board Directors Institute on the effectiveness of Alba’s Board and corporate governance processes was very positive, and indicated that Alba was both well above regional benchmarks, and had made significant progress since a similar review in 2011, across most elements of Corporate Governance.
Corporate, Governance
Evaluation and assessment of the Board and its Committees - The Board and its two standing sub-committees, the Board Audit Committee and the HRC, conduct annual self-evaluations and assessments using questionnaires and a discussion of gaps and areas of improvement. The results of the assessments by the sub-committees are reported to the Board.
Directors’ orientation/ handbook - A Director’s handbook consisting of key documents and other content on directors’ responsibilities serves as a reference guide for incumbent directors and to facilitate orientation of new directors.
“Alba was both well
above regional benchmarks,
and had made significant
progress since a similar review
in 2011”

Annual Report 2013 (20)
Directors’ independence - The Board conducts an annual review of directors’ independence, applying the classification criteria and guidance from the Central Bank of Bahrain and from the Code.
Conflicts of Interest - Policies are in place to prohibit a member of the Board of Directors from voting in any meeting, or participating in any business operation or activity, in which the member has a conflict of interest with the Company. Abstentions are required to be minuted. Directors are required to list directorships of all Bahraini companies, and any potential conflicts of interest through an annual declaration process.
CEO and CFO Certification of financial statements - The CEO and CFO produce a memorandum certifying each quarter’s financial statements, as well as the year-end financials.
Ownership and trading of company shares - Following the company’s dual listing on the Bahrain Bourse and the London Stock Exchange in November 2010, a process was implemented to identify and report Directors’ and Executives’ ownership and trading of company shares. The Company has issued policies on Key Persons Dealing/ Insider Trading and circulated these to all directors, officers, and other key employees identified by the Company, and has established, for all directors and officers, quarantine periods for trading in Alba shares.
Levels of Authority - In September 2013, the Board approved an updated Levels of Authority document for the Company. This document defines the limits of approvals and decision-making authority designated to specified positions of responsibility within the Company.
Succession plans - An annual review of succession plans for executives is now built into the Board agenda.
“Monitoring of internal controls is provided through
a number of internal and external assurance providers”
CorporateGovernance
Annual Report 2013 (21)
Main features of the internal control and risk management systems in relation to the financial reporting process
The Board, through the Board Audit Committee, is responsible for ensuring a sound and effective control environment. Monitoring of internal controls is provided through a number of internal and external assurance providers, including:
• Statutory Audit by our External Auditors, and discussion by the Board Audit Committee of the results of the statutory audit, including a review of the financial performance, any changes to disclosure, a subsequent events review, important accounting matters and other internal control matters;
Corporate, Governance
• Review and formal approval of financial results by the CFO, CEO, Board Audit Committee and Board;
• Co-ordination and review by Public Relations and Investor Relations department of all releases of financial results and other market-sensitive information to the market and to regulators;
• Monitoring by the Risk Management team, of progress against agreed actions for financial and other risks identified through the application of Alba’s Board approved Enterprise Risk Management Framework, and with regard to the Risk Appetite set by the Board. The Board Audit Committee reviews changes to the risk profile, together with progress on actions for key risks, on a quarterly basis;
• Internal Audit function, working from a risk-based annual internal audit plan covering key controls. The audit plan, budget, and methodologies are approved and monitored by the Board Audit Committee. On a quarterly basis, the Board Audit Committee reviews and discusses the internal audit findings, recommendations and agreed management actions, as well as progress made against prior audit findings. Additional private meetings are held between the Board Audit Committee, Chairman and the Chief Internal Auditor and Risk Officer;
• Audits carried out by the National Audit Office, and by Shareholder Audit teams;
• Board and sub-committee approvals and monitoring of Operating, Financial, Manpower and other Plans; and
• Executive and management monitoring activities (including the monitoring of Key Performance Indicators).

Annual Report 2013 (22)
Assurance is also provided through application of the Levels of Authority document for financial transactions, which are also enacted through financial reporting policies and procedures, and through IT controls in the financial reporting system. The revised Code of Conduct also sets out clear and specific expectations for accurate financial reporting.
Principal risks and uncertainties faced by the business
We encourage you to carefully consider the risks described below. Their occurrence could have a material adverse impact on our business, financial condition and results of operations, and could result in a decline in the trading price and liquidity of our securities. Our systems of governance, internal control and risk management identify and provide responses to key risks through the establishment of standards and other controls. Any failure of these systems could lead to the occurrence, or re-occurrence, of any of the risks described below:
• The cyclical nature of the Company’s industry has historically meant that there is significant aluminium price and demand volatility, and a general production overcapacity in the industry. The Company
has no control over a number of factors that affect the price of aluminium;
• The Company operates in an industry that gives rise to health, safety, security and environmental risks;
• Fire, equipment breakdown, attack on the physical or IT infrastructure, civil strike or unrest, or loss of gas, power or other utilities may result in loss of operational capability or shutdowns for significant periods, resulting in a significant adverse impact on the Company’s financial condition and results of operations;
• The loss of either of the Company’s two largest customers, or its inability to recover the receivables due from either of them, or the long-term loan extended to one of them may have a material adverse effect on its financial condition and future prospects;
• The Company relies on third-party suppliers for certain raw materials, and any disruption in its supply chain or failure to renew these contracts at competitive prices may have an adverse impact on the Company’s financial condition, results of operations and future prospects;
• The Company’s competitive position in the global aluminium industry is highly dependent on continued access to competitively priced and uninterrupted natural gas supply. An increase in the price of natural gas, or interruption in its supply, could have a material adverse effect on the Company’s business, financial condition, results of operations and future prospects;
• The Company’s business may be affected by shortages of skilled employees (including management), labour cost inflation and increased rates of attrition;
• The Company depends on the provision of uninterrupted transportation of raw materials and finished products across
“The revised Code of Conduct also sets
out clear and specific expectations“
CorporateGovernance
Annual Report 2013 (23)
significant distances. Interruption of these activities could have a material adverse impact on the company. Prices for such services (particularly for sea transport)
could increase;• The Company has a number of hedging
contracts, and has historically experienced significant mark-to-market and realised losses from certain of the Company’s derivative positions;
• The Company is exposed to foreign currency fluctuations, which may affect its financial condition;
• There is a high level of competition in the GCC aluminium market, and the Company
Corporate, Governance
may lose its market share in the GCC as its competitors increase their production
levels;• The Company’s strategy includes growth
and expansion of its operations, as well as cost savings initiatives, which may not be achieved on time or on budget;
• The Company does not insure against certain risks, and some of its insurance coverage may be insufficient to cover actual losses incurred; and
• Changes in laws or regulations, or a failure to comply with any laws or regulations, may
adversely affect the Company’s business.

Aluminium Industry
• The average LME cash price settled at $1,846 in 2013, down by 8.6% YoY as the market sentiment was adversely affected by an overall weak environment in Europe, worries over a potential tapering of QE monetary policy by Fed as well as rising concerns over China’s economic outlook
• LME inventories at 5.6 million metric tonnes; metal availability remains tight on the back of stock financing deals. In contrast to declining aluminium prices, premiums have decoupled from LME prices and remained firm despite the recent review of LME warehousing rules
• Total world consumption at record high with 50.1 million metric tonnes, up by 5.3% YoY while world production stood at 50 million metric tonnes, an increase of 4.3% YoY
• The soft pricing conditions of LME continue to impact marginal smelters. Curtailments have gained space in 2013 and led the aluminium market into deficit of 61,000 metric tonnes
• Demand for primary aluminum exceeded production for the first time since 2006 in 2013
• Global manufacturing activity expanded at the fastest pace since 2011
Products and Markets
2013 LME Cash AVG Trend (US$ mt)
Jan
Feb
Mar
Apr
May
Jun Jul
Aug
Sep
Oct
Nov
Dec
2,200
2,100
2,000
1,900
1,800
1,700
1,600
1,500
Products and Markets
Annual Report 2013 (25)
“Global manufacturing
activity expanded at the fastest pace
since 2011”
Industry Outlook for 2014
Global demand remains healthy and isexpected to grow at an average of 5% in 2014and emerging markets will continue to be thekey driver of this growth:
• World production is projected to increase by around 4.5 million metric tonnes (mt), of which 2.7 million mt will come from China alone (ramp-ups in North-western provinces) and the remaining 1.8 million mt from the Rest of the World
• Although Chinese government stressed its commitment to control primary aluminium production growth and promote energy efficiency, its policies have had little impact to date with no announcements of closures - marginal producers in China remain reluctant to cut production as smelters are considered as a key pillar of local economies
• Primary aluminium consumption to improve in Western Europe driven by the German and French demand
• North American demand to grow at a moderate rate and will be led by Brazil and South America
• Aluminium market will be oversupplied and without further production discipline, prices are likely to struggle
• Investor sentiment will be weighed down by high LME inventories, while tapering may have a negative impact on the price
• Lower LME prices will continue to pressure marginal producers to cut output in Australia and Europe
Sales Breakdown by Region
Annual Report 2013 (24)

2013 Sales at
US$2.0 billion
Metal Sales in metric tonnes (mt) up by
3.3% YoY
Value-Added Sales reached
606,294 mt
Annual Report 2013 (27)Annual Report 2013 (26)
Sales Breakdown by Product Line
“Alba Casthouse continues
to raise the bar”
Casthouse Performance
Alba Casthouse continues to raise the bar:
• Record Billet production reached 360,947 metric tonnes (mt), almost stable
• Foundry alloys volumes topped 123,683 mt, up by 9% YoY• Slab output at 114,089 mt, up by 6% versus
2012 • Value-Added production surged by around
3% YoY to stand at 598,719 mt
Alba closed 2013 Value-Added sales with anaverage of 66% versus 65% in 2012.
Downstream Markets
Our downstream markets continue to boom:
• Billets are sold to aluminium extruders which use the versatile properties of aluminium alloys to create profiles in all shapes and sizes mainly used in building applications, such as window frames or structural components
• Slabs are casted in rolling mills to produce foil stock which is re-rolled into household foil or packaging material used mainly in food or pharmaceutical industries. Other types of slabs are rolled into plates or
sheets for usage in the general engineering and building industries
• Foundry alloys are used by automotive components manufacturers to cast wheels and engine blocks
• Molten metal is sold primarily to Midal Group - one of the world’s leading cable
and rod manufacturers
Standard Ingot/Sows 3%
Productsand Markets

Midal Cables Limited, Between Bahrain & Australia Founded in 1977 | manufacture of aluminium rods and overhead electrical transmission conductors
Capral Aluminium, Australia Founded in 1936 | Australia’s largest manufacturer and distributor of aluminium profiles
Thai Metal, Thailand Founded in 1984 | One of the first wholly Thai owned extrusion companies in Thailand
CORTIZO, Spain Founded in 1972 | Prime manufacturer and distributor of industrial aluminium profiles
Service Center Metals , USA Founded in 2003 | Focused on providing metal service centres throughout the US and Canada with standard extrusions
GARMCO, Northern Gulf Founded in 1981 | supply both standard and non-standard cut-to-length aluminium sheets, coils and circles
RONAL GROUP, Switzerland Founded in 1969 | one of the most important manufacturers of light-alloy wheels for passenger and commercial vehicles
Clientele
Annual Report 2013 (28) Annual Report 2013 (29)
Clientele

Ronal Group
RONAL GROUP, founded in 1969, has its head office located in Härkingen, Switzerland and is one of the most important manufacturers of light-alloy wheels for passenger and commercial vehicles. As a long-time partner of the automotive industry, RONAL wheels are known to meet the strict requirements of global vehicle manufacturers.
The company has grown continuously and stands for customer proximity, innovative strength and quality work. The RONAL GROUP employs over 5,500 people.
A major foundry alloy customer of Alba since 2007.
Cortizo
Founded in 1972 in Padron (A Coruña, Spain), CORTIZO is the prime manufacturer and distributor of industrial aluminium profiles in Spain and European leader with an annual aluminium profile production of 45.000 tonnes in 2012.
CORTIZO puts at their clients’ disposal the know-how which has been acquired over a span of 40 years. With a production capacity of 81,500 metric tonnes and 15,000 hours per year dedicated to R & D, the company has placed itself at the forefront with specific solutions for the aluminium industry.
To date, CORTIZO has more than 32,500 dies, different in design for sectors such as automobile, transport, railroad , aeronautical, naval, wind energy, photovoltaic, military, mechanical engineering, electrical engineering, signposts, illumination, air conditioning, interiors, ephermal architecture, furniture or the signage industries.
Midal Cables
Midal Cables Limited, was established in 1977 between Intersteel, Bahrain and Olex Cables, Australia to manufacture aluminium rods and overhead electrical transmission conductors.
Adjacent to Alba’s smelter since its inception, the company has grown into a significant player in the aluminium and electrical transmission industry to span the globe. Midal Cables’ growth has propelled the industrialization of Bahrain and infrastructure in the Gulf countries and rest of the world while promoting a national skilled workforce within the company.
To date, Midal’s EC grade and Alloy Rod are sold around the world as well as being used in-house to manufacture vast range of Value-Added products including overhead electrical conductors, aluminium and aluminium alloy wires, conform products, aluminium clad steel wire etc. Value-Added products are marketed regionally and globally through marketing offices in London, Toronto and Kuala Lumpur along with the marketing offices at the production facilities.
Midal Cables has many companies under its portfolio namely ALUWHEEL, METAL FORM W.L.L, Bahrain Welding Wire Products Manufacturing Company W.L.L, MIDAL KABLO SANAYI VE TICARET A.S; 3 additional companies will join the Group in mid-2014 once the plant’s construction is complete which are Midal Cables International Pty Ltd (Australia), Midal Cables International Limitada ( Mozambique) and Midal Cables Saudi Arabia LLC.
Thai Metals
Thai Metals was founded in 1984 and was one of the first wholly Thai owned extrusion companies in Thailand. Initially the company traded exclusively in the architectural field providing extrusions for further processing into doors & windows by other local companies.
Throughout the years the application of extrusions manufactured by Thai Metals has expanded into heat sinks, electric motor bodies, measuring instruments, lighting poles curtain walling, ladders and motor vehicle components.
In addition to providing the hardware, Thai Metals also advises its customers on the best use of aluminium extrusions, on the best alloys and tempers to use as well as on the design of extrusion shapes for best manufacturing.
Thai Metals joined Alba’s portfolio of clientele since 2001.
Capral
Capral is an Australian company listed on the ASX (Code: CAA). It commenced operations in Australia in 1936 and is Australia’s largest manufacturer and distributor of aluminium profiles, with net assets of approximately $100 million. The company has a national footprint of world class aluminium extrusion plants, with 8 operating presses with annual capacity of 75KT.
Capral’s manufacturing footprint includes extrusion and distribution facility in Victoria, New South Wales, Queensland, South Australia and Western Australia and all have the ability to supply world class products at short lead times.
Garmco
In 1981, GARMCO was established as a joint venture between the governments of the Kingdom of Bahrain, Saudi Arabia, Sultanate of Oman, Qatar, Kuwait & Iraq.
Strategically located in the Northern Gulf, GARMCO supply both standard and non-standard cut-to-length aluminium sheets, coils and circles used for a wide range of applications from food containers and stylish up-market hollowware to high-profile architecture and paint industry.
To date, GARMCO is the largest aluminium rolling mill (165,000 metric tonnes) in the Middle East with offices spread across the world in Australia, Europe, Far-East, Middle East and North America.
Service Center Metals
Service Center Metals is one of the most recent and modern extrusion companies in the US. Based in Prince George, Virginia, it was founded in 2003 with a particular focus on providing metal service centres throughout the US and Canada with standard extrusions. Operating two presses the company has a production capacity of over 47 000 metric tons and offers more than 1200 products in 6063 and 6061 aluminium alloy. SCM utilizes a high degree of automated processing equipment and innovative operations planning philosophy that enable it to run at rapid turnover and superior productivity whilst maintaining top performance in quality, health and safety standards.
SCM is proud of the rapid growth in its chosen market niche and has built a great reputation for good machinability, high mechanical strength and elongation properties of its products which are put to action in engineering, machining and defense applications.
Annual Report 2013 (30) Annual Report 2013 (31)
Clientele
“Our downstream markets continue
to boom”

Safety is our number one priority both at the work place and at home. We are in the business of people and we act as ONE company. Employees are our most valuable asset and Alba continuously works towards promoting the health and well-being of employees, fostering a safe workplace and protecting the environment for the benefit of current and future generations.
Safety,Health and Environment
Annual Report 2013 (32)
“Ownership of Safety is everyone’s
responsibility”
Annual Report 2013 (33)
Safety, Healthand Environment
Occupational Health
Industrial health is at the heart of Alba’s safety initiatives whereby the company adopts continuous measures to control and reduce any hazards to employees’ health, as well as conduct different programmes to include periodic medical check-ups, summer training, campaigns on safety and heat-related issues, occupational health awareness, etc.
An ergonomic team within the Safety, Health & Environment (SHE) department was established with the objective to develop procedures for identifying, evaluating and controlling risk factors arising due to work-related ergonomic hazards, and accordingly adapting the job and workplace to the employee’s capabilities. To date, six ergonomic problems were evaluated and solved in early 2013.
Heat stress management standards were updated and prescribed for employees engaged in operations involving high temperature or strenuous physical activities that have a high risk of heat stress related illness and/or injuries, and in operational areas such as pot rooms, casthouse, carbon, and construction sites.
Workplace Safety
Safety starts from within and Alba has a central role to play in order to improve the personal wellness of its workforce. One of the greatest challenges to create effective Safety initiatives is to convince workers to actively participate in them - the key to success is behaviour.
For this purpose, we launched our ZERO accident principles which are (1) OWNERSHIP of Safety is everyone’s responsibility (2) Working SAFELY is a condition of employment (3) All workplace injuries and illnesses are PREVENTABLE. In addition the ‘Keep the Safety Momentum Alive in Alba’ campaign was the main highlight of 2013, which targeted primarily the shop floor workers who were encouraged to do safety observations in areas outside of their normal workspaces during the difficult summer months. Along with improving the employees’ awareness on working safely, it allowed them to get more familiar with the operations of different departments within the company.
The Near-Miss Campaign is another aspect that has been given an increased importance in 2013. Employees are being educated, encouraged and trained with the help of the management to report the near-miss incidents to better enhance Safety at work. Each near-miss teaches new lessons and thorough reporting is key to preventing accidents.
Safety First
Zero Accidents Week‘Keep the Safety Momentum Alive in Alba’
‘The Near-Miss Campaign’ Contractors safety programmes
Department-led SHE WeeksHeat Stress Management

In addition, a consultant, specialising in the evaluation of equipment and machines, has been contracted to assess all machinery in Alba with the aim to identify all critical aspects and associated hazards that could possibly result in injuries to employees, along with a systematic plan to replace or upgrade these machines.
Other safety highlights include the Department-led SHE Weeks, Zero Accidents Week, Heat Stress Management, safety meetings, contractors safety programmes, etc., which were successfully implemented to strengthen the key component of Alba’s charter: ‘If you don’t work safely, you don’t work here’.
Apart from the department-led SHE Weeks, two main SHE weeks were held in 2013. The first SHE Week, held from February 25 to March 4, 2013, aimed at propagating the safety principles of Alba and increasing safety awareness amongst the employees. The Second SHE Week (Summer SHE Week), held from June 30 to July 4, 2013, focussed on increasing summer safety awareness by addressing various topics such as heat stress, heat exhaustion, food habits, etc.
Environment
Alba has earned international praise and recognition for being continuously committed to implement the highest environmental standards across the organisation.
Alba meets with the environmental representatives of Bahrain’s other national industries such as Bapco, GPIC, Garmco, Tatweer and BANAGAS on a quarterly basis to discuss the latest national and international environmental developments. These organisations also share between them new environmental projects and developments that could benefit the country and improve the contribution of these industries towards a better and more sustainable national environment.
The SHE team has been also supporting the Line 6 project feasibility study team by providing them with the required environmental data such as air emission and effluent trends as well as all the applicable national environmental laws and legislations.
Annual Report 2013 (34)
“Alba has earned international
praise and recognition”
Safety, Healthand Environment
The target to reduce un-recycled waste (solid, liquid and gas) has been achieved – representing a reduction of 24% in 2013 versus 2012. Plant-wide emission level for fluoride was reduced by 24% in 2013 versus 2012 (0.92 kg/mt Al versus 1.22 kg/mt AL). The plant-wide emission level for particulates increased from 2.53 kg/mt Al in 2012 to 2.58 kg/mt in 2013 - a 2% YoY increase due to the maintenance work carried out for the pollution control equipment for Reduction Line 5, and is expected to return to its normal level in 2014. Treated sewage water from STP 1 and 2 was about 178,377 m3 in 2013, most of which was used for landscaping irrigation.
In the Future
To better enhance the effectiveness of SHE Department, six lead auditors are being prepared and trained in Safety, Health and Environment international standard management systems. Six personnel have attended and successfully completed the 7-day comprehensive and integrated training course to be certified as lead auditors for both, ISO 14001:2004 and OHSAS 18001:2007. This will upgrade the skills of these key personnel in order to play a positive role in bolstering the safety, health and environmental values in their respective business units.
As we march ahead, Alba will remain focused on all aspects of safety, healthand environment by implementing projects that will strengthen the core values of the company.
Annual Report 2013 (35)

Annual Report 2013 (36)
As a leading employer of Bahrainis, Alba strives to help its employees to reach their full potential and truly believes that the best outcomes are achieved through teamwork across the company.
Alba has always endeavoured to create a positive and nurturing social climate within and outside the company where employees can find compelling, rewarding and inspiring experiences.
Training andDevelopment
“Alba strives to help its employees
to reach their full potential”
Annual Report 2013 (37)
For over forty years, Alba has been committed to providing Bahraini nationals with meaningful training opportunities that help build successful careers. As one of the Kingdom’s leading companies, we view employee development as a key economic and social responsibility. Alba has continued to strengthen its learning culture in 2013, with an ever increasing number of employees benefiting from a range of courses and training programmes.
We participate and work closely with many national organisations and programmes including the Crown Prince Youth Training Programme, Crown Prince International Scholarship Programme, inJazz Bahrain and the Developing Secondary Vocation Educational project—all providing trainees with the knowledge, skills, tools and technical on-the-job training they need for successful employment.
Training andDevelopment
The main focus of our custom-made training programmes has been to develop courses that are as comprehensive as possible in order to meet the knowledge and skill requirements of every Alba employee. To achieve the same, we have introduced focus areas to help structure the training programme objectives.
• The Executive Education Series 2013The Executive Education Series 2013 was carefully designed to enable members of the Executive, Senior and Middle Management Team to gain vital insights into the areas of leadership. Some of the courses include Leadership and Change Management, Finance 101 and the 1- Day MBA Programme, amongst other management courses.
• Soft Skills and Leadership SeriesA diverse range of management and leadership training programmes were conducted at all levels of management to provide them the utmost support towards their career development with Alba. Some of them are: Project Management Professionals Program (PMP), Industrial and Employee Relations, The Supervisory Management Development Programme and The Miracle Team Building Programme.
The Executive Education Series 2013Soft Skills and Leadership SeriesTechnical TrainingSafety, Health & Environmental Training Developing Future Bahraini Leaders
Focus Areas

Annual Report 2013 (38)
• Technical TrainingSpecialised Technical Training Programmes are designed and delivered by experienced instructors, which provide employees with learning opportunities in the areas of operations and maintenance as well as ensure they obtain the latest industry developments. Some of the courses conducted are: Casthouse Hot Metal Plant Hydraulics Course, Control room operations of Power Station, Welding Training & Licensing of Reduction Services, Training Course on Pump Maintenance, etc.
• Safety, Health & Environmental TrainingThe safety and health of our employees are of the utmost importance to us, and several courses are organised throughout the year to strengthen the culture of safety across the organization. The main emphasis of these training courses is to ensure that employees are well informed and capable to spread this culture within the company and outside, and emerge as ambassadors for safety.
A key initiative has been taken to develop audio-visual materials, namely short films that demonstrate the safe methods for completing critical tasks and Job Safe Practices (JSPs) were produced in-house with the support from various departments across Alba.
Some of the other key course materials that took place in 2013 included: Course on Behavior Observations, Critical Task Analysis Job Safe Practices, Planned Job Observation, Working at Heights, the Complete Supervisory 5-Day SHE Course, as well as New Employees Non-Management SHE Induction Programme.
Training andDevelopment
Annual Report 2013 (39)
• Developing Future Bahraini LeadersAs a corporate citizen proud of its Bahraini roots, Alba continues to achieve success with its Bahrainisation goals and thereby strengthen its reputation as an employer of choice amongst Bahraini nationals who comprise 87 percent of its total workforce.
A number of initiatives to develop Bahraini Nationals have been implemented such as, Training Development Programme (TDP), Skill Matrix and Higher Education in various fields. The TDP is one of the biggest successes of Alba and has strengthened the quality of Bahrainisation. The goal of the programme is to identify promising Bahraini employees, tap into their potential and groom them to become future leaders. As part of their professional development plan, the TDP trainees will be sent to universities outside Bahrain to acquire higher academic qualifications to equip them in their tasks.
Currently, Alba has a total of four employees who are sponsored to undergo MBA-programme overseas and 10 employees are undergoing an Executive MBA program in Bahrain.
Bright Future
At Alba, we have long recognised the importance of world-class training and development of skills as a primary need to remain a leader in the industry. We remain fully committed to the development of the national workforce and continually strive to provide our employees with a comprehensive range of training programmes, development initiatives, educational opportunities and workshops to allow them to become the very best in their field.
“The TDP is one of the biggest successes of Alba and has
strengthened the quality of Bahrainisation”
Training andDevelopment

As a flagship of Bahrain’s economy, Alba recognises the importance of being a responsible corporate citizen. We believe that it is our responsibility to act conscientiously, operate sustainably, and contribute to the communities in which we work and live in.
Since the beginning of operations in 1971, Alba has remained committed to Corporate Social Responsibility (CSR) engagements. Our approach to corporate responsibilities is the same as our commitment towards our business goals and strategies. In our 43-year history, Alba - through a variety of community services, sponsorships, activities and programmes – has established a strong presence as a supporter of worthy causes and development of the society.
Corporate Social
Responsibility
Annual Report 2013 (40)
“An important part of Alba’s growth
strategies is to give back to the society”
Annual Report 2013 (41)
Alba fulfils its commitments to society through collaborative partnerships with industry partners, non-government organisations and various other social investment programmes that are designed to promote the development of the communities. Alba demonstrates its support through philanthropy, donations of funds, resources, and in-kind services to charitable, non-profit, and/or community initiatives.
An important part of Alba’s growth strategies is to give back to the society for the common good and one of the most effective ways to bring affirmative change in society is through voluntary service – Alba Community Services is one of the most prominent voluntary committees that serves the community at large with the active participation of Alba employees and their families.
This Committee plays a key role in encouraging the spirit of philanthropy and employee volunteer work amongst Alba workforce. As a part of the community service programme, Alba volunteers participate in numerous initiatives, some of which are: visit children in
Corporate SocialResponsibility
hospitals; provide needy items to orphanages; visit elderly in care homes around Bahrain; conduct health and safety awareness campaigns in neighbouring communities; hold sports events as well as gatherings for children and adults with special needs.
In addition, Alba ensured community involvement on a larger scale by backing some important events and programmes in the Kingdom with the most significant one being the inaugural Bahrain International Corporate Social Responsibility Conference and Exhibition 2013, which provided opportunities for community projects and initiatives. Some other important matters were backed by Alba through sponsorships -- Elderly Care, Child Development, Women’s Enhancement and Causes, Drug Awareness, as well as Ramadan Charities, Bahrain Red Crescent Society, and NGO projects by the Ministry of Social Development in various parts of Bahrain.
On the business front, Alba supported various exhibitions and forums that put Bahrain on an international platform to include CRU’s 18th
World Aluminium Conference, 2nd Middle East

Process Engineering Conference & Exhibition 2013, Aluminium Symposium 2013, Gulf Strategic Conference 2013, Invest in Bahrain Forum & Exhibition 2013, Aluminium Middle East 2013, United Nations Public Services Forum Day and Awards 2013, amongst others.
Alba recognises sports too as an important part of self-development to fostering team spirit. In line with the same, Alba has been a key supporter of diverse sporting activities both at the corporate and national level. In 2013, Alba participated as well as sponsored many sporting activities and competitions - Bahrain Baseball Majors, Khalid bin Hamad Horseracing Cup, Alba Golf Championship, Bahrain Cricket Association, Chevron Cup for Companies and Establishments, Charity Raft Race by Rotary Club of Salmaniya, Alba Ramadan Sports Tournament and Alba Football Team amid others. One of the biggest achievements for Alba was the launch of the first-ever Women’s Basketball team, thereby
supporting and promoting the women in an industrial environment.
Another facet of Alba’s CSR is the numerous health and well-being programmes, activities and workshops that are conducted by the Alba Health Care Centre for the benefit of Alba employees’ and their families.
This year various health topics were focussed upon: awareness sessions on prominent diseases such as Cancer, Diabetes, Industrial Health; workshops on work-related stress, healthy living, drug awareness; activities such as blood donation campaigns, flu vaccinations, medical check-ups during SHE Weeks, First-Aid refresher courses and much more.
To this extent, Alba backed numerous health care initiatives in Bahrain with the most prominent being the financial and logistical support towards the Electronic Library Project for the Bahrain Medical Society, and other
Annual Report 2013 (42)
projects such as the Al-Rhama Centre, which works towards health and rehabilitative care for young children and drug awareness campaign by the Southern Governorate.
Furthermore, Alba maintained its focus on education by investing in the Crown Prince International Scholarship Programme (CPISP) and providing financial support towards the establishment of Alba Kindergarten Royal Charity Organisation. Alba has been a top employer of students graduating from various educational institutes such as InJaz Bahrain and Bahrain Training Institute, where graduates are given first-hand opportunity to work in Alba.
The company further strengthened its position as a leading employer of Bahrainis by continuing to focus on various employee development programmes - Annual Summer Training Programmes and Training & Development Programme, as well as employee welfare programmes such as Annual Summer Camp, Annual Family Day and competitions and activities for employees’ children, amongst others.
Alba constantly strives to increase its involvement in CSR initiatives and strengthen its position as an agent for positive change in the larger community. The company has been applauded for integrating CSR into their long-term business strategies and the contribution made towards the development of its employees as well as the communities.
In coming times, Alba will continue to remain focussed on fostering greater community involvement, increased employee participation in philanthropic activities, and in supporting ventures that enhance the quality of life for its employees and the society at large.
“An important part of Alba’s growth
strategies is to give back to the society”
Annual Report 2013 (43)
For a bettersociety
Fostering greater community involvement
Increased employee participation in philanthropic activities
Supporting ventures that enhance the quality of life
Corporate SocialResponsibility
Looking Ahead

Annual Report 2013 (42) Annual Report 2013 (45)
INDEPENDENT AUDITORS’ REPORT TO THE SHAREHOLDERS OF ALUMINIUM BAHRAIN B.S.C. Report on the Financial Statements
We have audited the accompanying financial statements of Aluminium Bahrain B.S.C. (‘the Company’), which comprise the statement of financial position as at 31 December 2013 and the state-ments of comprehensive income, cash flows and changes in equity for the year then ended, and a summary of significant accounting policies and other explanatory information.
Board of Directors’ Responsibility for the Financial StatementsThe Board of Directors is responsible for the preparation and fair presentation of these financial state-ments in accordance with International Financial Reporting Standards, and for such internal control as the Board of Directors determines is necessary to enable the preparation of the financial state-ments that are free from material misstatement, whether due to fraud or error.
Auditors’ Responsibility Our responsibility is to express an opinion on these financial statements based on our audit.
We conducted our audit in accordance with International Standards on Auditing. Those standards require that we comply with ethical requirements and plan and perform the audit to obtain reason-able assurance about whether the financial statements are free from material misstatement.
An audit involves performing procedures to obtain audit evidence about the amounts and disclosures in the financial statements. The procedures selected depend on the auditors’ judgement, including the assessment of the risks of material misstatement of the financial statements, whether due to fraud or error. In making those risk assessments, the auditor considers internal control relevant to the entity’s preparation and fair presentation of the financial statements in order to design audit procedures that are appropriate for the circumstances, but not for the purpose of expressing an opinion on the effectiveness of the entity’s internal control. An audit also includes evaluating the ap-propriateness of accounting policies used and the reasonableness of accounting estimates made by the Board of Directors, as well as evaluating the overall presentation of the financial statements.
We believe that the audit evidence we have obtained is sufficient and appropriate to provide a basis for our audit opinion. Opinion In our opinion, the financial statements present fairly, in all material respects, the financial position of the Company as of 31 December 2013 and its financial performance and its cash flows for the year then ended in accordance with International Financial Reporting Standards. Report on Other Regulatory RequirementsAs required by the Bahrain Commercial Companies Law we report that:a. the Company has maintained proper accounting records and the financial statements are in
agreement therewith; and b. the financial information contained in the report of Board of Directors is consistent with the
financial statements. We are not aware of any violations of the Bahrain Commercial Companies Law, the Central Bank of Bahrain (CBB) Rule Book (applicable provisions of Volume 6) and CBB directives, regulations and associated resolutions, rules and procedures of the Bahrain Bourse or the terms of the Company’s memorandum and articles of association during the year ended 31 December 2013 that might have had a material adverse effect on the business of the Company or on its financial position. Satisfactory explanations and information have been provided to us by the management in response to all our requests.
12 February 2014Manama, Kingdom of Bahrain
Ernst & YoungP.O. Box 14014th Floor - South TowerBahrain World Trade CenterManama, Kingdom of BahrainTel: +973 153 5455 Fax: +973 1753 [email protected]/menaC.R. No. 6700
Financial Statements
31 December 2013

Annual Report 2013 (46) Annual Report 2013 (47)
2013 2012 Note BD ‘000 BD ‘000
ASSETSNon-current assetsProperty, plant and equipment 3 868,318 901,779Long term receivable 4 6,877 10,314
875,195 912,093
Current assetsInventories 5 144,930 143,564 Current portion of long term receivable 4 3,438 3,438 Accounts receivable and prepayments 6 85,375 91,139Other assets 4,800 -Derivative financial instruments 17 - 104Bank balances and cash 7 64,540 61,605
303,083 299,850
TOTAL ASSETS 1,178,278 1,211,943 EQUITY AND LIABILITIESEquityShare capital 8 142,000 142,000Treasury shares 9 (5,157) (4,087)Statutory reserve 11 71,000 71,000Capital reserve 12 249 249Retained earnings 629,381 600,683Proposed dividend 13 30,978 19,773
Total equity 868,451 829,618
Non-current liabilitiesBorrowings 14 84,402 77,096Derivative financial instruments 17 5,313 23,996Employees’ end of service benefits 15 (a) 930 915
90,645 102,007
Current liabilitiesBorrowings 14 116,432 160,303Accounts payable and accruals 16 97,960 106,585Derivative financial instruments 17 4,790 13,430
219,182 280,318
Total liabilities 309,827 382,325
TOTAL EQUITY AND LIABILITIES 1,178,278 1,211,943
............................................................................. ............................................................................. ............................................................................
Mahmood H. Al Kooheji Tim Murray Yousif Taqi Chairman Chief Executive Officer Director
Statement of Financial PositionAt 31 December 2013
The attached notes 1 to 27 form part of these financial statements
2013 2012 Note BD ‘000 BD ‘000
Sales 749,338 743,725
Cost of sales (640,751) (638,515)
GROSS PROFIT 108,587 105,210
Other income 18 7,304 39,378Selling and distribution expenses (17,574) (17,838)Administrative expenses (30,609) (27,347)Gain (loss) on foreign exchange translation 211 (1,346)Directors’ fees 22 (190) (190)Finance costs 19 (5,823) (7,182)
PROFIT FOR THE YEAR BEFORE DERIVATIVES 61,906 90,685
Gain on revaluation/settlement of derivative financial instruments (net) 17 17,871 5 ,860
PROFIT FOR THE YEAR 19 79,777 96,545 Other comprehensive income for the year - -
TOTAL COMPREHENSIVE INCOME FOR THE YEAR 79,777 96,545
Basic and diluted earnings per share (fils) 10 57 68
............................................................................. ............................................................................. ............................................................................
Mahmood H. Al Kooheji Tim Murray Yousif Taqi Chairman Chief Executive Officer Director
The attached notes 1 to 27 form part of these financial statements
Statement of Comprehensive IncomeYear ended 31 December 2013

Annual Report 2013 (48) Annual Report 2013 (49)
2013 2012 Note BD ‘000 BD ‘000
OPERATING ACTIVITIESProfit for the year 79,777 96,545Adjustments for: Depreciation 3 77,831 77,573 Provision for employees’ end of service benefits 15 (a) 844 814 Provision for impairment of inventories 5 339 151 Provision for impairment of receivables - net (51) (1,064) Gain on revaluation of derivative financial instruments 17 (27,219) (27,648) (Gain) Loss on disposal of property, plant and equipment (1,391) 36 Write off of property, plant and equipment - net book value 124 16 Write off of impairment provision of inventories 5 (62) (151) Interest income 18 (249) (389) Finance costs 19 4,759 6,121 Cost of Employees’ Stock Incentive Plan 19 680 765
135,382 152,769Working capital changes: Inventories (1,643) 14,456 Accounts receivable and prepayments 5,815 (19,874) Accounts payable and accruals (refer note a below) (8,553) 6,547
Cash from operations 131,001 153,898Employees’ end of service benefits paid 15 (a) (829) (839)
Net cash flows from operating activities 130,172 153,059
INVESTING ACTIVITIESPurchase of property, plant and equipment 3 (57,512) (32,724)Proceeds from disposal of property, plant and equipment 14,409 127Other assets (4,800) -Interest received 18 249 389
Net cash flows used in investing activities (47,654) (32,208)
FINANCING ACTIVITIESRepayment of long term receivable 3,437 3,439Borrowings availed 314,655 204,920Borrowings repaid (351,220) (284,394)Finance costs paid (refer note a below) (4,831) (6,213)Dividends paid (39,488) (76,271)Purchase of treasury shares (2,652) (805)Proceeds from resale of treasury shares 516 591
Net cash flows used in financing activities (79,583) (158,733)
INCREASE /(DECREASE) IN CASH AND CASH EQUIVALENTS 2,935 (37,882)
Cash and cash equivalents at 1 January 61,605 99,487
CASH AND CASH EQUIVALENTS AT 31 DECEMBER 7 64,540 61,605
Non-cash item:Movements in unpaid finance cost amounting to BD 72 thousand is excluded from the movement in accounts payable and accruals (2012: BD 92 thousand).
The attached notes 1 to 27 form part of these financial statements
Statement of Cash FlowsYear ended 31 December 2013
Share Treasury Statutory Capital Retained Proposed capital shares reserve reserve earnings dividend Total Note BD ‘000 BD ‘000 BD ‘000 BD ‘000 BD ‘000 BD ‘000 BD ‘000
Balance at 31 December 2011 142,000 (5,029) 71,000 249 544,064 56,509 808,793
Total comprehensive income for the year - - - - 96,545 - 96,545
Net movement in treasury shares - 177 - - - - 177
Amortisation of the cost of treasury shares held for Employees’ Stock Incentive Plan - 765 - - - - 765
Loss on resale of treasury shares - - - - (391) - ( 391)
Final dividend for 2011 approved and paid 13 - - - - - (56,495) ( 56,495)
Excess of final dividend for 2011 reversed 13 - - - - 14 (14) -
Interim dividend for 2012 proposed and paid 13 - - - - (19,776) - ( 19,776)
Proposed final dividend for 2012 13 - - - - (19,773) 19,773 -
Balance at 31 December 2012 142,000 (4,087) 71,000 249 600,683 19,773 829,618
Total comprehensive income for the year - - - - 79,777 - 79,777
Net movement in treasury shares - (1,749) - - - - ( 1,749)
Amortisation of the cost of treasury shares held for Employees’ Stock Incentive Plan - 679 - - - - 679
Loss on resale of treasury shares - - - - (386) - ( 386)
Final dividend for 2012 approved and paid 13 - - - - - (19,759) ( 19,759)
Excess of final dividend for 2012 reversed 13 - - - - 14 (14) -
Interim dividend for 2013 proposed and paid 13 - - - - (19,729) - ( 19,729)
Proposed final dividend for 2013 13 - - - - (30,978) 30,978 -
Balance at 31 December 2013 142,000 (5,157) 71,000 249 629,381 30,978 868,451
The attached notes 1 to 27 form part of these financial statements
Statement of Changes in EquityYear ended 31 December 2013
Annual Report 2013 (50) Annual Report 2013 (51)
1 ACTIVITIES Aluminium Bahrain B.S.C. (“the Company”) was incorporated as a Bahrain Joint Stock Company (closed) in the Kingdom of Bahrain and registered with the Ministry of Industry and Commerce under commercial registration (CR) number 999.
Subsequent to the Initial Public Offering (IPO), the Company became a Bahrain Public Joint Stock Company effective 23 November 2010 and its shares were listed on the Bahrain Bourse and Global Depositary Receipts were listed on the London Stock Exchange. The Company has its registered office at 150 Askar Road, Askar 951, Kingdom of Bahrain.
The Company’s majority shareholder is Bahrain Mumtalakat Holding Company B.S.C. (c) (Mumtalakat), a company wholly owned by the Government of the Kingdom of Bahrain through the Ministry of Finance, which holds 69.38% of the Company’s share capital.
The Company is engaged in manufacturing aluminium and aluminium related products. The Company owns and operates a primary aluminium smelter and the related infrastructure. The Company also has representative sales branch offices in Zurich, Switzerland and Hong Kong.
On 3 September 1990, the Company entered into a Quota Agreement between the Company, the Government of the Kingdom of Bahrain (GB), SABIC Industrial Investments Company (SIIC) and Breton Investments Limited (Breton). The Quota Agreement remains in full force and effect and was not amended with respect to the transfer of GB’s shareholding in the Company to Mumtalakat. Consequent to the purchase of shares held by Breton in 2010, Breton ceased to be a shareholder of the Company, thereby revoking its entitlement to rights and obligations under the Quota Agreement, including the right to require the Company to sell the eligible quota of aluminium to Breton at a specified price.
On 25 May 2010, Mumtalakat provided a letter to the Company whereby it irrevocably and unconditionally waived its rights under the Quota Agreement requiring the Company to sell the eligible quota of aluminium to Mumtalakat. Consequently, as a result of this waiver the Company is no longer under an obligation to sell any part of its production to Mumtalakat. The Company is now free to sell 69.38% of its production to third- party customers on commercial terms. Mumtalakat has also acknowledged that it is under an obligation to purchase its quota of aluminium produced by the Company, should the Company decide to sell Mumtalakat’s quota in accordance with the Quota Agreement. SIIC has not given a corresponding written waiver to the Company as at the date of approval of these financial statements.
These financial statements were authorised for issue in accordance with a resolution of the Directors on 12 February 2014.
Notes to the Financial StatementsAt 31 December 2013
2 SUMMARY OF SIGNIFICANT ACCOUNTING POLICIES
Basis of preparation The financial statements of the Company have been prepared in accordance with International Financial Reporting Standards (“IFRS”) issued by the International Accounting Standards Board (“IASB”) and in conformity with the Bahrain Commercial Companies Law, applicable requirements of the Central Bank of Bahrain Rule Book and associated resolutions, rules and procedures of the Bahrain Bourse.
The financial statements have been presented in Bahraini Dinars (BD). However, the Company’s functional currency is US Dollars (USD) in respect of sales and raw material purchases. The Company uses the pegged exchange rate of 0.376 to translate USD into BD equivalent.
The financial statements are prepared under the historical cost convention modified to include the measurement at fair value of derivative financial instruments.
New and amended standards and interpretations as of 1 January 2013The accounting policies adopted are consistent with those of the previous financial year, except for the following amended IFRSs effective as of 1 January 2013 which had no impact on the Company’s financial position, performance or its disclosures:
• IAS1PresentationofItemsofOtherComprehensiveIncome–AmendmentstoIAS1• IAS1Clarificationoftherequirementforcomparativeinformation(Amendment)• IFRS7FinancialInstruments:DisclosuresOffsettingFinancialAssetsandFinancial Liabilities Amendments to IFRS 7• IFRS13FairValueMeasurement
IAS 1 Presentation of Items of Other Comprehensive Income – Amendments to IAS 1The amendments to IAS 1 introduce a grouping of items presented in other comprehensive income (OCI). Items that could be reclassified (or recycled) to profit or loss at a future point in time (e.g., net gain on hedge of net investment, exchange differences on translation of foreign operations, net movement on cash flow hedges and net loss or gain on available-for-sale financial assets) now have to be presented separately from items that will never be reclassified (e.g., actuarial gains and losses on defined benefit plans and revaluation of land and buildings). The amendment affected presentation only and had no impact on the Company’s financial position or performance.
These amendments clarify the difference between voluntary additional comparative information and the minimum required comparative information. An entity must include comparative information in the related notes to the financial statements when it voluntarily provides comparative information beyond the minimum required comparative period. The amendments clarify that the opening statement of financial position (as at 1 January 2012 in the case of the Company), presented as a result of retrospective restatement or reclassification of items in financial statements does not have to be accompanied by comparative information in the related notes. The amendments have no impact on the Company’s financial position or performance or notes to the financial statements as it had no restatement, reclassification or change in accounting policies.
IFRS 7 Financial Instruments: Disclosures Offsetting Financial Assets and Financial LiabilitiesAmendments to IFRS 7The amendment requires an entity to disclose information about rights to set-off financial instruments and related arrangements (e.g., collateral agreements). The disclosures would provide users with information that is useful in evaluating the effect of netting arrangements on an entity’s financial position. The new disclosures are required for all
Notes to the Financial StatementsAt 31 December 2013

Annual Report 2013 (52) Annual Report 2013 (53)
2 SUMMARY OF SIGNIFICANT ACCOUNTING POLICIES [continued] New and amended standards and interpretations as of 1 January 2013 (continued) recognised financial instruments that are set off in accordance with IAS 32. The disclosures also apply to recognised financial instruments that are subject to an enforceable master netting arrangement or similar agreement, irrespective of whether the financial instruments are set off in accordance with IAS 32. As the Company is not setting off financial instruments in accordance with IAS 32 and does not have relevant offsetting arrangements, the amendment does not have an impact on the Company.
IFRS 13 Fair Value MeasurementIFRS 13 establishes a single source of guidance under IFRS for all fair value measurements. IFRS 13 does not change when an entity is required to use fair value, but rather provides guidance on how to measure fair value under IFRS when fair value is required or permitted. The application of IFRS 13 has not materially impacted the fair value measurements carried out by the Company. Additional disclosures where required, are provided in the individual notes relating to the assets and liabilities whose fair values were determined. Fair value hierarchy is provided in note 24.
Standards issued but not yet effectiveStandards issued but not yet effective up to the date of issuance of the Company’s financial statements are disclosed below. The Company expects these standards issued to be applicable at a future date. The Company intends to adopt these standards if applicable, when they become effective:
IFRS 9 Financial InstrumentsIFRS 9, as issued, reflects the first phase of the lASB’s work on the replacement of IAS 39 and applies to classification and measurement of financial assets and financial liabilities as defined in IAS 39. In subsequent phases, the lASB is addressing hedge accounting and impairment of financial assets. The adoption of the first phase of IFRS 9 will have an effect on the classification and measurement of the Company’s financial assets. The Company will quantify the effect in conjunction with the other phases, when the final standard including all phases is issued. The standard was initially effective for annual periods beginning on or after 1 January 2013, but amendments to IFRS 9 mandatory effective date of IFRS 9 and transition disclosures, issued in December 2011, moved the mandatory effective date to 1 January 2015. On November 19, 2013, the International Accounting Standards Board (lASB) issued amendments to IFRS 9 that introduced a new general hedge accounting and removed the 1 January 2015, mandatory effective date from IFRS 9. The new hedge accounting model significantly differs from the IAS 39 hedge accounting model in a number of aspects including eligibility of hedging instruments and hedged items, accounting for the time value component of options and forward contracts, qualifying criteria for applyinghedge accounting, modification and discontinuation of hedging relationships etc. Under the amendments, entities that adopt IFRS 9 (as amended in November 2013) can choose an accounting policy of either adopting the new IFRS 9 hedge accounting model now or continuing to apply the hedge accounting model in IAS 39 for the time being.
The Company will quantify the effect of adoption of this standard, in conjunction with the other phases, when issued, to present a comprehensive picture.
IAS 32 Offsetting Financial Assets and Financial Liabilities - Amendments to IAS 32These amendments clarify the meaning of “currently has a legally enforceable right to set-off” and the criteria for non-simultaneous settlement mechanisms of clearing houses to qualify for offsetting. These are effective for annual periods beginning on or after 1 January 2014. These amendments are not expected to be relevant to the Company.
Other standards and interpretations that have been issued but not yet effective are not likely to have any significant impact on the financial statements of the Company in the period of their initial application.
Notes to the Financial StatementsAt 31 December 2013
2 SUMMARY OF SIGNIFICANT ACCOUNTING POLICIES [continued]
Property, plant and equipmentProperty, plant and equipment is stated at cost, net of accumulated depreciation and/or accumulated impairment losses, if any. Such cost includes the cost of replacing part of the property, plant and equipment and borrowing costs for long-term construction projects if the recognition criteria are met. When significant parts of property, plant and equipment are required to be replaced at intervals, the Company recognises such parts as individual assets with specific useful lives and depreciates them accordingly. Likewise, when a major inspection is performed, its cost is recognised in the carrying amount of the plant and equipment as a replacement if the recognition criteria are satisfied. All other repair and maintenance costs are recognised in the statement of comprehensive income as incurred.
Depreciation is calculated on a straight line basis over the estimated useful lives of property, plant and equipment as follows:
Freehold buildings 45 years Power generating plant 23-25 years Plant, machinery and other equipment 3-23 years
Land and assets in process of completion are not depreciated. An item of property, plant and equipment and any significant part initially recognised is derecognised upon disposal or when no future economic benefits are expected from its use or disposal. Any gain or loss arising on derecognition of the asset (calculated as the difference between the net disposal proceeds and the carrying amount of the asset) is included in the statement of comprehensive income when the asset is derecognised.
Impairment of non-financial assetsThe Company assesses at each reporting date whether there is an indication that an asset may be impaired. If any indication exists, or when annual impairment testing for an asset is required, the Company estimates the asset’s recoverable amount. An asset’s recoverable amount is the higher of an asset’s or cash-generating unit’s (CGU) fair value less costs to sell and its value in use and is determined for an individual asset, unless the asset does not generate cash inflows that are largely independent of those from other assets or Group of assets. When the carrying amount of an asset or CGU exceeds its recoverable amount, the asset is considered impaired and is written down to its recoverable amount.
In assessing value in use, the estimated future cash flows are discounted to their present value using a pre- tax discount rate that reflects current market assessments of the time value of money and the risks specific to the asset. In determining fair value less costs on disposal, recent market transactions are taken into account. If no such transactions can be identified, an appropriate valuation model is used.
An assessment is made at each reporting date to determine whether there is an indication that previously recognised impairment losses no longer exist or have decreased. If such indication exists, the Company estimates the asset’s or CGU’s recoverable amount. A previously recognised impairment loss is reversed only if there has been a change in the assumptions used to determine the asset’s recoverable amount since the last impairment loss was recognised. The reversal is limited so that the carrying amount of the asset does not exceed its recoverable amount, nor exceed the carrying amount that would have been determined, net of depreciation, had no impairment loss been recognised for the asset in prior years. Such reversal is recognised in the statement of comprehensive income.
Notes to the Financial StatementsAt 31 December 2013

Annual Report 2013 (54) Annual Report 2013 (55)
2 SUMMARY OF SIGNIFICANT ACCOUNTING POLICIES [continued]
Borrowing costsBorrowing costs directly attributable to the acquisition, construction or production of an asset that necessarily takes a substantial period of time to get ready for its intended use or sale are capitalised as part of the cost of the asset. All other borrowing costs are expensed in the period they occur. Borrowing costs consist of interest and other costs that are incurred in connection with the borrowing of funds.
InventoriesInventories are valued at the lower of cost and net realisable value. Costs incurred in bringing each product to its present location and condition are accounted for as follows:
Raw materials Purchase cost on a weighted average basis.
Finished goods and work in progress Cost of direct materials, labour plus attributable overheads based on normal level of activity.
Stores Purchase cost calculated on a weighted average basis after making due allowance for any obsolete items.
Net realisable value is the estimated selling price in the ordinary course of business, less estimated costs of completion and the estimated costs necessary to make the sale.
Financial assetsInitial recognition and measurementFinancial assets are classified, at initial recognition, as financial assets at fair value through profit or loss, loans and receivables, held-to-maturity investments, available-for-sale financial assets, or as derivatives designated as hedging instruments in an effective hedge, as appropriate.
All financial assets are recognised initially at fair value plus, in the case of financial assets not recorded at fair value through profit or loss, transaction costs that are attributable to the acquisition of the financial asset.
Purchases or sales of financial assets that require delivery of assets within a time frame established by regulation or convention in the market place (regular way trades) are recognised on the trade date, i.e., the date that the Company commits to purchase or sell the asset.
Financial assets consist of bank balances and cash and receivables.
Subsequent measurement Accounts receivableAccounts receivable are stated at original invoice amount less a provision for any uncollectible amounts. An estimate for doubtful debts is made when collection of the full amount is no longer probable. Bad debts are written off when there is no possibility of recovery.
Cash and cash equivalentsFor the purpose of statement of cash flows, cash and cash equivalents consist of cash in hand, bank balances and short-term deposits with an original maturity of three months or less.
Notes to the Financial StatementsAt 31 December 2013
2 SUMMARY OF SIGNIFICANT ACCOUNTING POLICIES [continued]
DerecognitionA financial asset (or, where applicable, a part of a financial asset or part of a group of similar financial assets) is primarily derecognised (i.e. removed from the Company’s statement of financial position) when:
- The rights to receive cash flows from the asset have expired, or
- The Company has transferred its rights to receive cash flows from the asset or has assumed an obligation to pay the received cash flows in full without material delay to a third party under a ‘pass- through’ arrangement; and either (a) the Company has transferred substantially all the risks and rewards of the asset, or (b) the Company has neither transferred nor retained substantially all the risks and rewards of the asset, but has transferred control of the asset
Impairment of financial assetsThe Company assesses, at each reporting date, whether there is objective evidence that a financial asset or a group of financial assets is impaired. An impairment exists if one or more events that has occurred since the initial recognition of the asset (an incurred ‘loss event’), has an impact on the estimated future cash flows of the financial asset or the group of financial assets that can be reliably estimated. Evidence of impairment may include indications that the debtors or a group of debtors is experiencing significant financial difficulty, default or delinquency in interest or principal payments, the probability that they will enter bankruptcy or other financial reorganisation and observable data indicating that there is a measurable decrease in the estimated future cash flows, such as changes in arrears or economic conditions that correlate with defaults.
Impairment of financial assets is determined as follows:- For assets carried at fair value, impairment is the difference between cost and fair value,
less any impairment loss previously recognised in the statement of comprehensive income;
- For assets carried at cost, impairment is the difference between carrying value and the present value of future cash flows discounted at the current market rate of return for a similar financial asset; and
- For assets carried at amortised cost, impairment is the difference between the carrying amount and the present value of future cash flows discounted at the original effective interest rate.
Financial liabilitiesInitial recognition and measurementFinancial liabilities are classified, at initial recognition, as financial liabilities at fair value through profit or loss, loans and borrowings, payables, or as derivatives designated as hedging instruments in an effective hedge, as appropriate.
All financial liabilities are recognised initially at fair value and, in the case of loans and borrowings and payables, net of directly attributable transaction costs.
The Company’s financial liabilities include accounts and other payables, loans and borrowings and derivative financial instruments.
Subsequent measurement Accounts payables and accrualsAccounts payables and accruals are carried at cost which is the fair value of the consideration to be paid in the future for goods and services received whether or not billed to the Company.
Notes to the Financial StatementsAt 31 December 2013

Annual Report 2013 (56) Annual Report 2013 (57)
2 SUMMARY OF SIGNIFICANT ACCOUNTING POLICIES [continued]
BorrowingsSubsequent to initial recognition, borrowings are stated at amortised cost, any difference between the proceeds (net of transaction costs) and the redemption value is recognised in the statement of comprehensive income over the period of the borrowings using the effective interest rate method. Instalments due within one year are classified under current liabilities.
Interest is charged as an expense based on effective yield, with unpaid interest amounts included in ‘accounts payable and accruals’.
Offsetting of financial instrumentsFinancial assets and financial liabilities are offset and the net amount is reported in the statement of financial position if, and only if, there is a currently enforceable legal right to offset the recognised amounts and there is an intention to settle on a net basis, or to realise the assets and settle the liabilities simultaneously.
DerecognitionA financial liability is derecognised when the obligation under the liability is discharged or cancelled or expired.
Derivative financial instruments and hedging activitiesDerivative financial instruments are initially recognised in the statement of financial position at cost, including transaction costs, and subsequently re-measured to fair value. The method of recognising the resulting gain or loss depends on whether the derivative is designated as a hedging instrument and, if so, the nature of the item being hedged.
The recognition of changes in the fair values of derivative financial instruments entered into for hedging purposes is determined by the nature of the hedging relationship. For the purposes of hedge accounting, derivative financial instruments are designated as a hedge of either:
i) the fair value of a recognised asset or liability (fair value hedge), orii) the future cash flows attributable to a recognised asset or liability or a firm commitment (cash flow hedge).
The Company’s criteria for a derivative financial instrument to be accounted for as a hedge include:
- at the inception of the hedge there is formal documentation of the hedging relationship and the Company’s risk management objective and strategy for undertaking the hedge. That documentation should include identification of the hedging instrument, the related hedged item or transaction, the nature of the risk being hedged, and how the Company will assess the hedging instrument’s effectiveness in offsetting the exposure to changes in the hedged item’s fair value or the hedged transaction’s cash flows that is attributable to the hedged risk;
- the hedge is expected to be highly effective in achieving offsetting changes in fair value or cash flows attributable to the hedged risk, consistent with the originally documented risk management strategy for that particular hedging relationship;
- for cash flow hedges, a forecasted transaction that is the subject of the hedge must be highly probable and must present an exposure to variations in cash flows that could ultimately affect reported net profit or loss; and
- the effectiveness of the hedge can be reliably measured, that is, the fair value or cash flows of the hedged item and the fair value of the hedging instrument can be reliably measured;
- the hedge must be assessed on an ongoing basis and determined to have actually been highly effective throughout the financial reporting period.
Notes to the Financial StatementsAt 31 December 2013
2 SUMMARY OF SIGNIFICANT ACCOUNTING POLICIES [continued] Derivative financial instruments and hedging activities (continued)
Changes in fair values of derivative financial instruments that are designated, and qualify, as cash flow hedges and prove to be highly effective in relation to the hedged risk, are recognised as a separate component in equity as a cash flow hedge reserve. Unrealised gains or losses on any ineffective portion of cash flow hedging transactions are recognised in the statement of comprehensive income.
When a hedging instrument expires or is sold, or when a hedge no longer meets the criteria for hedge accounting, any cumulative gain or loss existing in equity at that time remains in equity and is recognised when the forecast transaction is ultimately recognised in the statement of comprehensive income. When a forecast transaction is no longer expected to occur, the cumulative gain or loss that was reported in equity is immediately transferred to the statement of comprehensive income.
Changes in the fair value of any derivative instruments that do not qualify for hedge accounting are classified as held for trading and are recognised immediately in the statement of comprehensive income.
ProvisionsProvisions are recognised when the Company has a present obligation (legal or constructive) as a result of a past event, it is probable that an outflow of resources embodying economic benefits will be required to settle the obligation and a reliable estimate can be made of the amount of the obligation. When the Company expects some or all of a provision to be reimbursed, for example, under an insurance contract, the reimbursement is recognised as a separate asset, but only when the reimbursement is virtually certain. The expense relating to a provision is presented in the statement of profit or loss net of any reimbursement.
If the effect of the time value of money is material, provisions are discounted using a current pre-tax rate that reflects, when appropriate, the risks specific to the liability. When discounting is used, the increase in the provision due to the passage of time is recognised as a finance cost.
Treasury sharesTreasury shares are stated at acquisition cost and are shown as a deduction to equity. No gain or loss is recognised in the statement of comprehensive income on the purchase, sale, issue or cancellation of the treasury shares. Gains arising from the subsequent resale of treasury shares is treated as non-distributable and included in treasury shares reserve. Any loss arising from the subsequent resale of treasury shares is first adjusted against the treasury shares reserve, if any, and charged to retained earnings if the amounts in treasury shares reserve is not sufficient to cover the loss.
Revenue recognitionRevenue is recognised to the extent that it is probable that the economic benefits will flow to the Company and the revenue can be reliably measured, regardless of when the payment is being made. Revenue is measured at the fair value of the consideration received or receivable, taking into account contractually defined terms of payment and excluding taxes or duty. The Company assesses its revenue arrangements against specific criteria to determine if it is acting as principal or agent. The Company has concluded that it is acting as a principal in all of its revenue arrangements. The specific recognition criteria described below must also be met before revenue is recognised.
Sale of goodsRevenue from the sale of goods is recognised when the significant risks and rewards of ownership of the goods have passed to the buyer and the amount of revenue can be measured reliably normally on delivery to the customer.
Notes to the Financial StatementsAt 31 December 2013

Annual Report 2013 (58) Annual Report 2013 (59)
2 SUMMARY OF SIGNIFICANT ACCOUNTING POLICIES [continued] Revenue recognition (continued)
Other incomeOther income is recognised as the income accrues.
Employee benefitsFor Bahraini nationals, the Company makes contributions to the Social Insurance Organisation (SIO). This is a funded defined contribution scheme and the Company’s contributions are charged to the statement of comprehensive income in the year to which they relate. The Company’s obligations are limited to the amounts contributed to the Scheme.
For non-Bahraini employees the Company provides for end of service benefits in accordance with the Bahrain Labour Law based on their salaries at the time of leaving and number of years of service. Provision for this unfunded commitment, which represents a defined benefit scheme, has been made by calculating the liability had all employees left at the reporting date.
Alba Savings Benefit SchemeThe Company operates a compulsory saving scheme for its Bahraini employees. The Company’s obligations are limited to the amounts to be contributed to the scheme. This saving scheme represents a funded defined contribution scheme.
Employees’ Stock Incentive PlanThe cost of shares allocated to the Employees’ Stock Incentive Plan is charged to the statement of comprehensive income over three years, being the vesting period for which the employee has to remain with the Company to be entitled to the shares.
Foreign currenciesTransactions in foreign currencies are recorded at the exchange rate prevailing on the date of the transaction. Monetary assets and liabilities denominated in foreign currencies are retranslated at the rate of exchange prevailing at the reporting date. All exchange differences are taken to the statement of comprehensive income.
Non-monetary items that are measured in terms of historical cost in a foreign currency are translated using the exchange rates as at the dates of the initial transactions. Non-monetary items measured at fair value in a foreign currency are translated using the exchange rates at the date when the fair value is determined.
Current versus non-current classificationThe Company presents assets and liabilities in statement of financial position based on current/non-current classification. An asset is presented as current when it is:
- Expected to be realised or intended to be sold or consumed in a normal operating cycle; - Held primarily for the purpose of trading; - Expected to be realised within twelve months after the reporting period, or - Cash or cash equivalent unless restricted from being exchanged or used to settle a liability for atleast twelve months after the reporting period.
Notes to the Financial StatementsAt 31 December 2013
2 SUMMARY OF SIGNIFICANT ACCOUNTING POLICIES [continued] Current versus non-current classification (continued)
All other assets are classified as non-current. A liability is presented as current when: - It is expected to be settled in a normal operating cycle; - It is held primarily for the purpose of trading; - It is due to be settled within twelve months after the reporting period, or - There is no unconditional right to defer the settlement of the liability for at least twelve months after the reporting period.
The Company classifies all other liabilities as non-current.
Fair value measurementPolicy applicable from 1January 2013
The Company measures financial instruments, at fair value at each reporting date. Also, fair values of financial instruments measured at amortised cost are disclosed in note 24.
Fair value is the price that would be received to sell an asset or paid to transfer a liability in an orderly transaction between market participants at the measurement date. The fair value measurement is based on the presumption that the transaction to sell the asset or transfer the liability takes place either:
- In the principal market for the asset or liability, or - In the absence of a principal market, in the most advantageous market for the asset or liability.
The principal or the most advantageous market must be accessible by the Company.
The fair value of an asset or a liability is measured using the assumptions that market participants would use when pricing the asset or liability, assuming that market participants act in their economic best interest.
A fair value measurement of a non-financial asset takes into account a market participant’s ability to generate economic benefits by using the asset in its highest and best use or by selling it to another market participant that would use the asset in its highest and best use.
The Company uses valuation techniques that are appropriate in the circumstances and for which sufficient data are available to measure fair value, maximising the use of relevant observable inputs and minimising the use of unobservable inputs.
All assets and liabilities for which fair value is measured or disclosed in the financial statements are categorised within the fair value hierarchy, described as follows, based on the lowest level input that is significant to the fair value measurement as a whole:
- Level 1 - Quoted (unadjusted) market prices in active markets for identical assets or liabilities - Level 2 - Valuation techniques for which the lowest level input that is significant to the fair value measurement is directly or indirectly observable - Level 3 - Valuation techniques for which the lowest level input that is significant to the fair value measurement is unobservable
Notes to the Financial StatementsAt 31 December 2013

Annual Report 2013 (60) Annual Report 2013 (61)
2 SUMMARY OF SIGNIFICANT ACCOUNTING POLICIES [continued] Fair value measurement (continued) Policy applicable from 1 January 2013 (continued)
For assets and liabilities that are recognised in the financial statements on a recurring basis, the Company determines whether transfers have occurred between levels in the hierarchy by re-assessing categorisation (based on the lowest level input that is significant to the fair value measurement as a whole) at the end of each reporting period.
At each reporting date, the management analyses the movements in the values of assets and liabilities which are required to be re-measured or re-assessed as per the Company’s accounting policies. For this analysis, the management verifies the major inputs applied in the latest valuation by agreeing the information in the valuation computation to contracts and other relevant documents.
The management, in conjunction with the Company’s external valuers, also compares each the changes in the fair value of each asset and liability with relevant external sources to determine whether the change is reasonable.
On an annual basis, the Company’s external valuers present the valuation results to the management. This includes a discussion of the major assumptions used in the valuations.
For the purpose of fair value disclosures, the Company has determined classes of assets and liabilities on the basis of the nature, characteristics and risks of the asset or liability and the level of the fair value hierarchy as explained above.
Policy applicable before 1January 2013The fair values of financial instruments traded in active markets (such as publicly traded derivatives) are based on quoted market prices at the reporting date. The quoted market price used for financial assets held by the Company is the current bid price; the appropriate quoted market price for financial liabilities isthe current ask price.
The fair values of financial instruments that are not traded in an active market (for example, over the counter derivatives, interest rate collars etc.) are determined by valuation techniques carried out by counterparties. The fair values of forward foreign exchange contracts are determined using forward exchange market rates at the reporting date with the same maturity.
Notes to the Financial StatementsAt 31 December 2013
3 PROPERTY, PLANT AND EQUIPMENT Plant, Power machinery Assets in Land and generating and other process of buildings plant equipment completion Total BD ‘000 BD ‘000 BD ‘000 BD ‘000 BD ‘000Cost: At 1 January 2013 268,331 422,805 1,154,006 54,593 1,899,735 Additions - 14,417 - 43,095 57,512 Transfers 718 338 15,539 (16,595) - Disposals (121) (20,301) (2,824) - (23,246) Write offs - (206) (152) - (358)
At 31 December 2013 268,928 417,053 1,166,569 81,093 1,933,643
Depreciation: At 1 January 2013 98,668 221,228 678,060 - 997,956 Charge for the year 6,599 16,232 55,000 - 77,831 Relating to disposals (80) (7,628) (2,520) - (10,228) Relating to write offs - (162) (72) - (234)
At 31 December 2013 105,187 229,670 730,468 - 1,065,325
Net carrying value: At 31 December 2013 163,741 187,383 436,101 81,093 868,318
Plant, Power machinery Assets in Land and generating and other process of buildings plant equipment completion Total BD ‘000 BD ‘000 BD ‘000 BD ‘000 BD ‘000Cost: At 1 January 2012 267,000 407,366 1,139,596 56,598 1,870,560 Additions - - - 32,724 32,724 Transfers 1,542 15,614 17,573 (34,729) - Disposals (211) (119) (3,108) - (3,438) Write offs - (56) (55) - (111)
At 31 December 2012 268,331 422,805 1,154,006 54,593 1,899,735
Depreciation: At 1 January 2012 92,248 205,139 626,366 - 923,753 Charge for the year 6,575 16,221 54,777 - 77,573 Relating to disposals (155) (90) (3,030) - (3,275) Relating to write offs - (42) (53) - (95)
At 31 December 2012 98,668 221,228 678,060 - 997,956
Net carrying value: At 31 December 2012 169,663 201,577 475,946 54,593 901,779
Notes to the Financial StatementsAt 31 December 2013

Annual Report 2013 (62) Annual Report 2013 (63)
3 PROPERTY, PLANT AND EQUIPMENT [continued] a) Land and buildings include freehold land at a cost of BD 453 thousand as at 31 December
2013 (2012: BD 453 thousand).
b) The Company is utilising land leased from the Government of Bahrain for the operations of lines 3, 4 and 5 and land leased from The Bahrain Petroleum Company B.S.C. (c) (BAPCO) for its calciner operations. These leases are free of rent.
c) The depreciation charge is allocated to cost of sales in the statement of comprehensive income.
4 LONG TERM RECEIVABLE
This represents an amount due from Gulf Aluminium Rolling Mill Company B.S.C. (c) (GARMCO), a company partly owned by two of the Company’s shareholders. The amount due is repayable in 16 half yearly instalments and the last instalment is due on 31 December 2016. Interest is payable half yearly on the outstanding balance at 6 months LIBOR plus a margin of 1% and the effective interest rate as of 31December 2013 was 1.42% (2012: 1.73%).
The current and non-current portion of the long term receivable as of 31 December is as follows:
2013 2012 BD ‘000 BD ‘000
Current portion 3,438 3,438Non-current portion 6,877 10,314
10,315 13,752 5 INVENTORIES
2013 2012 BD ‘000 BD ‘000
Goods in transit 37,752 25,276Raw materials 24,464 26,258Work-in-process 44,713 51,611Finished goods 13,049 18,144Stores stock [net of provision of BD 1,477 thousand (2012: BD 1,200 thousand)] 24,952 22,275
144,930 143,564
Movements in the allowance for provision for slow moving stores stock were as follows:
2013 2012 BD ‘000 BD ‘000
At 1 January 1,200 1,200Charge for the year 339 151Write off (62) (151)
At 31 December 1,477 1,200
Notes to the Financial StatementsAt 31 December 2013
6 ACCOUNTS RECEIVABLE AND PREPAYMENTS 2013 2012 BD ‘000 BD ‘000Trade accounts receivable [net of provision of BD 4,551 thousand (2012: BD 4,602 thousand)] 72,977 68,248Other receivables [net of provision of BD 45 thousand (2012: BD 45 thousand)] 9,820 19,742Prepayments 2,578 3,149
85,375 91,139
As at 31 December 2013, trade accounts receivable at a nominal value of BD 4,551 thousand (2012: BD 4,602 thousand) and other receivables of BD 45 thousand (2012: BD 45 thousand) were impaired. Movements in the allowance for impairment of trade accounts receivable were as follows:
Trade accounts receivable Other receivables
2013 2012 2013 2012 BD ‘000 BD‘000 BD ‘000 BD‘000At 1 January 4,602 5,357 45 354Write off - (623) - -Reversal of provision for the year (51) (132) - (309)
At 31 December 4,551 4,602 45 45
As at 31 December, the ageing of unimpaired trade accounts receivable was as follows:
Neither past Past due but not impaired due nor Less than Over Total impaired 30 days 30-90 days 91-120 days 120 days BD ‘000 BD ‘000 BD ‘000 BD ‘000 BD ‘000 BD ‘0002013 72,977 71,586 472 35 192 6922012 68,248 65,527 1,496 788 314 123
7 BANK BALANCES AND CASH 2013 2012 BD ‘000 BD ‘000 Cash in hand 23 21Cash at bank: - Current accounts 43,117 51,048 - Call accounts 21,400 10,536
Bank balances and cash 64,540 61,605
A major portion of the bank balances is held with banks in the Kingdom of Bahrain and these balances are denominated in Bahraini Dinars and US Dollars. The call accounts earn interest and the effective interest rates as of 31 December 2013 ranged between 0.10% to 0.12% (2012: 1.12% to 0.25%).
Notes to the Financial StatementsAt 31 December 2013

Annual Report 2013 (64) Annual Report 2013 (65)
2013 2012 Number % of total % of total Number of of share- outstanding Number of Number of outstandingCategories shares holders share capital shares shareholders share capital Less than 1% 70,195,871 2,387 4.94 67,196,856 2,453 4.73
1% up to less than 5% 71,804,129 2 5.06 74,803,144 2 5.27
5% up to less than 20% - - -
20% up to less than 50% 292,804,000 1 20.62 292,804,000 1 20.62
50% and above 985,196,000 1 69.38 985,196,000 1 69.38
1,420,000,000 2,391 100.00 1,420,000,000 2,457 100.00
8 SHARE CAPITAL 2013 2012 BD ‘000 BD ‘000Authorised 2,000,000,000 shares of 100 fils each 200,000 200,000
Issued and fully paid 1,420,000,000 shares of 100 fils each 142,000 142,000 The distribution of shareholdings are as follows:
9 TREASURY SHARES As explained in note 1, during 2010 the Company purchased its own shares from Breton for a purchase consideration of BD 13,536 thousand (US$ 36,000 thousand).
On 1 September 2010, the Company reissued the above treasury shares to Mumtalakat and SIIC in a ratio of 79.34% and 20.66% respectively.
Treasury shares held by the Company as of 31 December were:
2013 2012 Number Number of shares BD ‘000 of shares BD ‘000Held for the Employees’ Stock Incentive Plan [(note 15 (c)] 2,405,000 - 2,376,000 653Excess of the shares in Employees’ Stock Incentive Plan [note 15 (c)] 595,000 536 624,000 562
3,000,000 536 3,000,000 1,215Purchased subsequent to the IPO –netofsales 8,899,321 4,621 4,635,087 2,872
11,899,321 5,157 7,635,087 4,087
Notes to the Financial StatementsAt 31 December 2013
10 EARNINGS PER SHARE
Basic earnings per share is calculated by dividing the profit or loss for the year attributable to ordinary equity holders of the Company by the weighted average number of ordinary shares outstanding during the year, excluding the average number of ordinary shares purchased by the Company and held as treasury shares and is as follows:
2013 2012 BD ‘000 BD 000Profit for the year - BD’ 000 79,777 96,545
Weighted average number of shares, net of treasury shares - thousands of shares 1,410,767 1,412,508
Basic and diluted earnings per share (fils) 57 68
Basic and diluted earnings per share are the same since the Company has not issued any instruments that would have a dilutive effect.
There have been no other transactions involving ordinary shares or potential ordinary shares between the reporting date and the date of completion of these financial statements.
11 STATUTORY RESERVE The Bahrain Commercial Companies Law requires companies to transfer 10% of their annual profit to a statutory reserve, until such time the reserve equals 50% of the paid up share capital. A statutory reserve equal to 50% of the paid-up capital has been created by transfer of prior years’ profits. Therefore no further transfers have been made for the year ended 31 December 2013. This reserve cannot be utilised for the purpose of distribution, except in such circumstances as stipulated in the Bahrain Commercial Companies Law.
12 CAPITAL RESERVE
This reserve was created from the surplus on disposal of property, plant and equipment in prior years. This reserve is distributable subject to the approval of the shareholders.
13 DIVIDEND PROPOSED AND PAID
On 28 July 2013, the Board of Directors proposed an interim dividend of BD 0.014 per share (excluding treasury shares) totalling BD 19,729 thousand (2012: BD 0.014 per share (excluding treasury shares) totalling BD 19,776 thousand) which was paid on 30 September 2013. On 12 February 2014, the Board of Directors recommended a final dividend of BD 0.022 per share (excluding treasury shares) totalling BD 30,978 thousand (2012: 0.014 per share (excluding treasury shares) totalling BD 19,773 thousand). Both interim and final dividends are subject to the approval of the Company’s shareholders at the Annual General Meeting to be held in March 2014.
On 7 March 2013, the Company’s shareholders approved the Board of Director’s proposal to pay a final dividend of BD 0.014 per share (excluding treasury shares) totalling BD 19,759 thousand relating to 2012 which was paid in full in 2013 (2012: BD 0.040 per share totalling BD 56,509 thousand relating to 2011 of which BD 56,495 was paid).
Notes to the Financial StatementsAt 31 December 2013

Annual Report 2013 (66) Annual Report 2013 (67)
Notes to the Financial StatementsAt 31 December 2013
14 BORROWINGS Current Non-current Total Total 2013 2012 BD ‘000 BD ‘000 BD ‘000 BD ‘000Working capital revolving credit at 1.35 % to 1.89 % (2012: 1.40% to 2.28%) [1] 67,680 - 67,680 65,800Line 5 projects at 0.85 % to 1.61 % (2012: 0.94% to 1.77%) 19,006 27,335 46,341 128,762Coface loan at 0.85 % to 1.14 % (2012: 0.86% to 1.14%) 6,492 - 6,492 12,984Euro Coface loan at 1.18 % to 2.51 % (2012: 1.90% to 3.26%) [2] 4,395 17,157 21,552 21,782Euro SERV Loan at 1.55 % to 2.23 % (2012: 1.62% to 2.94%) [3] 1,939 4,625 6,564 8,071Refinancing loan at 2.64 % to 2.77 % (2012: nil) [4] 16,920 35,285 52,205 -
Total borrowings 116,432 84,402 200,834 237,399
Payable within one year 116,432 160,303Payable after one year 84,402 77,096
200,834 237,399
[1] The working capital revolving credit facilities are subject to periodic renewal and repricing. The working capital revolving facilities allow the Company to issue promissory notes for up to 12 month terms. It is the Company’s policy to maintain the current level of borrowings under these facilities by issuing new promissory notes in place of maturing notes.
[2] Euro Coface LoanOn 27 April 2010, the Company entered into a Coface facility agreement with a syndicate of financial institutions for Euro 54 million. BNP Paribas, France is the agent for this facility. This loan was obtained to finance the replacement of rectiformers for lines 1 and 2. The loan is repayable in twelve semi-annual instalments and the repayment dates had been agreed with the facility agent after the last drawdown.
[3] Euro SERV LoanOn 20 June 2010, the Company entered into a SERV facility agreement with a syndicate of financial institutions for Euro 22.4 million. BNP Paribas (Suisse) SA, Switzerland is the agent for this facility. This loan was obtained to finance the replacement of rectiformers for line 4. The loan is repayable in twelve semi-annual instalments and the repayment dates had been agreed with the facility agent after the last drawdown.
[4] Refinancing LoanIn 2013, the Company entered into refinancing agreements with two financial institutions for USD 169 million. These loans were obtained to partially repay the line 5 project loans. These loans are repayable in ten semi-annual and twelve quarterly instalments respectively and the repayment dates have been agreed with the facility agent after the last drawdown.
Line 5 projects loans, Coface loan and refinancing loan are secured by the quota agreement entered into between the Company and the shareholders.
Notes to the Financial StatementsAt 31 December 2013
ALBA Savings Social Insurance Benefit Scheme Organisation
2013 2012 2013 2012 BD ‘000 BD ‘000 BD ‘000 BD ‘000Provision as at 1 January 1,688 1,589 776 1,287 Expense recognised in the statement of comprehensive income (note 19) 4,037 3,786 5,998 5,548 Contributions paid (5,224) (3,687) (5,973) (6,059)
Provision as at 31 December (note 16) 501 1,688 801 776
15 EMPLOYEE BENEFITS
a) Defined benefit scheme - leaving indemnityMovements in the provision recognised in the statement of financial position are as follows:
2013 2012 BD ‘000 BD ‘000Provision as at 1 January 915 940Provided during the year (note 19) 844 814 Employees’ end of service benefits paid (829) (839)
Provision as at 31 December 930 915
b) Defined contribution schemesMovements in liabilities recognised in the statement of financial position are as follows:
c) Employees’ Stock Incentive PlanIn accordance with an Employees’ Stock Incentive Plan approved by the Board of Directors, the Company purchased 3,000,000 of its shares to be allocated to all of its employees on the Company’s payroll as of 1 December 2010. The Company has allocated 1,000 shares each to its 2,714 employees as of 1 December 2010 and these shares will vest after a period of three years. As of 31 December 2013, the number of employees eligible for this plan was 2,405 (2012: 2,376) and the excess of 595,000 shares is held as treasury shares as of 31 December 2013 (2012: 624,000 shares). During the year, the shares allocated to the employees had fully vested. 16 ACCOUNTS PAYABLE AND ACCRUALS
2013 2012 BD ‘000 BD ‘000
Trade payables 54,606 64,600Retentions payable 94 94Employee related accruals 30,582 26,452Accrued expenses 9,709 12,781Advances from customers 1,667 194Alba Savings Benefit Scheme [note 15 (b)] 501 1,688Social Insurance Organisation [note 15 (b)] 801 776
97,960 106,585
Employee related accruals include accruals for wages and salaries, bonus, sick leave, annual leave, medical and other benefits.

Annual Report 2013 (68) Annual Report 2013 (69)
2013 2012
Assets Liabilities Assets Liabilities BD ‘000 BD ‘000 BD ‘000 BD ‘000Commodity options - 9,364 - 34,424 Commodity futures - 38 104 - Interest rate collars and knockout swaps - 701 - 2,955 Forward foreign exchange contracts - - - 47
Total - 10,103 104 37,426 Classified in the statement of financial position as follows: Non-current portion: Commodity options - 5,232 - 22,799 Interest rate collars and knockout swaps - 81 - 1,197
- 5,313 - 23,996
Current portion: Commodity options - 4,132 - 11,625 Commodity futures - 38 104 - Interest rate collars and knockout swaps - 620 - 1,758 Forward foreign exchange contracts - - - 47
- 4,790 104 13,430
17 DERIVATIVE FINANCIAL INSTRUMENTS
The Company has a number of derivative financial instruments comprising interest rate collars, knockout swaps, forward foreign exchange contracts, commodity options and commodity futures. The fair values of the derivative financial instruments at 31 December 2013 and 31 December 2012 are as follows:
Notes to the Financial StatementsAt 31 December 2013
The fair valuation of the derivative financial instruments resulted in the following results taken to the statement of comprehensive income for the year ended 31 December.
2013 2012 BD ‘000 BD ‘000Revaluation: Commodity options 25,061 21,175 Commodity futures (143) 819 Interest rate collars and knockout swaps 2,254 5,363 Forward foreign exchange contracts 47 291
27,219 27,648
Realised: Commodity options (5,636) (16,090) Commodity futures (1,204) (850) Interest rate collars and knockout swaps (2,508) (4,848) (9,348) (21,788)
Net gain on fair valuation taken to statement of comprehensive income 17,871 5,860
Notes to the Financial StatementsAt 31 December 2013
17 DERIVATIVE FINANCIAL INSTRUMENTS (continued)
The Company does not engage in proprietary trading activities in derivatives. However, the Company enters into derivative transactions to hedge economic risks under its risk management guidelines that may not qualify for hedge accounting under IAS 39. Consequently, gains or losses resulting from the re-measurement to fair value of these derivatives, if any, are taken to the statement of comprehensive income.
Commodity optionsThe Company entered into commodity options to offset the premium payable on the interest rate collars. The exposure to the Company is that if the LME price of aluminium exceeds US$ 1,650 (2012: US$ 1,650) per metric tonne (which is above the London Metal Exchange (LME) price used in the feasibility study for line 5), then the Company will pay the difference between the market price and the average contracted price of US$ 1,650 (2012: US$ 1,650) per metric tonne for certain tonnages of aluminium.
Commodity futuresThe Company entered into commodity future contracts to reduce the price risk on behalf of its customers for 17,800 metric tonnes (2012: 10,750 metric tonnes).
Interest rate collars and knockout swapsThe Company entered into interest rate collar and knockout swap transactions for US$ 1.5 billion floating rate borrowings for financing the line 5 project (note 14) to manage overall financing costs. These contracts expire on 17 February 2015.
The notional amounts outstanding as at 31 December 2013 was US$ 270,000 thousand (2012: US$ 505,098 thousand).
Forward foreign exchange contractsThe Company has entered into forward foreign exchange contracts for capital expenditure cash outflows in foreign currencies equivalent to BD nil (2012: BD 311 thousand) as of 31 December 2013. These contracts expired on 8 March 2013.
18 OTHER INCOME
2013 2012 BD ‘000 BD ‘000 Interest income 249 389Sale of water 1,863 2,123Settlement with Alcoa (see note below) - 31,960Miscellaneous 5,192 4,906
7,304 39,378
On 9 October 2012, the Company entered into an out-of-court settlement agreement with Alcoa Inc., Alcoa World Alumina L.L.C. and members of its senior management (together, “Alcoa”). The settlement agreed was a combination of cash amounting to BD 31,960 thousand (US$ 85,000 thousand) as well as concessions on long term alumina supply and related agreements. Settlement amount of BD 15,980 thousand was received in 2012 and the balance was received in October 2013. The Company recognised the cash settlement of BD 31,960 thousand in 2012 as other income.

Annual Report 2013 (70) Annual Report 2013 (71)
Notes to the Financial StatementsAt 31 December 2013
19 PROFIT FOR THE YEAR
Profit for the year is stated after charging:
2013 2012 BD ‘000 BD ‘000Staff costs: Wages and salaries 76,176 68,404Employees’ end of service benefits [note 15 (a)] 844 814Alba savings benefit scheme [note 15 (b)] 4,037 3,786Social Insurance Organisation [note 15 (b)] 5,998 5,548Indirect benefits (housing, education) 489 496Payments to contractors 2,377 2,360Cost of Employees’ Stock Incentive Plan 680 765Others 405 398
91,006 82,571
Inventories recognised as an expense in cost of sales 442,443 350,870
The staff costs have been allocated in the statement of comprehensive income as follows:
2013 2012 BD ‘000 BD ‘000
Cost of sales 75,723 67,860Administrative expenses 13,711 12,741Selling and distribution expenses 1,572 1,970 91,006 82,571
Finance costs: Interest on borrowings 4,759 6,121Bank charges 1,064 1,061 5,823 7,182 20 COMMITMENTS AND CONTINGENCIES
a) Commitments 2013 2012 BD ‘000 BD ‘000Physical metal commitmentsSales commitments : 14,900 metric tonnes (2012: 7,750 metric tonnes) 10,024 7,900
Raw material supply agreementsIn the ordinary course of business the Company has entered into long-term commitments to purchase raw materials. These contracts are based on the market price of the raw material at the time of delivery.
Treasury sharesThe Board of Directors authorised the Company to purchase its own shares to a total cost amounting to BD 10,000 thousand (2012: BD 5,000 thousand). As of 31 December 2013, the Company has a remaining commitment of BD 4,000 thousand (2012: BD 1,500 thousand) towards the purchase of its own shares.
20 COMMITMENTS AND CONTINGENCIES [continued]a) Commitments (continued)
Capital expenditureEstimated capital expenditure contracted for at the reporting date amounted to BD 74,795 thousand (2012: BD 51,666 thousand). The commitments are expected to be settled within 1 to 5 years.
Letters of creditThe commitments on outstanding letters of credit as at 31 December 2013 were BD 7,372 thousand (2012: BD 8,911 thousand). The commitments are expected to be settled within 1 year.
At 31 December 2013, the Company had no outstanding letters of credit to counterparties for derivative transactions amounting (2012: BD 3,760 thousand).
b) ContingenciesThe Company has issued bank guarantee to customs authorities in the Kingdom of Bahrain amounting to BD 500 thousand until extension of the limits for the duty exemptions (2012: nil).
Under Albaskan Scheme, the Company has issued guarantees to financial institutions in the Kingdom of Bahrain in relation to the mortgage loans of its employees. The total value of these letters of guarantees is BD 14,292 thousand (2012: BD 12,021 thousand).
c) Legal claims i) A third party has initiated a claim against the Company towards damages caused to its
business unit. The Company is defending the claim and it is not practicable to estimate the liability of timing of any payments at this stage. Hence, no provision has been recognised in these financial statements.
ii) On 27 February 2008, the Company filed a lawsuit in the United States District Court for the Western District of Pennsylvania against Alcoa, Inc., Alcoa World Alumina LLC, a member of its senior management (together, “Alcoa”) and Victor Dahdaleh. In the complaint, the Company alleged that Alcoa conspired to bribe certain former members of its senior management and officials of the Government of the Kingdom of Bahrain to ensure, among other things, that Alcoa continued to benefit from the Company’s alumina purchases at inflated prices. Among other remedies, the Company sought damages for illicit activities that took place from 1993 to 2008.
In March 2008, the Court granted the U.S. Government’s unopposed motion to intervene and stay discovery, as the U.S. Government conducted a criminal investigation related to the same allegations. The stay was lifted in November 2011, and on 11 June 2012, the Court denied motions filed by Alcoa and the other defendants seeking to dismiss the lawsuit. On 9 October 2012, the Company reached a settlement with the Alcoa defendants comprised of a combination of cash and a long-term alumina supply arrangement. The lawsuit against Victor Dahdaleh is still ongoing.
iii) During 2009 the Company filed a complaint with the Public Prosecutor, who initiated
a criminal proceeding against three former employees of Alba Marketing (ALMA). The Company joined the proceedings as a civil right claimant. In its submission the Company claimed that the three former employees earned money from criminal activities and received commissions in contravention of the Bahrain Commercial Companies Law and the Prohibition of and Combating Money Laundering Law of Bahrain (“PCMLL”). In its civil right claim the Company sought to oblige the defendants to pay the amount of US$ 17,499,412 as interim relief, while preserving the Company’s civil right to have
Notes to the Financial StatementsAt 31 December 2013

Annual Report 2013 (72) Annual Report 2013 (73)
Notes to the Financial StatementsAt 31 December 2013
20 COMMITMENTS AND CONTINGENCIES [continued]c) Legal claims (continued)
recourse against the defendants for all the damages which ALMA has incurred as a result of the acts committed by the three former employees. In November 2010, the Bahrain criminal court found the defendants guilty under the PCMLL. In its judgment, the court did not make any reference to the reservation of the Company’s right to compensation pursuant to Article 3.2 of PCMLL. The criminal conviction was pardoned by a Royal Decree. However the Company’s civil claim is still pending under a civil court proceeding.
It is not practical to estimate the effect of any of these law suits on the financial statements at this stage.
21 OPERATING SEGMENT INFORMATION
For management purposes, the Company has a single operating segment which is the ownership and operation of a primary aluminium smelter and related infrastructure. Hence no separate disclosure of profit or loss, assets and liabilities is provided as this disclosure will be identical to the statement of comprehensive income and statement of financial position of the Company.
a) ProductAn analysis of the sales revenue by product is as follows:
2013 2012 BD ‘000 BD ‘000
Aluminium 730,879 730,924Calcined coke 12,141 12,801Alumina trading 6,318 -
Total sales revenue 749,338 743,725
b) Geographic informationAn analysis of the sales revenue by geographic location is as follows:
2013 2012 BD ‘000 BD ‘000
Kingdom of Bahrain 341,871 320,797Asia 80,721 102,967Rest of the Middle East and North Africa 199,651 186,828Europe 101,175 99,235Americas 25,920 33,898
Total sales revenue 749,338 743,725
The revenue information above is based on the location of the customers.
c) CustomersSales revenue from two customers of the Company amounted to BD 270,964 thousand (2012: BD 235,281 thousand), each being more than 10% of the total sales revenue for the year.
Notes to the Financial StatementsAt 31 December 2013
22 RELATED PARTY TRANSACTIONS
Related parties represent major shareholders, directors and key management personnel of the Company and entities controlled, jointly controlled or significantly influenced by such parties. Pricing policies and terms of these transactions are approved by the Company’s Board of Directors.
Transactions with shareholdersIn the ordinary course of business, the Company purchases supplies and services from parties related to the Government of the Kingdom of Bahrain, principally natural gas and public utility services. A royalty, based on production, is also paid to the Government of the Kingdom of Bahrain.
Transactions with related parties included in the statement of comprehensive income are as follows:
2013 2012 BD ‘000 BD ‘000Other related parties Revenue and other income Sale of metal 100,813 91,369Sale of water 1,312 1,218Interest on long term receivable 192 294
102,317 92,881
Cost of sales and expenses Purchase of natural gas and diesel 101,979 96,152Purchase of electricity 1,483 2,200Royalty 3,783 3,690
107,245 102,042
Balances with related parties included in the statement of financial position are as follows:
2013 2012 BD ‘000 BD ‘000Other related partiesAssets Long term receivable 10,315 13,752Bank balances 14,986 17,652Receivables 7,923 7,384
33,224 38,788
Liabilities Borrowings 15,040 7,520Payables 9,616 16,523
24,656 24,043
Outstanding balances at year-end arise in the normal course of business. For the year ended 31 December 2013, the Company has not recorded any impairment on amounts due from related parties (2012: nil).

Annual Report 2013 (74) Annual Report 2013 (75)
22 RELATED PARTY TRANSACTIONS [continued]
Compensation of key management personnelThe remuneration of members of key management during the year was as follows:
2013 2012 BD ‘000 BD ‘000
Short term benefits 1,384 1,677End of service benefits 73 118Contributions to Alba Savings Benefit Scheme 63 23Other benefits 111 272
1,631 2,090
Directors’ fees during the year amounted to BD 190 thousand (2012: BD 190 thousand).
23 RISK MANAGEMENT
The Company’s principal financial liabilities, other than derivatives, comprise borrowings, trade and other payables. The main purpose of these financial liabilities is to finance the Company’s operations. The Company has trade and other receivables, and cash and short-term deposits that arise directly from its operations. The Company also enters into derivative transactions.
The Company is exposed to market risk, credit risk and liquidity risk.
The Company’s executive management oversees the management of these risks. The Company’s executive management is supported by a risk management team that advises on financial risks and the appropriate financial risk governance framework for the Company. The risk management team provides assurance to the Company’s executive management that the Company’s financial risk-taking activities are governed by appropriate policies and procedures and that financial risks are identified, measured and managed in accordance with Company policies and Company risk appetite.
The Board of Directors reviews and agrees policies for managing each of these risks which are summarised below.
Market riskMarket risk is the risk that the fair value of future cash flows of a financial instrument will fluctuate because of changes in market prices. Market risk comprises three types of risk: interest rate risk, commodity price risk and foreign currency risk. Financial instruments affected by market risk include borrowings, deposits and derivative financial instruments.
Interest rate riskInterest rate risk is the risk that the fair value or future cash flows of a financial instrument will fluctuate because of changes in market interest rates.
The Company is exposed to interest rate risk on its interest bearing assets and liabilities (long term receivable, call accounts and borrowings). The Company has an interest rate collar and knockout swaps to limit the fluctuation in interest rates arising out of borrowings for its line 5 expansion.
The sensitivity of the statement of comprehensive income is the effect of the assumed changes in interest rates on the Company’s result for one year, based on the floating rate financial assets and financial liabilities held at 31 December 2013.
Notes to the Financial StatementsAt 31 December 2013
24 RISK MANAGEMENT [continued]
The interest earned on long term receivable is based on floating LIBOR rate plus margin. The call accounts and short term deposit earn interest at commercial rates. The interest rates are disclosed in notes 4 and 7.
The following table demonstrates the sensitivity of the statement of comprehensive income to reasonably possible changes in interest rates, with all other variables held constant.
Interest on borrowings Interest on call (after giving effect accounts and short for derivative financial term deposit instruments) Increase / Effect on Increase / Effect on decrease in results for decrease in results for basis points the year basis points the year
BD ‘000 BD ‘0002013 25 54 25 434 (25) (54) (25) (434) 2012 25 26 25 667 (25) (26) (25) (667) Commodity price riskCommodity price risk is the risk that future profitability is affected by changes in commodity prices. The Company is exposed to commodity price risk, as the selling prices for aluminium are generally based on aluminium prices quoted on the London Metal Exchange (LME). The Company hedges its selling price using futures commodity contracts, based on customers’ options. The forecast is deemed to be highly probable.
The following table demonstrates the sensitivity of the statement of comprehensive income to reasonably possible changes in the LME price on derivatives outstanding as of 31 December 2013, with all other variables held constant.
Increase/ Effect on decrease results in LME for the year price BD ‘000 2013 +30% 2,798 -30% (2,658)
2012 +30% (10,296) -30% 9,781 Foreign currency riskForeign currency risk is the risk that the fair value or future cash flows of a financial instrument will fluctuate because of changes in foreign exchange rates. The Company’s exposure to the risk of changes in foreign exchange rates relates primarily to the Company’s operating activities (when revenue or expense is denominated in a different currency from the Company’s presentation currency).
Notes to the Financial StatementsAt 31 December 2013

Annual Report 2013 (76) Annual Report 2013 (77)
24 RISK MANAGEMENT [continued]Foreign currency risk (continued)
The Company’s financial instruments are mainly denominated in Bahraini Dinars, US Dollars, Euros and Great Britain Pounds. The Company uses forward foreign exchange contracts to hedge against foreign currency payables (note 17).
As the Bahraini Dinar is pegged to the US Dollar, balances in US Dollars are not considered to represent significant currency risk.
The table below indicates the Company’s unhedged foreign currency exposures at 31 December, as a result of its monetary assets and liabilities. As of 31 December, the following financial instruments are denominated in currencies other than Bahrain Dinars and US Dollars, which were unhedged:
Financial Currency 2013 2012 BD ‘000 BD ‘000
Bank balances Euro 10,771 5,444 Great Britain Pounds 37 36Receivables Euro 5,739 6,225Borrowings Euro 28,116 30,745Payables Euro 2,512 2,061 Great Britain Pounds - 13
The analysis calculates the effect of a reasonably possible movement of the Bahraini Dinar’s currency rate against currencies which are exposed to currency risk, with all other variables held constant, on the statement of comprehensive income (due to the fair value of currency sensitive monetary assets and liabilities).
The effect of decreases in currency rate is expected to be equal and opposite to the effect of the increases shown.
2013 2012
Increase in Effect on Increase in Effect on currency rate results for currency rate results forCurrency to the BD the year to the BD the year BD ‘000 BD ‘000Euro +10% (1,412) +10% (2,113)
Great Britain Pounds +10% 4 +10% 2
(1,408) (2,111)
Credit riskCredit risk is the risk that a counterparty will not meet its obligations under a financial instrument or customer contract, leading to a financial loss. The Company is exposed to credit risk from its operating activities (primarily for trade receivables) and from its financing activities, including deposits with banks and financial institutions, foreign exchange transactions and other financial instruments.
Credit risk from bank balances and derivative contracts is managed by the Company’s treasury department in accordance with the Company’s policy. Investments of surplus funds are made only with approved counterparties and within credit limits assigned to each counterparty.
Notes to the Financial StatementsAt 31 December 2013
Notes to the Financial StatementsAt 31 December 2013
24 RISK MANAGEMENT [continued]Credit risk (continued)
The Company manages credit risk with respect to receivables from customers by receiving payments in advance from customers, obtaining letters of credit and other forms of credit insurance, by monitoring the exposure to customers on an ongoing basis.
Derivative contracts are entered into with approved counterparties and the Company is not subject to significant credit risk on these contracts.
Provisions for bad and doubtful debts are made for doubtful receivables whenever risks of default are identified.
The maximum credit risk exposure at the reporting date is equal to the carrying value of the financial assets shown in the statement of financial position, which are net of provisions for impairment.
The Company sells its products to a large number of customers. Its five largest customers account for 45.21% of outstanding accounts receivable at 31 December 2013 (2012: 54.11%).
As of 31 December 2013, the Company has a significant concentration of credit risk to Gulf Aluminium Rolling Mill Company B.S.C. (c) which consists of:
2013 2012 BD ‘000 BD ‘000 Long term receivable 10,315 13,752Trade accounts receivable 7,499 7,384
17,814 21,136
Liquidity riskLiquidity risk, also referred to as funding risk, is the risk that an enterprise will encounter difficulty in raising funds to meet commitments associated with financial instruments. Liquidity risk may result from an inability to sell a financial asset quickly at or close to its fair value. Trade payables are normally settled within 45 days of the date of purchase.
The Company limits its liquidity risk by ensuring bank facilities are available. The Company’s terms of sale require amounts to be paid within 30 to 180 days of the date of sale. Trade payable are non-interest bearing and are normally settled on 45 days terms.
The table below summarises the maturities of the Company’s undiscounted financial liabilities at 31 December, based on contractual payment dates and current market interest rates.

Annual Report 2013 (78) Annual Report 2013 (79)
Notes to the Financial StatementsAt 31 December 2013
24 RISK MANAGEMENT [continued]Liquidity risk (continued) Less than 3 to 12 1 to 5 Over 5 3 months months years years Total31 December 2013 BD ‘000 BD ‘000 BD ‘000 BD ‘000 BD ‘000Borrowings (including interest payable) 82,509 36,568 86,791 - 205,868Derivative financial instruments 897 3,956 5,250 - 10,103Accounts and other payable 60,633 - - - 60,633 Total 144,039 40,524 92,041 - 276,604 Less than 3 to 12 1 to 5 Over 5 3 months months years years Total31 December 2012 BD ‘000 BD ‘000 BD ‘000 BD ‘000 BD ‘000Borrowings (including interest payable) 137,703 24,133 79,392 - 241,228 Derivative financial instruments 1,617 11,813 23,996 - 37,426Accounts and other payable 31,840 38,917 - - 70,757 Total 171,160 74,863 103,388 - 349,411 Capital management Capital comprises share capital, statutory reserve, capital reserve, retained earnings and proposeddividend less treasury shares, and is measured at BD 868,451 thousand as at 31 December 2013 (2012: BD 829,618 thousand). The primary objective of the Company’s capital management is to ensure that it maintains a healthy capital base in order to support its business and maximise shareholders’ value.
The Company manages its capital structure and makes adjustments to it in light of changes in economic conditions. To maintain or adjust the capital structure, the Company may adjust the dividend payment to shareholders, return capital to shareholders or issue new shares. No changes were made in the objectives, policies or processes for managing capital during the years ended 31 December 2013 and31 December 2012.
24 FAIR VALUES OF FINANCIAL INSTRUMENTS
Financial instruments comprise of financial assets, financial liabilities and derivative financial instruments.
Financial assets consist of bank balances and cash and receivables. Financial liabilities consist of borrowings, short term loans and payables. Derivative financial instruments consist of interest rate collars, knockout swaps, forward exchange contracts and commodity options and futures.
Set out below is an overview of financial instruments, other than bank balances and cash, held by theCompany as at 31 December 2013: Loans Fair value and through receivables profit or loss BD ‘000 BD ‘000Financial assets:Trade and other receivables 82,797 - 82,797 -
Financial liabilities: Borrowings 200,834 -Accounts payable and accruals 60,633 -Derivative financial instruments - 10,103
261,467 10,103
Notes to the Financial StatementsAt 31 December 2013
24 FAIR VALUES OF FINANCIAL INSTRUMENTS (continued)
The management assessed that cash and short-term deposits, trade receivables, trade payables and other current liabilities approximate their carrying amounts largely due to the short-term maturities of these instruments.
The following methods and assumptions were used to estimate the fair values:
- Long-term fixed-rate and variable-rate receivables/borrowings are evaluated by the Company based on parameters such as interest rates, specific country risk factors, individual creditworthiness of the customer and the risk characteristics of the financed project. Based on this evaluation, allowances are taken into account for the expected losses of these receivables. As at 31 December 2013, the carrying amounts of such receivables, net of allowances, were not materially different from their calculated fair values.
- The Company enters into derivative financial instruments with various counterparties, principally financial institutions. Derivatives valued using valuation techniques with market observable inputs are mainly interest rate swaps and commodity forward contracts. The most frequently applied valuation techniques include forward pricing and swap models, using present value calculations. The models incorporate various inputs including the credit quality of counterparties and forward rates, interest rate curves and forward rate curves of the underlying commodity. All derivative contracts are fully cash collateralised, thereby eliminating both counterparty and the Group’s own non-performance risk. As at 31 December 2013, the marked-to-market value of derivative asset positions is net of a credit valuation adjustment attributable to derivative counterparty default risk. The changes in counterparty credit risk had no material effect on the hedge effectiveness assessment for derivatives designated in hedge relationships and other financial instruments recognised at fair value.
- Fair values of the Company’s interest-bearing borrowings and loans are determined by using DCF method using discount rate that reflects the issuer’s borrowing rate as at the end of the reporting period. The own non-performance risk as at 31 December 2013 was assessed to be insignificant.
Fair value hierarchyAll financial instruments for which fair value is recognised or disclosed are categorised within the fair value hierarchy, described as follows, based on the lowest level input that is significant to the fair value measurement as a whole:
Level 1 : Quoted market prices in an active market (that are unadjusted) for identical assets or liabilities;
Level 2 : Valuation techniques (for which the lowest level input that is significant to the fair value measurement is directly or indirectly observable); and
Level 3 : Valuation techniques (for which the lowest level input that is significant to the fair value measurement is unobservable).
As at 31 December 2013, the Company’s derivative financial instruments are measured at fair value. These are Level 2 as per the hierarchy above for the years ended 31 December 2013 and 31 December 2012. The Company does not have financial instruments qualifying for Level 1 or Level 3 classification.
During the year ended 31 December 2013, there were no transfers between Level 1 and Level 2 fair value measurements, and no transfers into or out of Level 3 fair value measurements (2012: same).
The fair values of financial instruments are not materially different from their carrying values as of the reporting date.

Annual Report 2013 (80) Annual Report 2013 (81)
25 KEY SOURCES OF ESTIMATION UNCERTAINTY
The key assumptions concerning the future and other key sources of estimation uncertainty at the reporting date, that have a significant risk of causing a material adjustment to the carrying amounts of assets and liabilities within the next financial year are discussed below.
Impairment of trade accounts receivableAn estimate of the collectible amount of trade accounts receivable is made when collection of the full amount is no longer probable. For individually significant amounts, this estimation is performed on an individual basis. Amounts which are not individually significant, but which are past due, are assessed collectively and a provision applied according to the length of time past due, based on historical recovery rates.
At 31 December 2013, gross trade accounts receivable were BD 77,528 thousand (2012: BD 72,850 thousand), and the provision for impairment was BD 4,551 thousand (2012: BD 4,602 thousand) and gross other receivables were BD 9,865 thousand (2012: BD 19,787 thousand), and the provision for impairment was BD 45 thousand (2012: BD 45 thousand). Any difference between the amounts actually collected in future periods and the amounts expected will be recognised in the statement of comprehensive income.
Impairment of inventoriesInventories are held at the lower of cost and net realisable value. When inventories become old or obsolete or if their selling prices have declined, an estimate is made of their net realisable values. For individually significant amounts this estimation is performed on an individual basis. Amounts which are not individually significant, but which are old or obsolete, are assessed collectively and a provision applied according to the inventory type and the degree of ageing or obsolescence, based on anticipated selling prices.
At 31 December 2013, stores stock was BD 26,429 thousand (2012: BD 23,475 thousand) with provisions for old and obsolete items of BD 1,477 thousand (2012: BD 1,200 thousand). Any difference between the amounts actually realised in future periods and the amounts expected will be recognised in the statement of comprehensive income.
Useful lives of property, plant and equipmentThe Company’s management determines the estimated useful lives of its property, plant and equipment for calculating depreciation. These estimates are determined after considering the expected usage of the asset or physical wear and tear. Management reviews the residual values and useful lives annually and the future depreciation charges would be adjusted where the management believes the useful lives differ from previous estimates.
26 ALBA SAVINGS BENEFIT SCHEME
The Company operates a compulsory savings benefit scheme for its Bahraini employees (‘the Scheme’).
The Scheme’s assets, which are not incorporated in these financial statements, consist principally of deposits with banks, equity shares and bonds.
The Scheme is established as a trust and administered by trustees representing the Company and the employees. The trustees manage the risks relating to the Scheme’s assets by approving the entities in which the Scheme can invest and by setting limits for investment in individual entities.
27 COMPARATIVE FIGURES
Certain of the prior year’s figures have been reclassified to conform to the current year’s presentation. Such reclassification did not affect previously reported net income or total shareholders’ equity.
As As previously Reclassi- reported reported fication herein BD ‘000 BD ‘000 BD ‘000
Statement of financial position Accounts receivable and prepayments 108,299 (17,160) 91,139Short term loans 17,160 (17,160) -Total assets 1,229,103 (17,160) 1,211,943Shareholder’s equity 829,618 - 829,618


Alb
a 20
12 A
nnua
l Rep
ort