Embed Size (px)
Citation preview

ORNL/TM-2011/278
ANALYSIS OF HIGHLY EFFICIENT ELECTRIC RESIDENTIAL HEAT PUMP WATER HEATERS FOR COLD CLIMATES
September 2011
Prepared by Van D. Baxter Richard W. Murphy C. K. Rice Bo Shen Zhiming Gao

DOCUMENT AVAILABILITY
Reports produced after January 1, 1996, are generally available free via the U.S. Department of Energy (DOE) Information Bridge. Web site http://www.osti.gov/bridge Reports produced before January 1, 1996, may be purchased by members of the public from the following source. National Technical Information Service 5285 Port Royal Road Springfield, VA 22161 Telephone 703-605-6000 (1-800-553-6847) TDD 703-487-4639 Fax 703-605-6900 E-mail [email protected] Web site http://www.ntis.gov/support/ordernowabout.htm Reports are available to DOE employees, DOE contractors, Energy Technology Data Exchange (ETDE) representatives, and International Nuclear Information System (INIS) representatives from the following source. Office of Scientific and Technical Information P.O. Box 62 Oak Ridge, TN 37831 Telephone 865-576-8401 Fax 865-576-5728 E-mail [email protected] Web site http://www.osti.gov/contact.html
This report was prepared as an account of work sponsored by an agency of the United States Government. Neither the United States Government nor any agency thereof, nor any of their employees, makes any warranty, express or implied, or assumes any legal liability or responsibility for the accuracy, completeness, or usefulness of any information, apparatus, product, or process disclosed, or represents that its use would not infringe privately owned rights. Reference herein to any specific commercial product, process, or service by trade name, trademark, manufacturer, or otherwise, does not necessarily constitute or imply its endorsement, recommendation, or favoring by the United States Government or any agency thereof. The views and opinions of authors expressed herein do not necessarily state or reflect those of the United States Government or any agency thereof.

ORNL/TM-2011/278
Energy and Transportation Sciences Division
ANALYSIS OF HIGHLY EFFICIENT ELECTRIC RESIDENTIAL
HEAT PUMP WATER HEATERS FOR COLD CLIMATES
Van D. Baxter
Richard W. Murphy
C. K. Rice
Bo Shen
Zhiming Gao
Date Published: September 2011
Prepared by
OAK RIDGE NATIONAL LABORATORY
Oak Ridge, Tennessee 37831-6283
managed by
UT-BATTELLE, LLC
for the
U.S. DEPARTMENT OF ENERGY
under contract DE-AC05-00OR22725


v
CONTENTS
ACRONYMS ................................................................................................................................ vii
ABSTRACT ..................................................................................................................................... 1
EXECUTIVE SUMMARY .............................................................................................................. 1
1. NATURAL GAS TANKLESS WATER HEATER (GTWH) BASELINE ................................ 2
2. TARGET EF FOR ELECTRIC HPWH TO ACHIEVE 30% SOURCE ENERGY SAVINGS . 2
3. POTENTIAL FOR ATTAINING THE SOURCE ENERGY SAVINGS GOAL ..................... 3
4. ENERGY FACTOR PERFORMANCE ANALYSIS FOR NINE HPWH DESIGNS .............. 4
4.1 GENERAL HPWH EQUIPMENT DESIGN ASSUMPTIONS .......................................... 5
4.2 HPWH OPERATION/CONTROL ASSUMPTIONS .......................................................... 5
4.3 SUMMARY OF REFRIGERANT, COMPRESSOR, AND SYSTEM DESIGN
ASSUMPTIONS AND PERFORMANCE ......................................................................... 6
4.4 HPWH EF PREDICTIONS FOR STEPWISE HEAT-UP DESIGNS ................................. 9
4.5 HPWH EF PREDICTIONS FOR ONCE-THROUGH HEAT-UP DESIGNS .................. 11
4.6 POSSIBLE FURTHER ANALYSIS WORK ..................................................................... 12
5. PRELIMINARY ESTIMATE OF NATIONAL ENERGY IMPACTS FROM TARGET
HPWH TECHNOLOGY ......................................................................................................... 13
5.1 COMPARED TO THE GTWH BASELINE ..................................................................... 13
5.2 COMPARED TO THE CURRENT ELECTRIC STORAGE WH STOCK ...................... 13
6. QUALITATIVE DISCUSSION OF OTHER FACTORS AFFECTING ―AS-INSTALLED‖
ANNUAL PERFORMANCE IN A RESIDENCE ................................................................... 14
7. COMPARISON OF TARGET EF HPWH TO CURRENT RESIDENTIAL ELECTRIC
HPWH PRODUCTS ................................................................................................................. 14
8. COMPARISON OF TARGET EF HPWH TO JAPANESE ECOCUTE HPWH
PRODUCTS ................................................................................................................................... 15
9. EVALUATION AGAINST GATE 2 GATE PERFORMANCE CRITERIA ― HIGHLY
EFFICIENT ELECTRIC HPWH FOR APPLICATION TO COLD CLIMATES PROJECT ..... 15
10. ORNL RECOMMENDATION ............................................................................................... 17
APPENDIX A ―Takagi TK1 GTWH ........................................................................................... 18

vi

vii
ACRONYMS
BPM Brushless permanent magnet
BTP DOE Building Technology Program
COP Coefficient of performance
DB Dry bulb (temperature)
EER Energy efficiency ratio
EF Energy factor
EWT Entering water temperature
EXV Electronic expansion valve
GTWH Gas tankless water heater
GWP Global warming potential
HBP High back pressure
HDD Heating degree days
HPWH Heat pump water heater
LSHX Liquid-to-suction line heat exchanger
RH Relative humidity
RSV Rated storage volume
TXV Thermostatic expansion valve
WH Water heating

viii
1
ABSTRACT
A scoping-level analysis was conducted to identify electric heat pump water heater (HPWH)
concepts that have the potential to achieve or exceed 30% source energy savings compared to a
gas tankless water heater (GTWH) representative of the type represented in version 0.9.5.2 beta
of the BEopt™ software developed by the National Renewable Energy Laboratory. The analysis
was limited to evaluation of options to improve the energy efficiency of electric HPWH product
designs currently on the market in the United States. The report first defines the baseline GTWH
system and determines its efficiency [source-energy-based ―adjusted‖ or ―derated‖ energy factor
(EF) of ~0.71]. High-efficiency components (compressors, pumps, fans, heat exchangers, etc.)
were identified and applied to current U.S. HPWH products and analyzed to determine the
viability of reaching the target EF. The target site-based EF required for an electric HPWH
necessary to provide 30% source energy savings compared to the GTWH baseline unit is then
determined to be ~3.19.
EXECUTIVE SUMMARY
This report describes results of a scoping-level analysis of significantly higher efficiency electric
heat pump water heaters (HPWH). The specific goal of the work was to identify electric HPWH
design options that have the potential to achieve or exceed 30% source energy savings compared
to a gas tankless water heater (GTWH) representative of the type represented in version 0.9.5.2
beta of the BEopt™ software developed by the National Renewable Energy Laboratory. This
effort was undertaken in response to a clearly expressed target in the FY10 DOE Building
Technology Program (BTP) Statement of Needs for the water heating (WH) program element.
Specifically, the need expressed was for advanced water heating systems for (buildings in) cold
climate locations that achieve 30% source energy savings vs. a GTWH with a cost premium of
$2000 or less. For purposes of this analysis a cold climate location is loosely defined as having
5500 heating degree days (HDD) or more.
It should be noted at this point that our analysis was limited to evaluation of options to improve
the energy efficiency of electric HPWH product designs currently on the market in the United
States. We specifically did NOT consider concepts for HPWH’s located in cold ambient
conditions (e.g., make use of cold ambient air as a heat source). Rather, the implicit assumption
was that the HPWH would be located in a semi-conditioned space in a residence (e.g., basement)
with ambient conditions approximating those specified in the energy factor (EF) rating test
(67.5°F and 50% RH) as described in Subpart B (Test Procedures), Appendix E (Uniform
Test Method for Measuring the Energy Consumption of Water Heaters) of CFR Part 430.
The report first defines the baseline GTWH system and determines its efficiency (source-energy-
based ―adjusted‖ or ―derated‖ EF of ~0.71). The target site-based EF required for an electric
HPWH necessary to provide 30% source energy savings compared to the GTWH baseline unit is
then determined to be ~3.19. High-efficiency components (compressors, pumps, fans, heat
exchangers, etc.) were identified and applied to current U.S. HPWH products and analyzed to
determine the viability of reaching the target EF. The report concludes with an evaluation of the
analysis results against the criteria established for passage to the next development stage in the
Stage-Gate Process.

2
1. NATURAL GAS TANKLESS WATER HEATER (GTWH) BASELINE
The baseline water-heating unit was taken to be the GTWH option described in BEopt™ version
0.8.7 (and unchanged in the recent, subsequent 0.9.5.2 beta version) to find optimal building
designs along the path to reduced energy use. According to BEopt™, this option is based on a
Takagi Model T-K1 GTWH with an EF of 0.84, derated by 8.8% (giving an ―adjusted‖ or
―derated‖ EF of approximately 0.76) to account for cycling inefficiencies, as proposed for
California’s 2008 Title 24. However, Takagi specifications for this unit give an EF of 0.81
operating with natural gas (see Appendix A).
The test procedures and computations to determine the EF for ―instantaneous‖ water heaters
covered under the Code of Federal Regulations Title 10, Chapter II, Volume 3, Part 430, Subpart
B, Appendix E, include a provision that if electrical auxiliary energy (for pumps, fans, etc.) is
included in the calculation, it must be converted using the following: 1 kWh = 3,412 Btu. Based
on the specifications of the Takagi Model T-K1 operating with natural gas, the electrical power
draw was estimated to be about 96.0 W during operation and about 6.2 W during standby. With
the performance schedule imposed by the rule for the 24-Hour Simulated Use Test from which
the EF is derived, it was estimated that the associated electrical energy consumption of this unit
was about 0.177 kWh or 604 Btu, while the associated natural gas energy consumption was about
49,561 Btu. According to the rule, both these quantities are measured on a site basis for EF
computation. To convert them to a source basis, the electricity source conversion factors used by
BEopt (3.16 for electricity and 1.02 for natural gas) were employed to give 1,910 Btu and
50,552 Btu, respectively, for the electricity and natural gas contributions—or a total of 52,462
Btu of source energy. These values, in turn, imply a source energy-based derated EF of about
0.77.
If, consistent with the BEopt methodology, the 0.81 EF specified by Takagi for this GTWH is
derated in the same manner by 8.8% for cycling inefficiencies (per California 2008 Title 24), the
derated site-energy-based EF is approximately 0.74, and the corresponding site energy
consumptions are about 0.194 kWh or 663 Btu for electricity and 54,343 Btu for natural gas.
Using the same site–source conversion factors gives about 2,094 Btu and 55,430 Btu, respectively
for the electricity and natural gas contributions—a total of 57,524 Btu. These values, in turn,
imply a corresponding derated source-energy-based EF of about 0.71.
2. TARGET EF FOR ELECTRIC HPWH TO ACHIEVE 30% SOURCE ENERGY
SAVINGS
To achieve the goal of 30% saving in source energy (relative to the derated GTWH described
above), an electric HPWH would have to use ≤40,267 Btu of source energy for the 24 Hour
Simulated Use Test. This yields a source-energy-based EF of about 1.01. The corresponding
usage of site energy would be about 12,743 Btu or 3.735 kWh, giving a site-energy-based EF of
about 3.19. This represents a 28-60% increase in EF compared to the rated EFs (2.0 to 2.5) of
electric HPWH products currently marketed in the United States. It also represents an increase of
~230-240% over the proposed new minimum EF for electric storage water heaters of 55 gallons
or less rated storage volume (RSV).
According to the final rule for residential water heaters issued March 22, 2010, the minimum EF
for electric storage water heaters effective April 16, 2015, will increase to:

3
EFmin = 0.96 – (0.0003 * RSV) for RSV 55 gallons, and
EFmin = 2.057 – (0.00113 * RSV) for RSV > 55 gallons.
From the first of these two equations, the minimum EF for an electric storage water heater with a
rated storage volume of 50 gallons will increase to 0.9450. From the last equation, the minimum
EF for an electric storage water heater with a rated storage volume of 80 gallons will increase to
1.9666. Figure 1 compares the new minimum EF standard to the current standard and to the rated
EFs of currently marketed electric HPWHs and the 3.19 target EF. One implication of the new EF
minimum standard will be that all electric storage WHs with greater than 55 gallons RSV must be
of the heat pump type.
0.0
0.5
1.0
1.5
2.0
2.5
3.0
3.5
0 10 20 30 40 50 60 70 80 90 100 110 120 130
rated storage volume (gallons)
en
erg
y f
acto
r
current minimum
current Energy Star minimum
new minimum
current Energy Star listings
goal
Figure 1. Current and new DOE minimum EF requirements for electric storage water heaters in
comparison to the Energy Star minimum requirement, rated EFs of current products, and the target
EF required for 30% source savings vs. GTWH baseline (“goal”).
3. POTENTIAL FOR ATTAINING THE SOURCE ENERGY SAVINGS GOAL
The ECR International Watter$aver HPWH product (marketed 2002–2005) had an EF of 2.47. It
employed a small R-134a reciprocating compressor that had an energy efficiency ratio (EER)
rating of about 6.8 and a rated cooling capacity of about 3100 Btu/hr with a 45°F evaporating
temperature (20°F exit superheat) and a 130°F condensing temperature (15°F exit subcooling)
while operating with refrigerant 134a. These operating conditions are representative of typical
surroundings of an HPWH in a cool basement or garage with average tank water at ~115-120°F).

4
Figure 2 illustrates efficiency levels of the Watter$aver compressor along with a number of other
reciprocating models and a few rotary models. The rotary models graphed in Figure 2 have an
average EER of ~10.4 at the same operating conditions.
0
1
2
3
4
5
6
7
8
9
10
11
12
0 2000 4000 6000 8000 10000 12000 14000
Capacity (Btu/hr)
EE
R (
Btu
/W-h
r)
RK-rotary,230V
CS10K6-recip,230V
AK-recip,115V
AE-recip,230V
AE-recip,115V
AK-recip,230V
FF12HBK-recip,230V
FF10HBK-recip,230V(Watter$aver)
reciprocating
rotary
conditions:
evaporating temperature = 45°F
condensing temperature = 130°F
superheat = 20°F
subcooling = 15°F
Figure 2. Rated high back pressure (HBP) performance of small R-134a compressors.
Of course, since EER is dimensional (Btu/hr/W) and is a cooling figure of merit, it does not
directly translate to the heating situation of interest here. If we convert the EERs to cooling COP,
the corresponding values are about 1.99 for the reciprocating compressor and about 3.05 for the
rotary compressor. If all the energy input to the evaporator and compressor in each case were
delivered as useful heat to the load (water in this case), the effective heating COPs would be
about 2.99 and 4.05, respectively. If it is further assumed that the performance of the HPWH (as
reflected in the EF) using the rotary compressor would be increased by the same ratio as that of
the respective compressor heating COPs, then the resulting EF would be about 3.34. If this
estimate proved accurate and if the associated costs were reasonable, then this change alone could
produce a viable unit capable of exceeding the EF target of 3.19 outlined above and, through the
previously described logic, the source energy savings of 30%. However, in the real system
design, other effects such as those relating to compressor capacity and fan and heat exchanger
sizing must be taken into account.
4. ENERGY FACTOR PERFORMANCE ANALYSIS FOR NINE HPWH DESIGNS
A more detailed analysis to estimate the potential EFs achievable was undertaken using models of
equipment designed to use HFC and CO2 refrigerants. These were used to develop system
performance maps as a function of entering water temperature (EWT) at the DOE HPWH test
rating condition of 67.5°F DB, 50% RH. Water heating capacity, total input power, and water
flow rates (fixed or variable as required) were then input to TRNSYS models for the 24-hour EF
and first-hour rating calculations. The system models were developed for designs using a pump to

5
circulate water from the tank to a water/refrigerant condenser. HPWH designs with static
condensers inside or wrapped around the tank were not considered in this analysis.
4.1 GENERAL HPWH EQUIPMENT DESIGN ASSUMPTIONS
The designs evaluated for HFC refrigerants were modeled assuming the use of R-134a and R-
410A. Compressor performance maps for high-efficiency rotary compressors over the range of
evaporating and condensing temperatures were obtained for appropriate rated cooling capacities
ranging from 4,350 to 5,420 Btu/hr.
For the water-to-refrigerant condenser, we used a counterflow Packless double-walled, fluted-
tube heat exchanger, model CDAX-6100, a size selected to give a relatively low refrigerant-to-
water mean temperature difference of about 9°F for the R-410A case at 115°F EWT. For the
pump, we assumed a brushless permanent-magnet motor (BPM) with the pump flow to be
optimized for each design for an assumed system head curve.
For the evaporator, we used a cross-counterflow, finned-tube heat exchanger with about 10%
more area than in models presently on the market. This sizing gave a mean refrigerant-to-air
temperature difference of about 6.5°F for the R-410A case. We assumed 300 cfm airflow across
the evaporator with 30 watts of fan power, which also implies a BPM motor.
The assumptions for compressor shell heat loss have a direct bearing on the predicted COPs, as
energy lost from the compressor shell in heat does not directly contribute to heating water in the
condenser. We obtained calorimeter data from the manufacturer which provided measured
discharge temperatures, from which we could calculate shell heat loss levels (as a fraction of
compressor input power) over the range of condensing temperatures. These relationships were
used in the simulations assuming there was full airflow over the compressor as recommended by
the manufacturer. Further, the shell heat losses were assumed to preheat the inlet air to the
evaporator. Minimal discharge line heat losses were also assumed.
As tank heat losses are included in EF calculations, we used two levels of assumed tank
insulation for this analysis: (1) that required to give a 0.90 EF for a tank heated with electric
resistance elements, and (2) that needed for a 0.95 EF resistance element tank.
4.2 HPWH OPERATION/CONTROL ASSUMPTIONS
The primary HPWH designs using HFCs were optimized for heating COP at an assumed average
EWT of 115°F and 67°F DB, 50% RH inlet air conditions. The condenser subcooling and water
flow were optimized for a BPM pump power versus flow curve developed for an expected system
loop head curve. Optimum water temperature increases through the condenser of 5.6 to 6.6°F
were found for the smaller to larger capacity units, respectively, at 115°F EWT. Accordingly,
tank heat-up was accomplished in a stepwise manner for this design configuration.
Once the optimum water flow and subcooling were determined for an average EWT condition,
the flow rate and required refrigerant charge levels were fixed. The compressor inlet superheat
was assumed to be fixed in this analysis, as would be approximately the case for a system with
TXV or similar EXV control. With the charge level and inlet superheat fixed (for an implicit
TXV model), the design model was run for EWTs ranging from 55 to 135°F to generate the
HPWH performance map needed for a TRNSYS 24-hour energy factor simulation.

6
For the transcritical CO2 design, we adjusted the heat exchanger sizes to obtain the same
refrigerant-to-air and refrigerant-to-water mean temperature differences as seen for the R-410A
case (which were the lowest of the HFC cases). The pump and fan power and airflow
assumptions were consistent with those for the HFC cases. A fixed-orifice refrigerant flow
control was assumed which was sized for best performance at the mean EWT. For the
compressor, we used a relatively high-efficiency reciprocating model for which we could obtain a
performance map comparable to those for the HFC refrigerant compressors. For the CO2
compressor, we assumed a fixed average shell heat loss fraction based on available system test
data, a value which was larger than that found in the calorimeter tests for HFC compressors.
A once-through design for the water flow was assumed for the primary CO2 HPWH systems to
obtain best matching of the water and refrigerant temperature glides in the gas cooler. A fixed
140°F return water temperature was maintained by adjusting the pump flow and power assuming
a BPM pump. For confirmation that the once-through design was more efficient than a stepwise
heat-up approach for a CO2 HPWH, one stepwise CO2 design was also simulated with an optimal
flow rate set to give 6.6°F delta-T at 115°F EWT. (For similar comparison reasons, two R-134a
cases were also simulated for once-through designs, as discussed later in this section.)
Once system performance maps versus EWT were generated for the selected cases, these data
sets along with the water flow rates were input to a TRNSYS simulation of the 24-hour EF test.
This simulation included a nominal 50 gallon water tank model (actual assumed capacity of 45
gallons), divided into 6 equal volume regions from top (region 1) to bottom (region 6). For the
stepwise heat-up cases, the water was removed from node 6 and returned to node 5 with small
temperature rises on each pass, while for the once-through cases, the water was removed from
node 6, heated to 140°F in one pass, and returned to node 1.
The primary HPWH control locations were at node 5 for all the stepwise heat-up cases and node
2 for the once-through designs. These nodes correspond approximately to the locations of the
lower and upper resistance elements and their associated thermostats in electric resistance water
heaters. For the once-through case a control location at node 2 rather than at node 5 was found to
give higher EF performance by providing more tank stratification during tank reheat operations,
while still maintaining higher top tank temperatures reasonably well. The HPWH thermostat had
a ±5°F deadband and was adjusted so that at the end of tank pre-heat runs, the average tank
temperature was 135°F. For the stepwise designs, this was typically a setting of near 125°F on,
and 135°F off. For the once-through designs, a higher HPWH thermostat setting was needed to
give an average tank starting temperature of 135°F with the larger tank stratification. An upper
resistance element was included for all the designs (located at node 2) with an assumed ±11°F
deadband and a setting of 108.5°F on and 130.5°F off.
4.3 SUMMARY OF REFRIGERANT, COMPRESSOR, AND SYSTEM DESIGN
ASSUMPTIONS AND PERFORMANCE
A summary of the compressor types, efficiencies, sizes, and nominal cooling capacities used in
the analysis for the nine design cases is shown in Table 1. This is followed for each case by the
design configuration and control assumptions. Next the HPWH-on-time-averaged EWTs and
corresponding heating capacities and COPs are given. The final entries are the calculated EFs for
the two different tank heat loss levels. Note that the EF calculations used the HPWH system
performance maps for each case with the EWTs varying from 55 to 135°F at the fixed 67.5°F DB,
50% RH inlet air condition of the DOE EF test. The first four cases are for a stepwise tank heat-
up design, with a once-through heat-up design for the remaining five.

7
The first case listed is the larger of the two R-134a compressor sizes considered, with the highest
rated compressor EER of 10.3. The second entry is the smallest high-efficiency rotary model for
which a performance map was available to us. This unit as built has a lower-efficiency CSIR
(capacitor-start, induction-run) motor; however, the manufacturer indicated that if this motor
were replaced with a higher-efficiency PSC (permanent-split capacitor) motor, the rated
efficiency could be increased to near that of the 10.3 EER model. Based on this information, we
assumed a 10 EER could be achieved with this change.
The third case is for the smallest high-efficiency R-410A rotary available by the same
manufacturer. This model has a somewhat lower cooling EER due to differing refrigerant
thermodynamic properties. A better comparison of compressor-only performance is obtained by
calculating the overall isentropic compressor efficiency from shell inlet to exit, as shown in the
column following the rated EER values. By this measure, the compressor efficiency is 58%
compared to 60 and 61% for the two R-134a compressors.

8
Table 1. Summary of compressor and system performance predictions for nine HPWH designs with high-efficiency components
Case Refrigerant Type EER 1,2
Overall Isen. Displ. Q_c 1,2
Heatup Return Control EWT_ave Q_h3
COP_h 3
EF0.90 EF0.95
(Btu/W-hr) Efficiency (in3) (Btu/hr) Method Node Node (F) (Btu/hr)
1 R-134a Rotary 10.3 1
0.61 0.697 5420 1
Stepwise 5 5 114.6 6810 3.43 3.02 3.18
2 R-134a Rotary 10 1
0.60 0.580 4350 1
Stepwise 5 5 111.4 5865 3.63 3.17 3.33
3 R-410A Rotary 8,7 1
0.58 0.330 4850 1
Stepwise 5 5 114.3 6560 3.22 2.83 2.98
4 CO2 Recip 9.3 2
0.52 0.107 4890 2
Stepwise 5 5 110.5 5340 2.14 1.84 1.94
5 CO2 Recip 9.3 2
0.52 0.107 4890 2
Once-Thru 1 5 91.9 6200 2.62 2.23 2.35
6 CO2 Recip 9.3 2
0.52 0.107 4890 2
Once-Thru 1 2 82.9 6655 2.86 2.51 2.63
7 CO2 w LSHX5
Recip 9.3 2
0.52 0.107 4890 2
Once-Thru 1 2 82.9 6470 3.01 2.61 2.75
8 R-134a6
Rotary 10 1
0.60 0.580 4350 1
Once-Thru 1 2 78 5380 2.55 2.12 2.22
9 R-134a Rotary 10.3 1
0.61 0.697 5420 1
Once-Thru 1 2 80 6485 2.7 2.42 2.54
1 At Te/Tc/SH/SC rating condition of 45/130/20/15 F
2 At Te/Pc/RG/LL rating condition of 45F/85bar/90F/90F (ASHRAE HBP32)
3 At approximate average HPWH operation conditions for EF Test at DB=67.5F, RH=50% inlet air
4 Predicted based on performance maps from 55F to 135F EWTs, TRNSYS tank model with t-stat settings consistent with DOE 24-hour EF test procedure
5 Idealized LSHX heating suction gas to 90F where possible, depending on EWT.
6 Upper element was activated during EF draws for the 108.5F on, 130.5F off t-stat set point at node 2 (as used for all cases), lowering the effective EF for this case.
Note that all analyses use actual compressor maps except for the 10 EER R-134a case which uses an adjusted map with the
EER scaled from 9.1 to 10 EER to reflect expected gains in switching from a lower efficiency CSIR to a higher-efficiency PSC motor.
Energy Factors 4
Compressor Specifications Ave. Heating PerformanceOperation/Control Approach

9
The fourth case shown is for a reciprocating CO2 compressor. Here the rated EER, as noted in the
footnotes, is by necessity based on a different set of test conditions for the transcritical
compression cycle. Again, the overall isentropic efficiency calculated at the rating point gives a
better measure of the relative compressor performance. (No rotary CO2 compressor performance
maps could be obtained for this analysis.)
The column after the compressor efficiencies shows the compressor displacements, which
decrease as the operating evaporating pressures increase from R-134a to R-410A to CO2. The
rated cooling capacities for the two R-134a cases bracket the rated capacities for the R-410A and
CO2 units. The predicted heating capacities and COPs for the first four cases at their respective
average EWTs show similar capacities for the HFC cases and a slightly lower average capacity
for the CO2 case.
4.4 HPWH EF PREDICTIONS FOR STEPWISE HEAT-UP DESIGNS
The resultant EFs for the first two R-134a cases show values greater than 3 for both tank heat loss
assumptions. The smaller capacity R-134a case is the only one predicted to have an EF greater
than the 3.19 target, although two other R-134a configurations (the smaller compressor with less
insulated tank and the larger compressor with better insulated tank) are very close. These cases
would exceed the target if the shell heat loss fractions were moderately lower than the assumed
values (which were based on 425 cfm of air over the compressor).
As the assumed airflow is 300 cfm for these cases and most likely all of this airflow will not flow
over the compressor, it is likely that the applied airflow across the compressor could be 50% or
less of the tested levels. However, since we did not have data to predict these lowered levels, we
did not attempt such an analysis at this time. If the shell heat loss fractions (which ranged from
about 20% at 55°F EWT to 40% at 135°F EWT for the HFC cases) were reduced by one half or
more, this could also move the predicted EF values that are presently around 3.0 up close to the
target level. Further calorimeter tests with reduced airflow over the compressor are recommended
to allow these effects to be better quantified.
The smaller capacity R-134a case has about 5% higher EFs than the larger R-134a case. Three
factors contribute to this result. First, the steady-state COP at the same EWT is slightly higher
(1.5%) for the smaller unit due to lower loading on the equally sized heat exchangers, even
though the compressor efficiency is slightly lower. The other factors are related to lower water
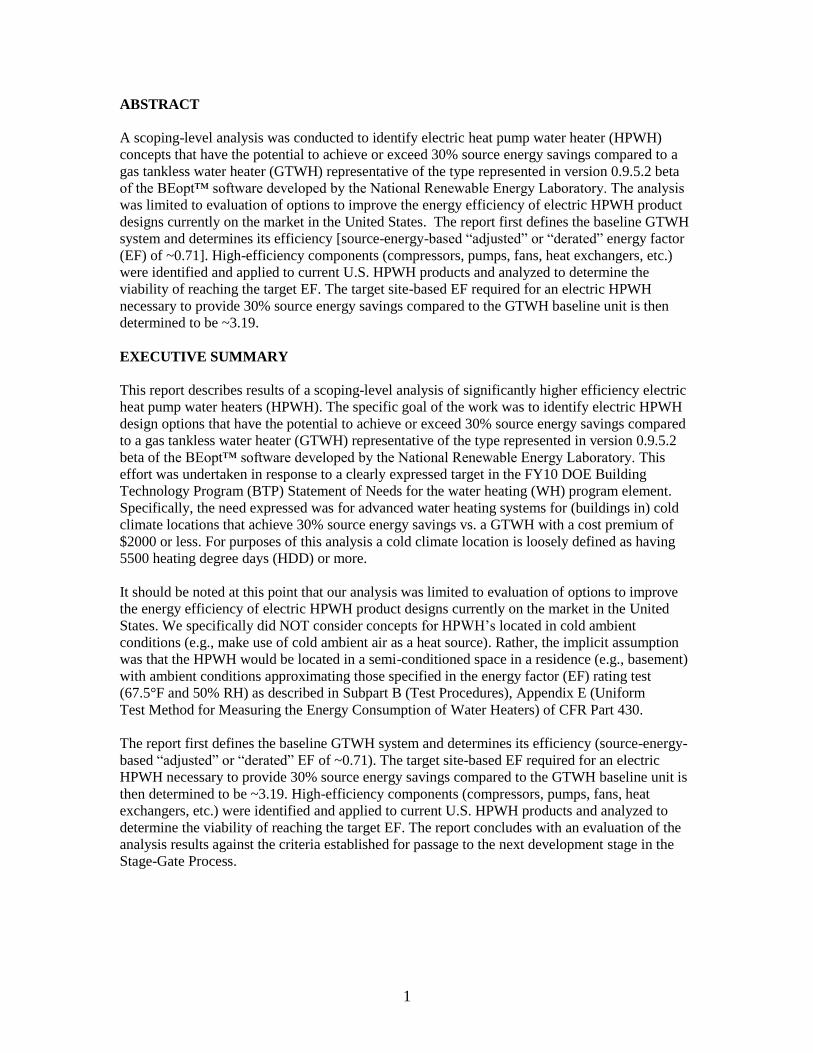
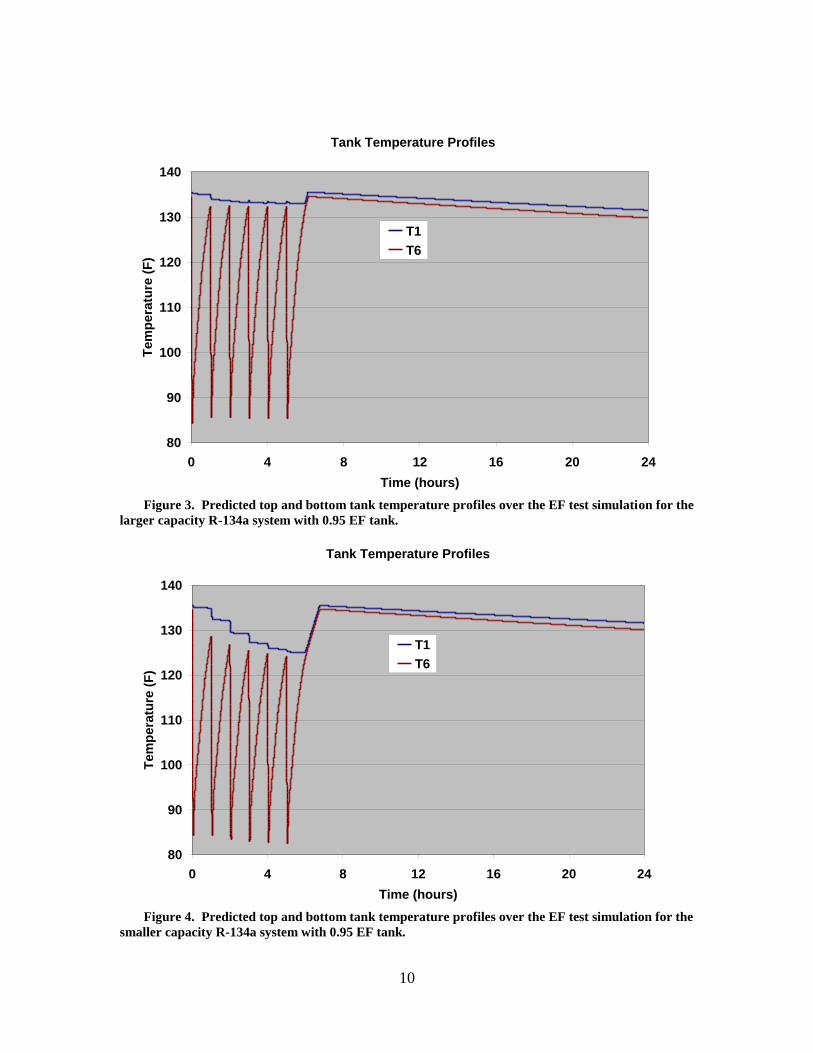
temperatures during the draw and heat-up cycles. Figures 3 and 4 show the predicted top and
bottom tank temperatures versus time for the 24-hour tests for the larger and smaller R-134a
compressors, respectively. The smaller R-134a unit in Figure 4 has a lower average EWT, as seen
from Table 1, which increases the operating COP. This is because the smaller capacity unit
cannot maintain tank temperatures as high during the 6 water draws in the initial part of the 24-
hour EF test. Finally, the lower tank temperatures result in less tank heat loss, which in turn also
results in a higher EF.
10
Tank Temperature Profiles
80
90
100
110
120
130
140
0 4 8 12 16 20 24
Time (hours)
Te
mp
era
ture
(F
)
T1
T6
Figure 3. Predicted top and bottom tank temperature profiles over the EF test simulation for the
larger capacity R-134a system with 0.95 EF tank.
Tank Temperature Profiles
80
90
100
110
120
130
140
0 4 8 12 16 20 24
Time (hours)
Te
mp
era
ture
(F
)
T1
T6
Figure 4. Predicted top and bottom tank temperature profiles over the EF test simulation for the
smaller capacity R-134a system with 0.95 EF tank.

11
The on and off settings assumed for the upper electric element thermostat (located at node 2) for
all the EF and the first-hour rating tests were such that no resistance element energy was used in
the EF test for any of the stepwise cases examined. Predicted first-hour ratings were > 64 gallons
in all cases.
4.5 HPWH EF PREDICTIONS FOR ONCE-THROUGH HEAT-UP DESIGNS
With regard to the CO2 HPWH with a stepwise heat-up design in case 4, the predicted EF
performance was substantially lower than for the HFC cases. In case 5, the same equipment is
controlled in a once-through design which yields a much lower average operating EWT than in
case 4 and thus a higher EF. For this case, the control node was left at node 5, which reduced the
temperature stratification during the heat-up cycles.
In case 6, the control point was moved to node 2, which maintained more tank stratification. In
combination with the glide matching between the CO2 and the water in the gas cooler with the
larger water delta-T’s, the EFs for case 6 are 36% higher than in case 4. Even so, the EFs for the
CO2 HPWH design of case 6 are 21% lower than for the highest performing R-134a case. About
12 percentage points of this can be attributed to the lower compressor efficiency of the available
reciprocating model. Some further loss may be attributable to the fixed-orifice refrigerant flow
control assumption used for this analysis as compared with a variable refrigerant flow control
(TXV or EXV) for the HFC cases.
Next we added a liquid-to-suction line heat exchanger (LSHX) in the CO2 cycle analysis, which
can be beneficial to transcritical cycle performance. We assumed an idealized LSHX where the
suction temperature was heated where possible to 90°F (the limiting suction inlet temperature for
the compressor), depending on the EWT. This increased the EFs 4 to 4.5%, leaving them still
about 18% lower than the best R-134a case. It appears that all of these improvements would be
needed along with a lower compressor shell heat loss for CO2 HPWHs to match the EF
performance potential of R-134a or its low GWP alternative R-1234yf (which is expected to have
an EF similar to that of R-134a). One possible advantage of the once-through CO2 design could
be hotter water temperatures provided more quickly to the top of the tank. As shown in Figure 5,
the top tank temperatures in the EF test for the CO2 system are somewhat higher than for the
highest performing R-134a system in Figure 4 during the draw periods. However, the average of
these higher top tank temperatures in Figure 5 is about the same as that for the higher capacity R-
134a case in Figure 3, which has EFs more than 15.6% higher.

12
Tank Temperature Profiles
60
70
80
90
100
110
120
130
140
0 4 8 12 16 20 24
Time (hours)
Tem
pera
ture
(F
) T1
T6
Figure 5. Predicted top and bottom tank temperature profiles over the EF test simulation for the
CO2 system with LSHX with 0.95 EF tank.
In the last two cases shown in Table 1, the two original R-134a design setups are re-configured
for once-through operation by lowering the water flow rates and changing the return node and
control locations. These two CO2-design-equivalent setups show that conventional HPWH
refrigerants operating at constant condensing temperature conditions lose considerable
performance in a once-through setup. Note that the higher performing, lower capacity R-134a
unit in a stepwise configuration is now the lowest efficiency case because the upper element was
activated due to insufficient heating capacity during the EF test draws. The larger R-134a unit in
once-through mode performs almost as well as the non-LSHX CO2 case (case 5), but with the
compressor operating at elevated condensing temperatures throughout the EF test. Predicted first-
hour ratings were again > 64 gallons in all cases since this value is primarily determined by the
upper element size, location, and control settings.
4.6 POSSIBLE FURTHER ANALYSIS WORK
For both the HFC and CO2 systems, the compressors were assumed to be single speed. Higher
efficiencies could likely be obtained with variable-speed compressors but no data were available
on the performance or operating envelopes of such compressors. Variable-speed compressors
provide the opportunity to slow down the compressor speed when the tank is approaching the set
point temperatures, thus unloading the heat exchangers and reducing the pressure ratios during
the lowest efficiency part of the heat-up cycle. This could be an area of further investigation and
additional performance gains ― gains which would need to be justified in energy savings and/or
improved hot water delivery, relative to the added cost.

13
Lastly it should be noted that tank models used to predict temperature distributions in the water
tanks could be improved by more validation for EF test conditions with forced external flow of
both fixed and varying flow rates with water return nodes at the top or near the bottom of the
tank. The absolute accuracy of the EF predictions depends on good prediction of the average
EWTs seen by the HPWHs during heat-up operation. Further lab testing and validation work are
recommended to refine the mixing assumptions used in the TRNSYS analysis for specific
configurations.
5. PRELIMINARY ESTIMATE OF NATIONAL ENERGY IMPACTS FROM TARGET
HPWH TECHNOLOGY
5.1 COMPARED TO THE GTWH BASELINE
According to Table HC9.8 of the 2005 Residential Energy Consumption Survey (RECS 2005,
http://www.eia.doe.gov/emeu/recs/recs2005/hc2005_tables/hc8waterheating/pdf/tablehc9.8.pdf)
about 33% of all U.S. housing units were located in cold climate areas (defined as having 5500
HDD or more for purposes of this study), and 60% of those used natural gas as the primary water
heating fuel. Data from RECS 2005, Table WH4
(http://www.eia.doe.gov/emeu/recs/recs2005/c&e/waterheating/pdf/tablewh4.pdf) indicate that
some 36% of total U.S. natural gas consumption for water heating can be assigned to those
residences, or a total of ~0.39 quads based on data in the 2009 update of the DOE Building
Energy DataBook (BED 2009, http://buildingsdatabook.eere.energy.gov/). The 2005 Guide for
Evaluation of Energy Savings Potential indicates that the average EF of gas water heaters to be
used as the base for energy savings computation in the U.S. is 0.59. Based on these data, if all gas
water heaters in cold climate residences switched to GTWH with an EF of 0.81 (e.g., 100%
market penetration of GTWH technology), total annual WH energy consumption for those
regions of the U.S. would drop to ~0.284 quads (0.39 x 0.59/0.81). If these were all replaced by
electric HPWHs meeting the target EF criteria (e.g., 30% source energy savings vs. GTWH
baseline), total annual WH energy consumption would further drop to~0.199 quads (0.284x70%)
for a maximum national energy savings of 0.085 quads (0.284 – 0.199). As noted, this is
maximum savings potential assuming eventual 100% market penetration of the advanced electric
HPWH technology.
5.2 COMPARED TO THE CURRENT ELECTRIC STORAGE WH STOCK
Table HC9.8 of RECS 2005 indicates that ~27% of residences in cold locations use electricity as
the primary WH energy source. Table WH4 indicates that these residences consume ~26% of
total annual U.S. water heating electricity or ~ 0.35 quads. Using the baseline electric WH EF of
0.9 from the 2005 Guide for Evaluation of Energy Savings Potential, maximum annual energy
savings from 100% replacement of electric WH stock with HPWHs of 3.19 EF would be ~0.251
quads [0.35 x(1-0.9/3.19)]. As noted, this assumes 100% replacement of current technology with
the advanced target HPWH. Depending upon market forces alone, this is obviously optimistic ―
reality would suggest maximum penetration closer to perhaps 30% (~0.075 quad savings). But if
future DOE rulemaking results in requiring HPWH technology for storage WH of 40 gallons
RSV or higher, then ultimately almost all electric WH in U.S. residences would be replaced by
HPWH technology. If all are replaced by HPWHs with average EF of 2.2 (assumed typical
performance of current HPWH products), total annual energy savings would amount to ~0.207
quads. Incremental annual savings from use of the advanced 3.19 EF technology would amount to
0.044 quads.

14
6. QUALITATIVE DISCUSSION OF OTHER FACTORS AFFECTING “AS-
INSTALLED” ANNUAL PERFORMANCE IN A RESIDENCE
The EF analysis above is useful for comparison of ―rated‖ performance of the target electric
HPWH to existing HPWHs and the GTWH baseline. However, detailed analytical comparison of
―as-installed‖ annual performance would require an hourly or sub-hourly annual performance
simulation taking into account several other application factors (beyond the available resources of
this initial scoping project). One of these is the actual ambient conditions surrounding the unit,
which depend on its location in the residence. Another factor is the unit’s impact on house space
heating and cooling loads if installed in conditioned space. A basement location is likely to have
somewhat cooler ambient temperature than that specified in the EF rating test (67.5°F), which
would tend to degrade the HPWH performance relative to the GTWH baseline. However,
offsetting that effect, the tank thermostat setting is likely to be 10-15°F lower than that used in the
EF test (135°F), leading to higher performance of the HPWH relative to the GTWH baseline.
On a first order estimate we assume that these effects would approximately negate one another,
i.e., no significant change in the energy savings estimate. Location of the HPWH within the
conditioned space would provide the HPWH with 3.5 to 8.5°F warmer ambient source air
(assuming 71°F and 76°F winter and summer thermostat settings) than would a basement location
with concomitant improvement of its water heating performance, particularly in summer and
shoulder periods, relative to the GTWH baseline. This improvement (added to that due to lower
tank thermostat setting as described above) would be offset to some extent by the increase in
house space heating loads due to the HPWH operation in winter.
We have done some analysis to obtain a rough estimate of this impact for a Chicago, IL, location.
For a 2600 ft2, two-story house in that location the space heating load was estimated to increase
by ~9% and the space cooling load to decrease by ~26% with a small (2-3%) net increase in
annual space conditioning load, assuming that the air in the room with the HPWH is well mixed
with air from the rest of the house. For more northerly locations the net load increase will be
larger. As noted, a detailed annual simulation would be required to estimate the range of net
source energy consumption impacts of locating the target HPWH in the conditioned space, and
such a simulation is recommended going forward. It is assumed on a first order that the impact
would be small, perhaps insignificant, in Chicago. It should also be noted that the added
infiltration from the operation of the flue vent fan in the case of a tankless gas water heater would
likely increase space conditioning loads in both winter and summer months. For the baseline
GTWH, the vent fan airflow is estimated to be approximately 35 cfm whenever the unit is
operating. It should also be noted that cold climates have the lowest ground water temperatures
throughout the year. As such, this results in higher water heating loads in these climates and a
more beneficial performance from HPWHs due to the cooler EWTs to the unit when meeting
active house draws.
These various effects could be quantified to a large extent in a detailed annual performance
TRNSYS analysis comparing advanced HPWHs to GTWHs.
7. COMPARISON OF TARGET EF HPWH TO CURRENT RESIDENTIAL ELECTRIC
HPWH PRODUCTS
Electric HPWHs available in the United States as of August, 2010, include at least 28 models
under 16 brands from 6 different manufacturers. Of these, 23 models under 14 brands from 5
manufacturers were listed as being Energy Star-qualified. That is, each was of integral (or ―drop-

15
in‖) configuration with voltage 250 V, current 24 A, EF 2.0, first-hour rating 50 gallons,
warranty 6 years on the sealed system, and meeting UL 174 and UL 1995 safety standards.
Listed values for their associated EFs ranged from 2.00 to 2.51. First-hour ratings ranged from 60
to 84 gallons and rated storage volumes ranged from 50 to 80 gallons.
The target EF of 3.19 is more than 27% above the highest Energy Star listing (2.51 for an 80-
gallon RSV unit). When/if an HPWH product meeting the target is available, it would use about
21% less source energy than 2.51 EF units. If we choose the most widely used RSV for
residential electric water heaters (50 gallons) for comparison, the highest Energy Star-listed EF is
2.35. If the target is met for this size, then the target EF is almost 36% higher and the source
energy use would be about 26% lower.
At the 50-gallon size, the target represents a 237% increase in EF relative to the new minimum
standard (EF = 0.945) and a 253% increase relative to the current minimum standard (EF = 0.90).
The corresponding reductions in source energy consumption are 70% and 72%, respectively.
8. COMPARISON OF TARGET EF HPWH TO JAPANESE ECOCUTE HPWH
PRODUCTS
EcoCute HPWH systems employ CO2 as the working fluid and benefit from significant
government subsidies in Japan. Most such systems are of the split arrangement with separate
tanks that store large amounts (much more than typical daily usage of U.S. residences) of high
temperature water, with tank charging occurring primarily during the late night hours to take
advantage of low off-peak electricity prices. For these units, energy efficiency has been
characterized by an annual performance factor (APF) based on the Japanese Refrigeration and Air
Conditioning Industry Association Standard JRA 4050 (2007R and a subsequent annex). This
value is based on a number of steady-state tests with the heat pump operating at selected ambient
air (dry bulb and wet bulb) and water (inlet and exit) temperatures and appears to be specifically
tailored to Japanese operating conditions. It does not account for transient performance and tank
standby losses and therefore cannot be directly compared to the water heater EF rating employed
in the United States. Furthermore, the cost premium of EcoCute units relative to current Energy
Star-listed products appears to be prohibitive.
9. EVALUATION AGAINST GATE 2 GATE PERFORMANCE CRITERIA ― HIGHLY
EFFICIENT ELECTRIC HPWH FOR APPLICATION TO COLD CLIMATES PROJECT
As called for in the statement of work for the Highly Efficient Electric HPWH for Cold Climates
project, recommendations are provided here for the stage-gate performance energy savings
criteria for an advanced electric HPWH for application to cold climate residences for passage
from the project’s current stage, Applied Research, to the next stage, Exploratory Development.
For the sake of completeness and consistency, the entire set of stage-gate criteria is summarized.
Our recommendations are guided by the Building Technologies Program’s (BTP’s) Stage-Gate
Implementation Handbook for R&D Projects, June 2009, Version 1.0.
Including the required, corporate must-meet criteria (on page 33 of the stage-gate handbook), the
following are our recommendations for the full set of gate criteria.
16
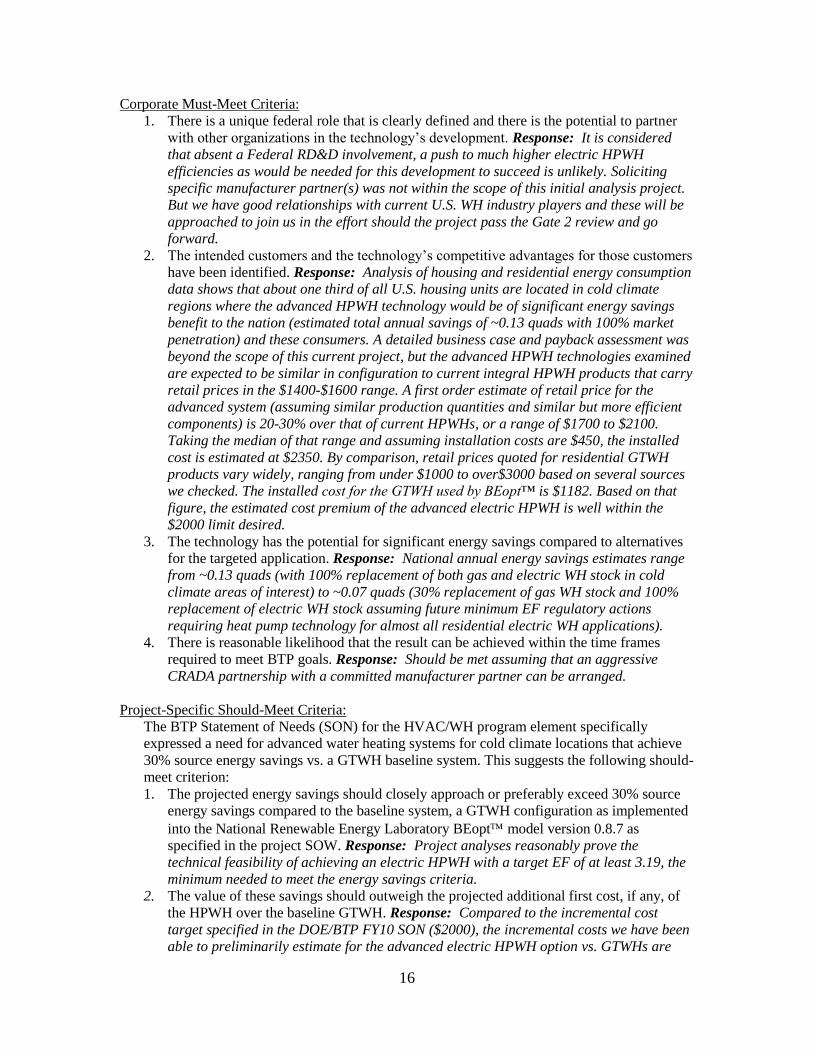
Corporate Must-Meet Criteria:
1. There is a unique federal role that is clearly defined and there is the potential to partner
with other organizations in the technology’s development. Response: It is considered
that absent a Federal RD&D involvement, a push to much higher electric HPWH
efficiencies as would be needed for this development to succeed is unlikely. Soliciting
specific manufacturer partner(s) was not within the scope of this initial analysis project.
But we have good relationships with current U.S. WH industry players and these will be
approached to join us in the effort should the project pass the Gate 2 review and go
forward.
2. The intended customers and the technology’s competitive advantages for those customers
have been identified. Response: Analysis of housing and residential energy consumption
data shows that about one third of all U.S. housing units are located in cold climate
regions where the advanced HPWH technology would be of significant energy savings
benefit to the nation (estimated total annual savings of ~0.13 quads with 100% market
penetration) and these consumers. A detailed business case and payback assessment was
beyond the scope of this current project, but the advanced HPWH technologies examined
are expected to be similar in configuration to current integral HPWH products that carry
retail prices in the $1400-$1600 range. A first order estimate of retail price for the
advanced system (assuming similar production quantities and similar but more efficient
components) is 20-30% over that of current HPWHs, or a range of $1700 to $2100.
Taking the median of that range and assuming installation costs are $450, the installed
cost is estimated at $2350. By comparison, retail prices quoted for residential GTWH
products vary widely, ranging from under $1000 to over$3000 based on several sources
we checked. The installed cost for the GTWH used by BEopt™ is $1182. Based on that
figure, the estimated cost premium of the advanced electric HPWH is well within the
$2000 limit desired.
3. The technology has the potential for significant energy savings compared to alternatives
for the targeted application. Response: National annual energy savings estimates range
from ~0.13 quads (with 100% replacement of both gas and electric WH stock in cold
climate areas of interest) to ~0.07 quads (30% replacement of gas WH stock and 100%
replacement of electric WH stock assuming future minimum EF regulatory actions
requiring heat pump technology for almost all residential electric WH applications).
4. There is reasonable likelihood that the result can be achieved within the time frames
required to meet BTP goals. Response: Should be met assuming that an aggressive
CRADA partnership with a committed manufacturer partner can be arranged.
Project-Specific Should-Meet Criteria:
The BTP Statement of Needs (SON) for the HVAC/WH program element specifically
expressed a need for advanced water heating systems for cold climate locations that achieve
30% source energy savings vs. a GTWH baseline system. This suggests the following should-
meet criterion:
1. The projected energy savings should closely approach or preferably exceed 30% source
energy savings compared to the baseline system, a GTWH configuration as implemented
into the National Renewable Energy Laboratory BEopt model version 0.8.7 as
specified in the project SOW. Response: Project analyses reasonably prove the
technical feasibility of achieving an electric HPWH with a target EF of at least 3.19, the
minimum needed to meet the energy savings criteria.
2. The value of these savings should outweigh the projected additional first cost, if any, of
the HPWH over the baseline GTWH. Response: Compared to the incremental cost
target specified in the DOE/BTP FY10 SON ($2000), the incremental costs we have been
able to preliminarily estimate for the advanced electric HPWH option vs. GTWHs are

17
much lower (~$1168 compared to the GTWH unit cost of $1182 used by BEopt™). So
from this standpoint, this criterion has definitely been met.
Viewed from the consumer economics standpoint, the results are mixed. As noted above,
a detailed business case and consumer payback analysis was beyond the scope of the
project. However, a preliminary payback estimate of an advanced HPWH (3.19 EF) over
the baseline 0.81 EF GTWH (effective site EF=0.71) was made for a Chicago location
(with estimated WH load of 3850 kWh or 13.14 million Btu) using recent IL natural gas
and electricity prices available from EIA (July 2011 Natural Gas Monthly, Table 18,
http://www.eia.gov/pub/oil_gas/natural_gas/data_publications/natural_gas_monthly/cur
rent/pdf/table_18.pdf; and August 2011 Electric Power Monthly Table 5.6.B,
http://www.eia.gov/cneaf/electricity/epm/chap5.pdf, 2011 year to date average price data
through May; $7.79/1000 ft3 for gas and 11.46 ¢/kWh for electricity; publications
accessed August 25, 2011). Based on this information the estimated annual energy cost
savings from switching to the advanced HPWH is about $2. Using the preliminary
estimates of the HPWH average installed cost ($2350) and the GTWH installed cost used
in BEopt™, this yields a simple payback period of >500 years. Similar estimates for
Boston and Syracuse (with same annual WH load, gas prices of $13.26/1000 ft3 (est.) and
$12.69/1000 ft3 , and electricity prices of 14.73 ¢/kWh and 17.64 ¢/kWh , respectively)
gave annual cost savings and payback periods of about $61 and $17 and ~19 and ~70
years, respectively. Absent some utility (or other) incentive program to reduce cost of the
target EF HPWH to the consumer the likelihood is that this technology will not
significantly displace GTWHs where they are an option (e.g., natural gas is available to
the home owner). It should be noted that estimated consumer payback for the target 3.19
EF HPWH vs. a 2.2 EF HPWH in these same three cities is ~4-6 years, so the advanced
electric HPWH is a more attractive option where natural gas is not available.
One final point: As noted, the advanced electric HPWH technology options evaluated under this
project are largely extensions of existing HPWH product configurations. As such, they should be
equally applicable to both retrofit and new construction markets.
10. ORNL RECOMMENDATION
Based on the above, ORNL recommends that the project pass the Gate 2 review and proceed to
Stage 2, Exploratory Development, at least through lab proof of concept breadboard testing. If no
private sector partner can be interested in collaborating with us to take the development on to the
advanced Stages, it should probably go no further than Stage 2.

18
Appendix A
Takagi TK1 GTWH

19