Embed Size (px)
Citation preview
Confidential. © 2018 IHS MarkitTM. All Rights Reserved.Confidential. © 2017 IHS MarkitTM. All Rights Reserved.
22 March 2018Hilton Americas | Houston, TX, US
Highlights of a strong growth market –Polyester fibers & PET
Ashish PujariExecutive Director, Aromatics & FiberPolyester Fibers & PET
Polyester has today become an inseparable part of our daily lives, across all regions and social strata. China has dominated the growth in this industry in the past 20 years and alone accounts for more than 70% of the global market share. The textile industry is labor intensive and low wages and high productivity attracted invested in China. On the other have, bottle grade PET production costs are more or less same across the world, but the fast demand growth and easy availability of raw materials has helped drive most of the new investments into Asia.
Although bulk of the industry in now in Asia, its integration with other streams like olefins and refining means that any changes in polyester outlook continues to have global ramifications. The global integration is not only on the upstream side, but even in the downstream, PET recycling has now become a globally integrated industry, with China accounting processing almost 75% of global PET waste.
The industry saw sub‐par demand growth between 2012 and 2016 leading to the poor margins for a considerable period of time. However, with crude oil prices bottoming out through 2015 and continuing to move up over the last 2 years, the industry is witnessing a strong rebound in demand as well as margins. China’s new policy on imports of PET waste has put extra pressure in virgin polyester fibers, but is also expected to put pressure on global recyclers now.
Polyester industry is set for a strong 2018 – both for demand and margins, but there are developing mid term concerns which one needs to watch out!
1

Confidential. © 2018 IHS MarkitTM. All Rights Reserved.
Polyester has seen anaemic growth rates in past 5 years
Questions raised as confidence shaken
• Short-term phenomenon or new trend line?
• Reasons for slowdown
• Did market overestimate polyester potential?
• Has demand moved back to cotton?0
20
40
60
80
100
12 13 14 15 16N. America S. America W. Europe C. Europe
CIS & Baltics Africa Middle East Indian Subc.
NE Asia SE Asia Capacity
Global Polyester Melt Capacity & Demand Growth
Mill
ion
Met
ric T
ons
Source: IHS Markit © 2018 IHS Markit
5% 5% 4%4% 3%
7% 2% 2%9%8%
2
Confidential. © 2018 IHS MarkitTM. All Rights Reserved.
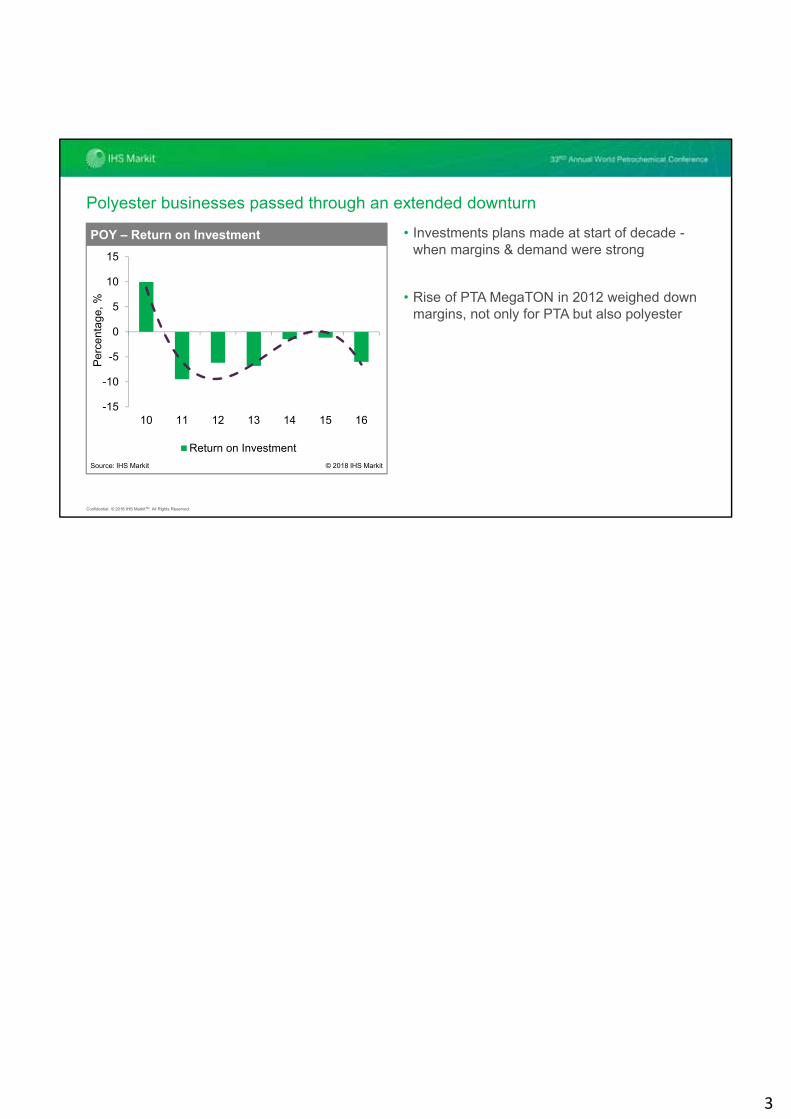
Polyester businesses passed through an extended downturn
• Investments plans made at start of decade -when margins & demand were strong
• Rise of PTA MegaTON in 2012 weighed down margins, not only for PTA but also polyester
-15
-10
-5
0
5
10
15
10 11 12 13 14 15 16
Return on Investment
Percentage,POY – Return on Investment
© 2018 IHS MarkitSource: IHS Markit
Per
cent
age,
%
3
Confidential. © 2018 IHS MarkitTM. All Rights Reserved.
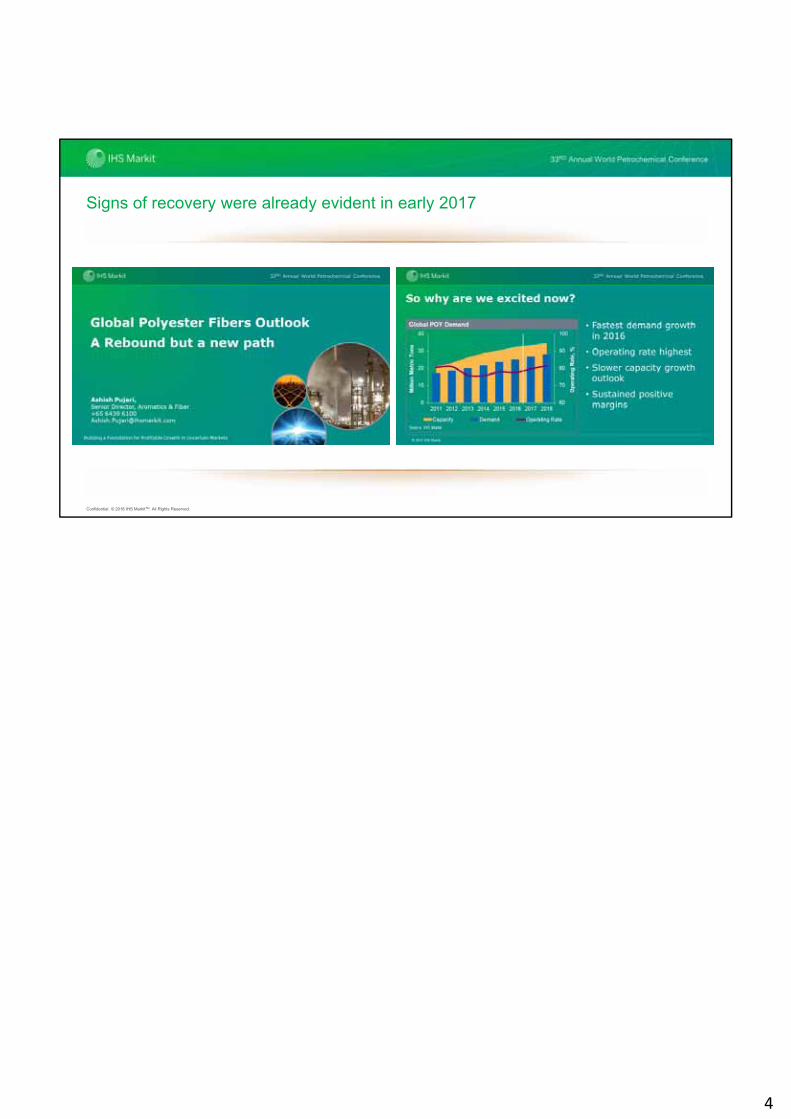
Signs of recovery were already evident in early 2017
4

Confidential. © 2018 IHS MarkitTM. All Rights Reserved.
What we’ll cover today
PET
Recycling
Polyester fiber
5
Confidential. © 2018 IHS MarkitTM. All Rights Reserved.
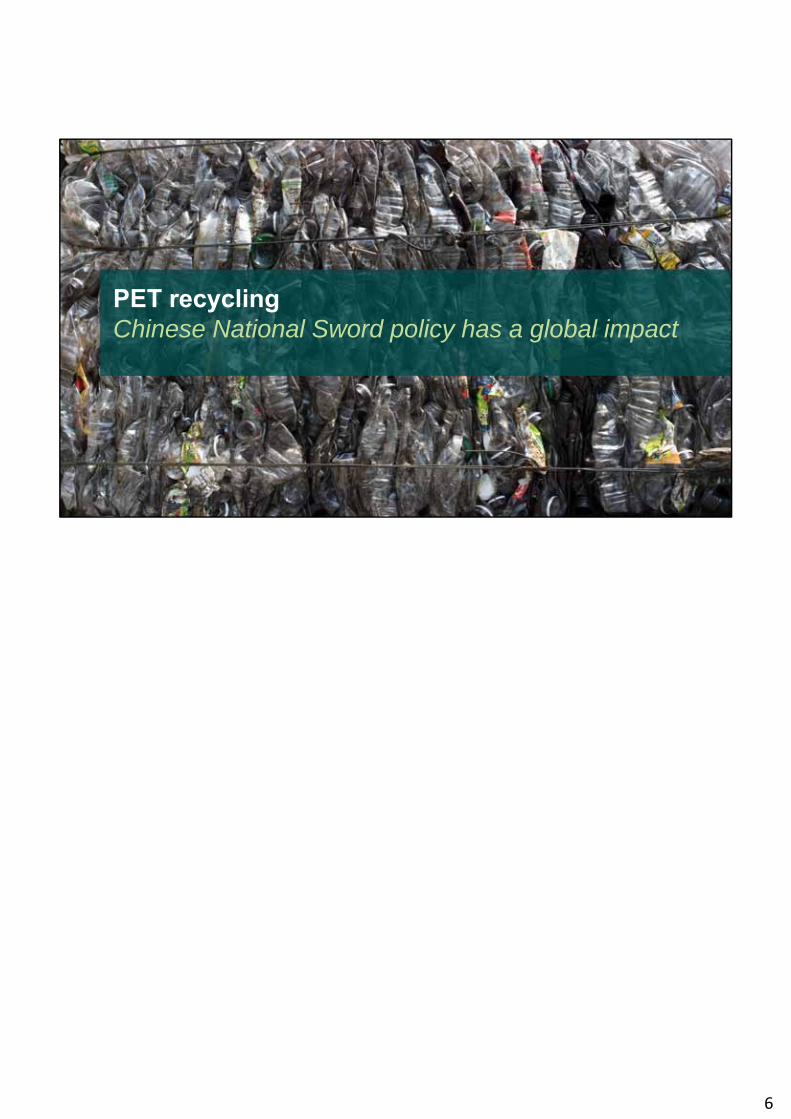
PET recyclingChinese National Sword policy has a global impact
6

Confidential. © 2018 IHS MarkitTM. All Rights Reserved.
PET growth attractive; but handling waste is growing concern
40% 46% 50%
0
10
20
30
40
50
60
0
5
10
15
20
25
30
12 17 22
Bottle Collection PET Consumption
Globally - waste collection has grown faster than virgin PET demand
Source: IHS Markit
Mill
ion
Met
ric T
ons
PE
T B
ottle
Col
lect
ion
, %
© 2018 IHS Markit
7
Confidential. © 2018 IHS MarkitTM. All Rights Reserved.
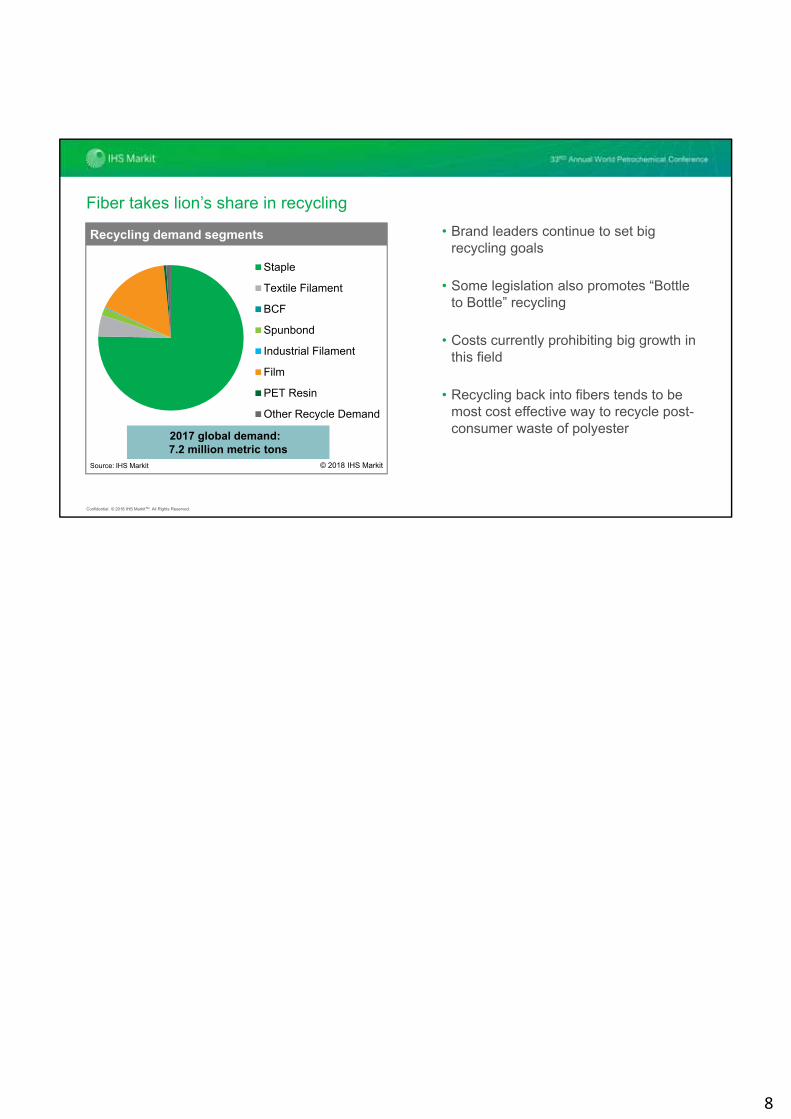
• Brand leaders continue to set big recycling goals
• Some legislation also promotes “Bottle to Bottle” recycling
• Costs currently prohibiting big growth in this field
• Recycling back into fibers tends to be most cost effective way to recycle post-consumer waste of polyester
Staple
Textile Filament
BCF
Spunbond
Industrial Filament
Film
PET Resin
Other Recycle Demand
Recycling demand segments
Source: IHS Markit © 2018 IHS Markit
Fiber takes lion’s share in recycling
2017 global demand: 7.2 million metric tons
8

Confidential. © 2018 IHS MarkitTM. All Rights Reserved.
Polyester recycling – caught between economics & regulation
Imports43%Domestic
57%
PET recylate processed in China
Source: IHS Markit © 2018 IHS Markit
2017 estimated processed volume: 5.1 million metric tons
50%
60%
70%
80%
0
2
4
6
12 13 14 15 16 17
Domestic PET Consumption Recylate Collection
China’s own recycling standards faltering!
Source: IHS Markit © 2018 IHS Markit
Mill
ion
Met
ric T
ons
Rec
ycla
te C
olle
ctio
n
9

Confidential. © 2018 IHS MarkitTM. All Rights Reserved.
0
100
200
300
400
500
0
500
1,000
1,500
2,000
2,500
2012 Q1 2013 Q3 2015 Q1 2016 Q3 2018 Q1
Crude Oil Virgin Recycle
Polyester Chip Price: Virgin vs Recycle
Source: IHS Markit
Polyester Chip Price: Virgin vs Recycle
Pric
e,D
olla
rs p
er M
etric
Ton
China - Polyester chip price: Virgin vs recycle
Diff
eren
tials
, D
olla
rsP
er M
etric
Ton
© 2018 IHS Markit
Economic incentive primary driver for consuming fibers from recycleDiscounts over virgin PSF dropped to lowest levels after China’s ban on imports of PET waste as supply has tightened
Differential
10
Confidential. © 2018 IHS MarkitTM. All Rights Reserved.
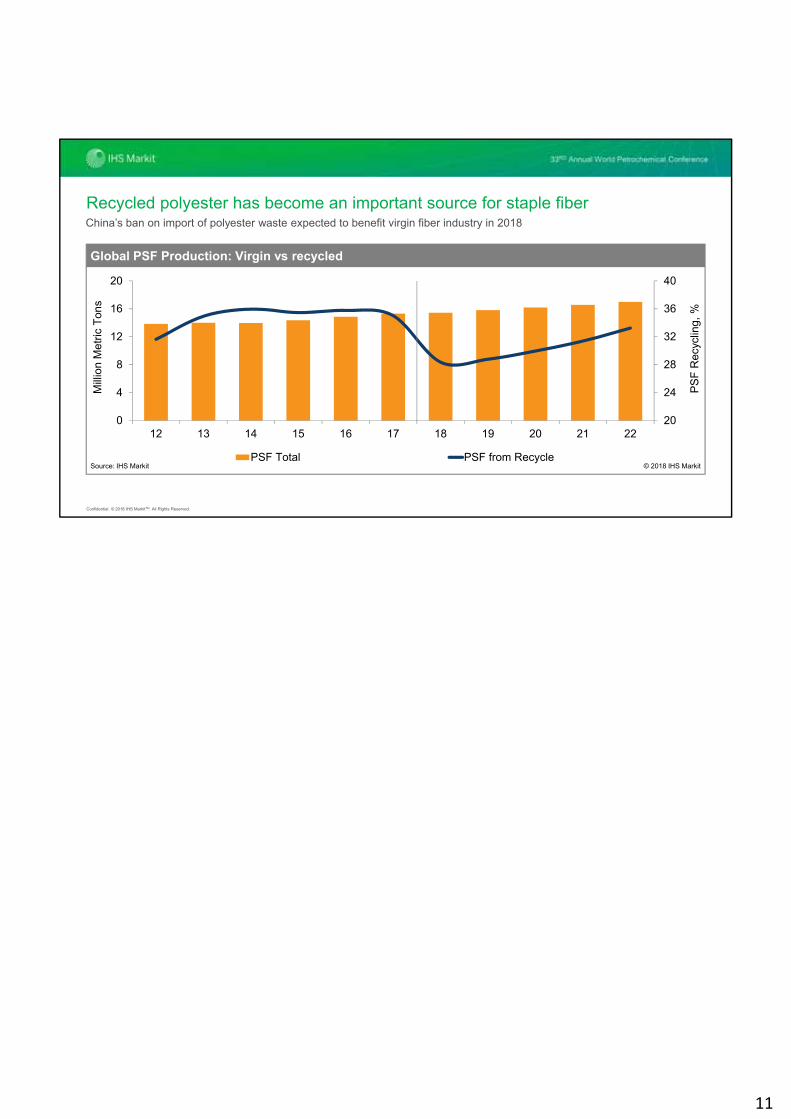
Recycled polyester has become an important source for staple fiberChina’s ban on import of polyester waste expected to benefit virgin fiber industry in 2018
20
24
28
32
36
40
0
4
8
12
16
20
12 13 14 15 16 17 18 19 20 21 22
PSF Total PSF from Recycle
Global PSF Production: Virgin vs recycled
Source: IHS Markit
Mill
ion
Met
ric T
ons
PS
F R
ecyc
ling,
%
© 2018 IHS Markit
11

Confidential. © 2018 IHS MarkitTM. All Rights Reserved.
-20%
-15%
-10%
-5%
0%
5%
10%
15%
12 14 16 18 20 22 24 26G
row
th R
ate
Virgin fibers Recycled fibers
Source: IHS Markit © 2018 IHS Markit
Global Fiber supply growth: Virgin vs. recycled
Policy measures delay growth of recycling, but economics favors more recycling
12
Confidential. © 2018 IHS MarkitTM. All Rights Reserved.
PETMost producers see better days, as few majors falter
13
Confidential. © 2018 IHS MarkitTM. All Rights Reserved.
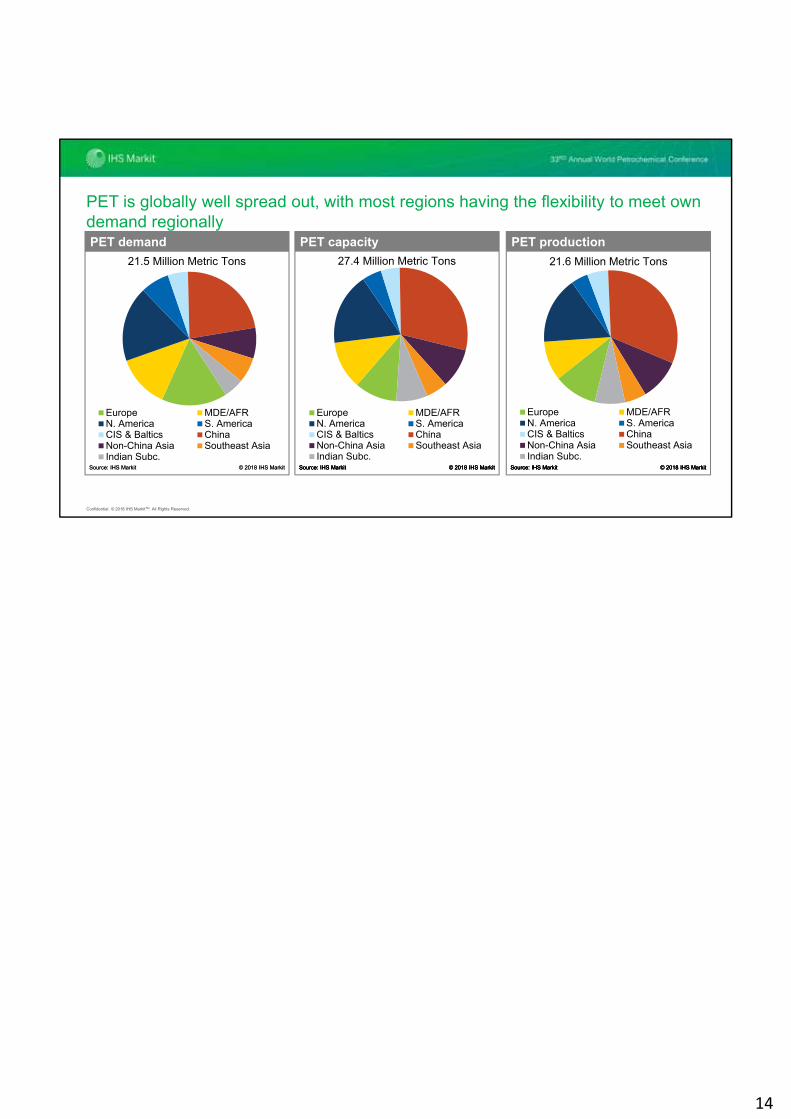
PET is globally well spread out, with most regions having the flexibility to meet own demand regionally
Europe MDE/AFRN. America S. AmericaCIS & Baltics ChinaNon-China Asia Southeast AsiaIndian Subc.
27.4 Million Metric Tons
PET
Source: IHS Markit © 2018 IHS Markit
PET Capacity
Source: IHS Markit © 2018 IHS Markit
PET
Source: IHS Markit © 2018 IHS Markit
PET capacity
Source: IHS Markit © 2018 IHS Markit
Europe MDE/AFRN. America S. AmericaCIS & Baltics ChinaNon-China Asia Southeast AsiaIndian Subc.
21.6 Million Metric Tons
PET
Source: IHS Markit © 2018 IHS Markit
PET Capacity
Source: IHS Markit © 2018 IHS Markit
PET
Source: IHS Markit © 2018 IHS Markit
PET production
Source: IHS Markit © 2018 IHS Markit
Europe MDE/AFRN. America S. AmericaCIS & Baltics ChinaNon-China Asia Southeast AsiaIndian Subc.
21.5 Million Metric Tons
PET
Source: IHS Markit © 2018 IHS Markit
PET demand
Source: IHS Markit © 2018 IHS Markit
14
Confidential. © 2018 IHS MarkitTM. All Rights Reserved.
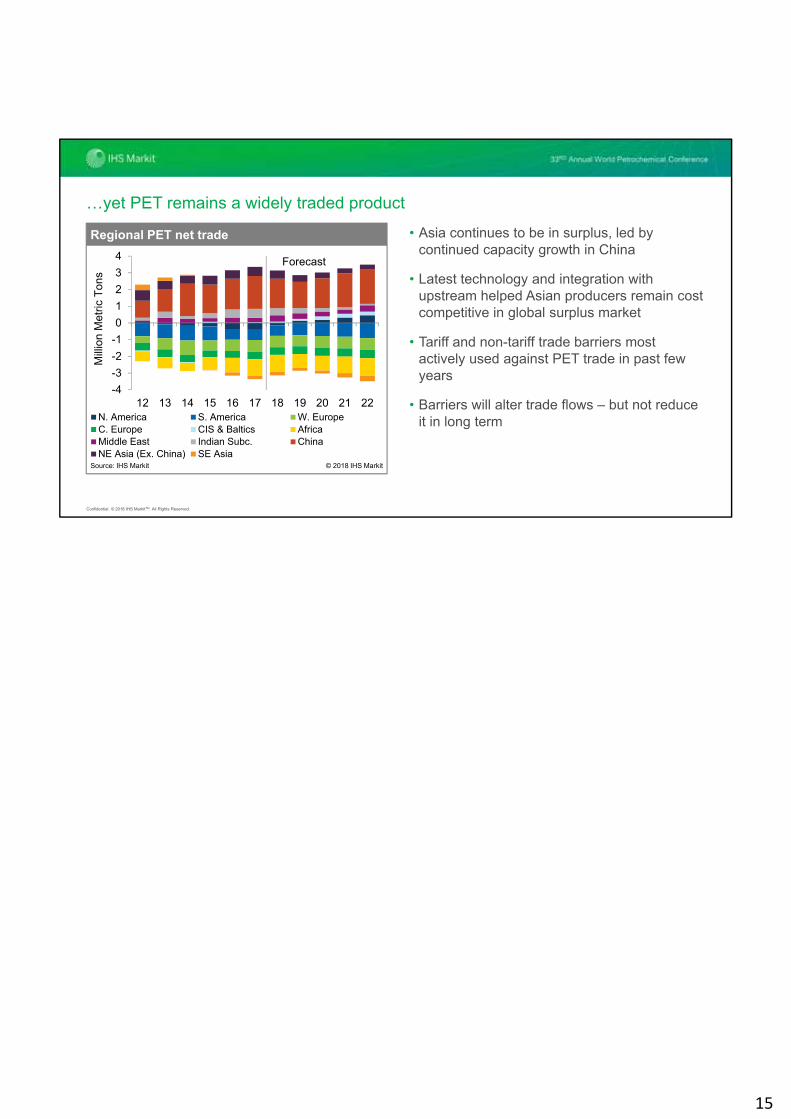
…yet PET remains a widely traded product
• Asia continues to be in surplus, led by continued capacity growth in China
• Latest technology and integration with upstream helped Asian producers remain cost competitive in global surplus market
• Tariff and non-tariff trade barriers most actively used against PET trade in past few years
• Barriers will alter trade flows – but not reduce it in long term
-4
-3
-2
-1
0
1
2
3
4
12 13 14 15 16 17 18 19 20 21 22N. America S. America W. EuropeC. Europe CIS & Baltics AfricaMiddle East Indian Subc. ChinaNE Asia (Ex. China) SE Asia
Regional PET net trade
Forecast
Mill
ion
Met
ric T
ons
Source: IHS Markit © 2018 IHS Markit
15
Confidential. © 2018 IHS MarkitTM. All Rights Reserved.
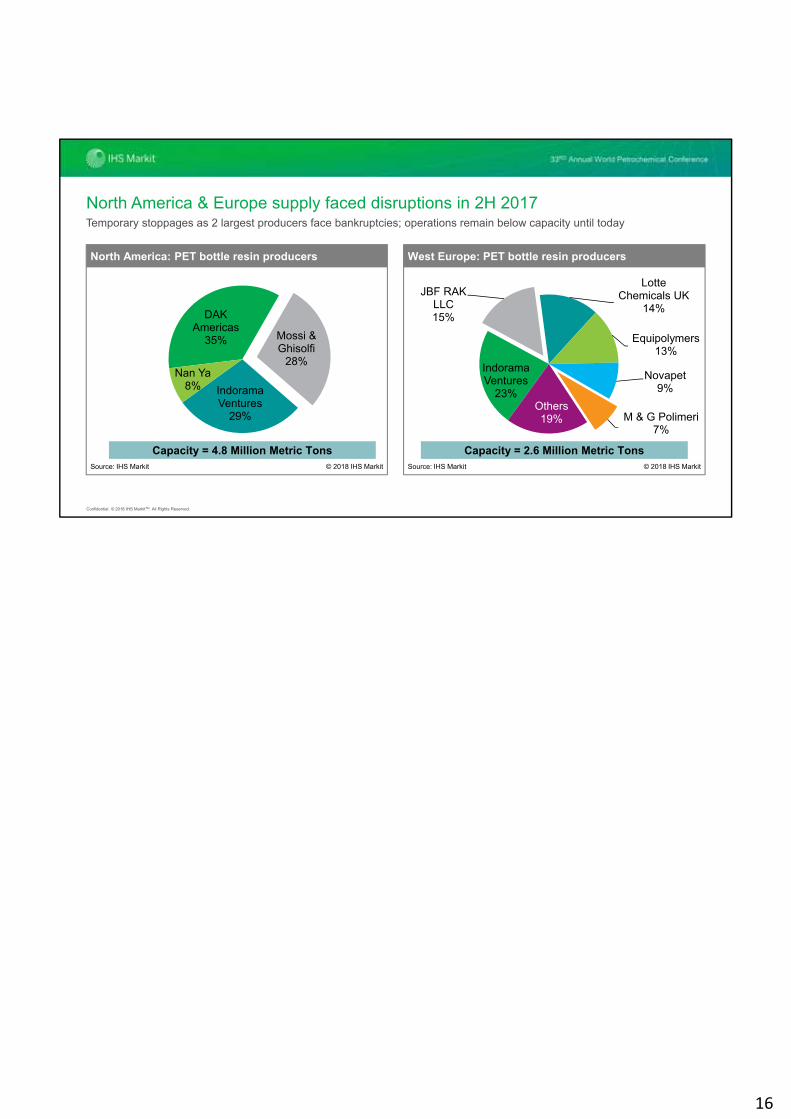
DAK Americas
35% Mossi & Ghisolfi
28%
Indorama Ventures
29%
Nan Ya8%
Capacity = 4.8 Million Metric Tons
North America: PET bottle resin producers
© 2018 IHS MarkitSource: IHS Markit
Indorama Ventures
23%
JBF RAK LLC15%
Lotte Chemicals UK
14%
Equipolymers13%
Novapet9%
M & G Polimeri7%
Others19%
Capacity = 2.6 Million Metric Tons
West Europe: PET bottle resin producers
© 2018 IHS MarkitSource: IHS Markit
Temporary stoppages as 2 largest producers face bankruptcies; operations remain below capacity until today
North America & Europe supply faced disruptions in 2H 2017
16

Confidential. © 2018 IHS MarkitTM. All Rights Reserved.
0
50
100
150
200
250
Jan-
17
Feb
-17
Mar
-17
Apr
-17
May
-17
Jun-
17
Jul-1
7
Aug
-17
Sep
-17
Oct
-17
Nov
-17
Dec
-17
Jan-
18
NAM SAM USA NEA SEA JAPISC WEP CEP AFR CIS MDE
PET: Exports from China
Tho
usan
d M
etric
Ton
s
Source: IHS Markit © 2018 IHS Markit
0
10
20
30
40
50
Jan-
17
Feb
-17
Mar
-17
Apr
-17
May
-17
Jun-
17
Jul-1
7
Aug
-17
Sep
-17
Oct
-17
Nov
-17
Dec
-17
Jan-
18
NAM SAM USA NEA SEA JAPISC WEP CEP AFR CIS MDE
PET: Exports from South Korea
Tho
usan
dM
etric
Ton
s
Source: IHS Markit © 2018 IHS Markit
Trade barriers altering trade flows, overall trade volumes still increasing
Asian exporters have benefitted from global supply disruptions
17
Confidential. © 2018 IHS MarkitTM. All Rights Reserved.
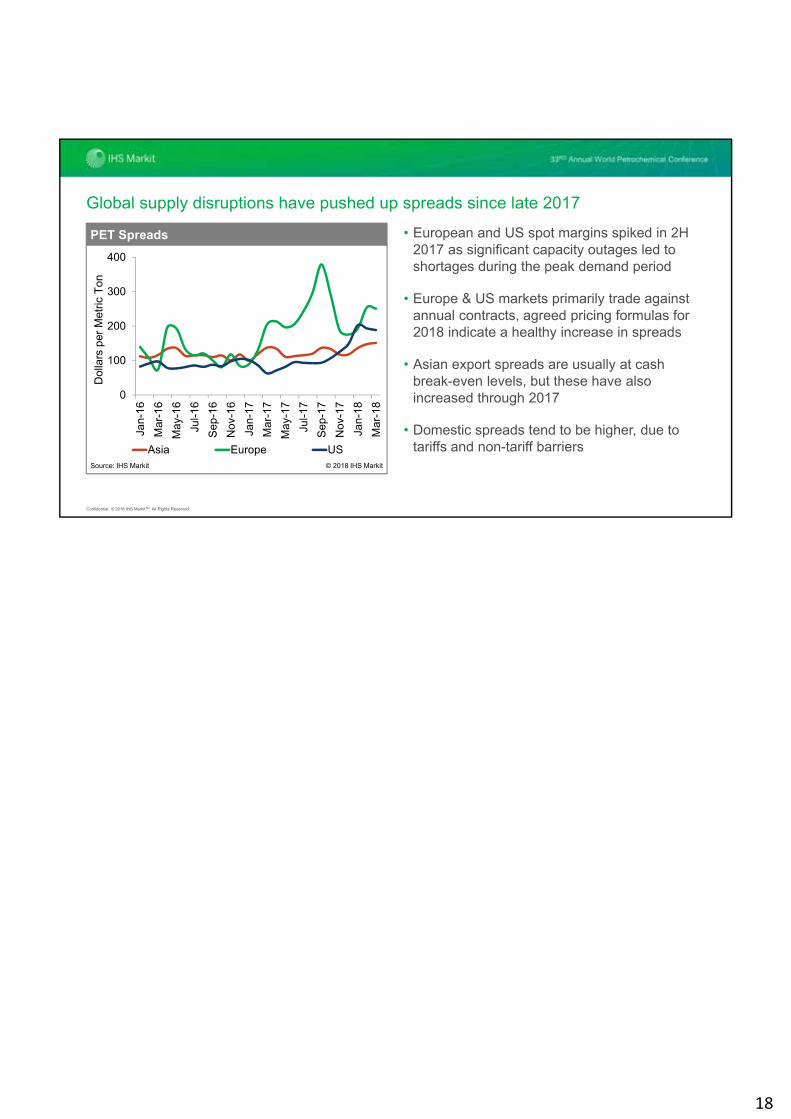
Global supply disruptions have pushed up spreads since late 2017
0
100
200
300
400
Jan-
16
Mar
-16
May
-16
Jul-1
6
Sep
-16
Nov
-16
Jan-
17
Mar
-17
May
-17
Jul-1
7
Sep
-17
Nov
-17
Jan-
18
Mar
-18
Asia Europe US
PET Spreads
Source: IHS Markit © 2018 IHS Markit
Dol
lars
per
Met
ric T
on
• European and US spot margins spiked in 2H 2017 as significant capacity outages led to shortages during the peak demand period
• Europe & US markets primarily trade against annual contracts, agreed pricing formulas for 2018 indicate a healthy increase in spreads
• Asian export spreads are usually at cash break-even levels, but these have also increased through 2017
• Domestic spreads tend to be higher, due to tariffs and non-tariff barriers
18
Confidential. © 2018 IHS MarkitTM. All Rights Reserved.
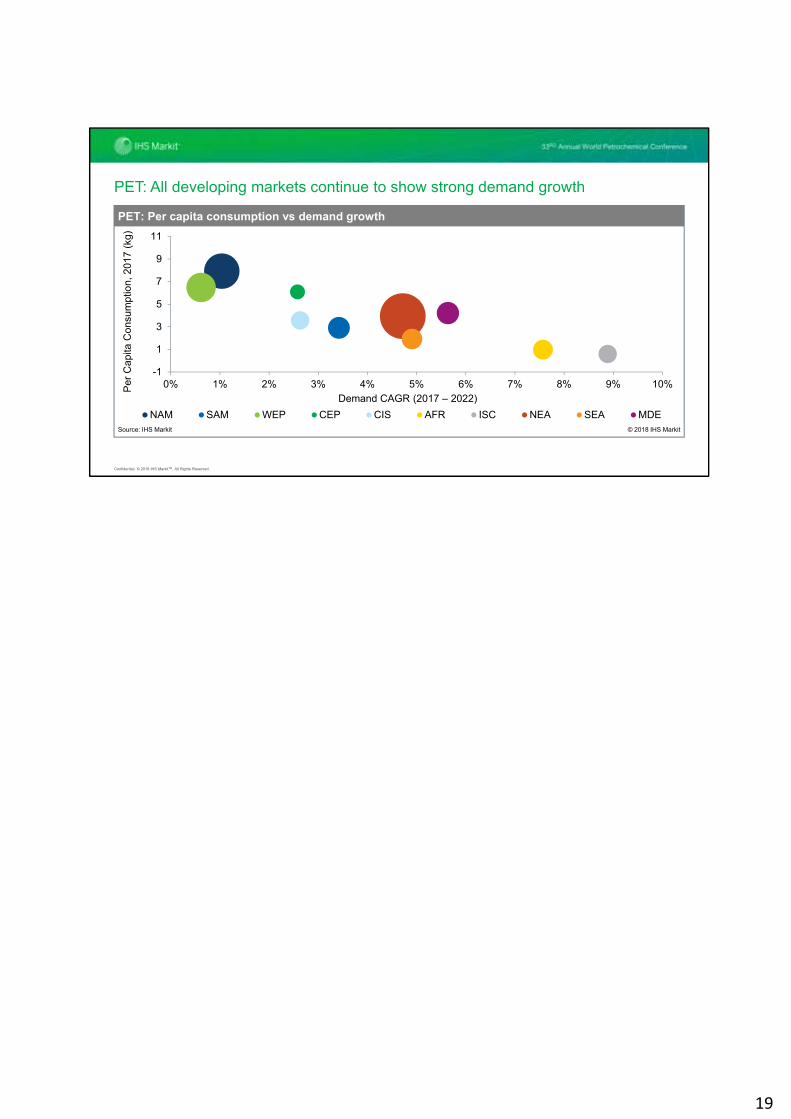
PET: All developing markets continue to show strong demand growth
-1
1
3
5
7
9
11
0% 1% 2% 3% 4% 5% 6% 7% 8% 9% 10%
NAM SAM WEP CEP CIS AFR ISC NEA SEA MDE
PET: Per capita consumption vs demand growth
Source: IHS Markit
Demand CAGR (2017 – 2022)
Per
Cap
ita C
onsu
mpt
ion,
201
7 (k
g)
© 2018 IHS Markit
19
Confidential. © 2018 IHS MarkitTM. All Rights Reserved.
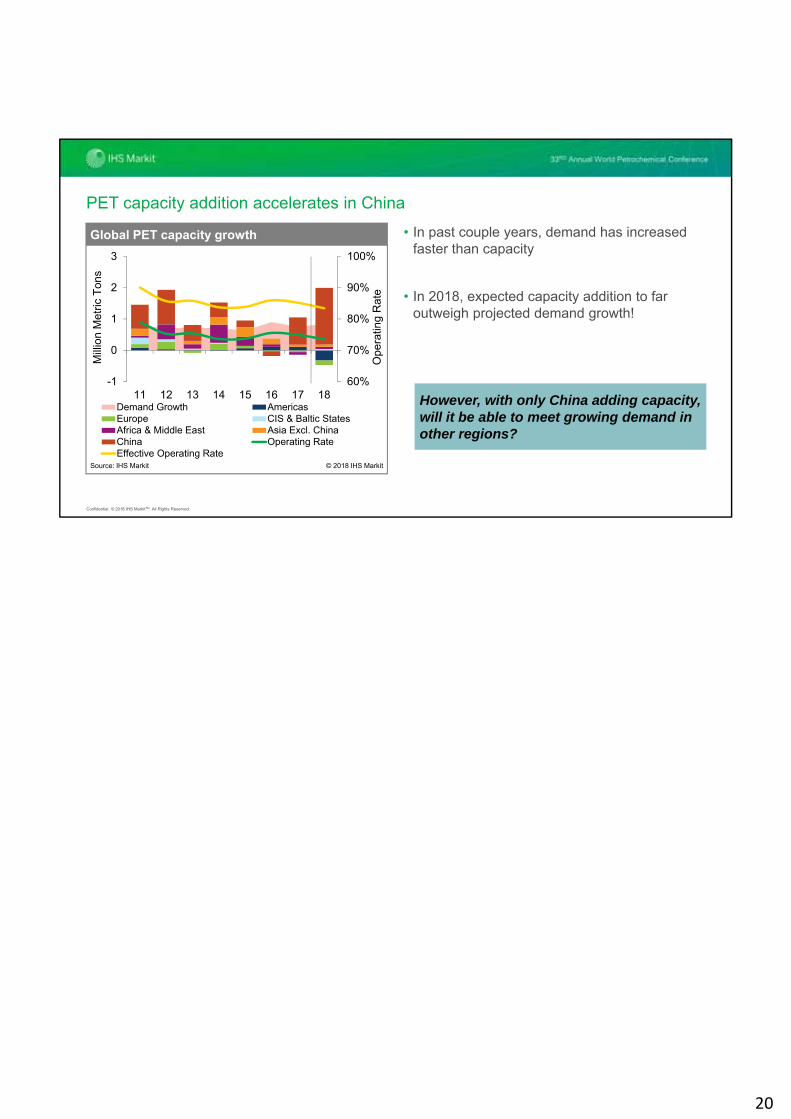
60%
70%
80%
90%
100%
-1
0
1
2
3
11 12 13 14 15 16 17 18Demand Growth AmericasEurope CIS & Baltic StatesAfrica & Middle East Asia Excl. ChinaChina Operating RateEffective Operating Rate
Global PET capacity growth
Mill
ion
Met
ric T
ons
Ope
ratin
g R
ate
Source: IHS Markit © 2018 IHS Markit
• In past couple years, demand has increased faster than capacity
• In 2018, expected capacity addition to far outweigh projected demand growth!
PET capacity addition accelerates in China
However, with only China adding capacity, will it be able to meet growing demand in other regions?
20
Confidential. © 2018 IHS MarkitTM. All Rights Reserved.
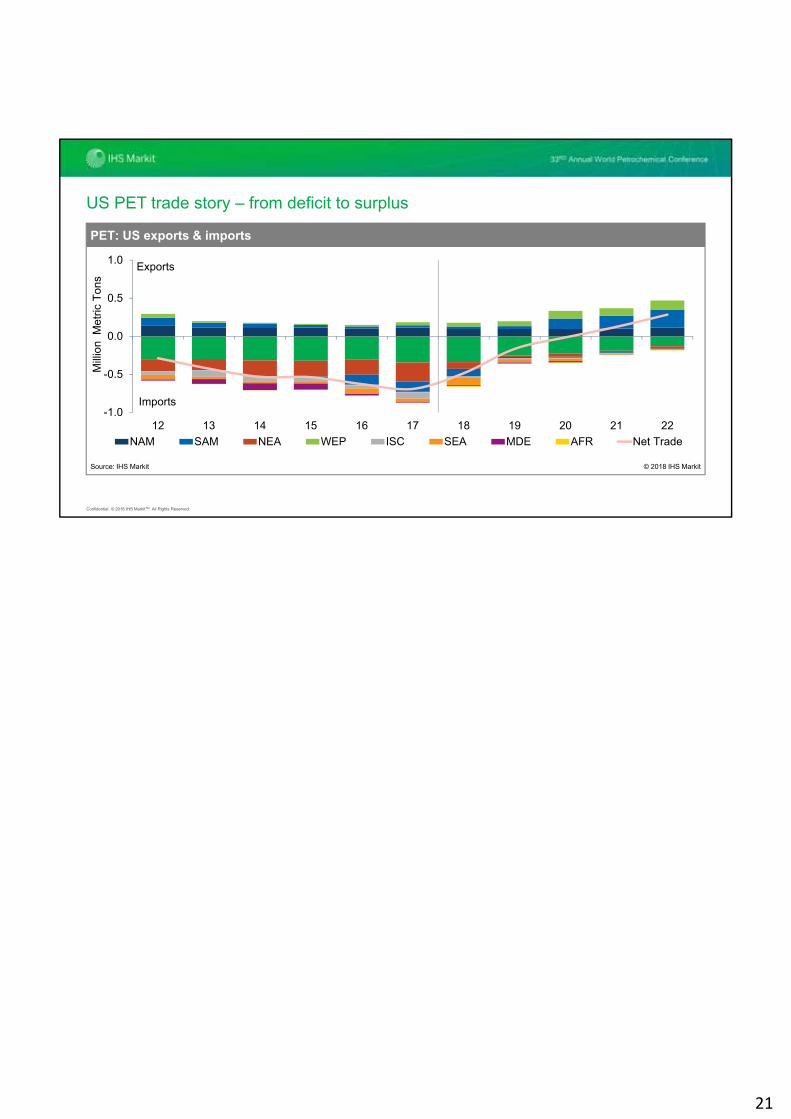
US PET trade story – from deficit to surplus
-1.0
-0.5
0.0
0.5
1.0
12 13 14 15 16 17 18 19 20 21 22
NAM SAM NEA WEP ISC SEA MDE AFR Net Trade
PET: US exports & imports
Mill
ion
Met
ric T
ons
Source: IHS Markit © 2018 IHS Markit
Imports
Exports
21
Confidential. © 2018 IHS MarkitTM. All Rights Reserved.
Polyester fibersBroad-based economic growth leads to revival in fibers demand
Credit: Shutterstock
22
Confidential. © 2018 IHS MarkitTM. All Rights Reserved.
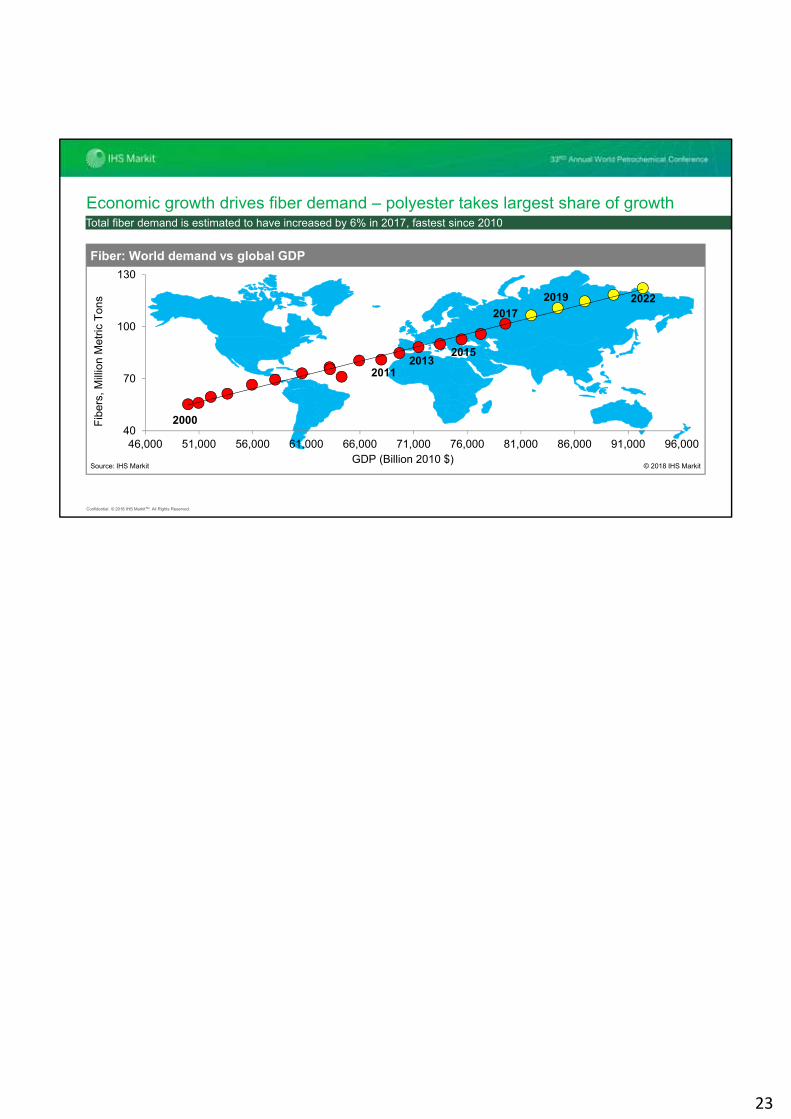
40
70
100
130
46,000 51,000 56,000 61,000 66,000 71,000 76,000 81,000 86,000 91,000 96,000
20112013
2017
2015
Total Natural and Man-Made Fibers
Source: IHS Markit © 2018 IHS MarkitGDP (Billion 2010 $)
Fib
ers,
Mill
ion
Met
ric T
ons 2019
2000
Fiber: World demand vs global GDP
2022
Economic growth drives fiber demand – polyester takes largest share of growthTotal fiber demand is estimated to have increased by 6% in 2017, fastest since 2010
23

Confidential. © 2018 IHS MarkitTM. All Rights Reserved.
Global Fibers mix – dominated by polyester & cotton
Polyester49%
Cotton26%
Olefin10%
Cellulosic6%
Nylon4%
Acrylic2%
Other Synthetic Fibers1%
Wool, Silk & Linen2%
Polyester
Cotton
Olefin
Cellulosic
Nylon
Acrylic
Other Synthetic Fibers
Wool, Silk & Linen
World fiber demand in 2017
Source: IHS Markit © 2018 IHS Markit
2017 total fiber demand: 101.7 Million Metric Tons
24
Confidential. © 2018 IHS MarkitTM. All Rights Reserved.
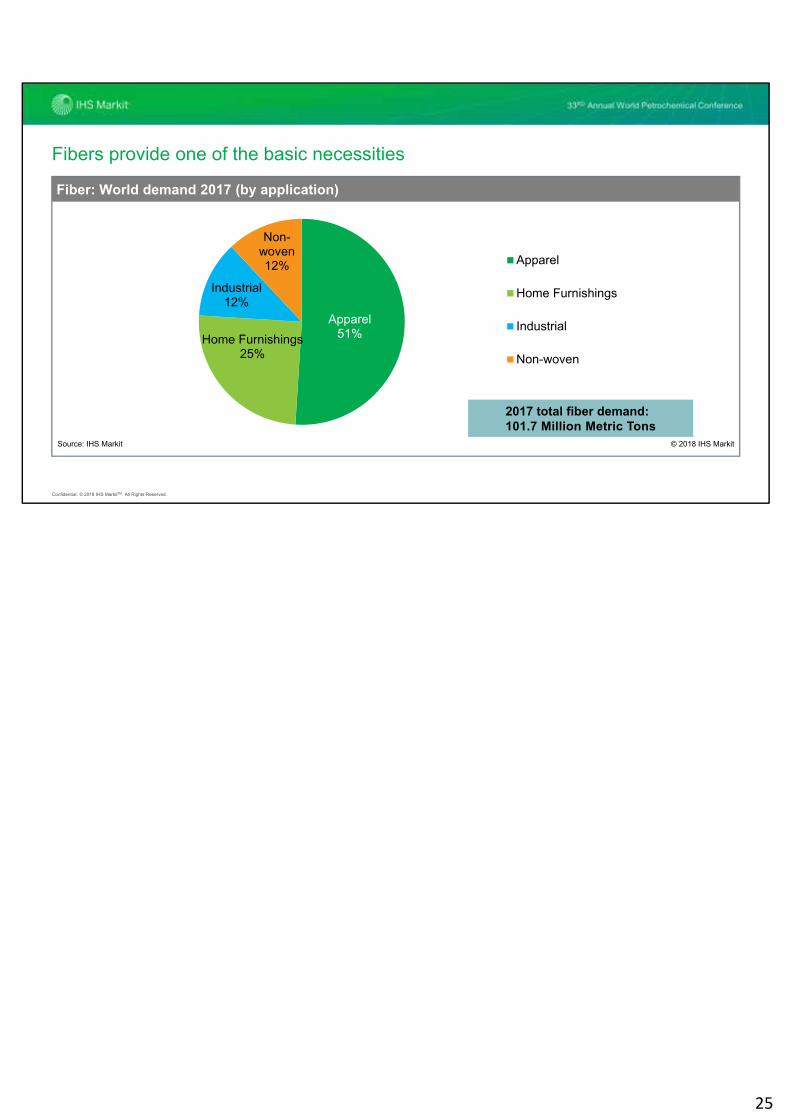
Fibers provide one of the basic necessities
2017 total fiber demand: 101.7 Million Metric Tons
Apparel51%Home Furnishings
25%
Industrial12%
Non-woven12% Apparel
Home Furnishings
Industrial
Non-woven
Fiber: World demand 2017 (by application)
Source: IHS Markit © 2018 IHS Markit
25

Confidential. © 2018 IHS MarkitTM. All Rights Reserved.
Europe MDE/AFRN. America S. AmericaCIS & Baltics ChinaNon-China Asia Southeast Asia
World: Total Polyester Fiber Demand (2017)
Source: IHS Markit © 2018 IHS Markit
Polyester fibers demand…heavily skewed towards China
• In 2017, China alone accounts for
• 66% of global demand
• 71% of global production
• up from a 25% share in the year 2000
• In total, Asia accounts for 86% of global demand.
• Lower labor costs initially attracted investments in the textile sector in Asia.
• Fast developing economies, rapid urbanization and strong growth in disposable income is now sustaining the growth in regional textile industry.
2017 demand: 49.8 Million Metric Tons
26
Confidential. © 2018 IHS MarkitTM. All Rights Reserved.
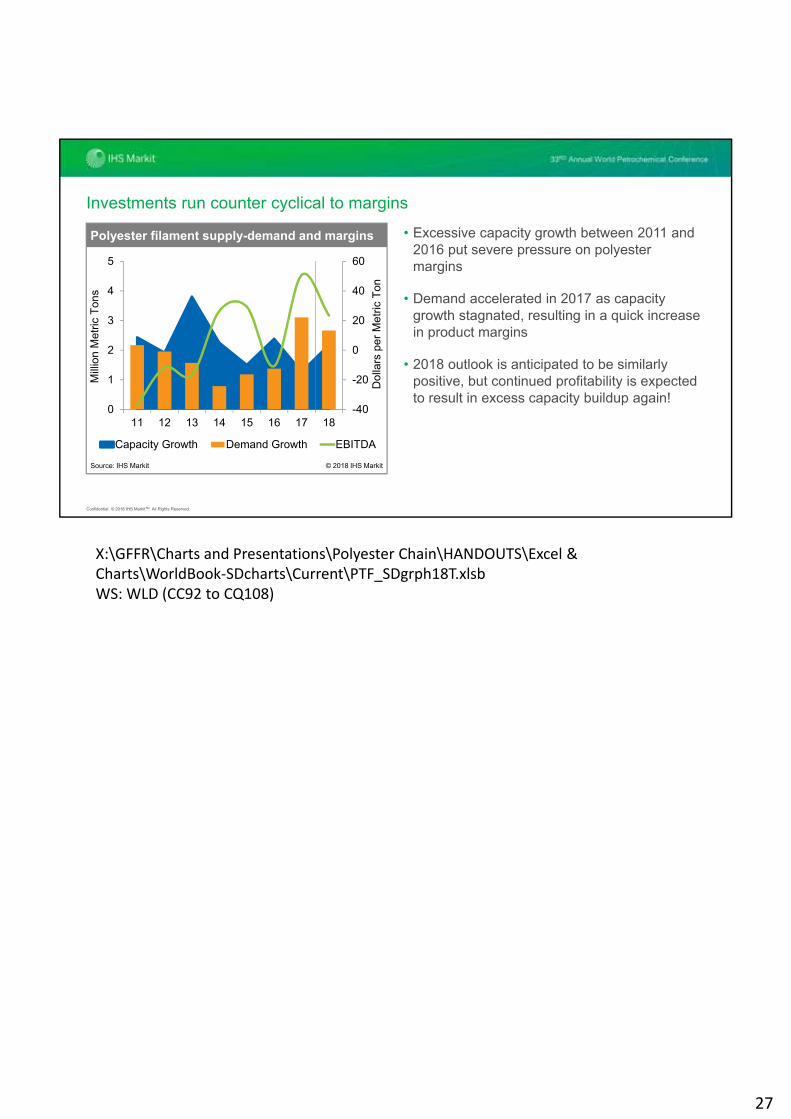
Investments run counter cyclical to margins
• Excessive capacity growth between 2011 and 2016 put severe pressure on polyester margins
• Demand accelerated in 2017 as capacity growth stagnated, resulting in a quick increase in product margins
• 2018 outlook is anticipated to be similarly positive, but continued profitability is expected to result in excess capacity buildup again!
-40
-20
0
20
40
60
0
1
2
3
4
5
11 12 13 14 15 16 17 18
Capacity Growth Demand Growth EBITDA
Mill
ion
Met
ric T
ons
Polyester filament supply-demand and margins
Source: IHS Markit © 2018 IHS Markit
Dol
lars
per
Met
ric T
on
X:\GFFR\Charts and Presentations\Polyester Chain\HANDOUTS\Excel & Charts\WorldBook‐SDcharts\Current\PTF_SDgrph18T.xlsbWS: WLD (CC92 to CQ108)
27
Confidential. © 2018 IHS MarkitTM. All Rights Reserved.
0
20
40
60
80
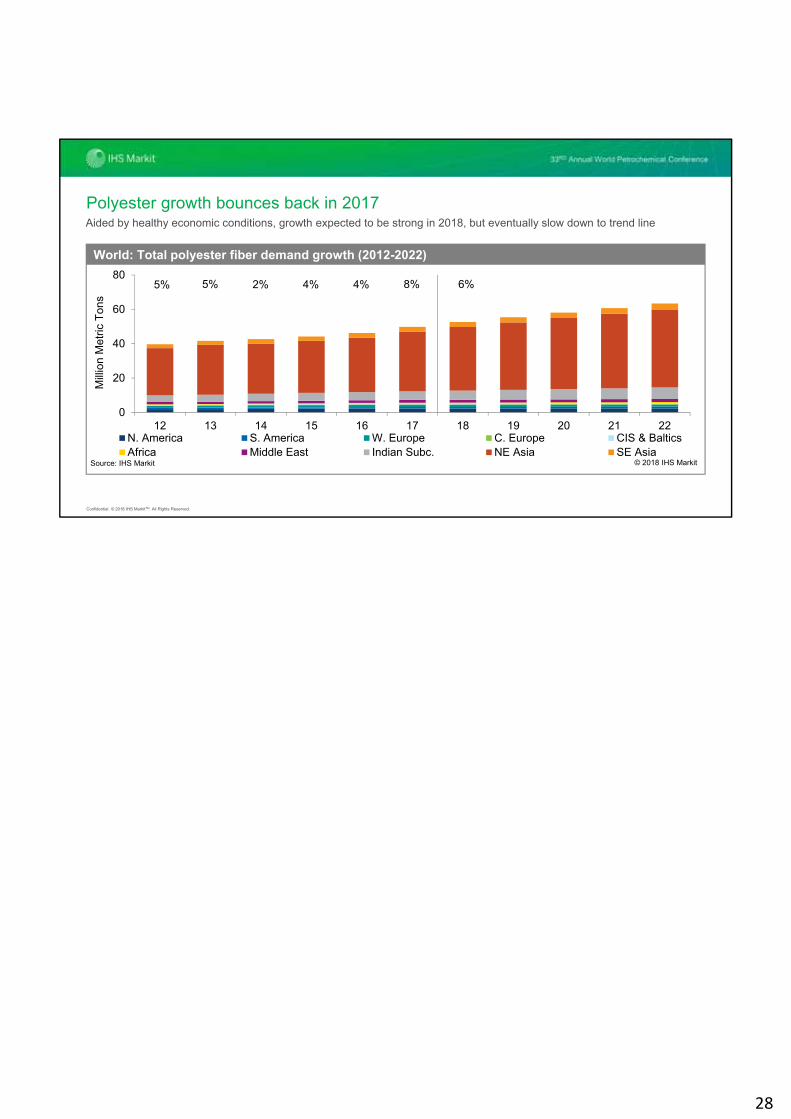
12 13 14 15 16 17 18 19 20 21 22N. America S. America W. Europe C. Europe CIS & BalticsAfrica Middle East Indian Subc. NE Asia SE Asia
Mill
ion
Met
ric T
ons
World: Total polyester fiber demand growth (2012-2022)
Source: IHS Markit © 2018 IHS Markit
5% 4% 4% 8% 6%5% 2%
Polyester growth bounces back in 2017Aided by healthy economic conditions, growth expected to be strong in 2018, but eventually slow down to trend line
28
Confidential. © 2018 IHS MarkitTM. All Rights Reserved.
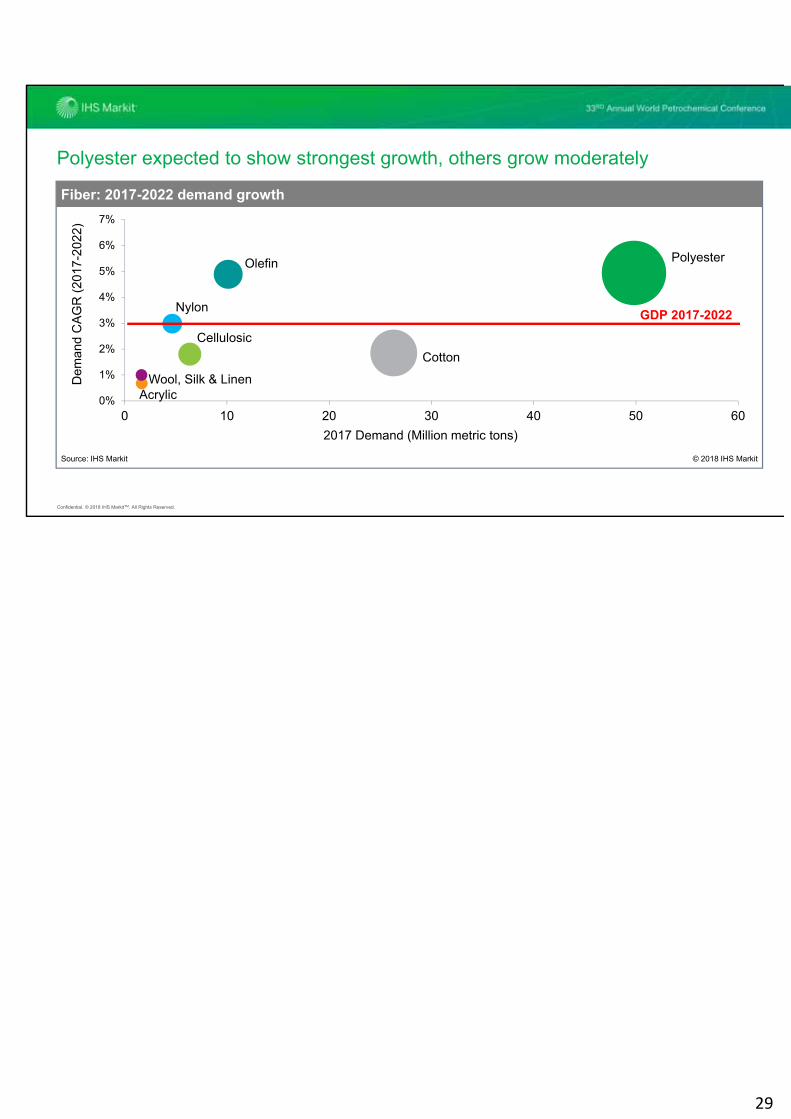
Polyester expected to show strongest growth, others grow moderately
Cotton
Polyester
Nylon
Olefin
Cellulosic
AcrylicWool, Silk & Linen
0%
1%
2%
3%
4%
5%
6%
7%
0 10 20 30 40 50 60
Fiber: 2017-2022 demand growth
Source: IHS Markit
2017 Demand (Million metric tons)
Dem
and
CA
GR
(20
17-2
022)
© 2018 IHS Markit
GDP 2017-2022
29
Confidential. © 2018 IHS MarkitTM. All Rights Reserved.
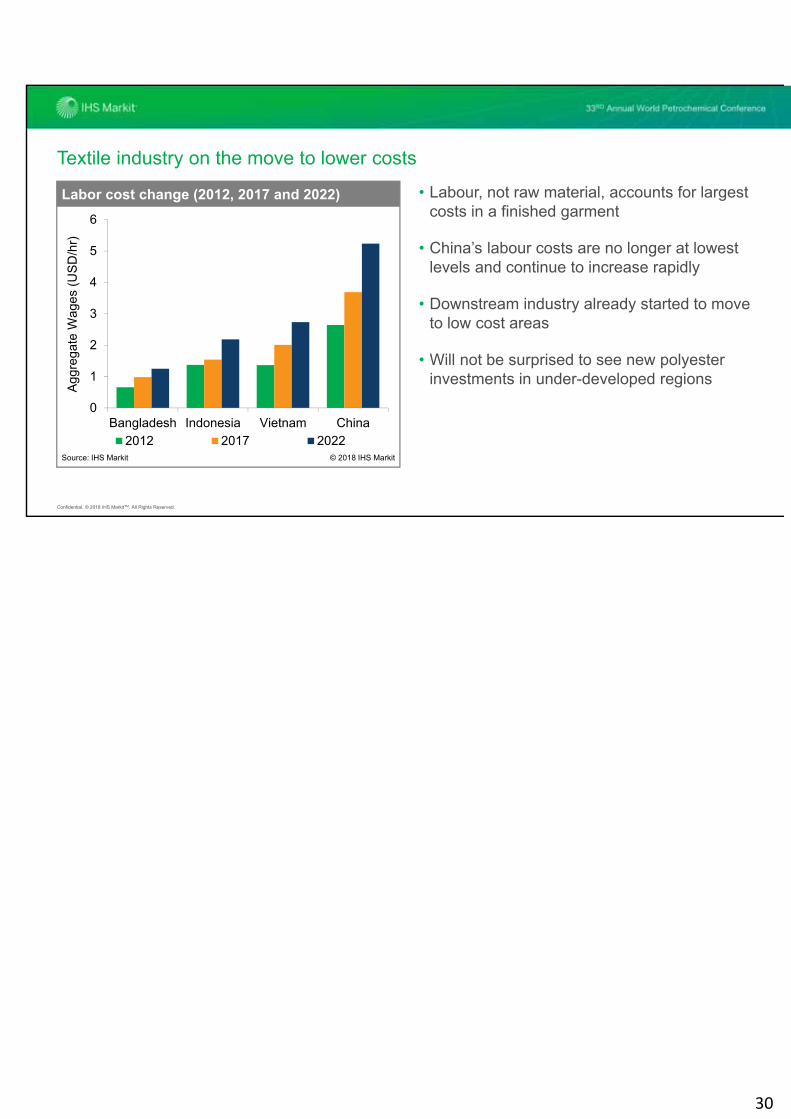
Textile industry on the move to lower costs
• Labour, not raw material, accounts for largest costs in a finished garment
• China’s labour costs are no longer at lowest levels and continue to increase rapidly
• Downstream industry already started to move to low cost areas
• Will not be surprised to see new polyester investments in under-developed regions
0
1
2
3
4
5
6
Bangladesh Indonesia Vietnam China
2012 2017 2022
Labor cost change (2012, 2017 and 2022)
Source: IHS Markit © 2018 IHS Markit
Agg
rega
teW
ages
(US
D/h
r)
30

Confidential. © 2018 IHS MarkitTM. All Rights Reserved.
Key takeaways
Demand growth expected to be strong in 2018
Fastest growing fiber for many years to come
Polyester fibersMarkets expected
to remain tight through 2018
Increasing brand owner focus on
recycling
PET
Sudden policy changes affect
short-term growth
Newer recycling avenues expected
in longer term
Recycling
31
Confidential. © 2018 IHS MarkitTM. All Rights Reserved.
Contact details
Ashish PujariExecutive Director \ Aromatics & Fibers
+65 6439 [email protected]
33

IHS Markit Customer [email protected]
Americas: +1 800 IHS CARE (+1 800 447 2273)
Europe, Middle East, and Africa: +44 (0) 1344 328 300
Asia and the Pacific Rim: +604 291 3600
DisclaimerThe information contained in this presentation is confidential. Any unauthorized use, disclosure, reproduction, or dissemination, in full or in part, in any media or by any means, without the prior written permission of IHS Markit Ltd. or any of its affiliates ("IHS Markit") is strictly prohibited. IHS Markit owns all IHS Markit logos and trade names contained in this presentation that are subject to license. Opinions, statements, estimates, and projections in this presentation (including other media) are solely those of the individual author(s) at the time of writing and do not necessarily reflect the opinions of IHS Markit. Neither IHS Markit nor the author(s) has any obligation to update this presentation in the event that any content, opinion, statement, estimate, or projection (collectively, "information") changes or subsequently becomes inaccurate. IHS Markit makes no warranty, expressed or implied, as to the accuracy, completeness, or timeliness of any information in this presentation, and shall not in any way be liable to any recipient for any inaccuracies or omissions. Without limiting the foregoing, IHS Markit shall have no liability whatsoever to any recipient, whether in contract, in tort (including negligence), under warranty, under statute or otherwise, in respect of any loss or damage suffered by any recipient as a result of or in connection with any information provided, or any course of action determined, by it or any third party, whether or not based on any information provided. The inclusion of a link to an external website by IHS Markit should not be understood to be an endorsement of that website or the site's owners (or their products/services). IHS Markit is not responsible for either the content or output of external websites. Copyright © 2017, IHS MarkitTM. All rights reserved and all intellectual property rights are retained by IHS Markit.
29