Embed Size (px)
Citation preview

Issue Number 136 January 2014
Catalogue of CCFEI China Report (Monthly)
Polyester
Nylon
Acrylic
Viscose
Spandex
Paraxylene MEG Fiber Grade PET Polyester Staple
Caprolactam
Nylon Filament
Propylene
Acrylic Fiber
Viscose Feedstock
Viscose Filament
MDI/PTMEG
PTA Bottle Grade PET Polyester Filament R-PET Fiber
Nylon Chips
Acrylonitrile
ABS
Viscose Staple
Spandex

China Chemical & Fiber Economic Information Network www.ccfei.net January 2014 [PX]
- 1 -
Paraxylene Contract Price (Yuan/ton or $/ton)
Month Change Price A month ago
Jan settled ↓475 10075 10550 RMB
Feb listed ↓350 9850 10200
Jan settled ↓20 1415 1435 USD
Feb listed ↓80-110 1380-1400 1470-1500
10000
11000
12000
13000
14000
15000
Aug Sep Oct Nov Dec Jan
1300
1400
1500
1600
1700
RMB-based USD-based
ExxonMobil, Idemitsu Kosan, JX Nippon Oil & Energy and S-oil released their February PX Asian contract
nominations at $1,400/ton, $1,380/ton, $1,380/ton and $1,390/ton respectively. January PX ACP was settled at
$1,415/ton.
Sinopec settled its January PX contract price at 10,075 yuan/ton, down by 475 yuan/ton from its December
settlement. Its contract nomination for February was placed at 9,850 yuan/ton, 350 yuan/ton lower from January.
Spot Average Price ($/ton) Week Date USD Week 1 1Jan -3Jan 1422.3
Week 2 6Jan-10Jan 1403.1
Week 3 13Jan-17Jan 1355.3
Week 4 20Jan-24Jan 1326.7
Week 5 27Jan-30Jan 1306.1
Monthly Ave. in Jan 1355.9
1200130014001500160017001800
9Aug 8Nov 30Jan
PX prices slumped in January.
Week 1: Jan ACP was agreed at $1,415/ton, which supported PX spot values to be firm during the week. Feb cargoes were quoted at $1,450/ton CFR China, but buying was thin. Forward cargoes enjoyed a premium in price.
Week 2: Domestic PTA prices in China tumbled, which dragged down PX spot values. On 9 Feb, Feb cargoes were heard traded at $1,400/ton CFR China, while offers gradually softened to $1,380/ton later.
Week 3: PTA prices dropped continuously, while upstream support also weakened. Thus, the downslide of PX values accelerated. Feb cargo offers gradually moved down to $1,340/ton CFR China, while bids also fell to $1,320-1,330/ton. In the meantime, off-screen bids were even heard at $1,260/ton CFR China for March.
Week 4: As the Chinese market will soon welcome the Spring Festival, trading atmosphere cooled down then. During the week, PX spot prices gradually stabilized, with Feb cargoes at around $1,310-1,320/ton CFR China. Meanwhile, some domestic producers were heard to reduce the term volumes for next month.
Week 5: During the last few trading days ahead of the Spring Festival, PX spot market turned quiet. Nominations for Feb ACP were released one after another, but again no consensus was reached at last.
Monthly International PX Value Trend
Asia (CFR China, USD/ton) Europe (€/ton, FD) USA (cts/lb, DEL)
Dec Jan Feb Dec Jan Feb Dec Jan Feb
1,435 1,415 ↘ 1,055 — ↘ 70.00 69.75 ↘
In European market, PX contract price for January was not settled yet by the time of publication, with the
nomination at €1,067/ton.
In US market, January PX contract price was at 69.75 cts/lb, down 0.25 cents from December.
PX contract prices for February in the above two regions are expected to decrease in line with the Asian market.
$/T Y/T
$/T

China Chemical & Fiber Economic Information Network www.ccfei.net January 2014 [PX]
- 2 -
Statistics on PX Imports in China (kt, $/ton)
Nov 2013 Dec 2013 Jan-Dec 2013 Jan-Dec 2012 Origin
Imp. Vol. Ave. Val. Imp. Vol. Ave. Val. Imp. Vol. Ave. Val. Imp. Vol. Ave. Val.
S. Korea 237.7 1463 272.6 1415 2805.1 1522 1902.1 1516
Taiwan 183.2 1455 103.7 1445 1625.8 1522 572 1552
Japan 187.5 1441 174.3 1408 2167.9 1506 1775.8 1515
Indonesia 0 0 44.6 1409 98.6 1475 22.2 1522
Thailand 58.6 1494 54.8 1440 63.3 1546 411.4 1509
Others 241.2 1492 187.7 1420 2350.5 1531 1602.6 1514
Total 849.6 1462 782.9 1419 9047.9 1520 6286.1 1520
According to China Customs, in December 2013, China imported 782.9 kt of PX, down by 66.7 kt month on month, at an average price of $1,419/ton, down by $43/ton on month.
Domestic enterprises mainly import contract goods. South Korea, Japan and Chinese Taiwan are the three major
sources for PX imports into China mainland in December, with volumes at 272.6 kt (up 34.9 kt), 174.3 kt (down 13.2 kt) and 103.7 kt (down 79.5 kt) respectively, accounting for 34.82%, 22.26% and 13.25%, and the combined import volume from the above three origins accounts for 70.33% of the total. Import volumes from Netherlands, Thailand, the US, Malaysia, Kuwait, Oman, and Singapore remained at high levels.
The combined import volume in Jan-Dec 2013 amounts to 9,047.9 kt, up 2,761.8 kt from 6,286.1 kt in Jan-Dec
2012. The average import price for this period is at $1,520/ton, flat to the same period in 2012.
Operation Status of PX Producers
Plant Operation
1. Gulei Petrochemical shut down an 800kt/yr PX unit in early Jan, while its another set of 800kt/yr PX unit that was shut down in Nov 2013 restarted in mid Jan.
2. Qingdao Lidong Chemical’s 700kt/yr PX unit, which was shut down from late Oct 2013, remained in outage during the month.
In China Nov Dec Jan Feb est.
Run rates 73.7% 71.9% 81.7% ↗
Output (kt) 670 707 753 ↗
According to CCFEI’s statistics, China’s PTA production in Dec is about 2,275 kt, which reflects a demand of 1,524 kt for PX. Based on operating rates of Chinese PX enterprises, PX production in Dec is assessed at around 707 kt. The total PX import volume in Dec is 783 kt, while total PX export volume is 15 kt. According to these data, the total supply in China in Dec is 1,475 kt, slightly below the demand.
CCFEI Comment
Feedstock: Crude oil was ranging bound at the moment, and is likely to drop further later. However, as the margin for PX has been very slim, the low oil prices may be the life-saving straw for PX producers during the downslide.
PX supply: In Feb, Pengzhou Petrochemical plans to start up PX unit, while Lidong’s unit is also anticipated to
restart, which will increase PX supply. On the other hand, as some PTA producers may strengthen their turnarounds in Feb, it is worth noting the possible pressure on spot market following the reduction in term volume supply.
Downstream demand: It was surprising that PTA operation rate kept at high levels in Jan. So, after the entry into
Feb, PTA operation rate may drop obviously, and the overall level is estimated to decrease to 80% or below. To sum up, PX spot prices trended towards $1,300/ton mark after breaching $1,400/ton, while the failure of Feb
ACP negotiation indicated that it was just a matter of time to penetrate the resistant level. The increase of PX supply is also a major issue facing market participants. However, since the cost support is still in place, the downside potentials of PX prices will be relatively limited, in case of no further decline in oil prices. It is expected that PX market will range bound in weakness in February.
China Chemical & Fiber Economic Information Network www.ccfei.net January 2014 [PTA]
- 3 -
PTA Contract Price (yuan/ton, $/ton)
Change Range Prev. Month
Settled for Jan. ↓415-465 7170-7220 7635 RMB
Nominated for Feb. ↓100-200 7200-7300 7300-7500
Implemented for Jan. → - - USD
Nominated for Feb. → - -
750077007900810083008500
Aug Sep Oct Nov Dec
RMB
January PTA contract settlements from domestic major producers were varied, with Sinopec and Hengli at 7,170 yuan/ton, BP at 7,210 yuan/ton and Yisheng at 7,220 yuan/ton. Both Sinopec and Hengli released their contract nominations for February 2014 at 7,200 yuan/ton, and BP Zhuhai issued number at 7,300 yuan/ton.
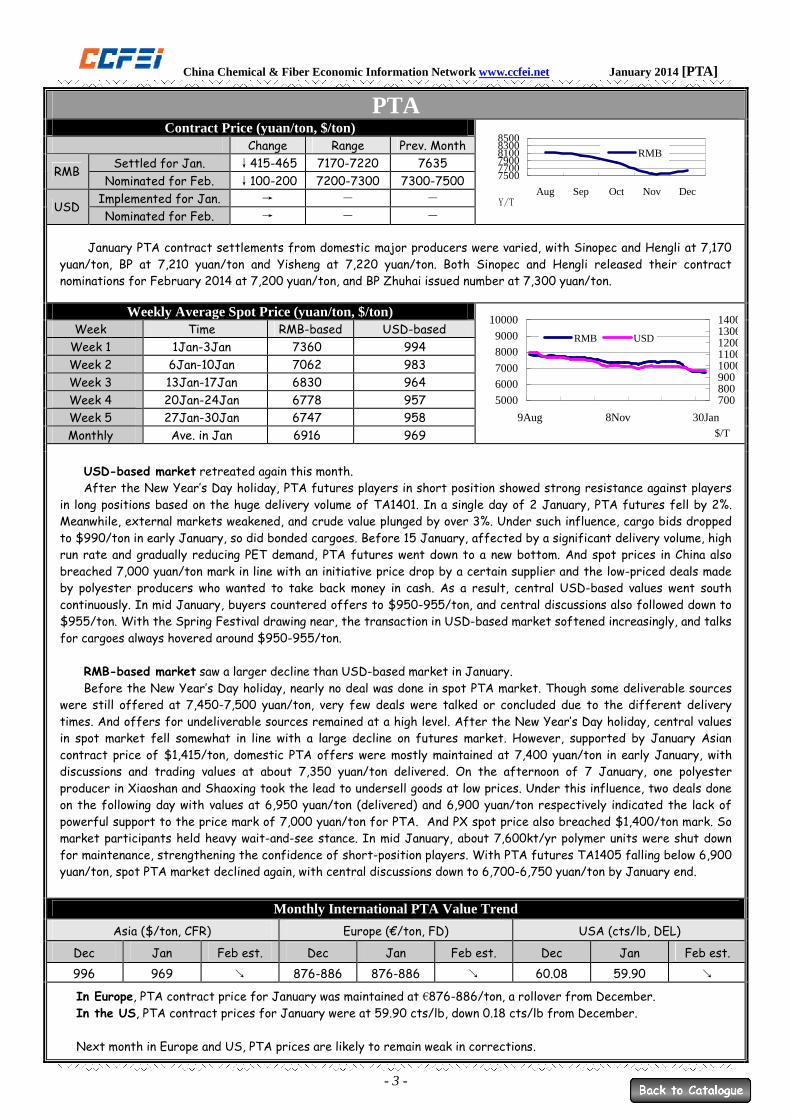
Weekly Average Spot Price (yuan/ton, $/ton) Week Time RMB-based USD-based
Week 1 1Jan-3Jan 7360 994
Week 2 6Jan-10Jan 7062 983
Week 3 13Jan-17Jan 6830 964
Week 4 20Jan-24Jan 6778 957
Week 5 27Jan-30Jan 6747 958
Monthly Ave. in Jan 6916 969
5000
6000
7000
8000
9000
10000
9Aug 8Nov 30Jan
70080090010001100120013001400
RMB USD
USD-based market retreated again this month. After the New Year’s Day holiday, PTA futures players in short position showed strong resistance against players
in long positions based on the huge delivery volume of TA1401. In a single day of 2 January, PTA futures fell by 2%. Meanwhile, external markets weakened, and crude value plunged by over 3%. Under such influence, cargo bids dropped to $990/ton in early January, so did bonded cargoes. Before 15 January, affected by a significant delivery volume, high run rate and gradually reducing PET demand, PTA futures went down to a new bottom. And spot prices in China also breached 7,000 yuan/ton mark in line with an initiative price drop by a certain supplier and the low-priced deals made by polyester producers who wanted to take back money in cash. As a result, central USD-based values went south continuously. In mid January, buyers countered offers to $950-955/ton, and central discussions also followed down to $955/ton. With the Spring Festival drawing near, the transaction in USD-based market softened increasingly, and talks for cargoes always hovered around $950-955/ton.
RMB-based market saw a larger decline than USD-based market in January. Before the New Year’s Day holiday, nearly no deal was done in spot PTA market. Though some deliverable sources
were still offered at 7,450-7,500 yuan/ton, very few deals were talked or concluded due to the different delivery times. And offers for undeliverable sources remained at a high level. After the New Year’s Day holiday, central values in spot market fell somewhat in line with a large decline on futures market. However, supported by January Asian contract price of $1,415/ton, domestic PTA offers were mostly maintained at 7,400 yuan/ton in early January, with discussions and trading values at about 7,350 yuan/ton delivered. On the afternoon of 7 January, one polyester producer in Xiaoshan and Shaoxing took the lead to undersell goods at low prices. Under this influence, two deals done on the following day with values at 6,950 yuan/ton (delivered) and 6,900 yuan/ton respectively indicated the lack of powerful support to the price mark of 7,000 yuan/ton for PTA. And PX spot price also breached $1,400/ton mark. So market participants held heavy wait-and-see stance. In mid January, about 7,600kt/yr polymer units were shut down for maintenance, strengthening the confidence of short-position players. With PTA futures TA1405 falling below 6,900 yuan/ton, spot PTA market declined again, with central discussions down to 6,700-6,750 yuan/ton by January end.
Monthly International PTA Value Trend
Asia ($/ton, CFR) Europe (€/ton, FD) USA (cts/lb, DEL)
Dec Jan Feb est. Dec Jan Feb est. Dec Jan Feb est.
996 969 ↘ 876-886 876-886 ↘ 60.08 59.90 ↘
In Europe, PTA contract price for January was maintained at €876-886/ton, a rollover from December. In the US, PTA contract prices for January were at 59.90 cts/lb, down 0.18 cts/lb from December. Next month in Europe and US, PTA prices are likely to remain weak in corrections.
Y/T
$/T

China Chemical & Fiber Economic Information Network www.ccfei.net January 2014 [PTA]
- 4-
Statistics on PTA Imports in China (kt, $/ton) Nov 2013 Dec 2013 Jan-Dec 2013 Jan-Dec 2012
Origin Imp. Vol. Ave. Val. Imp. Vol. Ave. Val. Imp. Vol. Ave. Val. Imp. Vol. Ave. Val.
S. Korea 92.1 1008 104.4 991 1211.1 1087 1580.7 1093 Taiwan 11.3 1030 10.3 1051 415.7 1117 1781 1102
Japan 11.1 1022 9.1 996 104.3 1103 86.5 1136 Thailand 13.4 1014 16.1 993 234 1095 552.6 1099 Others 31.8 1023 33.8 1051 403.4 1116 189.1 1107 Total 146.3 1018 157.6 1000 2134.5 1097 4189.9 1099
QTA/EPTA 38.6 983 32 958 607.6 1066 1175.2 1070 According to Customs’ statistics, China’s import volume for terephthalic acid in December 2013 totals 189.6 kt, up
by 4.6 kt from Nov 2013. The average price for the imports declared to the Customs is at $993/ton, down by $18/ton from previous month. China’s import volume for PTA (tariff number: 29173611) in Dec totals 157.6 kt, up by 11.3 kt from last month. The average price for imported PTA is at $1,000/ton, down by $18/ton month on month. China’s import volume for QTA/EPTA (tariff number: 29173619) in Dec totals 32.0 kt, down by 6.6 kt from one month earlier. The average price for imported QTA/EPTA is at $958/ton, down by $25/ton month on month.
By import volume into China, the first three countries and regions of the month are South Korea, Malaysia and Thailand. The volume from South Korea is 143.8 kt (including 104.4 tons of PTA), occupying 75.84% of the total. The volumes from Malaysia and Thailand are 16.6 kt and 16.3 kt (with PTA at 16.6 kt and 16.1 kt), respectively accounting for 8.67% and 8.49% of the total. The import volume from Taiwan retreated to the fourth position, at 103.1 kt. Average cost of PTA stocks is at 7,702 yuan/ton in Dec (by RMB/USD rate of 1:6.12), down 137 yuan/ton on month.
Inventory Status and Operation of Chinese PTA Producers in China On 4 Jan, BP Zhuhai restarted its 1,100kt/yr PTA unit that started turnaround on 15 Dec. Its
650kt/yr PTA unit was closed for turnaround on 23 Jan., with restart time initially scheduled in Mar. In early Jan, Pengwei Petrochemical started another round of maintenance shutdown for its
900kt/yr PTA unit, with the restart time pending. Yangzi Petrochemical closed 350kt/yr No. 2 PTA unit for turnaround, with restart time pending on
15 Jan. Its 350kt/yr No. 1 unit has yet to resume operation since starting maintenance from Feb 2013. On 25 Jan, Yuandong Petrochemical lowered the run rate for 1,400kt/yr No. 4 PTA unit to 50%. On 27 Jan, Mitsubishi Ningbo shut down 600kt/yr PTA unit for maintenance, with restart time
initially scheduled on 10 Feb.
Plant News
Units still down: Yuandong PC’s 600 kt/yr No. 2 & 600 kt/yr No.3 PTA units; Liaoyang PC’s 270kt/yr & 530 kt/yr PTA units; Yangzi PC’s 350 kt/yr unit; Yisheng Ningbo’s 650kt/yr No. 2 unit; moreover, Hengli cut production by 10-20%.
Nov Dec Jan Feb est.
Operating rate 81.8% 80.3% 85.1% ↘
Output (kt) 2240 2275 2409 ↘
Inventory Normal Normal High ↘ According to CCFEI estimate, China's outputs of polyester filament, staple and bottle-grade chips in December
amount to about 1,917 kt, 342 kt and 411 kt respectively. Thus, the effective production of PET melt is estimated at 2,670 kt, which means the effective demand for PTA is at 2,296 kt. Import and export volumes of PTA in December amount to 190 kt and 15 kt respectively. Domestic PTA production is 2,275 kt based on CCFEI statistics. PTA supply amounts to 2,450kt, which surpasses demand.
CCFEI Comment Feedstock: PX price plummeted towards $1,300/ton mark without pressure in January after breaching $1,400/ton,
and the failed settlement of February Asian contract price for PX indicates that dropping below this resistance level is just a question of time. Moreover, the increase on PX supplies is also around the corner since it has come into the year 2014. However, as PX market still gains cost support at present, and PX price will dip by a limited margin provided that crude oil value does not go down more quickly in the future. Supply: It’s astonishing that PTA run rate remained high in January. In February, some suppliers allocated term supplies of feedstocks, so PTA run rate is expected to plunge sharply, assessed at 80% or slightly lower. Demand: The accumulated polyester capacities closed before the Spring Festival have amounted to 7,600 kt/yr. Some units will resume operation in succession after the holiday, while about half of all units will be in outage. Of course, polyester producers showed limited interest to store up raw materials before the holiday. The possibility should not be ruled out that some rigid demand to replenish stocks at low prices will appear.
To sum up, the downward channel for PTA has yet to be closed completely in view of rising social inventories and the existing contradiction between supply and demand. All in all, PTA price has plummeted too much, and the sentiment will probably get corrections. Based on the expectation for a good start after the Spring Festival, the market will start with a bullish tone after the holiday. However, the overall trend will change little, and PTA market is very likely to fluctuate in a narrow range in February.
China Chemical & Fiber Economic Information Network www.ccfei.net January 2014 [MEG]
- 5 -
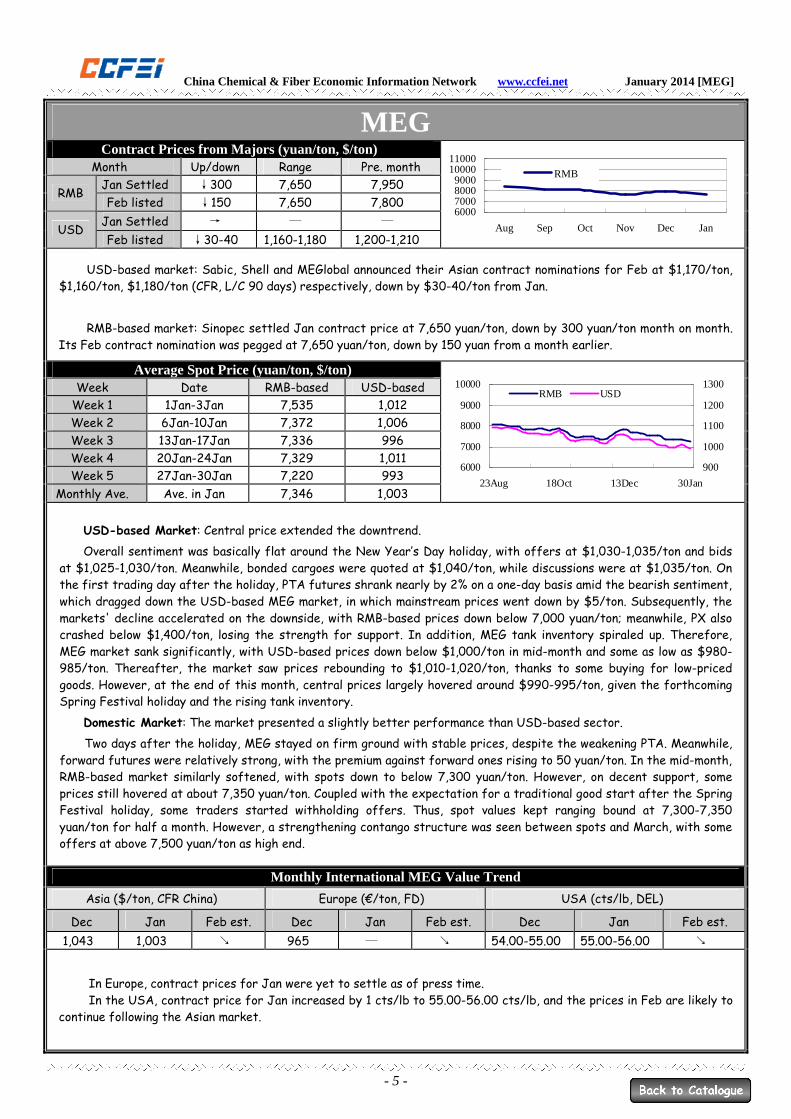
MEG Contract Prices from Majors (yuan/ton, $/ton)
Month Up/down Range Pre. month
Jan Settled ↓300 7,650 7,950 RMB
Feb listed ↓150 7,650 7,800
Jan Settled → — — USD
Feb listed ↓30-40 1,160-1,180 1,200-1,210
6000700080009000
1000011000
Aug Sep Oct Nov Dec Jan
RMB
USD-based market: Sabic, Shell and MEGlobal announced their Asian contract nominations for Feb at $1,170/ton, $1,160/ton, $1,180/ton (CFR, L/C 90 days) respectively, down by $30-40/ton from Jan.
RMB-based market: Sinopec settled Jan contract price at 7,650 yuan/ton, down by 300 yuan/ton month on month. Its Feb contract nomination was pegged at 7,650 yuan/ton, down by 150 yuan from a month earlier.
Average Spot Price (yuan/ton, $/ton) Week Date RMB-based USD-based
Week 1 1Jan-3Jan 7,535 1,012
Week 2 6Jan-10Jan 7,372 1,006
Week 3 13Jan-17Jan 7,336 996
Week 4 20Jan-24Jan 7,329 1,011
Week 5 27Jan-30Jan 7,220 993
Monthly Ave. Ave. in Jan 7,346 1,003
6000
7000
8000
9000
10000
23Aug 18Oct 13Dec 30Jan
900
1000
1100
1200
1300RMB USD
USD-based Market: Central price extended the downtrend.
Overall sentiment was basically flat around the New Year’s Day holiday, with offers at $1,030-1,035/ton and bids at $1,025-1,030/ton. Meanwhile, bonded cargoes were quoted at $1,040/ton, while discussions were at $1,035/ton. On the first trading day after the holiday, PTA futures shrank nearly by 2% on a one-day basis amid the bearish sentiment, which dragged down the USD-based MEG market, in which mainstream prices went down by $5/ton. Subsequently, the markets' decline accelerated on the downside, with RMB-based prices down below 7,000 yuan/ton; meanwhile, PX also crashed below $1,400/ton, losing the strength for support. In addition, MEG tank inventory spiraled up. Therefore, MEG market sank significantly, with USD-based prices down below $1,000/ton in mid-month and some as low as $980-985/ton. Thereafter, the market saw prices rebounding to $1,010-1,020/ton, thanks to some buying for low-priced goods. However, at the end of this month, central prices largely hovered around $990-995/ton, given the forthcoming Spring Festival holiday and the rising tank inventory.
Domestic Market: The market presented a slightly better performance than USD-based sector.
Two days after the holiday, MEG stayed on firm ground with stable prices, despite the weakening PTA. Meanwhile, forward futures were relatively strong, with the premium against forward ones rising to 50 yuan/ton. In the mid-month, RMB-based market similarly softened, with spots down to below 7,300 yuan/ton. However, on decent support, some prices still hovered at about 7,350 yuan/ton. Coupled with the expectation for a traditional good start after the Spring Festival holiday, some traders started withholding offers. Thus, spot values kept ranging bound at 7,300-7,350 yuan/ton for half a month. However, a strengthening contango structure was seen between spots and March, with some offers at above 7,500 yuan/ton as high end.
Monthly International MEG Value Trend Asia ($/ton, CFR China) Europe (€/ton, FD) USA (cts/lb, DEL)
Dec Jan Feb est. Dec Jan Feb est. Dec Jan Feb est.
1,043 1,003 ↘ 965 — ↘ 54.00-55.00 55.00-56.00 ↘
In Europe, contract prices for Jan were yet to settle as of press time. In the USA, contract price for Jan increased by 1 cts/lb to 55.00-56.00 cts/lb, and the prices in Feb are likely to
continue following the Asian market.

China Chemical & Fiber Economic Information Network www.ccfei.net January 2014 [MEG]
- 6 -
Statistics on MEG Imports in China (kt, $/ton) Nov 2013 Dec 2013 Jan-Dec 2013 Jan-Dec 2012
Origin Imp. Vol. Imp. Val. Imp. Vol. Imp. Val. Imp. Vol. Imp. Val. Imp. Vol. Imp. Val.
Saudi Arabia 316.4 1,071 310.4 1,042 3,782.9 1,054 3,691.9 1,018
Chinese Taiwan 113.8 1,045 97.8 1,032 1,251.0 1,072 1,175.0 1,037
South Korea 41.0 1,046 32.2 1,035 473.4 1,070 447.2 1,036
Canada 49.3 1,044 52.8 1,020 705.2 1,046 564.7 1,021
Singapore 57.4 1,049 35.9 1,037 592.0 1,052 445.5 1,019
Others 144.8 1,051 149.5 1,038 2,028.6 1,062 1,616.0 1,026
Total/Ave. Val. 665.3 1,059 642.7 1,037 8,241.1 1,058 7,940.3 1,026
According to statistics of China Customs, China’s MEG imports in December totalled 642.7 kt, down by 22.6 kt on month; and the average price was at $1,037/ton, down by $22/ton from November 2013.
In December, 583.8 kt of MEG was imported from other Asian countries or regions, down by 23.3 kt from November and accounting for 90.84% of the total. Hereinto, the volume from Saudi Arabia ranked the first at 310.4 kt, down 5 kt on month and taking up 48.3% of the total; Taiwan and Kuwait followed, with volumes at 97.8 kt and 44.5 kt respectively.
As for deep-sea cargoes, import volume from Canada increased by 3.5 kt month on month to 52.8 kt, taking up 8.22% of the total, and that from the US declined to 2 kt. The volume from European countries was limited.
In December 2013, the average cost for MEG stock was around 7,954 yuan/ton (1 USD = 6.12 RMB), down by 166 yuan/ton from the average cost in November.
Stock Level and Operation Status of MEG Producers 1. Ningbo Heyuan’s 500kt/yr MTO units was cut runs to 60% in December, and then gradually ramped up to 100% in January, on the back of softening methanol prices. 2. Influenced by the maintenance of upstream ethylene cracker, BASF-YPC’s 320kt/yr MEG unit had been reduced run rates to 50% since Jan5, and then was gradually raised runs to 100% from Jan 12.
Plant News
3. Other units in T/A: Liaoyang Petrochemical’s 200kt/yr unit, Yanshan Petrochemical’s 80kt/yr unit, units of Beijing Eastern Petrochemical, Puyang Yongjin and Hualu-Hengsheng’s 50kt/yr unit.
Domestic Nov Dec Jan Feb est.
Operating Rate 72.9% 72.3% 72.2% ↘
Production (kt) 293 305 309 ↘
Inventory High High High ↗
According to CCFEI, production of PFY, PSF and BGPET chips in December were at 1,917 kt, 342 kt and 411 kt respectively. Based on these, the total production of polyester melt that month reached 2,670 kt, reflecting an effective demand for MEG at around 895 kt. Import volume of MEG in December is 673 kt and export volume is 0.2 kt, while domestic MEG production in December is assessed at 305 kt. Based on above data, MEG supply totals 978 kt, indicating still large supply length (some surplus supplies are to meet demand from antifreeze sector).
CCFEI Comment Upstream: Crude oil market remained in corrections after the previous slump, but the likelihood of another fall in
the future still existed.
Supply: Tank inventory has surpassed 1 million tons by the end of January. In February, there will still be a large number of ships to unload cargos; thereby, the inventory may reach the high level of 1.2 million tons at a peak. Furthermore, Pengzhou Petrochemical’s MEG plant is planned to come on stream in the short term. Next month, the market may come under heavy supply pressure, which may lead to short tank space.
Demand: There was totally around 7,600 kt/yr polyester capacity down before the Spring Festival holiday. Although some units will successively resume operation after the holiday, nearly half of plants will remain idled due to the peak averting measures. Nevertheless, polyester producers may purchase low-prices goods as needed, given limited restocking activities for spots before the holiday.
To sum up, the post-holiday MEG market is possible to rebound, with the bullish expectation prevailing in the Chinese market. However, under the hefty pressure from tanks after the holiday, it still needs time to see the recovery in demand. Meanwhile, in mid to late February, the market may reach the bottom again.

China Chemical & Fiber Economic Information Network www.ccfei.net January 2014 [BGPET]
- 7 -
BGPET Chip Domestic Spot Price for Water Bottle Grade (yuan/ton)
Time Price On week
Week 1 2 Jan – 3 Jan 9463 ↓
Week 2 6 Jan – 10 Jan 9380 ↓
Week 3 13 Jan – 17 Jan 9170 ↓
Week 4 20 Jan – 24 Jan 9060 ↓
Week 5 26 Jan- 28 Jan 9025 ↓
Monthly Ave. in Jan 9220 ↓
6500
8000
9500
11000
12500
14000
19Jul 20Sep 29Nov 28Jan
USD-based Spot Price for Water Bottle Grade ($/ton)
Time Price On week
Week 1 2 Jan – 3 Jan 1315 →
Week 2 6 Jan – 10 Jan 1308 ↓
Week 3 13 Jan – 17 Jan 1295 ↓
Week 4 20 Jan – 24 Jan 1290 ↓
Week 5 26 Jan- 28 Jan 1290 →
Monthly Ave. in Jan 1300 ↓
Domestic BGPET chip prices fell by more than 400 yuan/ton during January.
In early month, offers for water bottle grade chips in eastern China were at 9,500-9,700 yuan/ton ex-works, while talks were at 9,450-9,500 yuan/ton. Then with crude oil showing weakness and PTA1405 softening, followed by a sharp fall upstream, domestic BGPET values began its downward movement by 25-100 yuan per day. By mid of the month, mainstream trading values in eastern China were at 9,100 yuan/ton ex-works, with low-end at around 9,000-9,050 yuan/ton, before retracing up to 9,100-9,150 yuan/ton soon. Prices stayed at that level for some time. However, later in the month with weakness in feedstock market persisting, buying interest subdued in spite of a surge of crude oil. Central prices in eastern China dipped further to 9,000-9,050 yuan/ton ex-works and remained there with market subdued ahead of Lunar New Year holidays. Discount of 50 yuan/ton was available with bulk parcels.
USD-based market saw weakness mainly in H1 Jan.
In early month, mainstream offers were pegged at $1,340/ton FOB CMP, with deals concluded at $1,310/ton as low-end and at $1,330/ton as high-end. Prices then kept falling tracking weakness of USD-based feedstock and domestic BGPET chip values. By 16 Jan, mainstream offers were at $1,290-1,300/ton FOB CMP. Trading values were in a wide spread, with low-end seen at $1,280/ton FOB CMP and high-end at $1,300/ton FOB CMP. Activities subdued later with China greeting the Lunar New Year holidays.
Monthly European BGPET Value Trend Contract (€/ton, FD) Spot (€/ton, FD)
Jan 2014 Jan 2013 Feb 2014 est. Jan 2014 Jan 2013 Feb 2014 est.
1120-1150 1250-1320 ↘ 1120-1150 1270-1320 ↘
During the month, in spite of lukewarm local demand, polyester prices in Europe were stable-to-firm as sellers held firm offers. As for plant news, Indorama idled a 155kt/yr unit, while M&G’s 140kt/yr unit was taken down for a 10-day maintenance. A 130kt/yr unit of Novapet was taken down for maintenance on 7 Jan and restarted on 20 Jan, currently running with full capacity. Polisan’s 80kt/yr unit was running with full capacity after restarting. Polyplex postponed the start of its new unit to end of Mar. Lotte Chemical’s 200kt/yr unit in UK is expected to be put on operation during Feb-Mar.
Generally speaking, European BGPET chip prices are expected to soften in February due to weak feedstock.
1150
1300
1450
1600
1750
19Jul 20Sep 29Nov 28Jan

China Chemical & Fiber Economic Information Network www.ccfei.net January 2014 [BGPET]
- 8 -
Statistics on BGPET Exports in China (ton, $/ton) Nov Dec Jan-Dec 2013 Jan-Dec 2012
Destination Exp. Vol. Ave. Val. Exp. Vol. Ave. Val. Exp. Vol. Ave. Val. Exp. Vol. Ave. Val.
Russia 3566 1352 12226 1309 89079 1400 69676 1439
Ukraine 3080 1364 6732 1309 108920 1430 97227 1428
Japan 21601 1413 16605 1413 237741 1424 196370 1409
The USA 6550 1374 6227 1349 79682 1446 74667 1453
Croatia 2789 1344 4994 1303 50782 1407 51987 1393
Others 113765 1369 114077 1353 1211863 1422 751796 1420
Total 151351 1375 160861 1356 1778167 1421 1241723 1417
China imported 3,213 tons of BGPET chips in Dec 2013, up by 4.4% from Nov 2013. The average import price for Dec is at $2,080/ton, up by 11.9% from Nov 2013. China's export volume in Dec totaled 160,861 tons, up by 6.3% from Nov 2013. The average export price for Dec is at $1,356/ton, down 1.4% month on month. From above data we can see that China’s export volume for BGPET is far larger than the import volume, with a net export volume of 157,648 tons, up by 9,376 tons from Nov 2013.
In Dec 2013, among the destinations for China's exports, Japan ranked the first, with the volume taking up 10.3% of the total. Russia took the second place at 7.6%, and India took the third at 6.1%.
China imported 38,000 tons of BGPET chips during Jan-Dec 2013, up by 4,100 tons y-o-y. The average import price is at $1,935/ton, up by $27/ton from 2012. China's export volume during Jan-Dec 2013 totaled 1.78 million tons, up by 537,000 tons from 2012. The average export price is at $1,424/ton, up by $6/ton from 2012.
Stock and Operation Status of Chinese BGPET Producers 1. In early Jan 2014, China Resources restarted two BGPET chip units (600kt/yr in total), which were idled on 4 Nov 2013. The two units started to yield products on 5 Jan. Plant News
2. Hainan Yisheng is to feed a 500kt/yr BGPET chip unit on 10 Feb.
Nov 2013 Dec 2013 Jan 2014 Feb 2014 est. Operating rate 59.1% 67.8% 76.3% ↗
Production (kt) 358 411 471 ↗
Inventory Normal Normal Normal ↗
With 600kt/yr capacities restarted during the month, the operating rate of Chinese BGPET chip suppliers picked up to above 75%. Early in the month, downstream buyers remained sidelined as chip prices kicked range-bound. Mid in the month, short-covering orders began to emerge with mainstream prices hovering at around 9,000-9,100 yuan/ton. Later in the month, there were a few large parcels changing hands at the level of 9,000 yuan/ton. By end of the month, inventory of BGPET suppliers only saw minor increase, and many beverage plants had ensured their procurements until early to mid Mar.
CCFEI Comment
Supply: Though BGPET chip producers are unlikely to carry out more turnarounds soon, and previously idled units are less likely to restart in Feb 2014, the market will still under supply pressure next month given Yisheng’s new capacity set to be started.
Demand: As some traders and beverage suppliers had stocked up ahead of Lunar New Year holidays during end of
Jan and early Feb, it is unlikely to be much short-covering demand after the holidays. Nevertheless, beverage producers may be glad to take volumes if prices would go below the 9,000 yuan/ton mark.
Cost: Though worries remained for the high market inventory of PTA, as PTA price had plummeted too much in past
days, the sentiment will probably get corrections. Based on the expectation for a good start after the Spring Festival, PTA market is likely to see narrow fluctuation in February. As for MEG, under the hefty pressure from tanks after the holiday, it still needs time to see the recovery in demand. Meanwhile, in mid to late February, the market may soften further. Generally speaking, feedstock markets are likely to hold relatively stable in near future, but may weaken in a mid-to-long term.
To sum up, given increasing feedstock inventory and chip availability combined with less active demand, BGPET chip
prices are likely go range-bound in a weak tone to track feedstock movements in a mid-to-long term.

China Chemical & Fiber Economic Information Network www.ccfei.net January 2014 [FGPET]
9
FGPET Chip Settlements from Majors (yuan/ton)
Sinopec East China South China Month
SD Bright SD Bright SD Bright
Nov 9500 9450 9550 9600 9700 9700
Dec 9400 9350 9500 9500 9600 9600
Jan 9200 9300 9350 9450 9450 9550
7500
9000
10500
12000
13500
Aug Sep Oct Nov Dec JanY/T
Sinopec East China
South China
Nominations from Majors (yuan/ton)
Sinopec East China South China Month
SD Bright SD Bright SD Bright
Nov 9500 9550 9500-
9600 9650 9600 9750
Dec 9500 9450 9550 9600 9700 9700
Jan 9500 9500 9600 9600-
9650 9700 9700
7500
9000
10500
12000
13500
Aug Sep Oct Nov Dec JanY/T
Sinopec East Chian
South China
Spot Average Price (yuan/ton)
Week Time SD Week on Week
Week 1 2Jan -3Jan 9075 →→→→
Week 2 6Jan -10Jan 9065 ↓
Week 3 13Jan -17Jan 8995 ↓
Week 4 20Jan -24Jan 8830 ↓
Week 5 26Jan -27Jan 8825 ↑
Monthly Ave. in Jan 8958 ↓
6500
8000
9500
11000
12500
14000
8-09 11-08 1-28
Semi Dull PET Chips: This month, SD chip market in Jiangsu and Zhejiang ranged bound in weakness, while central
values fell by 250 yuan/ton in total.
After New Year’s Day, SD chip market in Jiangsu and Zhejiang was insipid. Mainstream offers were at 9,150-9,300
yuan/ton and partially higher at 9,400 yuan/ton (cash) with discussions at 9,050-9,150 yuan/ton (cash). On the back of
appreciation of US dollar and increase in Libyan oil production, international oil prices tumbled during the night of
January 2 and kept decreasing till mid-month. With PTA futures TA1401 facing settlement, market supplies climbed.
Even if large number of polyester plants shutdown to tighten supplies of SD chip in Jiangsu and Zhejiang, it was
difficult to prevent the central values from dropping due to weak raw materials. Starting from mid-month, some
producers lowered their offers. Mainstream offers were at 9,000-9,200 yuan/ton (cash) on January 26 with some
second-tier brands offering at 8,800-8,900 yuan/ton Cash. During that period of time, market central values fell by 25-
75 yuan each day but trended up on January 20-22 with emergence of large-to-medium sized deals which were done at
low ends. On January 26, central values were mainly at 8,800-8,850 yuan/ton (cash). It was the Lunar New Year later
and central values kept steady.
Super Bright PET Chips: SB chip market mirrored the trend in SD chip market in January.
Earlier this month, due to tightened supplies, mainstream offers were at 9,300-9,500 yuan/ton (cash or D/A), with
firm discussions at 9,200-9,250 or so, while concluded trades were mostly in small sizes. Then, as raw materials and SD
chip both weakened, offers and central values in Jiangsu and Zhejiang SB chip market started to soften. Later this
month, offers dropped to 9,100-9,300 yuan/ton (cash or D/A) or lower at 8,900-9,000 yuan/ton (cash). Trading prices
were mixed with those of medium-sized deals at 8,800-8,900 yuan/ton (cash) and those of small volume deals at 9,000-
9,100 yuan/ton (cash).
CDP Chips: CDP chip market saw a slight increase in central values this month.
At first, mainstream offers were at 10,000 yuan/ton cash, and discussions were at about 9,900-9,950 yuan/ton
cash. Then in mid-month, CDP chip prices inevitably fell as SD chip central values bleached the 9,000 yuan/ton mark.
Later, offers were mainly at 9,800 yuan/ton with discussions 100 yuan/ton lower amid thin trades.

China Chemical & Fiber Economic Information Network www.ccfei.net January 2014 [FGPET]
10
Statistics on FGPET Imports in China (ton, $/ton) Nov 2013 Dec 2013 Jan-Dec 2013 Jan-Dec 2012
Origin Imp. Vol. Imp. Val. Imp. Vol. Imp. Val. Imp. Vol. Imp. Val. Imp. Vol. Imp. Val.
Iran 0 0 0 0 0 0 11065 1388
Taiwan 2138 1644 2467 1555 27727 1614 28320 1433
S Korea 3889 1927 3513 2062 44473 2004 38243 1826
USA 2004 1484 2003 1441 26847 1456 25807 1277
Japan 1528 2085 2078 1669 19804 1908 16184 2230
Others 1759 1890 1714 1588 32134 1627 29491 1869
Total 11318 1882 11775 1822 150985 1838 149110 1743
China’s PET chip import volume in December rose to 11,775 tons, 457 tons higher from 11,318 tons in November. Average import price in December was at $1,822/ton, down by $60/ton from November. Export volume declined by 981 tons or 8.4% to 10,697 tons, compared with 11,678 tons of December. Average export value was at $1,497/ton, down $6/ton from $1,503/ton in November and $385/ton lower than import value. So net import volume for December reaches 1,078 tons.
Of all import origins in December, the materials from South Korea, Chinese Taiwan, Iran, Japan and the USA account for 85.4% of the total import volume in China, up by 0.9 percentage points from November.
China’s total import volume of PET chips in 2013 was around 150.9 kt, up 2.5 kt year on year, at an average price of $1,846/ton, up $96/ton from 2012. China’s total export volume of PET chips in 2013 was around 179.6 kt, up 60.3 kt year on year, at the average value of $1,516/ton, down $61/ton from 2012.
Stock and Operation Status of Chinese FGPET Producers 1. Capacities of PFY plants involving turnaround of restart: 200kt/yr and 400kt/yr of Xiaoshan Hengyi,
200kt/yr of Wujiang Xinmin, 100kt/yr of Changshu Hengyi, 200kt/yr of Wuxi Shenyang, 240kt/yr of Zhangjiagang Xinxin, 100kt/yr of Ningbo Zhuocheng, 200kt/yr of Fujian Baihong, 200kt/yr of Fujian Xindonghua, 300kt/yr of Jiangsu Huaya, 450kt/yr of Shaoxing Cifu, 200kt/yr of Hangzhou Tianyuan, 200kt/yr of Jiangsu Yingxiang, 400kt/yr of Shaoxing Yifeng, 200kt/yr of HuaXing Tyre, 200kt/yr of Taicang Shenjiu, 200kt/yr of Xiaoshan Shuangtu, 200kt/yr of Fujian Jinlun, 650kt/yr of three units in total of Shaoxing Yuandong, 400kt/yr of Shaoxing Jiabao and 100kt/yr of Xiaoshan Rongsheng
2. Capacities of other plants down for T/A: 120kt/yr of Nangtong Jinxue (mainly producing PSF and PET chips) and 80kt/yr of Wujiang Fudong Shunxing Synthetic Fiber (mainly producing CDP chip)
Plant News
3. On January 15, one new 300kt/yr polyester plant of Jiangsu Sanfangxiang is planned to be thrown into production. The plant will produce bright chips at first and then polyester films.
Nov Dec Jan Feb est.
Run Rate 44.7% 44.0% 35.8% ↗
Output (kt) 335 330 270 ↗
Stock Low Low Low ↗
Many PET units were idled for repairs this month. With Sanfangxiang starting up its 300kt/yr new plant, PET chip amount increased instead of decreasing. The market was lack of trading activities with only a few large-to-medium sized deals done at low ends in mid-to-end January. As stock levels at producers were low, supplies were not loose. Run rates of chip-spinning mills reduced, 20-25% in Xiaoshan and Shaoxing, 10-20% in Zhuji and Cixi, and 20-30% in Changshu.
CCFEI Comment As for feedstock, PTA stock levels kept rising, which made market players concerned. On the other hand, PTA
prices fell sharply, which meant room for correction, coupled with the uptrend after the Lunar New Year, it is more likely that PTA market will rebound marginally. PTA market is expected to fluctuate in narrow ranges in February. MEG prices are also likely to rebound. Under weak demands against high inventory levels, the MEG market trends to cool down. In general, short term developments of raw materials are sound, while long term developments will be bearish.
As for supply, a large number of polyester plants which were shut down for maintenance will be restarted successively, and thus PET chip productions will increase. Adding accumulated materials during the holiday, supplies after the holiday are expected to be loose.
As for demand, the market is likely to restock after the long holiday. However, downstream chip-based spinning mills won’t restart soon which will only show little support for demand.
To sum up, Although PET chip inventory levels are expected to rise after the holiday, the short term uptrend will still be likely. In the long run, as raw materials show little support coupled with the uncertainty of resumption of downstream market, the PET chip market is expected to range bound in weakness. Market players are recommended to monitor the dynamics of polyester plants.

China Chemical & Fiber Economic Information Network www.ccfei.net January 2014 [PFY]
- 11 -
Polyester Filament Contract Prices from Majors (yuan/ton)
POY150D Time
Settled Listed
2Jan-6Jan a2AA2Aug
10250 10400
8Jan-13Jan 10200 10400 16Jan-20Jan 10150 10300
23Jan-27Jan 10150 10200
30Jan-31Jan 10250 10400
Average Spot Price (yuan/ton) Week Time POY150D DTY150D
150D FDY68D Week 1 1Jan-3Jan
a2AA2Aug 9795 11500 11000
Week 2 6Jan-10Jan 9664 11500 10820
Week 3 13Jan-17Jan 9664 11500 10820
Week 4 20Jan-24Jan 9542 11470 10718
Week 5 27Jan-31Jan 9520 11450 10670
Monthly average in Jan 9637 11484 10806
PFY prices were soft in January, with POY and FDY eying big loss and DTY relatively firm. ACP of PX for January was settled at $1,415/ton, but spot prices fell as much as $150/ton for the month due to
extensive production cutback in downstream polyester industry. In addition, PTA and MEG tumbled, but at a much slower pace than PX. Decent buying was seen early in the month when downstream producers did routine restocking. Therefore, the inventory of POY and FDY declined after active trading, and DTY prices firmed up. Despite a general downtrend of upstream feedstock prices, the sales/production ratio was broadly reported at around 100%, and even at above 100% for some POY and FDY producers. POY150D/48F was seen at between 9,600-9,650 yuan/ton in H1 January. In H2 January, as downstream mills’ purchasing period ended, PFY prices softened gradually due to continued
weakness in PX, PTA and MEG. Production at more DTY machines was cut or halted, and textile enterprises and sellers in Fabric Town gradually closed for Spring Festival holiday. As the Festival approached, POY producers revised offers down successively due to high stockpiles, but saw limited result given this time of the year. The average operation rate dropped to a relatively low level, but sales/production ratio was generally lower at around 50-60%, with numbers at several producers who sold for profit-taking at 200%. POY and FDY both posted on a weak note, while DTY firmed. In the month end, POY150D/48F toppled down to around 9,500 Yuan/ton. PFY inventory moved in different direction in January. The numbers for POY were mainly at 18-22 days’ worth,
while those for DTY and FDY were at 32-35 days’ worth and 18-22 days’ worth respectively.
Operation Status of Downstream Textile Sector Nov Dec Jan Jan est.
Operating Rate 52% 50% 30% →
Fabric Inventory 42 days 41 days 46 days →
Well-sold Products
woolen fabrics, embroidery fabrics and the fabrics for casual wear knitted fabrics Downstream looms were mostly closed for Spring Festival in January, and were not expected to resume production
until 14 Feb. Therefore, the periodic restocking is likely to be moderate. In addition, downstream producers are likely to face the difficulty in securing enough labor forces this year again.
Fabric: Daily trading volume in Textile City of China gradually declined in January, from 7 million meters per day to below 500 km per day, due to Spring Festival. February is also traditionally dull because textile enterprises are mostly down or are operating at reduced rate right after the Festival. Businesses in Textile City will resume gradually after mid February, with best selling fabrics mainly for spring cloth, like woolen fabric, embroidery fabrics and the fabrics for casual wear.
International PFY Price W. Europe (DEL, $/T) The US (DEL, $/T) Taiwan (DEL, $/T)
167dt POY 167dt DTY 150D/48-132F POY 150D/48-132F DTY 230D POY 150D DTY
/ 2881-3018→ 2800-2910→ 3792-3946→ 1454-1488→ 1759-1793→
Despite weaker export, production volume of BCF in North America remained at full capacity on the back of residential carpet market. Demand for textile filament and industrial filament slowed down. In West Europe, some special products sold well, despite bearish demand for conventional PFY specs. Moreover, some producers raised run rates due to higher-than-expected export, but import trade remained thin.
Y/T
Y/T
8000
10000
12000
14000
16000
11Feb 2Apr 22May 11Jul 30Aug 19Oct 8Dec 27Jan
POY150D settled
POY150D listed
DTY150D listed

China Chemical & Fiber Economic Information Network www.ccfei.net January 2014 [PFY]
- 12 -
Statistics on Exports of Chinese PFY (tons, $/ton) Nov 2013 Dec 2013 Jan-Dec 2013 Jan-Dec 2012
Destination Exp. Vol. Exp. Val. Exp. Vol. Exp. Val. Exp. Vol. Exp. Val. Exp. Vol. Exp. Val.
Turkey 19943 1742 21452 1741 197273 1821 169364 1900
Pakistan 10409 1802 19151 1752 130336 1831 114433 1848
Egypt 16019 1575 15568 1549 111517 1601 65284 1686
South Korea 8498 2113 8154 2056 100693 2108 83429 2123
Vietnam 12231 1788 16127 1740 125550 1856 83717 1883
Others 60990 2051 65320 2048 643043 2116 578889 2109
Total 128090 1902 145772 1877 1308413 1974 1095116 2008
China exported 145.8kt of PFY in December 2013, up 17.7kt or 13.82% month on month. The average export price is at $1,877/ton, down $25/ton or 1.31% month on month. In December, China imported 9.5kt of PFY, slightly up from 9.2kt in November. The average import price is at $3,527/ton, an increase of $178/ton from $3,349/ton in November.
Exports to Turkey totaled 21.4t in December 2013, up 7.57% from November 2013, ranking the first and accounting for 14.72% of the total in the month. Exports to Pakistan surged by 83.98% month on month to 19.1kt, ranking the second and accounting for 13.14% of the total, followed by Vietnam, Egypt, South Korea and etc.
Stock and Operation Status of Chinese PFY Producers
1. The units shut down for T/A in January include Ruichenghui, Lianda, Tianyuan, Xiangsheng, Hengyi, and Shuangtu in Xiaoshan, Yifeng, Jiabao, Nanfang, Cifu, Yuandong and Guxiandao in Shaoxing, Jinsheng, Zhuocheng, Konced and Huaxing Tyre in Ningbo, Longteng in Jiaxing, Xinmin and Xiangying in Wujiang, Shenjiu in Taicang, Godsheep in Wuxi, Xinxin in Zhangjiagang, Huaya in Yixing, Hengyi in Changshu, and Xianglu, Xindonghua, Jinlun and Billion in Fujian. A total capacity of 9 million tons/year was involved.
2. Two units at Wujiang Shenghong, with a combined capacity of 400 kt/yr, restarted on 15 Jan and 24 Jan respectively. Plant News
3. One 100 kt/yr bright FDY unit went through retrofitting in 14-19 January.
Nov Dec Jan Feb est.
Run rate 76.4% 79.2% 67.8% ↘
Output (kt) 1850 1917 1640 ↘
Inventory high high high ↗
Spring Festival came in January this year. As a result, run rate along the chain fell greatly from 15 Jan to around 67%, and is expected to remain low in H1 February because most producers scheduled to restart in H2 February. In addition, uncertainty still exists for post-Festival production resumption, so the average run rate in February is expected to remain relatively low at 60-70%.
Meanwhile, sale/production ratios for PFY were moderate in January. Active trades were seen in H1 Jan when downstream producers restocked. The ratio was reported at above 100% for most producers, and inventory level broadly declined. In H2 Jan, however, sales/production performances remained low at 50-60% as most downstream units shut down or ramped down. PFY producers who slashed prices to ease inventory pressure could make around 200%. In the meantime, PFY producers gradually shut down or ramped down as well with moderate stockpile, and by month end market was closed in general. In H1 February, the sales/production performance in PFY market is expected to remain weak as players were still away right after the Festival. Nevertheless, the outlook is bullish in late February due to expected restocking. However, the recovery in sales/production will still be subjected to downstream production at that time.
CCFEI Comment
Raw material: WTI crude oil prices weakened to around $98/barrel, and Brent crude oil prices fell to $107/barrel. Meanwhile, PX saw a total loss of $150/ton in January, and PTA and MEG remained sluggish. PX ACP for February ended up unsettled, exerting little support to PFY.
Supply: Supply will be curtailed in February as in previous month due to extensive maintenances at PFY units. But it may still be enough, considering the stockpile accumulated during Spring Festival.
Demand: Downstream production is expected to resume gradually after 14Feb. There may be a traditional New Year boom and decent demand in a short period, but the actual trading volume is expected to be limited this year. In addition, sentiment will also depend on labor market and order intake after the Festival.
All in all, activity is expected to be low in February, which is usual for right after the Spring Festival. In addition, post-Festival sentiment is also affected by upstream and downstream market as well as labor market. And considering the relatively high inventory at the moment, PFY prices will also depend on the cash flow of individual company.

China Chemical & Fiber Economic Information Network www.ccfei.net January 2014 [PSF]
- 13 -
Polyester Staple Contract Settlements and Nominations
(yuan/ton) Month
Sinopec (Delivered)
Private producers (Ex-works)
Nov settled 10,150 9,950
Dec settled 10,200 10,000
Jan settled 10,100 9,900
Feb listed 10,100 10,000
9800
10000
10200
10400
10600
10800
Jun Jul Aug Sep Oct Nov Dec Jan
Sinopec (delivered)
Private producers (ex-works)
Y/T
Sinopec nominated its February contract price for 1.4D SD PSF at 10,100 yuan/ton (delivered). On 23 January,
Sinopec announced its settlement price for January at 10,100 yuan/ton, down by 100 yuan/ton from December.
PSF and Cotton Prices in China (yuan/ton)
Week Time PSF 1.4D Cotton 328
Week 1 2Jan-3Jan 9,875 19,532
Week 2 6Jan -10Jan 9,830 19,534
Week 3 13Jan -17Jan 9,769 19,407
Week 4 20Jan -24Jan 9,690 19,406
Week 5 27Jan -30Jan 9,680 19,433
Monthly Ave. in Jan 9,769 19,462
8000
11000
14000
17000
20000
8Aug 6Sep 5Oct 3Nov 2Dec 31Dec 29Jan
1.4D PSF Cotton 328
Y/T
In January, due to the New Year’s Day and Chinese Lunar New Year as well as big surges in international crude oil
and polyester raw materials, the polyester market was mostly soft, and PSF was on the southward trend, with price breaching the lowest point in 2013.
Early Jan: PSF prices trended stable before going down. Limited stockpiles supported the PSF market which was in stalemate. Then after the steep slump in PTA futures and oil prices in the world, more players chose to be on the sideline. Even though discussions increased, mainstream prices still dropped. Several staple producers managed to keep decent deals at low prices after increasing promotions. Meanwhile, with PTA spots breaking the 7,000 yuan/ton level, the market was covered by the wait-and-see tone once again, and downstream players kept purchasing on a need-to basis. In Jiangsu and Zhejiang, most prices for 1.4D direct-melt-spun PSF were at 9,800-9,850 yuan/ton ex-works, down by 50 yuan/ton.
Mid Jan: the market went southward gradually. In early to mid January, raw materials continued to fall, and the range was wilder than downstream polyester products. Therefore, producers saw improvement in cash flows. As for PSF, producers were quite calm given low inventory. With Lunar New Year coming, some PSF producers sold off goods, as there was still no sign of pre-restocking activity and they were under the pressure from cash. As a result, deals done at low prices increased, but high-priced ones were still limited. In Jiangsu and Zhejiang, most prices for 1.4D direct-melt-spun PSF were at 9,700-9,750 yuan/ton ex-works, down by about 100 yuan/ton.
Late Jan: the market saw transactions and prices both sliding. On about 20 Jan, modest restocking activities emerged in some regions, because some producers lowered offers again to attract buyers, but general trading volumes were still limited. Downstream players’ confidence was hit by the continuous downtrend in raw materials earlier and they were under hefty cash pressure at the end of the year, so restocking activities before the holiday were fewer than expected. Meanwhile, with more downstream producers wrapping up business for the holiday, PSF market saw offers but no demand, most scattered small deals and the market was basically closed by the end of the month. In Jiangsu and Zhejiang, most prices for 1.4D direct-melt-spun PSF were at 9,700-9,750 yuan/ton ex-works, down by about 100 yuan/ton.
Monthly International PSF Value Trend Chinese Taiwan (DEL, $/ton) Europe(DEL, $/ton) USA(DEL,$/ton)
Dec Jan Feb est. Dec Jan Feb est. Dec Jan Feb est.
1,573 1,573 ↗ 2,229 2,229 ↗ 2,513 2,513 ↗
North America: The liquidity of PSF was affected by the upcoming winter holiday, and downstream producers kept reduced run rates and low raw material inventory by the end of the year.
West Europe: Nonwoven sector supported PSF with firm demand pushing trading volumes in PSF better than expected, while demand from spinning yarn industry was stable and sluggish.

China Chemical & Fiber Economic Information Network www.ccfei.net January 2014 [PSF]
- 14 -
Statistics on Exports of Chinese PSF (kt, $/ton) Nov 2013 Dec 2013 Jan-Dec 2013 Jan-Dec 2012
Destination Exp. Vol. Exp. Val. Exp. Vol. Exp. Val. Exp. Vol. Exp. Val. Exp. Vol. Exp. Val.
US 13.6 1,143 14.3 1,182 159.5 1,169 161.3 1,317 Pakistan 7.3 1,320 11.1 1,281 85.2 1,372 88.8 1,408 Israel 3.7 1,347 4.3 1,432 20.7 1,425 27.6 1,478 Russia 2.8 1,359 4.2 1,332 32.3 1,408 22.4 1,512 Turkey 3.8 1,465 3.9 1,466 39.3 1,454 41.9 1,500 Others 36.9 1,424 37.4 1,401 396.7 1,459 328.7 1,514
Total/Ave. Val. 68.1 1,352 75.3 1,343 733.8 1,383 670.7 1,450 According to the statistics from China Customs, China’s import volume for PSF in December 2013 is about 11.2kt, up
0.4kt on month, and the average import price is at $1,904/ton, $48/ton lower from November. Meanwhile, China exported 75.3kt of PSF in December, an increase of 7.2kt on month, with the average export price at $1,343/ton, down $9/ton on month. In 2013, total PSF import to China is 128.4kt, with average import price at $1,880/ton, while export is 733.8kt, with average export price at $1,382/ton.
South Korea, Chinese Taiwan and Japan rank the top three regions that exported PSF into China Mainland in December, and the top three export destinations of ex-China PSF are the US, Pakistan and Turkey.
Stock Level and Operation Status of Chinese PSF Producers
Plant News
1. Shandong Wanjie and Huijin’s PSF units are still idle, with impending restarting time. 2. Fujian Jingwei’ s 250 kt/yr direct-melt-spun PSF unit is running at 60% of full capacity at present
and expected to be running at full rates in H2 of Feb. 3. One Shanghai-based 30kt/yr PSF unit, which was closed in the end of Nov, restarted in early Jan. 4. Jiangyin Changsheng Chemical Fiber’s one 120kt/yr PSF unit closed in early Jan is expected to be
back online in early to mid Feb. Zhejiang Donghua (Zhenya Group)’s 60kt/yr PSF unit was shut down on about 10 Jan and is expected to be restart in early to mid Feb.
5. On 15 Jan, Texsino closed its 200kt/yr polymer unit, mainly producing cotton-type and hollow staple. The unit is expected to be idle until 12 Feb.
6. Nantong Jinxue’s one 120kt/yr polymer unit was shut down on 18 Jan. The unit mainly produced PSF and chips and is expected to restart after 14 Feb. Zhejiang Yuandong’s new 100kt/yr PSF unit was offline on 21 Jan and will restart after one month.
7. On 25 Jan, the following direct-melt-spun PSF units were closed: Huahong’s 250kt/yr unit, Huaxicun’s 250kt/yr unit, Kangxin’s 150kt/yr unit and Xiangsheng (Suqian)’s 200kt/yr unit.
Month Nov Dec Jan Feb est.
Operating rate 62.76% 65.43% 56.65% ↘
Output (kt) 338.9 341.9 296 ↘
Stock Level Medium Low Low →
The market confidence was weakened by the continuous downslide in raw materials and tight cash was still an issue, pre-restocking activities from downstream were worse than expected and most deals were done at low levels. Meanwhile, staple producers began to close units for maintenance earlier than expected. In Jan end, average inventory level stayed flat from December, with general level at 6-10 days’ worth and some below 3 days’ worth.
CCFEI Comment
Raw materials: The unsettled February ACP indicates that PX may breach $1,300/ton. In late January, the rebound in oil supported PX. Although the supply and demand gap in PTA market was wild, the steep slide previously may be corrected. The market opened in bullishness after the holiday, with prices in narrow fluctuation. In January end, MEG tanks in East China saw inventory over 1 million tons, and there will be tank shortage later. Prices may hitthe bottom again in mid to late February.
Demand: Restocking activities from downstream before Chinese New Year were limited. Run rates of yarn units may recover after 14 February, leading to the incremental demand for raw materials from downstream. Given the cash pressure and the market outlook, PSF demand in February was mostly in a hand-to-mouth way.
Supply: Run rates in PSF industry kept at low levels during the holiday, so the increase in inventory was limited. As PSF producers were cautious about raising run rates after the holiday, some products may face tight supply.
To sum up, producers became active in the market on limited availability and decent cash flow. Nevertheless, raw materials still affect the confidence in the polyester market. Meanwhile, it is still a question whether downstream demand for PSF recovers or not and it’s important that the supply and demand fundamentals were balanced. It is expected that PSF in February is most likely to be volatile in a narrow range.

China Chemical & Fiber Economic Information Network www.ccfei.net January 2014 [R-PET]
- 15 -
R-PET Fiber Hollow R-PSF Value Trend (yuan/ton)
Variety (6-15D siliconized) Trend Value
3-D-crimped in Jiangsu & Zhejiang - 9,400
3-D-crimped in Guangdong (pre-VAT) - 8,500
2-D-crimped whitened in Cixi (whitened) 36↓ 8,614
3-D-crimped Hollow R-PSF in JZ
9000
9500
10000
10500
22Jun 28Jul 2Sep 8Oct 13Nov 19Dec 24JanY/T
Due to the approaching of Chinese New Year, R-PET fiber market saw thinner trading activities in January, with producers shutting plants from mid month. Sale/production ratios were described as lower, seeing offers largely staying flat amid muted enquiries, while producers were mostly busy with fund reclamation.
During this period, 3-D-crimped hollow R-PSF market weakened in Jiangsu and Zhejiang, along with the downslide of sale/production ratios, seeing inventory pile up at producers who thereafter started to take down plants from Jan 20. Mainstream offers for siliconized goods remained stable at 9,400-9,800 yuan/ton (VAT included). Export market witnessed moderate demand, with siliconized products largely quoted at around $1,290-1,350/ton FOB.
In Guangdong and Fujian, 3-D-crimped hollow R-PSF market consolidated, with offers for siliconized goods sustained at 8,400-8,600 yuan/ton (VAT excluded). Most producers were comfortable with their inventory levels.
In Cixi of Zhejiang, hollow R-PSF market also softened amid the shutdowns, with offers for siliconized whitened products at 8,500-8,800 yuan/ton (VAT included). Manufacturers were under inventory pressure, with the slightly lower sale/production ratios.
Cotton-type R-PSF Value Trend (yuan/ton) Variety (in Jiangsu and Zhejiang) Trend Value
High-tenacity low-elongation virgin-like 1.5D 2↓ 8,398
High-pressure spun virgin-like 1.5D 34↑ 8,184
High quality raw white 1.5D 50↓ 7,750
High quality raw white 1.5D (SW China) - 8,100
Low quality raw white 1.5D 100↓ 7,600
R-POY150D/96F 682↓ 8,223
8000
8500
9000
9500
10000
22Jun 28 Jul 2 Sep 8Oct 13 Nov 19 Dec 24Jan
H-T Virgin-like R-PSF in JZ
In January, cotton-type R-PSF market was reported in weak corrections, seeing producers maintain flat offers amid limited transactions. Mainstream selling ideas for high tenacity & low elongation virgin-like goods were pegged at 8,200-8,500 yuan/ton (ex-works, VAT included), and those for high-pressure-spun virgin-like R-PSF were at 8,100-8,200 yuan/ton (VAT included).
In Jiangsu and Zhejiang, central offers for 1.5D high-quality raw white regular R-PSF slipped to 7,500-7,600 yuan/ton (ex-works, VAT included); while mainstream offers in Southwest China were maintained in the range of 7,900-8,100 yuan/ton (ex-works, VAT included).
During the same period, R-PFY offers were on a flat range-bound. Producers started to close their devices from mid Jan amid muted sales. Mainstream offers for R-POY 150D held unchanged at 8,500-8,600 yuan/ton (VAT included), with enquiry and trading atmosphere at a slow tone.
Bottle Flake Price Trend Clear flake, for 3-D-
crimped R-PSF Clear flake, for regular
R-PSF Clear flake, for R-PFY
Green flake, for spinning
Average in Jan 6,750→ 6,300→ 7,024↑ 5,700→
Forecast for Feb → → → →
With Lunar New Year holiday at corner, poor margins and sluggish transactions caused a series of shutdowns since early this month, but mainstream trading values stayed firm on the back of cost push. In mid Jan, more plants were taken down, and producers were mostly busy at fund reclamation and holiday arrangement, while spot trades were largely listless. Market was even sluggish in end Jan, seeing players mainly on vacation with only sporadic offers heard from major producers.
In Jiangsu and Zhejiang, mainstream offers for clear flakes used to spin R-PFY were at 6,900-7,200 yuan/ton (ex-works, VAT excluded), while procuring numbers for baled bottles stayed at 5,500-5,800 yuan/ton (80% for clear baled bottles, including 7% moisture in weight). Trading numbers for hot washed white flakes ready for spinning 3-D-crimped hollow R-PSF were seen at 6,650-6,750 yuan/ton (delivered, VAT excluded). Besides, central purchasing prices for post-consumer bottles stood at 4,500-4,600 yuan/ton. In Guangdong, mainstream trading values for hot washed white flakes ready for spinning 3-D-crimped hollow R-PSF were at 6,700-6,800 yuan/ton (delivered, VAT excluded). In Southwest China, offers for clear flakes ready for spinning were largely pegged stable at 6,200-6,400 yuan/ton (delivered, VAT excluded). Mainstream offers for imported hot washed white flakes ready to spin 3-D-crimped re-PSF were seen at $910-930/ton CFR SE Asia.
Y/T

China Chemical & Fiber Economic Information Network www.ccfei.net January 2014 [R-PET]
- 16 -
Statistics on Imported PET Scraps and Wastes into China (kt, $/ton) Nov 2013 Dec 2013 Jan-Dec 2013 Jan-Dec 2012
Origin Imp. Vol. Ave. Val. Imp. Vol. Ave. Val. Imp. Vol. Ave. Val. Imp. Vol. Ave. Val.
Japan 39.6 740 29 728 385.3 749 332.4 833
USA 19.9 606 20.8 612 192.8 640 207.4 734
Thailand 16.9 898 16.2 889 206.4 922 161.1 1,034
Indonesia 16.4 868 18.6 855 174.4 894 133.8 998
Hong Kong 12.9 674 9.3 664 67.3 711 124.7 702
Others 113.2 707 117.7 695 1,173.4 731 1,085.9 826
Total 219 728 211.6 719 2,199.7 756 2,045.4 838
According to China Customs, 2,120kt of PET waste was imported to China in December 2013, a decrease of 7kt on month, with average price at $719/ton, down by $9.4/ton from previous month.
The statistics show the decrease in both import volume and values during the month. Japan ranks the first in all the countries and regions that exported flakes into China Mainland, followed by the US, Germany, Indonesia, Thailand, Mexico, Vietnam, Hong Kong, the Philippines, South Korea, Malaysia and Belgium. As for import price, the highest numbers were from Thailand and Indonesia, followed by those from Burma, Sri lanka, Vietnam, Peru, Croatia, Sudan and the Philippines.
Operation Status of Chinese R-PET Fiber Producers
Ningbo Zhenbang’ 200 tons/day cotton-type R-PSF unit remained in outage.
Hangzhou Taifu closed its R-PSF plant on Jan 21-22, with a daily output of 50 tons/day involved.
Fuyang Anshun shut its R-PSF plant on Jan 21-22, with a daily output of 50 tons/day involved.
Hangzhou Best closed its R-PSF plants from Jan 10, with a daily output of 120 tons/day involved.
Hangzhou Yongxing shut its R-PSF plants from Jan 11, with a daily output of 110 tons/day involved.
Yangzhou Ruiyue closed its R-PSF plant on Jan 23, with a daily output of 40 tons/day involved.
Yangzhou Guangtai shut its R-PSF plant on Jan 25, with a daily output of 80 tons/day involved.
Plant Operation
Nantong Luolai closed its R-PSF plant on Jan 25, with a daily output of 60 tons/day involved.
Domestic producer Nov Dec Jan Feb est.
Operating rate 59% 57% 35% ↗
R-PET fiber market saw lackluster demand in January, with sale/production ratios in downward corrections. Inventory levels for cotton-type R-PSF were averaged at 10-15 days’ worth, with operation rates mainly kept at 30-50% of capacity. Meanwhile, hollow R-PSF producers saw inventory at about 15-20 days and run rates also at 30-50%, while R-PFY producers saw inventory of about 10-15 days, with run rates at about 30-50%.
CCFEI Comment
In January, R-PET fiber market headed south little by little. The downturn was triggered by bearish market atmosphere as well as diminishing orders from downstream.
Cost: Muted sales and high inventory in R-PET fiber market caused a decrease in demand for raw materials, and
bottle flake suppliers were pessimistic over the future trends, who in turn maintained flat offers for the short term, expecting a stable run or slight rebounds at high-end prices for the post-holiday market. Moreover, poor margins also eroded their incentive to produce, and most suppliers planned for a delay of production resuming.
Supply/demand: Overall operating rates at producers obviously declined this month, with production cutbacks taking place ahead of Lunar New Year holiday. In the meantime, downstream showed dampened demand and producers received fewer orders from both home and overseas markets. R-PET fiber machines were successively closed from mid Jan, with some others shutting down units around Jan 20. Producers were busy with fund reclamation, and also found it more difficult to withdraw money citing muted sales and poor margins throughout the year.
All in all, R-PET fiber market was quiet at lunar year-end. Looking forward, production is expected to be gradually
restored after Feb 7, but bearish sentiment may continue to linger in the market, and some producers are likely to restart their plants after Feb 14.

Disclaimer:Information contained in this report is obtained from sources believed to be reliable. However, neither responsibility nor liability will be accepted by China Chemical & Fiber Economic Information Network (CCFEI) for commercial decisions claimed to have been based on the content of the report.
© Copyright CCFEI 2002-2013 All Rights Reserved
CCFEI Business Coverage
Contact detailsAdd: 7F, Building No.2, 988 Pingliang Rd., Shanghai, 200082, China
Tel: +86-21-31276331 Fax: +86-21-31276851Email: [email protected] [email protected]: www.ccfei.net
Contact: Mr. Justin Shen
PTAMEG BGPET Polyester Filament Polyester Industrial YarnPolyester Staple RPET Fiber
Learn More!
CaprolactamPA-6 ChipNylon FilamentAcrylonitrile Acrylic FiberViscoseSpandex Cotton & Cotton Yarn
CCFEI Annual Report (2013)
Visit our website at www.ccfei.net
☆ Online Information
— Articles and Prices
☆ Newsletter Publications
— CCFEI China Report (Monthly)
☆ CCFEI Annual Report
☆ CCFEI Forums
☆ Advertisement
11th China International Acrylonitrile & Acrylic Fiber Forum
Shanghai, China☆☆☆☆ (500 Gushan Road)12-14 March 2014 Minya HotelLearn More!
CCFEI Conferences in 2014
I.
4th China International Sulphur & Sulphuric Acid Conference
Shanghai, China☆☆☆☆ (1116 West Yan An Road)18-20 June 2014 The Longemont HotelLearn More!
II.
11th China International Polyester & Intermediates Forum
Shanghai, China☆☆☆☆ (500 Gushan Road)10-12 July 2014 Minya Hotel
III.
10th China International Recycled Polyester Conference
Shanghai, ChinaSeptember 2014
IV.
12th China International Polyamide & Intermediates Forum
Shanghai, China☆☆☆☆ (2000, West Yan'an Road)4-5 December 2014 Rainbow Hotel
V.
Let’s gather in Shanghai to forge new relationships to China!