Embed Size (px)
Citation preview

Higher education in S
weden 2013 status report
Report 2013:3
In English
Higher education in Sweden
2013 status report
Report 2013:3

Higher education in S
weden 2013 status report
Report 2013:3
The Swedish Higher Education Authority is a government agency that deals with questions concerning universities and university colleges and is responsible for statistics about higher education. The SHEA works with the quality assurance of higher education courses and programmes, monitoring and evaluating effi ciency, legal supervision and leadership development in higher education.
You can read more on the web-site www.uk-ambetet.se.
www.uk-ambetet.se/rapporter
Higher education in Sweden
2013 status report

Higher education in Sweden 2013 Status report
Published by Universitetskanslersämbetet 2013Rapportnummer 2013:3
Editor Andrea AmftGraphic design and graphics Åsa TillPhotos Eva DalinPRINT Ineko, Stockholm, June 2013, Printed on environmentally-friendly paper
Swedish Higher Education Authority • Box 7703, SE-103 95 StockholmPhone +46 8 563 085 00 • Fax +46 8 563 085 50E-post [email protected] • www.uk-ambetet.se
Contents
Contents
Introduction 5
Sweden in an international perspective 7
Facts about higher education in Sweden 15Higher Education in Sweden 16The structure of programmes and qualifications 18Admission to higher education 19Tuition fees 20Student finance 20
Trends and developments 23First and second-cycle courses and programmes 24Third-cycle courses and programmes 35International mobility 38Education and employment 41Teachers and researchers 45Finance and research funding 48
Key figures for higher education institutions 53First and second-cycle programmes and courses 55First and second-cycle programmes and courses 56Third-cycle programmes and courses 57Teaching and research staff 58
Universities and university colleges in Sweden 59

INTRODUCTION 5
Introduction
The Swedish Higher Education Authority (Universitetskanslersämbetet) is continuing the tradition previously observed by the Na-tional Agency for Higher Education (Högsko-leverket) and is now publishing the first short version in English of its annual statistical re-port on higher education institutions in Swe-den. It gives a description of the current si-tuation in Sweden’s largest public sector area – the higher education sector.
Initially, the report summarises some in-dicators for Swedish higher education in an international perspective and, under the heading Facts about higher education in Swe-den, provides a basic description of the struc-ture of Swedish higher education and the re-
gulatory framework. The report then outlines developments prior to and including the fiscal year of 2012 for public-sector and independent universities and university colleges. The last section presents key data about students, staff and finance for each university and university college. Analyses in the statistical report are mainly based on information supplied by Sta-tistics Sweden and the Swedish Higher Edu-cation Authority. <
Lars HaikolaThe University Chancellor

SWEDEN IN AN INTERNATIONAL PERSPECTIVE 7
Sweden in an international perspective

8 SWEDEN IN AN INTERNATIONAL PERSPECTIVE
For many years the importance of an advan-ced level of education for competitiveness and growth has been high on the agenda – in Sweden and internationally. The impact on educational statistics can be seen clearly in the increase in the number of students in higher education in both Sweden and seve-ral other comparable countries. Consequently expenditure has also risen and there has been increasing focus on how to fund educational activities.
Educational level of the population Between 1997 and 2010 the proportion of the populations of the OECD countries aged 25–64 with tertiary qualifications had risen on average from 21 to 30 per cent. In Sweden the corresponding proportion rose from 21 to 34 per cent during the same period.
Among the 25 OECD countries for which there are statistics for both 1997 and 2010 Canada had the largest proportion of the population aged 25–64 with tertiary quali-fications in 2010, 51 per cent. This propor-tion was also high in Japan, the USA, New Zealand and South Korea, with 40 per cent or above. Here Sweden is in the middle, as it was in 1997.
Much of the increase in Canada is due, however, to a rise in the provision of short programmes with a more practical or profes-sional orientation. Programmes at this level constitute only ten per cent of the tertiary edu-cation offered in Sweden.
Higher median age for HE entrants in Sweden In the OECD countries higher education normally begins straight after leaving what corresponds to the upper-secondary school in Sweden. The median age in the OECD for HE entrants (including incoming foreign stu-dents) was 20.6 in 2010 and it has been more or less the same since 2001.
There is data about the median age of HE entrants in both 2001 and 2010 for 21 OECD
countries. It was highest in Iceland in 2010, 22.4. This was followed by Denmark, 22.1, and then Sweden, 21.8. In the countries that had the youngest HE entrants (Spain, Mexi-co, Ireland and Belgium) the median age was 19.3 or less.
The differences between the ages of HE en-trants in the various countries reflect social dif-ferences and differences in their educational systems, for instance the age at which secon-dary education finishes. In Sweden pupils nor-mally leave secondary education at the age of 19, which is partly why HE entrants are older than in many other countries. Higher educa-tion in Sweden is also characterised by a major element of lifelong learning and this is reflected in the age of the country’s HE entrants.
0 10 20 30 40 50 60
0 10 20 30 40 50 60
Turkey
Czech Republic
Slovakia
Mexico
Austria
Hungary
Poland
Greece
Germany
France
OECD average
Spain
Iceland
Sweden
Belgium
Switzerland
Norway
Ireland
Australia
Finland
United Kingdom
South Korea
New Zealand
USA
Japan
Canada
1997
2010
Per cent
Figure 1. Proportion of population aged 25-64 with tertiary qualifications (ISCED 5A, 5B or 6) 1997 and 2010 respectively. Source: Table A1.4 EAG 2012.
SWEDEN IN AN INTERNATIONAL PERSPECTIVE 9
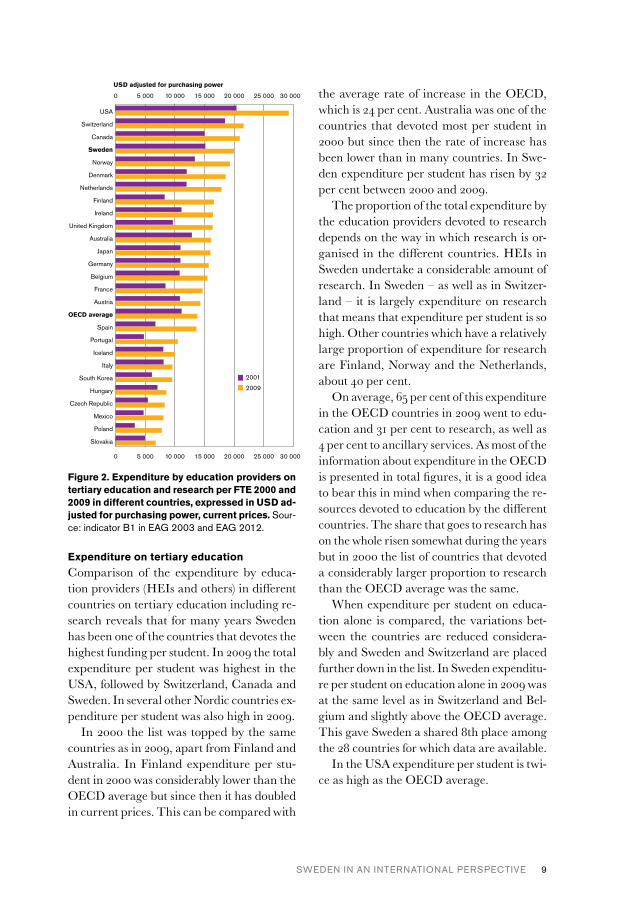
Expenditure on tertiary education Comparison of the expenditure by educa-tion providers (HEIs and others) in different countries on tertiary education including re-search reveals that for many years Sweden has been one of the countries that devotes the highest funding per student. In 2009 the total expenditure per student was highest in the USA, followed by Switzerland, Canada and Sweden. In several other Nordic countries ex-penditure per student was also high in 2009.
In 2000 the list was topped by the same countries as in 2009, apart from Finland and Australia. In Finland expenditure per stu-dent in 2000 was considerably lower than the OECD average but since then it has doubled in current prices. This can be compared with
the average rate of increase in the OECD, which is 24 per cent. Australia was one of the countries that devoted most per student in 2000 but since then the rate of increase has been lower than in many countries. In Swe-den expenditure per student has risen by 32 per cent between 2000 and 2009.
The proportion of the total expenditure by the education providers devoted to research depends on the way in which research is or-ganised in the different countries. HEIs in Sweden undertake a considerable amount of research. In Sweden – as well as in Switzer-land – it is largely expenditure on research that means that expenditure per student is so high. Other countries which have a relatively large proportion of expenditure for research are Finland, Norway and the Netherlands, about 40 per cent.
On average, 65 per cent of this expenditure in the OECD countries in 2009 went to edu-cation and 31 per cent to research, as well as 4 per cent to ancillary services. As most of the information about expenditure in the OECD is presented in total figures, it is a good idea to bear this in mind when comparing the re-sources devoted to education by the different countries. The share that goes to research has on the whole risen somewhat during the years but in 2000 the list of countries that devoted a considerably larger proportion to research than the OECD average was the same.
When expenditure per student on educa-tion alone is compared, the variations bet-ween the countries are reduced considera-bly and Sweden and Switzerland are placed further down in the list. In Sweden expenditu-re per student on education alone in 2009 was at the same level as in Switzerland and Bel-gium and slightly above the OECD average. This gave Sweden a shared 8th place among the 28 countries for which data are available.
In the USA expenditure per student is twi-ce as high as the OECD average.
2001
2009
USD adjusted for purchasing power
0 5 000 10 000 15 000 20 000 25 000 30 000
0 5 000 10 000 15 000 20 000 25 000 30 000
Slovakia
Poland
Mexico
Czech Republic
Hungary
South Korea
Italy
Iceland
Portugal
Spain
OECD average
Austria
France
Belgium
Germany
Japan
Australia
United Kingdom
Ireland
Finland
Netherlands
Denmark
Norway
Sweden
Canada
Switzerland
USA
Figure 2. Expenditure by education providers on tertiary education and research per FTE 2000 and 2009 in different countries, expressed in USD ad-justed for purchasing power, current prices. Sour-ce: indicator B1 in EAG 2003 and EAG 2012.
10 SWEDEN IN AN INTERNATIONAL PERSPECTIVE
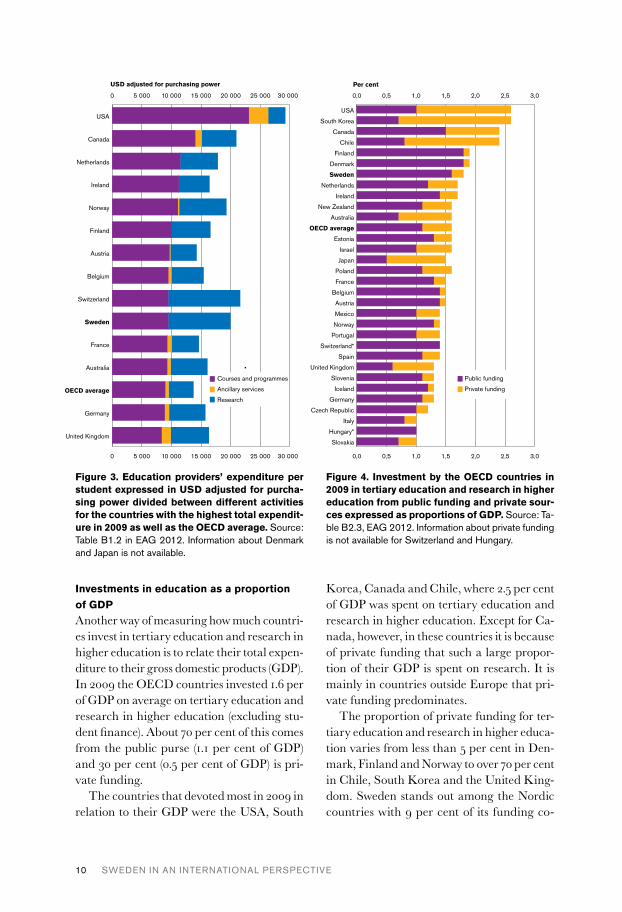
Investments in education as a proportion of GDPAnother way of measuring how much countri-es invest in tertiary education and research in higher education is to relate their total expen-diture to their gross domestic products (GDP). In 2009 the OECD countries invested 1.6 per of GDP on average on tertiary education and research in higher education (excluding stu-dent finance). About 70 per cent of this comes from the public purse (1.1 per cent of GDP) and 30 per cent (0.5 per cent of GDP) is pri-vate funding.
The countries that devoted most in 2009 in relation to their GDP were the USA, South
Korea, Canada and Chile, where 2.5 per cent of GDP was spent on tertiary education and research in higher education. Except for Ca-nada, however, in these countries it is because of private funding that such a large propor-tion of their GDP is spent on research. It is mainly in countries outside Europe that pri-vate funding predominates.
The proportion of private funding for ter-tiary education and research in higher educa-tion varies from less than 5 per cent in Den-mark, Finland and Norway to over 70 per cent in Chile, South Korea and the United King-dom. Sweden stands out among the Nordic countries with 9 per cent of its funding co-
0 5 000 10 000 15 000 20 000 25 000 30 000
0 5 000 10 000 15 000 20 000 25 000 30 000
United Kingdom
Germany
OECD average
Australia
France
Sweden
Switzerland
Belgium
Austria
Finland
Norway
Ireland
Netherlands
Canada
USA
USD adjusted for purchasing power
Courses and programmes
Ancillary services
Research
Figure 3. Education providers’ expenditure per student expressed in USD adjusted for purcha-sing power divided between different activities for the countries with the highest total expendit-ure in 2009 as well as the OECD average. Source: Table B1.2 in EAG 2012. Information about Denmark and Japan is not available.
0,0 0,5 1,0 1,5 2,0 2,5 3,0
0,0 0,5 1,0 1,5 2,0 2,5 3,0
Slovakia
Hungary*
Italy
Czech Republic
Germany
Iceland
Slovenia
United Kingdom
Spain
Switzerland*
Portugal
Norway
Mexico
Austria
Belgium
France
Poland
Japan
Israel
Estonia
OECD average
Australia
New Zealand
Ireland
Netherlands
Sweden
Denmark
Finland
Chile
Canada
South Korea
USA
Per cent
Public funding
Private funding
Figure 4. Investment by the OECD countries in 2009 in tertiary education and research in higher education from public funding and private sour-ces expressed as proportions of GDP. Source: Ta-ble B2.3, EAG 2012. Information about private funding is not available for Switzerland and Hungary.
SWEDEN IN AN INTERNATIONAL PERSPECTIVE 11
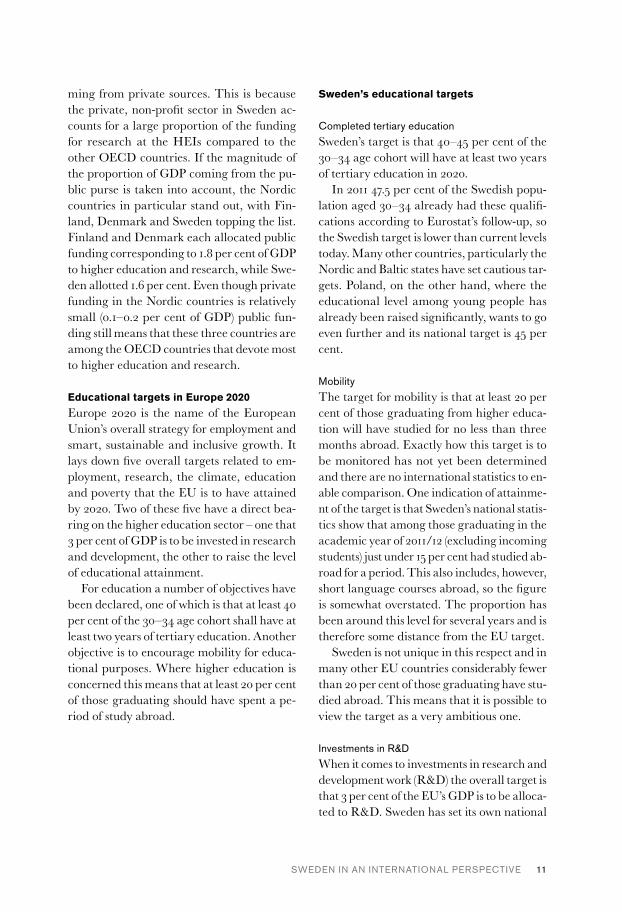
ming from private sources. This is because the private, non-profit sector in Sweden ac-counts for a large proportion of the funding for research at the HEIs compared to the other OECD countries. If the magnitude of the proportion of GDP coming from the pu-blic purse is taken into account, the Nordic countries in particular stand out, with Fin-land, Denmark and Sweden topping the list. Finland and Denmark each allocated public funding corresponding to 1.8 per cent of GDP to higher education and research, while Swe-den allotted 1.6 per cent. Even though private funding in the Nordic countries is relatively small (0.1–0.2 per cent of GDP) public fun-ding still means that these three countries are among the OECD countries that devote most to higher education and research.
Educational targets in Europe 2020Europe 2020 is the name of the European Union’s overall strategy for employment and smart, sustainable and inclusive growth. It lays down five overall targets related to em-ployment, research, the climate, education and poverty that the EU is to have attained by 2020. Two of these five have a direct bea-ring on the higher education sector – one that 3 per cent of GDP is to be invested in research and development, the other to raise the level of educational attainment.
For education a number of objectives have been declared, one of which is that at least 40 per cent of the 30–34 age cohort shall have at least two years of tertiary education. Another objective is to encourage mobility for educa-tional purposes. Where higher education is concerned this means that at least 20 per cent of those graduating should have spent a pe-riod of study abroad.
Sweden’s educational targets
Completed tertiary educationSweden’s target is that 40–45 per cent of the 30–34 age cohort will have at least two years of tertiary education in 2020.
In 2011 47.5 per cent of the Swedish popu-lation aged 30–34 already had these qualifi-cations according to Eurostat’s follow-up, so the Swedish target is lower than current levels today. Many other countries, particularly the Nordic and Baltic states have set cautious tar-gets. Poland, on the other hand, where the educational level among young people has already been raised significantly, wants to go even further and its national target is 45 per cent.
MobilityThe target for mobility is that at least 20 per cent of those graduating from higher educa-tion will have studied for no less than three months abroad. Exactly how this target is to be monitored has not yet been determined and there are no international statistics to en-able comparison. One indication of attainme-nt of the target is that Sweden’s national statis-tics show that among those graduating in the academic year of 2011/12 (excluding incoming students) just under 15 per cent had studied ab-road for a period. This also includes, however, short language courses abroad, so the figure is somewhat overstated. The proportion has been around this level for several years and is therefore some distance from the EU target.
Sweden is not unique in this respect and in many other EU countries considerably fewer than 20 per cent of those graduating have stu-died abroad. This means that it is possible to view the target as a very ambitious one.
Investments in R&DWhen it comes to investments in research and development work (R&D) the overall target is that 3 per cent of the EU’s GDP is to be alloca-ted to R&D. Sweden has set its own national

12 SWEDEN IN AN INTERNATIONAL PERSPECTIVE
target at 4 per cent, which means raising the level of ambition compared to today. Finland has also set itself the same target and the Aus-trian target is high as well, 3.76 per cent. For seven countries the target is 3 per cent (Bel-gium, Denmark, Germany, Estonia, Spain,
Per cent0,0 0,5 1,0 1,5 2,0 2,5 3,0 3,5 4,0
Spain
EU 27
Belgium
France
Estonia
Slovenia
Austria
Germany
Denmark
Iceland
Sweden
Finland
Figure 5. Member states’ investments in R&D ex-pressed as percentages of GDP. Source: Eurostat.
France and Slovenia) while the other member states have set lower targets.
For a long time Sweden has been one of the countries that has devoted most to R&D but the trend has declined since it peaked in 2001, when Sweden’s investment in R&D was 4.1 per cent of GDP. This is in spite of the in-clusion of companies with fewer than 50 em-ployees in the statistics since 2005. Finland overtook Sweden in 2009 and still devotes re-latively more than Sweden. Other countries that allocate relatively large proportions are Denmark, Iceland, Germany and Austria.
In the EU 62 per cent of the R&D was undertaken by the commercial sector in 2011, 24 per cent in HEIs and 13 per cent in go-vernmental institutions. In Sweden the com-mercial sector accounts for a larger share of R&D, 69 per cent, and the HEIs accounted for 26 per cent. Here the governmental re-search institutions are fairly few in number and only 4 per cent of the country’s research and development work takes place in them.


FACTS ABOUT HIGHER EDUCATION IN SWEDEN 15
Facts about higher education in Sweden

16 FACTS ABOUT HIGHER EDUCATION IN SWEDEN
HIGHER EDUCATION IN SWEDEN
Overall responsibilityIn Sweden, overall responsibility for higher education and research rests with the Riksdag (Swedish Parliament) and the Government. They decide on the regulations that apply to the higher-education area. They also deter-mine objectives, guidelines and the allocation of resources for the area.
The Ministry of Education and Research is responsible for issues relating to schools, HEIs, research, adult education, popular education and student finance. The public-sector HEIs are public agencies accountable to the Ministry of Education and Research. One exception is Sveriges Lantbruksuniver-sitet (Swedish University of Agricultural Sci-ences), which is accountable to the Ministry of Rural Affairs. Other agencies, such as Skol-verket (Swedish National Agency for Educa-tion), Universitetskanslersämbetet (Swedish Higher Education Authority), Universitets- och högskolerådet (Swedish Council for Hig-her Education) and Vetenskapsrådet (Swedish Research Council), are also accountable to the Ministry of Education and Research.
Higher education institutionsAll higher education is offered by public-sec-tor HEIs or by independent education pro-viders granted degree-awarding powers by the Government. Third-cycle courses and programmes are offered by universities and university colleges that have been granted en-titlement to award third-cycle qualifications.
There are 14 public-sector universities and 20 public-sector university colleges in Swe-den. In addition there are three independent HEIs that are entitled to award third-cycle qualifications: Chalmers University of Tech-nology, the Stockholm School of Economics and Jönköping University Foundation. There are also ten independent education providers entitled to award first-cycle, and in some cases second-cycle, qualifications as well as four in-
dependent course providers entitled to award qualifications in psychotherapy.
The Riksdag decides which public-sector HEIs are to exist. The Government can de-cide whether a HEI has university status.
The regulations that govern higher education institutionsIn Sweden, public-sector HEIs are agencies in their own right that report directly to the Go-vernment. The operations of HEIs are regula-ted by the laws and statutes that apply to the area of higher education. The HEIs are also subject to administrative and labour-market legislation and the provisions of the Instru-ment of Government. Their operations are also governed by the parameters and funding decided by the Riksdag and the Government.
The mission of the HEIs is to offer edu-cation based on an academic or artistic foo-ting and proven experience. They must also undertake development work, including re-search and artistic development. In addition, the HEIs must co-operate with their surroun-ding communities, provide information about their operations and also act to ensure that benefits are derived from the findings of their research.
Higher education in Sweden is governed by the Higher Education Act and the Higher Education Ordinance.
The Higher Education Act is enacted by the Riksdag and contains regulations about the operations of HEIs. These are often supp-lemented by the provisions laid down in the Higher Education Ordinance. The Higher Education Act contains basic regulations about the courses and programmes offered by HEIs. For instance, it sets out what should characterise these courses and programmes at the different levels and stipulates freedom of research. It provides a framework for the or-ganisation and governance of the HEIs, and states that every HEI must have a board of governors and a vice-chancellor.
FACTS ABOUT HIGHER EDUCATION IN SWEDEN 17
It also has regulations about the duties of teachers and contains provisions about stu-dent influence. HEIs must also foster equa-lity of opportunity and broaden recruitment.
The Higher Education Ordinance is laid down by the Government and is linked to the provisions of the Higher Education Act. For instance, the Ordinance states that students must be able to influence their courses and programmes. It contains regulations on en-trance qualifications and selection for courses and programmes, as well as the appointment of teachers and doctoral students. It also in-cludes regulations on course and programme syllabuses, grades and qualifications.
Annex 2 to the Higher Education Ordi-nance and the annexes to the Ordinances on the Swedish University of Agricultural Sci-ences and the Ordinance on the Swedish Na-tional Defence College are qualifications or-dinances that contain the descriptors for all qualifications.
Within these parameters, the HEIs are re-latively free to decide on their own organisa-tion, allocation of resources and course offe-rings. The system is based on the principle of management by objectives.
The Government lays down the directives for operations at the HEIs in their annual pu-blic-service agreements. The Swedish Higher Education Authority exercises supervision of the HEIs, which means ensuring their com-pliance with the statutes and regulations that apply to the higher-education area. The Swe-dish Higher Education Authority also reviews the quality of higher education and the effi-cient use of resources and public funding at the HEIs.
Allocation of resources to higher education institutionsThe Riksdag decides on funding for the HEIs. Resources are allocated to the institutions for first and second-cycle courses and program-mes on the basis of the number of students enrolled in each cycle, expressed in terms of
full-time equivalents (FTEs) and the number of credits attained (annual performance equi-valents). Every year the Government determi-nes a funding cap for the institutions, which lays down the maximum amount that can be paid to each HEI.
In June 2010 the Riksdag decided that re-sources for first and second-cycle program-mes are also to be allocated on the basis of the results of the Swedish Higher Education Authority’s quality evaluations. Institutions that receive the highest rating will be given the incentive of additional funding (quality funding). Quality based allocation of resour-ces will apply to public sector HEIs as well as Chalmers University of Technology and Jön-köping University Foundation and has taken effect in 2013.
The direct funding for research and third-cycle courses and programmes is based main-ly on past allocations, but since 2009 10 per cent of the funding and new resources are al-located on the basis of two quality indicators. These are publications and citations and re-search funding from external sources.
The Swedish University of Agricultur-al Sciences has a special budgeting and re-porting system in which funding for research, courses and programmes is allocated for a th-ree-year period together with the educational targets for the same period.
Degree-awarding powersIn order to be able to award a specific regu-lated qualification, the institution organising a programme – whether it is accountable to the state or independent – is required to have degree-awarding powers, i.e. special permis-sion to award this particular qualification.
Universities are entitled to award first, se-cond and third-cycle general qualifications. The public-sector university colleges have a general entitlement to award Higher Educa-tion Diplomas, Bachelor’s degrees and 60-cre-dit Master’s degrees. Those granted entitle-ment to award third-cycle qualifications
18 FACTS ABOUT HIGHER EDUCATION IN SWEDEN
within one or more specified fields according to the new regulations that apply from 2010 are also entitled to award 120-credit Master’s degrees in the field specified. The Higher Education Act stipulates, however, that each HEI has the right to apply to the Swedish Higher Education Authority for entitlement to award 120-credit Master’s degrees in one or more main fields of study.
In other cases the Government or the Swe-dish Higher Education Authority decides on entitlement to award general qualifications. In the case of first and second-cycle profes-sional qualifications and qualifications in the fine, applied and performing arts in every cy-cle, both universities and university colleges have to apply to the Swedish Higher Educa-tion Authority for degree-awarding powers. In addition, university colleges have to apply to the Swedish Higher Education Authority for entitlement to award third-cycle qualifi-cations. Independent education providers have to apply to the Government for degree-awarding powers. This is also the case for the Swedish University of Agricultural Sciences and the National Defence College. The qua-lifications that may be awarded by the Swe-dish University of Agricultural Sciences are listed in an annex to the Ordinance for the Swedish University of Agricultural Sciences and the qualifications that may be awarded by the National Defence College in an annex to the Ordinance for the Swedish National Defence College.
THE STRUCTURE OF PROGRAMMES AND QUALIFICATIONSThe Swedish Higher Education Act and Hig-her Education Ordinance have been amended in accordance with the agreements reached within the framework of the Bologna Process, including the European Qualifications Fram-ework (QF-EHEA). These amendments apply to courses and programmes offered from 1
July 2007 as well as to qualifications awar-ded after that date. Courses and programmes that started earlier are subject to transitional provisions.
CyclesAll courses, programmes and qualifications are ascribed to three cycles: first, second and third. There is progression, i.e. each cycle is based on the former. The formal require-ments that distinguish these cycles are speci-fied in the Higher Education Act.
All first and second-cycle educational of-ferings consist of courses. These courses can be combined to form programmes.
Higher-education creditsAn academic year that comprises 40 weeks of full-time study corresponds to 60 HE credits. The number of HE credits awarded for each course is determined by the amount of study normally required to attain its objectives.
The HE credits awarded in higher educa-tion in Sweden can be compared to Europe-an Credit Transfer and Accumulation System (ECTS) credits, where 60 ECTS credits are attained after one academic year of full-time study.
Categories of qualificationsThere are three categories of qualifications:1. General qualifications2. Qualifications in the fine, applied and per-forming arts3. Professional qualifications.
Professional qualifications are awarded within the first and second cycles and mainly in the regulated professions on the basis of the appropriate requirements.
Both general qualifications and qualifica-tions in the fine, applied and performing arts are assigned to the first, second or third cycle. Third-cycle qualifications in the fine, applied and performing arts were introduced on 1 Ja-nuary 2010.
FACTS ABOUT HIGHER EDUCATION IN SWEDEN 19
Of the professional qualifications awar-ded in the second cycle, the Postgraduate Diplomas in Midwifery, Specialist Nursing, Psychotherapy, Special Needs Teaching and Special Educational Needs require a previous qualification. Other programmes that lead to the award of a professional qualification in the second cycle are undivided, i.e. are not split between the cycles. The Swedish system dif-fers from many others in this respect.
In addition to the programmes that lead to the award of qualifications, higher educa-tion in Sweden offers a wide range of freestan-ding courses, of which many are offered in the form of distance learning. Students may se-lect their own combinations of these courses. If these combinations meet the requirements laid down in the qualitative targets, a general qualification may be awarded.
ADMISSION TO HIGHER EDUCATIONSweden has a more uniform system of ad-mission to higher education than many other countries. National admission regulations are laid down in the Higher Education Act, the Higher Education Ordinance and the regula-tions issued by the Swedish Higher Education Authority. The detailed national regulations apply mainly to the admission of HE entrants to first-cycle courses and programmes. There are also regulations on admission to second and third-cycle courses and programmes, but these are less comprehensive.
Specific prior knowledge is required for ad-mission to higher education. Those who have the required knowledge qualify for entry. En-try requirements can be either general or spe-cific. The general entry requirements apply to all courses and programmes in higher edu-cation; specific (additional) entry require-ments are also demanded for many courses and programmes. All first-cycle courses and programmes, apart from those that lead to the award of a qualification in the fine, app-
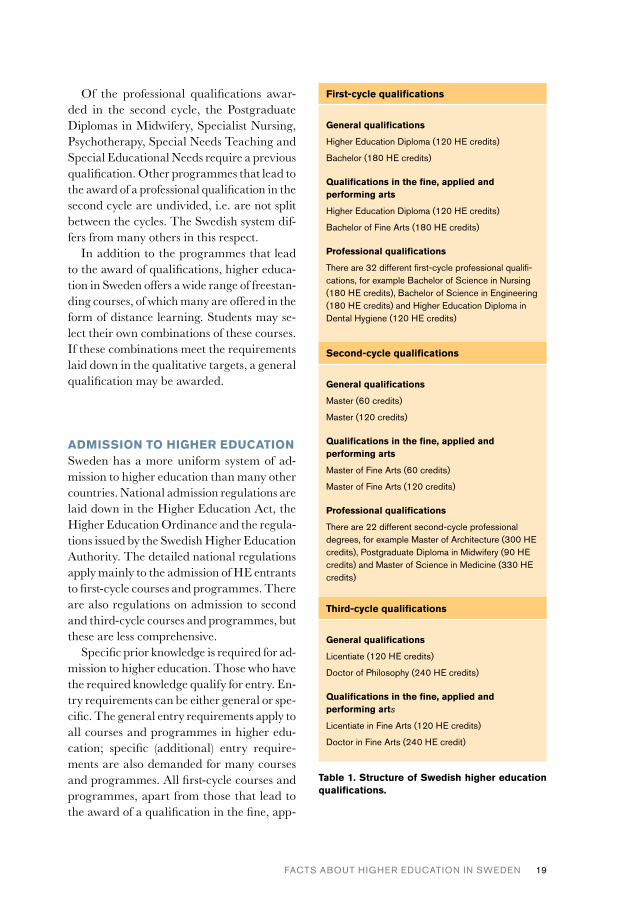
First-cycle qualifications
General qualifications
Higher Education Diploma (120 HE credits)
Bachelor (180 HE credits)
Qualifications in the fine, applied and performing arts
Higher Education Diploma (120 HE credits)
Bachelor of Fine Arts (180 HE credits)
Professional qualifications
There are 32 different first-cycle professional qualifi-cations, for example Bachelor of Science in Nursing (180 HE credits), Bachelor of Science in Engineering (180 HE credits) and Higher Education Diploma in Dental Hygiene (120 HE credits)
Second-cycle qualifications
General qualifications
Master (60 credits)
Master (120 credits)
Qualifications in the fine, applied and performing arts
Master of Fine Arts (60 credits)
Master of Fine Arts (120 credits)
Professional qualifications
There are 22 different second-cycle professional degrees, for example Master of Architecture (300 HE credits), Postgraduate Diploma in Midwifery (90 HE credits) and Master of Science in Medicine (330 HE credits)
Third-cycle qualifications
General qualifications
Licentiate (120 HE credits)
Doctor of Philosophy (240 HE credits)
Qualifications in the fine, applied and performing arts
Licentiate in Fine Arts (120 HE credits)
Doctor in Fine Arts (240 HE credit)
Table 1. Structure of Swedish higher education qualifications.
20 FACTS ABOUT HIGHER EDUCATION IN SWEDEN
lied and performing arts, use more or less the same selection criteria. These are based mainly on school-leaving grades or results from the Swedish Scholastic Aptitude Test.
The Higher Education Ordinance stipula-tes the general entry requirements that apply for all courses and programmes, as well as listing any selection criteria that may be in-voked. It also contains regulations on the eva-luation of final school grades.
The Government has decided that the Swedish Council for Higher Education is to issue further regulations regarding admissi-on, for example concerning applicants with foreign grades. The vast majority of admis-sions are pooled. The Swedish Council for Higher Education is responsible for pooled admissions on behalf of the HEIs, but the in-dividual HEIs decide on the admission of stu-dents. An appeal may be made to the Higher Education Appeals Board against a HEI’s ad-mission decision regarding eligibility but not regarding selection.
TUITION FEESFor a long time Sweden was one of the few countries in Europe in which higher educa-tion was completely free of charge for both Swedish students and those from other countries. In June 2010 the Riksdag enacted
a provision in the Higher Education Act that means that higher education is free for Swe-dish citizens and for citizens of the EU/EEA countries and Switzerland. Citizens of other countries, “third country students”, have to pay an application fee and tuition fees for first and second-cycle higher education courses and programmes starting from the autumn semester of 2011. The HEIs are required to charge tuition fees that cover their costs in full for these students.
STUDENT FINANCEIt is possible for students to obtain financial support from the state if they meet the stipu-lated requirements. Student finance consists of a combination of study grants and study lo-ans. In 2013 the grant portion of student finan-ce for an academic year of 40 weeks amounts to SEK 28,280 and the loan ceiling to SEK 61,960. The maximum total available govern-ment-sponsored student finance for an indi-vidual student pursuing fulltime studies thus amounts to SEK 90,240 per annum. Student finance can be paid for a maximum of 12 se-mesters or 6 academic years.
Repayment of the loan element is based on an annuity system and in normal cases the to-tal debt should have been repaid in 25 years or before the borrower reaches the age of 60.
TRENDS AND DEVELOPMENTS 23
Trends and developments

24 TRENDS AND DEVELOPMENTS
FIRST AND SECOND-CYCLE COURSES AND PROGRAMMES
Applications and admissionsThe number of applicants for the autumn semester of 2012 with no prior experience of higher education totalled 126,000. This is the highest figure ever recorded and an increase of 8 per cent compared to the previous year. Seen from a longer perspective, the number of new applicants has remained at a high level for the last four years.
Over 27 per cent of all 19-year-olds in the population applied for places in higher educa-tion for the autumn semester of 2012.
The gender ratio for applicants with no prior experience of higher education for the autumn semester of 2012 was 58 per cent wo-men and 42 per cent men.
The number of Swedish students with no prior experience of higher education who were admitted for the autumn semester of 2012 totalled 59,800. This is a slight increase of 1 per cent compared to the autumn semes-ter of 2011.
The largest age group among those admit-ted with no prior experience of higher educa-tion was composed of 19-year-olds, who con-stituted 32 per cent of the total number for the autumn semester of 2012. This is 2 per cent fewer than for the previous autumn semester. The 19-year-old age group was also the one in which the largest proportion of applicants were admitted – 56 per cent of all 19-year-olds who applied were admitted for the autumn semester of 2012.
The total number of applicants is always greater than the total number of admissions. The difference cannot, however, be interpre-ted as a direct measure of how much greater demand for higher education is than the supp-ly. On the one hand there are major differen-ces in supply and demand between different programmes and, on the other, application and admission is a long and complex process in which populations vary. Not all applicants
have the right qualifications, some of those admitted turn down their places in some se-lections and some students beginning their studies have not applied through the admis-sions system.
Fewer international applications after the introduction of tuition fees From the autumn of 2011 and onwards app-licants from countries outside the EU/EEA and Switzerland who are not participating in exchange programmes have to pay both an application fee when they apply and then tuition fees before they may start their stu-dies. The regular admissions round in 2010 received 14,000 applications from individuals who did not have complete civic registration numbers, i.e. who were international appli-cants. For the autumn semester of 2011 the number of applicants of this kind received in the regular admissions round declined consi-derably (by 64 per cent) to 5,000, but for the autumn semester of 2012 there was a rise to 6,500, which is still fewer than before the in-troduction of fees.
Since the autumn semester of 2008 there have been two admission rounds – in addition to the regular admission round – intended for international students. One round compri-
Totals
Applications
Admissions
0
20 000
40 000
60 000
80 000
100 000
120 000
140 000
201220102008200620042002
Figure 6. Number of students who have not pre-viously participated in higher education in Swe-den, 2002–2012.
TRENDS AND DEVELOPMENTS 25
ses international courses and first-cycle pro-grammes, the other international 120-credit Master’s programmes. The number of appli-cants in both rounds rose substantially bet-ween 2008 and 2010, but after the introduc-tion of fees for the autumn of 2011 this number has declined dramatically. Compared to the autumn semester of 2010, the number of app-licants to international courses and program-mes declined by 86 per cent for the autumn semester of 2011, while the numbers apply-ing for international 120-credit Master’s pro-grammes dropped by 81 per cent.
The number of applications for internatio-nal courses and programmes for the autumn semester of 2012 declined even further by 3 per cent, while the number of applications for international 120-credit Master’s program-mes rose by 25 per cent. Nevertheless, both these rounds still attracted fewer applicants than before the autumn of 2010.
Not all the applicants in the international admission rounds have to pay fees, however. Some 30 per cent of the applicants to inter-national courses and programmes for the au-tumn semester of 2012 were required to pay fees, which was lower than the figure for the previous autumn semester, when 48 per cent were liable to pay fees. The corresponding figures for applicants to 120-credit Master’s programmes were 40 per cent for the autumn semester of 2012 compared to 47 per cent for the autumn of 2011. It is obvious that fees have led to a marked reduction in the number of international applications.
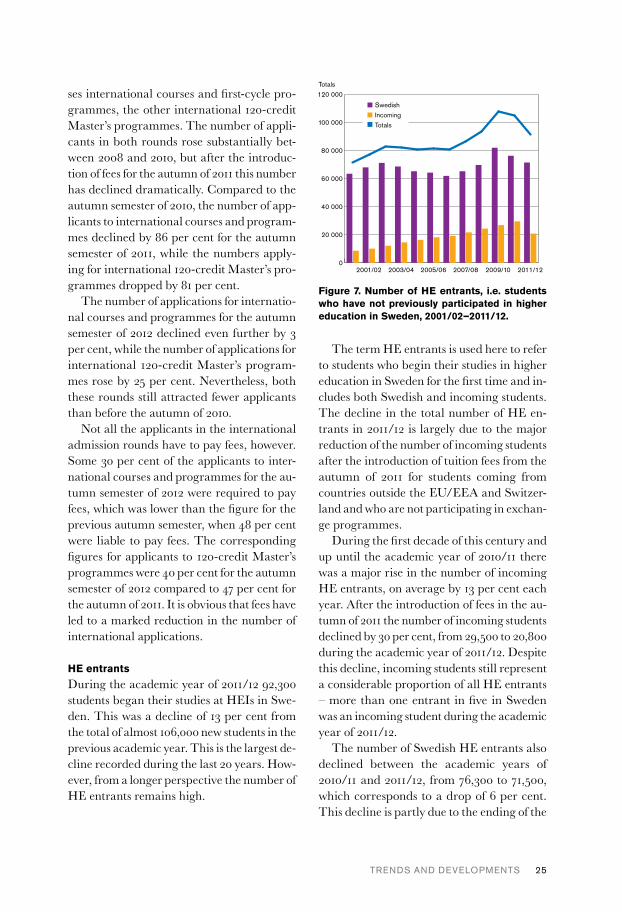
HE entrantsDuring the academic year of 2011/12 92,300 students began their studies at HEIs in Swe-den. This was a decline of 13 per cent from the total of almost 106,000 new students in the previous academic year. This is the largest de-cline recorded during the last 20 years. How-ever, from a longer perspective the number of HE entrants remains high.
The term HE entrants is used here to refer to students who begin their studies in higher education in Sweden for the first time and in-cludes both Swedish and incoming students. The decline in the total number of HE en-trants in 2011/12 is largely due to the major reduction of the number of incoming students after the introduction of tuition fees from the autumn of 2011 for students coming from countries outside the EU/EEA and Switzer-land and who are not participating in exchan-ge programmes.
During the first decade of this century and up until the academic year of 2010/11 there was a major rise in the number of incoming HE entrants, on average by 13 per cent each year. After the introduction of fees in the au-tumn of 2011 the number of incoming students declined by 30 per cent, from 29,500 to 20,800 during the academic year of 2011/12. Despite this decline, incoming students still represent a considerable proportion of all HE entrants – more than one entrant in five in Sweden was an incoming student during the academic year of 2011/12.
The number of Swedish HE entrants also declined between the academic years of 2010/11 and 2011/12, from 76,300 to 71,500, which corresponds to a drop of 6 per cent. This decline is partly due to the ending of the
Totals
0
20 000
40 000
60 000
80 000
100 000
120 000
2011/122009/102007/082005/062003/042001/02
SwedishIncomingTotals
Figure 7. Number of HE entrants, i.e. students who have not previously participated in higher education in Sweden, 2001/02–2011/12.
26 TRENDS AND DEVELOPMENTS
temporary expansion of higher education by almost 10,000 places during the period 2010–2011 - one of the measures taken to cope with the economic downturn.
The statistics for the autumn semester of 2012 indicate that the decline in the total number of HE entrants has levelled out and that in principle the total will be the same as for the autumn semester of 2011. The number of Swedish HE entrants has gone down by 2 per cent while there has been a rise of 6 per cent for incoming HE entrants for the autumn semester of 2012.
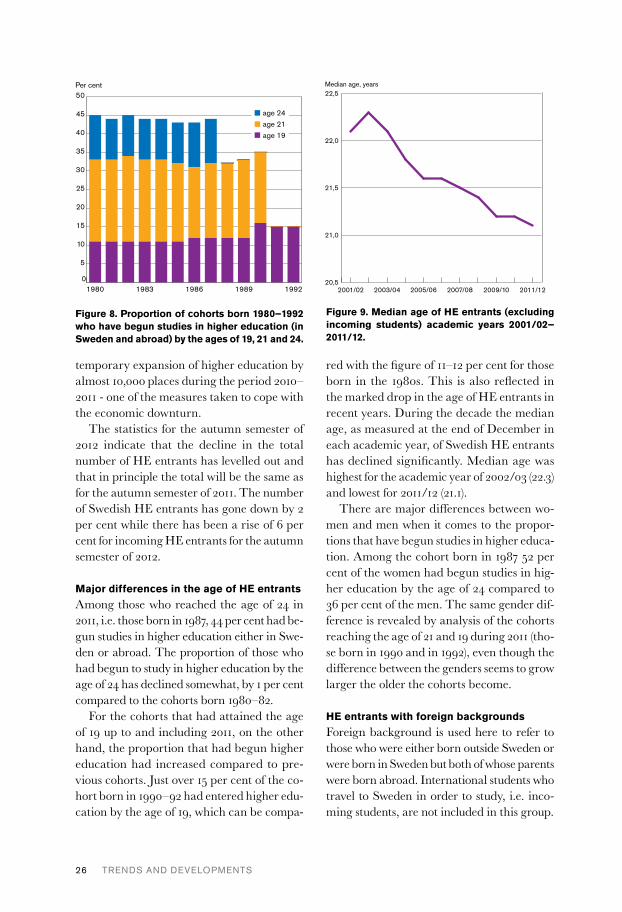
Major differences in the age of HE entrantsAmong those who reached the age of 24 in 2011, i.e. those born in 1987, 44 per cent had be-gun studies in higher education either in Swe-den or abroad. The proportion of those who had begun to study in higher education by the age of 24 has declined somewhat, by 1 per cent compared to the cohorts born 1980–82.
For the cohorts that had attained the age of 19 up to and including 2011, on the other hand, the proportion that had begun higher education had increased compared to pre-vious cohorts. Just over 15 per cent of the co-hort born in 1990–92 had entered higher edu-cation by the age of 19, which can be compa-
red with the figure of 11–12 per cent for those born in the 1980s. This is also reflected in the marked drop in the age of HE entrants in recent years. During the decade the median age, as measured at the end of December in each academic year, of Swedish HE entrants has declined significantly. Median age was highest for the academic year of 2002/03 (22.3) and lowest for 2011/12 (21.1).
There are major differences between wo-men and men when it comes to the propor-tions that have begun studies in higher educa-tion. Among the cohort born in 1987 52 per cent of the women had begun studies in hig-her education by the age of 24 compared to 36 per cent of the men. The same gender dif-ference is revealed by analysis of the cohorts reaching the age of 21 and 19 during 2011 (tho-se born in 1990 and in 1992), even though the difference between the genders seems to grow larger the older the cohorts become.
HE entrants with foreign backgroundsForeign background is used here to refer to those who were either born outside Sweden or were born in Sweden but both of whose parents were born abroad. International students who travel to Sweden in order to study, i.e. inco-ming students, are not included in this group.
Per cent
0
5
10
15
20
25
30
35
40
45
50
19921989198619831980
age 24 age 21 age 19
Figure 8. Proportion of cohorts born 1980–1992 who have begun studies in higher education (in Sweden and abroad) by the ages of 19, 21 and 24.
Median age, years
20,5
21,0
21,5
22,0
22,5
2011/122009/102007/082005/062003/042001/02
Figure 9. Median age of HE entrants (excluding incoming students) academic years 2001/02–2011/12.
TRENDS AND DEVELOPMENTS 27
The total number of HE entrants with fo-reign backgrounds in Swedish HEIs in the academic year of 2011/12 was 13,100. Most of them, 59 per cent, were women, a similar proportion as for those with Swedish back-grounds, where 57 per cent were women in the same year. Even though students with fo-reign backgrounds constitute a growing pro-portion of HE entrants, a smaller proportion from this group go into higher education after leaving school than among those with Swe-dish backgrounds.
Parents’ education In the academic year of 2011/12 36 per cent of HE entrants under 35 had parents with ad-vanced educational qualifications, i.e. at least one parent who had completed three years of tertiary education. Among the population aged 19–34 the corresponding figure was 24 per cent. This difference can be viewed as an overall measure of bias in recruitment to higher education.
In addition to the influence of parental educational qualifications on the decision to begin studies in higher education or not, they also influence the kinds of programmes chosen, as the proportions of students whose parents have advanced educational qualifi-cations varies among them. The proportion of HE entrants whose parents have advan-ced educational qualifications is largest in programmes that demand high grades for admission.
Fewer entrants on 120 credit Master’s programmes First and second-cycle studies can consist of either freestanding courses or degree pro-grammes. About half of all the HE entrants, i.e. with the inclusion of incoming students, took freestanding courses only during their first year of study and half were pursuing a degree programme.
Entrants to degree programmes may well, however, have prior experience of higher edu-
cation. Indeed this is a necessity for entrants to 60-credit and 120-credit Master’s program-mes for which possession of a Bachelor’s de-gree is an entry requirement.
Since the introduction of 120-credit Master’s programmes in 2007, the numbers beginning these programmes increased annu-ally until the academic year of 2010/11, when there were 14,600 entrants. Incoming students have been in the majority on these program-mes ever since 2007 and they accounted for 61 per cent of those starting these programmes in the academic year of 2010/11. The signifi-cant decline in the number of incoming stu-dents for the academic year of 2011/12 refer-red to above also had a major impact on the numbers beginning 120-credit Master’s pro-grammes. In the academic year of 2011/12 the number of beginners on these programmes fell to 10,100, a reduction of 31 per cent com-pared to the previous year. This is due enti-rely to the decline in the number of incoming students (62 per cent fewer), which means that from 2011/12 incoming students account for a considerably smaller proportion of those be-ginning 120-credit Master’s programmes (34 per cent) than before.
The trend in the number of students begin-ning the new 60-credit Master’s programmes introduced in the academic year 2007/08 de-scribes the same pattern as for those starting 120-credit Master’s programmes and has also been affected by the decline in the number of incoming students after the introduction of tuition fees.
Even though the numbers of incoming stu-dents have declined in both 60-credit and 120-credit Master’s programmes, they help to even the gender balance among entrants to these programmes, as the proportion of men is considerably larger among incoming students than among their Swedish counterparts.
Bachelor’s programmes are by far the most numerous among those leading to the award of a general qualification. The proportion of incoming students on these programmes is,

28 TRENDS AND DEVELOPMENTS
however, small. The number of entrants to Bachelor’s programmes in the academic year of 2011/12 amounted to 26,000, which was 3 per cent lower than in the previous academic year.
The studentsHE entrants form only a small proportion of all the students in higher education. In addi-tion to the HE entrants, the student popula-tion also comprises students continuing their studies from previous years and those retur-ning after several years of absence. Altogether 357,000 students participated at one time or another in first and second-cycle courses and programmes during the autumn semester of 2012 and 26,000 of them were incoming stu-dents, 14 per cent fewer than in the autumn of 2011.
Altogether the incoming students accoun-ted for 7 per cent of the entire student popula-tion, which can be compared with 10 per cent during the autumn semester of 2010, the last in which there were no tuition fees.
In the autumn semester of 2011 the total number of students dropped by 6,600 and this decline continued in the autumn of 2012 by another 5,600, i.e. just under 2 per cent. Abo-ve all there was a reduction of the number of men among incoming students, in the autumn of 2012 by 3,200. The number of women also dropped but somewhat less, among Swedish students by 1,600 and incoming students by 1,000. On the other hand the number of Swe-dish men rose by 200.
Viewed from a longer time perspective, the number of students in higher education in Sweden is still high. In the 1950s there were fewer than 50,000 students in higher educa-tion and at the end of the 1960s just over 100,000. The 1977 Higher Education Reform led to the incorporation of programmes with a further 46,000 students into the higher edu-cation sector and at the beginning of the 1980s the student population totalled 150,000. The 1990s saw the expansion of higher education and the number of students rose by 15,000–
20,000 annually to reach 260,000 in the late 1990s, when the rate of expansion began to slow down. In the early years of this century another rapid expansion of higher education began and the number of students rose to over 300,000.
There are more women among the stu-dents than men. The proportion of women has grown gradually since the 1977 Higher Education Reform, which incorporated pro-grammes in which women predominated, for instance in education and health scienc-es, into the higher education sector. Since the beginning of this century the gender ratio has remained constant in principle with 40 per cent men and 60 per cent women.
Decline in the number of distance students In recent years the distinction between on-campus teaching and distance education has become increasingly vague as the technology and the methodology initially used only for distance education is now also used on cam-pus. Distance programmes are defined for statistical purposes as programmes in which teachers and students are mainly separated in time and/or place. This means that both totally web-based programmes in which there are no meetings and programmes with occa-
Totals
Total
Women
0
50 000
100 000
150 000
200 000
250 000
300 000
350 000
400 000
20122007200219971992198719821977
Men
Figure 10. Number of students registered in first and second-cycle courses and programmes each autumn semester 1977–2012.

TRENDS AND DEVELOPMENTS 29
sional meetings, for instance those offered in local study centres, are included.
The number of students taking only on-campus courses rose during the early years of this century to its highest total of just over 288,000 in the autumn of 2003. Since then this number has declined and in the autumn of 2012 amounted to just under 274,000 stu-dents.
The number of students combining dis-tance education with on-campus teaching has more than tripled since the beginning of the century. The highest figure so far was reached in the autumn of 2010 when just over 21,000 students combined both forms of study.
The number of students opting for distance education alone has also risen since the be-ginning of the century from just over 18,000 in 2000 to just under 68,000 in the autumn of 2011.
Just as in on-campus teaching, a larger pro-portion of women are students than men. This applies in particular for those who are solely distance students but is also true of those who combine distance education with on-campus study.
Almost half of the students who are solely distance students have a previous higher edu-cation qualification. They are mainly taking
freestanding courses and only a few pursue degree programmes.
Qualifications awardedDuring the academic year of 2011/12 69,800 higher education qualifications were awar-ded and the numbers graduating totalled al-
0
50 000
100 000
150 000
200 000
250 000
300 000
350 000
400 000
20122009200620032000
Totals
Only distance Distance + on-campus Only on-campus
Figure 11. Numbers of students registered au-tumn semesters 1999–2012 per form of study.
Students with functional impairmentsThe Swedish Discrimination Act lays down that HEIs must actively ensure equal rights for stu-dents and applicants irrespective of functio-nal impairments, for instance. The Government has given Stockholm University the task of al-locating funding for special educational sup-port for students with functional impairments to the other HEIs.
Stockholm University’s report states that during 2012 there were about 9,400 students with functional impairments in higher educa-tion. These are students who have been in con-tact with the HEIs’ coordinators for students with functional impairments or have come to their attention in some other way. This means that the HEIs are now reporting almost 4,000 more known cases of students with functional impairments than they did five years ago. As the HEIs increase general accessibility a rising number of students with functional impairments will not be included in these statistics. About 65 per cent of this group were women and 35 per cent men, which means that the proportion of women is somewhat larger than in the student population as a whole.
About 8,600 of the 9,400 students with functional impairments received special edu-cational support, i.e. individual assistance to compensate for functional impairment or the specific measures these students are offered in groups.
During 2012 the Swedish National Agency for Higher Education (Högskoleverket) compiled a special presentation of the results concerning the HEIs’ measures for students with functional impairments from its supervisory visits during the period 2002–2012. The Agency noted that the number of students with dyslexia was rising every year. The same applied to students with neuropsychiatric impairments.

30 TRENDS AND DEVELOPMENTS
most 59,000. The numbers of qualifications awarded and graduates therefore remains high compared to previous academic years. There has, admittedly, been a slight decline in relation to the peak year of 2010/11 – the number of qualifications dropped by 1,700 and the number of graduates by 1,900 – but then the delayed reports normally submitted in the following year have not been included for the most recent academic year.
One factor that has been significant for the development in the number of qualifications awarded in the two most recent academic
years is that there was an appreciable rise in the number of teaching qualifications awar-ded in the academic year of 2010/11. During this academic year many qualifications were awarded to teachers who had not previous-ly applied for the award of their certificates, mainly as a result of the announced require-ment that qualified teacher status would be demanded for those employed as teachers (a reform that was later postponed until Decem-ber 2013). The number of these applications then declined substantially in the academic year of 2011/12. As teaching qualifications constitute the largest number of professional qualifications awarded, this change has had a major impact on the total number of quali-fications awarded during the year.
Most graduates were women aged 25-29 The majority of the students who graduated during the academic year of 2011/12 were wo-men, 63 per cent, and 37 per cent were men. There was a slight decline in the proportion of women compared to the previous five acade-mic years, when between 65 and 66 per cent of those graduating were women. One explana-tion for this is the major drop in the number of teaching qualifications awarded – of which 80 per cent are to women – in the most recent academic year.
The largest group of graduates during the academic year of 2011/12, about 40 per cent, comprised those aged 25–29. Just under a quarter were 24 or less while about one-third were 30 or older. The median age among gra-duates was 27 for both women and men. The median age for men has been the same for the last ten years while the median for wo-men has varied between 27 and 28 during the same period.
More general qualifications – fewer professional qualifications Since 2007 there have been three categories of qualifications: professional qualifications, ge-neral qualifications and qualifications in the
National minoritiesIn its budget bill for 2013 the Government has allocated specific funding to guarantee the provision of teachers for the national minority languages. A number of the national minority languages, Finnish, Sami, Meänkeli (Tornedal Finnish), Romany Chib and Yiddish, are cur-rently subjects in which higher education is of-fered but they have few students.
The Government views this as a disturbing development as teachers are needed in the education system who can teach these langu-ages as well as in them, if the national minority languages are to be able to survive and deve-lop and so that children and young people can be offered teaching in their minority languages.
To guarantee a supply of teachers for the na-tional minority languages the Government has therefore decided that certain HEIs should be given specific assignments – national re-sponsibility – for establishing and developing programmes to train teachers for secondary education in the national minority languages. Currently no HEI is entitled to award teaching qualifications for upper-secondary education in Sami, Meänkeli, Romay Chib or Yiddish. In April 2013 Stockholm University was awarded entitlement to issue teaching qualifications for teachers in secondary education in Finnish as a first language.
The Government has also decided to link spe-cific funds for work with the different national responsibilities.
TRENDS AND DEVELOPMENTS 31
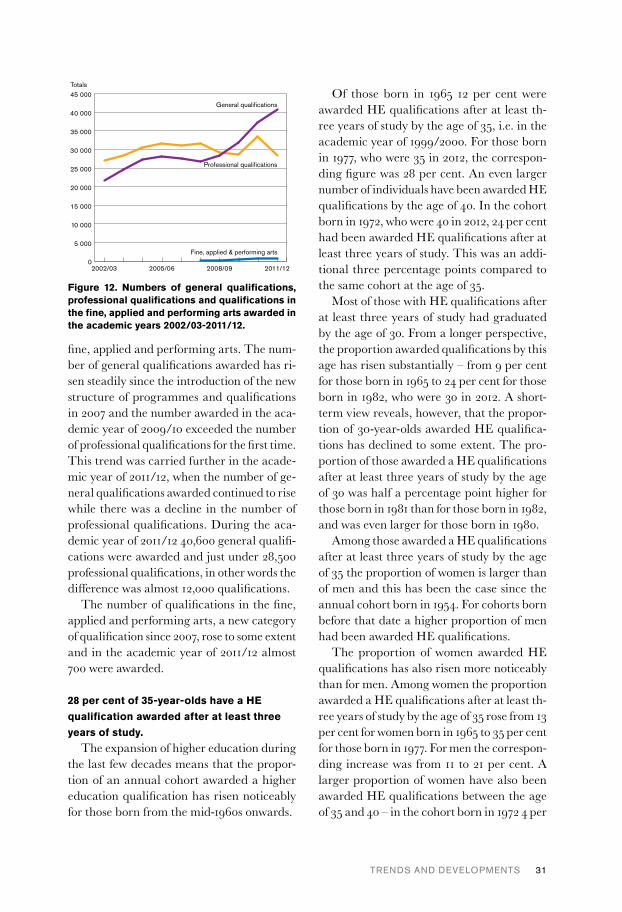
fine, applied and performing arts. The num-ber of general qualifications awarded has ri-sen steadily since the introduction of the new structure of programmes and qualifications in 2007 and the number awarded in the aca-demic year of 2009/10 exceeded the number of professional qualifications for the first time. This trend was carried further in the acade-mic year of 2011/12, when the number of ge-neral qualifications awarded continued to rise while there was a decline in the number of professional qualifications. During the aca-demic year of 2011/12 40,600 general qualifi-cations were awarded and just under 28,500 professional qualifications, in other words the difference was almost 12,000 qualifications.
The number of qualifications in the fine, applied and performing arts, a new category of qualification since 2007, rose to some extent and in the academic year of 2011/12 almost 700 were awarded.
28 per cent of 35-year-olds have a HE qualification awarded after at least three years of study.
The expansion of higher education during the last few decades means that the propor-tion of an annual cohort awarded a higher education qualification has risen noticeably for those born from the mid-1960s onwards.
Of those born in 1965 12 per cent were awarded HE qualifications after at least th-ree years of study by the age of 35, i.e. in the academic year of 1999/2000. For those born in 1977, who were 35 in 2012, the correspon-ding figure was 28 per cent. An even larger number of individuals have been awarded HE qualifications by the age of 40. In the cohort born in 1972, who were 40 in 2012, 24 per cent had been awarded HE qualifications after at least three years of study. This was an addi-tional three percentage points compared to the same cohort at the age of 35.
Most of those with HE qualifications after at least three years of study had graduated by the age of 30. From a longer perspective, the proportion awarded qualifications by this age has risen substantially – from 9 per cent for those born in 1965 to 24 per cent for those born in 1982, who were 30 in 2012. A short-term view reveals, however, that the propor-tion of 30-year-olds awarded HE qualifica-tions has declined to some extent. The pro-portion of those awarded a HE qualifications after at least three years of study by the age of 30 was half a percentage point higher for those born in 1981 than for those born in 1982, and was even larger for those born in 1980.
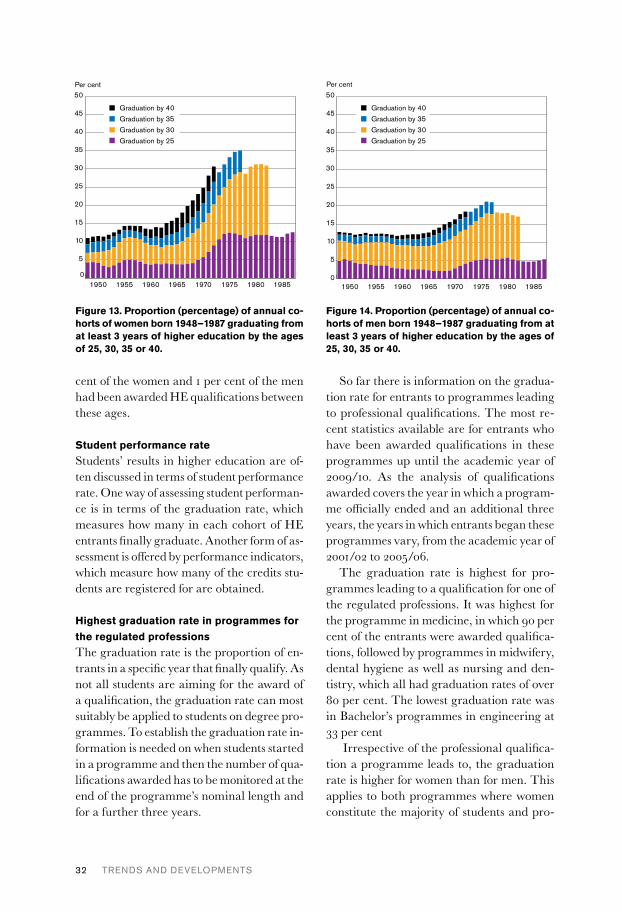
Among those awarded a HE qualifications after at least three years of study by the age of 35 the proportion of women is larger than of men and this has been the case since the annual cohort born in 1954. For cohorts born before that date a higher proportion of men had been awarded HE qualifications.
The proportion of women awarded HE qualifications has also risen more noticeably than for men. Among women the proportion awarded a HE qualifications after at least th-ree years of study by the age of 35 rose from 13 per cent for women born in 1965 to 35 per cent for those born in 1977. For men the correspon-ding increase was from 11 to 21 per cent. A larger proportion of women have also been awarded HE qualifications between the age of 35 and 40 – in the cohort born in 1972 4 per
Totals
General qualifications
0
5 000
10 000
15 000
20 000
25 000
30 000
35 000
40 000
45 000
2011/122008/092005/062002/03
Fine, applied & performing arts
Professional qualifications
Figure 12. Numbers of general qualifications, professional qualifications and qualifications in the fine, applied and performing arts awarded in the academic years 2002/03-2011/12.
32 TRENDS AND DEVELOPMENTS
cent of the women and 1 per cent of the men had been awarded HE qualifications between these ages.
Student performance rateStudents’ results in higher education are of-ten discussed in terms of student performance rate. One way of assessing student performan-ce is in terms of the graduation rate, which measures how many in each cohort of HE entrants finally graduate. Another form of as-sessment is offered by performance indicators, which measure how many of the credits stu-dents are registered for are obtained.
Highest graduation rate in programmes for the regulated professions The graduation rate is the proportion of en-trants in a specific year that finally qualify. As not all students are aiming for the award of a qualification, the graduation rate can most suitably be applied to students on degree pro-grammes. To establish the graduation rate in-formation is needed on when students started in a programme and then the number of qua-lifications awarded has to be monitored at the end of the programme’s nominal length and for a further three years.
So far there is information on the gradua-tion rate for entrants to programmes leading to professional qualifications. The most re-cent statistics available are for entrants who have been awarded qualifications in these programmes up until the academic year of 2009/10. As the analysis of qualifications awarded covers the year in which a program-me officially ended and an additional three years, the years in which entrants began these programmes vary, from the academic year of 2001/02 to 2005/06.
The graduation rate is highest for pro-grammes leading to a qualification for one of the regulated professions. It was highest for the programme in medicine, in which 90 per cent of the entrants were awarded qualifica-tions, followed by programmes in midwifery, dental hygiene as well as nursing and den-tistry, which all had graduation rates of over 80 per cent. The lowest graduation rate was in Bachelor’s programmes in engineering at 33 per cent
Irrespective of the professional qualifica-tion a programme leads to, the graduation rate is higher for women than for men. This applies to both programmes where women constitute the majority of students and pro-
Per cent
0
5
10
15
20
25
30
35
40
45
50
19851980197519701965196019551950
Graduation by 40Graduation by 35Graduation by 30Graduation by 25
Figure 13. Proportion (percentage) of annual co-horts of women born 1948–1987 graduating from at least 3 years of higher education by the ages of 25, 30, 35 or 40.
Per cent
0
5
10
15
20
25
30
35
40
45
50
19851980197519701965196019551950
Graduation by 40 Graduation by 35 Graduation by 30 Graduation by 25
Figure 14. Proportion (percentage) of annual co-horts of men born 1948–1987 graduating from at least 3 years of higher education by the ages of 25, 30, 35 or 40.
TRENDS AND DEVELOPMENTS 33
grammes in which men are in a majority. The greatest difference was in programmes in so-cial work, pharmacy and education, where the graduation rate for women was more than 20 percentage points higher than for men.
Decline in performance indicators – especially for freestanding distance coursesPerformance indicators show to what extent students obtain the credits for which they are registered. As this measurement does not re-quire the award of a qualification, it is not only suitable for assessing students on degree programmes but also for those taking frees-tanding courses. From 2013 onwards new sta-tistics linked to individuals are being used to establish performance indicators. These new statistics are based on the number of credits obtained in the semester of registration and in the following three semesters. The most re-cent year that can be accounted for is therefo-re the academic year of 2009/10 and the cre-dits awarded by the autumn semester of 2011.
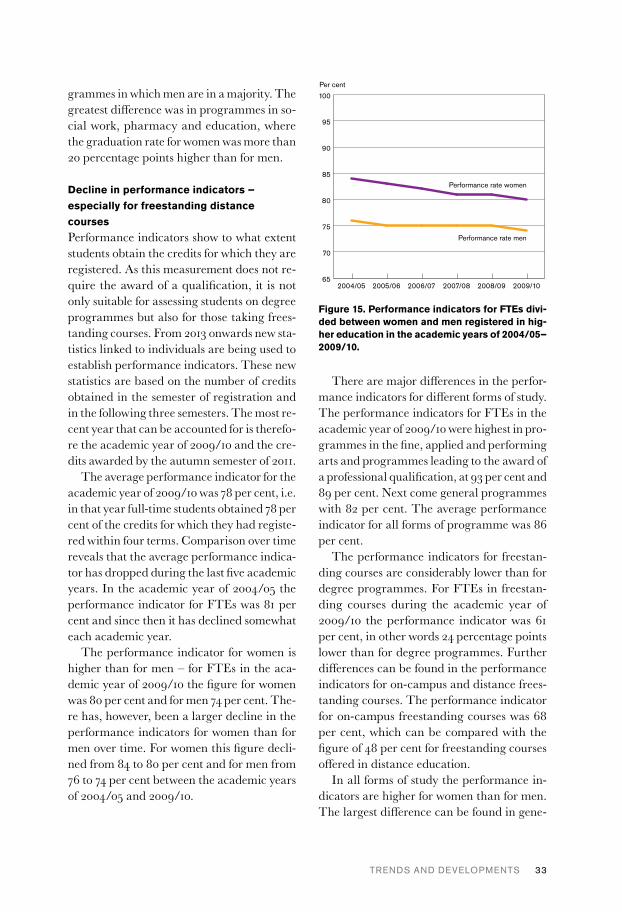
The average performance indicator for the academic year of 2009/10 was 78 per cent, i.e. in that year full-time students obtained 78 per cent of the credits for which they had registe-red within four terms. Comparison over time reveals that the average performance indica-tor has dropped during the last five academic years. In the academic year of 2004/05 the performance indicator for FTEs was 81 per cent and since then it has declined somewhat each academic year.
The performance indicator for women is higher than for men – for FTEs in the aca-demic year of 2009/10 the figure for women was 80 per cent and for men 74 per cent. The-re has, however, been a larger decline in the performance indicators for women than for men over time. For women this figure decli-ned from 84 to 80 per cent and for men from 76 to 74 per cent between the academic years of 2004/05 and 2009/10.
There are major differences in the perfor-mance indicators for different forms of study. The performance indicators for FTEs in the academic year of 2009/10 were highest in pro-grammes in the fine, applied and performing arts and programmes leading to the award of a professional qualification, at 93 per cent and 89 per cent. Next come general programmes with 82 per cent. The average performance indicator for all forms of programme was 86 per cent.
The performance indicators for freestan-ding courses are considerably lower than for degree programmes. For FTEs in freestan-ding courses during the academic year of 2009/10 the performance indicator was 61 per cent, in other words 24 percentage points lower than for degree programmes. Further differences can be found in the performance indicators for on-campus and distance frees-tanding courses. The performance indicator for on-campus freestanding courses was 68 per cent, which can be compared with the figure of 48 per cent for freestanding courses offered in distance education.
In all forms of study the performance in-dicators are higher for women than for men. The largest difference can be found in gene-
Per cent
Performance rate women
65
70
75
80
85
90
95
100
2009/102008/092007/082006/072005/062004/05
Performance rate men
Figure 15. Performance indicators for FTEs divi-ded between women and men registered in hig-her education in the academic years of 2004/05–2009/10.

34 TRENDS AND DEVELOPMENTS
ral programmes and programmes leading to the award of a professional qualification, in which the performance indicators for women were 7 and 6 per cent higher than for men for FTEs during the academic year of 2009/10.
The difference was smallest in programmes in the fine, applied and performing arts, where it was 2 per cent.
Comparison over time reveals that the gre-atest decline in performance indicators has been for freestanding courses offered in dis-tance education. Between the academic years of 2004/05 and 2009/10 the performance in-dicators for FTEs on distance freestanding courses dropped by 8 percentage points. The performance indicators for other forms of stu-dy declined by between 1 and 2 percentage points during the same period.
It is mainly where women are concerned that the performance indicator for freestan-ding distance courses has declined. This per-formance indicator for women has declined each year since the academic year of 2004/05 – from 61 to 51 per cent. For men the perfor-mance indicator is lower than for women but has not declined to the same extent – from 48 to 44 per cent between the academic years of 2004/05 and 2009/10.
The marked decline in the performance indicators for freestanding distance cour-ses, in particular for women, largely explains the overall drop in performance indicators during the last five academic years – and why
Evaluation of higher educationSince 2011 first and second-cycle program-mes have been evaluated on the basis of how well students attain the qualitative targets laid down in the Qualifications Ordinance. These evaluations cover all programmes that lead to the award of Bachelor’s degrees, 60-credit and 120-credit Master’s degrees and professional qualifications. Another requirement is that at least five independent projects (degree pro-jects) must have been graded in the three pre-vious years. The material on which evaluation is based comprises the independent projects, self-evaluations, student interviews and also, up until the autumn of 2012, questionnaires to alumni.
The evaluations are carried out with the help of external assessors. The panels of assessors consist of subject experts, labour market repre-sentatives and students.
The evaluations have been divided up into six rounds. Decisions have been announced for the first three rounds, which have included, for instance, the social sciences and languages. The fourth round is half way through the pro-cess. This round covers the natural sciences and technological sciences
/engineering programmes. During the spring of 2013 evaluations of programmes in health sciences and medicine have started. The last round of this evaluation cycle will begin in the autumn. It includes programmes in the fine, applied and performing arts, programmes in social work and in education.
The evaluation cycle will finish in 2014. So far 743 qualifications have been evaluated. Of them 163 have been judged to be of inadequate qua-lity, 415 considered to attain high quality and 129 very high quality.
The Swedish Higher Education Authority has given the programmes assessed as being of inadequate quality on year in which to submit an account of the measures adopted.
Per cent
Qualifications in the fine, applied & performing arts
40
50
60
70
80
90
100
2009/102008/092007/082006/072005/062004/05
Professional qualifications
On-campus freestanding courses
Distance freestanding courses
General qualifications
Figure 16. Performance indicators for FTEs in programmes in the fine, applied and performing arts, programmes leading to the award of a pro-fessional qualification, general programmes and freestanding on-campus and distance courses for the academic years of 2004/05-2009/10.
TRENDS AND DEVELOPMENTS 35
this has been larger for women than for men. The number of FTEs on freestanding dis-tance courses has moreover risen noticeably in recent years, from 18,700 in the academic year of 2004/05 to 35, 600 in the academic year of 2010/11, which means that their per-formance indicators have an impact on the average performance indicator for all courses and programmes. The reasons for this decline are unclear.
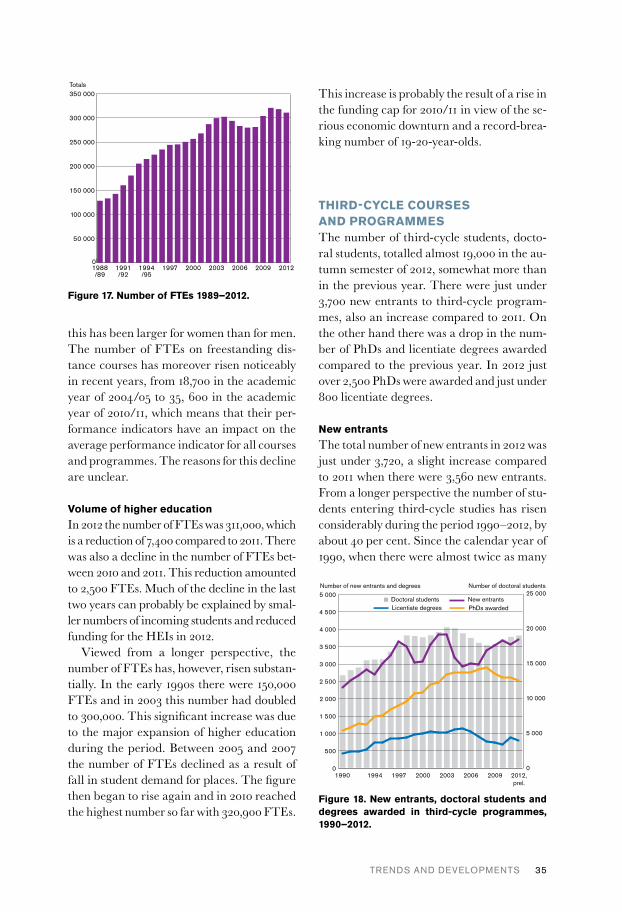
Volume of higher educationIn 2012 the number of FTEs was 311,000, which is a reduction of 7,400 compared to 2011. There was also a decline in the number of FTEs bet-ween 2010 and 2011. This reduction amounted to 2,500 FTEs. Much of the decline in the last two years can probably be explained by smal-ler numbers of incoming students and reduced funding for the HEIs in 2012.
Viewed from a longer perspective, the number of FTEs has, however, risen substan-tially. In the early 1990s there were 150,000 FTEs and in 2003 this number had doubled to 300,000. This significant increase was due to the major expansion of higher education during the period. Between 2005 and 2007 the number of FTEs declined as a result of fall in student demand for places. The figure then began to rise again and in 2010 reached the highest number so far with 320,900 FTEs.
This increase is probably the result of a rise in the funding cap for 2010/11 in view of the se-rious economic downturn and a record-brea-king number of 19-20-year-olds.
THIRD-CYCLE COURSES AND PROGRAMMESThe number of third-cycle students, docto-ral students, totalled almost 19,000 in the au-tumn semester of 2012, somewhat more than in the previous year. There were just under 3,700 new entrants to third-cycle program-mes, also an increase compared to 2011. On the other hand there was a drop in the num-ber of PhDs and licentiate degrees awarded compared to the previous year. In 2012 just over 2,500 PhDs were awarded and just under 800 licentiate degrees.
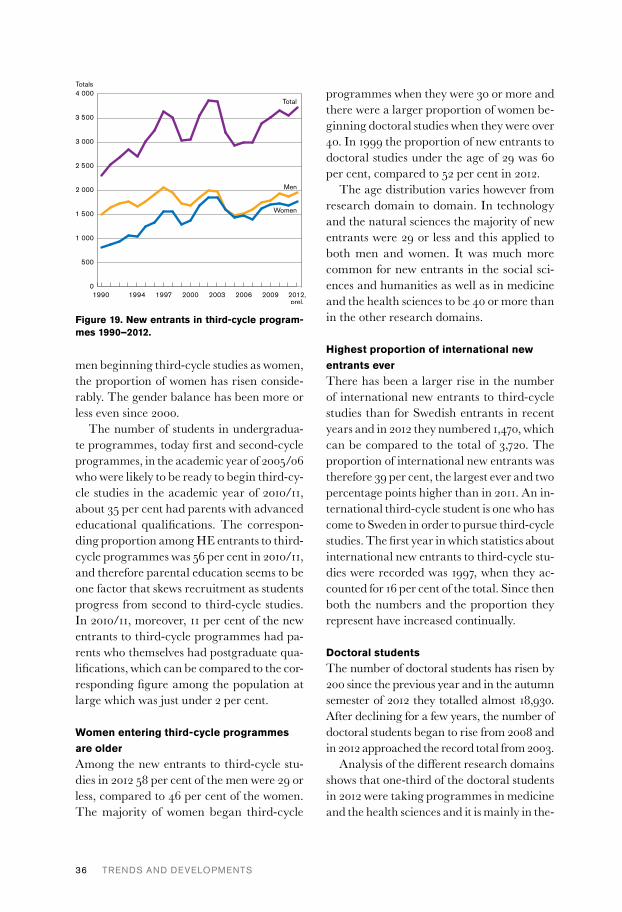
New entrantsThe total number of new entrants in 2012 was just under 3,720, a slight increase compared to 2011 when there were 3,560 new entrants. From a longer perspective the number of stu-dents entering third-cycle studies has risen considerably during the period 1990–2012, by about 40 per cent. Since the calendar year of 1990, when there were almost twice as many
Totals
0
50 000
100 000
150 000
200 000
250 000
300 000
350 000
2012200920062003200019971994/95
1991/92
1988/89
Figure 17. Number of FTEs 1989–2012.
0
5 000
10 000
15 000
20 000
25 000Number of new entrants and degrees
New entrantsPhDs awarded
0
500
1 000
1 500
2 000
2 500
3 000
3 500
4 000
4 500
5 000
2012,prel.
2009200620032000199719941990
Licentiate degreesDoctoral students
Number of doctoral students
Figure 18. New entrants, doctoral students and degrees awarded in third-cycle programmes, 1990–2012.
36 TRENDS AND DEVELOPMENTS
men beginning third-cycle studies as women, the proportion of women has risen conside-rably. The gender balance has been more or less even since 2000.
The number of students in undergradua-te programmes, today first and second-cycle programmes, in the academic year of 2005/06 who were likely to be ready to begin third-cy-cle studies in the academic year of 2010/11, about 35 per cent had parents with advanced educational qualifications. The correspon-ding proportion among HE entrants to third-cycle programmes was 56 per cent in 2010/11, and therefore parental education seems to be one factor that skews recruitment as students progress from second to third-cycle studies. In 2010/11, moreover, 11 per cent of the new entrants to third-cycle programmes had pa-rents who themselves had postgraduate qua-lifications, which can be compared to the cor-responding figure among the population at large which was just under 2 per cent.
Women entering third-cycle programmes are olderAmong the new entrants to third-cycle stu-dies in 2012 58 per cent of the men were 29 or less, compared to 46 per cent of the women. The majority of women began third-cycle
programmes when they were 30 or more and there were a larger proportion of women be-ginning doctoral studies when they were over 40. In 1999 the proportion of new entrants to doctoral studies under the age of 29 was 60 per cent, compared to 52 per cent in 2012.
The age distribution varies however from research domain to domain. In technology and the natural sciences the majority of new entrants were 29 or less and this applied to both men and women. It was much more common for new entrants in the social sci-ences and humanities as well as in medicine and the health sciences to be 40 or more than in the other research domains.
Highest proportion of international new entrants everThere has been a larger rise in the number of international new entrants to third-cycle studies than for Swedish entrants in recent years and in 2012 they numbered 1,470, which can be compared to the total of 3,720. The proportion of international new entrants was therefore 39 per cent, the largest ever and two percentage points higher than in 2011. An in-ternational third-cycle student is one who has come to Sweden in order to pursue third-cycle studies. The first year in which statistics about international new entrants to third-cycle stu-dies were recorded was 1997, when they ac-counted for 16 per cent of the total. Since then both the numbers and the proportion they represent have increased continually.
Doctoral studentsThe number of doctoral students has risen by 200 since the previous year and in the autumn semester of 2012 they totalled almost 18,930. After declining for a few years, the number of doctoral students began to rise from 2008 and in 2012 approached the record total from 2003.
Analysis of the different research domains shows that one-third of the doctoral students in 2012 were taking programmes in medicine and the health sciences and it is mainly in the-
Totals
Total
Men
0
500
1 000
1 500
2 000
2 500
3 000
3 500
4 000
2012,prel.
2009200620032000199719941990
Women
Figure 19. New entrants in third-cycle program-mes 1990–2012.
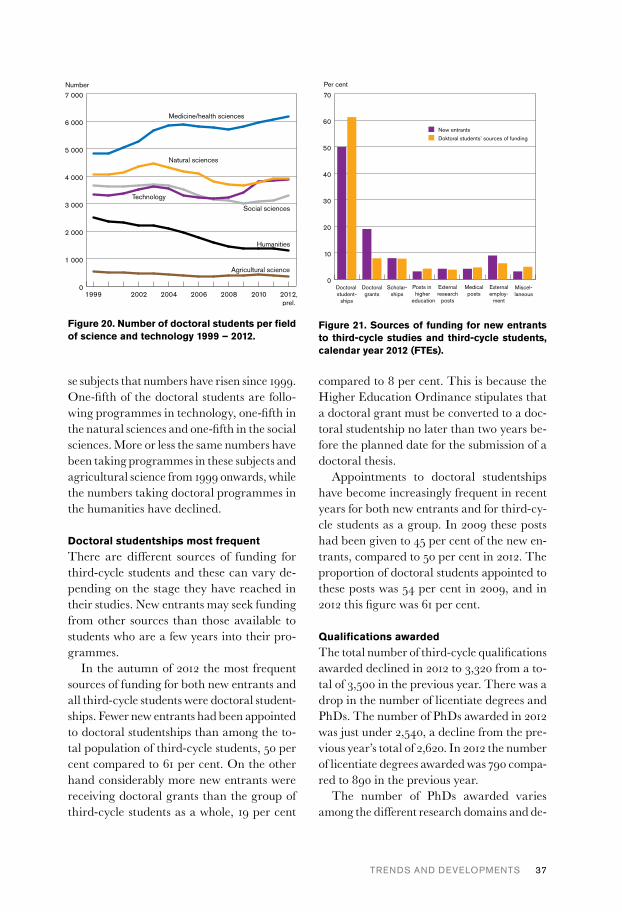
TRENDS AND DEVELOPMENTS 37
se subjects that numbers have risen since 1999. One-fifth of the doctoral students are follo-wing programmes in technology, one-fifth in the natural sciences and one-fifth in the social sciences. More or less the same numbers have been taking programmes in these subjects and agricultural science from 1999 onwards, while the numbers taking doctoral programmes in the humanities have declined.
Doctoral studentships most frequent There are different sources of funding for third-cycle students and these can vary de-pending on the stage they have reached in their studies. New entrants may seek funding from other sources than those available to students who are a few years into their pro-grammes.
In the autumn of 2012 the most frequent sources of funding for both new entrants and all third-cycle students were doctoral student-ships. Fewer new entrants had been appointed to doctoral studentships than among the to-tal population of third-cycle students, 50 per cent compared to 61 per cent. On the other hand considerably more new entrants were receiving doctoral grants than the group of third-cycle students as a whole, 19 per cent
compared to 8 per cent. This is because the Higher Education Ordinance stipulates that a doctoral grant must be converted to a doc-toral studentship no later than two years be-fore the planned date for the submission of a doctoral thesis.
Appointments to doctoral studentships have become increasingly frequent in recent years for both new entrants and for third-cy-cle students as a group. In 2009 these posts had been given to 45 per cent of the new en-trants, compared to 50 per cent in 2012. The proportion of doctoral students appointed to these posts was 54 per cent in 2009, and in 2012 this figure was 61 per cent.
Qualifications awardedThe total number of third-cycle qualifications awarded declined in 2012 to 3,320 from a to-tal of 3,500 in the previous year. There was a drop in the number of licentiate degrees and PhDs. The number of PhDs awarded in 2012 was just under 2,540, a decline from the pre-vious year’s total of 2,620. In 2012 the number of licentiate degrees awarded was 790 compa-red to 890 in the previous year.
The number of PhDs awarded varies among the different research domains and de-
Number
Medicine/health sciences
Social sciences
0
1 000
2 000
3 000
4 000
5 000
6 000
7 000
2012,prel.
201020082006200420021999
Technology
Natural sciences
Humanities
Agricultural science
Figure 20. Number of doctoral students per field of science and technology 1999 – 2012.
Per cent
Doktoral students’ sources of fundingNew entrants
0
10
20
30
40
50
60
70
Miscel-laneous
Externalemploy-
ment
Medicalposts
Externalresearch
posts
Posts in higher
education
Scholar-ships
Doctoralgrants
Doctoral student-
ships
Figure 21. Sources of funding for new entrants to third-cycle studies and third-cycle students, calendar year 2012 (FTEs).

38 TRENDS AND DEVELOPMENTS
pends for instance on how large the domains are. During 2012 most PhDs were awarded in medicine and the health sciences, just under one-third of the 2,540. Almost half of the 790 licentiate degrees were awarded in techno-logy and another quarter in the natural sci-ences in 2012.
Equal numbers of women and men were awarded PhDs in 2012 and the gender balance has been even in recent years, but seen from a 20-year perspective the proportion of women has risen from 27 to 50 per cent. The propor-tion of women awarded licentiate degrees was smaller, 41 per cent. One explanation is that half of all these degrees were awarded in tech-nology, where the majority of students are men.
INTERNATIONAL MOBILITYDuring the academic year of 2011/12 the ri-sing trend in the number of students arriving in Sweden to study in first and second-cycle programmes reversed. After having increased threefold during the preceding decade, the number declined by almost 30 per cent com-pared to the previous year. During the aca-demic year just over 38,100 foreign students were studying at HEIs in Sweden, which is 8,700 fewer than the year before.
These figures include all the incoming stu-dents registered in Sweden and not only new entrants to higher education.
Decline in the numbers of incoming HE entrants The number of incoming students who were HE entrants in first and second-cycle pro-grammes during the academic year of 2011/12 totalled 20,800, which is a decline of 8,600 compared to the previous year. The propor-tion of all HE entrants at Swedish HEIs co-ming from abroad was 23 per cent. This can be compared with the previous year, when this figure was 28 per cent. Despite the de-cline, this is a large proportion compared to the academic year of 2002/03, when students from abroad accounted for 15 per cent all HE entrants. Just over 70 per cent of the new in-coming students during the academic year of 2011/12 were exchange students.
During the previous academic year of 2010/11 there were more or less equal num-bers of free-movers and exchange students. The decline in the number of free-movers is mainly due to the introduction of tuition fees on 1 July 2011. This has mainly affected the numbers of free-movers from such countries: from 8,200 in the academic year of 2010/11 to 1,700 in the following year, a decline of 79 per cent. In the autumn of 2012 the number of incoming HE entrants rose by 7 per cent compared with the previous autumn but it is still considerably lower than it was before the introduction of fees.
The number of incoming free-movers from countries in the EU/EEA and Switzerland who were HE entrants rose from 1,400 in the autumn of 2010 to just under 2,300 in the au-tumn of 2012, in total an increase of 64 per cent. In other words there has been a shift in the countries that free-movers come from.
It is important to note that not all free-movers from third countries have to pay tui-tion fees. Fees are waived for students from third countries who are considered to have
Totals
0
10 000
20 000
30 000
40 000
50 000
2011/122008/092005/062002/03
Incoming
Outgoing
Figure 22. All incoming and outgoing students in the academic years 2002/03-2011/12.

TRENDS AND DEVELOPMENTS 39
strong links to Sweden, for instance those with permanent residence permits or resi-dence permits in Sweden granted for other reasons than to study. In the autumn of 2012 1,706 new free-movers from third countries began their studies in higher education and 81 per cent of them, 1,375, were paying fees. In the previous autumn 72 per cent or 1,155 of the fee-paying HE entrants were free-movers from third countries.
The autumn semester of 2012 was the first in which there were also fee-paying students who were not HE entrants, i.e. who were con-tinuing studies begun in the previous year, the academic year of 2011/12, which was the first year in which fees had been charged. In addi-tion to 1,375 fee-paying HE entrants in the au-tumn of 2012 there were also 1,020 fee-paying students continuing their studies. This means
that the total number of fee-paying students in the autumn of 2012 was 2,395.
Most international HE entrants at Lund UniversityDuring the academic year of 2011/12 Lund University had the largest number of inco-ming HE entrants in Sweden, just over 2,500 students of the total number of 20,800. Uppsa-la University and the Royal Institute of Tech-nology came next with 1,900 students each. Together these three institutions account for 30 per cent of these HE entrants and they have also had the largest numbers of inco-ming HE entrants for many years.
As most exchange students usually only complete part of their programmes in their exchange countries, the vast majority of the incoming exchange students were taking courses rather than complete degree pro-
Area of origin Student category Total new incoming Change (%)
Aut.-10 Aut.-11 Aut.-12 Aut.-10–Aut.-11 Aut.-11–Aut.-12
All Free-mover 12 450 4 900 5 800 -61 17
Exchange 9 600 9 800 9 700 2 -1
Total 22 100 14 700 15 400 -33 5
EU/EEA
& Switzerland
Free-mover 1 400 1 800 2 300 27 31
Exchange 7 000 7 100 7 100 2 0
Total 8 300 8 900 9 400 7 6
Other than EU/EEA
& Switzerland (Third
country students)
Free-mover 7 600 1 600 1 700 -79 7
Exchange 2 700 2 700 2 500 0 -5
Total 10 200 4 300 4 200 -58 -1
No information * Free-mover 3 500 1 500 1 700 -56 13
Total 3 500 1 500 1 700 -56 13
Table 2. Number of new incoming students to Sweden – who have not previously studied in Sweden – by area of origin and student category autumn 2011 and autumn 2012 as well as the percentage change between the two years. * There is no information about which country some free-mover students come from.
40 TRENDS AND DEVELOPMENTS
grammes. It was more common for free-mo-vers to opt for degree programmes, 69 per cent, instead of courses, 31 per cent. The in-crease in the proportion of students taking degree programmes coincides with the rise in the number of free-movers, which has in-creased each year during the last decade with the exception of the academic year of 2011/12. The explanation for this decline is the intro-duction of tuition fees, which led to a major reduction in the number of free-movers.
The disciplinary domains most often cho-sen by new exchange students during the aca-demic year of 2011/12 were social science, law, commerce and administration, followed by technology and manufacturing.
Almost every other incoming student comes from Europe There were almost 38,100 incoming stu-dents in Sweden during the academic year of 2011/12 and the majority, 78 per cent, came either from Europe (18,300) or Asia (11,300).
The total number of free-movers studying in Sweden in the academic year of 2011/12 was 23,100 and 7,100 of them came from Europe and 9,100 from Asia. Of the 15,300 exchange students in Sweden 11,300 came from Europe and 2,200 from Asia.
Most qualifications awarded in technology and manufacturing A total of 7,300 incoming students were awar-ded qualifications in the academic year of 2011/12. The majority of them, 80 per cent, were awarded second-cycle qualifications. Technology and manufacturing were the most popular fields of study and most qualifi-cations, 930, were awarded by the Royal Insti-tute of Technology. A relatively small number of those awarded qualifications were exchan-ge students, 590, the reason being that their exchange studies often form part of a comple-te programme in their own countries, where they probably qualify. Most of the exchange
students awarded qualifications in Sweden came from China followed by Germany.
Students leaving Sweden to studyDuring the academic year of 2011/12 there were 27,700 Swedish students abroad who either funded their studies through student finance from CSN or were on exchange pro-grammes, which was just over 1,000 more than in the previous year. This is the fourth year in a row that the number of students lea-ving Sweden has rising. These students can be grouped in three categories. The largest group consisted of free-movers (66 per cent), followed by exchange students (24 per cent) and finally those attending language courses (11 per cent). Compared to the previous year, the number of free-movers has risen by 4 per cent and exchange students by 12 per cent, while the number taking language courses has declined by 9 per cent. Students taking language courses were previously included in the group of free-movers but they can now be accounted for separately. The reason is that these language courses are no longer classified as higher education as they are not considered to be at tertiary level.
During the last decade the number of free-movers has risen by 18 per cent and the num-
State scholarship fund established In connection with the introduction of applica-
tion fees and tuition fees for international first and second-cycle students from countries out-side the EU/EEA and Switzerland who were not participating in exchange programmes a state scholarship fund was established. The HEIs are also increasingly finding their own scholarship funding from companies or from private dona-tions. In the autumn of 2012 just under 40 per cent of the newly registered fee-paying stu-dents were receiving Swedish scholarships. About one-third of those offered scholarships refused them. The reason was often that the scholarship was not considered adequate and/or that it was felt that it would be too expensive to live in Sweden.

TRENDS AND DEVELOPMENTS 41
ber of exchange students by 58 per cent. On the other hand the number of students taking language courses has declined by 53 per cent.
The UK and USA most popularDuring the academic year of 2011/12 the Uni-ted Kingdom and the USA were the most po-pular countries to study in, each attracting 5,100 students, 19 per cent of all those who left Sweden. These two countries were followed by Denmark, Australia, France, Spain and Poland. Altogether these seven countries ac-counted for two-thirds of all the students lea-ving Sweden to study, about 17,700 of a total of 27,700. The most frequent fields of study for free-movers leaving Sweden were, as ear-lier, social science, business, law & adminis-tration. About 30 per cent were studying in these fields in the academic year of 2011/12. They were followed by health and social care with 21 per cent. The humanities and fine, applied and performing arts were the third most popular field.
EDUCATION AND EMPLOYMENTIn Sweden the demand for graduates has been rising for a long time and statistics also show that higher education increases the possibi-lities of becoming established in the labour market. There are, however, major differen-ces between the ways in which students in dif-ferent disciplines enter the labour market after graduation.
The graduate labour marketGraduate have a better chance of becoming established in the labour market. The labour market surveys carried out by Statistics Swe-den reveal that a larger proportion of tho-se with tertiary education are gainfully em-ployed than those who are less well qualified. The overall unemployment rate among 15–74 year olds in 2012 was 7.7 per cent. For those who had merely completed secondary educa-
tion this figure was 7.3 per cent and for those with tertiary education it was 4.8 per cent. For many years unemployment has been lo-wer for graduates irrespective of the econo-mic situation.
In the population as a whole, there are more qualified women than men. Overall fe-wer women are gainfully employed than men, but, according to Statistics Sweden’s unem-ployment survey, a larger proportion of the women with higher education are employed than men. In 2012 4.5 of the women with terti-ary qualifications were unemployed, compare to 5.2 per cent of the men. This difference is largely due to gender differences in various educational and vocational fields. Women are overrepresented in professional programmes that lead to employment in education and so-cial and health care, where there has been no shortage of jobs in recent years.
Rise in the numbers of graduates in the labour force The total number of graduates from higher education entering the labour market in Swe-den is considerably larger than the number of graduates who retire each year. There was a rise in the number of individuals with tertiary education in the labour force of 440,000 bet-
0
5
10
15
20
Post-secondary
Secondary
Primary
201220112010200920082007
Per cent
Figure 23. Unemployment (per cent) 2007–2012 according to educational qualifications, age group 15–74.

42 TRENDS AND DEVELOPMENTS
ween 2000 and 2010 according to Statistics Sweden. Given the current volume of higher education this development will continue, alt-hough more slowly than hitherto. The num-ber of students in higher education is twice as large as it was twenty years ago. This ma-jor expansion of higher education means that several categories of graduates will increase in number during the next decades, even if there is no further increase in the number of places offered.
In today’s labour market qualifications from higher education are required for a gre-ater number of jobs than before. For a long time there has been a trend for employers to demand higher qualifications in various fields. This does not necessarily mean that a position actually demands a longer period of study – it is also one outcome of the continual rise in the number of graduates in the labour force. Individuals who have retired in the last 10–20 years have been replaced in many vo-cational fields by others with more advanced formal qualifications than those required by the preceding generation. It is more than li-kely that the demand for highly qualified em-ployees will continue to grow.
Graduates from other countries in the Swedish labour market Sweden enjoys a net migration of individuals with tertiary education, in other words there are more graduates moving to Sweden than leaving it. Only in connection with the crisis in the 1990s has the opposite been true.
To make it easier for these groups to gain a footing in the labour market it is possible for them to have their qualifications evalu-ated and recognised by an appropriate aut-hority. The process of issuing assessments of what Swedish qualification corresponds to a qualification from abroad shows that many, but not all, of the graduate immigrants apply to have their qualifications recognised. A to-tal of 20,500 immigrants with higher educa-tion qualifications came to Sweden in 2010 from other countries (according to their own information about their educational attain-ments) and in the same year just over 5,000 applications for recognition were made to the Swedish National Agency for Higher Educa-tion. From 1 January 2013 the responsibility for evaluating qualifications from abroad has been taken over by the Swedish Council for Higher Education. In addition there are qua-lifications from abroad that are evaluated by other authorities, for instance Socialstyrelsen (the National Board of Health and Welfare) when they concern the health services. Alto-gether the number of recognitions, registra-tions and certificates of qualified status issued for individuals from abroad corresponds to about one tenth of the total number of quali-fications awarded by higher education insti-tutions in Sweden each year.
The reason why the number of highly qua-lified immigrants applying for recognition of their qualifications is not larger may be that many of them have already found work in Sweden or begun supplementary studies.
Establishment on the labour market The number of places offered by HEIs in Sweden must meet student demand and the
0
500
1 000
1 500
2 000
2 500
Post-secondary education
Secondary education
Primary education (or corresponding)
2030202520202015201020052000
’000s
Figure 24. Total number gainfully employed 2000–2010 and estimated labour market demand 2011–2030 divided according to educational qua-lifications.
TRENDS AND DEVELOPMENTS 43
needs of the labour market. During the last 5–10 years a broader and more overall view of labour market links has evolved in higher education.
The increasing focus placed on the links between higher education and the labour market and its relevance is largely the result of the increased expectations from the la-bour market and the influence it exerts. Be-hind this development there is also the discu-ssion of employability that has been going on within the framework of the Bologna Process. Work has recently started in the context of European cooperation on the identification of a “benchmark” that can be used by the Member States to compare the employability of their students with each other. The target being discussed is an establishment rate of 80 per cent. According to the establishment in-dicators developed by the Swedish National Agency for Higher Education, in 2009 78 per cent of graduates in Sweden had gained a foo-ting in the labour market 1–2 years after the award of their qualifications. One year ear-lier this figure was 80 per cent. The decline between the two years reflects general deve-lopments in the labour market.
The definition of establishment developed by the Swedish National Agency for Higher Education – and which the Swedish Higher Education Authority will continue to use – assesses graduates as established if they were gainfully employed in November, earn more than a specific amount and have not been stu-dents, moved abroad or had periods of unem-ployment during the year or been involved in labour market policy measures. Establish-ment is measured 12–18 months after gradua-tion and graduates are grouped in different categories on the basis of which sector of the labour market their qualifications relate to.
The proportion establishing themselves varied from discipline to discipline. The lar-gest proportion of graduates who gained a footing in the labour market had qualifica-tions in areas such as technology, medicine
and health care. Nine out of ten graduates who qualified as physicians, dentists or had Master’s degrees in engineering had esta-blished themselves within 1.5 years. About 13 per cent of all those graduating belonged to categories with 90 per cent establishment or more. A large proportion of graduates, three out of four, belonged to categories in which the establishment interval lay between 70 and 89 per cent.
The majority of the graduates who gained a footing in the labour market in 2009 about whose occupations there is information had jobs that were closely linked to the field in which they qualified. Those with general qua-lifications can on the whole, find employment in a number of different occupations. These groups are, however, the ones who usually find it more difficult to establish themselves than those with professional qualifications.
Gender differences The proportions of women and men with qualifications from higher education who es-tablish themselves in the labour market differ. In 2009 the difference was four per cent in fa-vour of the men. This difference can largely be explained by the varying representation of women and men in different study program-mes so that they seek employment in different sectors. In some years there have been large differences between the rates of establishment for different disciplines and these are also re-flected in gender differences.
As the fields in which students qualify play such an important role for establishment, the gender differences become smaller if the choi-ce of programmes by women and men are ta-ken into account. If the women and men who entered the labour market in 2009 had been evenly distributed over the different discipli-nary domains, the gender difference would have been just over 3 per cent less. There would, however, still have been a difference of 1.5 per cent in favour of the men.
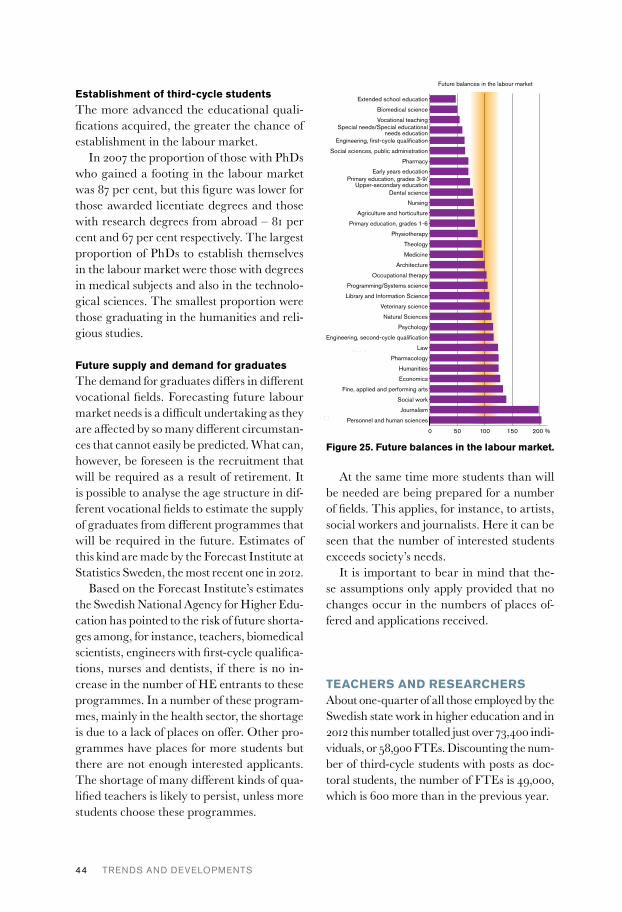
44 TRENDS AND DEVELOPMENTS
Establishment of third-cycle students The more advanced the educational quali-fications acquired, the greater the chance of establishment in the labour market.
In 2007 the proportion of those with PhDs who gained a footing in the labour market was 87 per cent, but this figure was lower for those awarded licentiate degrees and those with research degrees from abroad – 81 per cent and 67 per cent respectively. The largest proportion of PhDs to establish themselves in the labour market were those with degrees in medical subjects and also in the technolo-gical sciences. The smallest proportion were those graduating in the humanities and reli-gious studies.
Future supply and demand for graduates The demand for graduates differs in different vocational fields. Forecasting future labour market needs is a difficult undertaking as they are affected by so many different circumstan-ces that cannot easily be predicted. What can, however, be foreseen is the recruitment that will be required as a result of retirement. It is possible to analyse the age structure in dif-ferent vocational fields to estimate the supply of graduates from different programmes that will be required in the future. Estimates of this kind are made by the Forecast Institute at Statistics Sweden, the most recent one in 2012.
Based on the Forecast Institute’s estimates the Swedish National Agency for Higher Edu-cation has pointed to the risk of future shorta-ges among, for instance, teachers, biomedical scientists, engineers with first-cycle qualifica-tions, nurses and dentists, if there is no in-crease in the number of HE entrants to these programmes. In a number of these program-mes, mainly in the health sector, the shortage is due to a lack of places on offer. Other pro-grammes have places for more students but there are not enough interested applicants. The shortage of many different kinds of qua-lified teachers is likely to persist, unless more students choose these programmes.
At the same time more students than will be needed are being prepared for a number of fields. This applies, for instance, to artists, social workers and journalists. Here it can be seen that the number of interested students exceeds society’s needs.
It is important to bear in mind that the-se assumptions only apply provided that no changes occur in the numbers of places of-fered and applications received.
TEACHERS AND RESEARCHERSAbout one-quarter of all those employed by the Swedish state work in higher education and in 2012 this number totalled just over 73,400 indi-viduals, or 58,900 FTEs. Discounting the num-ber of third-cycle students with posts as doc-toral students, the number of FTEs is 49,000, which is 600 more than in the previous year.
0 50 100 150 200
250
Procent
Personnel and human sciences
Journalism
Social work
Fine, applied and performing arts
Economics
Humanities
Pharmacology
Law
Engineering, second-cycle qualification
Psychology
Natural Sciences
Veterinary science
Library and Information Science
Programming/Systems science
Occupational therapy
Architecture
Medicine
Theology
Physiotherapy
Primary education, grades 1-6
Agriculture and horticulture
Nursing
Dental science
Primary education, grades 3-9/Upper-secondary education
Early years education
Pharmacy
Social sciences, public administration
Engineering, first-cycle qualification
Special needs/Special educationalneeds education
Vocational teaching
Biomedical science
Extended school education
Future balances in the labour market
%
Figure 25. Future balances in the labour market.
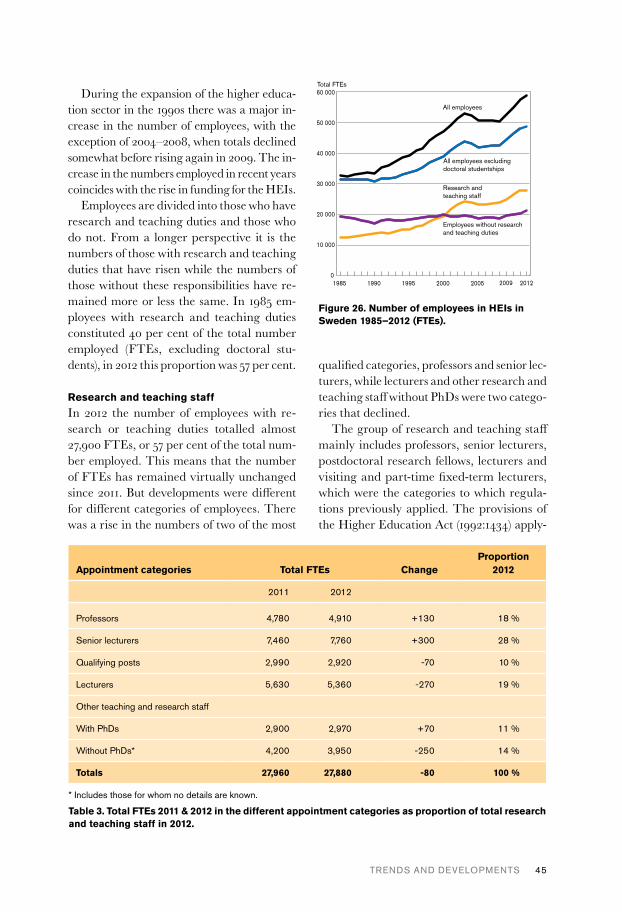
TRENDS AND DEVELOPMENTS 45
During the expansion of the higher educa-tion sector in the 1990s there was a major in-crease in the number of employees, with the exception of 2004–2008, when totals declined somewhat before rising again in 2009. The in-crease in the numbers employed in recent years coincides with the rise in funding for the HEIs.
Employees are divided into those who have research and teaching duties and those who do not. From a longer perspective it is the numbers of those with research and teaching duties that have risen while the numbers of those without these responsibilities have re-mained more or less the same. In 1985 em-ployees with research and teaching duties constituted 40 per cent of the total number employed (FTEs, excluding doctoral stu-dents), in 2012 this proportion was 57 per cent.
Research and teaching staff In 2012 the number of employees with re-search or teaching duties totalled almost 27,900 FTEs, or 57 per cent of the total num-ber employed. This means that the number of FTEs has remained virtually unchanged since 2011. But developments were different for different categories of employees. There was a rise in the numbers of two of the most
qualified categories, professors and senior lec-turers, while lecturers and other research and teaching staff without PhDs were two catego-ries that declined.
The group of research and teaching staff mainly includes professors, senior lecturers, postdoctoral research fellows, lecturers and visiting and part-time fixed-term lecturers, which were the categories to which regula-tions previously applied. The provisions of the Higher Education Act (1992:1434) apply-
Total FTEs
0
10 000
20 000
30 000
40 000
50 000
60 000
1985 1990 1995 2000 2005 2009
All employees
All employees excluding doctoral studentships
Research and teaching staff
Employees without research and teaching duties
2012
Figure 26. Number of employees in HEIs in Sweden 1985–2012 (FTEs).
Appointment categories Total FTEs ChangeProportion
2012
2011 2012
Professors 4,780 4,910 +130 18 %
Senior lecturers 7,460 7,760 +300 28 %
Qualifying posts 2,990 2,920 -70 10 %
Lecturers 5,630 5,360 -270 19 %
Other teaching and research staff
With PhDs 2,900 2,970 +70 11 %
Without PhDs* 4,200 3,950 -250 14 %
Totals 27,960 27,880 -80 100 %
* Includes those for whom no details are known.
Table 3. Total FTEs 2011 & 2012 in the different appointment categories as proportion of total research and teaching staff in 2012.
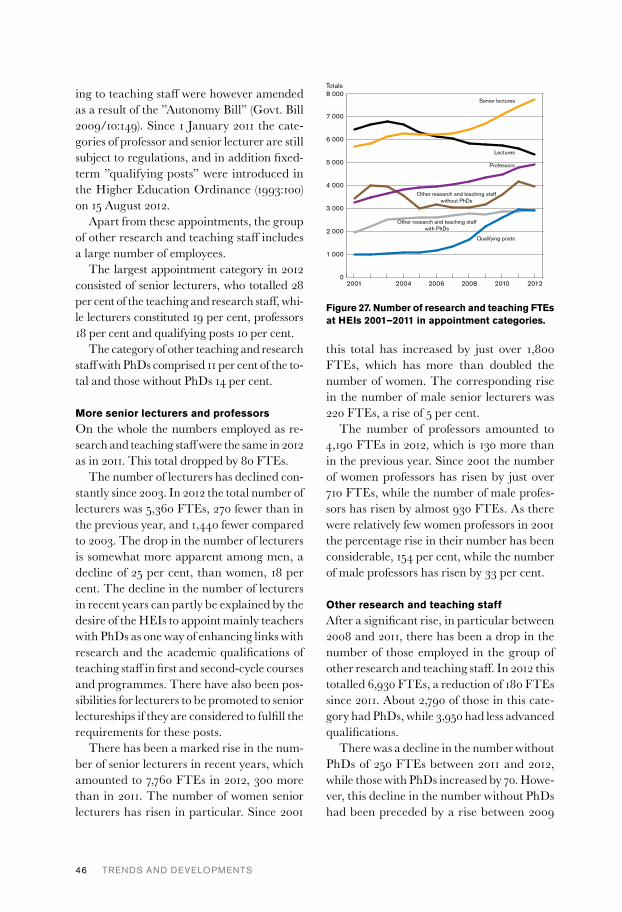
46 TRENDS AND DEVELOPMENTS
ing to teaching staff were however amended as a result of the ”Autonomy Bill” (Govt. Bill 2009/10:149). Since 1 January 2011 the cate-gories of professor and senior lecturer are still subject to regulations, and in addition fixed-term ”qualifying posts” were introduced in the Higher Education Ordinance (1993:100) on 15 August 2012.
Apart from these appointments, the group of other research and teaching staff includes a large number of employees.
The largest appointment category in 2012 consisted of senior lecturers, who totalled 28 per cent of the teaching and research staff, whi-le lecturers constituted 19 per cent, professors 18 per cent and qualifying posts 10 per cent.
The category of other teaching and research staff with PhDs comprised 11 per cent of the to-tal and those without PhDs 14 per cent.
More senior lecturers and professorsOn the whole the numbers employed as re-search and teaching staff were the same in 2012 as in 2011. This total dropped by 80 FTEs.
The number of lecturers has declined con-stantly since 2003. In 2012 the total number of lecturers was 5,360 FTEs, 270 fewer than in the previous year, and 1,440 fewer compared to 2003. The drop in the number of lecturers is somewhat more apparent among men, a decline of 25 per cent, than women, 18 per cent. The decline in the number of lecturers in recent years can partly be explained by the desire of the HEIs to appoint mainly teachers with PhDs as one way of enhancing links with research and the academic qualifications of teaching staff in first and second-cycle courses and programmes. There have also been pos-sibilities for lecturers to be promoted to senior lectureships if they are considered to fulfill the requirements for these posts.
There has been a marked rise in the num-ber of senior lecturers in recent years, which amounted to 7,760 FTEs in 2012, 300 more than in 2011. The number of women senior lecturers has risen in particular. Since 2001
this total has increased by just over 1,800 FTEs, which has more than doubled the number of women. The corresponding rise in the number of male senior lecturers was 220 FTEs, a rise of 5 per cent.
The number of professors amounted to 4,190 FTEs in 2012, which is 130 more than in the previous year. Since 2001 the number of women professors has risen by just over 710 FTEs, while the number of male profes-sors has risen by almost 930 FTEs. As there were relatively few women professors in 2001 the percentage rise in their number has been considerable, 154 per cent, while the number of male professors has risen by 33 per cent.
Other research and teaching staff After a significant rise, in particular between 2008 and 2011, there has been a drop in the number of those employed in the group of other research and teaching staff. In 2012 this totalled 6,930 FTEs, a reduction of 180 FTEs since 2011. About 2,790 of those in this cate-gory had PhDs, while 3,950 had less advanced qualifications.
There was a decline in the number without PhDs of 250 FTEs between 2011 and 2012, while those with PhDs increased by 70. Howe-ver, this decline in the number without PhDs had been preceded by a rise between 2009
0
1 000
2 000
3 000
4 000
5 000
6 000
7 000
8 000
201220102008200620042001
Totals
Qualifying posts
Lectures
Senior lectures
Other research and teaching staff with PhDs
Other research and teaching staff without PhDs
Professors
Figure 27. Number of research and teaching FTEs at HEIs 2001–2011 in appointment categories.
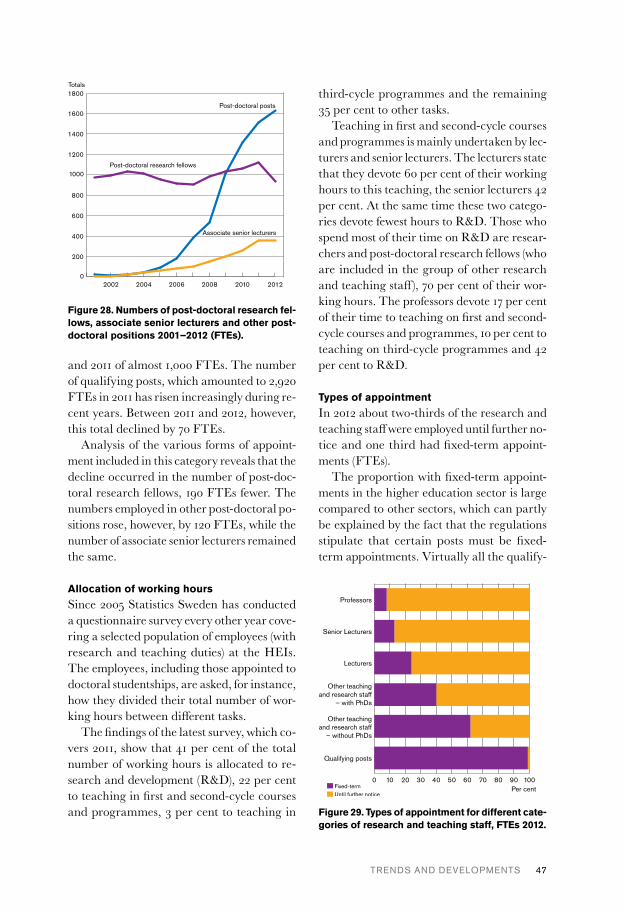
TRENDS AND DEVELOPMENTS 47
and 2011 of almost 1,000 FTEs. The number of qualifying posts, which amounted to 2,920 FTEs in 2011 has risen increasingly during re-cent years. Between 2011 and 2012, however, this total declined by 70 FTEs.
Analysis of the various forms of appoint-ment included in this category reveals that the decline occurred in the number of post-doc-toral research fellows, 190 FTEs fewer. The numbers employed in other post-doctoral po-sitions rose, however, by 120 FTEs, while the number of associate senior lecturers remained the same.
Allocation of working hours Since 2005 Statistics Sweden has conducted a questionnaire survey every other year cove-ring a selected population of employees (with research and teaching duties) at the HEIs. The employees, including those appointed to doctoral studentships, are asked, for instance, how they divided their total number of wor-king hours between different tasks.
The findings of the latest survey, which co-vers 2011, show that 41 per cent of the total number of working hours is allocated to re-search and development (R&D), 22 per cent to teaching in first and second-cycle courses and programmes, 3 per cent to teaching in
third-cycle programmes and the remaining 35 per cent to other tasks.
Teaching in first and second-cycle courses and programmes is mainly undertaken by lec-turers and senior lecturers. The lecturers state that they devote 60 per cent of their working hours to this teaching, the senior lecturers 42 per cent. At the same time these two catego-ries devote fewest hours to R&D. Those who spend most of their time on R&D are resear-chers and post-doctoral research fellows (who are included in the group of other research and teaching staff ), 70 per cent of their wor-king hours. The professors devote 17 per cent of their time to teaching on first and second-cycle courses and programmes, 10 per cent to teaching on third-cycle programmes and 42 per cent to R&D.
Types of appointment In 2012 about two-thirds of the research and teaching staff were employed until further no-tice and one third had fixed-term appoint-ments (FTEs).
The proportion with fixed-term appoint-ments in the higher education sector is large compared to other sectors, which can partly be explained by the fact that the regulations stipulate that certain posts must be fixed-term appointments. Virtually all the qualify-
0
200
400
600
800
1000
1200
1400
1600
1800
201220102008200620042002
Totals
Post-doctoral posts
Post-doctoral research fellows
Associate senior lecturers
Figure 28. Numbers of post-doctoral research fel-lows, associate senior lecturers and other post-doctoral positions 2001–2012 (FTEs).
0 10 20 30 40 50 60 70 80 90 100
Qualifying posts
Other teaching and research staff
– without PhDs
Other teachingand research staff
– with PhDs
Lecturers
Senior Lecturers
Professors
Per centFixed-termUntil further notice
Figure 29. Types of appointment for different cate-gories of research and teaching staff, FTEs 2012.

48 TRENDS AND DEVELOPMENTS
ing posts were fixed-term and this is also the type of appointment that should normally be offered for them.
In addition fixed-term appointments were also frequent in the group of other research and teaching staff, in particular for those wit-hout PhDs (62 per cent).
Overall, a larger proportion of the women had fixed-term appointments in 2012 compa-red to men, 36 per cent for women, 31 per cent for men. In most of the appointment catego-ries it was also more common for women to have fixed-term appointments. The exception was the category of other research and teach-ing staff without PhDs, where slightly more men had fixed-term appointments.
The proportion of those with fixed-term appointments has been the same since 2008 even though funding allocations have risen during this period.
Women professorsThere is a development towards a more even gender balance among research and teaching staff. In 2001 37 per cent were women, a pro-portion that has risen to 43 per cent in 2012 (FTEs). Since 2001 the number of women pro-fessors has risen from 460 to 1,170 FTEs, in other words a rise of just over 150 per cent in
eleven years. At the same time the proportion of professors who are women has risen by just under one percentage point per year, from 14 to 24 per cent. This was also the case between 2011 and 2012, when the number of women professors rose by 88 FTEs and by 45 FTEs for men, which means that the proportion of women rose from 23 to 24 per cent.
To encourage a rise in the proportion of women among professors the Government has set targets for the recruitment of women professors at 34 HEIs for the period 2012–2015. These targets are based on the calcula-ted recruitment base (senior lecturers and post-doctoral research fellows) in different fields of research. There have been targets of this kind since 1997, although none were set for 2009–2011.
FINANCE AND RESEARCH FUNDING For several years higher education in Sweden has been in an expansive phase. This deve-lopment also continued in 2012 and the HEIs’ revenues rose to SEK 61.2, which in current prices is SEK 1.8 billion more than in the pre-ceding year.
The increase in revenues is, however, une-venly distributed and in the last two years re-venues for first and second-cycle courses and programmes have declined while research funding has continued to grow. This means that research has become increasingly predo-minant in the higher education sector. The Government’s most recent research bill covered the period 2009–2012 and has led to a considerable increase in the HEIs’ revenu-es for research and third-cycle courses and programmes each year, particularly early in the period. The HEIs’ revenues for first and second-cycle courses and programmes also rose at the beginning of this period, but have since then declined.
The reforms that have been implemented in first and second-cycle courses and pro-grammes have mainly been financed through
0
10
20
30
40
50
60
201220102008200620042001
Per cent
Lecturers
ProfessorsSenior lecturers
Qualifying postsOther research
and teaching staff with PhDs
Other research and teaching staff
without PhDs
Figure 30. Proportion of women in different cate-gories of research and teaching staff 2001–2012 (FTEs).
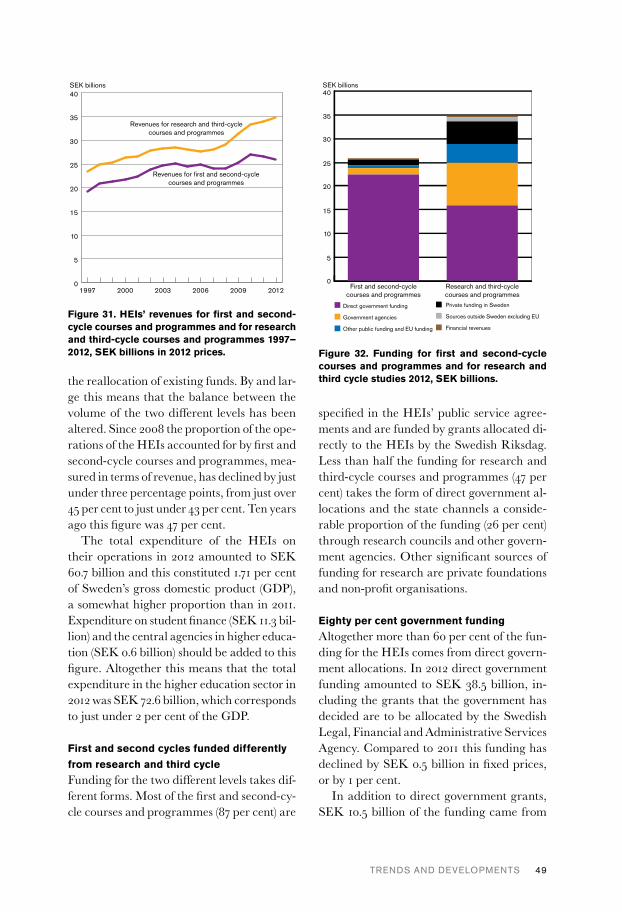
TRENDS AND DEVELOPMENTS 49
the reallocation of existing funds. By and lar-ge this means that the balance between the volume of the two different levels has been altered. Since 2008 the proportion of the ope-rations of the HEIs accounted for by first and second-cycle courses and programmes, mea-sured in terms of revenue, has declined by just under three percentage points, from just over 45 per cent to just under 43 per cent. Ten years ago this figure was 47 per cent.
The total expenditure of the HEIs on their operations in 2012 amounted to SEK 60.7 billion and this constituted 1.71 per cent of Sweden’s gross domestic product (GDP), a somewhat higher proportion than in 2011. Expenditure on student finance (SEK 11.3 bil-lion) and the central agencies in higher educa-tion (SEK 0.6 billion) should be added to this figure. Altogether this means that the total expenditure in the higher education sector in 2012 was SEK 72.6 billion, which corresponds to just under 2 per cent of the GDP.
First and second cycles funded differently from research and third cycleFunding for the two different levels takes dif-ferent forms. Most of the first and second-cy-cle courses and programmes (87 per cent) are
specified in the HEIs’ public service agree-ments and are funded by grants allocated di-rectly to the HEIs by the Swedish Riksdag. Less than half the funding for research and third-cycle courses and programmes (47 per cent) takes the form of direct government al-locations and the state channels a conside-rable proportion of the funding (26 per cent) through research councils and other govern-ment agencies. Other significant sources of funding for research are private foundations and non-profit organisations.
Eighty per cent government funding Altogether more than 60 per cent of the fun-ding for the HEIs comes from direct govern-ment allocations. In 2012 direct government funding amounted to SEK 38.5 billion, in-cluding the grants that the government has decided are to be allocated by the Swedish Legal, Financial and Administrative Services Agency. Compared to 2011 this funding has declined by SEK 0.5 billion in fixed prices, or by 1 per cent.
In addition to direct government grants, SEK 10.5 billion of the funding came from
SEK billions
Revenues for first and second-cycle courses and programmes
Revenues for research and third-cycle courses and programmes
0
5
10
15
20
25
30
35
40
201220092006200320001997
Figure 31. HEIs’ revenues for first and second-cycle courses and programmes and for research and third-cycle courses and programmes 1997–2012, SEK billions in 2012 prices.
SEK billions
Private funding in Sweden
Sources outside Sweden excluding EU
Financial revenues
0
5
10
15
20
25
30
35
40
Research and third-cyclecourses and programmes
First and second-cyclecourses and programmes
Direct government funding
Government agencies
Other public funding and EU funding
Figure 32. Funding for first and second-cycle courses and programmes and for research and third cycle studies 2012, SEK billions.
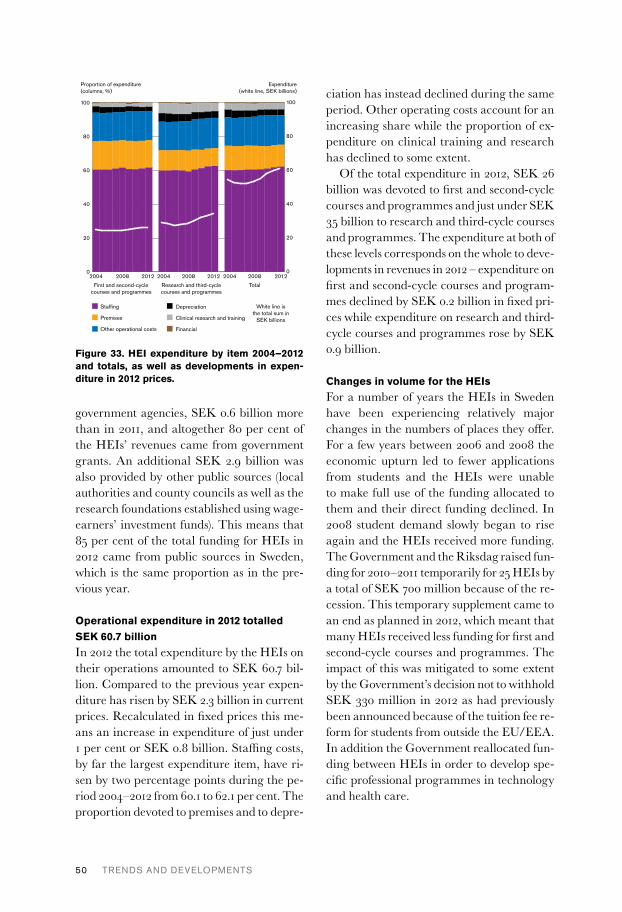
50 TRENDS AND DEVELOPMENTS
government agencies, SEK 0.6 billion more than in 2011, and altogether 80 per cent of the HEIs’ revenues came from government grants. An additional SEK 2.9 billion was also provided by other public sources (local authorities and county councils as well as the research foundations established using wage-earners’ investment funds). This means that 85 per cent of the total funding for HEIs in 2012 came from public sources in Sweden, which is the same proportion as in the pre-vious year.
Operational expenditure in 2012 totalled SEK 60.7 billion In 2012 the total expenditure by the HEIs on their operations amounted to SEK 60.7 bil-lion. Compared to the previous year expen-diture has risen by SEK 2.3 billion in current prices. Recalculated in fixed prices this me-ans an increase in expenditure of just under 1 per cent or SEK 0.8 billion. Staffing costs, by far the largest expenditure item, have ri-sen by two percentage points during the pe-riod 2004–2012 from 60.1 to 62.1 per cent. The proportion devoted to premises and to depre-
ciation has instead declined during the same period. Other operating costs account for an increasing share while the proportion of ex-penditure on clinical training and research has declined to some extent.
Of the total expenditure in 2012, SEK 26 billion was devoted to first and second-cycle courses and programmes and just under SEK 35 billion to research and third-cycle courses and programmes. The expenditure at both of these levels corresponds on the whole to deve-lopments in revenues in 2012 – expenditure on first and second-cycle courses and program-mes declined by SEK 0.2 billion in fixed pri-ces while expenditure on research and third-cycle courses and programmes rose by SEK 0.9 billion.
Changes in volume for the HEIsFor a number of years the HEIs in Sweden have been experiencing relatively major changes in the numbers of places they offer. For a few years between 2006 and 2008 the economic upturn led to fewer applications from students and the HEIs were unable to make full use of the funding allocated to them and their direct funding declined. In 2008 student demand slowly began to rise again and the HEIs received more funding. The Government and the Riksdag raised fun-ding for 2010–2011 temporarily for 25 HEIs by a total of SEK 700 million because of the re-cession. This temporary supplement came to an end as planned in 2012, which meant that many HEIs received less funding for first and second-cycle courses and programmes. The impact of this was mitigated to some extent by the Government’s decision not to withhold SEK 330 million in 2012 as had previously been announced because of the tuition fee re-form for students from outside the EU/EEA. In addition the Government reallocated fun-ding between HEIs in order to develop spe-cific professional programmes in technology and health care.
Proportion of expenditure(columns, %)
0
20
40
60
80
100
201220082004201220082004201220082004First and second-cycle
courses and programmesResearch and third-cycle courses and programmes
Total
Expenditure(white line, SEK billions)
Depreciation
Clinical research and training
Financial
Staffing
Premises
Other operational costs
White line is the total sum in
SEK billions
0
20
40
60
80
100
Figure 33. HEI expenditure by item 2004–2012 and totals, as well as developments in expen-diture in 2012 prices.

TRENDS AND DEVELOPMENTS 51
In 2012 the HEIs’ revenues for first and se-cond-cycle courses and programmes amoun-ted to SEK 25.9 billion. Compared to the pre-vious year this is a drop of SEK 0.6 billion, a reduction of 2.4 per cent.
Rapid growth in funding for research The research system in higher education is currently undergoing a period of rapid growth. This is an effect of the measures pre-sented by the Government in 2008 in its bill on research policy for the years 2009–2012, which involved raising the level of resources for research and innovation by an amount corresponding to SEK 5 billion. This increase will continue according to the proposals in the 2012 bill on research policy, which involve raising funding levels by an additional SEK 4 billion by 2016. Changes in funding that does not come from public sources will also affect the overall level, but about three-quarters of the funding for research and third-cycle cour-ses and programmes at the HEIs is provided by the state.
The HEIs’ revenues for research and third-cycle courses and programmes amounted in 2012 to SEK 34.9 billion. In current prices this corresponds to an increase of SEK 1.7 billion or 5.3 per cent compared to the previous year. Expressed in terms of fixed prices the rise in revenues was SEK 0.9 billion or 2.7 per cent. Most of this increase came from the state.
Viewed from a longer perspective, the HEIs’ revenues for research and third-cycle courses and programmes were relatively unchanged from 2002 to 2007 at about SEK 28 billion (in 2012 prices). In 2008 there was a rise in revenues in fixed prices and this increase has continued for the last four years. Compared to 2007, revenues for research and third-cycle courses and programmes have risen in fixed prices from SEK 28 billion to 35 billion. This corresponds to an increase of SEK 6.8 billion or 24 per cent.
Large increase in research grants The revenues of the HEIs that come from re-search grants (excluding the funding allocated in the form of grants by the Swedish Legal, Fi-nancial and Administrative Services Agency) amounted in 2012 to SEK 15.1 billion, which is SEK 0.5 billion or 3 per cent more than in the previous year (2012 prices). Grants for re-search and third-cycle courses and program-mes varied for most of the first decade of this century between SEK 11 and 12 billion and, together with the increases in 2010–2012, the HEIs’ revenues from research grants have ri-sen in fixed prices by 30 per cent in four years.
A considerable proportion of government funding for research and third-cycle cour-ses and programmes is channelled through the three research councils, the Swedish Re-search Council, Fas (the Swedish Council for Working Life and Social Research) and For-mas (the Swedish Research Council for En-vironment, Agricultural Sciences and Spati-al Planning) as well as through Vinnova (the Swedish Governmental Agency for Innova-tion Systems). In 2012 a total of SEK 5.9 bil-lion (39 per cent) of the HEIs’ total revenues from grants for research and third-cycle cour-ses and programmes came from these four agencies.
EU funding for research and third-cycle courses and programmes at HEIs in Sweden amounted in 2012 to SEK 1.5 billion, which is somewhat more than in 2011. The rise is due to increased revenues from the European Research Council. Revenues from other in-ternational sources apart from the EU total-led altogether SEK 0.6 billion, in other words more or less the same level as in recent years.
The HEIs’ revenues from Swedish non-profit organisations totalled SEK 3.1 billion in 2012, or 21 per cent of the total grant reve-nue. Combined with funding from companies this means that the private sector in Sweden accounts for a quarter of the total amount re-ceived in the form of research grants.
KEY FIGURES FOR HIGHER EDUCATION INSTITUTIONS 53
Key figures for higher education institutions
54 KEY FIGURES FOR HIGHER EDUCATION INSTITUTIONS
Higher education is offered at about fifty uni-versities, university colleges and other insti-tutions that vary greatly in size and degree of specialisation. The accompanying tables present quantitative data to describe the dif-ferences and similarities between the HEIs. The smallest institutions that are not run by the state have been excluded.
First and second-cycle programmes and courses HE entrants to higher education at the institution. These figures indicate the num-ber of individuals beginning to study for the first time at the institution in the academic year of 2011/12 in Sweden.
Median age of new entrants. Median age of new entrants at the HEIs and new en-trants for the first time in any HEI in the aca-demic year of 2011/12.
Proportion of men. The proportion of men among new entrants.
Total number of students. Total number of students, autumn semester 2012.
Education profile. The number of FTEs in some subject areas – humanities, theology, social science and technology - divided by all FTEs in the academic year of 2011/12.
The proportion of FTEs in second-cycle programmes and courses. The number of FTEs studying in the second cycle divided by all first and second-cycle FTEs in the academic year of 2011/12.
Total number of qualifications awar-ded. The total number of qualifications awarded in the academic year of 2011/12.
Third-cycle programmes and coursesThird-cycle entrants. New students in third-cycle studies, 2012.
Total number of third-cycle students. The number of active third-cycle students, au-tumn semester 2011. Active students are those who have reported at least 1 per cent of full-time study activity.
PhD degrees. The number of PhD degrees awarded, 2012.
Licentiate degrees. The number of licen-tiate degrees awarded, 2012.
Teaching and research staff Teaching and research staff. The num-ber of teaching and research staff (in FTEs), 2012. The figures include professors, senior lectures, lecturers, post-doctoral research fel-lows, visiting lecturers, fixed-term part-time lecturers and other research and teaching staff.
Proportion of women. The proportion of women among teaching and research staff.
Proportion of teaching and research staff with PhDs. The proportion of the teaching and research staff with PhD degrees.
FundingTotal expenditure. Total expenditure (SEK million), 2012.
Proportion of first and second-cycle programmes and courses. The propor-tion of expenditure for first and second-cycle programmes and courses related to total ex-penditure, 2012.
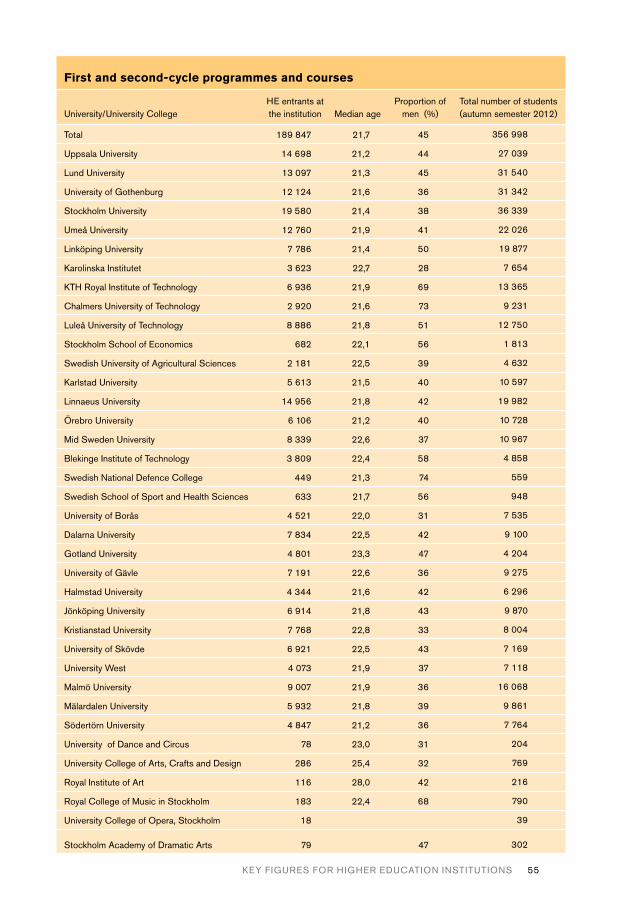
KEY FIGURES FOR HIGHER EDUCATION INSTITUTIONS 55
First and second-cycle programmes and courses
University/University CollegeHE entrants at the institution Median age
Proportion of men (%)
Total number of students (autumn semester 2012)
Total 189 847 21,7 45 356 998
Uppsala University 14 698 21,2 44 27 039
Lund University 13 097 21,3 45 31 540
University of Gothenburg 12 124 21,6 36 31 342
Stockholm University 19 580 21,4 38 36 339
Umeå University 12 760 21,9 41 22 026
Linköping University 7 786 21,4 50 19 877
Karolinska Institutet 3 623 22,7 28 7 654
KTH Royal Institute of Technology 6 936 21,9 69 13 365
Chalmers University of Technology 2 920 21,6 73 9 231
Luleå University of Technology 8 886 21,8 51 12 750
Stockholm School of Economics 682 22,1 56 1 813
Swedish University of Agricultural Sciences 2 181 22,5 39 4 632
Karlstad University 5 613 21,5 40 10 597
Linnaeus University 14 956 21,8 42 19 982
Örebro University 6 106 21,2 40 10 728
Mid Sweden University 8 339 22,6 37 10 967
Blekinge Institute of Technology 3 809 22,4 58 4 858
Swedish National Defence College 449 21,3 74 559
Swedish School of Sport and Health Sciences 633 21,7 56 948
University of Borås 4 521 22,0 31 7 535
Dalarna University 7 834 22,5 42 9 100
Gotland University 4 801 23,3 47 4 204
University of Gävle 7 191 22,6 36 9 275
Halmstad University 4 344 21,6 42 6 296
Jönköping University 6 914 21,8 43 9 870
Kristianstad University 7 768 22,8 33 8 004
University of Skövde 6 921 22,5 43 7 169
University West 4 073 21,9 37 7 118
Malmö University 9 007 21,9 36 16 068
Mälardalen University 5 932 21,8 39 9 861
Södertörn University 4 847 21,2 36 7 764
University of Dance and Circus 78 23,0 31 204
University College of Arts, Crafts and Design 286 25,4 32 769
Royal Institute of Art 116 28,0 42 216
Royal College of Music in Stockholm 183 22,4 68 790
University College of Opera, Stockholm 18 39
Stockholm Academy of Dramatic Arts 79 47 302
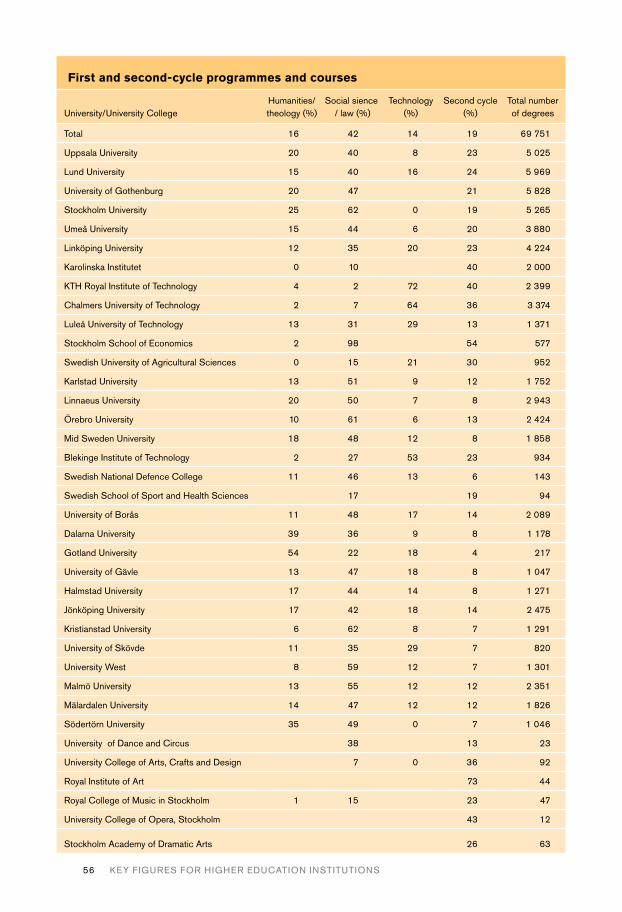
56 KEY FIGURES FOR HIGHER EDUCATION INSTITUTIONS
First and second-cycle programmes and courses
University/University CollegeHumanities/ theology (%)
Social sience / law (%)
Technology (%)
Second cycle (%)
Total number of degrees
Total 16 42 14 19 69 751
Uppsala University 20 40 8 23 5 025
Lund University 15 40 16 24 5 969
University of Gothenburg 20 47 21 5 828
Stockholm University 25 62 0 19 5 265
Umeå University 15 44 6 20 3 880
Linköping University 12 35 20 23 4 224
Karolinska Institutet 0 10 40 2 000
KTH Royal Institute of Technology 4 2 72 40 2 399
Chalmers University of Technology 2 7 64 36 3 374
Luleå University of Technology 13 31 29 13 1 371
Stockholm School of Economics 2 98 54 577
Swedish University of Agricultural Sciences 0 15 21 30 952
Karlstad University 13 51 9 12 1 752
Linnaeus University 20 50 7 8 2 943
Örebro University 10 61 6 13 2 424
Mid Sweden University 18 48 12 8 1 858
Blekinge Institute of Technology 2 27 53 23 934
Swedish National Defence College 11 46 13 6 143
Swedish School of Sport and Health Sciences 17 19 94
University of Borås 11 48 17 14 2 089
Dalarna University 39 36 9 8 1 178
Gotland University 54 22 18 4 217
University of Gävle 13 47 18 8 1 047
Halmstad University 17 44 14 8 1 271
Jönköping University 17 42 18 14 2 475
Kristianstad University 6 62 8 7 1 291
University of Skövde 11 35 29 7 820
University West 8 59 12 7 1 301
Malmö University 13 55 12 12 2 351
Mälardalen University 14 47 12 12 1 826
Södertörn University 35 49 0 7 1 046
University of Dance and Circus 38 13 23
University College of Arts, Crafts and Design 7 0 36 92
Royal Institute of Art 73 44
Royal College of Music in Stockholm 1 15 23 47
University College of Opera, Stockholm 43 12
Stockholm Academy of Dramatic Arts 26 63

KEY FIGURES FOR HIGHER EDUCATION INSTITUTIONS 57
Third-cycle programmes and courses
University/University CollegeNew third-
cycle studentsTotal number of third-cycle stu-dents (autumn semester 2012) PhD degrees
Licentiate degrees
Total 3 718 18 934 2 535 790
Uppsala University 423 2 052 314 75
Lund University 497 2 726 325 62
University of Gothenburg 296 1 676 233 36
Stockholm University 295 1 548 229 65
Umeå University 237 1 122 174 15
Linköping University 204 1 210 169 55
Karolinska Institutet 436 2 307 301 7
KTH Royal Institute of Technology 430 1 952 235 153
Chalmers University of Technology 208 1 149 172 152
Luleå University of Technology 96 523 57 72
Stockholm School of Economics 21 138 16 2
Swedish University of Agricultural Sciences 92 602 103 15
Karlstad University 74 245 25 9
Linnaeus University 51 282 38 6
Örebro University 104 477 55 14
Mid Sweden University 27 201 14 21
Blekinge Institute of Technology 10 102 18 9
Swedish National Defence College
Swedish School of Sport and Health Sciences 9 15
University of Borås 9 45 2
Dalarna University 1 3
Gotland University
University of Gävle 7 10
Halmstad University 6 19 1
Jönköping University 31 146 21 2
Kristianstad University
University of Skövde 9 17
University West 5 9
Malmö University 46 154 13 1
Mälardalen University 74 183 20 19
Södertörn University 21 53
University of Dance and Circus
University College of Arts, Crafts and Design
Royal Institute of Art
Royal College of Music in Stockholm
University College of Opera, Stockholm
Stockholm Academy of Dramatic Arts

58 KEY FIGURES FOR HIGHER EDUCATION INSTITUTIONS
Teaching and research staff Funding
University/University College
Teaching and research staff
(FTE)
Proportion of
women (%)
Teaching and research staff with PhD (%)
Total expenditure
(SEK million)
Proportion of first and second cycle
education (%)
Total 27 878 43 57 60 728 43
Uppsala University 2 624 43 61 5 513 31
Lund University 2 798 37 67 6 926 34
University of Gothenburg 2 438 49 64 5 379 39
Stockholm University 2 132 46 60 4 283 43
Umeå University 1 866 45 62 3 927 42
Linköping University 1 545 39 63 3 323 45
Karolinska Institutet 1 952 52 63 5 506 18
KTH Royal Institute of Technology 1 484 24 57 3 891 32
Chalmers University of Technology 1 097 21 61 3 140 28
Luleå University of Technology 564 35 61 1 452 45
Stockholm School of Economics 96 22 80 374 58
Swedish University of Agricultural Sciences 1 427 44 59 3 150 20
Karlstad University 609 48 47 992 67
Linnaeus University 926 45 44 1 570 74
Örebro University 504 48 55 1 016 67
Mid Sweden University 485 44 48 945 59
Blekinge Institute of Technology 211 38 44 470 65
Swedish National Defence College 219 24 19 482 71
Swedish School of Sport and Health Sciences 78 54 44 135 73
University of Borås 339 52 45 598 75
Dalarna University 417 55 40 595 82
Gotland University 105 36 42 190 76
University of Gävle 354 47 43 544 79
Halmstad University 274 45 45 487 77
Jönköping University 335 53 46 755 73
Kristianstad University 324 59 39 459 86
University of Skövde 240 41 41 403 79
University West 295 53 42 441 80
Malmö University 774 54 47 1 274 81
Mälardalen University 461 50 41 816 75
Södertörn University 352 50 65 647 57
University of Dance and Circus 34 58 6 70 85
University College of Arts, Crafts and Design 67 59 18 165 94
Royal Institute of Art 31 60 2 75 85
Royal College of Music in Stockholm 91 29 8 164 96
University College of Opera, Stockholm 13 54 27 80
Stockholm Academy of Dramatic Arts 48 60 1 134 93

UNIVERSITIES AND UNIVERSITY COLLEGES IN SWEDEN 59
HEIs with entitlement to award first, second and third-cycle qualifications
Accountable to the Government
Uppsala University
Lund University
University of Gothenburg
Stockholm University
Umeå University
Linköping University
Karolinska Institutet
KTH Royal Institute of Technology
Luleå University of Technology
Swedish University of Agricultural Sciences
Karlstad University
Linnaeus University
Mid Sweden University
Örebro University
Blekinge Institute of Technology*
Malmö University*
Mälardalen University*
The Swedish School of Sport and Health Sciences*
University of Borås*
University of Gävle*
Halmstad University*
University of Skövde*
Södertörn University*
University West*
Independent
Chalmers University of Technology
Stockholm School of Economics
Jönköping University*
*University Colleges entitled to award third-cycle qualifi-cations in one or several restricted disciplinary domains at the end of 2012.
HEIs entitled to award first and second-cycle qualifications
Accountable to the Government
Swedish National Defence College
Dalarna University
Gotland University
Kristianstad University
University of Dance and Circus
Stockholm Academy of Dramatic Arts
University College of Arts, Crafts and Design
Royal Institute of Art
Royal College of Music in Stockholm
University College of Opera, Stockholm
Independent
Beckmans College of Design
Ersta Sköndal University College
Gammelkroppa School of Forestry
Johannelund Theological Seminary
Newman Institute
The Red Cross University College
University College of Music Education in Stockholm
Sophiahemmet University College
Stockholm School of Theology
Örebro School of Theology
In addition there are a number of education providers entitled to award qualifications in psychotherapy.
Universities and university colleges in Sweden


Higher education in S
weden 2013 status report
Report 2013:3
The Swedish Higher Education Authority is a government agency that deals with questions concerning universities and university colleges and is responsible for statistics about higher education. The SHEA works with the quality assurance of higher education courses and programmes, monitoring and evaluating efficiency, legal supervision and leadership development in higher education.
You can read more on the web-site www.uk-ambetet.se.