Embed Size (px)
Citation preview
1
1
Higher Education in Egypt Country Review Report
2008
2 3
3
3.6.2 Support services 52 3.6.3 Strategies, policies and management style 53 3.6.4 Self-assessment 54 3.6.5 Student feedback on courses 57 3.6.6 Student assessment methods 57
3.7 Educational outputs 59 3.7.1 Student achievement, knowledge and skills 59 3.7.2 Stakeholders’ views 60
3.9 References 60
CHAPTER 4. EQUITY 63
4.1 Introduction 63 4.2 Inequity at provincial level 63 4.3 Gender inequity 64 4.4 Special needs and gifted students 67 4.5 Future targets for equity in higher education 67 4.6 References 67
CHAPTER 5. EXTERNAL EFFICIENCY 68
5.1 Introduction 68 5.2 Employment 685.3 Higher Education and the labour market 69 5.4 Academic programs and the labour market 73 5.5 Specialization patterns 73 5.6 Higher education role and investment 74 5.7 Key skills in academic programs 74 5.8 Relation of employers HE institutes 74 5.9 Careers guidance 75
CHAPTER 6. COSTS AND FINANCING OF HIGHER EDUCATION 75
6.1 Introduction 76 6.2 Costs and financing 76
6.2.1 Case study: Ain Shams University 77 6.2.2 Diversifying funding sources 78 6.2.2 Cost-sharing options 82
6.3 Public spending 83 6.3.1 Spending on research 84
References 85
CHAPTER 7. GOVERNANCE 86
7.1 Introduction 87 7.2 Strategic planning 87 7.3 Management 88 7.4 Information management 89 7.5 Operational management 90
CHAPTER 8. RESEARCH & INNOVATION
8.1 Introduction 8.2 Research bodies in Egypt
2
Table of Contents
1.9.1 Public and Al Azhar universities 16 1.9.2 Private universities 17 1.9.3 The middle/higher technical institutes (private and public) 19
1.10 Degrees offered in the higher education system 19 1.11 Student enrolment and teaching staff 20 1.12 Admission to higher education 21
CHAPTER 2. ACCESS 22
2.1 Introduction 22 2.2 Enrolment and transition to higher education 22
Basic education 22 Secondary education 23 Higher education 24 International comparisons 27 Geographical distribution of higher education 28 Distribution of students by discipline 30
2.3 Issues affecting access 31 Transparency 31 Public educational grants and scholarships 32 Women’s enrolment 32
2.4 Internal efficiency 32
CHAPTER 3. QUALITY 33
3.1 Introduction 33 3.2 The National Authority for Quality Assurance and Accreditation of Education 33 Box 3.1. The Steering Committee for the Project of Continuous Improvement and Qualifying for Accreditation 35 3.3 Internal quality assurance 36 3.4 Quality of educational inputs 36
3.4.1 Academic staff/assistants 36 3.4.2 Students 42 3.4.3 Resources 44
3.5 Laws and regulations 49 3.5.1 Staff appointments 50
3.6 Quality of the educational process 51 3.6.1 Teaching staff-student interaction 51
4 5
4
8.2.1 Major reform 93 8.3 Financing research 94
8.3.1 Funding 94 8.3.2. Expenditures on research institutes 95 8.3.3 Funding programmes 95
8.4 Research staff 96 8.4.1 Student involvement in research 96 8.4.2 Researchers’ mobility 97 8.4.3. Researchers’ publications 98
8.5 Infrastructure and information resources for research 100 8.6 Business-academia relationships 100 8.7 Research and globalisation 100
CHAPTER 9. INTERNATIONALISATION 102
9.1. Introduction 102 9.2. International mobility 102
9.2.1 Mobility of Egyptian faculty members 102 9.2.2 Mobility of foreign faculty members 104 9.2.3 Mobility of Egyptian undergraduates 105 9.2.4 Mobility of foreign undergraduates 106
9.3 Curriculum issues 110 9.4 Foreign languages 110
6 7
7
CHAPTER 1. THE CONTEXT OF HIGHER EDUCATION
1.1 Introduction
This chapter introduces the current context of higher education in Egypt. It provides an overview of the Egyptian education system in general, together with the higher education system. This contextual chapter also looks at the socio–cultural setting, economic growth, the constitution and legal system, and the workforce distribution.
1.2 Historical background
Egypt’s location is very strategic, linking Africa with Asia. This special location has exposed Egypt to the rule of a number of different civilisations, including Ptolemies, Romans, Greeks, Pharaohs, Arabs, Fatimids, Mamluks, Ottomans, and Napoleon Bonaparte. Each of these had its own influence on the Egyptian culture. However, the Arabic and Muslim cultures can be claimed to have had the most significant impact on Egypt.
In 1882, Egypt was invaded by the British, who took control of political life and government policies. In response to liberation movements, in 1922 the UK unilaterally declared Egypt’s independence. However, this was only a partial independence and the UK continued to dominate life in the nation. This situation continued until 1936, when the Anglo-Egyptian treaty was signed. This required British troops to withdraw from Egypt, except from the Suez Canal. This withdrawal was fully accomplished in 1954, following the 1952 revolution in which Egypt declared itself as republic.
Since then, Egypt has passed through different eras, beginning with socialism mainly endorsed by President Nasser. The socialist era was followed by an open door policy in economic initiated by President Sadat. The current era is striving for economic development, initiated by President Mubarak. Each of these eras has had its own impact on the Egyptian context in terms of economics, politics and education in general and higher education specifically.
At the beginning of the 21st century the higher education system is facing unprecedented challenges arising from the impacts of globalisation, the increasing importance of knowledge as a key driver of growth, and the information and communication revolution. Opportunities are emerging from these challenges, such as the role of education in constructing knowledge economies. In recognition of all these facts, the Ministry of Higher Education is trying to analyse the current situation in the higher education system and to seek new avenues for improvement.
1.3 Geographic and demographic information
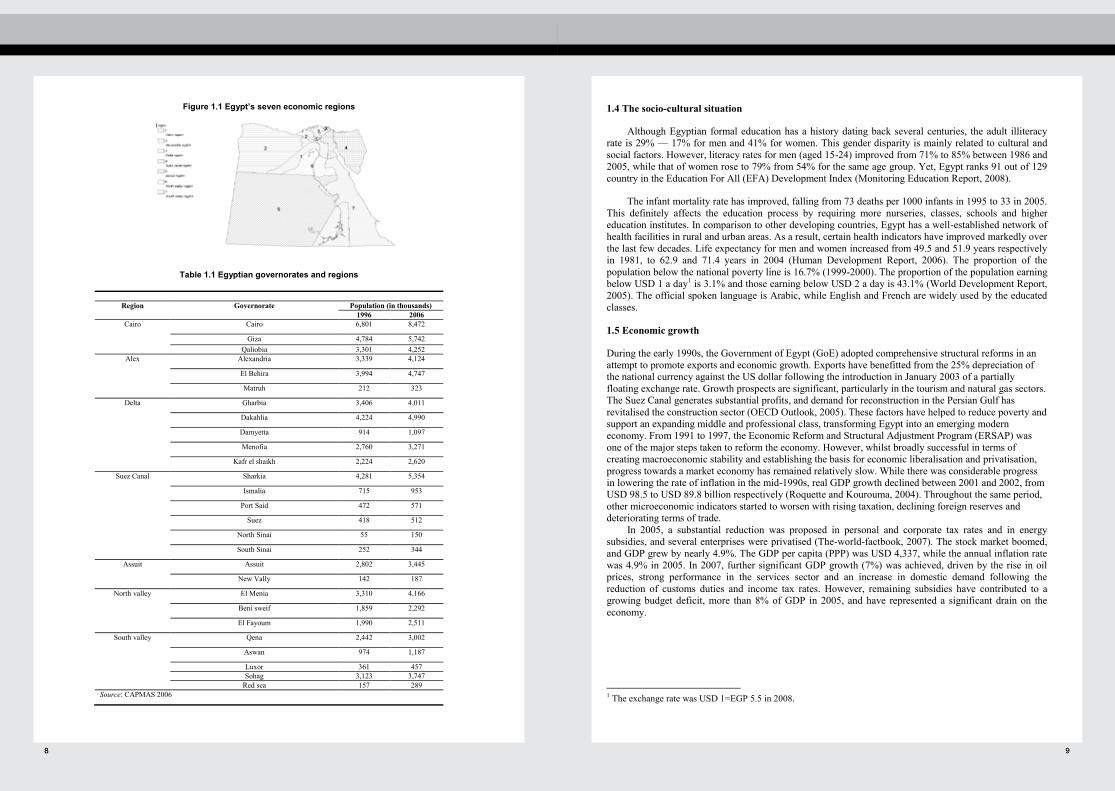
Egypt covers around 1million square kilometres; its main features are the River Nile and the desert. Over 97% of the population lives in the narrow strip of the Nile Valley and in the Nile Delta, which represents together around 5% of the country’s total land. The country is divided into 28 governorates, under seven economic regions (Figure 1.1 and Table 1.1). In 2006 Egypt’s population was estimated at 71.3 million (34.8 million females and 36.5 million males). The annual population growth rate is 1.8%, and the average density is 70.7 inhabitants/km2. The urban population is 42% of the total population (CAPMAS, 2006). Nearly 13% of the population is of primary school age.
6
Preface Higher education, in Egypt, is facing unprecedented challenges at the beginning of the 21st century, arising from the convergent impacts of globalization, the increasing importance of knowledge as a main driver of growth, and the information and communication revolution. However, opportunities are coming out of these challenges, one of these is the role of education in general, and tertiary education in particular, in the construction of knowledge economies. Recognizing these facts, in 1997, a National Commission on Higher Education Reform was established by the Ministry of Higher Education, to diagnose the challenges that confront higher education in Egypt and set education strategies. This led to a National Conference in 2000 that aimed at having a long-term reform program within a period of seventeen years. The major objectives of this reform were, first, to raise the level of efficiency by granting universities more autonomy and by rationalizing government funding. Second, to raise quality through faculty and staff training as well as through the introduction of a competitive fund. Third, to improve the quality and relevance of mid-level technical education and raise its standing, reform curricula, strengthen management, and consolidate small institutions. These objectives have been prioritised according to the funds' variability; and the government endorsed six projects for the five-year plan 2002-2007, namely, the Faculty and Leadership Development Project (FLDP), the Technical Colleges Project (TCP), Quality Assurance and Accreditation Project (QAAP), the Faculties of Education Project (FOEP), the Information and Communication Technology Project (ICTP), and the Higher Education Enhancement Project Fund (HEEPF).
Learning from its experience, the Ministry of Higher Education represented by the Strategic Planning Unit (SPU), is very keen to adopt a systematic approach for educational planning that is based on sound information about academic needs and priorities. This approach should enhance the efficiency of the decision-making processes. In this spirit, SPU takes the lead to introduce the so called Education Sector Analysis (ESA), which is summarised in this document, as a milestone in the desired planning process. In order to meet the international standards, the terms of reference for this analysis has been fully prepared by the SPU team then discussed with OECD and World Bank experts. Generally, it is agreed that the SPU team conducts an ESA in a form of background report which is summarised in this document. This report examines the status, functions and results of the higher educational system in Egypt trying to identify the strengths and weaknesses of the higher education system in Egypt with opportunities for improvement. Specifically, the report addresses the country specific context of human resources and development together with the following angles Access, Internal efficiency, Quality, External efficiency, Costs and financing, Management and governance, Equity, and internationalization In parallel a joint OECD and World Bank report which provides an overview of higher education in Egypt and offers analysis on the same angles is prepared against the background report prepared by the SPU team and information supplied in meetings in the course of site visits. This review of education policy was undertaken within the framework of the programme of work of the OECD Directorate for Education in partnership with the World Bank. Egypt within this context is taking a pioneer step in the Middle East and Africa.
For more information about the Report, please contact:Prof Galal Abdel Hamid,Minister advisor for the Strategic PlanningMinistry of Higher Education96 Ahmed Oraby Street, El Mohandseen, El Giza
Tel.: +2 02 334 586 10 ext 239Fax: +2 02 334 586 10 ext 274Website: http://www.mhe-spu.org
8 9
9
1.4 The socio-cultural situation
Although Egyptian formal education has a history dating back several centuries, the adult illiteracy rate is 29% — 17% for men and 41% for women. This gender disparity is mainly related to cultural and social factors. However, literacy rates for men (aged 15-24) improved from 71% to 85% between 1986 and 2005, while that of women rose to 79% from 54% for the same age group. Yet, Egypt ranks 91 out of 129 country in the Education For All (EFA) Development Index (Monitoring Education Report, 2008).
The infant mortality rate has improved, falling from 73 deaths per 1000 infants in 1995 to 33 in 2005. This definitely affects the education process by requiring more nurseries, classes, schools and higher education institutes. In comparison to other developing countries, Egypt has a well-established network of health facilities in rural and urban areas. As a result, certain health indicators have improved markedly over the last few decades. Life expectancy for men and women increased from 49.5 and 51.9 years respectively in 1981, to 62.9 and 71.4 years in 2004 (Human Development Report, 2006). The proportion of the population below the national poverty line is 16.7% (1999-2000). The proportion of the population earning below USD 1 a day1 is 3.1% and those earning below USD 2 a day is 43.1% (World Development Report, 2005). The official spoken language is Arabic, while English and French are widely used by the educated classes.
1.5 Economic growth
During the early 1990s, the Government of Egypt (GoE) adopted comprehensive structural reforms in an attempt to promote exports and economic growth. Exports have benefitted from the 25% depreciation of the national currency against the US dollar following the introduction in January 2003 of a partially floating exchange rate. Growth prospects are significant, particularly in the tourism and natural gas sectors. The Suez Canal generates substantial profits, and demand for reconstruction in the Persian Gulf has revitalised the construction sector (OECD Outlook, 2005). These factors have helped to reduce poverty and support an expanding middle and professional class, transforming Egypt into an emerging modern economy. From 1991 to 1997, the Economic Reform and Structural Adjustment Program (ERSAP) was one of the major steps taken to reform the economy. However, whilst broadly successful in terms of creating macroeconomic stability and establishing the basis for economic liberalisation and privatisation, progress towards a market economy has remained relatively slow. While there was considerable progress in lowering the rate of inflation in the mid-1990s, real GDP growth declined between 2001 and 2002, from USD 98.5 to USD 89.8 billion respectively (Roquette and Kourouma, 2004). Throughout the same period, other microeconomic indicators started to worsen with rising taxation, declining foreign reserves and deteriorating terms of trade.
In 2005, a substantial reduction was proposed in personal and corporate tax rates and in energy subsidies, and several enterprises were privatised (The-world-factbook, 2007). The stock market boomed, and GDP grew by nearly 4.9%. The GDP per capita (PPP) was USD 4,337, while the annual inflation rate was 4.9% in 2005. In 2007, further significant GDP growth (7%) was achieved, driven by the rise in oil prices, strong performance in the services sector and an increase in domestic demand following the reduction of customs duties and income tax rates. However, remaining subsidies have contributed to a growing budget deficit, more than 8% of GDP in 2005, and have represented a significant drain on the economy.
1 The exchange rate was USD 1=EGP 5.5 in 2008.
8
Figure 1.1 Egypt’s seven economic regions
Table 1.1 Egyptian governorates and regions
Region Governorate Population (in thousands)
1996 2006 Cairo Cairo 6,801 8,472
Giza 4,784 5,742 Qaliobia 3,301 4,252
Alex Alexandria 3,339 4,124
El Behira 3,994 4,747
Matruh 212 323
Delta Gharbia 3,406 4,011
Dakahlia 4,224 4,990
Damyetta 914 1,097
Menofia 2,760 3,271
Kafr el shaikh 2,224 2,620
Suez Canal Sharkia 4,281 5,354
Ismalia 715 953
Port Said 472 571
Suez 418 512
North Sinai 55 150
South Sinai 252 344
Assuit Assuit 2,802 3,445
New Vally 142 187
North valley El Menia 3,310 4,166
Beni sweif 1,859 2,292
El Fayoum 1,990 2,511
South valley Qena 2,442 3,002
Aswan 974 1,187
Luxor 361 457 Sohag 3,123 3,747
Red sea 157 289 Source: CAPMAS 2006

10 11
11
Table 1.2 Distribution of employment by activity, 2001/02 and 2005/06
2001/02 2005/06
Agriculture 28.40% 27.29% Mining, petroleum and industry 12.62% 13.45% Construction 7.78% 7.80% Education and health services 5.61% 6.23% Services 45.59% 45.23% Source: Ministry of Economic Development
Figure 1.2 Workforce distribution by sector 2005/06
1.8 Overall education structure
Egypt’s political leadership considers education to be an issue of national security. Therefore, the education policy has been given special attention through various development programmes covering its goals, aspects and dimensions over the last few years. The goal of universalising education began with the first Egyptian constitution in 1923 — Article 19 states that elementary education is compulsory for all Egyptian children. Egypt is also one of the countries that signed the Universal Declaration of Human Rights in 1948, thus agreeing to all the human rights it encompasses, Article 26 states that everyone has the right to education. This step has focused on establishing a unified compulsory elementary education system (EDUCATION DEVELOPMENT National, 2000). Despite this, the previous regime (roughly 1840-1952), together with the British occupying government (1882-1954), did little to improve the education system. The British did not consider education to be one of their priorities in Egypt; they reduced spending on education and imposed fees for primary education. In addition, they shaped the educational system to meet
28.4
0%
12.6
2%
7.78
%
5.61
%
45.5
9%
27.2
9%
13.4
5%
7.80
%
6.23
%
45.2
3%
0.00%
5.00%
10.00%
15.00%
20.00%
25.00%
30.00%
35.00%
40.00%
45.00%
50.00%
Agriculture Mining, petroleum and industry
Construction Education and health services
Services
2001/02
2005/06
10
1.6 The constitution, legislation and political systems
The Egyptian Constitution of 1971 has its roots in both English Common Law and the Napoleonic Code. A 1980 amendment to the constitution made Islamic Law (Sharia) the official law and thus the Koran became the most significant basis for legislation.
The president is the head of state and is elected by popular vote for a six-year term, with the possibility of re-election. The president nominates all ministers and one or more vice-presidents. Finally, the president can also hold a referendum on important matters. The Council of Ministers is the highest executive and administrative body in the Egyptian Republic. In collaboration with the president, the cabinet must determine the general policies of the country and ensure their fulfilment. The prime minister is appointed by the president, controls the work of the government and is responsible to the president.
The Egyptian Parliament is bicameral and consists of the People's Assembly (Majlis El-Shaab) and the Advisory Council (Majlis El-Shourah). The Majlis El-Shaab has the power to approve all new legislation, the budget and the government’s development plans. It also has the right to undertake investigations and to charge taxes. Furthermore, it appoints the presidential candidate and can pass a vote of no confidence in the cabinet or any cabinet member. The Majlis El-Shaab is elected for a five-year term and must consist of "not less than 350" elected members, of which half must be farmers and workers. Additionally, 10 members are appointed by the president. The Majlis El-Shourah advises and proposes new laws and regulations to the Majlis El-Shaab. It has 140 members, half of which are nominated by the president. Egypt has a multi-party system (22 parties). The National Democratic Party (NDP) has been the longest ruling party and dominates the Egyptian political arena.
1.7 Workforce distribution
In 2006, the total workforce was found to be 21,017 thousand, with 2,040 thousand unemployed, i.e. an unemployment rate of 9.3%. The unemployed are distributed almost equally among the rural and urban areas. This rate has not improved significantly since 1995 (11.2%), due to the gradual reform of the civil service in which one million posts have been removed
The unemployment rate for women was found to be 25% of the total labour force, which is worse than the 20.3% rate of the mid-nineties. There has been an improvement in rural areas, where women’s employment rate rose from 17.8% in 1998 to 26.1% in 2006. However, the diminishing role of the public sector as a traditional employer of women has prevented any further improvement in these figures.
If educational attainment is considered, the unemployment rates (of people aged over 15) were 0.9% 19.8% and 14% for people with only primary education, for those with secondary education and for those with higher education respectively.
The government still plays a significant role in the labour market, accounting for 26.5% of the employed labour force (around 5.58 million people), although this has fallen from 40% in 1982. The government’s privatisation policy and the efforts made to formalise the informal private sector have encouraged many people to move from the public to the private sector and have created many new jobs. Thus the share of the private sector in the total labour force is now 68.5% (14 million employees). Between 2001 and 2005 (Table 1.2), the share of employees in the agriculture sector fell, while the share of employment in mining, petroleum and industry rose, together with the construction sector. In 2005/06, employment was distributed as follows: services (45%), agriculture (27%), mining, petroleum and industry (13%), and construction (8%). The workforce in the education and health sector represented about 6% of the total (Figure 1.2).

12 13
13
Figure 1.3 Educational system in Egypt
12
their own needs, which were for obedient governmental clerks. In addition they undermined the diffusion of literacy; in 1917, after 35 years of British rule, over 90% of the population was illiterate (Richards, 1982).
In 1981 another law (Education Law No. 139) was issued, grounded in the constitution, stressing that “the state should work hard to extend compulsory education to other educational stages”. In 1999, a further law (No. 23) emphasised that compulsory education should last for nine years and that primary education should represent six of those nine years.
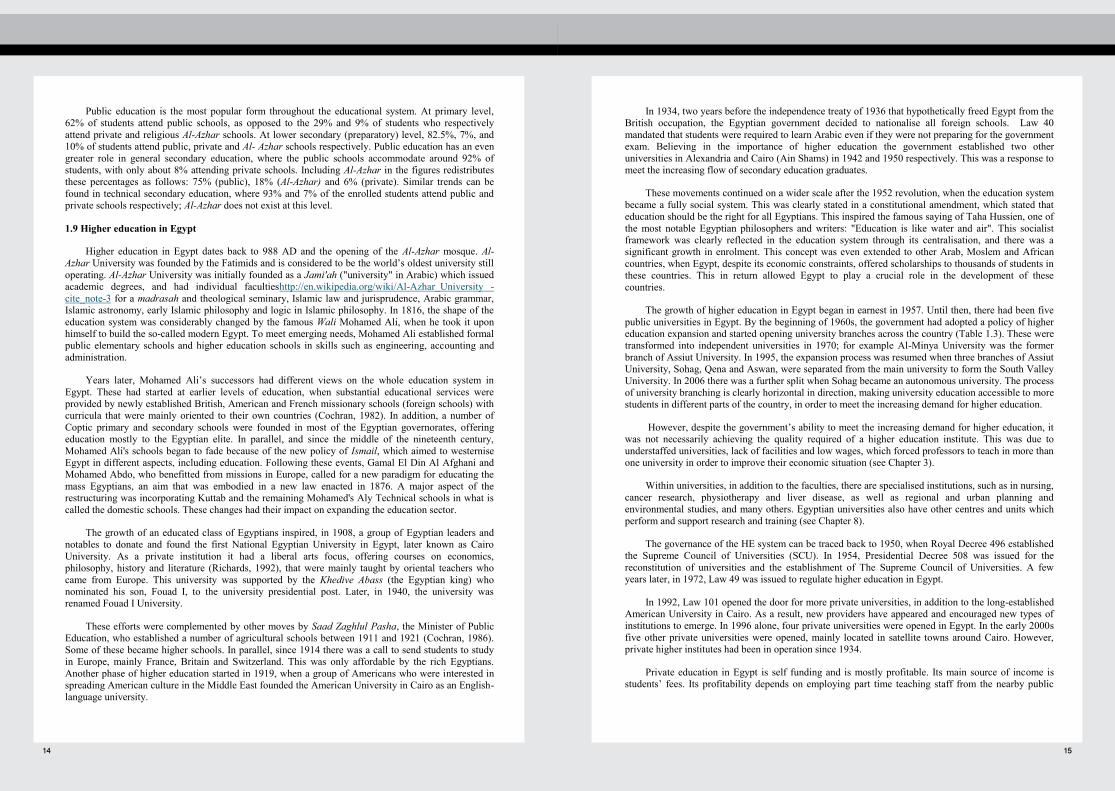
The main advantage of the education system in Egypt is its simple structure, especially when compared with other complicated education systems such as the French one. Egypt’s current education structure by age and level is schematically represented in Figure 1.3. This diagram highlights the following different levels of education:
Basic schooling (primary and preparatory): Nine years of basic education (six years of primary and three years of preparatory) are a right for all Egyptian children from the age of six. After grade 9, children may join general secondary schools or technical secondary schools.
General secondary schooling: This stage starts from grade 10 and aims to prepare students for practical life, as well as for higher education. The stage lasts for three years. Graduates of secondary education normally join higher education institutes through a very competitive process based mainly on the results of the secondary school leaving exam (Thanaweya Amma).
Technical secondary schools (industrial, agricultural and commercial): Study at technical secondary schools is implemented at two levels. The first level prepares a group of technicians at technical secondary schools via a three-year system. The second level prepares senior technicians at technical secondary schools via a five-year system. The graduates from both tracks are entitled to join higher education according to their results in the final exam. However, their transition rates are relatively low when compared to graduates of the general secondary education.
University and higher education: This type of education is implemented in universities or higher specialised institutes. The duration of study ranges from two years in middle technical institutes to four, five, or six years in university colleges and higher institutes. Masters and PhD degrees need at least two years and three years respectively to be awarded. There is a small private higher education sector, mainly comprised of 15 private universities.
Al-Azharite education: Al-Azharite (religious) education follows the same direction as general education in terms of hours of study for each school subject. However, Al-Azhar offers religious instruction as part of the curriculum. The share of Al-Azhar in primary level education is large but progressively declines at higher levels. The Azhar schools are all over the country.
14 15 15
In 1934, two years before the independence treaty of 1936 that hypothetically freed Egypt from the British occupation, the Egyptian government decided to nationalise all foreign schools. Law 40 mandated that students were required to learn Arabic even if they were not preparing for the government exam. Believing in the importance of higher education the government established two other universities in Alexandria and Cairo (Ain Shams) in 1942 and 1950 respectively. This was a response to meet the increasing flow of secondary education graduates.
These movements continued on a wider scale after the 1952 revolution, when the education system became a fully social system. This was clearly stated in a constitutional amendment, which stated that education should be the right for all Egyptians. This inspired the famous saying of Taha Hussien, one of the most notable Egyptian philosophers and writers: "Education is like water and air". This socialist framework was clearly reflected in the education system through its centralisation, and there was a significant growth in enrolment. This concept was even extended to other Arab, Moslem and African countries, when Egypt, despite its economic constraints, offered scholarships to thousands of students in these countries. This in return allowed Egypt to play a crucial role in the development of these countries.
The growth of higher education in Egypt began in earnest in 1957. Until then, there had been five public universities in Egypt. By the beginning of 1960s, the government had adopted a policy of higher education expansion and started opening university branches across the country (Table 1.3). These were transformed into independent universities in 1970; for example Al-Minya University was the former branch of Assiut University. In 1995, the expansion process was resumed when three branches of Assiut University, Sohag, Qena and Aswan, were separated from the main university to form the South Valley University. In 2006 there was a further split when Sohag became an autonomous university. The process of university branching is clearly horizontal in direction, making university education accessible to more students in different parts of the country, in order to meet the increasing demand for higher education.
However, despite the government’s ability to meet the increasing demand for higher education, it was not necessarily achieving the quality required of a higher education institute. This was due to understaffed universities, lack of facilities and low wages, which forced professors to teach in more than one university in order to improve their economic situation (see Chapter 3).
Within universities, in addition to the faculties, there are specialised institutions, such as in nursing, cancer research, physiotherapy and liver disease, as well as regional and urban planning and environmental studies, and many others. Egyptian universities also have other centres and units which perform and support research and training (see Chapter 8).
The governance of the HE system can be traced back to 1950, when Royal Decree 496 established the Supreme Council of Universities (SCU). In 1954, Presidential Decree 508 was issued for the reconstitution of universities and the establishment of The Supreme Council of Universities. A few years later, in 1972, Law 49 was issued to regulate higher education in Egypt.
In 1992, Law 101 opened the door for more private universities, in addition to the long-established American University in Cairo. As a result, new providers have appeared and encouraged new types of institutions to emerge. In 1996 alone, four private universities were opened in Egypt. In the early 2000s five other private universities were opened, mainly located in satellite towns around Cairo. However, private higher institutes had been in operation since 1934.
Private education in Egypt is self funding and is mostly profitable. Its main source of income is students’ fees. Its profitability depends on employing part time teaching staff from the nearby public
14
Public education is the most popular form throughout the educational system. At primary level, 62% of students attend public schools, as opposed to the 29% and 9% of students who respectively attend private and religious Al-Azhar schools. At lower secondary (preparatory) level, 82.5%, 7%, and 10% of students attend public, private and Al- Azhar schools respectively. Public education has an even greater role in general secondary education, where the public schools accommodate around 92% of students, with only about 8% attending private schools. Including Al-Azhar in the figures redistributes these percentages as follows: 75% (public), 18% (Al-Azhar) and 6% (private). Similar trends can be found in technical secondary education, where 93% and 7% of the enrolled students attend public and private schools respectively; Al-Azhar does not exist at this level.
1.9 Higher education in Egypt
Higher education in Egypt dates back to 988 AD and the opening of the Al-Azhar mosque. Al-Azhar University was founded by the Fatimids and is considered to be the world’s oldest university still operating. Al-Azhar University was initially founded as a Jami'ah ("university" in Arabic) which issued academic degrees, and had individual facultieshttp://en.wikipedia.org/wiki/Al-Azhar_University - cite_note-3 for a madrasah and theological seminary, Islamic law and jurisprudence, Arabic grammar, Islamic astronomy, early Islamic philosophy and logic in Islamic philosophy. In 1816, the shape of the education system was considerably changed by the famous Wali Mohamed Ali, when he took it upon himself to build the so-called modern Egypt. To meet emerging needs, Mohamed Ali established formal public elementary schools and higher education schools in skills such as engineering, accounting and administration.
Years later, Mohamed Ali’s successors had different views on the whole education system in Egypt. These had started at earlier levels of education, when substantial educational services were provided by newly established British, American and French missionary schools (foreign schools) with curricula that were mainly oriented to their own countries (Cochran, 1982). In addition, a number of Coptic primary and secondary schools were founded in most of the Egyptian governorates, offering education mostly to the Egyptian elite. In parallel, and since the middle of the nineteenth century, Mohamed Ali's schools began to fade because of the new policy of Ismail, which aimed to westernise Egypt in different aspects, including education. Following these events, Gamal El Din Al Afghani and Mohamed Abdo, who benefitted from missions in Europe, called for a new paradigm for educating the mass Egyptians, an aim that was embodied in a new law enacted in 1876. A major aspect of the restructuring was incorporating Kuttab and the remaining Mohamed's Aly Technical schools in what is called the domestic schools. These changes had their impact on expanding the education sector.
The growth of an educated class of Egyptians inspired, in 1908, a group of Egyptian leaders and notables to donate and found the first National Egyptian University in Egypt, later known as Cairo University. As a private institution it had a liberal arts focus, offering courses on economics, philosophy, history and literature (Richards, 1992), that were mainly taught by oriental teachers who came from Europe. This university was supported by the Khedive Abass (the Egyptian king) who nominated his son, Fouad I, to the university presidential post. Later, in 1940, the university was renamed Fouad I University.
These efforts were complemented by other moves by Saad Zaghlul Pasha, the Minister of Public Education, who established a number of agricultural schools between 1911 and 1921 (Cochran, 1986). Some of these became higher schools. In parallel, since 1914 there was a call to send students to study in Europe, mainly France, Britain and Switzerland. This was only affordable by the rich Egyptians. Another phase of higher education started in 1919, when a group of Americans who were interested in spreading American culture in the Middle East founded the American University in Cairo as an English-language university.

16 17
17
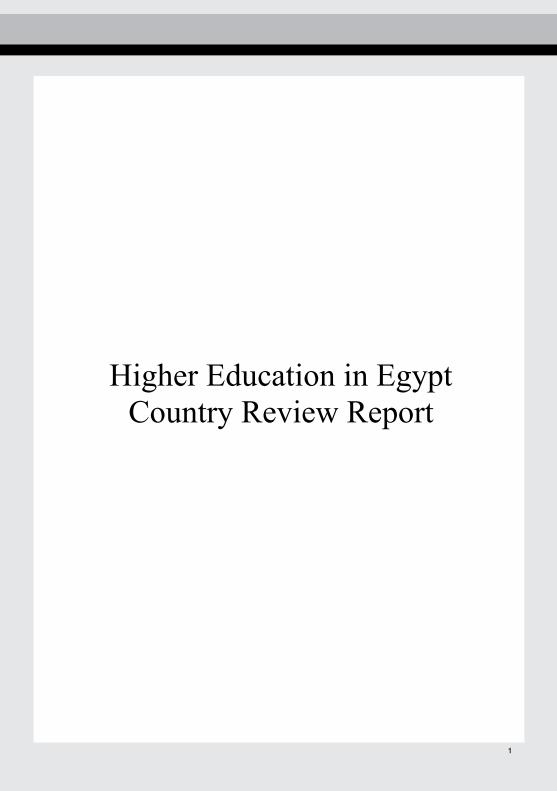
Figure 1.4 Growth of public universities in Egypt, 1908-2006
1.9.2 Private universities
An account of Egyptian university education would not be complete without describing the 17 private universities (Table 1.4). These private universities do not receive state funding and are solely dependent on their own resources and support from foundations and societies. Given the small number of students attending them, these universities do not play a significant role in HE. Neither do they contribute to research, other than the American University in Cairo, which is the best English language publisher in Egypt. Figure 1.5 shows that the number of private universities increased gradually until 2006, when another six universities were approved for opening. This can be explained by the fact that by then the government had been able to evaluate the experience and decided to allow further expansion.
0
2
4
6
8
10
12
14
16
18
1908 1942 1950 1957 1972 1974 1975 1976 1995 2005 2006
Num
ber o
f pup
lic u
nive
rsiti
es
Year
16
universities or setting high fees. Until 2008, the private sector was exempt from any domestic taxes, which greatly helped to optimise profits.
1.9.1 Public and Al Azhar universities
Most public universities (11) are located in the Cairo, Alexandria and Delta regions, while there are only six in the upper Egypt regions (Table 1.3). This does not include Al-Azhar University, which has a wide range of branches and institutes across the country and covers all the regions in Egypt. Figure 1.4 shows the growth of public universities between 1908 and 2006. Clearly some periods were more active than others, such as the 1970s and mid-2000s.
Table 1.3 List of public Egyptian universities
Public Egyptian Universities Founded in
1 Cairo University 1908 2 Alexandria University 1942 3 Ain shams University 1950 4 Assiut University 1957 5 Tanta University 1972 6 Al Mansoura University 1972 7 Al Zagazig University 1974 8 Helwan University 1975 9 Al Menia University 1976 10 Al Menofia University 1976 11 Suez Canal University 1976 12 South Valley University 1995 13 Banha University 2005 14 Fayoum University 2005 15 Beni Sweif University 2005 16 Kafr El-Shiekh University 2006 17 Sohag University 2006
Source: SPU database

18 19 19
1.9.3 The middle/higher technical institutes (Public and private)
The government has paid special attention to the public middle technical institutes and has a reasonable network of 45 institutes that have lately been integrated into 8 new bodies known as technological colleges. The HE system also includes 133 private institutes of technical and professional education. Of these 133 institutes, there are 22 two-year private middle technical institutes (MTI), while 111 are four or five-year higher technical institutes. Figure 1.6 shows that these private institutes began to flourish in the late 1980s.
Figure 1.6 Growth of private higher institutes in Egypt, 1996-2007
1.10 Degrees offered in the higher education system
The higher education system offers two types of undergraduate degrees: bachelors (bachelors of arts and bachelors of science) and diplomas. The bachelors’ degree is awarded by public and private universities after four, five or six year programmes (or their equivalent in private higher institutes). The diploma (mainly called vocational qualifications) is granted after a two-year degree programme in a technical college or private middle institute. In addition, the public higher education system also grants diplomas, masters (MA and MSc) and PhD degrees after fulfilling the requirements of different postgraduate programmes.
However, there is a mismatch between the number of students who are enrolled in the two types of degrees: 93.5% of those enrolled are studying for a bachelor degree, while only 6.5% are studying for a diploma. This can be explained by many inherited problems in the vocational education system, such as poor funding and quality of education, low status and the low transition rate to university education due to the limited places offered to vocational education graduates by universities.
A major drawback of the HE system is that, apart from individual efforts in some institutes, the Ministry of Higher Education (MoHE) does not have a national framework for increasing the international relevance and competitiveness of its higher education system. Neither is there any link with major global structural reform processes, such as “the Bologna Process” (see Chapter 3) adopted
18
Table 1.4 List of Egyptian private universities
Egyptian private universities Founded in Al-Ahram Canadian University (ACU) 2004 American University in Cairo (AUC) 1919 Arab Open University (AOU) 2003 British University in Egypt (BUE) 2004 Canadian International College (CIC) 2004 Université Française d’Égypte (UFÉ) 2002 Future University 2006 German University in Cairo (GUC) 2002 Misr International University (MIU) 1996 Misr University for Science and Technology (MUST) 1996 Modern Sciences and Arts University (MSA) 1996 Nile University 2006 October 6 University 1996 Pharos University in Alexandria (PUA) 2006 Heliopolis University 2007 Sinai Private University 2005 Russian University 2006
Figure 1.5 Growth of private universities in Egypt, 1919-2007
0
2
4
6
8
10
12
14
16
18
1919 1996 2002 2003 2004 2005 2006 2007
Num
ber o
f pri
vate
uni
vers
ities
Year
20 21
21
1.12 Admission to higher education
The main way for general secondary school leavers to enter a higher education programme in Egypt is to perform adequately in the centralised national exam (Thanaweya Amma). This exam used to be held in the last year of secondary education, and was perceived as a nightmare by students and their families being the only way of admission to HE. For this purpose many students resorted to private tutoring in order to pass, placing an added financial burden on their families. In order to remove some tension, the government split Thanweya Amma into two exams spread over the last two years of secondary education — the total grades are considered as the final result with one year validity. Unfortunately, this has actually exacerbated the problem as the perception is now that there are not one, but two Thanweya Amma.
The examination is administered annually by the Ministry of Education. Those students who pass can apply to HE through a Central Placement Office (CPO) which distributes students based on the following criteria:
The maximum number of students that can be accommodated by each higher education institute, which is normally decided by MoHE and the Supreme Council of Universities (SCU).
The rank of the scores of candidates wishing to enter the same higher education programmes.
The candidates’ own list and ranking of higher education institutions he/she wishes to join.
The fact that a single style examination is applied as a single criteria ignores other qualities of students. Including other characteristics could improve the validity of the selection process.
In the meantime, students who are enrolled in vocational secondary education may also join HE, but this depends on their results in the final year of their secondary schools. However, a smaller number of places in public HE institutes is available for these students. Some private institutes/universities are more flexible in enrolling these students.
In May 2008, the government organised a national conference on the reform of secondary education and the HE admission policies. The recommendations focus mainly on reducing the burden on the students and their families by conducting a final single exam in the last year of secondary education and introducing an admission test for higher education. Thus admission to HE would be based on a weighted grade from both exams. In the meantime, the conference strongly recommended extending the validity of the Thanaweya Amma exam from only one year to at least three years. This specific recommendation is part of the new proposals for a more flexible education system that allows students to move in and out of the system based on newly defined rules. New proposals include restructuring the secondary education system for developing students’ skills for joining the labour market and meeting the needs of modern employers. Therefore, the new system will not be restricted to any type of secondary education, whether technical, vocational secondary education or general education. It is believed that instead, solid, broad-based knowledge and generic skills — such as the ability to learn, communicate and engage in teamwork — form the basis of all essential work tasks. This would be accomplished through different proposed measures such as introducing a new curriculum that will enhance critical thinking and problem solving.
20
by the European Union which relates to three levels: bachelor degrees (three years), postgraduate masters degrees (two years) and PhDs (three years).
1.11 Student enrolment and teaching staff
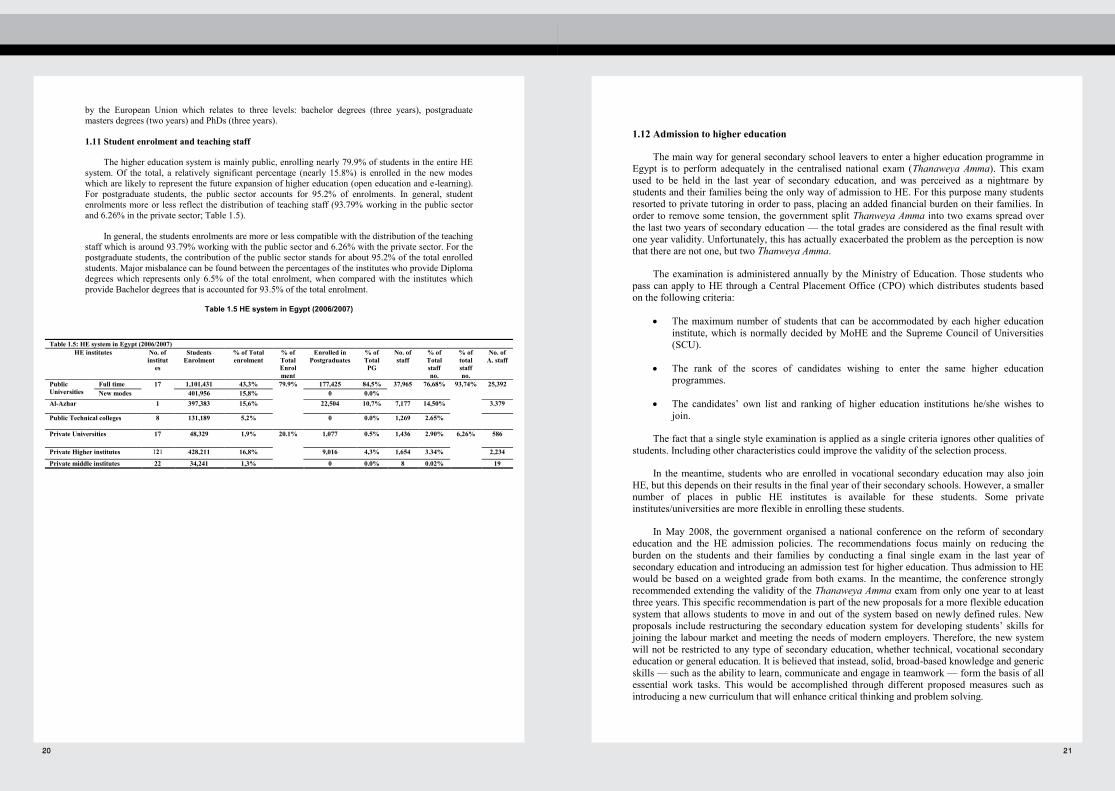
The higher education system is mainly public, enrolling nearly 79.9% of students in the entire HE system. Of the total, a relatively significant percentage (nearly 15.8%) is enrolled in the new modes which are likely to represent the future expansion of higher education (open education and e-learning). For postgraduate students, the public sector accounts for 95.2% of enrolments. In general, student enrolments more or less reflect the distribution of teaching staff (93.79% working in the public sector and 6.26% in the private sector; Table 1.5).
In general, the students enrolments are more or less compatible with the distribution of the teaching staff which is around 93.79% working with the public sector and 6.26% with the private sector. For the postgraduate students, the contribution of the public sector stands for about 95.2% of the total enrolled students. Major misbalance can be found between the percentages of the institutes who provide Diploma degrees which represents only 6.5% of the total enrolment, when compared with the institutes which provide Bachelor degrees that is accounted for 93.5% of the total enrolment.
Table 1.5 HE system in Egypt (2006/2007)
Table 1.5: HE system in Egypt (2006/2007) HE institutes No. of
institutes
Students Enrolment
% of Total enrolment
% of Total Enrolment
Enrolled in Postgraduates
% of Total PG
No. of staff
% of Total staff no.
% of total staff no.
No. of A. staff
Public Universities
Full time 17 1,101,431 43,3% 79.9% 177,425 84,5% 37,965 76,68% 93,74% 25,392 New modes 401,956 15,8% 0 0.0%
Al-Azhar 1 397,383 15,6% 22,504 10,7% 7,177 14,50% 3.379
Public Technical colleges 8 131,189 5,2% 0 0.0% 1,269 2.65%
Private Universities 17 48,329 1,9% 20.1% 1,077 0.5% 1,436 2.90% 6,26% 586
Private Higher institutes 121 428,211 16,8% 9,016 4,3% 1,654 3.34% 2,234
Private middle institutes 22 34,241 1,3% 0 0.0% 8 0.02% 19
22 23
23
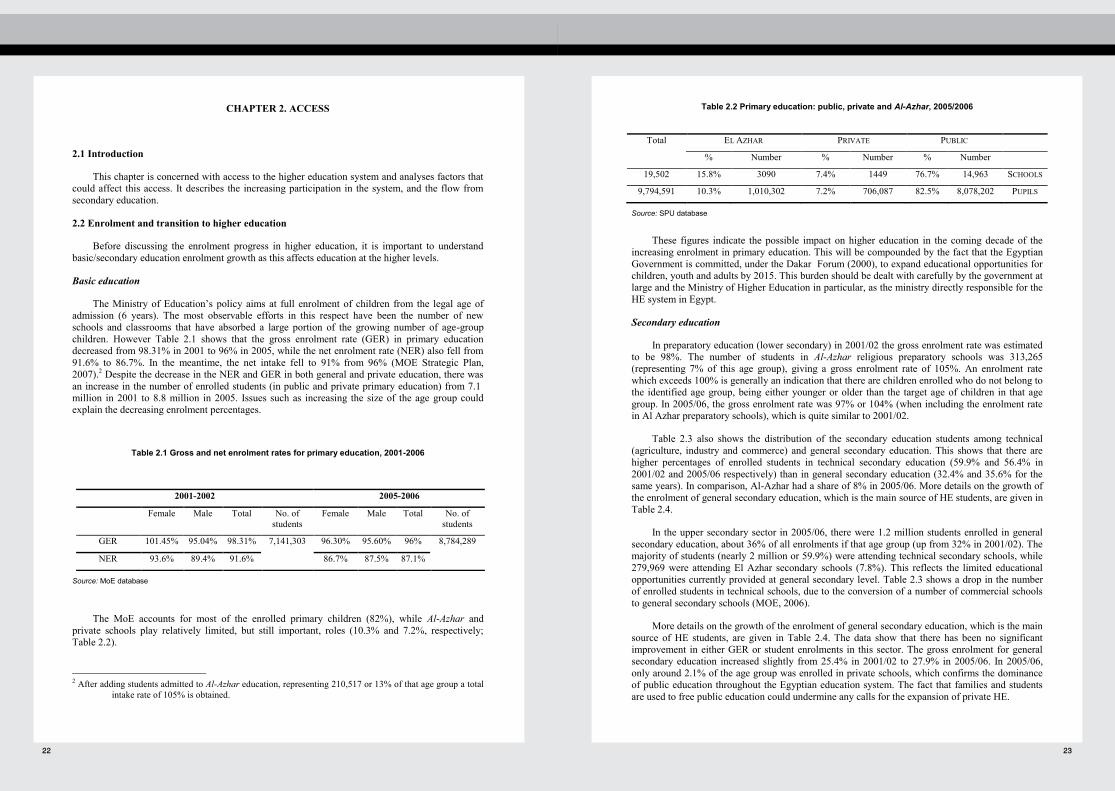
Table 2.2 Primary education: public, private and Al-Azhar, 2005/2006
Total
EL AZHAR PRIVATE PUBLIC
% Number % Number % Number
19,502 15.8% 3090 7.4% 1449 76.7% 14,963 SCHOOLS
9,794,591 10.3% 1,010,302 7.2% 706,087 82.5% 8,078,202 PUPILS
Source: SPU database
These figures indicate the possible impact on higher education in the coming decade of the increasing enrolment in primary education. This will be compounded by the fact that the Egyptian Government is committed, under the Dakar Forum (2000), to expand educational opportunities for children, youth and adults by 2015. This burden should be dealt with carefully by the government at large and the Ministry of Higher Education in particular, as the ministry directly responsible for the HE system in Egypt.
Secondary education
In preparatory education (lower secondary) in 2001/02 the gross enrolment rate was estimated to be 98%. The number of students in Al-Azhar religious preparatory schools was 313,265 (representing 7% of this age group), giving a gross enrolment rate of 105%. An enrolment rate which exceeds 100% is generally an indication that there are children enrolled who do not belong to the identified age group, being either younger or older than the target age of children in that age group. In 2005/06, the gross enrolment rate was 97% or 104% (when including the enrolment rate in Al Azhar preparatory schools), which is quite similar to 2001/02.
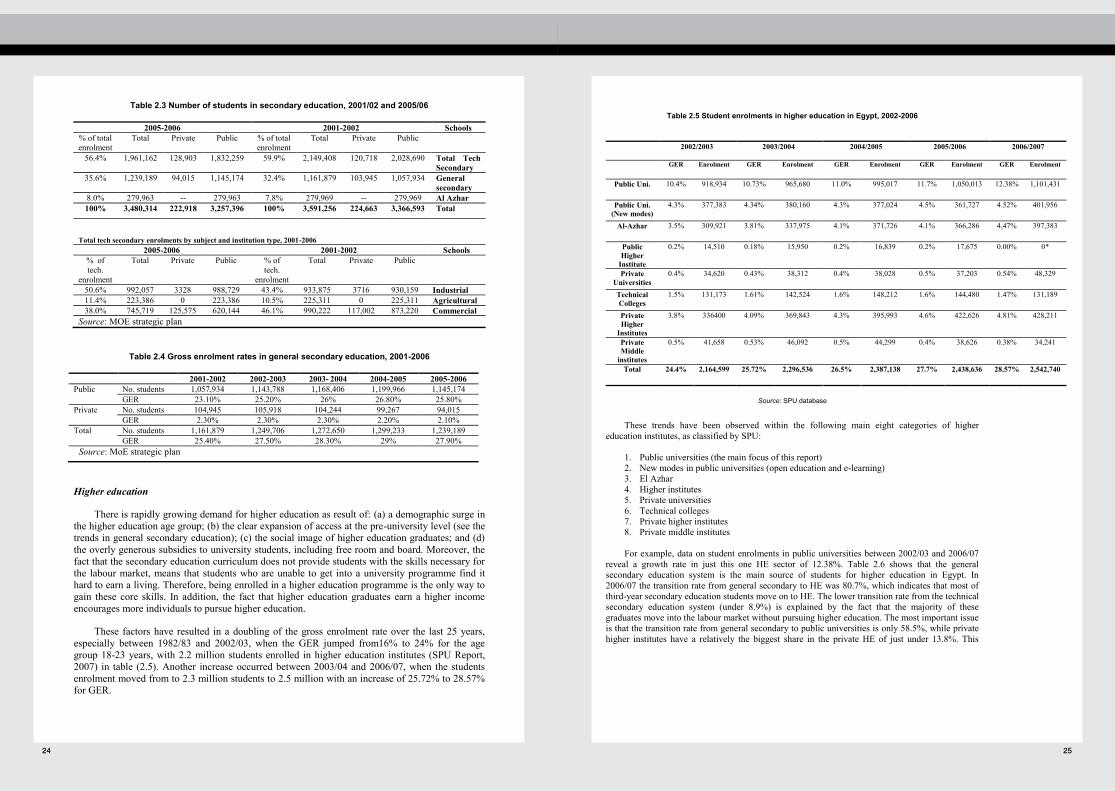
Table 2.3 also shows the distribution of the secondary education students among technical (agriculture, industry and commerce) and general secondary education. This shows that there are higher percentages of enrolled students in technical secondary education (59.9% and 56.4% in 2001/02 and 2005/06 respectively) than in general secondary education (32.4% and 35.6% for the same years). In comparison, Al-Azhar had a share of 8% in 2005/06. More details on the growth of the enrolment of general secondary education, which is the main source of HE students, are given in Table 2.4.
In the upper secondary sector in 2005/06, there were 1.2 million students enrolled in general secondary education, about 36% of all enrolments if that age group (up from 32% in 2001/02). The majority of students (nearly 2 million or 59.9%) were attending technical secondary schools, while 279,969 were attending El Azhar secondary schools (7.8%). This reflects the limited educational opportunities currently provided at general secondary level. Table 2.3 shows a drop in the number of enrolled students in technical schools, due to the conversion of a number of commercial schools to general secondary schools (MOE, 2006).
More details on the growth of the enrolment of general secondary education, which is the main source of HE students, are given in Table 2.4. The data show that there has been no significant improvement in either GER or student enrolments in this sector. The gross enrolment for general secondary education increased slightly from 25.4% in 2001/02 to 27.9% in 2005/06. In 2005/06, only around 2.1% of the age group was enrolled in private schools, which confirms the dominance of public education throughout the Egyptian education system. The fact that families and students are used to free public education could undermine any calls for the expansion of private HE.
22
CHAPTER 2. ACCESS
2.1 Introduction
This chapter is concerned with access to the higher education system and analyses factors that could affect this access. It describes the increasing participation in the system, and the flow from secondary education.
2.2 Enrolment and transition to higher education
Before discussing the enrolment progress in higher education, it is important to understand basic/secondary education enrolment growth as this affects education at the higher levels.
Basic education
The Ministry of Education’s policy aims at full enrolment of children from the legal age of admission (6 years). The most observable efforts in this respect have been the number of new schools and classrooms that have absorbed a large portion of the growing number of age-group children. However Table 2.1 shows that the gross enrolment rate (GER) in primary education decreased from 98.31% in 2001 to 96% in 2005, while the net enrolment rate (NER) also fell from 91.6% to 86.7%. In the meantime, the net intake fell to 91% from 96% (MOE Strategic Plan, 2007).2 Despite the decrease in the NER and GER in both general and private education, there was an increase in the number of enrolled students (in public and private primary education) from 7.1 million in 2001 to 8.8 million in 2005. Issues such as increasing the size of the age group could explain the decreasing enrolment percentages.
Table 2.1 Gross and net enrolment rates for primary education, 2001-2006
Source: MoE database
The MoE accounts for most of the enrolled primary children (82%), while Al-Azhar and
private schools play relatively limited, but still important, roles (10.3% and 7.2%, respectively; Table 2.2).
2 After adding students admitted to Al-Azhar education, representing 210,517 or 13% of that age group a total
intake rate of 105% is obtained.
2005-2006 2001-2002
No. of students
Total Male Female No. of students
Total Male Female
8,784,289 96% 95.60% 96.30% 7,141,303 98.31% 95.04% 101.45% GER
87.1% 87.5% 86.7% 91.6% 89.4% 93.6% NER
24 25
25
Table 2.5 Student enrolments in higher education in Egypt, 2002-2006
Source: SPU database
These trends have been observed within the following main eight categories of higher education institutes, as classified by SPU:
1. Public universities (the main focus of this report) 2. New modes in public universities (open education and e-learning) 3. El Azhar 4. Higher institutes 5. Private universities 6. Technical colleges 7. Private higher institutes 8. Private middle institutes For example, data on student enrolments in public universities between 2002/03 and 2006/07
reveal a growth rate in just this one HE sector of 12.38%. Table 2.6 shows that the general secondary education system is the main source of students for higher education in Egypt. In 2006/07 the transition rate from general secondary to HE was 80.7%, which indicates that most of third-year secondary education students move on to HE. The lower transition rate from the technical secondary education system (under 8.9%) is explained by the fact that the majority of these graduates move into the labour market without pursuing higher education. The most important issue is that the transition rate from general secondary to public universities is only 58.5%, while private higher institutes have a relatively the biggest share in the private HE of just under 13.8%. This
2006/2007 2005/2006 2004/2005 2003/2004 2002/2003
Enrolment GER Enrolment GER Enrolment GER Enrolment GER Enrolment GER
1,101,431 12.38% 1,050,013 11.7% 995,017 11.0% 965,680 10.73% 918,934 10.4% Public Uni.
401,956 4.52% 361,727 4.5% 377,024 4.3% 380,160 4.34% 377,383 4.3% Public Uni. (New modes)
397,383 4,47% 366,286 4.1% 371,726 4.1% 337,975 3.81% 309,921 3.5% Al-Azhar
0* 0.00% 17,675 0.2% 16,839 0.2% 15,950 0.18% 14,510 0.2% Public Higher
Institute 48,329 0.54% 37,203 0.5% 38,028 0.4% 38,312 0.43% 34,620 0.4% Private
Universities 131,189 1.47% 144,480 1.6% 148,212 1.6% 142,524 1.61% 131,173 1.5% Technical
Colleges 428,211 4.81% 422,626 4.6% 395,993 4.3% 369,843 4.09% 336400 3.8% Private
Higher Institutes
34,241 0.38% 38,626 0.4% 44,299 0.5% 46,092 0.53% 41,658 0.5% Private Middle
institutes 2,542,740 28.57% 2,438,636 27.7% 2,387,138 26.5% 2,296,536 25.72% 2,164,599 24.4% Total
24
Table 2.3 Number of students in secondary education, 2001/02 and 2005/06
2005-2006 2001-2002 Schools % of total enrolment
Total Private Public % of total enrolment
Total Private Public
56.4% 1,961,162 128,903 1,832,259 59.9% 2,149,408 120,718 2,028,690 Total Tech Secondary
35.6% 1,239,189 94,015 1,145,174 32.4% 1,161,879 103,945 1,057,934 General secondary
8.0% 279,963 -- 279,963 7.8% 279,969 -- 279,969 Al Azhar 100% 3,480,314 222,918 3,257,396 100% 3,591,256 224,663 3,366,593 Total
Total tech secondary enrolments by subject and institution type, 2001-2006
2005-2006 2001-2002 Schools % of tech.
enrolment
Total Private Public % of tech.
enrolment
Total Private Public
50.6% 992,057 3328 988,729 43.4% 933,875 3716 930,159 Industrial 11.4% 223,386 0 223,386 10.5% 225,311 0 225,311 Agricultural 38.0% 745,719 125,575 620,144 46.1% 990,222 117,002 873,220 Commercial
Source: MOE strategic plan
Table 2.4 Gross enrolment rates in general secondary education, 2001-2006
2001-2002 2002-2003 2003- 2004 2004-2005 2005-2006 Public No. students 1,057,934 1,143,788 1,168,406 1,199,966 1,145,174
GER 23.10% 25.20% 26% 26.80% 25.80% Private No. students 104,945 105,918 104,244 99,267 94,015
GER 2.30% 2.30% 2.30% 2.20% 2.10% Total No. students 1,161,879 1,249,706 1,272,650 1,299,233 1,239,189
GER 25.40% 27.50% 28.30% 29% 27.90% Source: MoE strategic plan
Higher education
There is rapidly growing demand for higher education as result of: (a) a demographic surge in the higher education age group; (b) the clear expansion of access at the pre-university level (see the trends in general secondary education); (c) the social image of higher education graduates; and (d) the overly generous subsidies to university students, including free room and board. Moreover, the fact that the secondary education curriculum does not provide students with the skills necessary for the labour market, means that students who are unable to get into a university programme find it hard to earn a living. Therefore, being enrolled in a higher education programme is the only way to gain these core skills. In addition, the fact that higher education graduates earn a higher income encourages more individuals to pursue higher education.
These factors have resulted in a doubling of the gross enrolment rate over the last 25 years, especially between 1982/83 and 2002/03, when the GER jumped from16% to 24% for the age group 18-23 years, with 2.2 million students enrolled in higher education institutes (SPU Report, 2007) in table (2.5). Another increase occurred between 2003/04 and 2006/07, when the students enrolment moved from to 2.3 million students to 2.5 million with an increase of 25.72% to 28.57% for GER.

26 27
27
International comparisons
According to the EFA monitoring report 2008, Egypt’s GER (27.29%) is good compared with other Arab states (which averaged 21% in 2005) and developing countries in general (average GER of 17% in 2005). On the other hand, the average GER in developed countries was 66.1% in 2005 (Table 2.8), which shows the amount of work still required for Egypt to achieve similar rates. The gross enrolment rate, which is the accessibility and the perceived value of attending higher education (tertiary education), is still far from the OECD average of 53% in tertiary type A (degree level) courses for high income countries (OECD, 2006a).
Table 2.8 Higher education gross enrolment ratios by region, 1999 and 2005
Gross enrolment ratios (%)
1999 2005 World 18.3 24.3 Developing countries 12.4 16.8 Developed countries 50.5 66.1 Countries in transition 37.5 56.5 Sub-Saharan Africa 4.4 5.1 Arab States 21.7 21.4 Central Asia 20.1 26.5 East Asia and the Pacific 15.6 23.8 East Asia 15.2 23.4 Pacific 4.3 50.3 South and West Asia 9.2 10.5 Latin America and the Caribbean
20.2 29.2
Caribbean 4.8 6.5 Latin America 20.6 30 North America and Western Europe
54.8 70.1
Central and Easter Europe 36 57
Source: OECD
Given Egypt’s ranking in the Human Development Report (116 out of 179 countries in 2008) and the World Competitiveness Report (77 out of 131 in 2007-08) and knowing that quantity of education is one of the main pillars of Global Competiveness Index (GCI) or Human development Index (HDI), the Egyptian government has strived to broaden access to HE and to ensure good quality education. This is a challenging goal. As a first step the current infrastructure and human resource system should be revised (see Chapter 3). For example, public HE institutes are already overcrowded and most universities and technical colleges are unable to accommodate the growing flow of students coming from the secondary schools. Lectures in some disciplines, such as law and business (commerce), can be attended by between 1 500 and 2 000 students in one hall. This in turn has implications for the learning and teaching process. In addition the long duration of HE programmes increases students’ costs and indirectly reduces the capacity of HEIs because of the need to accommodate students throughout their years of study. Alternatives have been considered, such as expanding the capacity of many institutes. Examples include Cairo University, which founded a new campus in 6th of October, while Assiut and Ain Shams universities have acquired
26
reflects the important current role of the private higher institutes. In the meantime, the private universities receive only a very small proportion of enrolments, despite having been established since 1996.
Table 2.6 Source of students enrolling in higher education
General secondary Technical certificates Public Universities 58.5% 1.9% Al Azhar 0.1% -- Private Universities 0.4% 0.002% Private higher institutes 13.8% 2.7% Technical colleges 6.1% 3.6% Private middle institutes 1.7% 0.7% Total 80.7% 8.9%
Source: SPU database
A closer look at the public universities (Table 2.7) shows that the percentages of the newly admitted students based on their secondary education are more or less the same across the 17 universities. In general, 94.5% of students admitted to public universities come from general secondary education, while other sources (technical colleges, private middle institutes, technical secondary and foreign secondary) are much less significant. However, higher rates can be found, for example in Helwan University, which due to its origins as a technological university encourages the enrolment of students from technical backgrounds.
Table 2.7 Enrolment in public universities based on secondary education type, 2006/07
General secondary Technical secondary Others
Cairo 93.1% 2.5% 4.4% Alex 99.1% 0.9% 0.0% Ain Shams 94.6% 3.3% 2.1%
Assiut 96.2% 0.9% 2.9%
Tanta 96.7% 1.9% 1.4%
El Mansoura 97.1% 2.0% 0.9%
El Zagazig 97.2% 1.9% 1.0%
Helwan 89.2% 3.4% 7.4%
El Minia 95.2% 3.5% 1.4%
El Menoufeya 92.2% 5.0% 2.8% Sue Canal 86.5% 7.6% 6.0%
South Valley 93.1% 3.4% 3.5% Beni Sweif 92.6% 5.3% 2.1%
El Fayoum 92.4% 2.8% 4.8%
Banha 90.9% 0.5% 8.6%
Kafr El Sheikh N/A N/A N/A
Sohag 100.0% 0.0% 0.0%
Total 94.5% 2.6% 2.9% Source: SPU database
28 29
29
Table 2.9 Enrolments of students by econom
ic regions, 2002/03 and 2006/07
Public Universities
Al A
zhar T
echnical Colleges
Higher institutes
Private Universities
Private higher institutes
Private middle
institutes
Region
Num
ber of inst.
No. of
students N
o. of students
(New
m
odes)
Num
ber of inst.
No. of
students N
umber
of inst. N
o. of students
Num
ber of inst.
No. of
students N
umber
of inst. N
o. of students
Num
ber of inst.
No. of
students N
umber
of inst. N
o. of students
Year 2002-2003
Cairo
75 332,367
189,332 22
123,307 15
49,443 2
5,883 38
34,620 65
189,857 7
18,523
Alexandria
25 103,404
45,719 4
21,191 5
18,443 0
0 0
0 17
44,168 2
2,230
Delta
69 214,463
70,324 17
75,694 10
26,164 0
0 0
0 11
33,995 5
8,381
Suez Canal
43 110,484
32,417 5
26,999 11
15,389 1
4,260 0
0 9
27,773 3
5,501
Assiut
20 48,145
15,047 9
38,519 3
4,968 0
0 0
0 2
4,578 1
846
North V
alley 36
67,400 18,072
1 2,569
2 4,351
1 3,254
0 0
1 954
1 715
South Valley
19 42,671
6,472 5
21,642 13
12,415 1
1,113 0
0 6
35,075 3
5,462
Grand Total
287 918,934
377,383 63
309,921 59
131,173 5
14,510 38
34,620 111
336,400 22
41,658
Year 2006-2007
Cairo
79 394,688
193,258 23
165,036 15
42,701 0
0 75
47,121 79
249,043 7
13,596
Alexandria
29 127,076
45,537 4
28,467 5
8,271 0
0 5
752 22
51,542 2
2,896
Delta
73 253,271
77,628 17
87,986 9
32,003 0
0 0
0 17
50,172 5
7,547
Suez Canal
45 124,234
32,869 6
35,987 11
18,107 0
0 6
456 14
32,160 3
3,580
Assiut
19 54,542
15,979 9
47,787 3
5,426 0
0 0
0 3
3,553 1
444
North V
alley 41
91057 21,306
1 3,410
2 7,501
0 0
0 0
2 2,051
1 577
South Valley
27 56,563
15,379 6
28,710 13
17,180 0
0 0
0 7
39,690 3
5,601
Grand Total
313 1,101,431
401,956 66
397,383 58
131,189 0
0 86
48,329 144
428,211 22
34,241
Source: SPU database
28
new land for future expansion, not only to increase access but also to promote quality. But further measures should be considered to address the type and length of programmes. Another approach taken by the government is to diversify higher education by allowing the private sector to operate. The private sector supplements the public institutions and increases the opportunities for higher education. However, this has added legal, supervisory, financial and management problems. The private sector is currently playing a noticeable role in HE, as evidenced by the enrolment of around 511,990 students in 2006/07 — 20.5% of the total HE enrolment (Table 2.5).
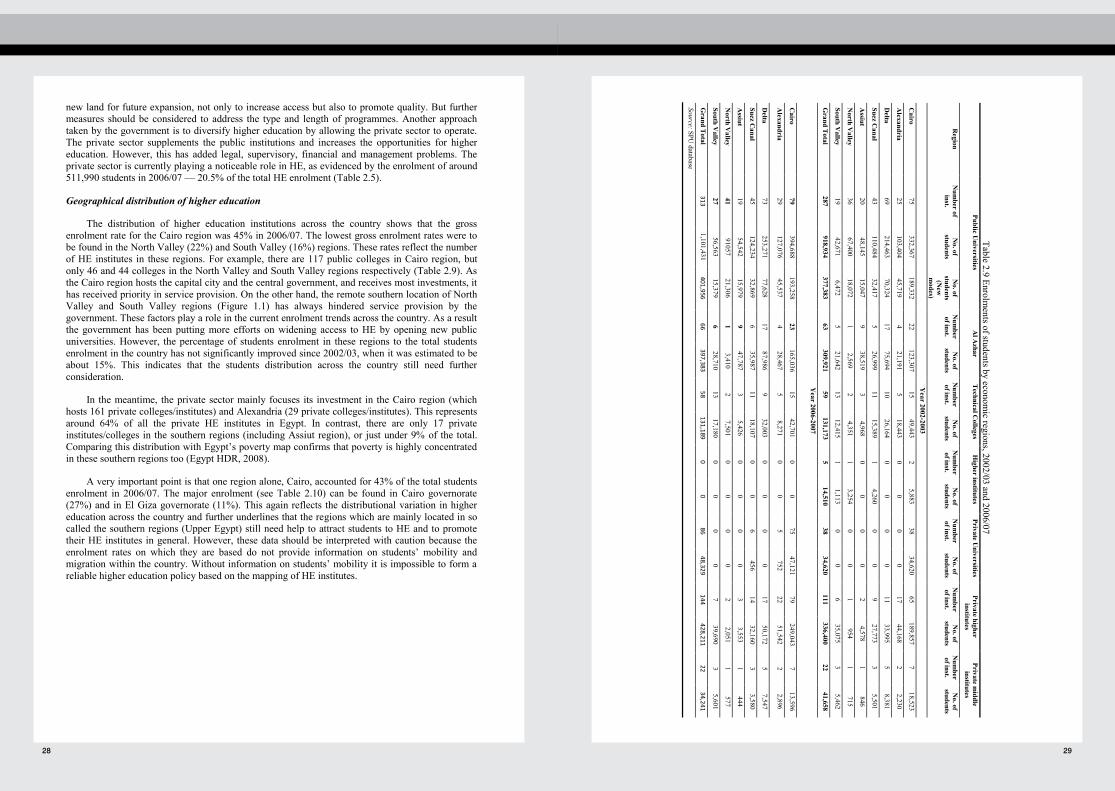
Geographical distribution of higher education
The distribution of higher education institutions across the country shows that the gross enrolment rate for the Cairo region was 45% in 2006/07. The lowest gross enrolment rates were to be found in the North Valley (22%) and South Valley (16%) regions. These rates reflect the number of HE institutes in these regions. For example, there are 117 public colleges in Cairo region, but only 46 and 44 colleges in the North Valley and South Valley regions respectively (Table 2.9). As the Cairo region hosts the capital city and the central government, and receives most investments, it has received priority in service provision. On the other hand, the remote southern location of North Valley and South Valley regions (Figure 1.1) has always hindered service provision by the government. These factors play a role in the current enrolment trends across the country. As a result the government has been putting more efforts on widening access to HE by opening new public universities. However, the percentage of students enrolment in these regions to the total students enrolment in the country has not significantly improved since 2002/03, when it was estimated to be about 15%. This indicates that the students distribution across the country still need further consideration.
In the meantime, the private sector mainly focuses its investment in the Cairo region (which hosts 161 private colleges/institutes) and Alexandria (29 private colleges/institutes). This represents around 64% of all the private HE institutes in Egypt. In contrast, there are only 17 private institutes/colleges in the southern regions (including Assiut region), or just under 9% of the total. Comparing this distribution with Egypt’s poverty map confirms that poverty is highly concentrated in these southern regions too (Egypt HDR, 2008).
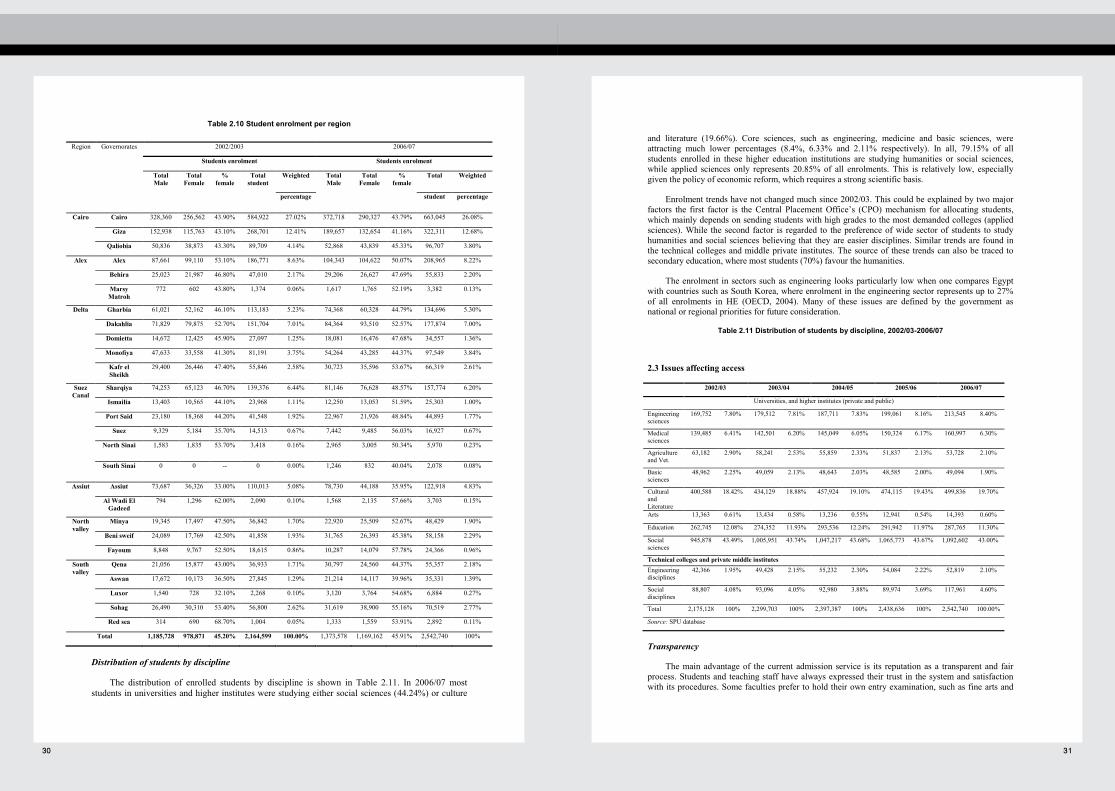
A very important point is that one region alone, Cairo, accounted for 43% of the total students enrolment in 2006/07. The major enrolment (see Table 2.10) can be found in Cairo governorate (27%) and in El Giza governorate (11%). This again reflects the distributional variation in higher education across the country and further underlines that the regions which are mainly located in so called the southern regions (Upper Egypt) still need help to attract students to HE and to promote their HE institutes in general. However, these data should be interpreted with caution because the enrolment rates on which they are based do not provide information on students’ mobility and migration within the country. Without information on students’ mobility it is impossible to form a reliable higher education policy based on the mapping of HE institutes.
30 31
31
and literature (19.66%). Core sciences, such as engineering, medicine and basic sciences, were attracting much lower percentages (8.4%, 6.33% and 2.11% respectively). In all, 79.15% of all students enrolled in these higher education institutions are studying humanities or social sciences, while applied sciences only represents 20.85% of all enrolments. This is relatively low, especially given the policy of economic reform, which requires a strong scientific basis.
Enrolment trends have not changed much since 2002/03. This could be explained by two major factors the first factor is the Central Placement Office’s (CPO) mechanism for allocating students, which mainly depends on sending students with high grades to the most demanded colleges (applied sciences). While the second factor is regarded to the preference of wide sector of students to study humanities and social sciences believing that they are easier disciplines. Similar trends are found in the technical colleges and middle private institutes. The source of these trends can also be traced to secondary education, where most students (70%) favour the humanities.
The enrolment in sectors such as engineering looks particularly low when one compares Egypt with countries such as South Korea, where enrolment in the engineering sector represents up to 27% of all enrolments in HE (OECD, 2004). Many of these issues are defined by the government as national or regional priorities for future consideration.
Table 2.11 Distribution of students by discipline, 2002/03-2006/07
2.3 Issues affecting access
2002/03 2003/04 2004/05 2005/06 2006/07
Universities, and higher institutes (private and public)
Engineering sciences
169,752 7.80% 179,512 7.81% 187,711 7.83% 199,061 8.16% 213,545 8.40%
Medical sciences
139,485 6.41% 142,501 6.20% 145,049 6.05% 150,324 6.17% 160,997 6.30%
Agriculture and Vet.
63,182 2.90% 58,241 2.53% 55,859 2.33% 51,837 2.13% 53,728 2.10%
Basic sciences
48,962 2.25% 49,059 2.13% 48,643 2.03% 48,585 2.00% 49,094 1.90%
Cultural and Literature
400,588 18.42% 434,129 18.88% 457,924 19.10% 474,115 19.43% 499,836 19.70%
Arts 13,363 0.61% 13,434 0.58% 13,236 0.55% 12,941 0.54% 14,393 0.60%
Education 262,745 12.08% 274,352 11.93% 293,536 12.24% 291,942 11.97% 287,765 11.30%
Social sciences
945,878 43.49% 1,005,951 43.74% 1,047,217 43.68% 1,065,773 43.67% 1,092,602 43.00%
Technical colleges and private middle institutes Engineering disciplines
42,366 1.95% 49,428 2.15% 55,232 2.30% 54,084 2.22% 52,819 2.10%
Social disciplines
88,807 4.08% 93,096 4.05% 92,980 3.88% 89,974 3.69% 117,961 4.60%
Total 2,175,128 100% 2,299,703 100% 2,397,387 100% 2,438,636 100% 2,542,740 100.00%
Source: SPU database
Transparency
The main advantage of the current admission service is its reputation as a transparent and fair process. Students and teaching staff have always expressed their trust in the system and satisfaction with its procedures. Some faculties prefer to hold their own entry examination, such as fine arts and
30
Table 2.10 Student enrolment per region
Distribution of students by discipline
The distribution of enrolled students by discipline is shown in Table 2.11. In 2006/07 most students in universities and higher institutes were studying either social sciences (44.24%) or culture
Region Governorates 2002/2003 2006/07
Students enrolment Students enrolment
Total Male
Total Female
% female
Total student
Weighted Total Male
Total Female
% female
Total Weighted
percentage student percentage
Cairo Cairo 328,360 256,562 43.90% 584,922 27.02% 372,718 290,327 43.79% 663,045 26.08%
Giza 152,938 115,763 43.10% 268,701 12.41% 189,657 132,654 41.16% 322,311 12.68%
Qaliobia 50,836 38,873 43.30% 89,709 4.14% 52,868 43,839 45.33% 96,707 3.80%
Alex Alex 87,661 99,110 53.10% 186,771 8.63% 104,343 104,622 50.07% 208,965 8.22%
Behira 25,023 21,987 46.80% 47,010 2.17% 29,206 26,627 47.69% 55,833 2.20%
Marsy Matroh
772 602 43.80% 1,374 0.06% 1,617 1,765 52.19% 3,382 0.13%
Delta Gharbia 61,021 52,162 46.10% 113,183 5.23% 74,368 60,328 44.79% 134,696 5.30%
Dakahlia 71,829 79,875 52.70% 151,704 7.01% 84,364 93,510 52.57% 177,874 7.00%
Domietta 14,672 12,425 45.90% 27,097 1.25% 18,081 16,476 47.68% 34,557 1.36%
Monofiya 47,633 33,558 41.30% 81,191 3.75% 54,264 43,285 44.37% 97,549 3.84%
Kafr el Sheikh
29,400 26,446 47.40% 55,846 2.58% 30,723 35,596 53.67% 66,319 2.61%
Suez Canal
Sharqiya 74,253 65,123 46.70% 139,376 6.44% 81,146 76,628 48.57% 157,774 6.20%
Ismailia 13,403 10,565 44.10% 23,968 1.11% 12,250 13,053 51.59% 25,303 1.00%
Port Said 23,180 18,368 44.20% 41,548 1.92% 22,967 21,926 48.84% 44,893 1.77%
Suez 9,329 5,184 35.70% 14,513 0.67% 7,442 9,485 56.03% 16,927 0.67%
North Sinai 1,583 1,835 53.70% 3,418 0.16% 2,965 3,005 50.34% 5,970 0.23%
South Sinai 0 0 -- 0 0.00% 1,246 832 40.04% 2,078 0.08%
Assiut Assiut 73,687 36,326 33.00% 110,013 5.08% 78,730 44,188 35.95% 122,918 4.83%
Al Wadi El Gadeed
794 1,296 62.00% 2,090 0.10% 1,568 2,135 57.66% 3,703 0.15%
North valley
Minya 19,345 17,497 47.50% 36,842 1.70% 22,920 25,509 52.67% 48,429 1.90%
Beni sweif 24,089 17,769 42.50% 41,858 1.93% 31,765 26,393 45.38% 58,158 2.29%
Fayoum 8,848 9,767 52.50% 18,615 0.86% 10,287 14,079 57.78% 24,366 0.96%
South valley
Qena 21,056 15,877 43.00% 36,933 1.71% 30,797 24,560 44.37% 55,357 2.18%
Aswan 17,672 10,173 36.50% 27,845 1.29% 21,214 14,117 39.96% 35,331 1.39%
Luxor 1,540 728 32.10% 2,268 0.10% 3,120 3,764 54.68% 6,884 0.27%
Sohag 26,490 30,310 53.40% 56,800 2.62% 31,619 38,900 55.16% 70,519 2.77%
Red sea 314 690 68.70% 1,004 0.05% 1,333 1,559 53.91% 2,892 0.11%
Total 1,185,728 978,871 45.20% 2,164,599 100.00% 1,373,578 1,169,162 45.91% 2,542,740 100%

32 33
33
CHAPTER 3. QUALITY
3.1 Introduction
Improving the quality of higher education has received tremendous government support in Egypt over the past few years. Since 2002, a project intended to enhance HE started to end in year 2007 through which there has been a drastic change in the quality assurance system for HE institutions and universities. The new quality assurance system includes:
An external quality assessment and accreditation process run by the National Authority for Quality Assurance and Accreditation of Education (NAQAAE), which is mandatory for each HE institution (faculty, higher institute, technical college…) and has to be reapplied every five years.
An internal quality assurance system, run by the HE institution itself, resulting in an institution annual report describing all quality components in the HE process applied to all academic programs as well as for the institution itself.
An independent external quality assessment system based on a peer reviewing process, run by the National Quality Assurance and Accreditation Committee (which has now been replaced by the Steering Committee for the Project of Continuous Improvement and Qualifying for Accreditation, see Box 3.1).
This analysis will describe these three systems, before evaluating the quality of HE system in Egypt in terms of input, processes and output. It concludes with final recommendations for how to further improve the quality of education.
3.2 The National Authority for Quality Assurance and Accreditation of Education
NAQAAE is a newly established government entity involved in external accreditation and in assuring the quality of HE in Egypt. It was established under a presidential decree in 2006 (Law 82-2006). NAQAAE operates as an independent agency, attached to the Prime Minister, and works on developing quality assurance (QA) and accreditation standards for various types of education (pre-university, higher, and Al-Azhar education). Its main role in the evaluation and accreditation of higher education institutions is to verify their fulfilment of criteria within two areas — institutional capacity and educational effectiveness — against a set of standards. These standards allow for the comprehensive self-evaluation of the educational institution. Institutional capacity includes eight criteria:
1. strategic planning
2. organisational structure
3. leadership and governance
4. credibility and ethics, administrative body
5. financial and material resources
6. community service
7. institutional evaluation
32
physical education. However, there is broad consensus that the Thanaweya Amma is not the best instrument to measure education achievements at the end of formal secondary education.
Public educational grants and scholarships
The public HE system is free for all national students. However, some subsidies are provided to individual students based on their social and economic status. These issues help many students to seek a HE opportunity, especially in the public sector.
Women’s enrolment
While there was a slight increase in women’s enrolment in HE between 2002/03 and 2005/06 (from 45% to 46%), this percentage still needs further improvement in the coming years. Percentages are lower still in governorates such as Assiut, Luxor, Suez Canal and Aswan, where in 2005/06 female enrolments were 34%, 51%, 41% and 40% respectively (SPU database). Gender equality in higher education is discussed more fully in Section 4.3.
2.4 Internal efficiency
The main indicators of internal efficiency are promotion rate, repetition rate and drop out rate. Other indicators, such as survival and completion rates, should also be estimated. Unfortunately, the available data do not provide cohorts through the entire education system, so there is no information on this. Such issues should be sorted out once the Education Management Information System (EMIS) is functioning.
In 2006/07, aggregated data from different public higher education institutions in Egypt (except Al-Azhar and technical colleges) show that repetition and dropout rates were on average 10% and 9% respectively for most grades. The highest cases were observed in the first year of most disciplines. This indicates that there are significant wastage rates from 4 and 5 year degree courses. However, disciplines such as social sciences have relatively high retake rates (around 18%), while those for other disciplines, such as medical sciences, are lower (around 6%). In general the recorded numbers of retakers and dropouts represent about 19% of the loss in allocated budget annually. Calculations based on the estimated unit cost per student (USD 782) in 2006/2007 show that these numbers lead to wastage of about USD 159 million from the public universities’ total allocated budget.
Despite such observations, there is no evidence that any of the public Egyptian universities have mechanisms for identifying or assisting students who are in difficulty. This is despite the fact that it is well known that many students find it difficult to adapt smoothly to their selected higher education institutes. This is especially true for applied sciences, such as engineering, where the type of education differs from the long years of rote learning and exam oriented education, which are the norm in Egypt’s basic education system. Another negative habit that affects students’ performance is considering private tuition as the main source of information for many students, especially when the teaching in the universities, is of inadequate quality. This also has a negative impact on resource expenditure.
References Cochran, Judith, "Education in Egypt", 1986.
34 35
35
If the program meets the accreditation standards, NAQAAE shall officially contact the institution within a month of its application date.
NAQAAE then urges the institution to start preparing its evaluation of the program following the template developed for this purpose by NAQAAE.
The self-evaluation must be submitted to NAQAAE within six months of the date of approval. The institution should pay the program's evaluation and accreditation fees set by NAQAAE's board of directors and announced on its website within 30 days of receiving the acceptance of application.
NAQAAE’s accreditation process for education programs at higher education institutions depends on the following set of controls:
Accreditation is granted to an educational program which has proven its ability to achieve the requirements of the two evaluation and accreditation areas (program management and educational effectiveness).
The program will not be accredited if it has not specifically achieved some of the standards of educational effectiveness — academic standards, design of programs and curricula, and teaching and learning — because these are considered to be the decisive standards in the process of evaluation and accreditation.
NAQAAE will inform the institution of the final result, including the program's strengths and the areas to be improved. It also stresses NAQAAE’s complete readiness to offer various forms of advice, guidance and direction to help the institution ensure that the program meets NAQAAE's evaluation and accreditation standards.
If the institution fails to accredit its program (s), it will be given the chance to rehabilitate itself to meet the requirements. If such requirements are still not met, the authority, in consultation with the Minister of HE, can decide to dismiss the administration or not to enrol students for a year until it does meet the necessary requirements. Governmental financial support may also be withdrawn.
Box 3.1. The Steering Committee for the Project of Continuous Improvement and Qualifying for Accreditation
The Steering Committee for the Project of Continuous Improvement and Qualifying for Accreditation was established in February 2008. This government entity is also involved in assuring quality and helping faculties/institutes in public universities to get ready for accreditation by NAQAAE. It is mainly concerned with the activities of four sub-projects:
1. Continuous Improvement and Qualifying for Accreditation Project (CIQAP).
2. Quality Assurance and Accreditation Project, second phase (QAAP-II).
3. Monitoring and Evaluation of New Programs Project (MENPP).
4. Institutional Strategic Planning Project (ISPP).
34
8. quality management
Educational effectiveness also includes eight criteria:
1. students and graduates
2. academic standards
3. academic programs/courses
4. teaching, learning and supporting facilities
5. teaching staff
6. scientific research
7. post-graduate studies
8. ongoing evaluation of the effectiveness of the educational process.
The first step in the accreditation process begins once the Minister of HE issues a list of the faculties to be accredited. Each faculty gets a letter of approval from its university. NAQAAE then asks the faculty to submit its evaluation. A review team is selected who then visits the institution. The institution receives the report within nine months of the date of its accreditation application. Private and public institutions undergo the same accreditation process.
NAQAAE also offers programme and university accreditation. In order to encourage competition among educational programmes offered by similar higher education institutions, as well as internal competition among various educational programmes in the same institution, the higher education institutions and Al-Azhar University may apply for accreditation for one or more of their educational programmes. The following are the steps involved in applying for accreditation of a programme:
If the institution wishes to apply for accreditation of an educational programme, the application should be authorised by its governing board and the university/academy board (if the institution is affiliated to a university or an academy). This is in addition to submitting the adequate descriptive data about the program.
The application for accreditation will be rejected if NAQAAE finds that the program does not meet the necessary conditions; in this case the institution can re-apply after six months from the date it received the rejection. Such conditions are:
The institution should obtain a license from the Ministry of Higher Education to work as a higher education institution.
The institution should have an academic certificate, at least, for the educational program required to be accredited.
The institution should have a specific mission authorized by the governing board in addition to a documented strategic plan.
The institution should submit the agreement of the body to which it is directly affiliated on the accreditation application.
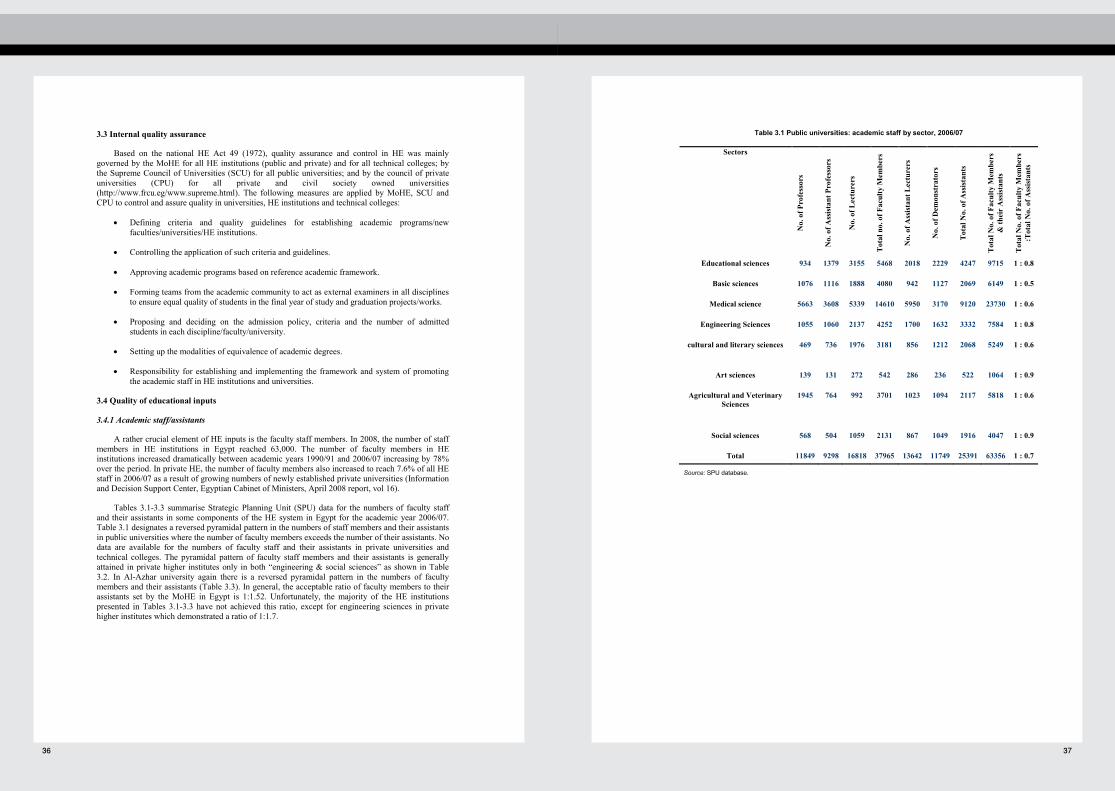
36 37
37
Table 3.1 Public universities: academic staff by sector, 2006/07
Sectors
No.
of P
rofe
ssor
s
No.
of A
ssis
tant
Pro
fess
ors
No.
of L
ectu
rers
Tot
al n
o. o
f Fac
ulty
Mem
bers
No.
of A
ssis
tant
Lec
ture
rs
No.
of D
emon
stra
tors
Tot
al N
o. o
f Ass
ista
nts
Tot
al N
o. o
f Fac
ulty
Mem
bers
&
thei
r A
ssis
tant
s
Tot
al N
o. o
f Fac
ulty
Mem
bers
:T
otal
No.
of A
ssis
tant
s
Educational sciences 934 1379 3155 5468 2018 2229 4247 9715 1 : 0.8
Basic sciences 1076 1116 1888 4080 942 1127 2069 6149 1 : 0.5
Medical science 5663 3608 5339 14610 5950 3170 9120 23730 1 : 0.6
Engineering Sciences 1055 1060 2137 4252 1700 1632 3332 7584 1 : 0.8
cultural and literary sciences 469 736 1976 3181 856 1212 2068 5249 1 : 0.6
Art sciences 139 131 272 542 286 236 522 1064 1 : 0.9
Agricultural and Veterinary Sciences
1945 764 992 3701 1023 1094 2117 5818 1 : 0.6
Social sciences 568 504 1059 2131 867 1049 1916 4047 1 : 0.9
Total 11849 9298 16818 37965 13642 11749 25391 63356 1 : 0.7
Source: SPU database.
36
3.3 Internal quality assurance
Based on the national HE Act 49 (1972), quality assurance and control in HE was mainly governed by the MoHE for all HE institutions (public and private) and for all technical colleges; by the Supreme Council of Universities (SCU) for all public universities; and by the council of private universities (CPU) for all private and civil society owned universities (http://www.frcu.eg/www.supreme.html). The following measures are applied by MoHE, SCU and CPU to control and assure quality in universities, HE institutions and technical colleges:
Defining criteria and quality guidelines for establishing academic programs/new faculties/universities/HE institutions.
Controlling the application of such criteria and guidelines.
Approving academic programs based on reference academic framework.
Forming teams from the academic community to act as external examiners in all disciplines to ensure equal quality of students in the final year of study and graduation projects/works.
Proposing and deciding on the admission policy, criteria and the number of admitted students in each discipline/faculty/university.
Setting up the modalities of equivalence of academic degrees.
Responsibility for establishing and implementing the framework and system of promoting the academic staff in HE institutions and universities.
3.4 Quality of educational inputs
3.4.1 Academic staff/assistants
A rather crucial element of HE inputs is the faculty staff members. In 2008, the number of staff members in HE institutions in Egypt reached 63,000. The number of faculty members in HE institutions increased dramatically between academic years 1990/91 and 2006/07 increasing by 78% over the period. In private HE, the number of faculty members also increased to reach 7.6% of all HE staff in 2006/07 as a result of growing numbers of newly established private universities (Information and Decision Support Center, Egyptian Cabinet of Ministers, April 2008 report, vol 16).
Tables 3.1-3.3 summarise Strategic Planning Unit (SPU) data for the numbers of faculty staff and their assistants in some components of the HE system in Egypt for the academic year 2006/07. Table 3.1 designates a reversed pyramidal pattern in the numbers of staff members and their assistants in public universities where the number of faculty members exceeds the number of their assistants. No data are available for the numbers of faculty staff and their assistants in private universities and technical colleges. The pyramidal pattern of faculty staff members and their assistants is generally attained in private higher institutes only in both “engineering & social sciences” as shown in Table 3.2. In Al-Azhar university again there is a reversed pyramidal pattern in the numbers of faculty members and their assistants (Table 3.3). In general, the acceptable ratio of faculty members to their assistants set by the MoHE in Egypt is 1:1.52. Unfortunately, the majority of the HE institutions presented in Tables 3.1-3.3 have not achieved this ratio, except for engineering sciences in private higher institutes which demonstrated a ratio of 1:1.7.

38 39
39
Tabl
e 3.
3 A
l-Azh
ar u
nive
rsiti
es: a
cade
mic
sta
ff by
sec
tor,
2006
/07
Sect
ors
No.
of
Prof
esso
rs
No.
of
Ass
ista
nt
Prof
esso
rs
No.
of
Lect
urer
s To
tal n
o. o
f Fa
culty
M
embe
rs
No.
of
Ass
ista
nt
Lect
ures
No.
of
Dem
onst
rato
rs
Tota
l No.
of
Ass
ista
nts
Tota
l No.
of
Facu
lty M
embe
rs
& th
eir A
ssis
tant
s
Tota
l No.
of
Facu
lty
Mem
bers
: To
tal N
o. o
f A
ssis
tant
s
Educ
atio
nal
scie
nces
85
84
17
8 34
7 14
2 77
21
9 56
6 1
: 0.6
Bas
ic sc
ienc
es
300
183
199
682
206
119
325
1007
1
: 0.5
Med
ical
sc
ienc
e 11
37
553
641
2331
71
7 34
9 10
66
3397
1
: 0.4
Engi
neer
ing
Scie
nces
15
8 61
10
9 32
8 52
29
81
40
9 1
: 0.2
Hum
aniti
es
796
716
1056
25
68
683
531
1214
37
82
1 : 0
.5
Agr
icul
tura
l &
Vet
erin
ary
Med
icin
e
209
71
74
354
80
107
187
541
1 : 0
.5
Soci
al sc
ienc
es
176
172
219
567
200
87
287
854
1 : 0
.5
Tota
l 28
61
1840
24
76
7177
20
80
1299
33
79
1055
6 1
: 0.5
Sou
rce:
SP
U d
atab
ase.
38
Tabl
e 3.
2 Pr
ivat
e in
stitu
tes:
aca
dem
ic s
taff
by s
ecto
r, 20
06/0
7
Sect
ors
No.
of
Prof
esso
rs
No.
of
Ass
ista
nt
Prof
esso
rs
No.
of
Lect
urer
s To
tal n
o. o
f fa
culty
m
embe
rs
No.
of
Ass
ista
nt
Lect
urer
s
No.
of
Dem
onst
rato
rs
Tota
l No.
of
Ass
ista
nts
Tota
l no.
of
facu
lty
mem
bers
&
ass
ista
nts
Tota
l No.
of
Facu
lty
Mem
bers
: To
tal N
o. o
f A
ssis
tant
s
Med
ical
scie
nce
1 0
3 4
2 29
31
35
1
: 7.7
Engi
neer
ing
Scie
nces
10
3 75
26
4 44
2 28
7 44
7 73
4 11
76
1 : 1
.7
Hum
aniti
es
4 3
61
68
22
32
54
122
1 : 0
.8
Art
scie
nces
61
59
14
3 26
3 14
7 15
5 30
2 56
5 1
: 1.1
Agr
icul
tura
l &
Vet
. Sci
ence
s 10
1
1 12
9
3 12
24
1
: 1
Soci
al sc
ienc
es
77
100
598
775
410
704
1114
18
89
1 : 1
.4
Tota
l 25
6 23
8 10
70
1564
87
7 13
70
2247
38
11
1 : 1
.4
Sou
rce:
SP
U d
atab
ase.
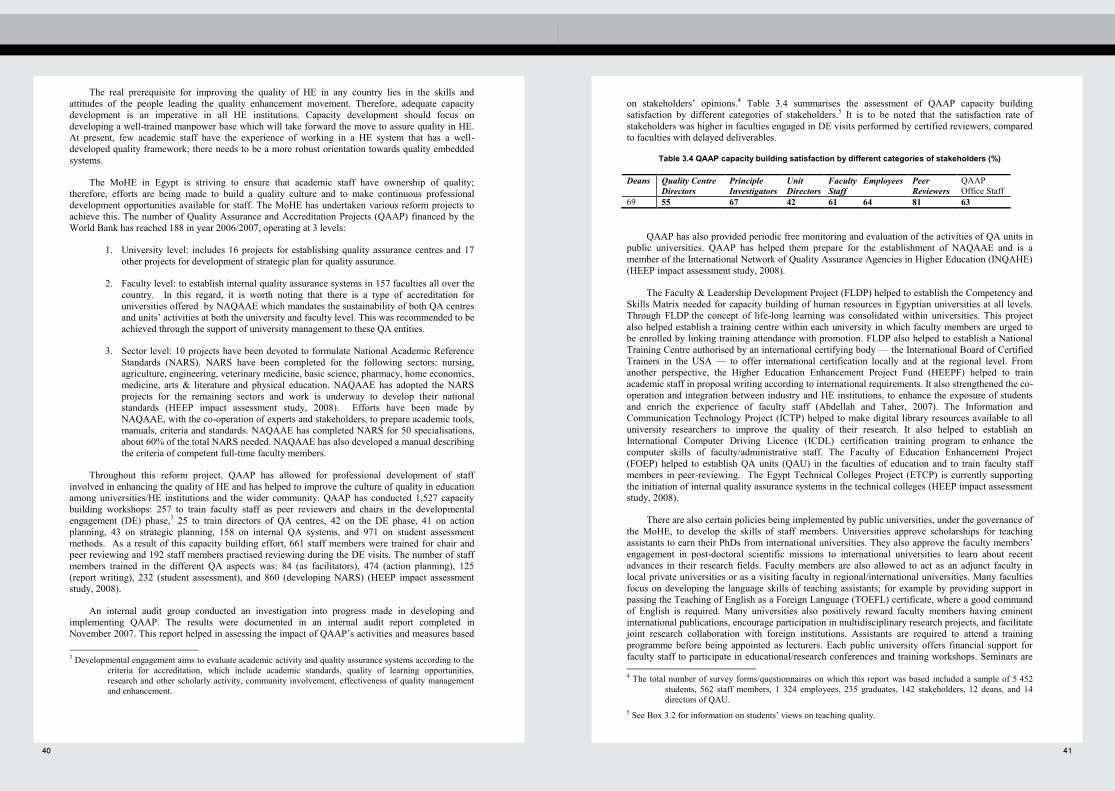
40 41
41
on stakeholders’ opinions.4 Table 3.4 summarises the assessment of QAAP capacity building satisfaction by different categories of stakeholders.5 It is to be noted that the satisfaction rate of stakeholders was higher in faculties engaged in DE visits performed by certified reviewers, compared to faculties with delayed deliverables.
Table 3.4 QAAP capacity building satisfaction by different categories of stakeholders (%)
Deans Quality Centre Directors
Principle Investigators
Unit Directors
Faculty Staff
Employees Peer Reviewers
QAAP Office Staff
69 55 67 42 61 64 81 63
QAAP has also provided periodic free monitoring and evaluation of the activities of QA units in public universities. QAAP has helped them prepare for the establishment of NAQAAE and is a member of the International Network of Quality Assurance Agencies in Higher Education (INQAHE) (HEEP impact assessment study, 2008).
The Faculty & Leadership Development Project (FLDP) helped to establish the Competency and Skills Matrix needed for capacity building of human resources in Egyptian universities at all levels. Through FLDP the concept of life-long learning was consolidated within universities. This project also helped establish a training centre within each university in which faculty members are urged to be enrolled by linking training attendance with promotion. FLDP also helped to establish a National Training Centre authorised by an international certifying body — the International Board of Certified Trainers in the USA — to offer international certification locally and at the regional level. From another perspective, the Higher Education Enhancement Project Fund (HEEPF) helped to train academic staff in proposal writing according to international requirements. It also strengthened the co-operation and integration between industry and HE institutions, to enhance the exposure of students and enrich the experience of faculty staff (Abdellah and Taher, 2007). The Information and Communication Technology Project (ICTP) helped to make digital library resources available to all university researchers to improve the quality of their research. It also helped to establish an International Computer Driving Licence (ICDL) certification training program to enhance the computer skills of faculty/administrative staff. The Faculty of Education Enhancement Project (FOEP) helped to establish QA units (QAU) in the faculties of education and to train faculty staff members in peer-reviewing. The Egypt Technical Colleges Project (ETCP) is currently supporting the initiation of internal quality assurance systems in the technical colleges (HEEP impact assessment study, 2008).
There are also certain policies being implemented by public universities, under the governance of the MoHE, to develop the skills of staff members. Universities approve scholarships for teaching assistants to earn their PhDs from international universities. They also approve the faculty members’ engagement in post-doctoral scientific missions to international universities to learn about recent advances in their research fields. Faculty members are also allowed to act as an adjunct faculty in local private universities or as a visiting faculty in regional/international universities. Many faculties focus on developing the language skills of teaching assistants; for example by providing support in passing the Teaching of English as a Foreign Language (TOEFL) certificate, where a good command of English is required. Many universities also positively reward faculty members having eminent international publications, encourage participation in multidisciplinary research projects, and facilitate joint research collaboration with foreign institutions. Assistants are required to attend a training programme before being appointed as lecturers. Each public university offers financial support for faculty staff to participate in educational/research conferences and training workshops. Seminars are 4 The total number of survey forms/questionnaires on which this report was based included a sample of 5 452
students, 562 staff members, 1 324 employees, 235 graduates, 142 stakeholders, 12 deans, and 14 directors of QAU.
5 See Box 3.2 for information on students’ views on teaching quality.
40
The real prerequisite for improving the quality of HE in any country lies in the skills and
attitudes of the people leading the quality enhancement movement. Therefore, adequate capacity development is an imperative in all HE institutions. Capacity development should focus on developing a well-trained manpower base which will take forward the move to assure quality in HE. At present, few academic staff have the experience of working in a HE system that has a well-developed quality framework; there needs to be a more robust orientation towards quality embedded systems.
The MoHE in Egypt is striving to ensure that academic staff have ownership of quality; therefore, efforts are being made to build a quality culture and to make continuous professional development opportunities available for staff. The MoHE has undertaken various reform projects to achieve this. The number of Quality Assurance and Accreditation Projects (QAAP) financed by the World Bank has reached 188 in year 2006/2007, operating at 3 levels:
1. University level: includes 16 projects for establishing quality assurance centres and 17 other projects for development of strategic plan for quality assurance.
2. Faculty level: to establish internal quality assurance systems in 157 faculties all over the country. In this regard, it is worth noting that there is a type of accreditation for universities offered by NAQAAE which mandates the sustainability of both QA centres and units’ activities at both the university and faculty level. This was recommended to be achieved through the support of university management to these QA entities.
3. Sector level: 10 projects have been devoted to formulate National Academic Reference Standards (NARS). NARS have been completed for the following sectors: nursing, agriculture, engineering, veterinary medicine, basic science, pharmacy, home economics, medicine, arts & literature and physical education. NAQAAE has adopted the NARS projects for the remaining sectors and work is underway to develop their national standards (HEEP impact assessment study, 2008). Efforts have been made by NAQAAE, with the co-operation of experts and stakeholders, to prepare academic tools, manuals, criteria and standards. NAQAAE has completed NARS for 50 specialisations, about 60% of the total NARS needed. NAQAAE has also developed a manual describing the criteria of competent full-time faculty members.
Throughout this reform project, QAAP has allowed for professional development of staff involved in enhancing the quality of HE and has helped to improve the culture of quality in education among universities/HE institutions and the wider community. QAAP has conducted 1,527 capacity building workshops: 257 to train faculty staff as peer reviewers and chairs in the developmental engagement (DE) phase,3 25 to train directors of QA centres, 42 on the DE phase, 41 on action planning, 43 on strategic planning, 158 on internal QA systems, and 971 on student assessment methods. As a result of this capacity building effort, 661 staff members were trained for chair and peer reviewing and 192 staff members practised reviewing during the DE visits. The number of staff members trained in the different QA aspects was: 84 (as facilitators), 474 (action planning), 125 (report writing), 232 (student assessment), and 860 (developing NARS) (HEEP impact assessment study, 2008).
An internal audit group conducted an investigation into progress made in developing and implementing QAAP. The results were documented in an internal audit report completed in November 2007. This report helped in assessing the impact of QAAP’s activities and measures based 3 Developmental engagement aims to evaluate academic activity and quality assurance systems according to the
criteria for accreditation, which include academic standards, quality of learning opportunities, research and other scholarly activity, community involvement, effectiveness of quality management and enhancement.

42 43
43
Ta
ble
3.5
Nu
mb
ers
of
sta
ff m
em
be
rs a
nd
stu
den
ts,
an
d t
he
ra
tio
of
sta
ff m
em
be
rs t
o s
tud
en
ts b
y H
E t
yp
e a
nd
sec
tor,
20
06
/07
Secto
rs/S
cie
nces
Nu
mb
er
of
Facu
lty M
em
bers
N
um
ber
of
Stu
dents
F
acult
y M
em
bers
/ S
tudents
rati
o
Pu
b U
P
r U
P
HI
Al-
Az
Pub U
P
r U
P
HI
Al-
Az
Pub U
P
r U
P
HI
Al-
Az
Ed
ucati
on
al
5
46
8
87
_
34
7
239284
664
_
44085
1/4
4
1/7
_
1/1
27
Basi
c
40
80
19
_
68
2
395
96
177
_
9421
1/9
1/9
_
1/1
3
Med
ical
1
46
10
13
99
4
23
31
123704
23303
1393
11382
1/8
1/1
6
1/3
48
1/4
En
gin
eeri
ng
42
52
64
4
44
2
32
8
131899
8683
64956
6913
1/3
1
1/1
3
1/1
46
1/2
1
Cu
ltu
ral
& l
itera
ry
31
81
78
6
8
25
68
180236
1258
16734
244543
1/5
7
1/1
6
1/2
46
1/9
5
Art
5
42
13
0
26
3
_
10763
1152
2274
_
1/2
0
1/8
1/8
_
Ag
ricu
ltu
ral
&
Vete
rin
ary
3
70
1
_
12
35
4
35950
_
9736
5279
1/9
_
1/8
11
1/1
4
So
cia
l
21
31
12
35
7
75
56
7
337634
13377
333245
75738
1/1
58
1/1
0
1/4
29
1/1
33
To
tal
37
96
5
35
92
1
56
4
71
77
1099066
48614
4283
38
397361
1/2
9
1/1
3
1/2
73
1/5
5
Note
s:
Pub U
= P
ublic
Univ
ers
itie
s
Pr
U =
Private
Univ
ers
itie
s
PH
I =
Private
Hig
her
Institu
tes
Al-A
z =
Al-A
zhar
Univ
ers
ity
Sourc
e:
SP
U d
ata
base.
42
often held at faculties in which prominent national and international speakers are invited to give lectures to faculty members and their assistants. Some private/public universities/institutes have also started to require regular performance appraisals of faculty staff and administration personnel.
3.4.2 Students
In 2008, HE institutions in Egypt were serving 2.4 million undergraduate students and about 250 000 postgraduate students (Minister of HE presentation in the TEMPUS Conference; May, 2008). The number of undergraduate students was 17 times those in HE institutions in 1965/66 (Information and Decision Support Center, Egyptian Cabinet of Ministers, April 2008 report, vol 16). This number of students is expected to almost double by 2022; currently 30% of the target age group is enrolled and the objective is to reach 40% by 2022. It is rather obvious that the quality of HE in Egypt is negatively affected by the dramatic growth in the student population. The rapid growth in university enrolments in the 1970s and 1980s resulted in a serious deterioration in the quality of education. Academic success depended on the use of tutors, whose fees are beyond the reach of students of modest means (Richards, 1992). Student enrolments also increased by 42% between 1997/98 and 1998/99, leading to an 8% decline in per-student spending and exacerbating disparities in resource allocation between faculties (World Bank, 2002). The government strategy pursued since the mid-1980s, of stabilising the number of university students, has required considerable courage by policy makers, who are struggling to correct a long-term, inequitable misallocation of educational resources (Richards, 1992).
Table 3.5 shows the number of staff members and the ratio of staff members to students in some components of the HE system for the academic year 2006/07. In public universities, the ratio of faculty staff members to students is a long way from internationally accepted ratios (1/25) in educational, basic, literary, and social sciences. On the other hand, the table demonstrates that in all fields of study at private universities the ratio of staff members to students does not generally deviate from international standards. In private higher institutes, however, the ratio of faculty members to student is also a long way from international standards in all sectors except for art sciences. In Al-Azhar University, the ratio does not match international standards in educational, literary and social sciences. Faculty members in faculty of agriculture had the lowest share of students, (1/6.3 on average) whereas faculty members in law and commerce had the highest (1/500 and 1/356 respectively) in 2005/2006 (Information and Decision Support Center, Egyptian Cabinet of Ministers, April 2008 report, vol 16). In general, the data demonstrate that there is a shortage of faculty staff members and strategies will be needed to deal with this.

44 45
45
employees at the students’ affairs office who do not treat students properly and (ii) to poorly developed examination schedules). Recommendations Increase the number of public universities (32% of respondents) Improving curricula (19%) Abide by the needs of stakeholders (12%) Exert strict control measures by the government over the private universities (12%). Apply strict control measures over the public universities (6%). Reduce tuition fees in private universities (8%) Establish colleges for vocational education (5%). Source: Information and Decision Support Center, Egyptian Cabinet of Ministers, February, 2007.
Table 3.6 Number of new programmes in public universities and number of students served
Sector Engineering Pharmacy Medicine Basic Sciences
Agriculture Computers &
Information
Commerce Arts Veterinary Medicine
No. of new programs
21 7 7 3 3 3 2 1 1
No. of students served in new programs
2199
668
1006
420
52
133
346
16
46
Source: SPU database.
Table 3.7a Digital libraries and e-subscription of books and scientific journals available in public universities as a result of HEEP
Knowledge Resources
Description No of Item Source
Fulltext -Dissertations & Theses 2.4 million Proquest
Fulltext journal - e-book 5120 Springer Link
Fulltext journal 2000 Science Direct
Fulltext journal - Abstract 10,000 ASC
Fulltext journal 500 LISTA
Fulltext journal 4,800 MEDLINE
Fulltext journal - Abstract 388,700 GreenFILE
Fulltext journal 1,243,000 ERIC
Fulltext journal-Abstract-patent abstract 13,014,050 Scopus
Fulltext journal - title 500 Wilson Humanities
Fulltext journal 128 IEEE
Source: Egyptian Digital Library Consortium
44
3.4.3 Resources
Educational resources
Teaching material
In the majority of public universities, faculty members prepare lecture/laboratory notes as the main source of information for students. Text books recommended by course instructors may be available in the faculty library, though there are only a few copies of each. The faculty members in any department responsible for teaching a course are involved in developing the course material and updating it annually. Evaluation of course material is done by external evaluators as part of the quality assurance process. However, a formal internal quality assurance system is yet to be achieved in the majority of public universities.
Some public universities are offering what is called "new programme in HE" in which small number of fee-paying students are enrolled versus the regular free education. These programmes take an inter- or multidisciplinary approach and are monitored and evaluated through the Monitoring and Evaluation of New Programs Project (MENPP) using international benchmarking.6 In many of these programmes, international text books are used by course instructors and the libraries contain enough copies of these books. Nevertheless, the percentage of these new programmes relative to the total number of educational programmes available is too small to have a measurable positive impact on the quality of HE in Egypt. New programmes offered in 2007/2008 reached 48 in 14 public universities in nine sectors, serving 4886 students in total (Monitoring and Assessment of New Programs Report 2007/2008 and see below). Table 3.6 demonstrates that 45% of all students enrolled in the new programmes were in the engineering sector; the next highest percentages were in the pharmacy and medical sectors.
In general, however, educational material is limited, although HEEP has helped in making digital libraries and e-subscription of books and scientific journals available to compensate for such limitations (Table 3.7a & b).
Box 3.2. Students’ opinions A government survey asked 1 282 Egyptian public university students about the problems they face in university education. They answered as follows: Problems related to faculty staff members (35% of respondents, 50% of whom explained that the major problem lies in some faculty members not following the lecture schedule). 44% reported problems related to curricula: too long (49%), too difficult (34%) and that many books exist for a single course. These difficulties were noted as the main reason for resorting to private lessons (10% of survey participants). 55% of participants mentioned that lecture notes prepared by instructors are expensive and they are not available early in the academic semester. Not enough books in the libraries (22% of participants); not enough space in libraries (21%); problems related to teaching halls and laboratories (42% of participants, 63% of whom explained that the size of teaching halls and laboratories are not suitable for the number of students). Problems related to cultural, and physical activities inside the university (12% of respondents, 37% of whom noted lack of proper announcements about these activities). Problems related to student affairs (36% of respondents, 33% of whom related such problems to (i)
6 For more information, see www.heep2.edu.eg/menpp.htm

46 47
47
stakeholders. Therefore, faculties which attained QAAP projects conduct an annual survey of stakeholders (employers, alumni, students, and parents) to evaluate their educational programmes. External examiners/evaluators’ reports, students’ complaints and course evaluations may also feed into curricula updates. The ETCP has helped develop curricula according to the relevant industry skill/job requirements using the developed National Skills Standards (NSS), where available. As a general outcome of HEEP, curricula were redesigned for 26 programmes involving 440 courses in the commercial, industrial, civil, architect, hotel, management & tourism and social services specialisations (HEEP Progress Report Feb, 2008). As previously mentioned, curricula matching the most recent advances in many fields were offered through the new programmes in higher education in 2007/08. One Tempus Joint European Project called “Sustainable Environmental Development, A Curriculum Development Project” (SEDC) is one example of many Tempus curriculum development projects pursued in Egypt. SEDC was selected in 2003; activities operated between September 2003 and February 2007. Throughout this project, a total of seven courses were updated and upgraded at the Faculty of Agriculture of Suez Canal University in Ismailia.8
Financial resources
Officially, the Egyptian government is responsible for financing basic and higher education. Only parents of students who attend private universities/institutes, pay tuition fees. In 1907, the budget of the Ministry of HE was LE 374 000, in 1965/66 it was EGP 25.8 million, while by 2007/08, total expenditure on HE in Egypt had reached EGP 10.1 billion. In public HE institutions during the academic year 1965/66, the government spent EGP 182 per student, versus EGP 4 248 per student in 2006/07 (Information and Decision Support Center, Egyptian Cabinet of Ministers, April 2008 report, vol 16). Nevertheless, HE in Egypt has been facing declining government budgets and employment and increasing reliance on the private sector (Richards, 1992). Beginning in 1994/95, the government’s share of higher education finance for public universities was reduced to 85%, leaving the universities to generate the remaining 15% through different means. To compensate for such reduction, some public universities have introduced high quality foreign language programmes for which they charge nominal tuition fees and other relevant fees (see Chapter 6). For example, some public universities charge a few thousands Egyptian pounds for degree programmes in commerce and law which use English and French as the media of instruction (World Bank, 2000). The new programmes mentioned above are also fee-paying.
It is important to note that the MoHE allocated a budget of one billion EGP for preparing public universities for accreditation through the Continuous Improvement and Qualifying for Accreditation Project (CIQAP) between 2007 and 2012. Through this project, faculties can apply for between 5 and 10 million EGP to implement an action plan for improving the undergraduate/graduate educational process, enhancing research and community service activities and sustaining their internal QA systems. At present, 23 faculties have started implementing their action plan to qualify for accreditation and about 20 other faculties were expected to be funded by September 2008. Quality Assurance and Accreditation Projects in their first and second phases (QAAP & QAAP2) also helped to establish internal quality assurance systems in 250 of 320 faculties. In these projects, budgets of between EGP 170,000 and 340,000 were allocated to each faculty. In March 2008, 77 faculties and institutes had QAAP2 projects, with 52 faculties and institutes planning to apply for QAAP2 projects in September 2008.9
88 For more information see http://www.incaweb.org/tempus/ 9 See www.heep2.edu.eg/qaap2/index.htm
46
Table 3.7b Logins, searches, full text downloads, and abstracts accessed in public universities, 2006/2007
Logins and Activities
University Logins Searches Full text downloads Abstracts Accessed
Cairo 92,071 210,489 320,818 832,628
Alexandria 66,715 148,693 208,112 611,997
Ain Shams 32,878 82,919 100,147 509,969
Assuit 38,989 62,882 103,329 273,003
Tanta 34,762 79,396 118,625 333,630
Mansoura 65,291 135,703 193,479 482,532
Zagazig 34,279 74,824 108,464 258,678
Helwan 15,234 37,442 45,662 121,985
Menia 22,187 46,369 123,196 230,662
Minofia 28,465 59,715 81,149 216,748
Suez Canal 29,406 68,494 90,563 229,249
South Valley 17,826 37,016 80,924 170,544
Fayoum 3,346 7,954 4,681 19,247
Benha 2,998 5,751 3,438 13,273
Beni Seuf 1,775 3,019 2,782 9,486
EUN 886 26,859 1,442 6,985
Total 487,108 1,087,525 1,586,811 4,320,616
Source: Egyptian Digital Library Consortium
Curriculum
As part of the outputs of the QAAP, faculties define the knowledge and skills to be acquired by students (intended learning outcomes or ILOs) for different faculties. The QAAP requires faculty members to assess students’ achievement of different ILOs. For that purpose they are regularly urged to document the views of students, alumni, and employers as to the achievement and appropriateness of programme ILOs. For the purpose of accreditation, comparing “Provision” and “Benchmark” is important in revealing the gap between the faculty’s ILOs and the adopted target. Reducing the gap necessitates updating the curriculum. To assist HE institutions in comparing with and upgrading their academic standards/curricula to equivalent national/international standards, QAAP — in collaboration with SCU sector committees and academic professional societies and syndicates — aimed to develop and adopt NARS that correspond to international standards for all undergraduate studies. Recently, NAQAAE has adopted the NARS and took charge of reviewing the first draft of the academic standards for 36 educational programmes in the engineering, physical education, basic sciences, arts, medicine, and agriculture sectors.7
Educational programmes are updated through a curriculum development committee (CDC) established as by the QAU in each faculty engaged with QAAP. The CDC committee is chaired by the dean and includes vice-deans, the QA unit manager, and department heads. QAAP has also urged faculties in public universities to ensure that the curricular content meets the expectations of 7 For more information see www.naqaae.org
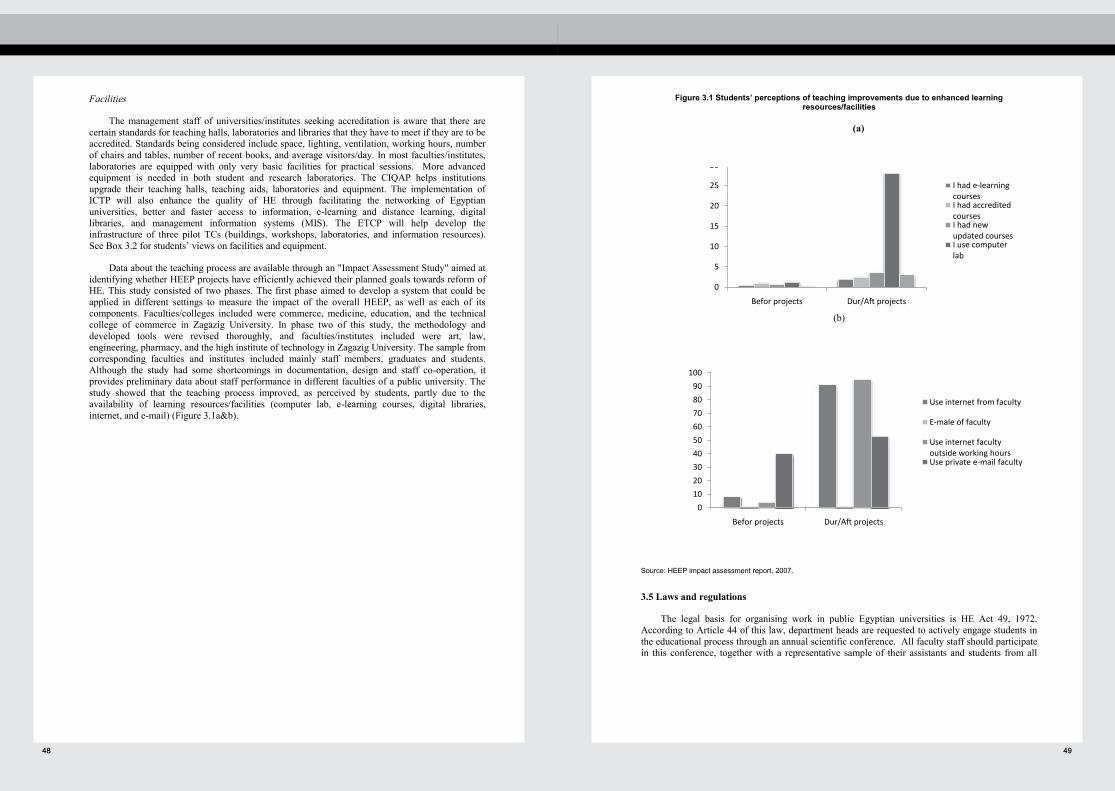
48 49
49
Figure 3.1 Students’ perceptions of teaching improvements due to enhanced learning resources/facilities
(a)
(b)
Source: HEEP impact assessment report, 2007.
3.5 Laws and regulations
The legal basis for organising work in public Egyptian universities is HE Act 49, 1972. According to Article 44 of this law, department heads are requested to actively engage students in the educational process through an annual scientific conference. All faculty staff should participate in this conference, together with a representative sample of their assistants and students from all
0
5
10
15
20
25
30
Befor projects Dur/Aft projects
I had e-learning coursesI had accredited coursesI had new updated coursesI use computer lab
0
10
20
30
40
50
60
70
80
90
100
Befor projects Dur/Aft projects
Use internet from faculty
E-male of faculty
Use internet faculty outside working hoursUse private e-mail faculty
48
Facilities
The management staff of universities/institutes seeking accreditation is aware that there are certain standards for teaching halls, laboratories and libraries that they have to meet if they are to be accredited. Standards being considered include space, lighting, ventilation, working hours, number of chairs and tables, number of recent books, and average visitors/day. In most faculties/institutes, laboratories are equipped with only very basic facilities for practical sessions. More advanced equipment is needed in both student and research laboratories. The CIQAP helps institutions upgrade their teaching halls, teaching aids, laboratories and equipment. The implementation of ICTP will also enhance the quality of HE through facilitating the networking of Egyptian universities, better and faster access to information, e-learning and distance learning, digital libraries, and management information systems (MIS). The ETCP will help develop the infrastructure of three pilot TCs (buildings, workshops, laboratories, and information resources). See Box 3.2 for students’ views on facilities and equipment.
Data about the teaching process are available through an "Impact Assessment Study" aimed at identifying whether HEEP projects have efficiently achieved their planned goals towards reform of HE. This study consisted of two phases. The first phase aimed to develop a system that could be applied in different settings to measure the impact of the overall HEEP, as well as each of its components. Faculties/colleges included were commerce, medicine, education, and the technical college of commerce in Zagazig University. In phase two of this study, the methodology and developed tools were revised thoroughly, and faculties/institutes included were art, law, engineering, pharmacy, and the high institute of technology in Zagazig University. The sample from corresponding faculties and institutes included mainly staff members, graduates and students. Although the study had some shortcomings in documentation, design and staff co-operation, it provides preliminary data about staff performance in different faculties of a public university. The study showed that the teaching process improved, as perceived by students, partly due to the availability of learning resources/facilities (computer lab, e-learning courses, digital libraries, internet, and e-mail) (Figure 3.1a&b).

50 51
51
3.6 Quality of the educational process
3.6.1 Teaching staff-student interaction
In proper educational settings, it is important that faculties facilitate learning and encourage students to take responsibility for their own learning methods, as appropriate. For this purpose, it is essential to encourage the use of new learning methods alongside traditional methods, taking full advantage of the experience available through the learning and teaching support sites on the internet. Training courses in advanced teaching methodologies and approaches, and other ways of engaging students in the learning process, are being implemented to introduce the concept of interactive teaching. These educational methods include lectures to let students gain information, provide explanations and illustrations and to encourage students to ask questions and undertake further reading.
Practical and/or laboratory sessions are essential for delivering hard sciences. They highlight the means of application of theoretical knowledge, allow students to develop their professional skills and provide experimental learning opportunities in the different disciplines. Assignments in the form of posters or seminar presentations, research papers, and case studies are used in many faculties to encourage students to work individually or in small groups. This method also enhances students’ independent learning through library visits and online research. Some faculties use fieldtrips to provide students with experiential learning opportunities in the appropriate environment. Some courses include training of all students to use the computer since computer skills are needed in students’ everyday life. Summer training and internship programmes are performed under the supervision of faculty staff members and their assistants in some faculties. Students get involved in field training to practise their profession in different settings. Unfortunately, in social sciences and humanities, students might not have the chance to be trained properly to perfect their professional skills. The large numbers of students in faculties like law and commerce, for example, hinder the proper interaction between students and teachers during the learning process and make it financially difficult to produce better quality professionals. In these educational settings learning largely depends on memorisation and repetition without fostering the development of synthesising, problem-solving, or creative thinking abilities.
In the HEEP impact assessment study, enhanced methods of teaching and assessment were compared before, during and after the project (Table 3.9). This shows a significant increase during the project in the percentage of faculty staff who were using small group teaching, advanced visual aids, role plays and problem solving assessment methods.
50
levels of study. The aim of this scientific gathering is to explore different ways of enhancing the quality of the teaching, learning and research processes. Article 42 of the act also requires each department head to write an annual final report to be approved by the department council. This report discusses all scientific, educational, administrative and financial matters of the department. In addition, the report discusses departmental activities, level of performance and examination procedures and results. All constraints should be raised along with possible solutions and all good and bad practices that the department experienced are discussed to learn from in the following academic year. This report should be approved by the department council before being approved by the faculty council. In each HE institution there are internal bylaws and regulations that can be reviewed and updated when needed. These bylaws were defined under Presidential Decree 25 (2007). Article 5 of the bylaws refers to the importance of having internal mechanisms for reviewing the quality of services provided by institutions to be eligible to apply for accreditation. Institutions to be accredited must also have graduates in the labour market, strategic plans, quality reports, and action plans for improvement that are monitored and evaluated on a periodic basis.
3.5.1 Staff appointments
Like all other governmental institutions in Egypt, public universities used to apply the seniority system of public administration. Under this system, there was no requirement to open up job vacancies to external candidates; full time faculty staff had the sole privilege of filling the position. This system bred mediocrity and had a negative impact on the quality of higher education. The Minister of HE proposed a new unified legislation in October 2006 which basically suggested applying the merit system of public administration that has proved successful in both public and private institutions in developed countries. The merit system ensures hiring according to qualifications and promotion according to achievements. Faculty staff’s resistance to change was evident when the unified legislation was proposed and therefore implementation may occur gradually.
Table 3.8 demonstrates the contribution of ETCP in reforming legislation governing technical colleges. In general, HEEP, through legislative reform, aims at establishing the performance standards for an accredited system of HE.
Table 3.8 ETCP’s contribution in reforming legislation governing technical colleges
Status of Agreed Objectives Indicators Project Development Objective Indicator
Measurement Baseline Value Progress To Date End-of-project Target Value
Legislative Framework in place for the Technical Colleges to become self-governing institutions with linkage to the private sector
No. or Text Date No. or Text Date No. or Text Date Legislative
framework in place for the Technical Colleges
Dec 2007 - Legislative framework in place for the Technical Colleges -Bylaws were revised after one year of implementation.
Dec 2008
Source: HEEP Progress Report Feb, 2008.
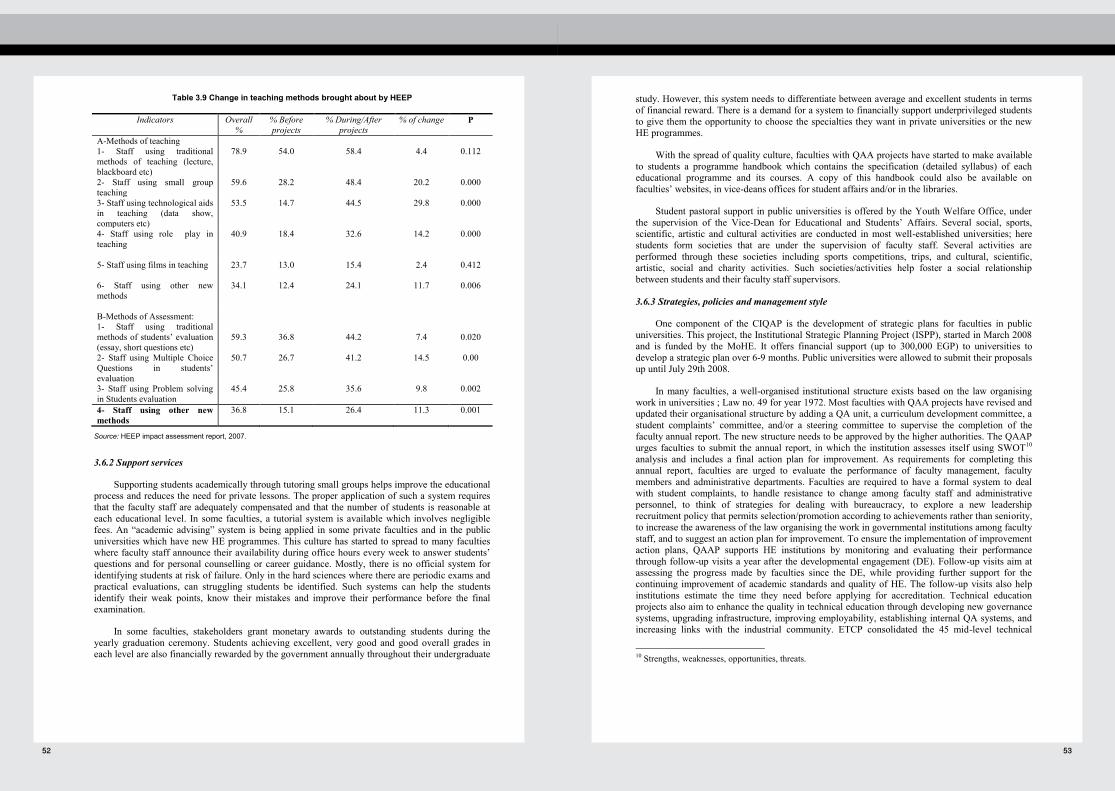
52 53
53
study. However, this system needs to differentiate between average and excellent students in terms of financial reward. There is a demand for a system to financially support underprivileged students to give them the opportunity to choose the specialties they want in private universities or the new HE programmes.
With the spread of quality culture, faculties with QAA projects have started to make available to students a programme handbook which contains the specification (detailed syllabus) of each educational programme and its courses. A copy of this handbook could also be available on faculties’ websites, in vice-deans offices for student affairs and/or in the libraries.
Student pastoral support in public universities is offered by the Youth Welfare Office, under the supervision of the Vice-Dean for Educational and Students’ Affairs. Several social, sports, scientific, artistic and cultural activities are conducted in most well-established universities; here students form societies that are under the supervision of faculty staff. Several activities are performed through these societies including sports competitions, trips, and cultural, scientific, artistic, social and charity activities. Such societies/activities help foster a social relationship between students and their faculty staff supervisors.
3.6.3 Strategies, policies and management style
One component of the CIQAP is the development of strategic plans for faculties in public universities. This project, the Institutional Strategic Planning Project (ISPP), started in March 2008 and is funded by the MoHE. It offers financial support (up to 300,000 EGP) to universities to develop a strategic plan over 6-9 months. Public universities were allowed to submit their proposals up until July 29th 2008.
In many faculties, a well-organised institutional structure exists based on the law organising work in universities ; Law no. 49 for year 1972. Most faculties with QAA projects have revised and updated their organisational structure by adding a QA unit, a curriculum development committee, a student complaints’ committee, and/or a steering committee to supervise the completion of the faculty annual report. The new structure needs to be approved by the higher authorities. The QAAP urges faculties to submit the annual report, in which the institution assesses itself using SWOT10 analysis and includes a final action plan for improvement. As requirements for completing this annual report, faculties are urged to evaluate the performance of faculty management, faculty members and administrative departments. Faculties are required to have a formal system to deal with student complaints, to handle resistance to change among faculty staff and administrative personnel, to think of strategies for dealing with bureaucracy, to explore a new leadership recruitment policy that permits selection/promotion according to achievements rather than seniority, to increase the awareness of the law organising the work in governmental institutions among faculty staff, and to suggest an action plan for improvement. To ensure the implementation of improvement action plans, QAAP supports HE institutions by monitoring and evaluating their performance through follow-up visits a year after the developmental engagement (DE). Follow-up visits aim at assessing the progress made by faculties since the DE, while providing further support for the continuing improvement of academic standards and quality of HE. The follow-up visits also help institutions estimate the time they need before applying for accreditation. Technical education projects also aim to enhance the quality in technical education through developing new governance systems, upgrading infrastructure, improving employability, establishing internal QA systems, and increasing links with the industrial community. ETCP consolidated the 45 mid-level technical
10 Strengths, weaknesses, opportunities, threats.
52
Table 3.9 Change in teaching methods brought about by HEEP
Indicators Overall %
% Before projects
% During/After projects
% of change P
A-Methods of teaching 1- Staff using traditional methods of teaching (lecture, blackboard etc)
78.9
54.0
58.4
4.4
0.112
2- Staff using small group teaching
59.6 28.2 48.4 20.2 0.000
3- Staff using technological aids in teaching (data show, computers etc)
53.5 14.7 44.5 29.8 0.000
4- Staff using role play in teaching
40.9 18.4 32.6 14.2 0.000
5- Staff using films in teaching
23.7 13.0 15.4 2.4 0.412
6- Staff using other new methods
34.1 12.4 24.1 11.7 0.006
B-Methods of Assessment: 1- Staff using traditional methods of students’ evaluation (essay, short questions etc)
59.3
36.8
44.2
7.4
0.020
2- Staff using Multiple Choice Questions in students’ evaluation
50.7 26.7 41.2 14.5 0.00
3- Staff using Problem solving in Students evaluation
45.4 25.8 35.6 9.8 0.002
4- Staff using other new methods
36.8 15.1 26.4 11.3 0.001
Source: HEEP impact assessment report, 2007.
3.6.2 Support services
Supporting students academically through tutoring small groups helps improve the educational process and reduces the need for private lessons. The proper application of such a system requires that the faculty staff are adequately compensated and that the number of students is reasonable at each educational level. In some faculties, a tutorial system is available which involves negligible fees. An “academic advising” system is being applied in some private faculties and in the public universities which have new HE programmes. This culture has started to spread to many faculties where faculty staff announce their availability during office hours every week to answer students’ questions and for personal counselling or career guidance. Mostly, there is no official system for identifying students at risk of failure. Only in the hard sciences where there are periodic exams and practical evaluations, can struggling students be identified. Such systems can help the students identify their weak points, know their mistakes and improve their performance before the final examination.
In some faculties, stakeholders grant monetary awards to outstanding students during the yearly graduation ceremony. Students achieving excellent, very good and good overall grades in each level are also financially rewarded by the government annually throughout their undergraduate
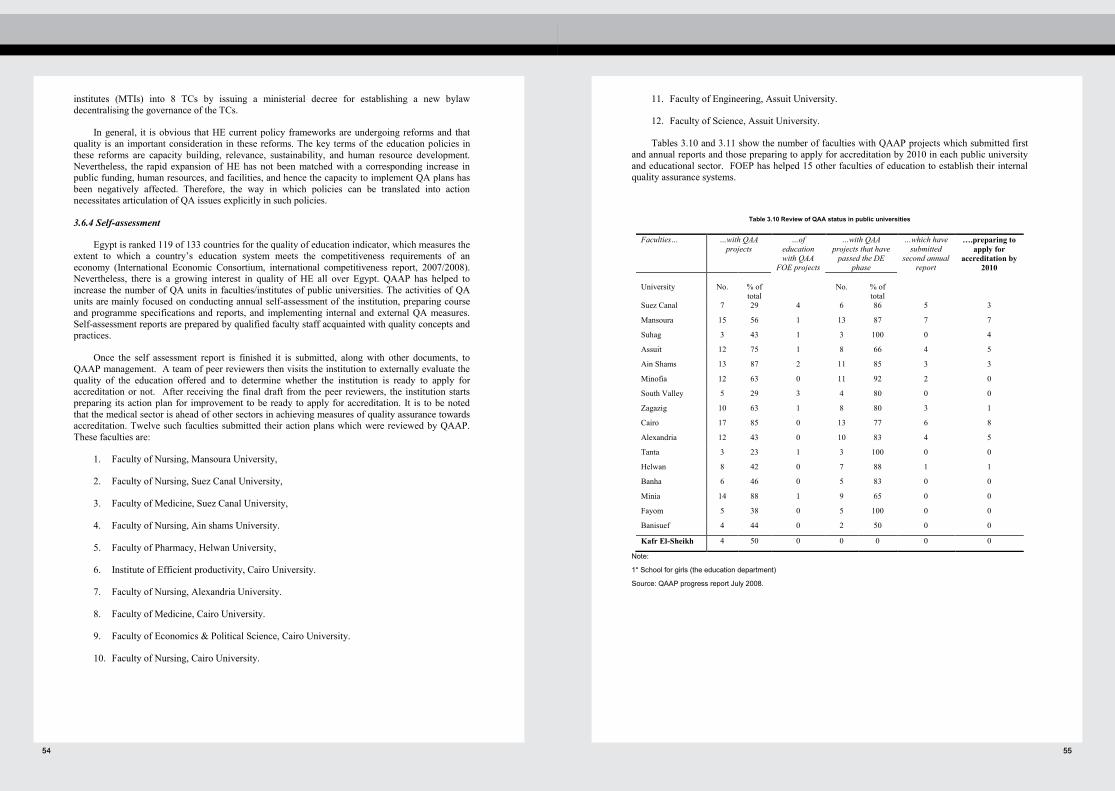
54 55
55
11. Faculty of Engineering, Assuit University.
12. Faculty of Science, Assuit University.
Tables 3.10 and 3.11 show the number of faculties with QAAP projects which submitted first and annual reports and those preparing to apply for accreditation by 2010 in each public university and educational sector. FOEP has helped 15 other faculties of education to establish their internal quality assurance systems.
Table 3.10 Review of QAA status in public universities
Faculties… …with QAA projects
…of education with QAA
FOE projects
…with QAA projects that have
passed the DE phase
…which have submitted
second annual report
….preparing to apply for
accreditation by 2010
University
No.
% of total
No.
% of total
Suez Canal 7 29 4 6 86 5 3
Mansoura 15 56 1 13 87 7 7
Suhag 3 43 1 3 100 0 4
Assuit 12 75 1 8 66 4 5
Ain Shams 13 87 2 11 85 3 3
Minofia 12 63 0 11 92 2 0
South Valley 5 29 3 4 80 0 0
Zagazig 10 63 1 8 80 3 1
Cairo 17 85 0 13 77 6 8
Alexandria 12 43 0 10 83 4 5
Tanta 3 23 1 3 100 0 0
Helwan 8 42 0 7 88 1 1
Banha 6 46 0 5 83 0 0
Minia 14 88 1 9 65 0 0
Fayom 5 38 0 5 100 0 0
Banisuef 4 44 0 2 50 0 0
Kafr El-Sheikh 4 50 0 0 0 0 0
Note:
1* School for girls (the education department)
Source: QAAP progress report July 2008.
54
institutes (MTIs) into 8 TCs by issuing a ministerial decree for establishing a new bylaw decentralising the governance of the TCs.
In general, it is obvious that HE current policy frameworks are undergoing reforms and that quality is an important consideration in these reforms. The key terms of the education policies in these reforms are capacity building, relevance, sustainability, and human resource development. Nevertheless, the rapid expansion of HE has not been matched with a corresponding increase in public funding, human resources, and facilities, and hence the capacity to implement QA plans has been negatively affected. Therefore, the way in which policies can be translated into action necessitates articulation of QA issues explicitly in such policies.
3.6.4 Self-assessment
Egypt is ranked 119 of 133 countries for the quality of education indicator, which measures the extent to which a country’s education system meets the competitiveness requirements of an economy (International Economic Consortium, international competitiveness report, 2007/2008). Nevertheless, there is a growing interest in quality of HE all over Egypt. QAAP has helped to increase the number of QA units in faculties/institutes of public universities. The activities of QA units are mainly focused on conducting annual self-assessment of the institution, preparing course and programme specifications and reports, and implementing internal and external QA measures. Self-assessment reports are prepared by qualified faculty staff acquainted with quality concepts and practices.
Once the self assessment report is finished it is submitted, along with other documents, to QAAP management. A team of peer reviewers then visits the institution to externally evaluate the quality of the education offered and to determine whether the institution is ready to apply for accreditation or not. After receiving the final draft from the peer reviewers, the institution starts preparing its action plan for improvement to be ready to apply for accreditation. It is to be noted that the medical sector is ahead of other sectors in achieving measures of quality assurance towards accreditation. Twelve such faculties submitted their action plans which were reviewed by QAAP. These faculties are:
1. Faculty of Nursing, Mansoura University,
2. Faculty of Nursing, Suez Canal University,
3. Faculty of Medicine, Suez Canal University,
4. Faculty of Nursing, Ain shams University.
5. Faculty of Pharmacy, Helwan University,
6. Institute of Efficient productivity, Cairo University.
7. Faculty of Nursing, Alexandria University.
8. Faculty of Medicine, Cairo University.
9. Faculty of Economics & Political Science, Cairo University.
10. Faculty of Nursing, Cairo University.
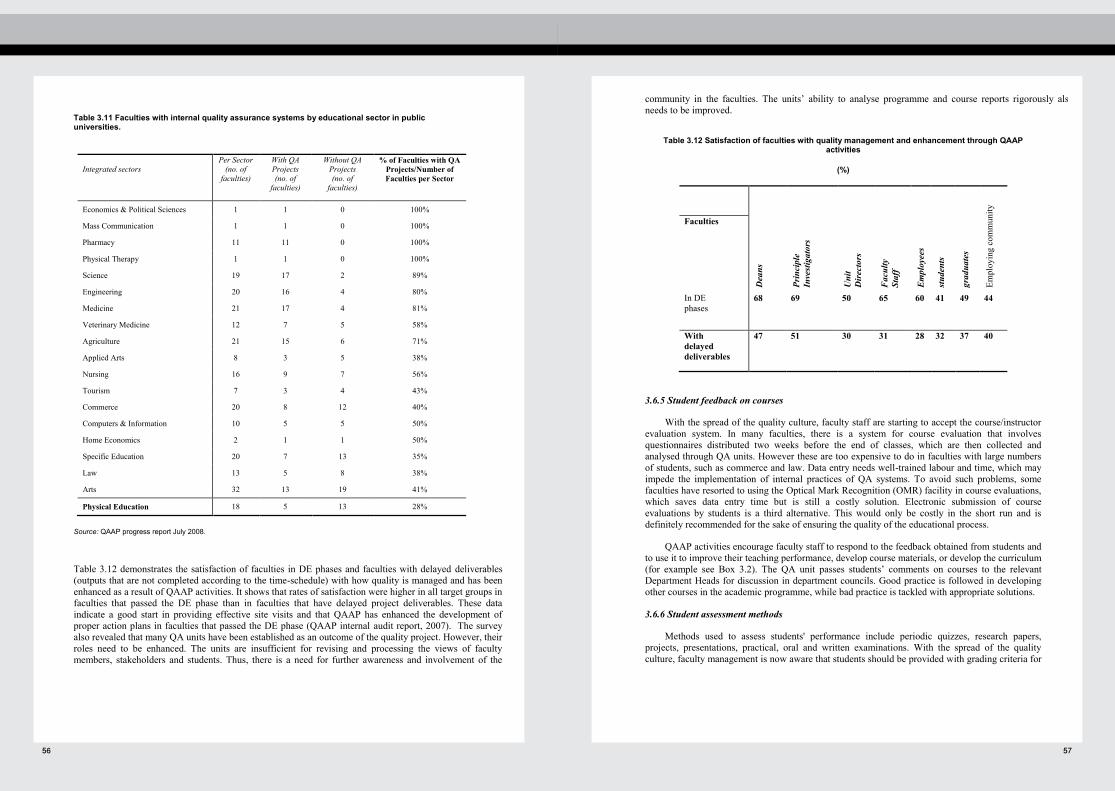
56 57
57
community in the faculties. The units’ ability to analyse programme and course reports rigorously also needs to be improved.
Table 3.12 Satisfaction of faculties with quality management and enhancement through QAAP activities
(%)
Dea
ns
Prin
cipl
e In
vest
igat
ors
Uni
t D
irec
tors
Facu
lty
Staf
f
Empl
oyee
s
stud
ents
grad
uate
s
Empl
oyin
g co
mm
unity
Faculties
In DE phases
68 69 50 65 60 41 49 44
With delayed deliverables
47 51 30 31 28 32 37 40
3.6.5 Student feedback on courses
With the spread of the quality culture, faculty staff are starting to accept the course/instructor evaluation system. In many faculties, there is a system for course evaluation that involves questionnaires distributed two weeks before the end of classes, which are then collected and analysed through QA units. However these are too expensive to do in faculties with large numbers of students, such as commerce and law. Data entry needs well-trained labour and time, which may impede the implementation of internal practices of QA systems. To avoid such problems, some faculties have resorted to using the Optical Mark Recognition (OMR) facility in course evaluations, which saves data entry time but is still a costly solution. Electronic submission of course evaluations by students is a third alternative. This would only be costly in the short run and is definitely recommended for the sake of ensuring the quality of the educational process.
QAAP activities encourage faculty staff to respond to the feedback obtained from students and to use it to improve their teaching performance, develop course materials, or develop the curriculum (for example see Box 3.2). The QA unit passes students’ comments on courses to the relevant Department Heads for discussion in department councils. Good practice is followed in developing other courses in the academic programme, while bad practice is tackled with appropriate solutions.
3.6.6 Student assessment methods
Methods used to assess students' performance include periodic quizzes, research papers, projects, presentations, practical, oral and written examinations. With the spread of the quality culture, faculty management is now aware that students should be provided with grading criteria for
56
Table 3.11 Faculties with internal quality assurance systems by educational sector in public universities.
Integrated sectors
Per Sector (no. of
faculties)
With QA Projects (no. of
faculties)
Without QA Projects (no. of
faculties)
% of Faculties with QA Projects/Number of Faculties per Sector
Economics & Political Sciences 1 1 0 100%
Mass Communication 1 1 0 100%
Pharmacy 11 11 0 100%
Physical Therapy 1 1 0 100%
Science 19 17 2 89%
Engineering 20 16 4 80%
Medicine 21 17 4 81%
Veterinary Medicine 12 7 5 58%
Agriculture 21 15 6 71%
Applied Arts 8 3 5 38%
Nursing 16 9 7 56%
Tourism 7 3 4 43%
Commerce 20 8 12 40%
Computers & Information 10 5 5 50%
Home Economics 2 1 1 50%
Specific Education 20 7 13 35%
Law 13 5 8 38%
Arts 32 13 19 41%
Physical Education 18 5 13 28%
Source: QAAP progress report July 2008.
Table 3.12 demonstrates the satisfaction of faculties in DE phases and faculties with delayed deliverables (outputs that are not completed according to the time-schedule) with how quality is managed and has been enhanced as a result of QAAP activities. It shows that rates of satisfaction were higher in all target groups in faculties that passed the DE phase than in faculties that have delayed project deliverables. These data indicate a good start in providing effective site visits and that QAAP has enhanced the development of proper action plans in faculties that passed the DE phase (QAAP internal audit report, 2007). The survey also revealed that many QA units have been established as an outcome of the quality project. However, their roles need to be enhanced. The units are insufficient for revising and processing the views of faculty members, stakeholders and students. Thus, there is a need for further awareness and involvement of the
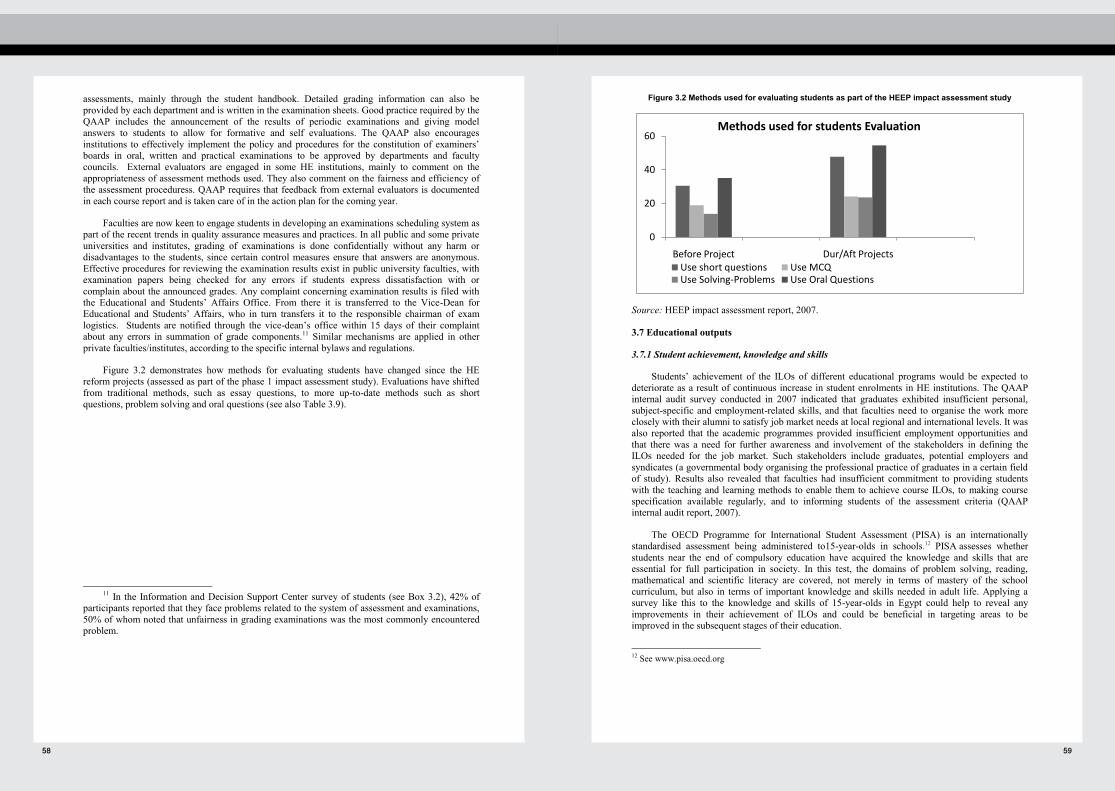
58 59
59
Figure 3.2 Methods used for evaluating students as part of the HEEP impact assessment study
Source: HEEP impact assessment report, 2007.
3.7 Educational outputs
3.7.1 Student achievement, knowledge and skills
Students’ achievement of the ILOs of different educational programs would be expected to deteriorate as a result of continuous increase in student enrolments in HE institutions. The QAAP internal audit survey conducted in 2007 indicated that graduates exhibited insufficient personal, subject-specific and employment-related skills, and that faculties need to organise the work more closely with their alumni to satisfy job market needs at local regional and international levels. It was also reported that the academic programmes provided insufficient employment opportunities and that there was a need for further awareness and involvement of the stakeholders in defining the ILOs needed for the job market. Such stakeholders include graduates, potential employers and syndicates (a governmental body organising the professional practice of graduates in a certain field of study). Results also revealed that faculties had insufficient commitment to providing students with the teaching and learning methods to enable them to achieve course ILOs, to making course specification available regularly, and to informing students of the assessment criteria (QAAP internal audit report, 2007).
The OECD Programme for International Student Assessment (PISA) is an internationally standardised assessment being administered to15-year-olds in schools.12 PISA assesses whether students near the end of compulsory education have acquired the knowledge and skills that are essential for full participation in society. In this test, the domains of problem solving, reading, mathematical and scientific literacy are covered, not merely in terms of mastery of the school curriculum, but also in terms of important knowledge and skills needed in adult life. Applying a survey like this to the knowledge and skills of 15-year-olds in Egypt could help to reveal any improvements in their achievement of ILOs and could be beneficial in targeting areas to be improved in the subsequent stages of their education.
12 See www.pisa.oecd.org
0
20
40
60
Before Project Dur/Aft Projects
Methods used for students Evaluation
Use short questions Use MCQUse Solving-Problems Use Oral Questions
58
assessments, mainly through the student handbook. Detailed grading information can also be provided by each department and is written in the examination sheets. Good practice required by the QAAP includes the announcement of the results of periodic examinations and giving model answers to students to allow for formative and self evaluations. The QAAP also encourages institutions to effectively implement the policy and procedures for the constitution of examiners’ boards in oral, written and practical examinations to be approved by departments and faculty councils. External evaluators are engaged in some HE institutions, mainly to comment on the appropriateness of assessment methods used. They also comment on the fairness and efficiency of the assessment proceduress. QAAP requires that feedback from external evaluators is documented in each course report and is taken care of in the action plan for the coming year.
Faculties are now keen to engage students in developing an examinations scheduling system as part of the recent trends in quality assurance measures and practices. In all public and some private universities and institutes, grading of examinations is done confidentially without any harm or disadvantages to the students, since certain control measures ensure that answers are anonymous. Effective procedures for reviewing the examination results exist in public university faculties, with examination papers being checked for any errors if students express dissatisfaction with or complain about the announced grades. Any complaint concerning examination results is filed with the Educational and Students’ Affairs Office. From there it is transferred to the Vice-Dean for Educational and Students’ Affairs, who in turn transfers it to the responsible chairman of exam logistics. Students are notified through the vice-dean’s office within 15 days of their complaint about any errors in summation of grade components.11 Similar mechanisms are applied in other private faculties/institutes, according to the specific internal bylaws and regulations.
Figure 3.2 demonstrates how methods for evaluating students have changed since the HE reform projects (assessed as part of the phase 1 impact assessment study). Evaluations have shifted from traditional methods, such as essay questions, to more up-to-date methods such as short questions, problem solving and oral questions (see also Table 3.9).
11 In the Information and Decision Support Center survey of students (see Box 3.2), 42% of
participants reported that they face problems related to the system of assessment and examinations, 50% of whom noted that unfairness in grading examinations was the most commonly encountered problem.
60 61
61
HEEP progress report, Feb 2008
Monitoring and Evaluation of New Programs Report 2007/2008.
World Bank (2000). Arab Republic of Egypt. Higher Education. Report # PID9033 p.40-41
Monitoring and Evaluation of New Programs Project (MENPP), WWW.heep2.edu.eg/menpp.htm.
Quality Assurance and Accreditation Project, second phase (QAAP2), WWW.heep2.edu.eg/qaap2/index.htm.
International Economic Consortium, international competitiveness report, 2007/2008.
Evaluation of HEEPF Project, October 2007
Impact assessment report 2007.
QAAP progress report 2008.
The Quality Assurance and Accreditation Handbook for Higher Education in Egypt. The National Quality Assurance and Accreditation Committee in Collaboration with British Consultants in Higher Education. Second edition, December 2007, Ministry of Higher Education.
Tuning the educational structures in Europe: Universities’ contribution to the Bologna Process: An Introduction. Second edition. Editors: Julia Gonzalez and Robert Wagenaar. Education and Culture DG, Lifelong Learning Programme, Feb, 2008.
National Authority for Quality Assurance and Accreditation of Education (NAQAAE). www.naqaae.org
Field trips by the author; Prof. Amani Khalifa while performing the following roles: a. Continuous monitoring, evaluation, and technical support of 17 quality
assurance/qualifying for accreditation projects in different faculties/institutes of Ain Shams University as the Director of The Quality Assurance and Qualifying for Accreditation Center (QAQAC), Ain-Shams University.
b. Monitoring, evaluation, and technical support of 157 quality assurance and accreditation projects, QAAP, Ministry of Higher Education (2005-2007).
c. Peer reviewer going through the whole process of the site visit to the completion of the last version of the developmental engagement report.
d. The Principle Investigator of a project for establishment of an internal system for assuring quality of education in Faculty of Pharmacy at Ain Shams University.
e. Director of QA Unit in Faculty of Pharmacy, Ain Shams University f. External evaluator in the project for “Establishment of an Internal Quality Assurance
System-Second Phase (QAAP2). g. External evaluator in the “Continuous Improvement and Qualifying for Accreditation
Project (CIQAP)”. h. External evaluator in Monitoring and Evaluation of New Programs in Higher Education
Project (MENPP). i. External evaluator in the Institutional Strategic Planning Project (ISPP). j. Quality Expert in the MENPP.
60
3.7.2 Stakeholders’ views
Generally, there is a clear gap between the academic level of graduates and labour market qualifications. The stakeholders of the HE institutions include students, graduates, employers of graduates, suppliers, academic and non-academic staff, non-governmental organisations, sponsors, community groups, and the government. An internal system of quality assurance in any HE institution cannot be sustained without a policy and consistent procedures to regularly engage these stakeholders in the educational, research and community service activities. Stakeholders’ views and comments can be captured through surveys, forums and focus group meetings. HEEPF has strengthened the co-operation and integration between industry and HE institutions. Faculties with QAAP, CIQAP, and QAAP2 projects are required to engage stakeholders in the quality enhancement process through membership of faculty councils, membership of committees for curricular development, or by generally engaging them in different phases of the internal review process conducted by quality assurance units in each faculty. In addition, in writing the faculty annual report, QAAP requires that stakeholders’ opinions on the educational programme and community service offered by the institution are included. With the establishment of internal QA systems in faculties with QAAPs, a system to monitor student employment has also started to take effect through an alumni office within the QA unit. This office aims to follow up and support student employment through continuous interaction with relevant employers.
A number of stakeholders have benefited from HE reform over the years. HEEPF projects have directly benefited 121,722 (8%) and indirectly benefited 89,899 (6%) under-graduates. Other beneficiaries include post-graduate students, alumni, university management, staff members, technicians, society, and public authorities. The largest number of beneficiaries was the alumni, followed by the post-graduate students (Evaluation of HEEPF Project, October 2007).
3.9 References
“Supreme Council of Universities”. http://www.frcu.eg/www.supreme.html.
Information and Decision Support Center, Egyptian Cabinet of Ministers, April 2008 report, vol 16. www.idsc.gov.eg
HEEP impact assessment study, 2008.
Internal Audit Report, QAAP, November 7th, 2007
Abdellah, Galal Abdel-Hamid and Taher, Salah El-Din Mohamed Fahmy. A Novel perspective of competitive mechanisms for enhancing Higher education in Egypt, 2007; p1-18. Available at: heepf.org.eg/pdf/research/
Hany Helal; Minister of Higher Education and State for Scientific Research, presentation in Tempus conference on quality enhancement in higher education. “ Higher Education in Egypt: A Vision Towards Quality Education”. Cairo, Egypt, 7-8 May 2008. Available at: ec.europa.eu/education/programmes/tempus/events/egypt.pdf.
Alan Richards. Policy, Research working papers ; no. WPS 862. Education and employment, 1992
World Bank (2002). Arab Republic of Egypt Higher Education Enhancement Project (HEEP) p.41 Washington D.C.

62 63
63
CHAPTER 4. EQUITY
4.1 Introduction
The issue of equity is crucial for the higher education sector in Egypt. It is of concern for disadvantaged groups or areas, such as girls in some regions, inhabitants of poor urban districts and rural residents, students with special needs, geographic areas with fewer education opportunities, or any groups that might be discriminated against —whether intentionally or unintentionally — for any reason.
The Higher Education Reform Strategy 2000 identified the basic challenges facing higher education in Egypt. One challenge is the inequality among students joining higher education. One aspect is underrepresentation of female versus male students across geographic regions, within certain specialisations and in relation to the level of degrees obtained. National policies have been adopted to resolve these issues and have been translated into specific programmes across universities and higher education institutes.
In 2004, the Higher Education Reform Strategy was revisited and one of the issues stressed was inequality. Minimal progress was achieved in this regard, a fact that invited more operational policies and strategies.
4.2 Inequity at provincial level
The distribution of students in higher education sector across geographical regions is still inequitable (Figure 4.1). For example, 7%, 8% and 10% of 18-23 year olds are enrolled in higher education in Fayoum, Behira and Menia respectively, versus 70%, 56% and 39% in Cairo, Port Said and Giza (Strategic Planning Unit, 2007).
Figure 4.1 Percentage of age group (18-23) enrolled by province, 2006/07
70%
56%47%
39%31%28%26%25%24%24%24%23%23%20%19%17%16%15%
10% 9% 9% 8% 8% 7% 4% 3% 2%0%
10%20%30%40%50%60%70%80%
Cair
o
Port
Sai
d
Ale
x
Giz
a
Dak
ahlia
Ass
iut
Gha
rbia
Suez
Asw
an
Mon
ofia
Shar
kia
Dom
iat
Ism
alia
Beni
Sw
eif
Kafr
el s
hikh
Qal
iobi
a
Qen
a
Soha
g
Min
ya
Nor
th S
inai
Luxo
r
Al W
ady
Al
…
Behi
ra
Fayo
m
Mar
sa M
atro
h
Red
Sea
Sout
h Si
nai
Average of 27.26%
62
k. Quality Expert representing Ain Shams University in quality of education related conferences/activities.
l. OECD PISA survey. www.pisa.oecd.org
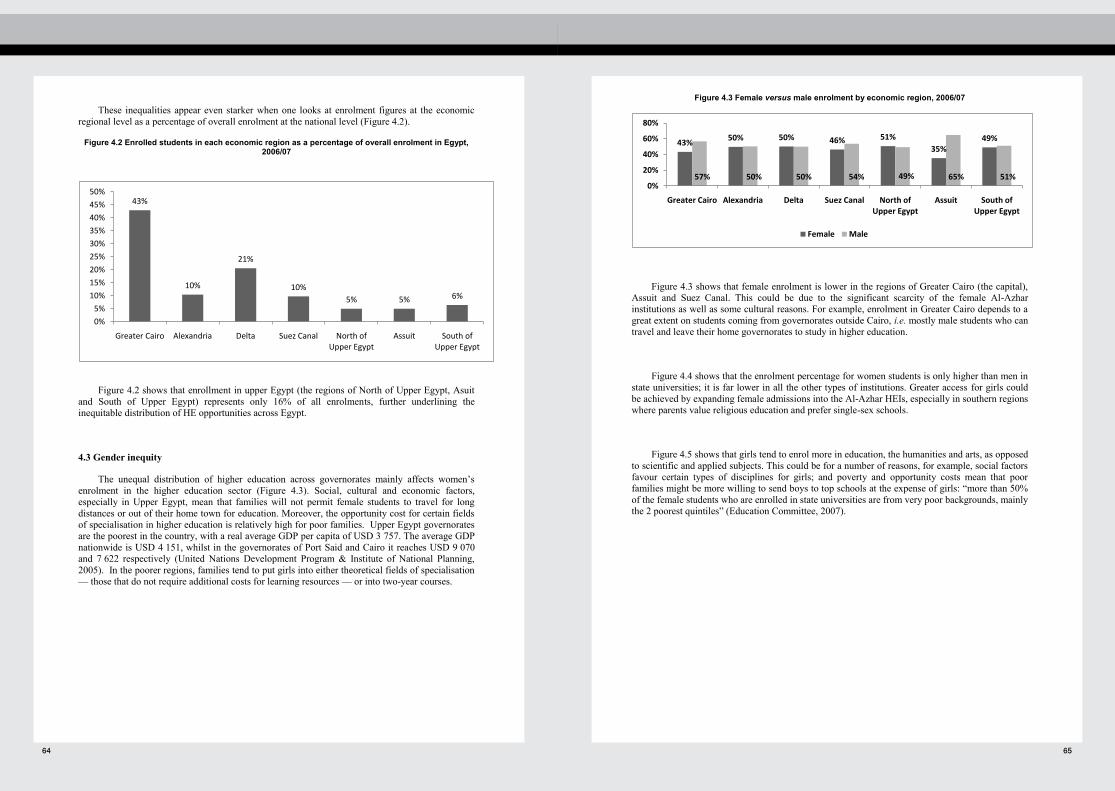
64 65
65
Figure 4.3 Female versus male enrolment by economic region, 2006/07
Figure 4.3 shows that female enrolment is lower in the regions of Greater Cairo (the capital), Assuit and Suez Canal. This could be due to the significant scarcity of the female Al-Azhar institutions as well as some cultural reasons. For example, enrolment in Greater Cairo depends to a great extent on students coming from governorates outside Cairo, i.e. mostly male students who can travel and leave their home governorates to study in higher education.
Figure 4.4 shows that the enrolment percentage for women students is only higher than men in state universities; it is far lower in all the other types of institutions. Greater access for girls could be achieved by expanding female admissions into the Al-Azhar HEIs, especially in southern regions where parents value religious education and prefer single-sex schools.
Figure 4.5 shows that girls tend to enrol more in education, the humanities and arts, as opposed to scientific and applied subjects. This could be for a number of reasons, for example, social factors favour certain types of disciplines for girls; and poverty and opportunity costs mean that poor families might be more willing to send boys to top schools at the expense of girls: “more than 50% of the female students who are enrolled in state universities are from very poor backgrounds, mainly the 2 poorest quintiles” (Education Committee, 2007).
43% 50% 50% 46% 51%35%
49%
57% 50% 50% 54% 49% 65% 51%0%
20%
40%
60%
80%
Greater Cairo Alexandria Delta Suez Canal North of Upper Egypt
Assuit South of Upper Egypt
Female Male
64
These inequalities appear even starker when one looks at enrolment figures at the economic
regional level as a percentage of overall enrolment at the national level (Figure 4.2).
Figure 4.2 Enrolled students in each economic region as a percentage of overall enrolment in Egypt, 2006/07
Figure 4.2 shows that enrollment in upper Egypt (the regions of North of Upper Egypt, Asuit and South of Upper Egypt) represents only 16% of all enrolments, further underlining the inequitable distribution of HE opportunities across Egypt.
4.3 Gender inequity
The unequal distribution of higher education across governorates mainly affects women’s enrolment in the higher education sector (Figure 4.3). Social, cultural and economic factors, especially in Upper Egypt, mean that families will not permit female students to travel for long distances or out of their home town for education. Moreover, the opportunity cost for certain fields of specialisation in higher education is relatively high for poor families. Upper Egypt governorates are the poorest in the country, with a real average GDP per capita of USD 3 757. The average GDP nationwide is USD 4 151, whilst in the governorates of Port Said and Cairo it reaches USD 9 070 and 7 622 respectively (United Nations Development Program & Institute of National Planning, 2005). In the poorer regions, families tend to put girls into either theoretical fields of specialisation — those that do not require additional costs for learning resources — or into two-year courses.
43%
10%
21%
10%5% 5% 6%
0%
5%
10%
15%
20%
25%
30%
35%
40%
45%
50%
Greater Cairo Alexandria Delta Suez Canal North of Upper Egypt
Assuit South of Upper Egypt
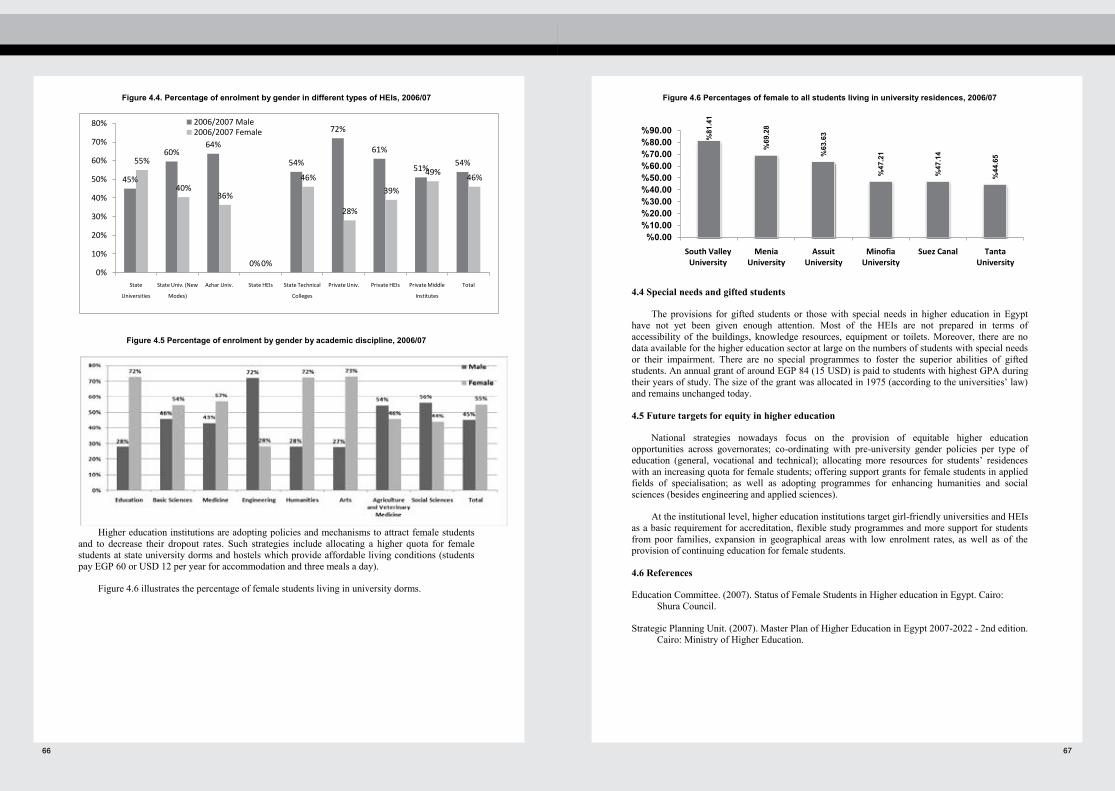
66 67
67
Figure 4.6 Percentages of female to all students living in university residences, 2006/07
4.4 Special needs and gifted students
The provisions for gifted students or those with special needs in higher education in Egypt have not yet been given enough attention. Most of the HEIs are not prepared in terms of accessibility of the buildings, knowledge resources, equipment or toilets. Moreover, there are no data available for the higher education sector at large on the numbers of students with special needs or their impairment. There are no special programmes to foster the superior abilities of gifted students. An annual grant of around EGP 84 (15 USD) is paid to students with highest GPA during their years of study. The size of the grant was allocated in 1975 (according to the universities’ law) and remains unchanged today.
4.5 Future targets for equity in higher education
National strategies nowadays focus on the provision of equitable higher education opportunities across governorates; co-ordinating with pre-university gender policies per type of education (general, vocational and technical); allocating more resources for students’ residences with an increasing quota for female students; offering support grants for female students in applied fields of specialisation; as well as adopting programmes for enhancing humanities and social sciences (besides engineering and applied sciences).
At the institutional level, higher education institutions target girl-friendly universities and HEIs as a basic requirement for accreditation, flexible study programmes and more support for students from poor families, expansion in geographical areas with low enrolment rates, as well as of the provision of continuing education for female students.
4.6 References
Education Committee. (2007). Status of Female Students in Higher education in Egypt. Cairo: Shura Council.
Strategic Planning Unit. (2007). Master Plan of Higher Education in Egypt 2007-2022 - 2nd edition. Cairo: Ministry of Higher Education.
81.41
% 69.28
% 63.63
%
47.21
%
47.14
% 44.65
%
0.00%10.00%20.00%30.00%40.00%50.00%60.00%70.00%80.00%90.00%
South Valley University
Menia University
Assuit University
Minofia University
Suez Canal Tanta University
66
Figure 4.4. Percentage of enrolment by gender in different types of HEIs, 2006/07
Figure 4.5 Percentage of enrolment by gender by academic discipline, 2006/07
Higher education institutions are adopting policies and mechanisms to attract female students
and to decrease their dropout rates. Such strategies include allocating a higher quota for female students at state university dorms and hostels which provide affordable living conditions (students pay EGP 60 or USD 12 per year for accommodation and three meals a day).
Figure 4.6 illustrates the percentage of female students living in university dorms.
45%
60%64%
0%
54%
72%
61%
51%54%55%
40%36%
0%
46%
28%
39%
49%46%
0%
10%
20%
30%
40%
50%
60%
70%
80%
State
Universities
State Univ. (New
Modes)
Azhar Univ. State HEIs State Technical
Colleges
Private Univ. Private HEIs Private Middle
Institutes
Total
2006/2007 Male2006/2007 Female
68 69
69
System. Brain drain is also expected to hunt talented graduates from a prominent Higher Education systems, and Egypt should be aware with the amount of losses that may witness in the coming few years. Knowledge economies give priority to analytical and problem solving ability, adaptability and capacity for innovation and written expression. In view of rapid technical changes, in many cases focus is now on attitudes and behavior of people rather than their technical capacities, that need to be renewed continually (Agarwal, 2009). The changing nature of work has implications on the expectations from education. As per survey of near future by the Economist (2001), 40% of the global workforce will be knowledge workers requiring higher education qualifications by the year 2020. 5.3 Higher education and the labour market Historically since the late 1970s, the Egyptian higher education system used to suffer from serious external inefficiencies. The supply of graduates by the universities and the demand for their services by the job market have long been seriously imbalanced. This disequilibrium was both partially created and temporarily concealed by the Government's job guarantee: by undertaking to hire all graduates. However, such a policy stimulated the demand for higher education, to which the universities responded by expanding enrolments and graduates (Richards, 1992). Although the economic developments over the last 15 years have shaped the demand for labor, the civil service however continues to be a major employer in Egypt: indeed over 42% of jobs created over the 1990s were in government administration. The result is that the Government accounted for 28.6% of all employment by 2003, up from 22.1% in 1990 (World Economic Situation, 2006). However, the aforementioned disequilibrium still persists, not due to lack of demand for labor but to the fact that manpower has not been adequately trained to meet the market demand. New curricula based on real market needs, advanced training methodologies and skilled trainers are required. Much more will also have to be done, especially to help graduate women and young job seekers, given their enormous pool of underutilized skills. Table 5.2 presents the employment rate by the level of education in Egypt. This has been distributed among five different education levels: below secondary, upper secondary, tertiary (2 years), tertiary (4 years), and postgraduate. The analysis of the labour market has shown that the percentage of employment for those with tertiary education has only reached 19.4% in 2006. These are divided among those with 2 years tertiary education (4.2%) and those with 4 years and above (14.85%), while postgraduate represent the least share with only 0.4%. This shows that the unqualified and low qualified staff (below secondary) represent more that 50% of the employees in Egypt. This differs from the data obtained from OECD countries where the percentahe of unemployment of unqualified staff increased from 8.6% to 11.3% between 1983 and 2003 (MaIntosh, 2008).
68
CHAPTER 5. EXTERNAL EFFICIENCY
5.1 Introduction This chapter assesses the external effectiveness of higher education system in terms of its contribution to the country’s economic and social development. In practice, it has proved to be difficult to actually calculate the contribution of education to economic growth and social wellbeing. Therefore, the proposed analysis is restricted to some operational questions which relate the suitability of educational provision to the country's developments needs and on the interaction between the higher education system and the labour market. 5.2 Employment Recent shifts in Egypt's demographics have resulted in an expanding and increasingly young working-age population. The 70% fall in infant mortality and 78% decline in child mortality over the past 30 years, have led to the present situation where 51% of Egyptians fall within the working age bracket of 15-64. About 35% of the working-age population (15-64) is aged 15-24, and new entrants to the labor market are primarily from this age group. Although the youth population grew at an average rate of 2.9% between 1990 and 2005, its share of the population peaked at 21.5% in 2005 and its share of the labor force will fall to about 20% by 2050 (ERF 2004), all of which suggests that the pressure on the labor market will gradually ease after 2005. Table 5.1 shows the situation of employment in 2006 (Capmas, 2008).
Table 5.1: Employment (Egypt) 2006 Illiterate 41.5% Literate 58.5% Source: CAPMAS, 4th quarter 2006
Egypt is currently facing unprecedented challenge with its goal for moving towards knowledge economy. Within this context, Egypt has a wide range of aspects that should be addressed while making this paradigm shift. These are mainly regarded to the potential of employment opportunities, and skill requirements and its level. Being the main supplier of qualified and skilled graduates, Higher Education has to deal with a new form of challenges. The analysis of knowledge economies experience shows that they have not been in a position to produce the skills required. Even countries with the largest network of higher education institutions, such as China, India, and the USA, could not produce highly skilled workers in sufficient quantity to meet their domestic demand and the global market demand, especially in the knowledge-intensive segments of the economy (Varghese, 2008). This sends signals to the calls in Egypt that fear future expansion of Higher Education

70 71
71
demand on some disciplines such as medical sciences and engineering. This limits the ability of SCU in aligning the graduates of the higher education to the labour market. Taking the plea of social demand, there is always a pressure towards expanding the higher education, despite the conditions for the educated people. This sometimes results in a situation where higher education graduates are ready to accept inferior jobs better than being unemployed. Comparing between the percentage of the students enrolment in different HE disciplines (Table 5.3) and the percentage of employees distribution (Table 5.4) according to their acquired degrees, reveals the significant mismatch between both patterns. The enrolment in 2006/07 in engineering disciplines reached 210,021 students while there are 251,900 employed engineers in the labour market. This indicates that in, five years time, which is the cycle of the engineering degree (2011/12), the labour market should be ready to receive more or less 210,021 fresh graduate engineers who seek new jobs. There is a clear mismatch between both patterns. Similar mismatches can found in other disciplines such as basic sciences although in leaner patterns. These kinds of mismatches, were the reason for raising questions about the efficiency of the higher system in addressing labor market needs. Moreover, this mismatch is supported with additional inquiries from different social partners, and researchers, about the utilization of higher education graduates.
Table 5.3: Distribution of students enrolment on different disciplines 2002/03 2006/07 Universities, and higher institutes (private and public) Engineering sciences 174,890 8.1% 210,021 8.4% Medical sciences 141,834 6.6% 158,389 6.3% Agriculture and Vet. 55,285 2.6% 52,857 2.1% Basic sciences 48,962 2.3% 48,299 1.9% Cultural and Literature 398,625 18.4% 491,742 19.7% Arts 13,363 0.6% 14,159 0.6% Education 262,745 12.1% 283,105 11.3% Social sciences 896,064 41.4% 1,074,762 43.0% Technical colleges and private middle institutes Engineering disciplines 42,370 2.0% 51,964 2.1% Social disciplines 130,461 6.0% 116,051 4.6% Total 2,164,599 100% 2,501,349 100.0%
For graduates with Higher Education Technical degrees, there are 853,900 employed graduates in the labour market, represents 21.8% of the total employed HE graduates, which is the second highest among HE graduates. However, this share does not match the enrolled percentage in both technical colleges and middle private institutes (6.7%), where the offered programs are mainly of vocational nature. Following the same trends since decades ago, disciplines such as social sciences, cultural and literature represent the majority of the enrolled students in HE system with around 67.2% of the total students enrolment in 2006/07. This stands for 1,566,504 students which are expected to add to the labour market by year 2010/11. Apparently, these changes should be thoroughly considered, especially when the growth of the labour market is analysed.
70
Table 5.2: Employment rate according to the education attainment 2006 Below secondary 9.137% Upper Secondary 29.983% Tertiary (2 years) 4.178% Tertiary (4 year and above) 14.848% Postgraduate 0.378% Total 58.52% Source: CAPMAS, 4th quarter 2006
On the other hand, migration is currently accounting for no more than 1.2 million (5%) of Egypt’s labor force. In the 1980s, Egyptians were in high demand in neighbouring labor markets, but, again, their skills have not progressed in line with modern technologies used in industry and services. Education and training policy should therefore be geared towards maximizing the eligibility of the work force to migrate. One of the outcomes of enhancing labor skills and productivity in this way is that it will allow sectors such as construction, ICT and manufacturing, to gain or regain their regional and international competitiveness. Historical influences, institutional developments, the role of education in society, past and current attitudes to funding, quality and access: when it comes to measuring quality, relevance and impact of universities, we simply need more evidence. Institutions of higher education everywhere are increasingly encouraged—if not obliged–to draw a higher proportion of their resources from non-state funds. Just as the health system and pension funds can no longer be solely funded with public money, university “consumers” will increasingly be asked for a financial contribution. There is a paradox: on the one hand governments and the public request public universities to provide greater access, improved quality and to cut costs. On the other hand, public funding is reduced. In some countries higher education may as a consequence become scarcer, and access more limited. Some change, whether in approach or structure, seems inevitable. In the increasing international labor market has its reflection on the HE system in Egypt, where many public and private universities have initiated twinning and joint programs with foreign universities. The experience of public universities is based on providing local students with courses that are reviewed and assessed by foreign universities. While the private universities are more based on joint and twinning agreements offer ladderized programmes, they thus offer opportunities to pursue and obtain degrees in an institution abroad. This could open new avenues for students, because of the possibility of more rewarding employment opportunities in the country of the foreign provider. As mentioned in chapter two, Ministry of Higher Education and SCU have been confronted with the coming flow from secondary education. As SCU normally tries to accommodate all secondary education graduates to satisfy families who spend thousands of pounds on private tutoring for their children trying to secure them opportunities in HE institute, which normally overloads public universities. Additional burden is observed as result of the high
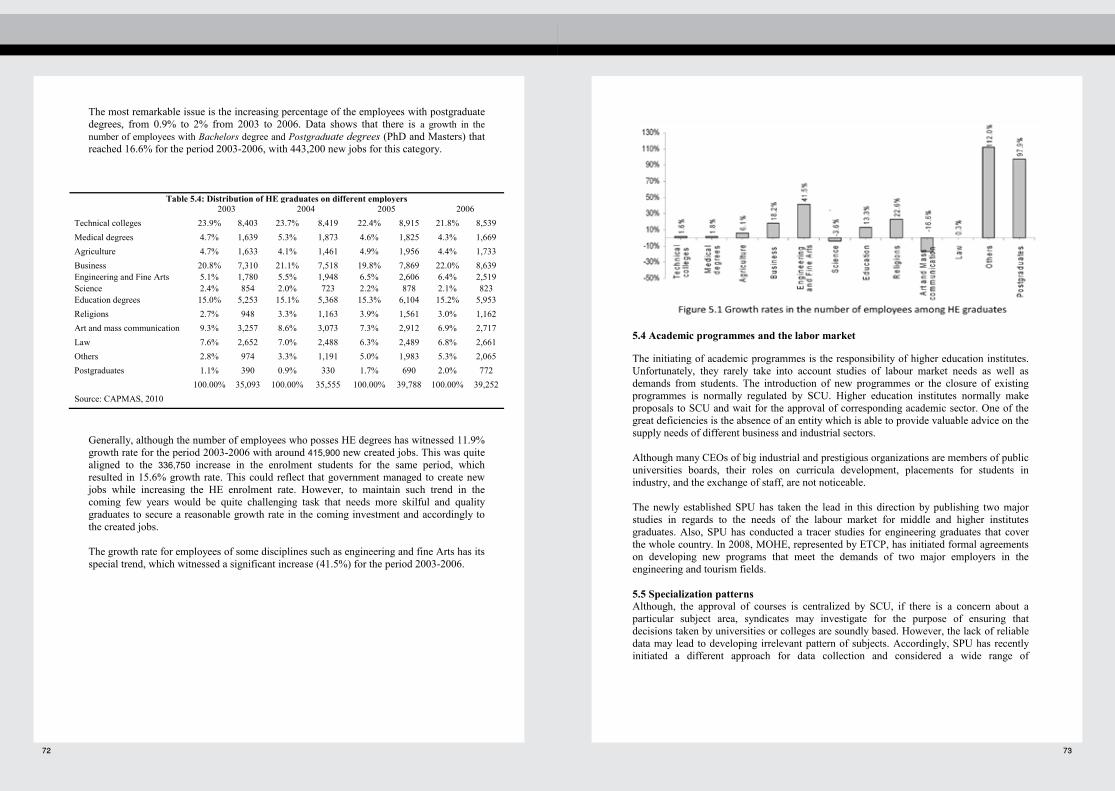
72 73
73
5.4 Academic programmes and the labor market
The initiating of academic programmes is the responsibility of higher education institutes. Unfortunately, they rarely take into account studies of labour market needs as well as demands from students. The introduction of new programmes or the closure of existing programmes is normally regulated by SCU. Higher education institutes normally make proposals to SCU and wait for the approval of corresponding academic sector. One of the great deficiencies is the absence of an entity which is able to provide valuable advice on the supply needs of different business and industrial sectors. Although many CEOs of big industrial and prestigious organizations are members of public universities boards, their roles on curricula development, placements for students in industry, and the exchange of staff, are not noticeable. The newly established SPU has taken the lead in this direction by publishing two major studies in regards to the needs of the labour market for middle and higher institutes graduates. Also, SPU has conducted a tracer studies for engineering graduates that cover the whole country. In 2008, MOHE, represented by ETCP, has initiated formal agreements on developing new programs that meet the demands of two major employers in the engineering and tourism fields. 5.5 Specialization patterns Although, the approval of courses is centralized by SCU, if there is a concern about a particular subject area, syndicates may investigate for the purpose of ensuring that decisions taken by universities or colleges are soundly based. However, the lack of reliable data may lead to developing irrelevant pattern of subjects. Accordingly, SPU has recently initiated a different approach for data collection and considered a wide range of
72
The most remarkable issue is the increasing percentage of the employees with postgraduate degrees, from 0.9% to 2% from 2003 to 2006. Data shows that there is a growth in the number of employees with Bachelors degree and Postgraduate degrees (PhD and Masters) that reached 16.6% for the period 2003-2006, with 443,200 new jobs for this category.
Table 5.4: Distribution of HE graduates on different employers 2003 2004 2005 2006
Technical colleges 23.9% 8,403 23.7% 8,419 22.4% 8,915 21.8% 8,539 Medical degrees 4.7% 1,639 5.3% 1,873 4.6% 1,825 4.3% 1,669 Agriculture 4.7% 1,633 4.1% 1,461 4.9% 1,956 4.4% 1,733 Business 20.8% 7,310 21.1% 7,518 19.8% 7,869 22.0% 8,639 Engineering and Fine Arts 5.1% 1,780 5.5% 1,948 6.5% 2,606 6.4% 2,519 Science 2.4% 854 2.0% 723 2.2% 878 2.1% 823 Education degrees 15.0% 5,253 15.1% 5,368 15.3% 6,104 15.2% 5,953 Religions 2.7% 948 3.3% 1,163 3.9% 1,561 3.0% 1,162 Art and mass communication 9.3% 3,257 8.6% 3,073 7.3% 2,912 6.9% 2,717 Law 7.6% 2,652 7.0% 2,488 6.3% 2,489 6.8% 2,661 Others 2.8% 974 3.3% 1,191 5.0% 1,983 5.3% 2,065 Postgraduates 1.1% 390 0.9% 330 1.7% 690 2.0% 772 100.00% 35,093 100.00% 35,555 100.00% 39,788 100.00% 39,252 Source: CAPMAS, 2010
Generally, although the number of employees who posses HE degrees has witnessed 11.9% growth rate for the period 2003-2006 with around 415,900 new created jobs. This was quite aligned to the 336,750 increase in the enrolment students for the same period, which resulted in 15.6% growth rate. This could reflect that government managed to create new jobs while increasing the HE enrolment rate. However, to maintain such trend in the coming few years would be quite challenging task that needs more skilful and quality graduates to secure a reasonable growth rate in the coming investment and accordingly to the created jobs. The growth rate for employees of some disciplines such as engineering and fine Arts has its special trend, which witnessed a significant increase (41.5%) for the period 2003-2006.
74 75
75
and there are no tracer studies which have been conducted to understand the relation between engineers’ educational background and the positions they occupy. There are some efforts to initiate or reactivate alumni affairs units in some faculties. Also, there have been some steps taken to increase the bonds between the engineering institutions and industrial and construction enterprises. Among these steps are appointing some executive leaders from the industry as members of the faculty council (two for most engineering institutions), and also inviting executive persons to attend scientific conferences and seminars. 5.9 Careers guidance There is a clear lack of higher education careers guidance services. HEIs do not provide information to students’ entitlement to careers' education. In return, this leads to the absence of links with employers and the potential of strategic role of career services within their institutions. A major observation is that institutions do not collect, analyze and disseminate labor market information. In turn most of institutions do not rely on reliable data while taking their decisions on program developments. References Pawan Agarwal, "Higher Education and the Labor Market in India", Worldbank Report, 2009. MCIntosh, Steven, "Employment and Education in OECD countries", International Institute for Educational Planning and Management, UNESCO, Paris, 2008.
74
international indicators in order to redistribute the education patterns in Egypt based on reliable approaches. An example of this, SPU has emphasized in the Higher Education Master Plan, the needs for high-caliber PhD students to develop into future academic researchers and teaching staff. This was seen to be a key component in the future success of HE institutions. Also, the Master Plan has recommended the increase of the applied science from its current percentage (30%) of the total enrolled students in the higher education system in Egypt to 50% by year 2021/22. However, mechanisms such as providing postgraduate students with substantial incentives and promoting secondary education students to study the applied sciences should be introduced. In the meantime, SPU undertakes a review of the supply of graduates with engineering, tourism, and business skills. SPU reports on these analysis are to be published by June 2009. 5.6 Higher education role and investment Internationally, different countries and its higher education institutes have set new ambitious strategies towards competing in a global economy. They recognized the need of establishing best performance institutes, research laboratories with strong ties with technological organizations. These strategies resulted from thorough consideration for the paradigm shift of the multinational corporations. For example Microsoft’s Bill Gates base its decisions for the new companies locations on the availability of talent pools and a culture for innovation, rather than tax policy (OECD, 2009). In Egypt adopting such strategies cannot be implemented only by MOHE, the involvement of other ministries is highly needed. Ministries have to play crucial roles in promoting and marketing the graduates of HE institutes. This can be done through a wide span of mechanisms. Ministries such as Ministry of Communications and information technology has played a vital role in attracting different multinational company and proved interesting incentives to invest in Egypt. 5.7 Key skills in academic programmes Most of Higher education institutions do not impede the learning of key skills required by employers in academic programmes. This is regarded to the lack of coordination between employers and the HEIs. Despite the fact that some institutes encourage their students to undertake internships during summer holiday, most of these trainings are based on personal contacts of students and there is no clear framework for coordination. A feature of Egypt's higher education is the tight legislation that prevents HEIs from offering sandwich courses where students spend up to a year in employment having some relevance to their programme of study. Therefore, most graduates are not well prepared for employment. 5.8 Relation of employers HE institutes There is no interactive relationship between employers and HE institutions concerning the academic programs. Also, faculties rarely conduct market analysis to plan for future topics and new disciplines. The relations between the alumni and the institutions are not strong;

76 77
77
Table 6.2 State universities budget lines, 1995-2005
(%)
Source: Ministry of Higher Education, Master plan for Higher Education in Egypt (2007-2022), 2007, p.29.
These indicators can be translated into low quality of education and research and how this is undermining the objectives of current educational policy.13
6.2.1 Case study: Ain Shams University
To get a clearer picture of the various financing resources we have analysed the budget of one of the state universities, Ain Shams University (Table 6.3).14 However, as Ain Shams University is one of the biggest state universities in Egypt, we can not necessarily draw general conclusions for the other universities.
Firstly, in 2004/05 the government financed 93.5% of wages, the rest (6.5%) coming from the university’s own resources. However, in the case of hospitals15, the government’s share of wages decreased to 65%, leaving the rest (35%) to the university to find (hospitals represent one of the main sources of self-funding in the university). The government covered about 24% of running costs in the education sector, leaving 76% to be sourced internally. A similar picture can be seen for hospitals. Finally, investment in education depends heavily on other resources, such as grants and transfers, with less than half (42.5%) coming from the government. Hospitals are a major income resource for the university and this aspect receives no government input. Just under half of their investments come from their own budget and the rest from the other resources listed above.
13 If we were to take the inflation rate into account, the picture would be worse.
14 For 2004/05 based on data availability. 15 There are some units and/or departments in the hospitals work for profit.
Year Wages Running costs Investments Capital transfers 1995/1996 57.93 21.15 18.44 2.48 1996/1997 49.05 21.15 16.92 2.88 1997/1998 60.20 21.78 15.25 2.77 1998/1999 61.81 21.72 14.95 1.53 1999/2000 62.14 19.88 16.11 1.87 2000/2001 63.72 20.47 15.27 0.54 2001/2002 64.92 18.83 15.82 0.43 2002/2003 62.38 18.00 19.13 0.48 2003/2004 62.93 17.60 18.91 0.55 2004/2005 63.60 16.25 19.61 0.53
76
CHAPTER 6. COSTS AND FINANCING OF HIGHER EDUCATION
6.1 Introduction
The financial problems faced by higher education institutions stem from two sources. The first of these is the high costs of higher education per student. This problem can be attributed to the fact that historically, higher education is both capital and labour intensive and throughout the world has proven to be especially unsuitable for labour-saving technology. The second force significantly exacerbating the financial problems of higher educational institutions and ministries in many countries is the pressure for increasing enrolments, particularly where high birth rates are coupled with rapidly increasing proportions of young people finishing secondary school. Higher education in most countries has mainly depended on governments for the revenue to meet these high and rising costs. When the cost pressures of higher education are not met with proportionately increasing revenues, the results tend to be decreased efficiency and productivity.
This chapter will look at the current status of costs and financing of higher education in Egypt. We mainly focus on public universities, due to the lack of data on private universities’ budgets.
6.2 Costs and financing
According to the Egyptian constitution, education in Egypt is free charges from basic up to higher education. The state provides the lion’s share of funding. Table 6.1 shows costs per student in the state higher education institutions which are fully-financed by the government. As can be seen in this table, over the last five years costs per student have doubled in state universities, but remained roughly constant in Al-Azhar University and technical colleges. Unfortunately there are no available and accurate data on the budgets of private universities.
Table 6.1. Costs per student in the state higher education institutions (nominal prices)
Year State University Al- Azhar University Technical Colleges Budget
EGP million
No. enrolled students
Cost per
student (EGP)
Budget EGP
million
No. enrolled students
Cost per
student (EGP)
Budget EGP
million
No. enrolled students
Cost per
student (EGP)
2002/2003 4443 1545361 2875 579 309921 1868 560 131173 4269 2003/2004 4806 1271846 3779 606 337975 1793 742 142524 5206 2004/2005 5284 1314079 4021 669 371726 1801 772 148212 5206 2005/2006 5763 1411740 4082 716* 366286 1954* 777 144480 5377 2006/2007 7620 1503387 5069 766* 397383 1928* 749 131189 5706
Source: Ministry of Higher Education, Master plan for Higher Education in Egypt (2007-2022), 2007, p.28.
*Estimated value based on a regression model using semi-log form.
While officially the state is responsible for financing higher education in Egypt, the state’s share of higher education finance for universities fell to 85% in 1994/95, leaving the universities to generate the remaining 15% themselves through various revenue diversification strategies. Note the increasing proportion of the higher education budget allocated for wages and salaries shown in Table 6.2 (58% in 1995 rising to 64% in 2005). Over the same period, the share of investments in the budget has remained more or less constant (at 19%).
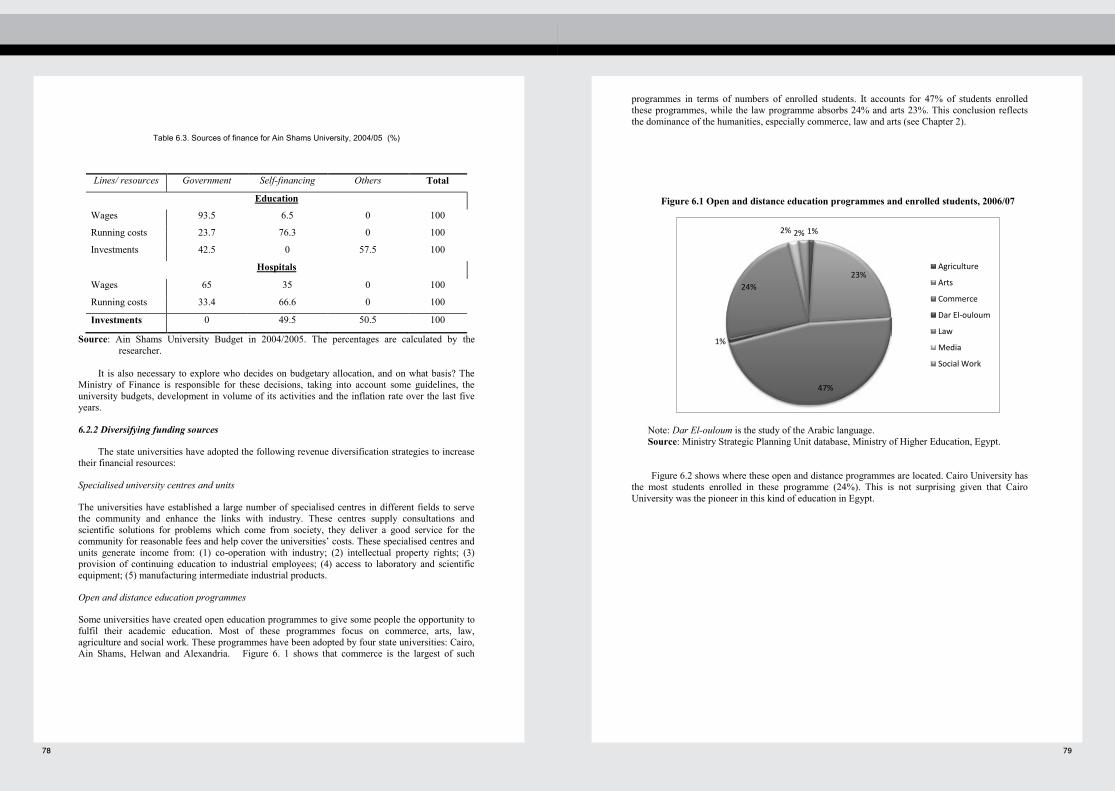
78 79
79
programmes in terms of numbers of enrolled students. It accounts for 47% of students enrolled these programmes, while the law programme absorbs 24% and arts 23%. This conclusion reflects the dominance of the humanities, especially commerce, law and arts (see Chapter 2).
Figure 6.1 Open and distance education programmes and enrolled students, 2006/07
Note: Dar El-ouloum is the study of the Arabic language. Source: Ministry Strategic Planning Unit database, Ministry of Higher Education, Egypt. Figure 6.2 shows where these open and distance programmes are located. Cairo University has
the most students enrolled in these programme (24%). This is not surprising given that Cairo University was the pioneer in this kind of education in Egypt.
1%
23%
47%
1%
24%
2% 2%
Agriculture
Arts
Commerce
Dar El-ouloum
Law
Media
Social Work
78
Table 6.3. Sources of finance for Ain Shams University, 2004/05 (%)
Lines/ resources Government Self-financing Others Total
Education
Wages 93.5 6.5 0 100
Running costs 23.7 76.3 0 100
Investments 42.5 0 57.5 100
Hospitals
Wages 65 35 0 100
Running costs 33.4 66.6 0 100
Investments 0 49.5 50.5 100
Source: Ain Shams University Budget in 2004/2005. The percentages are calculated by the researcher.
It is also necessary to explore who decides on budgetary allocation, and on what basis? The
Ministry of Finance is responsible for these decisions, taking into account some guidelines, the university budgets, development in volume of its activities and the inflation rate over the last five years.
6.2.2 Diversifying funding sources
The state universities have adopted the following revenue diversification strategies to increase their financial resources:
Specialised university centres and units
The universities have established a large number of specialised centres in different fields to serve the community and enhance the links with industry. These centres supply consultations and scientific solutions for problems which come from society, they deliver a good service for the community for reasonable fees and help cover the universities’ costs. These specialised centres and units generate income from: (1) co-operation with industry; (2) intellectual property rights; (3) provision of continuing education to industrial employees; (4) access to laboratory and scientific equipment; (5) manufacturing intermediate industrial products.
Open and distance education programmes
Some universities have created open education programmes to give some people the opportunity to fulfil their academic education. Most of these programmes focus on commerce, arts, law, agriculture and social work. These programmes have been adopted by four state universities: Cairo, Ain Shams, Helwan and Alexandria. Figure 6. 1 shows that commerce is the largest of such
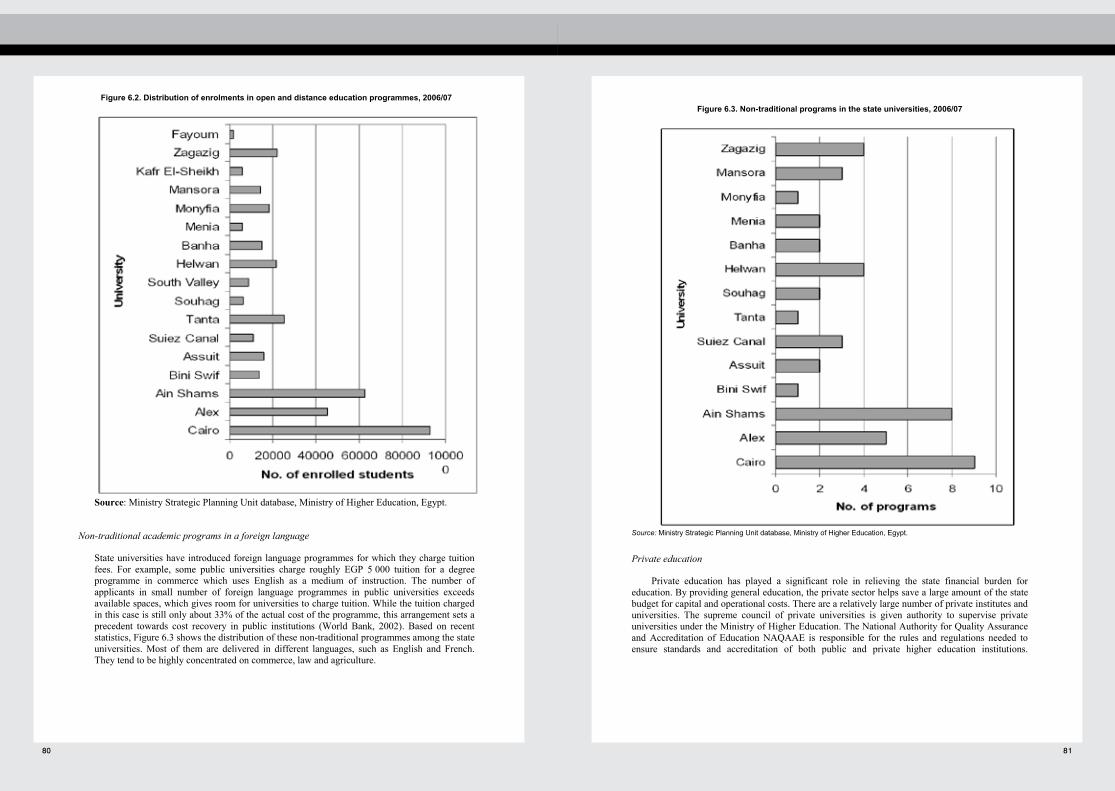
80 81
81
Figure 6.3. Non-traditional programs in the state universities, 2006/07
Source: Ministry Strategic Planning Unit database, Ministry of Higher Education, Egypt.
Private education
Private education has played a significant role in relieving the state financial burden for education. By providing general education, the private sector helps save a large amount of the state budget for capital and operational costs. There are a relatively large number of private institutes and universities. The supreme council of private universities is given authority to supervise private universities under the Ministry of Higher Education. The National Authority for Quality Assurance and Accreditation of Education NAQAAE is responsible for the rules and regulations needed to ensure standards and accreditation of both public and private higher education institutions.
80
Figure 6.2. Distribution of enrolments in open and distance education programmes, 2006/07
Source: Ministry Strategic Planning Unit database, Ministry of Higher Education, Egypt.
Non-traditional academic programs in a foreign language
State universities have introduced foreign language programmes for which they charge tuition fees. For example, some public universities charge roughly EGP 5 000 tuition for a degree programme in commerce which uses English as a medium of instruction. The number of applicants in small number of foreign language programmes in public universities exceeds available spaces, which gives room for universities to charge tuition. While the tuition charged in this case is still only about 33% of the actual cost of the programme, this arrangement sets a precedent towards cost recovery in public institutions (World Bank, 2002). Based on recent statistics, Figure 6.3 shows the distribution of these non-traditional programmes among the state universities. Most of them are delivered in different languages, such as English and French. They tend to be highly concentrated on commerce, law and agriculture.
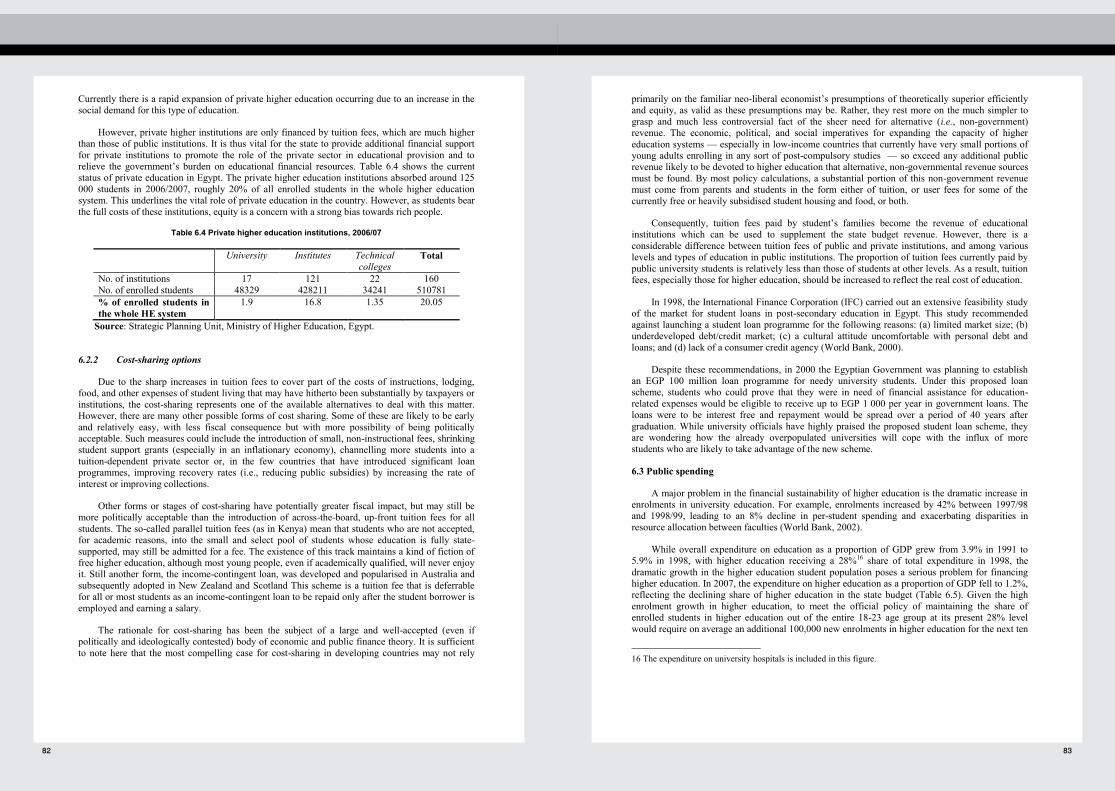
82 83
83
primarily on the familiar neo-liberal economist’s presumptions of theoretically superior efficiently and equity, as valid as these presumptions may be. Rather, they rest more on the much simpler to grasp and much less controversial fact of the sheer need for alternative (i.e., non-government) revenue. The economic, political, and social imperatives for expanding the capacity of higher education systems — especially in low-income countries that currently have very small portions of young adults enrolling in any sort of post-compulsory studies — so exceed any additional public revenue likely to be devoted to higher education that alternative, non-governmental revenue sources must be found. By most policy calculations, a substantial portion of this non-government revenue must come from parents and students in the form either of tuition, or user fees for some of the currently free or heavily subsidised student housing and food, or both.
Consequently, tuition fees paid by student’s families become the revenue of educational institutions which can be used to supplement the state budget revenue. However, there is a considerable difference between tuition fees of public and private institutions, and among various levels and types of education in public institutions. The proportion of tuition fees currently paid by public university students is relatively less than those of students at other levels. As a result, tuition fees, especially those for higher education, should be increased to reflect the real cost of education.
In 1998, the International Finance Corporation (IFC) carried out an extensive feasibility study of the market for student loans in post-secondary education in Egypt. This study recommended against launching a student loan programme for the following reasons: (a) limited market size; (b) underdeveloped debt/credit market; (c) a cultural attitude uncomfortable with personal debt and loans; and (d) lack of a consumer credit agency (World Bank, 2000).
Despite these recommendations, in 2000 the Egyptian Government was planning to establish an EGP 100 million loan programme for needy university students. Under this proposed loan scheme, students who could prove that they were in need of financial assistance for education-related expenses would be eligible to receive up to EGP 1 000 per year in government loans. The loans were to be interest free and repayment would be spread over a period of 40 years after graduation. While university officials have highly praised the proposed student loan scheme, they are wondering how the already overpopulated universities will cope with the influx of more students who are likely to take advantage of the new scheme.
6.3 Public spending
A major problem in the financial sustainability of higher education is the dramatic increase in enrolments in university education. For example, enrolments increased by 42% between 1997/98 and 1998/99, leading to an 8% decline in per-student spending and exacerbating disparities in resource allocation between faculties (World Bank, 2002).
While overall expenditure on education as a proportion of GDP grew from 3.9% in 1991 to 5.9% in 1998, with higher education receiving a 28%16 share of total expenditure in 1998, the dramatic growth in the higher education student population poses a serious problem for financing higher education. In 2007, the expenditure on higher education as a proportion of GDP fell to 1.2%, reflecting the declining share of higher education in the state budget (Table 6.5). Given the high enrolment growth in higher education, to meet the official policy of maintaining the share of enrolled students in higher education out of the entire 18-23 age group at its present 28% level would require on average an additional 100,000 new enrolments in higher education for the next ten
16 The expenditure on university hospitals is included in this figure.
82
Currently there is a rapid expansion of private higher education occurring due to an increase in the social demand for this type of education.
However, private higher institutions are only financed by tuition fees, which are much higher than those of public institutions. It is thus vital for the state to provide additional financial support for private institutions to promote the role of the private sector in educational provision and to relieve the government’s burden on educational financial resources. Table 6.4 shows the current status of private education in Egypt. The private higher education institutions absorbed around 125 000 students in 2006/2007, roughly 20% of all enrolled students in the whole higher education system. This underlines the vital role of private education in the country. However, as students bear the full costs of these institutions, equity is a concern with a strong bias towards rich people.
Table 6.4 Private higher education institutions, 2006/07
Source: Strategic Planning Unit, Ministry of Higher Education, Egypt.
6.2.2 Cost-sharing options
Due to the sharp increases in tuition fees to cover part of the costs of instructions, lodging, food, and other expenses of student living that may have hitherto been substantially by taxpayers or institutions, the cost-sharing represents one of the available alternatives to deal with this matter. However, there are many other possible forms of cost sharing. Some of these are likely to be early and relatively easy, with less fiscal consequence but with more possibility of being politically acceptable. Such measures could include the introduction of small, non-instructional fees, shrinking student support grants (especially in an inflationary economy), channelling more students into a tuition-dependent private sector or, in the few countries that have introduced significant loan programmes, improving recovery rates (i.e., reducing public subsidies) by increasing the rate of interest or improving collections.
Other forms or stages of cost-sharing have potentially greater fiscal impact, but may still be more politically acceptable than the introduction of across-the-board, up-front tuition fees for all students. The so-called parallel tuition fees (as in Kenya) mean that students who are not accepted, for academic reasons, into the small and select pool of students whose education is fully state-supported, may still be admitted for a fee. The existence of this track maintains a kind of fiction of free higher education, although most young people, even if academically qualified, will never enjoy it. Still another form, the income-contingent loan, was developed and popularised in Australia and subsequently adopted in New Zealand and Scotland This scheme is a tuition fee that is deferrable for all or most students as an income-contingent loan to be repaid only after the student borrower is employed and earning a salary.
The rationale for cost-sharing has been the subject of a large and well-accepted (even if politically and ideologically contested) body of economic and public finance theory. It is sufficient to note here that the most compelling case for cost-sharing in developing countries may not rely
University Institutes Technical colleges
Total
No. of institutions 17 121 22 160 No. of enrolled students 48329 428211 34241 510781 % of enrolled students in the whole HE system
1.9 16.8 1.35 20.05
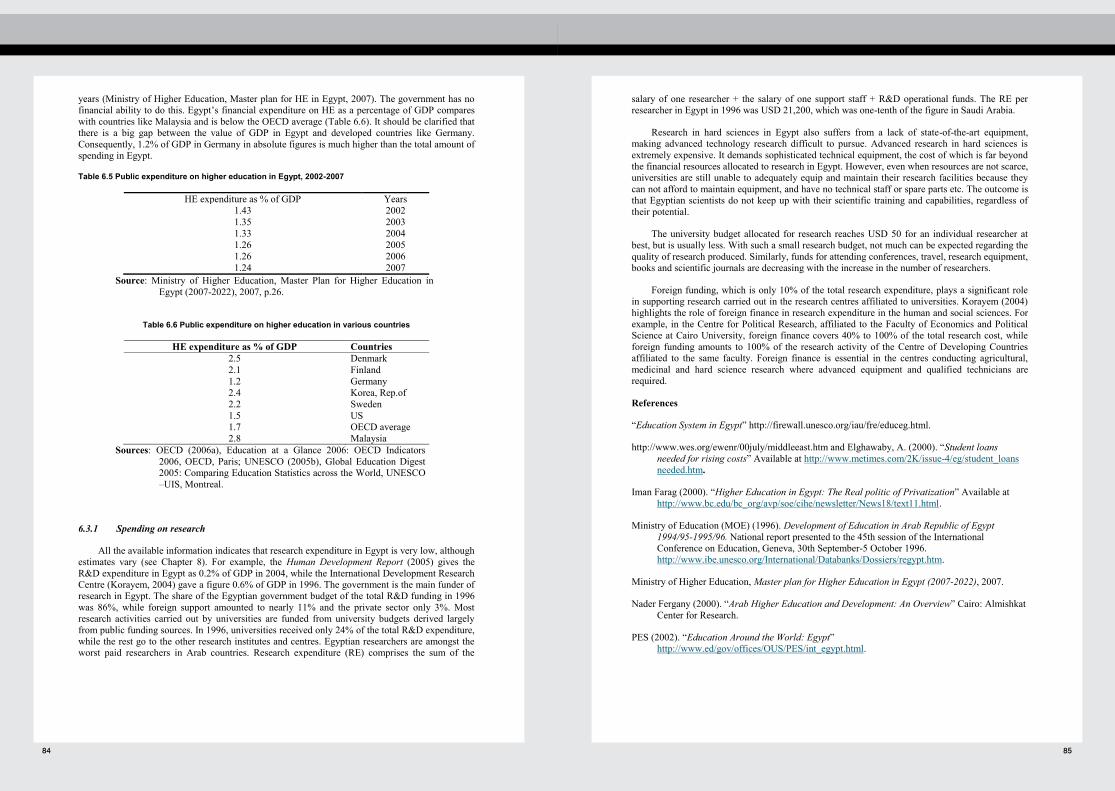
84 85
85
salary of one researcher + the salary of one support staff + R&D operational funds. The RE per researcher in Egypt in 1996 was USD 21,200, which was one-tenth of the figure in Saudi Arabia.
Research in hard sciences in Egypt also suffers from a lack of state-of-the-art equipment, making advanced technology research difficult to pursue. Advanced research in hard sciences is extremely expensive. It demands sophisticated technical equipment, the cost of which is far beyond the financial resources allocated to research in Egypt. However, even when resources are not scarce, universities are still unable to adequately equip and maintain their research facilities because they can not afford to maintain equipment, and have no technical staff or spare parts etc. The outcome is that Egyptian scientists do not keep up with their scientific training and capabilities, regardless of their potential.
The university budget allocated for research reaches USD 50 for an individual researcher at best, but is usually less. With such a small research budget, not much can be expected regarding the quality of research produced. Similarly, funds for attending conferences, travel, research equipment, books and scientific journals are decreasing with the increase in the number of researchers.
Foreign funding, which is only 10% of the total research expenditure, plays a significant role in supporting research carried out in the research centres affiliated to universities. Korayem (2004) highlights the role of foreign finance in research expenditure in the human and social sciences. For example, in the Centre for Political Research, affiliated to the Faculty of Economics and Political Science at Cairo University, foreign finance covers 40% to 100% of the total research cost, while foreign funding amounts to 100% of the research activity of the Centre of Developing Countries affiliated to the same faculty. Foreign finance is essential in the centres conducting agricultural, medicinal and hard science research where advanced equipment and qualified technicians are required.
References
“Education System in Egypt” http://firewall.unesco.org/iau/fre/educeg.html.
http://www.wes.org/ewenr/00july/middleeast.htm and Elghawaby, A. (2000). “Student loans needed for rising costs” Available at http://www.metimes.com/2K/issue-4/eg/student_loans needed.htm.
Iman Farag (2000). “Higher Education in Egypt: The Real politic of Privatization” Available at http://www.bc.edu/bc_org/avp/soe/cihe/newsletter/News18/text11.html.
Ministry of Education (MOE) (1996). Development of Education in Arab Republic of Egypt 1994/95-1995/96. National report presented to the 45th session of the International Conference on Education, Geneva, 30th September-5 October 1996. http://www.ibe.unesco.org/International/Databanks/Dossiers/regypt.htm.
Ministry of Higher Education, Master plan for Higher Education in Egypt (2007-2022), 2007.
Nader Fergany (2000). “Arab Higher Education and Development: An Overview” Cairo: Almishkat Center for Research.
PES (2002). “Education Around the World: Egypt” http://www.ed/gov/offices/OUS/PES/int_egypt.html.
84
years (Ministry of Higher Education, Master plan for HE in Egypt, 2007). The government has no financial ability to do this. Egypt’s financial expenditure on HE as a percentage of GDP compares with countries like Malaysia and is below the OECD average (Table 6.6). It should be clarified that there is a big gap between the value of GDP in Egypt and developed countries like Germany. Consequently, 1.2% of GDP in Germany in absolute figures is much higher than the total amount of spending in Egypt.
Table 6.5 Public expenditure on higher education in Egypt, 2002-2007
HE expenditure as % of GDP Years 1.43 2002 1.35 2003 1.33 2004 1.26 2005 1.26 2006 1.24 2007
Source: Ministry of Higher Education, Master Plan for Higher Education in Egypt (2007-2022), 2007, p.26.
Table 6.6 Public expenditure on higher education in various countries
HE expenditure as % of GDP Countries 2.5 Denmark 2.1 Finland 1.2 Germany 2.4 Korea, Rep.of 2.2 Sweden 1.5 US 1.7 OECD average 2.8 Malaysia
Sources: OECD (2006a), Education at a Glance 2006: OECD Indicators 2006, OECD, Paris; UNESCO (2005b), Global Education Digest 2005: Comparing Education Statistics across the World, UNESCO –UIS, Montreal.
6.3.1 Spending on research
All the available information indicates that research expenditure in Egypt is very low, although estimates vary (see Chapter 8). For example, the Human Development Report (2005) gives the R&D expenditure in Egypt as 0.2% of GDP in 2004, while the International Development Research Centre (Korayem, 2004) gave a figure 0.6% of GDP in 1996. The government is the main funder of research in Egypt. The share of the Egyptian government budget of the total R&D funding in 1996 was 86%, while foreign support amounted to nearly 11% and the private sector only 3%. Most research activities carried out by universities are funded from university budgets derived largely from public funding sources. In 1996, universities received only 24% of the total R&D expenditure, while the rest go to the other research institutes and centres. Egyptian researchers are amongst the worst paid researchers in Arab countries. Research expenditure (RE) comprises the sum of the
86 87
87
CHAPTER 7. GOVERNANCE
7.1 Introduction
Governance of Egypt’s higher education system lies with a network of partners which includes governmental bodies represented primarily by the Ministry of Higher Education (MoHE), Ministry of Finance (MoF), Ministry of Education (MoE) and Ministry of Economic Development (MoED) in addition to the Supreme Council of Universities (SCU), which is a governmental body for public universities, the Council of Private Universities (CPU) and Council of Higher Institutes and Council of Technical Colleges; and finally both public and private higher education institutions.
The National Authority of Quality Assurance and Accreditation of Education (NAQAAE) joined in as a new player in 2008 with the immense role of assessing quality of education at all levels (see Chapter 3).
There is a variety of legislations, acts and decrees that govern the operation of higher education in Egypt:
The public universities (act # 49 / 1972)
The private universities (act # 101/1992)
The private higher institutes (act # 52/1970)
The technical colleges (act # 528/2003)
The education development fund (act # 290/2004)
NAQAAE (presidential decree # 82/2006)
This chapter focuses on the four major functions or levels of management of higher education in Egypt: strategic, management, information and operational.
7.2 Strategic planning
A national strategy was announced in 2000 indicating the strengths and weaknesses of the higher education system in Egypt and introducing 25 programmes to reform the sector. Programmes targeted all components to remedy the problems that the sector was suffering from at the time. However financial constraints meant that the government could only endorse six programmes for the five-year plan 2002-2007:
1. Faculty and Leadership Development Project (FLDP)
2. Technical Colleges Project (TCP)
3. Quality Assurance and Accreditation Project (QAAP)
4. Faculties of Education Project (FOEP)
86
Research and Development systems in the Arab states: Development of Science and Technology Indicators. Subhi Qasem UNESCO publication 1998; Chapter 4. The Research Environment in Egypt, Karima Korayem in Research and Development in the Middle East and North Africa. Eds: E.Rached and D. Craissati. IDRC 2000 (http://www.idrc.ca/en/ev-41626-201-1-DO_TOPIC.html.
Sanyal, B.C. (1998). Diversification of Sources and the Role of Privatization in Financing of Higher Education in the Arab States Region. Paris: IIEP/UNESCO. Working document in the series: IIEP Contribution-No. 30.
Thomas O. Eisemon & Jamil Salmi (1995). “Increasing Equity in Higher Education: Strategies and Lessons from Experience”, http://fiu/~iied/equity.htm.
U.S. Department of State (2002). Background Note: Egypt, Retrieved 6/18/2002 from http://www.state.gov/r/pa/ei/bgn/5309.htm.
World Bank (2000). Arab Republic of Egypt, Higher education. Report # PID9033 JI/2002MS/2004.
World Bank (2002). Arab Republic of Egypt Higher Education Enhancement Project (HEEP). Washington, D.C.: World Bank.
Yunan L. Rizk (2000). “Al-Ahram: A Diwan of Contemporary Life” http://www.ahram.org/eg/weekly/200/511/chrncls.htm .
88 89
89
Leadership is another important factor for the management of the higher education sector. The government appoints university leaders — the Minister of Higher Education nominates three candidates and a presidential decree is issued for one of them. This process does not match the recruitment regulations and procedures described by the “universities regulating law” where the selection of universities’ leaders should be through ....
Some control mechanisms exist to detect deviations in the system, but they are mainly for financial and quantitative measures. The Central Auditing Organisation (CAO) — an independent organisation that reports to the president (Central Auditing Organisation, 2004) — supervises organisations’ accounting of financial performance and tracks corruption, but does not judge any relevance of the financial performance to the overall organisation performance or achievement of objectives.
Another crucial problem is that of the size of the administrative body within the higher education sector in general and public universities in particular. The rate of administrators to students varies from 1:4 (Beni Seuf University) to 1:16 (Assuit & Suez Canal Universities); 46% of this cohort is top management level staff, forming a top heavy administrative pyramid.17
7.4 Information management
Information — availability and usability — is a crucial issue for the enlightened governance of any higher education system. There was no management information system for higher education in Egypt before the Information and Communication Technology Project started in 2002. In its first phase this will only involve public universities, and information is to be linked to the Centre of Management Information Systems and Decision Support Systems in the Supreme Council of Universities (SCU). The system is not functional yet and is only expected to be effective by 2010.
Thus, the higher education information management system only covers public universities and does not include Al Azhar University, public technical colleges, private universities and HEIs. It mirrors the traditional management functions of public universities and lacks much of the information needed for decision support at the strategic level.
The Ministry of Higher Education collects annual data on enrolments and human resources at all HEIs in Egypt. A statistical yearbook is published annually and disseminated to relevant ministries and agencies. In 2007, a database on the higher education sector was developed at the Strategic Planning Unit at the Ministry of Higher Education, which includes data from 2002 until 2007 for all higher education systems. The database is integrated with a geographic information system for decision support.
Data processing, redistribution and analysis has become (since 2006) the role of the Strategic Planning Unit, which provides an annual report on the status of higher education in Egypt to the public and for technical studies, research and decision making.
17 These calculations do not include short-term contracted administrative staff.
88
5. Information and Communication Technology Project (ICTP)
6. Higher Education Enhancement Project Fund (HEEPF)
The six programmes (many of which are described in Chapter 3) were managed and executed by the Higher Education Enhancement Project (HEEP) and were mainly implemented in the public universities, except for the TCP and some projects funded by the HEEPF. The project is coming to an end by December 2008 after a year’s extension for handing over the process.
In 2004 the strategic plan was updated and higher education institutions were encouraged to adopt the national strategy and respond to the national development needs. The strategy now included three main pillars:
1. Legislation
2. National master plan for higher education
3. Governance
National level planning can only guide national policies for higher education that support development plans in different sectors. Thus, there is a need for planning at the regional level, where closer linkages can be forged with the labour market. Egypt is divided into seven main economic regions: greater Cairo (5 governorates), Alexandria (3 governorates), Delta (5 governorates), Suez Canal (6 governorates), North of Upper Egypt (3 governorates), Assuit (2 governorates) and South of Upper Egypt (5 governorates). A pilot is being conducted in both the Alexandria and South of Upper Egypt economic regions. Here teams from the governorates and higher education institutions within the regions are conducting labour market surveys, tracer studies and gathering other relevant data that will enable them to plan in a way that responds more efficiently to market needs.
Strategic planning at the institutional level was not guiding institutional plans except for some functions and activities of the university specially that for establishing new building or projects but not for guiding universities’ policies and targets in the future. Strategic planning at the institutional level has become one of NAQAAE’s requirements for accreditation. Thus, strategic planning was one of the components tackled in a national project for preparing public universities for accreditation. The project was sponsored by the GoE, which allocated EGP one billion under the five year plan 2007-2012. The project started to operate in January 2008 and all public universities are now developing or updating their strategic plans for this purpose.
However, no mechanism exists to motivate/require higher education institutions at any level to respond to the higher education sector’s national or regional needs; neither is it based on the evaluation of former policies and plans.
7.3 Management
MoHE, SCU and CPU operate within a centralised system of governance and management. At the same time, public and private higher education institutions operate under different legislative and financing rules. Ideally, unified legislation for all higher education institutions would enable all higher education institutions to be governed by the same rules given that they all operate within the national higher education system.
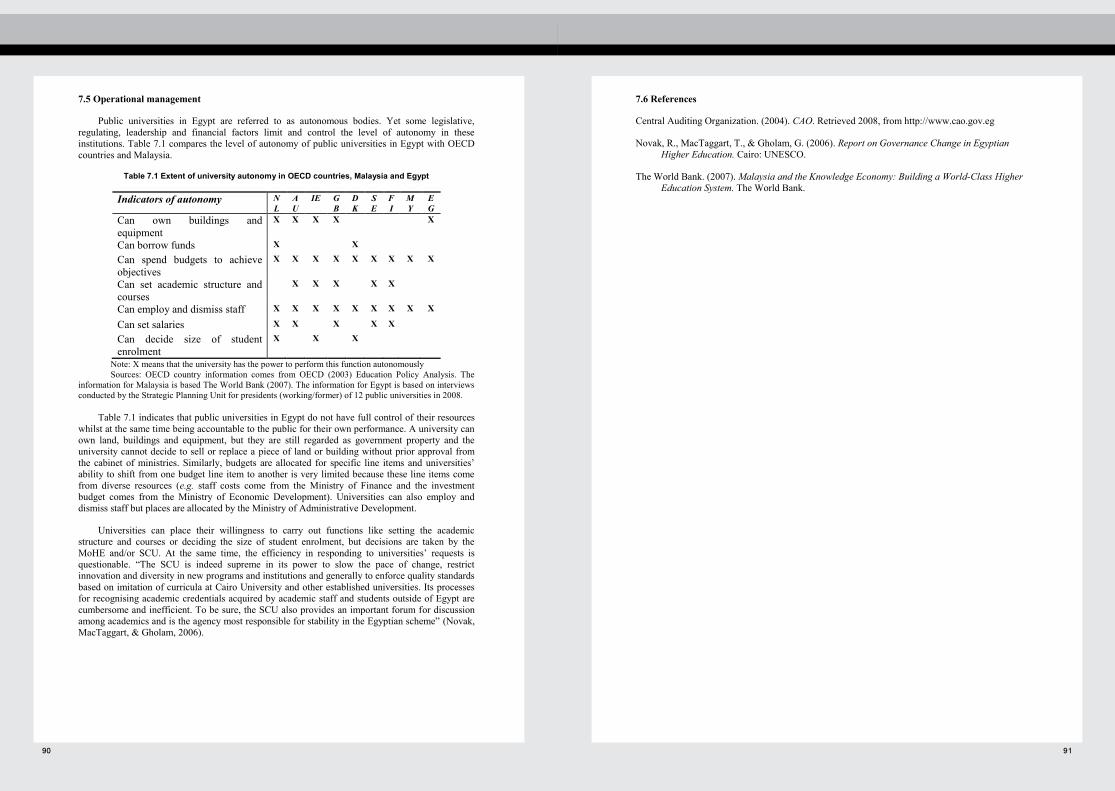
90 91
91
7.6 References
Central Auditing Organization. (2004). CAO. Retrieved 2008, from http://www.cao.gov.eg
Novak, R., MacTaggart, T., & Gholam, G. (2006). Report on Governance Change in Egyptian Higher Education. Cairo: UNESCO.
The World Bank. (2007). Malaysia and the Knowledge Economy: Building a World-Class Higher Education System. The World Bank.
90
7.5 Operational management
Public universities in Egypt are referred to as autonomous bodies. Yet some legislative, regulating, leadership and financial factors limit and control the level of autonomy in these institutions. Table 7.1 compares the level of autonomy of public universities in Egypt with OECD countries and Malaysia.
Table 7.1 Extent of university autonomy in OECD countries, Malaysia and Egypt
Indicators of autonomy NL
AU
IE GB
DK
SE
FI
MY
EG
Can own buildings and equipment
X X X X X
Can borrow funds X X
Can spend budgets to achieve objectives
X X X X X X X X X
Can set academic structure and courses
X X X X X
Can employ and dismiss staff X X X X X X X X X
Can set salaries X X X X X
Can decide size of student enrolment
X X X
Note: X means that the university has the power to perform this function autonomously Sources: OECD country information comes from OECD (2003) Education Policy Analysis. The
information for Malaysia is based The World Bank (2007). The information for Egypt is based on interviews conducted by the Strategic Planning Unit for presidents (working/former) of 12 public universities in 2008.
Table 7.1 indicates that public universities in Egypt do not have full control of their resources whilst at the same time being accountable to the public for their own performance. A university can own land, buildings and equipment, but they are still regarded as government property and the university cannot decide to sell or replace a piece of land or building without prior approval from the cabinet of ministries. Similarly, budgets are allocated for specific line items and universities’ ability to shift from one budget line item to another is very limited because these line items come from diverse resources (e.g. staff costs come from the Ministry of Finance and the investment budget comes from the Ministry of Economic Development). Universities can also employ and dismiss staff but places are allocated by the Ministry of Administrative Development.
Universities can place their willingness to carry out functions like setting the academic structure and courses or deciding the size of student enrolment, but decisions are taken by the MoHE and/or SCU. At the same time, the efficiency in responding to universities’ requests is questionable. “The SCU is indeed supreme in its power to slow the pace of change, restrict innovation and diversity in new programs and institutions and generally to enforce quality standards based on imitation of curricula at Cairo University and other established universities. Its processes for recognising academic credentials acquired by academic staff and students outside of Egypt are cumbersome and inefficient. To be sure, the SCU also provides an important forum for discussion among academics and is the agency most responsible for stability in the Egyptian scheme” (Novak, MacTaggart, & Gholam, 2006).
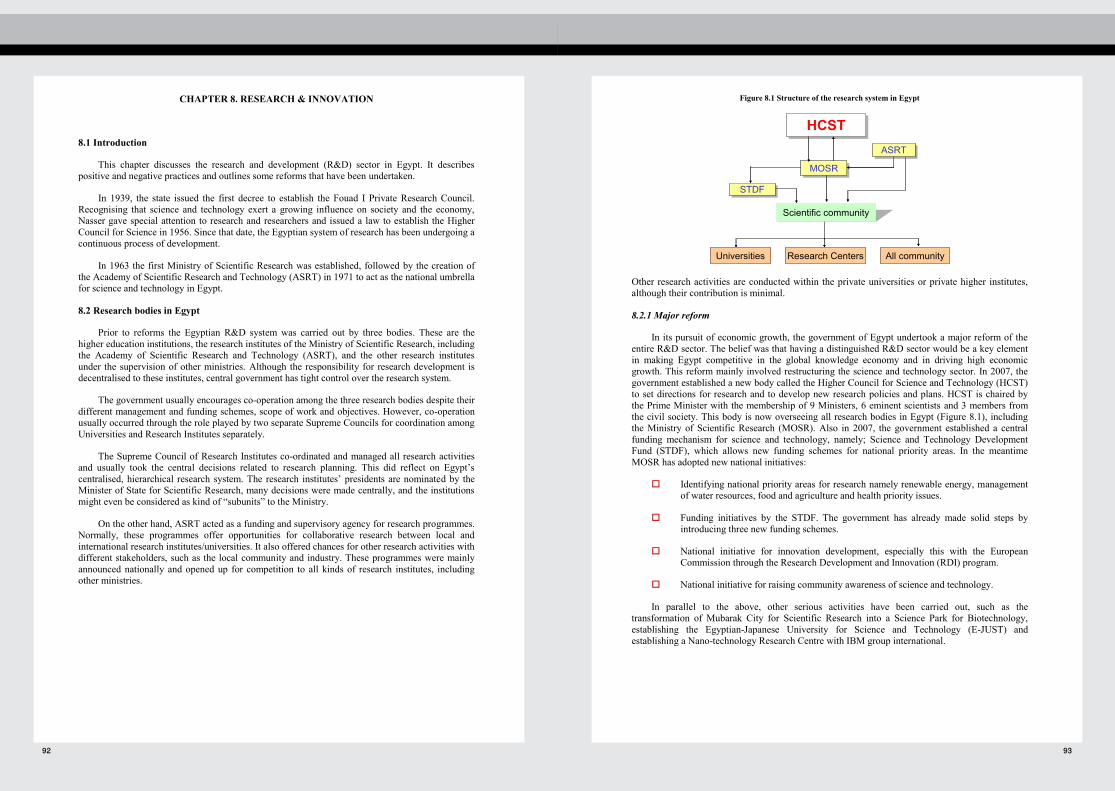
92 93
93
Figure 8.1 Structure of the research system in Egypt
Other research activities are conducted within the private universities or private higher institutes, although their contribution is minimal.
8.2.1 Major reform
In its pursuit of economic growth, the government of Egypt undertook a major reform of the entire R&D sector. The belief was that having a distinguished R&D sector would be a key element in making Egypt competitive in the global knowledge economy and in driving high economic growth. This reform mainly involved restructuring the science and technology sector. In 2007, the government established a new body called the Higher Council for Science and Technology (HCST) to set directions for research and to develop new research policies and plans. HCST is chaired by the Prime Minister with the membership of 9 Ministers, 6 eminent scientists and 3 members from the civil society. This body is now overseeing all research bodies in Egypt (Figure 8.1), including the Ministry of Scientific Research (MOSR). Also in 2007, the government established a central funding mechanism for science and technology, namely; Science and Technology Development Fund (STDF), which allows new funding schemes for national priority areas. In the meantime MOSR has adopted new national initiatives:
Identifying national priority areas for research namely renewable energy, management of water resources, food and agriculture and health priority issues.
Funding initiatives by the STDF. The government has already made solid steps by introducing three new funding schemes.
National initiative for innovation development, especially this with the European Commission through the Research Development and Innovation (RDI) program.
National initiative for raising community awareness of science and technology.
In parallel to the above, other serious activities have been carried out, such as the transformation of Mubarak City for Scientific Research into a Science Park for Biotechnology, establishing the Egyptian-Japanese University for Science and Technology (E-JUST) and establishing a Nano-technology Research Centre with IBM group international.
HCSTHCST
ASRTASRT
MOSRMOSR
STDFSTDF
Scientific community
All communityResearch CentersUniversities
HCSTHCST
ASRTASRT
MOSRMOSR
STDFSTDF
Scientific community
All communityResearch CentersUniversities
92
CHAPTER 8. RESEARCH & INNOVATION
8.1 Introduction
This chapter discusses the research and development (R&D) sector in Egypt. It describes positive and negative practices and outlines some reforms that have been undertaken.
In 1939, the state issued the first decree to establish the Fouad I Private Research Council. Recognising that science and technology exert a growing influence on society and the economy, Nasser gave special attention to research and researchers and issued a law to establish the Higher Council for Science in 1956. Since that date, the Egyptian system of research has been undergoing a continuous process of development.
In 1963 the first Ministry of Scientific Research was established, followed by the creation of the Academy of Scientific Research and Technology (ASRT) in 1971 to act as the national umbrella for science and technology in Egypt.
8.2 Research bodies in Egypt
Prior to reforms the Egyptian R&D system was carried out by three bodies. These are the higher education institutions, the research institutes of the Ministry of Scientific Research, including the Academy of Scientific Research and Technology (ASRT), and the other research institutes under the supervision of other ministries. Although the responsibility for research development is decentralised to these institutes, central government has tight control over the research system.
The government usually encourages co-operation among the three research bodies despite their different management and funding schemes, scope of work and objectives. However, co-operation usually occurred through the role played by two separate Supreme Councils for coordination among Universities and Research Institutes separately.
The Supreme Council of Research Institutes co-ordinated and managed all research activities and usually took the central decisions related to research planning. This did reflect on Egypt’s centralised, hierarchical research system. The research institutes’ presidents are nominated by the Minister of State for Scientific Research, many decisions were made centrally, and the institutions might even be considered as kind of “subunits” to the Ministry.
On the other hand, ASRT acted as a funding and supervisory agency for research programmes. Normally, these programmes offer opportunities for collaborative research between local and international research institutes/universities. It also offered chances for other research activities with different stakeholders, such as the local community and industry. These programmes were mainly announced nationally and opened up for competition to all kinds of research institutes, including other ministries.

94 95
95
needs or plans. A similar policy applies to research institutes, , but with an explicit component for R&D in their budget.
8.3.2. Expenditures on research institutes
Table 8.2 reveals that for most research institutes between 2004 and 2006, their budgets showed negative growth rates. The universities’ budget exceeds these ranges significantly, totalling EGP 7 billion per year. However, this budget is distributed among different activities, including research.
Table 8.2 Expenditure of centres and institutes affiliated to the Ministry of Scientific Research, 2004-2007 (EGP million)
Centre/research institute 2004/05 2005/06 2006/07 Office of Minister of State for Scientific Research
35.5 15.8 11.1
Academy of Scientific Research and Technology 64 56.6 64.4 National Research Center 166.7 146.9 162.7 National Authority for Remote Sensing and Space Sciences
63.5 61.3 64.6
Mubarak City for Scientific Research 31.1 22.1 28.8 National Research Institute for Astronomy and Geophysics
26.9 25.3 23
National Institute of Oceanography and Fisheries 24.2 24.5 26.7 National Institute of Standard 24.2 18.5 19.5 Egyptian Petroleum Research Institute 27.3 23 31.1 Central Metallurgical Research and Development Institute
25.6 23.5 22.6
Electronics Research Institute 16.2 12.8 15.6 Theodore Bilharz Research Institute 32.8 25.6 29.6 Research Institute of Ophthalmology 22.7 21.4 23 The higher Council of the centres and research institutes
2.1 1.5 2.2
Total 562.8 478.8 524.9 Source: Ministry of Scientific Research, indicators report
8.3.3 Funding programmes
Some new funding programmes have recently been established to fund and stimulate R&D activities. For example, the European Union has allocated a grant of EUR 11 million to finance a three-year programme (RDI) to facilitate Egypt’s participation in the European Research Area by encouraging and stimulating innovation and scientific linkages among research institutions and scientists from Egypt and the EU. The Ministry of Scientific Research has also established a science and technology fund (STDF) for promoting research activities in the country. These programmes provide competitive grant-based projects initiated by researchers. The grant form of financing also allows students to be involved in the research activities, thus improving the quality of training. These funding mechanisms provide flexible and independent support for research as being a part of governmental programmes.
94
8.3 Financing research
Government financing of research in Egypt is still highly centralised. The government funding goes either directly to universities, or to different research institutes that belong to different ministries. This funding is mainly directed to basic research and the funding available from STDF and RDI is mainly directed to applied research. There is annual increase in funding levels by 10-15%, however, the low levels of funds available for research have always affected the quality of research output, resulted in weak ties with society over the years and distorted the image of research institutes at large and researchers specifically among stakeholders. It has also made the business sector reluctant to invest in research.
Table 8.1 shows that there was a growth rate of 28% from 2004 to 2006 in research expenditure by the government. The expenditure on research, which fluctuated between 0.27% of GDP in 2004 to 0.23% in 2006, is still quite low, especially when compared with international trends. For example, in 2004 Korea spent about 2.6% of its GDP on R&D. These figures reflect the need for further attention by the government to R&D in terms of financial issues and resources mobilisation; efforts should not be restricted to reforms in governance and management.
Table 8.1. Expenditure on scientific research, 2003-2007
Year Value (USD million) Expenditure
as a % of GDP
2003/2004 245 0.27 2004/2005 251 0.25 2005/2006 299 0.26 2006/2007 314 0.23
Source: Ministry of Scientific Research
8.3.1 Funding
Budget allocations to higher education institutions are not informed by sector strategic plans or linked to the needs of individual institutions. Neither does government financing of public HEIs and research institutes consider performance-based criteria (see Chapter 6). Despite the fact that the Supreme Council of Universities (SCU) and the MoHE are the governing bodies for the universities, the budget allocation is determined unilaterally by the Ministries of Finance (recurrent budget) and Planning (investment budget).
Generally, the allocated budgets are assigned by line-item categories and, astonishingly, research is not explicitly one of them. Moreover, education institutions do not have the freedom to shift resources across line-item categories. For example, the funding allocation to an individual university is determined based on the previous year's budget and the university's request to the MoF in the form of mechanical increments. The research budget is inclusive. At the faculty level, a percentage of the university budget is distributed to each faculty according to its specific requirements. However, the response to these needs is very limited. Normally, the same budget is allocated unless central decisions are taken to purchase new buildings or restore old ones. This is again due to the restrictions placed on universities for manipulating funds according to their own

96 97
97
In 2006/07, public universities and Al Azhar enrol about 91.9% and 7.8% of the total postgraduates students in applied sciences respectively while they enrol 91.6% and 7.6% of humanities and social science respectively. This shows that the Government still the main provider and supporter for postgraduate studies in the country. The percentages in private universities and higher institutes are lower. In private universities only 0.2% and 0.8% of the total postgraduate enrolled students are conducting research in applied and basic science, and humanities and social sciences respectively.
Table 8.4 Percentage and numbers of the postgraduate students in different HEIs
Applied and basic sciences Humanities and Social Sciences
2002-03 2006-07 2002-03 2006-07 No. of
enrolled postgraduate
% of the total
enrolled postgraduate
students
No. of enrolled
postgraduate
% of the total
enrolled postgraduate
students *
No. of enrolled
postgraduate
% of the total
enrolled postgraduate
students
No. of enrolled
postgraduate
% of the total
enrolled postgraduate
students* Public Uni. 58,073 93.9% 75,264 91.9% 99,898 91.0% 102,161 91.6% Al Azhar 3,573 5.8% 10206
7.8% 9,192 8.4% 12,298 7.6%
Private Universities
199 0.3% 174 0.2% 682 0.6% 903 0.8%
Total 61,845 100.0% 85,644 100.0% 109,772 100.0% 115,362 100.0% Source: SPU database
The other higher education institutes do not conduct any research and so no postgraduate students are enrolled. Researchers in these institutes normally join public universities to pursue their postgraduate studies. In addition to the senior research staffs who hold PhDs, Table 8.3 shows that there are around 209,229 researchers employed in applied and basic sciences disciplines (90,522) and humanities and social sciences disciplines (118,707). This can be considered as the second pool of researchers in Egypt.
The quality of training of master and doctoral students, the future leaders in all economic and state structures, is strongly dependent on the level of scientific research in the higher education sector. Thus it is essential that the Egyptian government takes the necessary steps to improve the volume and quality of research activities in the higher education sector.
In this regards, MOSR is adopting a new program to enhance the capabilities of new-graduated researchers, who obtained ASRT fellowship. The new program provides intensive 6-month training for scientists and provides them with a mobility opportunity to visit international research institutes as well through a complementary program called Partnership-Ownership (Par-Own).
8.4.2 Researchers’ mobility
For decades the government has offered, annually, a number of scholarships for junior researchers to allow them to pursue their postgraduate studies abroad. These scholarships are distributed among public HEIs and research institutes, based on a five-year plan that focuses on certain disciplines. However, many institutes and researchers change their courses according to
96
8.4 Research staff
The public universities, together with the institutes that belong to the Ministry of Scientific Research, form the main pool of researchers in the country, representing around 88% of all research staff in Egypt. Other research activities can be found in other ministries, such as the Ministry of Agriculture (employing around 8% of the country’s researchers) and the Ministry of Water Resources and Irrigation. Most of the other ministries have only a limited number of research institutes (Table 8.3).
Table 8.3 Number of higher degrees holders in different ministries
Ministry Masters PhD Female male Female Male
Industry and Trade 9 14 7 39 Petroleum 4 44 1 22 Information 4 2 2 8 Military Production 0 2 0 2 Communications and IT 8 8 10 11 Investment 3 17 3 2 Housing and utilities & Urban Communities
17 64 38 15
Education 31 17 26 44 Culture 29 48 83 91 State for the Environment 10 29 10 10 State for Administrative Development
22 16 28 58
Agriculture and Land Reclamation 665 1,210 909 2,852 Health and population 307 1,060 110 331 Manpower and immigration 10 0 3 1 Water Resources and irrigation 36 104 32 158 Transportation 9 26 3 5 Planning 13 7 32 54 Civil Aviation 2 18 1 20
Electricity and energy 175 219 333 473 Source: Ministry of Scientific Research, indicators report
A very important issue is that staff members who come from science and engineering represent 32% of all researchers in the public universities. This could be a very good asset for potential development and innovation in Egypt. However, despite the relative increase in graduates of science and technical subjects between 1996 and 2006, the availability of researchers and R&D staff that could lead to a real transformation of the Egyptian economy is still questionable.
8.4.1 Student involvement in research
The participation of students in HEI research activities is mainly restricted to postgraduate students studying for Diplomas, Masters and PhDs. However, little of this research meets economic needs or fulfils social demands. It is mostly conducted by students to obtain a degree to enhance either their academic or professional career. Apart from the final year projects conducted by undergraduate students, it is very rare to find undergraduates who are involved in real research activities. Generally, culture of pursuing postgraduate studies has spread among Egyptian graduates especially in the last few years. This can be observed in the growth in enrolment (12.7%) between 2002/03 and 2006/07. This appears significantly in the applied sciences where the growth is found to be 32.4% for the same interval, while much less has been observed at the humanities and social sciences.

98 99
99
Table 8.6 Number of publications by different Arab states (1995-2005)
Country No. of publications Algeria 5,900 Bahrain 1,070 Egypt 27,237 Iraq 840 Jordan 7,453 Kuwait 6,513 Lebanon 10,035 Mauritania 586 Morocco 1,683 Oman 4,984 Qatar 772 Saudi Arabia 21,596 Sudan 1,324 Syria 1,961 Tunisia 9,149 Source: Ministry of Scientific Research report
However, in 2005, Germany, Japan and Korea, had 100,000, 95,144 and 31,574 publications respectively (see Table 8.7), while Egypt had only 4,469 publications for the same year. Despite being relatively low in comparison to developed countries, Egypt’s publication growth rate between 1998 and 2005 was 55%. The growth rates were 21%, 20% and 158% for Germany, Japan, and Korea respectively over the same period. While Egypt’s publication growth rate is quite promising, serious efforts are still needed.
Country Publications
1998 2002 2005
total number
per million population
total number
per million
population
total number
per million
population
Japan 79,781 631.1 82,316 660.2 95,144 743.6
Germany 82,429 1004.7 79,382 1021.3 >100000 1454.8
France 57,774 989.3 54,836 953.4 69,013 1136.2
Russia 29,688 202.1 27,197 181.8 28,072 196.1
Poland 9,864 255.1 12,239 390.3 17,006 445.6
Romania 1,830 81.3 2,192 112.5 3,005 138.9
Korea 12,096 261.3 18,750 516.6 31,574 653.8
Despite being relatively low in comparison to developed countries, the publications growth rate from 1998 to 2005 in Egypt has been 55%. While the growth rates have been 20%, 21% and 158% for Japan, Germany, and Korea respectively for the same period. This indicates that Egypt has made a good progress since late 1990s in terms of research publications however, serious efforts still ahead.
Table 8.7 Publications of scientists from different countries (1998-2005)
Source: OECD review report on Kazakhstan
98
their interest, which affects the achievement of the national plan. Other grants are available to senior researchers to allow them to spend between three and nine months conducting joint research abroad. However, the size of the grant is quite limited and the beneficiaries are relatively few.
For decades the government has offered, annually, a number of scholarships for junior researchers to allow them to pursue their postgraduate studies abroad. These scholarships are distributed among public HEIs and research institutes, based on a five-year plan that focuses on certain disciplines. However, many institutes and researchers change their courses according to their interest, which affects the achievement of the national plan. Other grants are available to senior researchers to allow them to spend between three and nine months conducting joint research abroad. However, the size of the grant is quite limited and the beneficiaries are relatively few.
Researchers from HEIs claim that the transparency of the granting process is questionable due to the lack of clear selection criteria. However, in 2006 MoHE initiated a new granting scheme called PAROWN that fully targets young researchers in all research institutes in the country. Despite its short period (three to six months) and the limited number of beneficiaries, its impact on researchers’ mobility is quite apparent.
No special measures have been taken to improve the local mobility of researchers. There are no active exchange programmes between public universities and other institutes within the country. Current legislation, which restricts researcher mobility, has negatively affected such activities. Normally, researchers need to fulfil very bureaucratic procedures to conduct research or training in different institutes.
Few international researchers come to Egypt to pursue research. Issues such as the lack of data on Egyptian universities and research institutes, the poor quality of labs and equipment, and the few incentives available for both hosting and visiting researchers are badly impeding such activities.
8.4.3. Researchers’ publications
The publication rate of Egyptian researchers (Table 8.5) is relatively good when compared to other Arab countries, but not when compared to developed countries. Table 8.6 shows that Egypt had the most publications (27,237) of all Arab countries. Saudi Arabia came second, with 21,596 publications, for the same period.
Table 8.5 Research published in international journal
Year Number of publications 1998 2,866 1999 2,770 2000 2,940 2001 3,198 2002 3,352 2003 3,941 2004 4,306 2005 4,469 2006 4,582 2007 4,802
Source: Ministry of Scientific Research report

100 101
101
the world to develop research and innovation capabilities. For example, China and India have attracted many foreign companies to locate R&D activities there, and R&D activities are carried out both in academia and industry. In this context higher education institutions can make a major contribution to research and innovation by creating new knowledge through scientific and technological research. Internationally, this role of higher education in innovation has started to increase significantly. This is clearly reflected in the increasing R&D expenditures, rising graduation rates, increased patenting and the growing number of references in scientific literature to patent applications. Unfortunately such a role is still relatively absent from Egypt.
100
8.5 Infrastructure and information resources for research
The state of the infrastructure in most of research laboratories is not really promising. The old and outdated equipment has limited the potential for carrying out competitive scientific research. The quality of used material in the technical and natural sciences should be improved considering that these are Egypt’s priority areas in helping the country to compete on a global scale.
On the other hand, the launch of the Information and Communication Technology Project (ICTP) in 2003, has gradually resolved the serious deficiencies in the information resources available at university libraries. For example, the project arranged for subscriptions to major international scientific databases such as Scopus (Elsevier Science), and made electronic versions of the leading scientific journals available to researchers in the universities. Also, the project is building a database of Egyptian dissertations and theses. However, the impact of these efforts is yet to be seen. The ICTP has also founded a fast internet network between universities. Generally, IT infrastructure is currently satisfactory, despite the fact that the number of personal computers with Internet access needs to be increased.
8.6 Business-academia relationships
In general there are no mechanisms and measures to help HEIs and research institutes transfer knowledge and technology to the business sector. Although there are cases where the business sector asks these institutes for support, most of the existing co-operation is based on personal relations and connections and is usually in the form of technical support rather than conducting innovative research projects. This is true of most universities, such as Cairo University, Alexandria University, Assiut University and most research institutes. However, there is no research incubator within the HEIs and no high tech parks or techno poles. The absence of high tech parks and techno poles and the diversity of research activities in most universities — without a real focus on certain disciplines — have made the business sector reluctant to co-operate with these universities. The absence of tax incentives for R&D has also played a role in discouraging the private sector from investing in research. Generally, the governance system, legislation and funding schemes prevent the higher education organisations and research institutes from being more responsive to economic and societal needs. As they do not conduct research and because they suffer from poor quality education, the technical colleges do not offer any kind of support to small and medium-sized enterprises.
The government has started to take steps to improve technology transfer from public research organisations to business sector through different programs such the aforementioned RDI and STDF. New legislation is not yet in place to consider technology transfer to business as an explicit mission of universities. However, the government has not yet reformed the rules governing the ownership of intellectual property (IP) generated by public research institutions. Norway and Switzerland introduced such changes in recent years, and Iceland and Finland are preparing legislation on the subject (OECD, 2004). Countries that have not changed legislation, such as Australia and Ireland, have nevertheless developed new guidelines to encourage commercialisation of research results and provide greater consistency in IP management among research organisations.
8.7 Research and globalisation
Internationally the current scale of globalisation is having a large impact on innovation in both academia and industry. The scope for global collaboration is expanding and leading more regions in
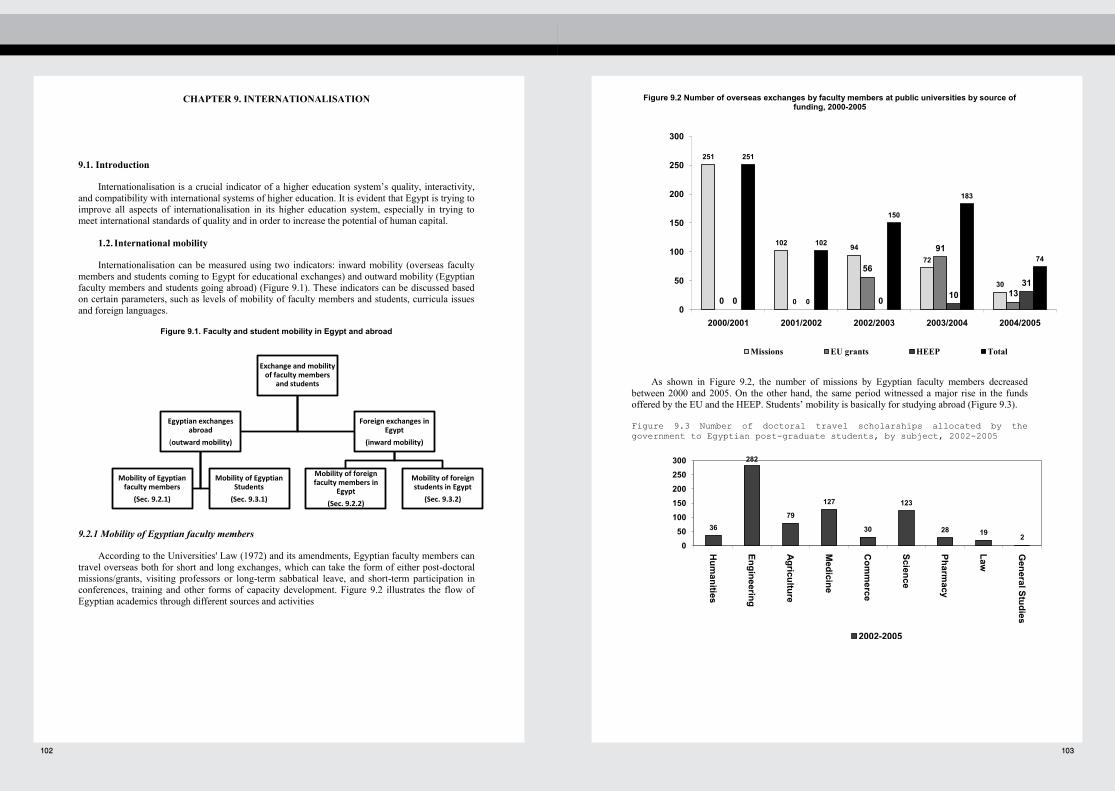
102 103
103
Figure 9.2 Number of overseas exchanges by faculty members at public universities by source of funding, 2000-2005
As shown in Figure 9.2, the number of missions by Egyptian faculty members decreased
between 2000 and 2005. On the other hand, the same period witnessed a major rise in the funds offered by the EU and the HEEP. Students’ mobility is basically for studying abroad (Figure 9.3).
Figure 9.3 Number of doctoral travel scholarships allocated by the government to Egyptian post-graduate students, by subject, 2002-2005
251
102 94
72
30
0 0
56
91
130 0 0 10
31
251
102
150
183
74
0
50
100
150
200
250
300
2000/2001 2001/2002 2002/2003 2003/2004 2004/2005
Missions EU grants HEEP Total
36
282
79
127
30
123
28 19 20
50100150200250300
Hum
anities
Engineering
Agriculture
Medicine
Com
merce
Science
Pharmacy
Law
General Studies
2002-2005
102
CHAPTER 9. INTERNATIONALISATION
9.1. Introduction
Internationalisation is a crucial indicator of a higher education system’s quality, interactivity, and compatibility with international systems of higher education. It is evident that Egypt is trying to improve all aspects of internationalisation in its higher education system, especially in trying to meet international standards of quality and in order to increase the potential of human capital.
1.2. International mobility
Internationalisation can be measured using two indicators: inward mobility (overseas faculty members and students coming to Egypt for educational exchanges) and outward mobility (Egyptian faculty members and students going abroad) (Figure 9.1). These indicators can be discussed based on certain parameters, such as levels of mobility of faculty members and students, curricula issues and foreign languages.
Figure 9.1. Faculty and student mobility in Egypt and abroad
9.2.1 Mobility of Egyptian faculty members
According to the Universities' Law (1972) and its amendments, Egyptian faculty members can travel overseas both for short and long exchanges, which can take the form of either post-doctoral missions/grants, visiting professors or long-term sabbatical leave, and short-term participation in conferences, training and other forms of capacity development. Figure 9.2 illustrates the flow of Egyptian academics through different sources and activities
Exchange and mobility of faculty members
and students
Egyptian exchanges abroad
(outward mobility)
Mobility of Egyptian faculty members
(Sec. 9.2.1)
Mobility of Egyptian Students
(Sec. 9.3.1)
Foreign exchanges in Egypt
(inward mobility)
Mobility of foreign faculty members in
Egypt
(Sec. 9.2.2)
Mobility of foreign students in Egypt
(Sec. 9.3.2)
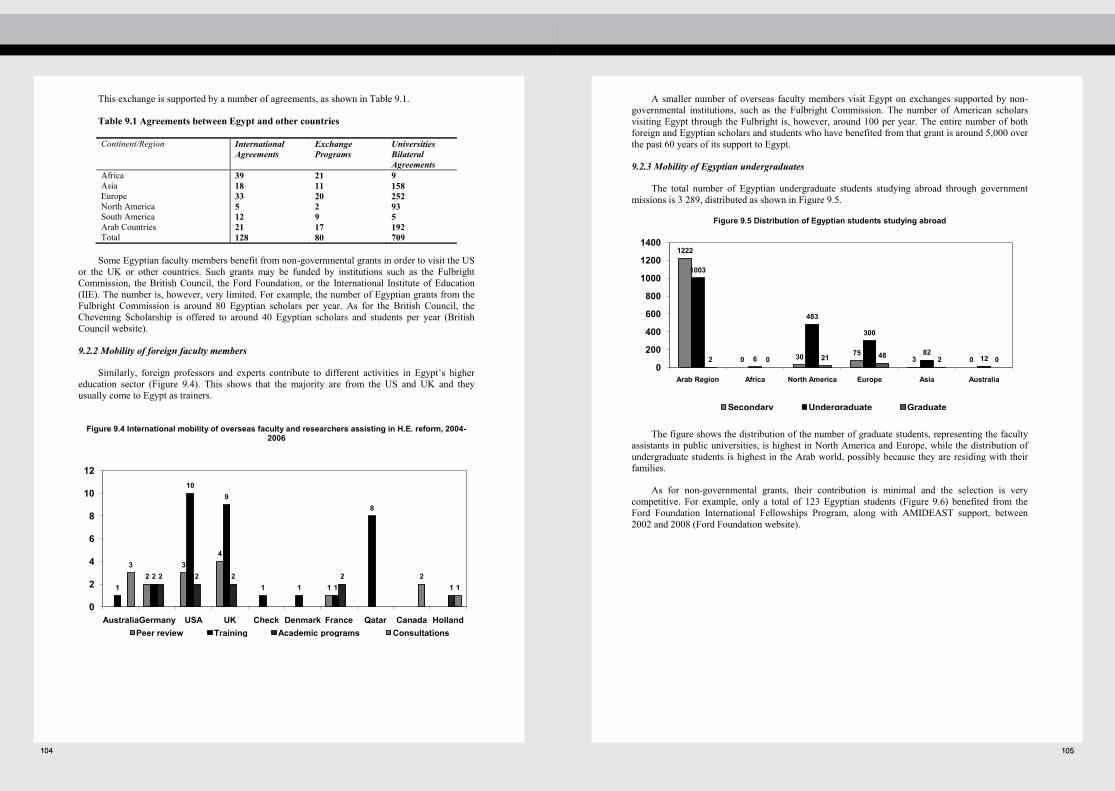
104 105
105
A smaller number of overseas faculty members visit Egypt on exchanges supported by non-governmental institutions, such as the Fulbright Commission. The number of American scholars visiting Egypt through the Fulbright is, however, around 100 per year. The entire number of both foreign and Egyptian scholars and students who have benefited from that grant is around 5,000 over the past 60 years of its support to Egypt.
9.2.3 Mobility of Egyptian undergraduates
The total number of Egyptian undergraduate students studying abroad through government missions is 3 289, distributed as shown in Figure 9.5.
Figure 9.5 Distribution of Egyptian students studying abroad
The figure shows the distribution of the number of graduate students, representing the faculty assistants in public universities, is highest in North America and Europe, while the distribution of undergraduate students is highest in the Arab world, possibly because they are residing with their families.
As for non-governmental grants, their contribution is minimal and the selection is very competitive. For example, only a total of 123 Egyptian students (Figure 9.6) benefited from the Ford Foundation International Fellowships Program, along with AMIDEAST support, between 2002 and 2008 (Ford Foundation website).
1222
0 30 753 0
1003
6
483
300
82122 0 21 48 2 0
0
200
400
600
800
1000
1200
1400
Arab Region Africa North America Europe Asia Australia
Secondary Undergraduate Graduate
104
This exchange is supported by a number of agreements, as shown in Table 9.1.
Table 9.1 Agreements between Egypt and other countries
Continent/Region International Agreements
Exchange Programs
Universities Bilateral Agreements
Africa 39 21 9 Asia 18 11 158 Europe 33 20 252 North America 5 2 93 South America 12 9 5 Arab Countries 21 17 192 Total 128 80 709
Some Egyptian faculty members benefit from non-governmental grants in order to visit the US or the UK or other countries. Such grants may be funded by institutions such as the Fulbright Commission, the British Council, the Ford Foundation, or the International Institute of Education (IIE). The number is, however, very limited. For example, the number of Egyptian grants from the Fulbright Commission is around 80 Egyptian scholars per year. As for the British Council, the Chevening Scholarship is offered to around 40 Egyptian scholars and students per year (British Council website).
9.2.2 Mobility of foreign faculty members
Similarly, foreign professors and experts contribute to different activities in Egypt’s higher education sector (Figure 9.4). This shows that the majority are from the US and UK and they usually come to Egypt as trainers.
Figure 9.4 International mobility of overseas faculty and researchers assisting in H.E. reform, 2004-
2006
23
4
112
109
1 1 1
8
2 2 2 21
32
1
0
2
4
6
8
10
12
AustraliaGermany USA UK Check Denmark France Qatar Canada HollandPeer review Training Academic programs Consultations
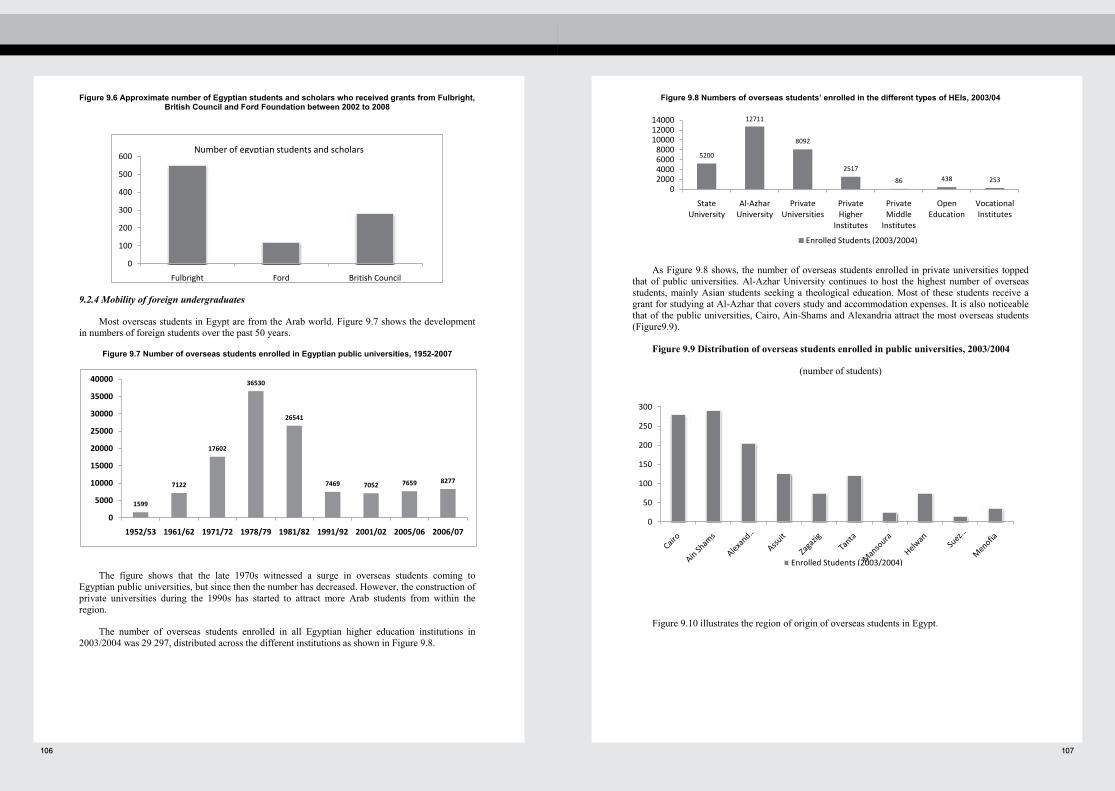
106 107
107
Figure 9.8 Numbers of overseas students’ enrolled in the different types of HEIs, 2003/04
As Figure 9.8 shows, the number of overseas students enrolled in private universities topped that of public universities. Al-Azhar University continues to host the highest number of overseas students, mainly Asian students seeking a theological education. Most of these students receive a grant for studying at Al-Azhar that covers study and accommodation expenses. It is also noticeable that of the public universities, Cairo, Ain-Shams and Alexandria attract the most overseas students (Figure9.9).
Figure 9.9 Distribution of overseas students enrolled in public universities, 2003/2004
(number of students)
Figure 9.10 illustrates the region of origin of overseas students in Egypt.
5200
12711
8092
2517
86 438 2530
2000400060008000
100001200014000
State University
Al-Azhar University
Private Universities
Private Higher
Institutes
Private Middle
Institutes
Open Education
Vocational Institutes
Enrolled Students (2003/2004)
0
50
100
150
200
250
300
Enrolled Students (2003/2004)
106
Figure 9.6 Approximate number of Egyptian students and scholars who received grants from Fulbright, British Council and Ford Foundation between 2002 to 2008
9.2.4 Mobility of foreign undergraduates
Most overseas students in Egypt are from the Arab world. Figure 9.7 shows the development in numbers of foreign students over the past 50 years.
Figure 9.7 Number of overseas students enrolled in Egyptian public universities, 1952-2007
The figure shows that the late 1970s witnessed a surge in overseas students coming to Egyptian public universities, but since then the number has decreased. However, the construction of private universities during the 1990s has started to attract more Arab students from within the region.
The number of overseas students enrolled in all Egyptian higher education institutions in 2003/2004 was 29 297, distributed across the different institutions as shown in Figure 9.8.
0
100
200
300
400
500
600
Fulbright Ford British Council
Number of egyptian students and scholars
1599
7122
17602
36530
26541
7469 7052 7659 8277
0
5000
10000
15000
20000
25000
30000
35000
40000
1952/53 1961/62 1971/72 1978/79 1981/82 1991/92 2001/02 2005/06 2006/07

108 109
109
Table 9.2 Source of finance for foreign students in public universities
(numbers of students)
Source of Finance Study Type
Egyptian Grant
Own Country Grant
Self Total
Undergraduate 668 -- 3290 3958 Postgraduate 166 454 2274 2894 Others (Learning Arabic Language)
237 -- -- 237
1107 454 5564 7125
Tuition fees charged for overseas undergraduate students in Egypt’s public universities are as follows: Undergraduate students (currencies in British pounds, GBP)
Tuition Scientific Disciplines Humanities First deposit 1500 1000 Annual 1500 1000
This information allows us to calculate the approximate revenue gained by public universities
from overseas students. We have calculated that for an average four-year study period at undergraduate level, the average tuition fee for a student would be GBP 4500. If the number of overseas students in 2006/2007 was 8 277 (Figure 9.7), then the revenue for 2006/2007 would be about GBP 37 million. This revenue would be higher when taking into account the fees charged for graduate students too.
Year Number of students Approximate revenue (GBP) 2001/2002 7052 32 million 2005/2006 7659 34 million 2006/2007 8277 37 million
Figure 9.12 Approximate revenue in public universities from foreign student tuition, 2001-2007
(GBP)
28000000
30000000
32000000
34000000
36000000
38000000
2001/2002 2005/2006 2006/2007
Approx. revenue
108
Figure 9.10 Distribution of overseas students at public universities by place of origin, 1998-2008
This shows that the bulk of overseas students in public universities is from Arab countries, followed by students from Asia, then Sub-Saharan Africa. However, the numbers of students from Arab countries are decreasing while those from Sub-Saharan Africa and Asia are increasing, specifically Malaysia, Indonesia, India and China. This reflects the growing numbers of bilateral agreements specifically in the fields of medicine, humanities and engineering (Figure 9.11).
Figure 9.11 Distribution of foreign students studying in Egypt by discipline, 2004-2008
Table 9.2 illustrates the source of finance for the overseas students at public universities:
1131
5
6521 74
05
6066 68
54
196
164
230
460 95
0
80 179
253 12
78
1362
30 73 55 68 81
0
2000
4000
6000
8000
10000
12000
1988/89 1993/94 1998/99 2003/04 2007/2008
Arab Countries Sub-Saharan Africa Asia Europe & Americas
9% 8%
28%
8%
26%
22%
5% 8% 22%
5% 42%
17%
5% 6% 20%
6%
48%
16%5% 6%
18%
9%
49%
14%
0%
10%
20%
30%
40%
50%
60%
Basic Sciences Education Humanities Agri. & Vet. Medicine
Medicine Engineering
2004/05 2005/06 2006/07 2007/08
110 111
110
Tuition fees for overseas graduate students (currencies in British pounds, GBP) were as follows: Tuition Scientific disciplines Humanities Diploma MA PhD Diploma MA PhD First deposit 1700 1700 1700 1200 1200 1200 Annual 1300 1500 2500 1000 1200 2000
9.3 Curriculum issues
The majority of academic programmes at public universities are semester based. Very recently, some HEIs, mainly private universities, have shifted to the credit hours system. This is because in some cases private universities carrying foreign names borrow academic programmes from foreign countries through collaboration with foreign higher education institutions, or seek accreditation from overseas accrediting agencies.
Academic degrees granted by public universities are all approved by the Supreme Council of Universities. An equivalence process is used for equating degrees from other countries with Egyptian degrees before admitting students into academic programmes. However, private universities are freer to admit overseas students through their own admission system without taking prior approval from the wafidin18 directorate.
9.4 Foreign languages
The integration of foreign languages into university level education occurs either as a medium of teaching, or as standalone taught courses within the academic programmes. English is the most common foreign language used as a teaching medium in some programmes, specifically medicine and engineering. However a common concern given as feedback from employers was the unsatisfactory language proficiency of graduates, especially in disciplines that are closely associated with applied fields like tourism and business.
18 The central directorate responsible for admitting students to public universities and private higher and
middle institutes.

112