Embed Size (px)
Citation preview

2 December 2003
Contents
NOTICE: This journal is copyrighted in the name of the International Rice Research Institute (IRRI). IRRI has the exclusive right to reproduce or
authorize reproduction of the copyrighted work, to prepare derivative works based upon the copyrighted work, and to distribute copies of the
copyrighted work to the public for sale or other transfer of ownership. You may copy, duplicate, or otherwise reproduce any of the articles or portions
of the articles in the copyrighted work; but you must acknowledge the journal and its copyright owner as the source of the copyrighted work. You may
not modify, translate, or use the data herein contained to prepare a derivative work without the prior written consent of the copyright owner.
28.2/2003 International Rice Research Institute
IRRI home page: http://www.irri.org
Riceweb: http://www.riceweb.org
Riceworld: http://www.riceworld.org
IRRI Library: http://ricelib.irri.cgiar.org
IRRN: http://www.irri.org/irrn.htm
International Rice Research Notes
MINI REVIEWS
Copyright International Rice Research Institute 2003
December 2003
5
24
22
Vivek Dhan 82: a high-yielding, blast-resistantirrigated rice variety for the Indian HimalayaR.K. Sharma, J.C. Bhatt, and H.S. Gupta
Santosh—a high-yielding variety for the rainfedlowland of Bihar, India, developed throughparticipatory breedingR. Thakur, N.K. Singh, S.B. Mishra, A.K. Singh,K.K. Singh, and R.K. Singh
25
Detection of simple sequence repeat markersassociated with resistance to whitebackedplanthopper, Sogatella furcifera (Horvath), in riceP. Kadirvel, M. Maheswaran, andK. Gunathilagaraj
Integrated natural resource manage-ment for rice productionS. P. Kam
Yields at IRRI research farm are stillclose to the climatic potential levelM.J. Kropff, K.G. Cassman, S. Peng, and H.H. vanLaar
Using rice cultivar mixtures: a sus-tainable approach for managingdiseases and increasing yieldN.P. Castilla, C.M. Vera Cruz, Y. Zhu, and T.W. Mew
Plant breeding
Genetic resources
Cover photo courtesy of Y. Zhu
12
19
3IRRN 28.2
27 32
28
Pest science & management
33Fingerprinting the rice isolates of R. solani Kuhnusing RAPD markersV. Singh, M. Singh, U.S. Singh, and K.P. Singh
Effects of methanol extracts from Ophiopogonjaponicus on rice blast fungusD. Lin, E. Tsuzuki, Y. Sugimoto, and M. Matsuo
Is the trap barrier system with a rice trap crop areservoir for rice insect pests?R.C. Joshi, E.B. Gergon, A.R. Martin, A.D. Bahatan, andJ.B. Cabigat
Screening of rice genotypes for resistance toleaffolder, Cnaphalocrocis medinalis Guenée, andstem borer, Scirpophaga incertulas WalkerS.P. Gupta, R.A. Singh, J.L. Dwivedi, and R.C. Chaudhary
Reduction in chemical use following integratedecologically based rodent managementG.R. Singleton, Sudarmaji, N.P. Tuan, P.M. Sang, N.H. Huan,P.R. Brown, J. Jacob, K.L. Heong, and M.M. Escalada
30 35 First report of narrow brown leaf spot disease ofrice in West Bengal, IndiaA. Biswas
36 41
Soil, nutrient, & water management
Effect of organic farming on management ofrice brown planthopperJ. Alice R.P. Sujeetha, and M.S. Venugopal
The effect of nitrogen on rice grain ironC. Prom-u-thai and B. Rerkasem
37
Influence of irrigation, nutrient management,and seed priming on yield and attributes ofupland riceU.C. Thomas, K. Varughese, and A. Thomas
Effect of organic and inorganic P fertilizers onsustainability of soil fertility and grain yield in arice-pulse systemD. Selvi, S. Mahimairaja, P. Santhy, and B. Rajkannan
44 Participatory research on the effect of on-farmwater management practicesK. Joseph
39
5046
48
Crop management & physiology
Temporal variation in sugar exudation rate ofhydroponically grown Pusa Basmati 1 at seed-ling stageS. Ghosh and D. Majundar
Impact of pulse applications of herbicides onbiomass of grasses and sedges and their effectson the yield and yield components of direct wet-seeded riceI.U. Awan, M.A. Nadim, F. Anjam, and K. Hayat
Effect of nursery seeding date and phosphorusfertilization on rice seedling growthK. Ashok Kumar and M.D. Reddy

4 December 2003
53
NOTES FROM THE FIELD62
An improved direct-rice seederS.S. Sivakumar, R. Manian, and K. Kathirvel
Agricultural engineering
Socioeconomics
Yield performance under the rice yaya demon-stration program in Sri Lanka: a case studyU. P.N.S. Pathirana and M. Wijeratne
Agricultural extension and farmer needs fortechnologyW.D.N.R. Prasad and M. Wijeratne
Advance estimation of rice production in Indiausing weather indicesG. Nageswara Rao, Y.S. Ramakrishna, A.V.R.Kesava Rao, and G.G.S.N. Rao
Impact of soil reclamation on productivity,income, and employment of rice farmers: a casestudy of the Krishnagiri Reservoir Project areaK.M. Shivakumar and M.N. Budhar
Exposure of Bangladeshi rice farmers to earlyflood riskB. Shankar and J. Barr
55
56
58
5560
Editorial Board
Jagdish K. Ladha, Editor-in-Chief
Gary Jahn (pest science and management)Zhikang Li (plant breeding; molecular and cell biology, China)Swapan Datta (plant breeding; molecular and cell biology, Los Baños)Mercy Sombilla (socioeconomics; agricultural engineering)Renee Lafitte (crop management and physiology)Abdelbagi Ismail (soil, nutrient, and water management; environment)Edwin Javier (genetic resources)
Production Team
Tess Rola, managing editor
EditorialBill Hardy
Graphic designEmmanuel Panisales
Editorial assistanceDiane MartinezJojo Llanto
INSTRUCTIONS TO CONTRIBUTORS66

5IRRN 28.2
MINI REVIEW
The adoption of modern rice cultivars has increased annual production in the pastthree decades by 2.4% per annum and average yield by 71% (Khush and Virk 2002).Modern cultivars continue to replace thousands of traditional cultivars (Chang
1994). Although the number of landraces used in breeding modern cultivars has increasedin the same period (Hossain et al 2003), many modern cultivars share the same geneticbackground (Chang 1994), which has contributed to the instability of resistance againstseveral rice diseases with high epidemic potential.
A sustainable approach in managing modern cultivars is functional diversification.Functional biodiversity (Schmidt 1978) is based on the principle of using cultivars withdiversified functions to limit the development of diseases. A growing number of studiesshow that, in natural ecosystems, functional diversity leads to higher stability (Petcheyand Gaston 2002). This means that, in agroecosystems, haphazard cultivar mixtures donot necessarily control diseases and increase yield and that prolonging the useful life ofresistance genes and increasing crop productivity may be achieved by taking into ac-count the functional differences in disease resistance and other agronomic traits of culti-vars. Such functional diversification can be achieved by using multilines and cultivarmixtures (Wolfe 1985).
The usefulness of mixtures, whether multilines or cultivar mixtures, for diseasemanagement has been well demonstrated for rusts and barley powdery mildews of cere-
Using rice cultivar mixtures: a sustainable approach formanaging diseases and increasing yield
N.P. Castilla, C.M. Vera Cruz, and T.W. Mew, IRRI; and Y. Zhu, The Phytopathology Laboratory of Yunnan Province, YunnanAgricultural University, Kunming, Yunnan 650201, China. Email: [email protected]
December 20036
als (Finckh et al 2000, Mundt 2002). Multilines aremixtures of genotypically identical lines (near-isogenic lines) that differ only in a specific diseaseor pest resistance gene (Browning and Frey 1981).Multiline cultivars of rice are widely used to pre-vent the breakdown of resistance against blast inJapan, where the first registered rice multiline wasreleased in 1995 (Koizumi 2001). Cultivar mixturesrefer to mixtures of cultivated varieties growing si-multaneously on the same parcel of land with noattempt to breed for phenotypic uniformity (Mundt2002). The use of cultivar mixtures is considered tobe more practical and requires less investment thanthe use of multilines because there is no need tobreed new cultivars. This can be easily implementedby resource-poor farmers in developing countries—all that they have to do is mix existing cultivars withfavorable agronomic traits and performance. Mix-ing existing cultivars with more diverse geneticbackgrounds than multilines can enhance functionaldiversity and improve yield by providing morechances for positive interactions among cultivars.Moreover, this offers better opportunities for on-farm conservation of genetic resources by allowingfarmers to grow traditional cultivars.
Farmers in subsistence farming communitiesgrow several cultivars in a field or adjacent field asa strategy to cope with heterogeneous and uncer-tain ecological and socioeconomic conditions(Bellon 1996). The success of the large-scale farmerparticipatory experiment in Yunnan, China, inwhich traditional cultivars and hybrid rice are in-terplanted to control blast and increase yield (Zhuet al 2000), has contradicted the long-held assump-tion that cultivar mixtures should be restricted tolow-input and small-scale rice production systems.This has provided new insights into the importantcomponents that can help ensure the success of us-ing cultivar mixtures as a large-scale genetic diver-sification scheme in modern rice production sys-tems.
This article reviews the current knowledgeabout the mechanisms that account for disease re-duction and yield increase in cultivar mixtures ofmultiple crops. It discusses the various determi-nants in the adoption of cultivar mixtures and theprospects for and challenges in using cultivar mix-tures as a functional diversification strategy.
Mechanisms for reducing disease intensity andincreasing yield and yield stabilityThe underlying mechanisms behind the reductionin disease intensity and the increase in yield and
yield stability are relatively well understood in othercrops (Mundt 2002). Much remains to be done inunderstanding the same concepts in rice cultivarmixtures, but it can be assumed that most of themechanisms reported in mixtures of other cropscould also operate in rice.
Mechanisms for disease reduction
Several review articles explain the various mecha-nisms by which cultivar mixtures reduce diseaseintensity (Mundt 2002).
Dilution effect. Disease is reduced in cultivarmixtures because of the increased distance betweenplants of the susceptible cultivar in the mixture(Browning and Frey 1969, Chin and Wolfe 1984).The presence of the resistant cultivar decreases thechance of the inoculum produced from the infectedsusceptible cultivar of landing on anothersusceptible cultivar. Most of the inoculum lands onthe resistant cultivar, thus reducing the rate of dis-ease increase.
Barrier effect. The resistant cultivar provides aphysical barrier that restricts the movement of theinoculum from the susceptible cultivar (Browningand Frey 1969). For mixtures of differentially sus-ceptible cultivars (i.e., both components are suscep-tible to different races of the pathogen), plants ofcultivar A serve as a barrier for the race that attackscultivar B, and vice versa.
Induced resistance. This occurs when races thatare nonvirulent on a cultivar induce the plant’s de-fense response mechanisms. As a consequence, anyvirulent race (genetically different isolate of thesame pathogen that would normally infect theplant) invading exactly the same area of the plantcannot cause infection (Chin and Wolfe 1984).
Competition among pathogen races. The diversityof pathogen genotypes is expected to be higher incultivar mixtures than in monoculture, thus increas-ing the chance of interactions and competition be-tween pathogen races (Garrett and Mundt 1999).Competition among different virulent races mayprevent a certain race from dominating and over-coming host resistance in cultivar mixtures, thusreducing disease in the mixtures.
Mechanisms for increasing yield and yieldstabilityCultivar mixtures can have a higher yield and moreyield stability than pure stands of the components(Finckh et al 2000). Yield advantages are more com-monly observed in mixtures that have decreased
7IRRN 28.2
disease intensity (Finckh and Mundt 1992, Mundtet al 1995). Aside from the reduction in disease,several mechanisms are believed to account for theincrease in yield and yield stability in cultivar mix-tures.
Complementarity. The yield benefit of cultivarmixtures may be a function of complementary re-source use above- and belowground (Willey 1979).As in interspecific mixtures, a yield advantageoccurs when cultivar components differ in their useof resources in space and time in such a way thatoverall use of resources is better than when compo-nents are grown separately. Complementarity usu-ally occurs when component cultivars have differ-ent growth durations because the demand on re-sources occurs at different times (Fukai andTrenbath 1993).
Compensation. Compensation usually happensbetween cultivars with different competitive abili-ties (Willey 1979). It occurs when the yield of onecomponent increases while the other decreaseswithout affecting the overall yield of the mixture(Khalifa and Qualset 1974). Compensatory tilleringby resistant plants was observed when disease oc-curred early in the season (Brophy and Mundt 1991)and even in mixtures where disease intensity wasnot affected (Mundt et al 1995). Compensation wasalso observed in cultivar mixtures where the com-ponents differed in plant height (Khalifa andQualset 1974).
Facilitation. Facilitation is the positive effect ofplants on the establishment or growth of otherplants (Garcia-Barrios 2002). A component cultivarmay benefit another component directly by improv-ing microclimate, providing physical support orwindbreaks, and ameliorating harsh environmen-tal conditions, or indirectly by providing protectionfrom other pests and diseases, and improving wa-ter-holding capacity (Callaway 1995, Garcia-Barrios2002). Although rarely quantified, a form of facili-tation observed in rice cultivar mixtures is thehigher resistance to lodging of tall cultivars in mix-tures than in monoculture.
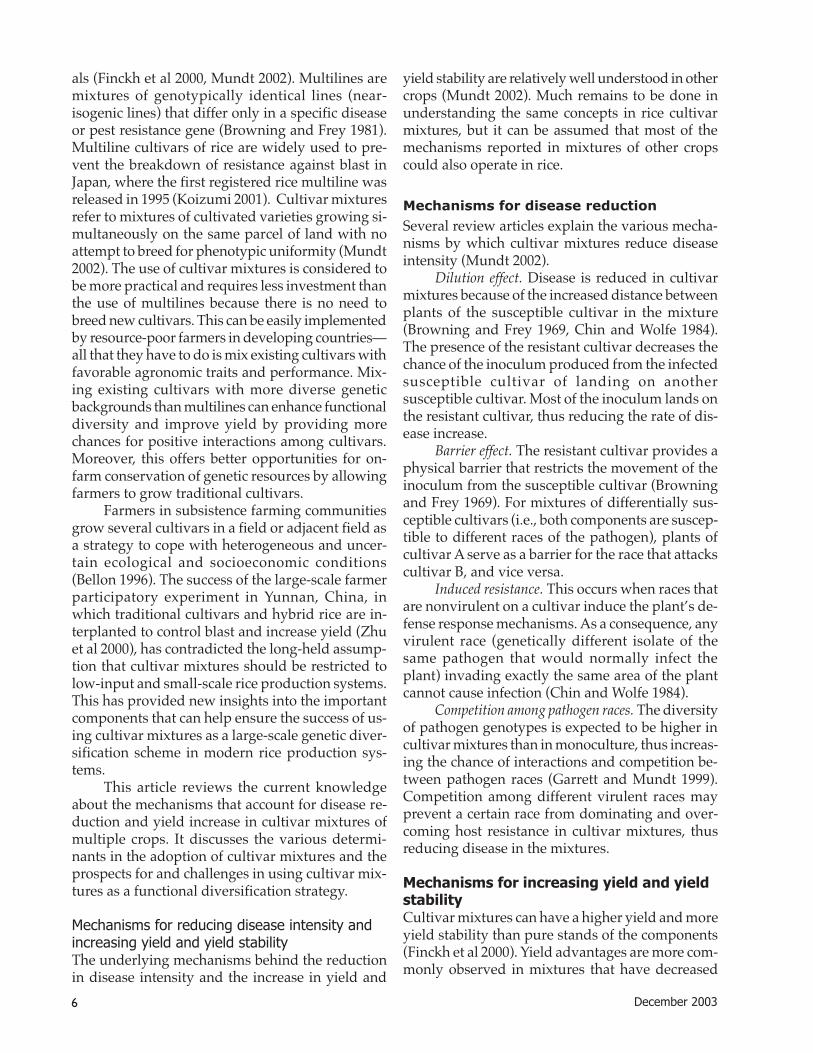
Major determinants in growing rice cultivarmixturesVarious biological and socioeconomic factors mustbe considered in the choice of cultivars to be usedin mixtures and their deployment in space and time.These factors and their interrelationships aresummarized in the figure.
Choice of cultivars
Functional diversity of cultivars. An important pre-requisite in using mixtures is the diversity of culti-vars to be included in terms of functions, such asresistance to the prevailing populations of thepathogen, resource use, and other agronomic traits.The functional diversity approach can help reducediseases and increase yield. Advances in genomics
Functional diversityin resistance to pestand other agronomictrails
Yield potential Other traits preferred by farmers andconsumers (e. g., eating quality, tolerancefor other stresses)
CompatibilityChoice of cultivars
Efficacy of disease suppressionYield (interaction between cultivars)Desired yield quality (e.g., eating and cooking quality)
Spatial deployment
Proportion of cultivars Planting pattern of cultivars
Disease epidemiologyPhenotype and maturity of cultivarsSuitability to existing cropping practices
Temporal deploymentChanges in preferences offarmers and consumers
Changes in virulenceof the pathogen
Changes in crop productivity
Interrelationships among some factors that affect the adoption of rice cultivar mixtures.
December 20038
and the recent completion of the rice genome mayhelp determine the functions of genes and predictthe performance of both traditional and modern cul-tivars to be included in the mixtures (Leung et al2003).
Yield potential. The yield potential of the culti-vars may be more important in some areas wherefarmers are more concerned with maximizing yieldthan reducing disease. Although disease reductionis expected to increase yield, a more preferable op-tion is to choose at least one cultivar with high po-tential yield to increase the chances of attaining highyield.
Other traits preferred by farmers. Rice farmers donot always consider disease resistance or yield asthe sole criterion in choosing cultivars. In areaswhere modern cultivars are widely adopted, mar-ket demand has increasingly become the most im-portant selection criterion (Friis-Hansen 2000).Farmers may prefer to combine cultivars that fulfilldifferent requirements as generally observed in rice-growing areas where multiple traditional cultivarsare grown (Bellon 1996)—e.g. good eating qualityfor cultivar A and high yield potential for cultivarB. Most farmers, particularly in modern rice pro-duction systems, would prefer to mix cultivars thatare similar in crop duration and phenotype to fa-cilitate crop establishment and maintenance, har-vesting, and marketing of harvested grains.
Spatial deployment of cultivar mixtures
Proportion of cultivars. Various studies suggest thatthe mean level of resistance of all components withrespect to the population of the pathogen has astronger effect on disease intensity than the num-ber of components (Finckh et al 2000). Increasingthe optimum proportion of resistant cultivars is ex-pected to increase the efficacy of the cultivar mix-ture because of the dilution effect. However, the pro-portion of the resistant cultivars is dictated not onlyby the expected effects on disease intensity but alsoby its effects on yield and whether it can fulfill therequirements of farmers. Farmers who produce ricemainly for the market may prefer to grow a higherproportion of the cultivar that commands a higherprice. In seed mixtures, the desired proportion maydepend on the eating quality of the product. Fur-thermore, plant type may be a consideration. Forexample, in mixtures composed of cultivars that dif-fer in height, increasing the proportion of the tallercultivar may adversely affect the growth and yieldof the shorter cultivar.
Planting or spatial pattern of cultivars. In severalcases, the efficacy of cultivar mixtures depends notonly on the proportion of susceptible and resistantcomponents but also on the planting pattern. If theinitial disease is distributed randomly or uniformly,such as the foliar diseases caused by wind-dispersedpathogens, the efficacy of mixtures increases as thegenotype unit area (GUA) decreases (Mundt et al1996). GUA is the area occupied by an independentunit of host tissue of the same genotype. For culti-var mixtures to be effective against diseases, culti-vars with the same level of resistance should not beadjacent to each other. A rice cultivar mixture inwhich the hills consist of seedlings belonging todifferent cultivars has a lower GUA than one withseveral rows of each cultivar alternating. Cultivarmixtures could be less effective for the control ofdiseases, such as bacterial blight, which is causedby a pathogen that is mainly dispersed by rainsplash or water (Ahmed et al 1997). The inoculumdispersed by this mechanism usually lands close tothe source plant; thus, rows of resistant plants can-not effectively serve as a barrier between rows ofsusceptible plants. Mixing seeds of a susceptiblecultivar with those of other cultivars with functionalresistance genes will result in reduced GUA andmay effectively suppress bacterial blight.
Spatial pattern also affects yield and competi-tiveness of components in the mixture (Fernandezet al 2002). To improve yield, there is a need to con-sider a spatial pattern that would allow cultivars,especially those with varying phenotypes, to inter-act positively and compete less. Spatial pattern may,in part, be determined by its suitability to existingcropping practices, specifically with respect to cropestablishment and harvesting.
Temporal deployment of cultivar mixtures
It may be necessary to change the composition ofcultivar mixtures after a specific period of time. Theuse of saved seeds from one season to another maylead to a shift in the composition of cultivar mix-tures due to the enhanced competitive ability of acomponent because of diseases (Alexander et al1986). It may also decrease the productivity of cul-tivar mixtures even in the absence of disease(Khalifa and Qualset 1974). Changing the mixturecomposition after a given period could delay theshift of the population structure of the pathogentoward virulent races, which occurs after succes-sive cultivation of the same cultivars. Another rea-son for changing the components is the change in
9IRRN 28.2
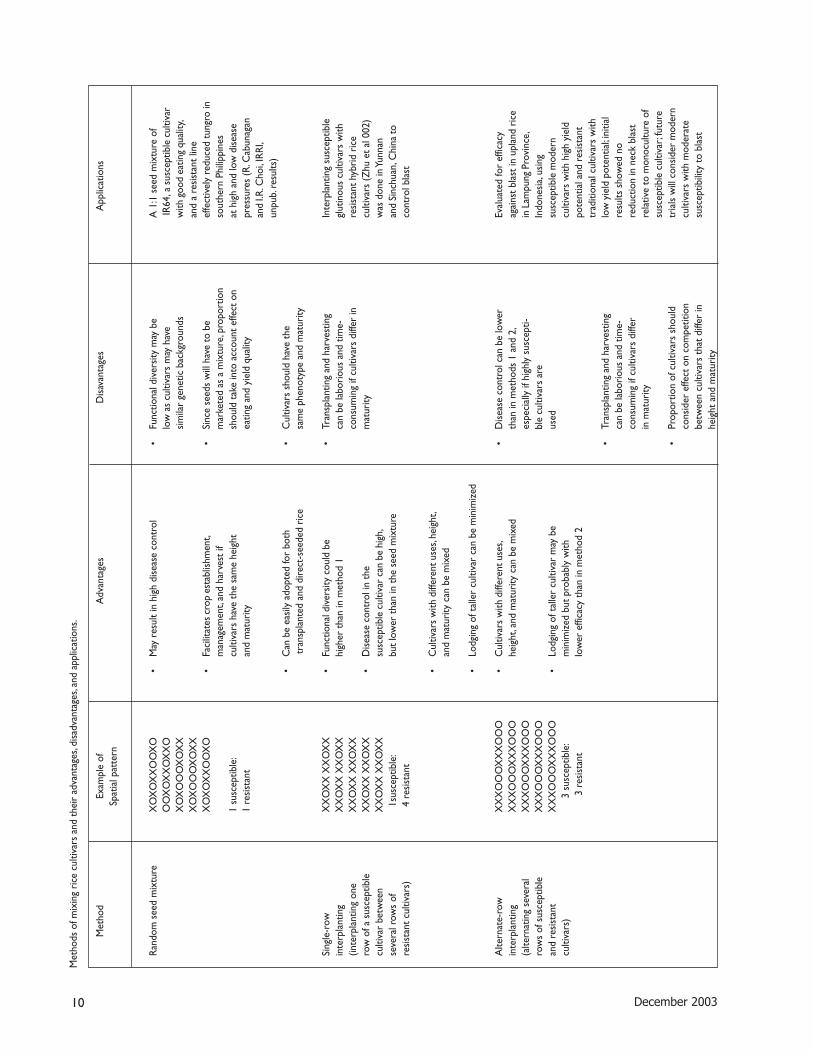
the preferences of farmers and consumers.The most common methods of mixing rice
cultivars and their advantages, disadvantages, andapplications are shown in the table.
Prospects and challengesThe main challenge in the use of cultivar mixturesas a functional diversification scheme lies in the factthat designing a system for mixing cultivars is adynamic process. It should be customized not onlyto the diseases and cultivars but also to the variousbiotic constraints and cropping practices of farm-ers in a specific area. Several research issues mustbe examined in designing an optimum system; theseare the most important: (1) What cultivars shouldbe combined? (2) What are the effects of certain pro-portions and planting patterns on major diseasesand other biotic constraints and crop productivity?and (3) What are the mechanisms (i.e., ecologicaland genetic bases) behind disease reduction andyield increase? The next step is to analyze practicalissues. A system for mixing cultivars must be de-signed to minimize anticipated difficulties in cropestablishment, harvesting, and milling and market-ing of grains that are usually associated with theadoption of cultivar mixtures. It is also importantto quantify the costs and benefits to determinewhether the benefits, such as those derived fromthe increase in yield and reduction in fungicide use,can offset additional costs. Farmers in Yunnan,China, incurred additional cost in transplanting andharvesting, but they continue to interplant cultivarsbecause the economic benefits exceeded the costs(Leung et al 2003).
The prospects for using rice cultivar mixturesappear to be more promising now than decades agobecause of the availability of several new ap-proaches that are important in choosing the rightcombination and spatio-temporal deployment ofcultivars. Recent advances in genomics, coupledwith phenotyping, allow the selection of cultivarswith defense genes effective against the populationof pathogens in a given location. More importantly,these advances may help in the selection of compo-nent cultivars that are functionally diverse with re-spect to disease resistance and agronomic traits.Experimental designs and various analytical ap-proaches can now be used to evaluate disease epi-demics and interactions of cultivars in mixtures and,consequently, allow for a more efficient identifica-tion of a system that suppresses diseases and maxi-mizes positive interactions among cultivars. More-over, various farmer participatory methods can be
applied to ensure that a given system suits the so-cial, cultural, and economic needs of farmers. Us-ing a combination of these approaches, on-farmexperiments are under way in China, the Philip-pines, and Indonesia to explore the use of rice culti-var mixtures.
ReferencesAhmed HU, Finckh MR, Alfonso RF, Mundt CC. 1997.
Epidemiological effect of gene deployment strategies onbacterial blight of rice. Phytopathology 87:66–70.
Alexander HM, Roelfs AP, Cobbs G. 1986. Effects of diseaseand plant competition on yield in monoculture andmixtures of two wheat cultivars. Plant Pathol. 35:457–465.
Bellon MR. 1996. The dynamics of infraspecific diversity: aconceptual framework at the farmer level. Econ. Bot.50:26-39.
Browning JA, Frey KJ. 1969. Multiline cultivars as a means ofdisease control. Annu. Rev. Phytopathol. 14:355–382.
Browning JA, Frey KJ. 1981. The multiline concept in theoryand practice. In: Jenkyn JF, Plumb RT, editors. Strategiesfor the control of cereal disease. Oxford: BlackwellPublications. p 37-46.
Callaway RM. 1995. Positive interactions among plants. Bot.Rev. 61:306-349.
Chang TT. 1994. The biodiversity crisis in Asian cropproduction and remedial measures. In: Peng CI, ChouCH, editors. Biodiversity and terrestrial ecosystems.Taipei: Institute of Botany, Academia Sinica. p 25-41.
Chin KM, Wolfe MS. 1984. Selection on Erysiphe graminis inpure and mixed stands of barley. Plant Pathol. 33: 535-546.
Fernandez ON, Vignolio OR, Requenses EC. 2002.Competition between corn (Zea mays) and Bermudagrass (Cynodon dactylon) in relation to crop plantarrangement. Agronomie 22:293-305.
Finckh MR, Mundt CC. 1992. Stripe rust, yield, and plantcompetition in wheat cultivar mixtures. Phytopathology82:905–913.
Finckh MR, Gacek ES. Goyeau H, Lannou C, Merz U, MundtCC, Munk L, Nadziak J, Newton AC, Vallavieille-PopeC, Wolfe MS. 2000. Cereal variety and species mixturesin practice, with emphasis on disease resistance.Agronomie 20:813-837.
Friis-Hansen E. 2000. Farmers’ management and use of cropgenetic diversity in Tanzania. In: Almekinders C, DeBoef W, editors. Encouraging diversity. The conservationand development of plant genetic resources. London:Intermediate Technology Publications. p 66-71.
Fukai S, Trenbath BR. 1993. Processes determining intercropproductivity and yields of component crops. Field CropsRes. 34:247-271.
Garcia-Barrios L. 2002. Plant-plant interactions in tropicalagriculture. In: Vandermeer JH, editor. Tropicalagroecosystems. Boca Raton, Florida: CRC Press.p 11-58.
Garrett KA, Mundt CC. 1999. Epidemiology in mixed hostpopulations. Phytopathology 89:984-990.
Hossain M, Gollin D, Cabanilla V, Cabrera E, Johnson N,Khush GS, McLaren G. 2003. Crop genetic improvement
December 200310
Met
hods
of m
ixin
g ri
ce c
ultiv
ars
and
thei
r ad
vant
ages
, disa
dvan
tage
s, an
d ap
plic
atio
ns.
M
etho
dEx
ampl
e of
Adv
anta
ges
Disa
vant
ages
App
licat
ions
Spat
ial p
atte
rn
Rand
om s
eed
mix
ture
XO
XO
XX
OO
XO
•M
ay r
esul
t in
hig
h di
seas
e co
ntro
l•
Func
tiona
l div
ersit
y m
ay b
eA
1:1
see
d m
ixtu
re o
fO
OX
OX
XO
XX
Olo
w a
s cu
ltiva
rs m
ay h
ave
IR64
, a s
usce
ptib
le c
ultiv
arX
OX
OO
OX
OX
Xsim
ilar
gene
tic b
ackg
roun
dsw
ith g
ood
eatin
g qu
ality
,X
OX
OO
OX
OX
Xan
d a
resis
tant
line
XO
XO
XX
OO
XO
•Fa
cilit
ates
cro
p es
tabl
ishm
ent,
•Si
nce
seed
s w
ill h
a ve
to b
eef
fect
ivel
y re
duce
d tu
ngro
inm
anag
emen
t, an
d ha
rves
t if
mar
kete
d as
a m
ixtu
re, p
ropo
rtio
nso
uthe
rn P
hilip
pine
s1
susc
eptib
le:
culti
vars
hav
e th
e sa
me
heig
htsh
ould
tak
e in
to a
ccou
nt e
ffect
on
at h
igh
and
low
dise
ase
1 re
sista
ntan
d m
atur
ityea
ting
and
yiel
d qu
ality
pres
sure
s (R
. Cab
unag
anan
d I.R
. Cho
i, IR
RI,
unpu
b. r
esul
ts)
•C
an b
e ea
sily
adop
ted
for
both
•C
ultiv
ars
shou
ld h
ave
the
tra
nspl
ante
d an
d di
rect
-see
ded
rice
sam
e ph
enot
ype
and
mat
urity
Sing
le-r
owX
XO
XX
XX
OX
X•
Func
tiona
l div
ersit
y co
uld
be•
Tran
spla
ntin
g an
d ha
rves
ting
Inte
rpla
ntin
g su
scep
tible
inte
rpla
ntin
gX
XO
XX
XX
OX
Xhi
gher
tha
n in
met
hod
1ca
n be
labo
riou
s an
d tim
e-gl
utin
ous
culti
vars
with
(inte
rpla
ntin
g on
eX
XO
XX
XX
OX
Xco
nsum
ing
if cu
ltiva
rs d
iffer
inre
sista
nt h
ybri
d ri
cero
w o
f a s
usce
ptib
leX
XO
XX
XX
OX
X•
Dise
ase
cont
rol i
n th
em
atur
itycu
ltiva
rs (Z
hu e
t al
002
)cu
ltiva
r be
twee
nX
XO
XX
XX
OX
Xsu
scep
tible
cul
tivar
can
be
high
,w
as d
one
in Y
unna
nse
vera
l row
s of
1su
scep
tible
:bu
t low
er th
an in
the
seed
mix
ture
and
Sinc
huan
, Chi
na to
resis
tant
cul
tivar
s) 4
res
istan
tco
ntro
l bla
st
•C
ultiv
ars
with
diff
eren
t use
s, he
ight
,an
d m
atur
ity c
an b
e m
ixed
•Lo
dgin
g of
tal
ler
culti
var
can
be m
inim
ized
Alte
rnat
e-ro
wX
XX
OO
OX
XX
OO
O•
Cul
tivar
s w
ith d
iffer
ent u
ses,
•D
iseas
e co
ntro
l can
be
low
erEv
alua
ted
for
effic
acy
inte
rpla
ntin
gX
XX
OO
OX
XX
OO
Ohe
ight
, and
mat
urity
can
be
mix
edth
an in
met
hods
1 a
nd 2
,ag
ains
t bl
ast
in u
plan
d ri
ce(a
ltern
atin
g se
vera
lX
XX
OO
OX
XX
OO
Oes
peci
ally
if h
ighl
y su
scep
ti-in
Lam
pung
Pro
vinc
e,ro
ws
of s
usce
ptib
leX
XX
OO
OX
XX
OO
Obl
e cu
ltiva
rs a
reIn
done
sia, u
sing
and
resis
tant
XX
XO
OO
XX
XO
OO
•Lo
dgin
g of
tal
ler
culti
var
may
be
used
susc
eptib
le m
oder
ncu
ltiva
rs)
3
sus
cept
ible
:m
inim
ized
but
pro
babl
y w
ithcu
ltiva
rs w
ith h
igh
yiel
d
3
resis
tant
low
er e
ffica
cy t
han
in m
etho
d 2
pote
ntia
l and
res
istan
ttr
aditi
onal
cul
tivar
s w
ith•
Tran
spla
ntin
g an
d ha
rves
ting
low
yie
ld p
oten
tial; i
nitia
lca
n be
labo
riou
s an
d tim
e-re
sults
sho
wed
no
cons
umin
g if
culti
vars
diff
erre
duct
ion
in n
eck
blas
tin
mat
urity
rela
tive
to m
onoc
ultu
re o
fsu
scep
tible
cul
tivar
; fut
ure
•Pr
opor
tion
of c
ultiv
ars
shou
ldtr
ials
will
con
sider
mod
ern
cons
ider
effe
ct o
n co
mpe
titio
ncu
ltiva
rs w
ith m
oder
ate
betw
een
culti
vars
that
diff
er in
susc
eptib
ility
to b
last
heig
ht a
nd m
atur
ity

11IRRN 28.2
in developing countries: overview and summary. In:Evenson RE, Gollin D, editors. Crop varietyimprovement and its effect on productivity. The impactof international agricultural research. Wallingford,Oxon: CAB International. p 7-38.
Khalifa MA, Qualset CO. 1974. Intergenotypic competitionbetween tall and dwarf wheats. I. In mechanicalmixtures. Crop Sci. 14:795-799.
Khush GS, Virk PS. 2002. Rice improvement: past, presentand future. In: Kang, MS, editor. Crop improvement:challenges in the twenty-first century. New York: FoodProducts Press. p 17-42.
Koizumi S. 2001. Rice blast control with multilines in Japan.In: Mew TW, Borromeo E, Hardy B, editors. Exploitingbiodiversity for sustainable pest management.Proceedings of the impact symposium on exploitingbiodiversity for sustainable pest management, KunmingChina, 21-23 Aug 2000. Los Baños (Philippines):International Rice Research Institute. p 143-157.
Leung H, Zhu, Y, Revilla-Molina I, Fan JX, Chen H, Pangga I,Vera Cruz C, Mew TW. 2003. Using genetic diversity toachieve sustainable rice disease management. Plant Dis.87:1156-1169.
Mundt CC. 2002. Use of multiline cultivars and cultivarmixtures for disease management. Annu. Rev.Phytopathol. 40: 381-410.
Mundt CC, Brophy LS, Schmitt ME. 1995. Choosing cropcultivars and mixtures under high versus low diseasepressure: a case study with wheat. Crop Prot. 14:509-515.
Mundt CC, Brophy LS, Kolar SC. 1996. Effect of genotypeunit number and spatial arrangement on severity ofyellow rust in wheat cultivar mixtures. Plant Pathol.45:215-222.
Mundt CC, Browning JA. 1985. Development of crown rustepidemics in genetically diverse oat populations: effectof genotype unit area. Phytopathology 75:607-610.
Petchey OL, Gaston KL. 2002. Functional diversity (FD),species richness and community composition. Ecol. Lett.5:402-411.
Willey RW. 1979. Intercropping – its importance and researchneeds. Part 1. Competition and yield advantages. FieldCrops Abstr. 32:1-10.
Wolfe MS. 1985. The current status and prospects of multilinecultivars and variety mixtures for disease resistance.Annu. Rev. Phytopathol. 23:251-273.
Zhu Y, Chen H, Fan JH, Wang Y, Li Y, Chen J, Fan JX, Yang S,Hu L, Leung H, Mew TW, Teng PS, Wang Z, Mundt CC.2000. Genetic diversity and disease control in rice.Nature 406:718-722.
○ ○ ○ ○ ○ ○ ○ ○ ○ ○ ○ ○ ○ ○ ○ ○ ○ ○ ○ ○ ○ ○ ○ ○ ○ ○ ○ ○ ○ ○
1. Authors should submit separate text and table files in MS Word.Text files should not be formatted. For text files, authors shoulduse Arial 12 points, left alignment, no justification, and double spacewith only one space between sentences and no extra space be-tween paragraphs. Table files should not be formatted as tables,but as column text blocks (using tabs to separate columns). Au-thors should use Arial 10 points, no boldface.
2. Authors should submit figures (graphs, charts, illustrations, etc.) inExcel, if possible, or the original graphics application, and not asembedded files in MS Word. Photos/images should have a resolu-tion of 300 dpi. Figures should not be smaller than 5.5 by 8.5 inches.Figures should be one to a sheet. Authors should use at least 0.5-thick pt. lines for graphs, boxes, etc., in figures.
3. Authors should make sure that no objects (graphs or charts) areembedded between text blocks. Photo files are also accepted inthe following electronic file formats: jpeg, tif, and gif. File name andtype of file must be indicated.
GUIDELINES ON SUBMITTING ELECTRONIC FILES TO IRRN
December 200312
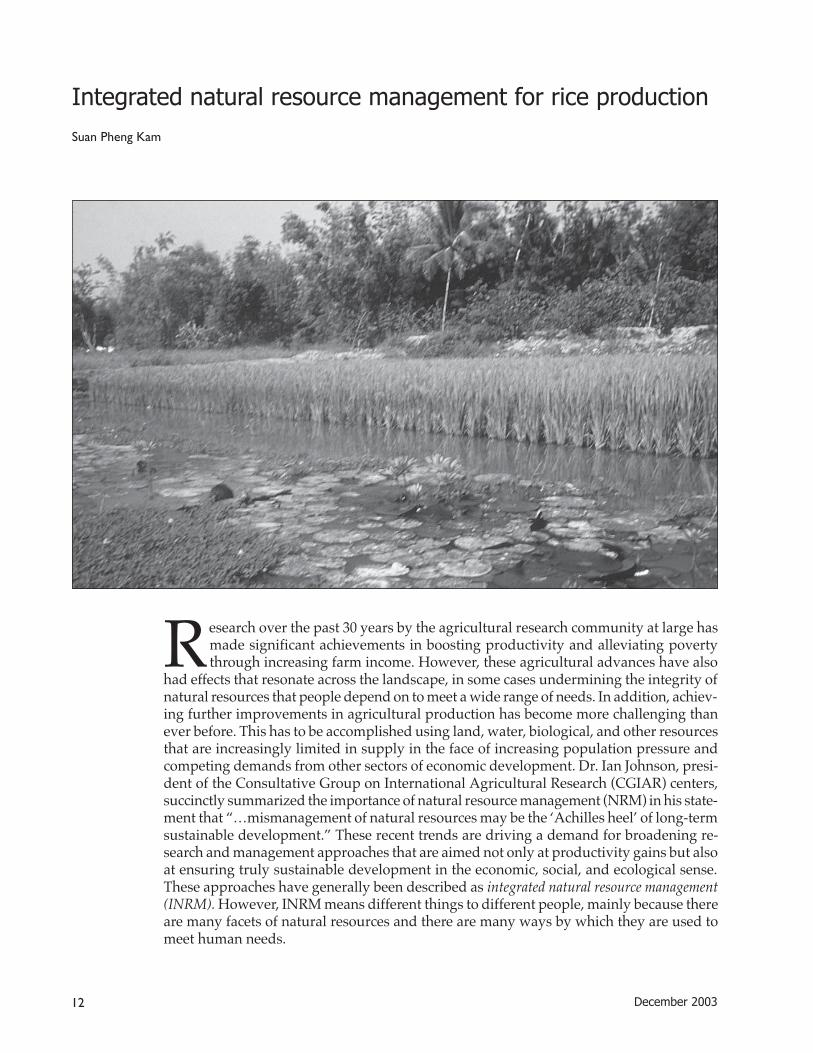
Research over the past 30 years by the agricultural research community at large hasmade significant achievements in boosting productivity and alleviating povertythrough increasing farm income. However, these agricultural advances have also
had effects that resonate across the landscape, in some cases undermining the integrity ofnatural resources that people depend on to meet a wide range of needs. In addition, achiev-ing further improvements in agricultural production has become more challenging thanever before. This has to be accomplished using land, water, biological, and other resourcesthat are increasingly limited in supply in the face of increasing population pressure andcompeting demands from other sectors of economic development. Dr. Ian Johnson, presi-dent of the Consultative Group on International Agricultural Research (CGIAR) centers,succinctly summarized the importance of natural resource management (NRM) in his state-ment that “…mismanagement of natural resources may be the ‘Achilles heel’ of long-termsustainable development.” These recent trends are driving a demand for broadening re-search and management approaches that are aimed not only at productivity gains but alsoat ensuring truly sustainable development in the economic, social, and ecological sense.These approaches have generally been described as integrated natural resource management(INRM). However, INRM means different things to different people, mainly because thereare many facets of natural resources and there are many ways by which they are used tomeet human needs.
Integrated natural resource management for rice production
Suan Pheng Kam
13IRRN 28.2
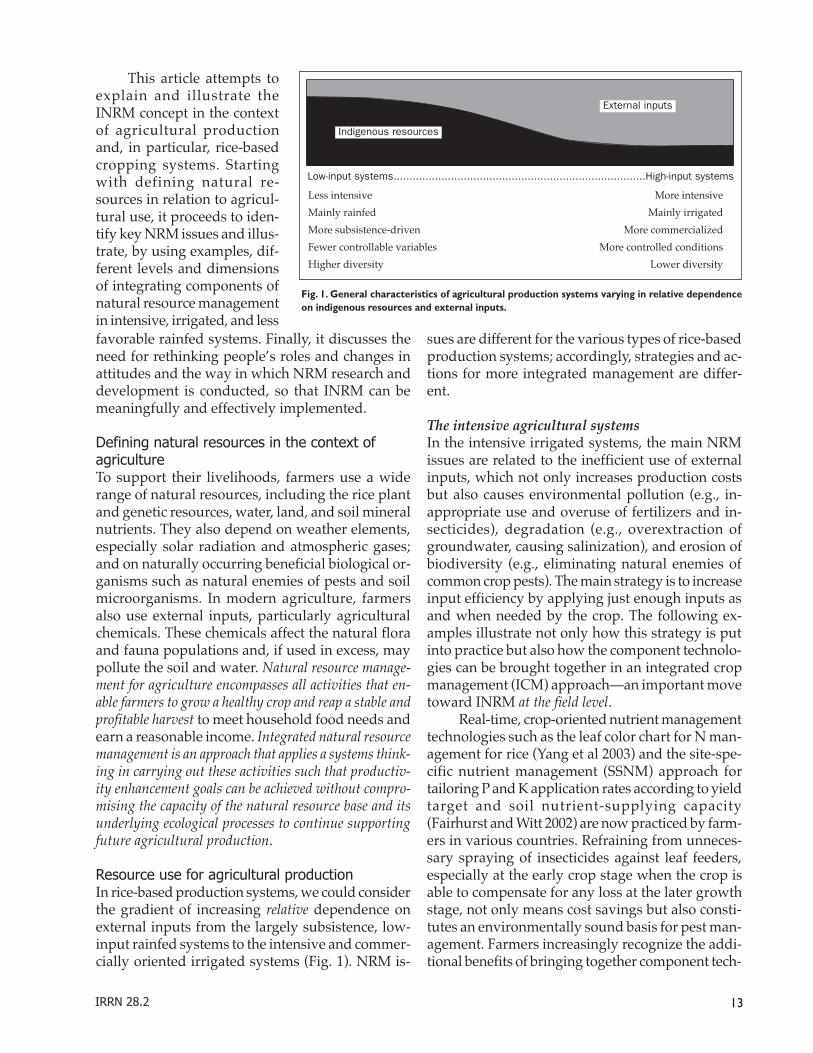
This article attempts toexplain and illustrate theINRM concept in the contextof agricultural productionand, in particular, rice-basedcropping systems. Startingwith defining natural re-sources in relation to agricul-tural use, it proceeds to iden-tify key NRM issues and illus-trate, by using examples, dif-ferent levels and dimensionsof integrating components ofnatural resource managementin intensive, irrigated, and lessfavorable rainfed systems. Finally, it discusses theneed for rethinking people’s roles and changes inattitudes and the way in which NRM research anddevelopment is conducted, so that INRM can bemeaningfully and effectively implemented.
Defining natural resources in the context ofagricultureTo support their livelihoods, farmers use a widerange of natural resources, including the rice plantand genetic resources, water, land, and soil mineralnutrients. They also depend on weather elements,especially solar radiation and atmospheric gases;and on naturally occurring beneficial biological or-ganisms such as natural enemies of pests and soilmicroorganisms. In modern agriculture, farmersalso use external inputs, particularly agriculturalchemicals. These chemicals affect the natural floraand fauna populations and, if used in excess, maypollute the soil and water. Natural resource manage-ment for agriculture encompasses all activities that en-able farmers to grow a healthy crop and reap a stable andprofitable harvest to meet household food needs andearn a reasonable income. Integrated natural resourcemanagement is an approach that applies a systems think-ing in carrying out these activities such that productiv-ity enhancement goals can be achieved without compro-mising the capacity of the natural resource base and itsunderlying ecological processes to continue supportingfuture agricultural production.
Resource use for agricultural productionIn rice-based production systems, we could considerthe gradient of increasing relative dependence onexternal inputs from the largely subsistence, low-input rainfed systems to the intensive and commer-cially oriented irrigated systems (Fig. 1). NRM is-
Fig. 1. General characteristics of agricultural production systems varying in relative dependenceon indigenous resources and external inputs.
sues are different for the various types of rice-basedproduction systems; accordingly, strategies and ac-tions for more integrated management are differ-ent.
The intensive agricultural systemsIn the intensive irrigated systems, the main NRMissues are related to the inefficient use of externalinputs, which not only increases production costsbut also causes environmental pollution (e.g., in-appropriate use and overuse of fertilizers and in-secticides), degradation (e.g., overextraction ofgroundwater, causing salinization), and erosion ofbiodiversity (e.g., eliminating natural enemies ofcommon crop pests). The main strategy is to increaseinput efficiency by applying just enough inputs asand when needed by the crop. The following ex-amples illustrate not only how this strategy is putinto practice but also how the component technolo-gies can be brought together in an integrated cropmanagement (ICM) approach—an important movetoward INRM at the field level.
Real-time, crop-oriented nutrient managementtechnologies such as the leaf color chart for N man-agement for rice (Yang et al 2003) and the site-spe-cific nutrient management (SSNM) approach fortailoring P and K application rates according to yieldtarget and soil nutrient-supplying capacity(Fairhurst and Witt 2002) are now practiced by farm-ers in various countries. Refraining from unneces-sary spraying of insecticides against leaf feeders,especially at the early crop stage when the crop isable to compensate for any loss at the later growthstage, not only means cost savings but also consti-tutes an environmentally sound basis for pest man-agement. Farmers increasingly recognize the addi-tional benefits of bringing together component tech-
Less intensive More intensive
Mainly rainfed Mainly irrigated
More subsistence-driven More commercialized
Fewer controllable variables More controlled conditions
Higher diversity Lower diversity
Indigenous resources
External inputs
Low-input systems...............................................................................High-input systems
December 200314
nologies into workable “packages.” The Vietnamexample of “Three reductions, three gains””(Box 1)illustrates the coming together of pest, nutrient, andseed management.
Three reductions, three gainsIn the Mekong River Delta of Vietnam, farmers whostarted out adopting the “no-early-spray” practice,and thereby reduced insecticide use, are now embrac-ing technologies that reduce other inputs—site-spe-cific nutrient management for reducing fertilizer useand the drum seeder for reducing the number of riceseeds used in direct sowing. This provided the impe-tus for the “Three reductions, three gains” campaignthat is now widely promoted by the Vietnamese gov-ernment. The three gains as perceived by scientistsare increased profit, improved health for humans, andbetter environment; as perceived by farmers, thesegains are increased yield, better grain quality, andmore profit. This shows that farmers have the moreimmediate productivity enhancement objective inmind. The environmental gain is more long term andof less immediate concern to farmers. Yet, if the com-bination of crop management practices that directlybenefit farmers can also benefit the environment, theoutcome is a win-win situation.
It is not difficult to conceive of ways by whichadditional components of ICM can be introduced.For example, the first line of defense against dis-ease attack is to start the crop with healthy seedsand seedlings. Relatively simple methods taught tofarmers for storing and maintaining high-qualityseed stock that they save for the next planting go along way toward improving seedling vigor. Theseed health campaign in Bangladesh and elsewherehas gained widespread adoption. The strategy ofseeking alternative, nonchemical ways of wardingoff diseases is clearly illustrated by the rapidly ex-panding practice in China of interplanting modern,high-yielding hybrid rice varieties that have highdisease (in this case, rice blast) resistance with sus-ceptible traditional taller glutinous varieties (Leunget al 2003). The crop mixture as a whole faces lowerblast incidence without need for fungicide use.There are also unexpected spin-off benefits from thisinterplanting practice. Farmers are reintroducingblast-susceptible traditional varieties that have highsociocultural and market value and are getting de-cent yields in addition to those of the modern vari-eties with which they are interplanted.
There is also a growing concern about reducedwater availability and assurance of water supply,hence the need for water-saving technologies forirrigated rice. Various management practices arenow available for a range of water constraint con-ditions. These include (1) dry direct seeding to savewater used for field preparation, at the same timesaving on labor; (2) land leveling to reduce theamount of water needed to keep fields uniformlyflooded, at the same time improving weed control;(3) alternate wetting and drying; (4) the use of raisedbeds; and (5) aerobic rice systems that progressivelyreduce the need for fully flooded fields all the time.These water-saving technologies in turn requirerather different nutrient management regimes andpest management strategies that are appropriate forthe shifts in weed flora composition and pest pro-files resulting from changes in water regime in therice field. This calls for not only more dimensionsof integration in crop management at the field levelbut also matching ICM with improved crop varietiesthat are better adapted to conditions of reducedwater availability.
It is also not difficult to conceive that the INRMapproach can be extended beyond the rice crop andbeyond the field and farm levels, particularly as natu-ral resources are used over and over again and theirflows and processes cover geographical scales largerthan a farmer’s field plot. Many agricultural areasare increasingly undergoing more intensified anddiversified use, and proper management of thenatural resources becomes even more critical if theseproduction systems are to be sustained.
For example, millions of hectares in South andEast Asia are grown to rice in the monsoon season,followed by wheat in the winter season. To improvethe overall productivity of this rice-wheat system,management interventions for the rice crop cannotbe made in isolation from interventions for thewheat crop. Hence, the efforts of the Rice-WheatConsortium (http://www.rwc-prism.cgiar.org/rwc/index.asp), a research network of South Asiannational agricultural research and extension sys-tems, are increasingly focused on attaining bettersynergies in more efficient nutrient and water man-agement strategies for the rice and wheat (or other)crops in tandem (Ladha et al 2003).
The diverse rainfed systemsManaging diversified cropping systems is evenmore challenging under rainfed conditions, whenthe time period for cultivation is restricted, espe-
15IRRN 28.2
cially in areas with climatic constraints. Generally,the lower input, rainfed systems are heavily depen-dent on and driven by the availability (in location,quantity, and time) of natural resources. Here, themain NRM issues are related to various productiv-ity constraints (too much water, too little water,poor-quality water and soil, steep terrain), greateruncertainty in supply (and therefore higher risk tofarmers), and limited windows of opportunity foragricultural production. Particularly in the less fa-vorable and more fragile rainfed environments,such as areas prone to soil and water degradation,it is easy to tip the delicate ecological balancesthrough mismanagement and very difficult to re-store these checks and balances that are so impor-tant for long-term sustainable use of the natural re-sources. These are also areas where the poorer farm-ers are concentrated. These farmers mainly prac-tice subsistence farming and have limited resourcesat their disposal to improve their livelihoods, muchless to concern themselves with the long-term en-vironmental consequences of their present activi-ties.
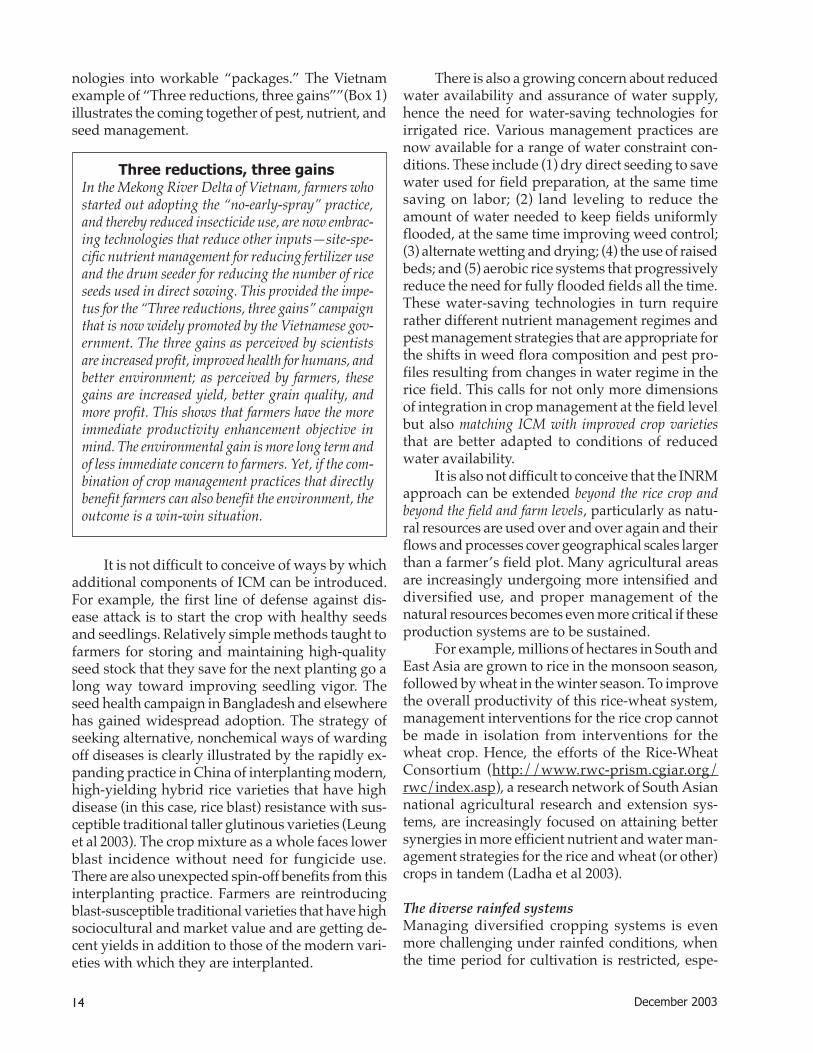
Under these circumstances, the main strategyis to help farmers effectively use (and expand wherepossible) their windows of opportunity for foodproduction to meet their immediate householdneeds (“fill their rice bowls”), in ways that can in-crementally release resources for them to diversifytheir income-generating activities (Fig. 2). The cir-cumstances are quite varied, making NRM for ag-ricultural development in rainfed environmentsparticularly challenging—hence an even greaterneed for integrated approaches, as single interven-tions are not likely to have much real impact. As inthe case of the irrigated systems, there can be sev-eral scales of integration in NRM. Managing these
Fig. 2. An exit path from food insecurity, poverty, and environmental degradation.
results in (farmers’ concern)
Improving household food security and enhancing livelihoods
whichfurtherenhances
while
Releasing resources todiversity
for
Protecting the environment andConserving biodiversity
Generating farm income as well as
Enhancing household resources foroff-farm employment
whichcontributes
to
Rice as the entry point:Increasing rice productivity
allowing for
resources judiciously requires practices and actionsthat are at and beyond the field/farm to the land-scape level, and beyond the household to the com-munity.
At the field level, there is still considerable scopefor crop management interventions to improve cropproductivity, particularly in areas where technolo-gies targeted for favorable conditions are not suited.Much more attention needs to be placed on the in-fluence that water availability (and quality, in somecases) and its management have on other aspectsof crop management, including establishing thecrop, applying nutrients, and controlling weeds andpests. Integrated crop management is even morecritically needed for rainfed systems.
Recent advances in biotechnology to comple-ment conventional breeding are opening up oppor-tunities for incorporating traits that make the riceplant, including popularly grown varieties, betteradapted to adverse environmental conditions. Theemergence of well-adapted varieties—e.g., for sub-mergence and salinity tolerance—will happen fasterthan ever before with such concerted efforts for cropimprovement. These developments must be accom-panied by equally concerted efforts to developmatching crop management practices that will helprealize the full potential of the improvedgermplasm. This calls for integration between ICMand crop improvement.
Because rainfed production systems (espe-cially the predominantly subsistence types) tend tobe more diversified, farmers try to manage andspread their limited resources over a range of farmactivities. Therefore, crop management strategiesneed to consider the total resources at the disposalof the farm household and ways of optimizing theiruse within a cropping system, rather than a par-
ticular crop or season. Many ofthe improved varieties tar-geted for less favorable rainfedconditions are also of shortergrowth duration, hence reduc-ing the period that the rice cropoccupies the field and allowingfor a tandem crop to be accom-modated within the availabletime window suitable for crop-ping. Appropriate crop estab-lishment (e.g., direct seedinginstead of transplanting) andmanagement practices (e.g.,water harvesting and soil
December 200316
moisture conservation) can further stretch and op-timize the time and resource use in favor of intensi-fying agricultural production under rainfed condi-tions. It has been shown that even managing theland in fallow, between cropping seasons, can ben-efit the environment and improve the income offarmers.
Integration at the landscape level is importantin managing natural resources in rainfed systemsthat are heavily dependent on natural resourcestocks and flows (e.g., of water and nutrients), es-pecially if these are limiting. A recently completedproject in Bac Lieu Province in the Mekong RiverDelta in Vietnam (see Box 2) illustrates the relevanceof applying an INRM approach at the regional levelfor effective and sustainable land and water re-source management for both rice- and brackishwater shrimp-based production systems in thecoastal lands that are partially protected from sa-linity intrusion (Tuong et al 2003).
While there is a compelling ecological basis formanaging natural resources beyond the field andfarm levels, this would also directly benefit farm-ing communities and farmers who use and man-age resources across different landscape positions.Interactions across the landscape or toposequencebecome more significant for NRM in hilly andmountainous areas, especially where the fragile eco-systems are being transformed and subjected tomore intensive use because of increasing popula-tion pressure. There have been successful attemptsat conservation-friendly alternatives to shortenedslash-and-burn cultivation cycles (Sanchez andHailu 1996, Husson et al 2001), and an active con-sortium of research organizations, the Consortiumfor Alternatives to Slash and Burn, is devoted topromoting these alternatives (http://www.asb.cgiar.org/txt_only/home.htm). However,successes are still limited relative to the extent ofthe problem of unsustainable agricultural develop-ment in the uplands across all continents.
Recent transformations in upland agriculturein southwestern Yunnan Province in China (see Box3) illustrate how it takes a chain of interventionsintroduced at several levels to achieve widespreadimpact of sound NRM practices that bring aboutimproved livelihoods and more rational land andresource use. The success of the Yunnan case maynot be directly prescriptive of all upland areas suf-fering from nonsustainable land use. Moreover,there is room for further improving the entire sys-tem, and its components, to ensure long-term
sustainability. Nonetheless, this is a real case ex-ample of the strategy depicted in Figure 2. It illus-trates the need for technology advancement to besupported by appropriate policy intervention andeffectively adopted through community action andprivate-sector participation.
Managing water and land resources atthe interface between fresh and salinewater environments
About 160,000 ha of coastal lands in Bac Lieu Provincein the Mekong River Delta of Vietnam were targeted inthe late 1980s for complete salinity protection to allowintensified rice production. However, while the sluice con-struction progressed in the 1990s, an emerging enterpriseof brackish water shrimp pond culture and changingmarket conditions (fall in world rice price and boost inshrimp exports) resulted in two main production sys-tems—intensified rice-based farming in the eastern, fullyprotected part, and shrimp-based aquaculture in the west-ern yet-to-be protected part. The two systems had con-flicting demands for fresh and brackish water. The con-flict escalated in 2000 when affected shrimp farmersbreached embankments to access saline water, promptinga reconsideration of the 1980s land-use policy. The key toturning around a situation of conflict to one that accom-modates both needs lies in reconfiguring the operation ofthe sluice gates to manage a dual brackish-fresh-waterregime. This was achieved with the help of a hydraulicmodel, refined under an IRRI-led, DFID-funded project,to explore scenarios of sluice operation that allow care-fully controlled entry of saline water to the western partfor shrimp raising during the dry season, followed byflushing out using fresh water at the start of the rainyseason for rice cultivation. Using evidence produced bythe project on the impact of the salinity control scheme onrural livelihoods, particularly of the poor, the provincialgovernment obtained national approval for changing theland-use policy, thus paving the way for more diversifieduse of the fresh and brackish water resources for liveli-hood improvement. With this, more targeted natural re-source management interventions can be developed forproductivity improvement of the various components ofthe rice- and shrimp-based production systems at the farmand field levels. Further investigation is also needed toaddress sustainability issues of this managed system—e.g., impact on aquatic biodiversity and linkage with in-land capture fisheries.
17IRRN 28.2
Managing people to managethe natural resourcesTo have impact, research for NRM must involve theultimate users—the farmers—and also other stake-holders who can potentially help or influence whatfarmers do. These include local authorities, exten-sion personnel, development NGOs, and the agri-cultural private sector and policymakers. INRM asan approach has to be woven into the fabric of in-teractions among researchers and these variousstakeholder groups. Hence, the INRM approach isespecially amenable to participatory modes in con-ducting research and management. There is now
Agricultural development in the up-lands of Yunnan Province, China
Over the past 4–5 years, a chain of events causedsome dramatic transformations in the uplands ofwestern Yunnan Province, where nonsustainableuse of the sloping land, especially for extensive cul-tivation of low-yielding upland rice by mainly poorethnic populations, used to be prevalent. A team ofscientists from the Yunnan Academy of Agricul-tural Sciences successfully developed high-yieldingupland rice varieties that yield substantially higherthan the traditional varieties, albeit with higher in-put levels. These facultative upland varieties yieldeven higher under terraced conditions, with theavailability of bunded water later in the growingseason. These yield gains enable domestic rice re-quirements to be met with less land, reduced soilerosion, and improved water-use efficiency. Thisprompted the provincial government, with subse-quent approval of the central government, to for-mulate land-use policies that (1) disallow unbundedupland rice cultivation on slopes exceeding 25°, (2)set quotas of per capita rice land deemed sufficientto fulfill household rice security at the improvedyield levels, and (3) rehabilitate sloping lands re-leased from upland rice cultivation ultimately toforest. Local agricultural development and exten-sion agencies were brought in to promote croppingand livestock diversification programs. The privatesector was also called upon to support the inputsupply and commodity marketing chain. Overall,there have been impressive improvements in the live-lihoods and living conditions in the participatingvillages across more than 10 counties in the south-west region of the province.
available a wide range of participatory methodolo-gies and tools that researchers and extension per-sonnel can use to engage more active involvementof farmers, communities, policymakers, etc., inNRM activities and decision making at various spa-tial and social scales.
ConclusionsThe descriptions above of several instances involv-ing varying levels of integration in managing natu-ral resources for agricultural production illustratethat INRM can be a living concept that isimplementable to serve the goals of sustainabledevelopment. The examples also show that INRMdoes not need to be all-embracing in integratingeverything. Rather, it makes better sense in realityto integrate only those additional aspects, stake-holders, or scales that can reasonably be expectedto have an influence in solving the problem at hand.INRM may be centered on specific technologies thatopen up opportunities for improved resource man-agement, as illustrated by the Yunnan case, or it mayembrace broader natural resource managementstrategies, as in the Bac Lieu example. INRM asdescribed here is more a changed approach to re-search and management rather than a prescribedset of methodologies.
Nevertheless, there have to be certain elementsor conditions that together engender this change inapproach.
• It requires a systems thinking to articulatea common understanding of the problem athand, so that attention is placed on tacklingnot only components of the problem butalso the interactions among them that mayhave profound influence on the success ofindividual technologies. A multidisciplinaryrepresentation at the problem identificationstage allows researchers and target stake-holders to “see” beyond one’s sphere of ex-perience. A group of people arriving at acommon understanding of the problem mayhave different motivations, mandates, andcapacity to tackle it or aspects of it; what isimportant is that they do so, knowing howthey can collectively contribute to solvingthe problem at hand.
• Integration is necessarily achieved by incre-ments. Partnerships cannot be forced, norcan all aspects of integration be preplanned.Many successful INRM cases often did noteven start off as being purposefully integra-

December 200318
tive. What matters is that when some inter-vention makes headway, the opportunitiesto enhance its impact are recognized andseized upon.
• In the long run, there needs to be a changein the prevailing, largely sectoral R&D cul-ture and organizational arrangements to-ward a more integrative outlook and mode.Incremental reinforcements of the benefitsof integrative efforts over some period oftime can help change mind sets. This againis a process that cannot be forced, but hasto be allowed time to develop and evolve atall levels of the R&D organization.
In the long process of engendering change, anattempt to modify existing research and develop-ment efforts to achieve higher levels of integrationincrementally does, on balance, seem to be a sen-sible thing to do. The sharing of successful INRMcase studies helps not only in transferring the tan-gible knowledge and products but also in broaden-ing minds and perspectives that INRM approachescan, and do, work.
ReferencesFairhurst TH, Witt C (editors). 2002. Rice: a practical guide to
nutrient management. PPI-IRRI. 136 p.Husson O, Lienhard P, Seguy L, Tuan HD, Doanh LQ. 2001.
Development of direct sowing and mulching techniquesas alternatives to slash-and-burn systems in northernVietnam. Paper presented at the World Congress onConservation Agriculture, 1-5 Oct 2001, Madrid.
Ladha JK, Hill JE, Duxbury JD, Gupta RK, Buresh RJ(editors). 2003. Improving the productivity andsustainability of rice-wheat systems: issues and impact.American Society of Agronomy Spec. Publ. 65. Madison,WI (USA): ASA, CSSA, SSSA. 211 p.
Leung H, Zhu Y, Revilla-Molina I, Fan JX, Chen H, Pangga I,Vera Cruz C, Mew TW. 2003. Using genetic diversity toachieve sustainable rice disease management. Plant Dis.87(10):1156-1169.
Sanchez PA, Hailu M (editors). 1996. Alternatives to slash-and-burn agriculture. Agric. Ecosyst. Environ. 58(1):1-86.
Tuong TP, Kam SP, Hoanh CT, Dung LC, Khiem NT, Barr J,Ben DC. 2003. Impact of seawater intrusion control onthe environment, land use and household incomes in acoastal area. Paddy Water Environ. 1:65-73.
Yang WH, Peng S, Huang J, Sanico AL, Buresh RJ, Witt C.2003. Using leaf color charts to estimate leaf nitrogenstatus of rice. Agron. J. 95:212-217.
○ ○ ○ ○ ○ ○ ○ ○ ○ ○ ○ ○ ○ ○ ○ ○ ○ ○ ○ ○ ○ ○ ○ ○ ○ ○ ○ ○ ○ ○
• What is eLearning?
• Is eLearning aseffective as face-to-faceinstruction?
• What are theeconomics ofeLearning?
• What are theadvantages ofeLearning?
• How do you ensure theproper design andeffectiveness of youreLearning?
For more information, [email protected] or visit the eLearning
for Development course at
http://www.knowledgebank.irri.org
19IRRN 28.2
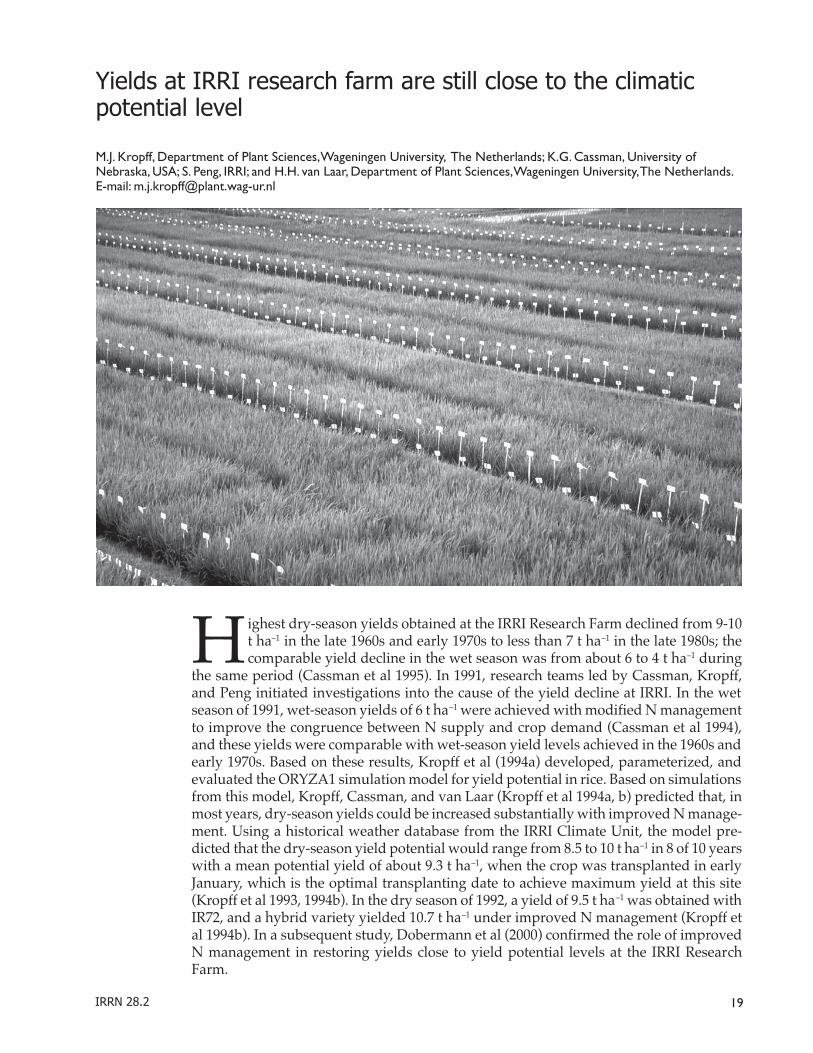
Highest dry-season yields obtained at the IRRI Research Farm declined from 9-10t ha–1 in the late 1960s and early 1970s to less than 7 t ha–1 in the late 1980s; thecomparable yield decline in the wet season was from about 6 to 4 t ha–1 during
the same period (Cassman et al 1995). In 1991, research teams led by Cassman, Kropff,and Peng initiated investigations into the cause of the yield decline at IRRI. In the wetseason of 1991, wet-season yields of 6 t ha–1 were achieved with modified N managementto improve the congruence between N supply and crop demand (Cassman et al 1994),and these yields were comparable with wet-season yield levels achieved in the 1960s andearly 1970s. Based on these results, Kropff et al (1994a) developed, parameterized, andevaluated the ORYZA1 simulation model for yield potential in rice. Based on simulationsfrom this model, Kropff, Cassman, and van Laar (Kropff et al 1994a, b) predicted that, inmost years, dry-season yields could be increased substantially with improved N manage-ment. Using a historical weather database from the IRRI Climate Unit, the model pre-dicted that the dry-season yield potential would range from 8.5 to 10 t ha–1 in 8 of 10 yearswith a mean potential yield of about 9.3 t ha–1, when the crop was transplanted in earlyJanuary, which is the optimal transplanting date to achieve maximum yield at this site(Kropff et al 1993, 1994b). In the dry season of 1992, a yield of 9.5 t ha–1 was obtained withIR72, and a hybrid variety yielded 10.7 t ha–1 under improved N management (Kropff etal 1994b). In a subsequent study, Dobermann et al (2000) confirmed the role of improvedN management in restoring yields close to yield potential levels at the IRRI ResearchFarm.
Yields at IRRI research farm are still close to the climaticpotential level
M.J. Kropff, Department of Plant Sciences, Wageningen University, The Netherlands; K.G. Cassman, University ofNebraska, USA; S. Peng, IRRI; and H.H. van Laar, Department of Plant Sciences, Wageningen University, The Netherlands.E-mail: [email protected]
December 200320
Since 1992, maximum dry-season rice yieldsof IR72 at the IRRI Farm have ranged from 9.03 to9.58 t ha–1 under the optimum crop managementsystems (Peng et al 2003). In the dry seasons from1998 to 2001, however, highest yields of IR72 were17% lower than that in the 1992-98 period. Regres-sion of yield on several climate variables was usedto help identify the causes of this decline. It wasconcluded that the most likely causes for the reduc-tion in maximum yield obtained in the 1999-2001period, compared with yield levels achieved in1992-98, were lower solar radiation and highernighttime temperature. Both higher night tempera-ture and less solar radiation would result in a re-duction in net C assimilation rates: the former be-cause of increased rates of maintenance respirationand the latter because of a decrease in photosyn-thetic rates. Pathak et al (2003) also reported thatthe decrease in solar radiation and increase in mini-mum temperature were responsible for the nega-tive yield trends of the rice crop from 1985 to 2000in the Indo-Gangetic Plain. The objectives of thispaper were to demonstrate the effect of improvedcrop management since 1992 on yield potential atthe IRRI Research Farm and to determine if the ob-served yield decline during 1998-2001 can be ex-plained by changes in solar radiation and nighttimetemperature using a well-validated ecophysiologi-cal simulation model.
MethodsThe ORYZA1 model (Kropff et al 1994a) was usedto estimate rice yield potential in the dry season atthe IRRI Research Farm from 1980 to 2001 based onactual climate data from planting to maturity. Here,we define yield potential as the yield that can beachieved with an adapted rice cultivar when grownwithout limitations from water, nutrients, or pests.Parameter values used in these simulations werebased on values derived for IR72 from the 1992 dry-season experiments as described by Kropff et al(1994a, b). Comparisons of simulated and actualyields were based on the yield of best entry in along-term continuous cropping experiment from1979 to 2001 at the IRRI Research Farm (Dobermannet al 2000) and the highest recorded yields of IR72in replicated agronomic trials under the optimumcrop management systems at the IRRI ResearchFarm for the 1992-2001 period as reported by Penget al (2003).
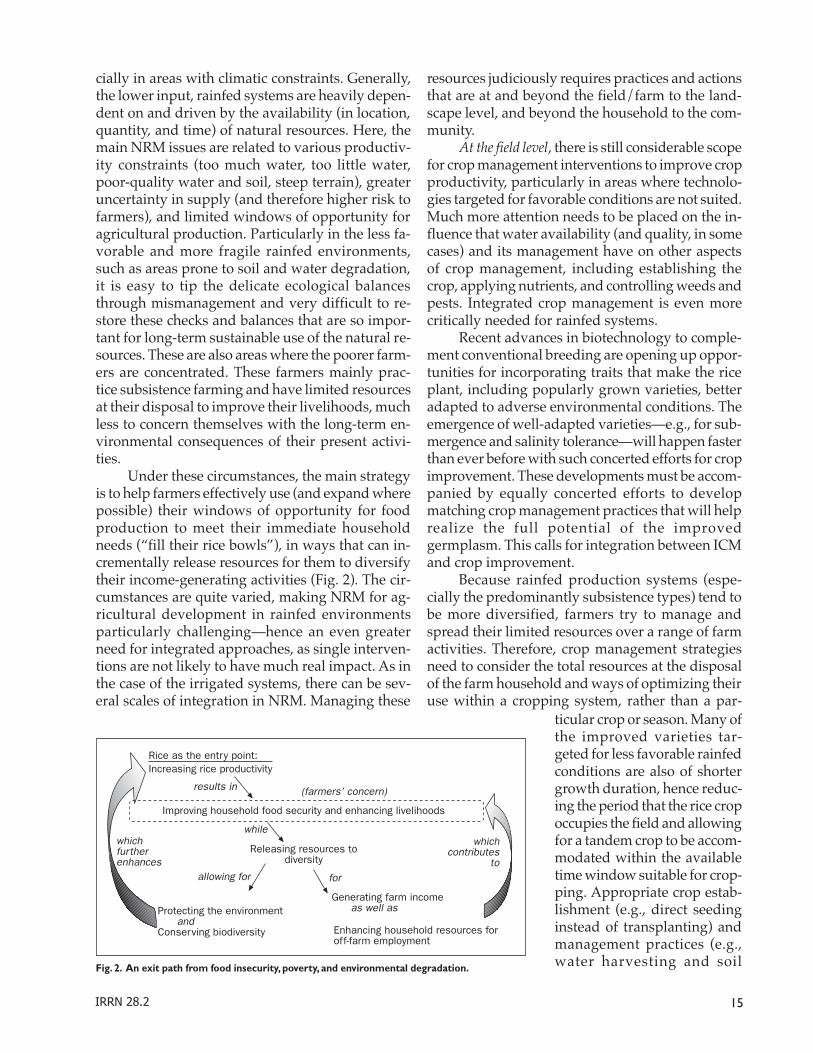
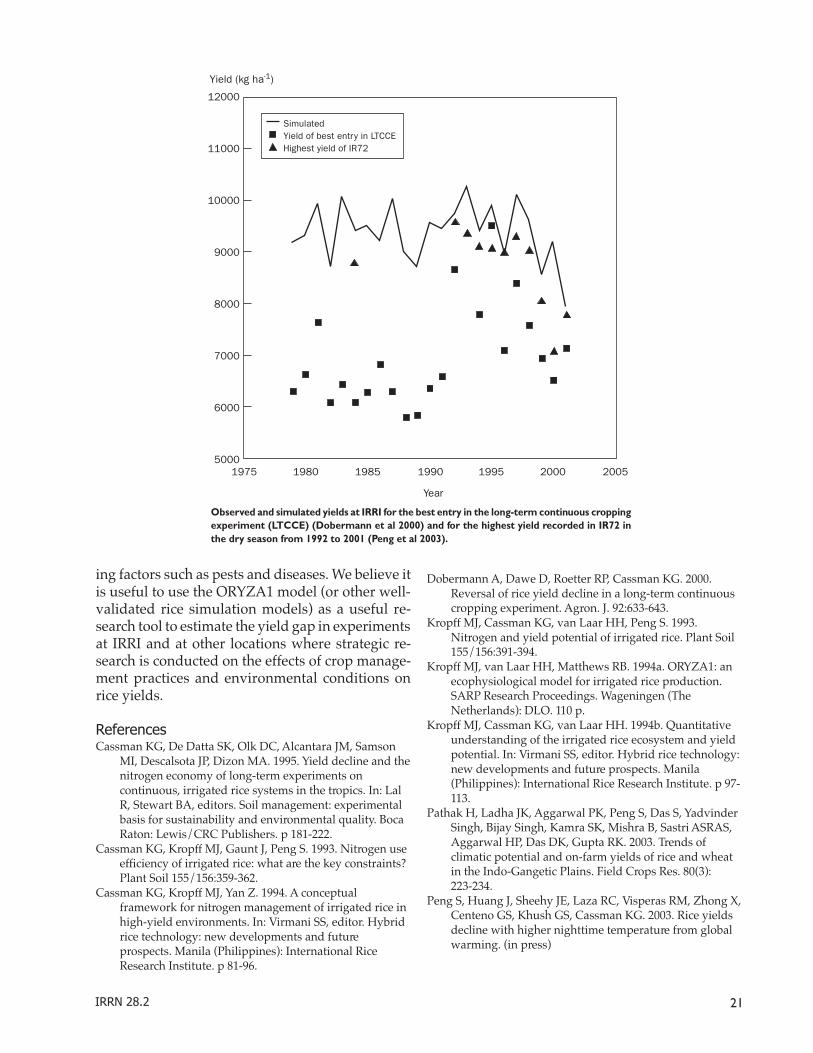
ResultsThe simulation results based on the actual data ofsolar radiation and temperature for the period 1979-2001 clearly indicate the large yield gap of about 3 tha–1 between potential dry-season yield and theyield of the best entry in the long-term continuouscropping experiment at the IRRI Research Farmbefore 1992 (see figure). In contrast, the simulatedyield potential is much closer to the best entry yieldin the long-term continuous cropping experimentfrom 1992 to 2001. The average difference betweensimulated potential yield and the yield of best en-try in the long-term continuous cropping experi-ment was about 1.5 t ha-1 from 1992 to 2001. How-ever, the average difference between simulated po-tential yield and the highest recorded yields of IR72grown in replicated agronomic trials under opti-mum crop management systems at the IRRI Re-search Farm was about 0.6 t ha–1 for 1992-2001 (seefigure). These results suggest that improved cropmanagment has effectively closed the yield gap be-tween simulated potential yield and actual yield.In 1992, 1994, 1996, and 2001, the model estimatedthe yield potential of IR72 very accurately. Themodel also simulates the variation in yield overyears very well.
The smaller yield potential in the 1998-2001period is also evident in the simulations (see fig-ure). The highest yield of IR72 in the 1998-2001 pe-riod was reduced by 17% compared with the high-est yield of IR72 in the 1992-97 period. The simula-tion model estimated that the climatic yield poten-tial in 1998-2001 was, on average, 12% lower thanthe yield potential in 1992-97. Therefore, the recentdecline trend in grain yield at the IRRI ResearchFarm was not related to crop management or vari-etal performance. Reduced solar radiation and in-creased nighttime temperature were mainly respon-sible for the yield decline. Furthermore, yields atthe IRRI Research Farm are still close to the climaticpotential level.
ConclusionThe trends in the highest actual yield of irrigatedrice obtained at the IRRI Farm since 1992 can be wellexplained by the ecophysiological model ORYZA1for potential production. Before 1992, there was anobvious yield gap of 3 t ha–1 between potential andactual yields, which apparently resulted from Nlimitation (Cassman et al 1993, Kropff et al 1993,Dobermann et al 2000). A much smaller yield gapwas observed in recent 10 years after 1992, whichapparently resulted from the effects of yield-reduc-
21IRRN 28.2
ing factors such as pests and diseases. We believe itis useful to use the ORYZA1 model (or other well-validated rice simulation models) as a useful re-search tool to estimate the yield gap in experimentsat IRRI and at other locations where strategic re-search is conducted on the effects of crop manage-ment practices and environmental conditions onrice yields.
ReferencesCassman KG, De Datta SK, Olk DC, Alcantara JM, Samson
MI, Descalsota JP, Dizon MA. 1995. Yield decline and thenitrogen economy of long-term experiments oncontinuous, irrigated rice systems in the tropics. In: LalR, Stewart BA, editors. Soil management: experimentalbasis for sustainability and environmental quality. BocaRaton: Lewis/CRC Publishers. p 181-222.
Cassman KG, Kropff MJ, Gaunt J, Peng S. 1993. Nitrogen useefficiency of irrigated rice: what are the key constraints?Plant Soil 155/156:359-362.
Cassman KG, Kropff MJ, Yan Z. 1994. A conceptualframework for nitrogen management of irrigated rice inhigh-yield environments. In: Virmani SS, editor. Hybridrice technology: new developments and futureprospects. Manila (Philippines): International RiceResearch Institute. p 81-96.
Observed and simulated yields at IRRI for the best entry in the long-term continuous croppingexperiment (LTCCE) (Dobermann et al 2000) and for the highest yield recorded in IR72 inthe dry season from 1992 to 2001 (Peng et al 2003).
12000
11000
10000
9000
8000
7000
6000
50001975 1980 1985 1990 1995 2000 2005
Year
Yield (kg ha-1)
SimulatedYield of best entry in LTCCEHighest yield of IR72
Dobermann A, Dawe D, Roetter RP, Cassman KG. 2000.Reversal of rice yield decline in a long-term continuouscropping experiment. Agron. J. 92:633-643.
Kropff MJ, Cassman KG, van Laar HH, Peng S. 1993.Nitrogen and yield potential of irrigated rice. Plant Soil155/156:391-394.
Kropff MJ, van Laar HH, Matthews RB. 1994a. ORYZA1: anecophysiological model for irrigated rice production.SARP Research Proceedings. Wageningen (TheNetherlands): DLO. 110 p.
Kropff MJ, Cassman KG, van Laar HH. 1994b. Quantitativeunderstanding of the irrigated rice ecosystem and yieldpotential. In: Virmani SS, editor. Hybrid rice technology:new developments and future prospects. Manila(Philippines): International Rice Research Institute. p 97-113.
Pathak H, Ladha JK, Aggarwal PK, Peng S, Das S, YadvinderSingh, Bijay Singh, Kamra SK, Mishra B, Sastri ASRAS,Aggarwal HP, Das DK, Gupta RK. 2003. Trends ofclimatic potential and on-farm yields of rice and wheatin the Indo-Gangetic Plains. Field Crops Res. 80(3):223-234.
Peng S, Huang J, Sheehy JE, Laza RC, Visperas RM, Zhong X,Centeno GS, Khush GS, Cassman KG. 2003. Rice yieldsdecline with higher nighttime temperature from globalwarming. (in press)
22 December 2003
Plant breeding
The whitebacked planthopper(WBPH), Sogatella furcifera(Horvath), is a serious insect pestthat causes severe yield losses inrice-growing areas in tropicalAsia. Through classical geneticanalysis, six major genes confer-ring resistance to WBPH havebeen discovered in ricegermplasm: Wbph1, Wbph2,Wbph3, wbph4, Wbph5 (Khush andBrar 1991), and Wbph6(t) (Ma etal 2001). Using molecular mark-ers, Wbph1 and Wbph6(t) havebeen located in linkage groups 7(McCouch 1990) and 11 (Ma et al2001), respectively. In addition tothese major genes, quantitativetrait loci (QTLs) associated withquantitative resistance to WBPHhave also been mapped acrossrice mapping populations. A ma-jor QTL for tolerance for WBPHwas mapped on linkage group 11in a doubled-haploid (DH) map-ping population derived fromIR64/Azucena (Kadirvel et al1999). A major QTL for antibiosisbased on ovicidal response wasdetected on linkage group 8 in arecombinant inbred population(RIL) derived from Asominori/IR24 (Yamasaki et al 1999). Twomore QTLs for ovicidal responseof WBPH were detected in a DHpopulation derived fromZaiyeging 8/Zing 17 (Sogawa etal 2001). The search for QTLs con-ferring resistance to WBPH acrossmapping populations would helpbreeding programs develop cul-
Detection of simple sequence repeat markersassociated with resistance to whitebackedplanthopper, Sogatella furcifera (Horvath), in rice
P. Kadirvel, Centre for Plant Breeding and Genetics; M. Maheswaran, Centre for Plant Molecular Biology;K. Gunathilagaraj, Department of Entomology, Tamil Nadu Agricultural University, Coimbatore 641003,India
tivars with durable resistance toWBPH. Here we report our at-tempt to detect simple sequencerepeat (SSR) markers associatedwith quantitative resistance toWBPH involving an F3 popula-tion derived from a cross betweenBasmati 370 and ASD16.
For a phenotyping experi-ment, WBPH was mass-reared onsusceptible rice variety TaichungNative 1 (TN1) following themethod of Heinrichs et al (1985).A total of 262 F3 families ofBasmati 370/ASD16 werescreened along with their parentsat the seedling level using thestandard seedbox screening test(SSST) (Heinrichs et al 1985). Va-rieties TN1 and PTB33 were usedas susceptible and resistantchecks, respectively.
In brief, 30 pregerminatedseeds of each F3 family were sown3 cm apart in 50-cm rows in 50 ×50 × 10 cm3 wooden boxes. Onerow each of susceptible checkTN1 and resistant check PTB33were sown at random in all theseed boxes. Ten days after sow-ing (DAS), the seedlings were in-fested with first- to third-instarnymphs of WBPH at the rate ofapproximately five to eightnymphs per seedling. After infes-tation, the wooden seed boxeswith seedlings were covered withwire mesh wooden cages. The testplants were observed daily fordamage by WBPH. Damage rat-ing of the test lines was done on
an individual plant basis when90% of the plants in the suscep-tible check row were killed. Thetest lines were graded using theStandard Evaluation System for Rice(SES) scale (IRRI 1996).
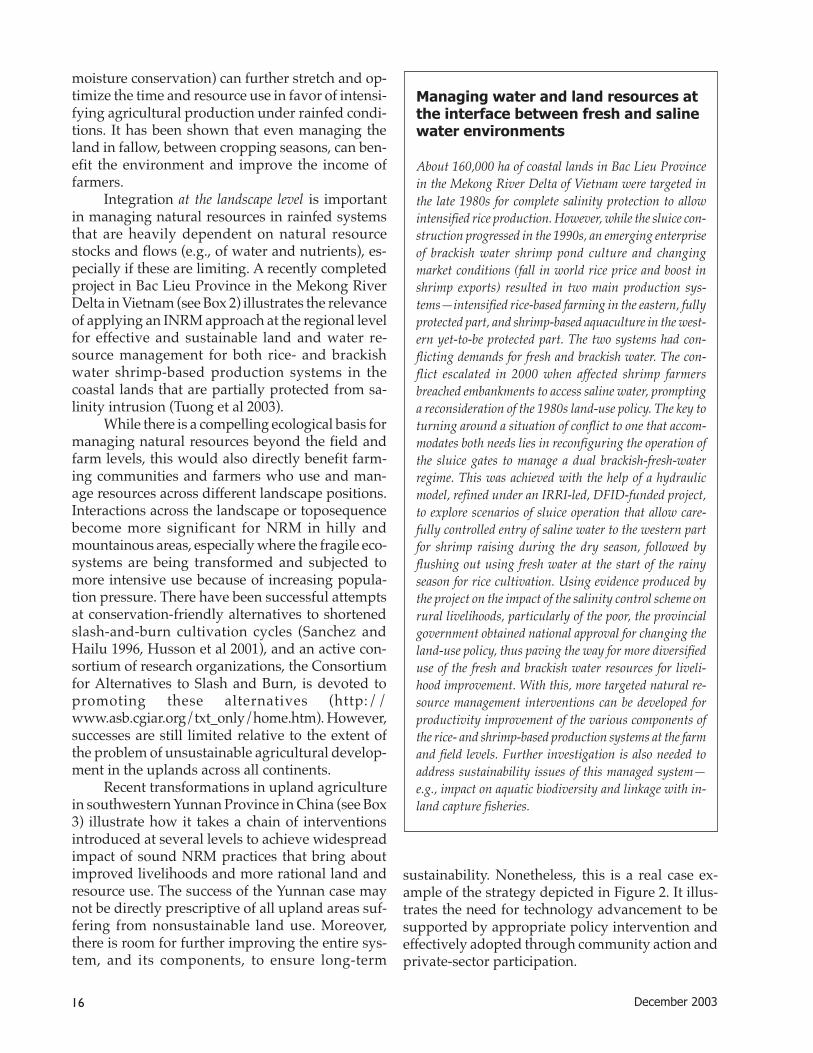
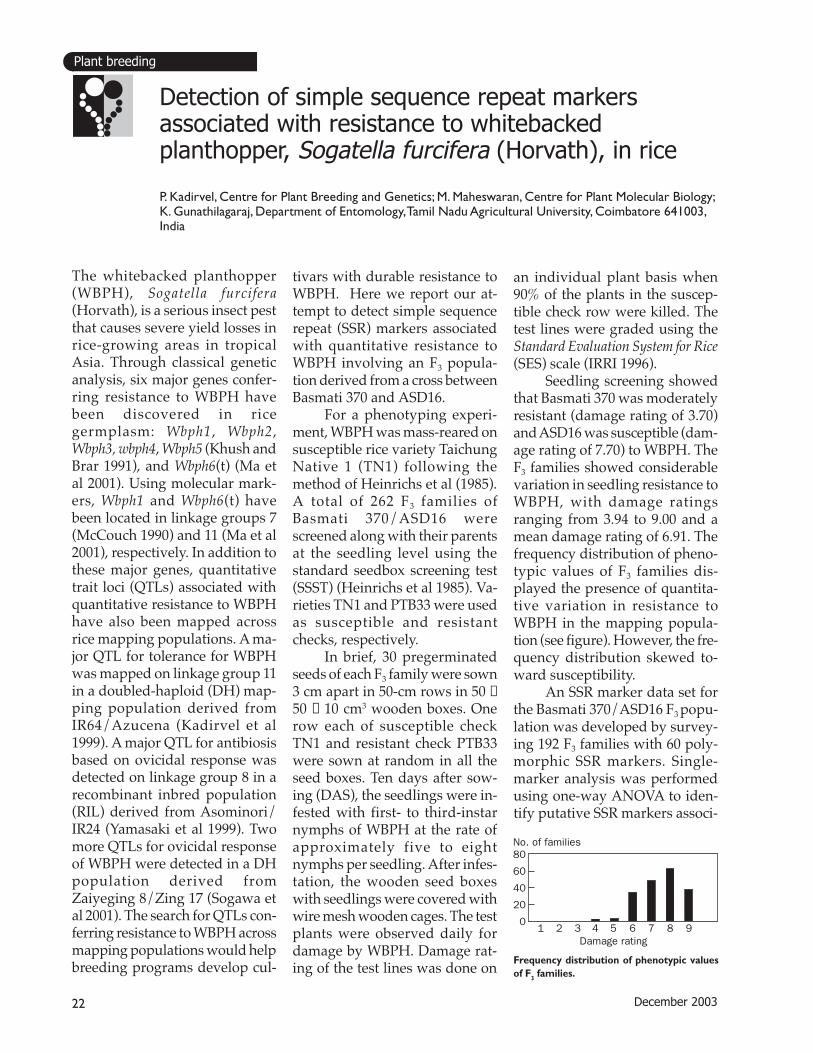
Seedling screening showedthat Basmati 370 was moderatelyresistant (damage rating of 3.70)and ASD16 was susceptible (dam-age rating of 7.70) to WBPH. TheF3 families showed considerablevariation in seedling resistance toWBPH, with damage ratingsranging from 3.94 to 9.00 and amean damage rating of 6.91. Thefrequency distribution of pheno-typic values of F3 families dis-played the presence of quantita-tive variation in resistance toWBPH in the mapping popula-tion (see figure). However, the fre-quency distribution skewed to-ward susceptibility.
An SSR marker data set forthe Basmati 370/ASD16 F3 popu-lation was developed by survey-ing 192 F3 families with 60 poly-morphic SSR markers. Single-marker analysis was performedusing one-way ANOVA to iden-tify putative SSR markers associ-
80
60
40
20
01 2 3 4 5 6 7 8 9
No. of families
Damage rating
Frequency distribution of phenotypic valuesof F3 families.
23IRRN 28.2
ated with resistance to WBPHusing marker-phenotypic datafrom 192 out of 262 F3 families.Marker trait association revealedthat 6 out of 60 polymorphic SSRmarkers had association with re-sistance to WBPH in this mappingpopulation. The identified mark-ers were RM282 (linkage group3), RM178 (linkage group 5),RM2, RM248, and RM351 (link-age group 7), and RM313 (linkagegroup 12) (Table 1). Two-way in-teractions between the putativeSSR markers were tested usingthe SAS package (SAS 1985) andthe interacting marker pairs—RM2/RM282 and RM248/RM282—were identified (Table2). Based on the association ofthese putative SSR markers withWBPH resistance, we could estab-lish the possibility of QTLs forWBPH resistance on linkagegroups 3, 5, 7, and 12. The two-way interaction analysis indi-cated a possible epistatic interac-tion between the QTLs identifiedon linkage groups 3 (RM282) and7 (RM248). We are in the processof fine mapping these QTLs in arecombinant inbred population ofBasmati 370/ASD16 (F9 genera-tion) using an SSR marker-basedlinkage map.
Table 2. Two-way interactions betweenputative SSR markers associated withresistance to WBPH in Basmati 370/ASD16F3 population.
Pair of linked R2 F value Probabilitymarkers
RM2/RM178 0.125 2.500 0.089RM2/RM248 0.083 0.450 0.772RM2/RM282 0.135 2.470 0.047RM2/RM313 0.102 1.690 0.154RM2/RM351 0.122 1.700 0.153RM178/RM248 0.094 0.220 0.927RM178/RM282 0.115 0.700 0.594RM178/RM313 0.095 0.610 0.657RM178/RM351 0.127 0.960 0.431RM248/RM282 0.138 2.790 0.028RM248/RM313 0.089 0.550 0.696RM248/RM351 0.152 0.110 0.978
fragment length polymorphism(RFLP). PhD dissertation. CornellUniversity. 177 p.
SAS Institute. 1985. SAS user’s guide:statistics. 5th ed. Cary, NC: SASInstitute.
Sogawa K, Fujimoto H, Qian Q, Teng S,Liu G, Zhu L. 2001. QTLs forovicidal response to whitebackedplanthopper in rice. Chin. Rice Res.Newsl. 9:5.
Yamasaki M, Tsunematsu H, YoshimuraA, Iwata N, Yasui H. 1999. Quanti-tative trait locus mapping ofovicidal response in rice (Oryzasativa L.) against whitebackedplanthopper (Sogatella furciferaHorvath). Crop Sci. 39:1178-1183.
Table 1. Putative SSR markers linked withresistance to WBPH in Basmati 370/ASD16F3 population.
Marker Linkage F P value F group (calculated)a (critical)
RM282 3 4.716 0.010 3.045RM178 5 5.301 0.005 3.046RM2 7 3.310 0.038 3.049RM248 7 4.397 0.013 3.049RM351 7 6.315 0.002 3.045RM313 12 3.469 0.033 3.045
aCalculated using single-factor ANOVA.
ReferencesHeinrichs E, Medrano FG, Rapusas H.
1985. Genetic evaluation of insectresistance in rice. Manila(Philippines): International RiceResearch Institute
IRRI (International Rice ResearchInstitute). 1996. Standardevaluation system for rice. 4th ed.Manila (Philippines): IRRI. 52 p.
Kadirvel P, Maheswaran M, Gunathi-lagaraj K. 1999. Molecularmapping of quantitative trait locus(QTL) associated with resistance towhitebacked planthopper in rice.Int. Rice Res. Notes 24(3):12-14.
Khush GS, Brar DS. 1991. Genetics ofresistance to insects in crop plants.Adv. Agron. 45:223-274.
Ma L, Zhuang J, Liu G, Min S, Li X.2001. Mapping of Wbph6 (t)—anew gene for resistance towhitebacked planthopper. Chin.Rice Res. Newsl. 9:2-3.
McCouch SR. 1990. Construction andapplications of a molecular linkagemap of rice based on restriction ○ ○ ○ ○ ○ ○ ○ ○ ○ ○ ○ ○ ○ ○ ○ ○ ○ ○ ○ ○
Rice covers much ofAsia, so improvedvarieties that need lesspesticide leave a cleaner,greener environment.
24 December 2003
Genetic resources
Rice is grown on about 1.44 mil-lion ha of mountain ecosystem inthe Indian Himalaya, with totalproduction and productivity of2.52 million t and 1.75 t ha–1,respectively. The IndianHimalaya region, composed oftwo geographically distinctflanks, the northeastern and thenorthwestern, represents a widerange of diversity in agroclimaticconditions such as soil, tempera-ture, rainfall, and altitude. Theprevalence of suboptimum tem-perature throughout the life cycleof the rice plant prolongs its ma-turity duration. In addition, thehills are known to be a hot spotfor rice blast. Tolerance for low-temperature stress and resistanceto blast are thus considered essen-tial for developing new varietiesthat can, in turn, improve rice pro-ductivity of the hill ecosystem.
To develop a rice varietywith resistance to blast and toler-ance for low-temperature stress,a cross (VR1023) was made in1986 between VL Dhan 221 (ashort-duration, blast-resistant va-riety for the rainfed uplands) andUPR82-1-7 (genotype with goodgrain and better plant type).Promising uniform lines thatwere selected using pedigreemethods were tested for yield andother ancillary attributes for twoconsecutive years at the experi-ment farm in Hawalbagh (1,250m asl) before being nominated tothe All-India Coordinated Testingunder initial varietal trials (earlyhills) as IET15473 in 1997. On thebasis of better yield performance
Vivek Dhan 82: a high-yielding, blast-resistantirrigated rice variety for the Indian Himalaya
R.K. Sharma, J.C. Bhatt, and H.S. Gupta, Vivekananda Parvatiya Krishi Anusandhan Sansthan (Indian Councilof Agricultural Research), Almora 263601, Uttaranchal, India
in the hill zone, it was identifiedfor release by the All-India An-nual Rice Workshop and subse-quently released by the CRVC in2001 as Vivek Dhan 82 for culti-vation in the hills and mountainareas of Uttaranchal (UA),Himachal Pradesh (HP), andMeghalaya states. This varietygave an average yield of 4.94t ha–1, compared with the nationalcheck K39’s 3.35 t ha–1, the re-gional check K448-1-2’s 3.6 t ha–1,and the local check’s 4.26 t ha–1 incoordinated trials conducted atdifferent hilly sites of UA, HP, andMeghalaya (see table).
Vivek Dhan 82 is a semitall(115–120 cm) variety and requires90 d to flower in mid-altitude ar-eas such as Hawalbagh (UA),Malan (HP), and Barapani(Meghalaya) and 105–110 d inhigher elevation locations such asKatrain (HP). It has well-exsertedpanicles, is awnless and straw-colored, and has long bold (L/B,
2.55) grains with 70.6% millingrecovery, intermediate gelatiniza-tion temperature, and good ker-nel elongation ratio (1.63). Thevariety also showed resistance toor tolerance for major bioticstresses of the region (e.g., leafand neck blast disease and insectssuch as stem borer and leaf-folder).
The variety was also testedunder the Frontline Demonstra-tion Program in farmers’ fields atLakhanari, Rait, Khari, andPalrigarh villages in Almora Dis-trict (UA) during the 2002 kharif(wet) season. The yield of VivekDhan 82 (4.2 t ha–1) was higherthan that of local varieties(3.2 t ha–1) in the region. The vari-ety is becoming popular becauseof its higher yield, better strawyield (required for animal feed),and tolerance for diseases andinsect pests prevailing in the rec-ommended areas of cultivation.
Yield performance of Vivek Dhan 82 in the All-India coordinated trials in the hills ofUttaranchal, Himachal Pradesh, and Meghalaya.
Grain yield (t ha–1)Genotype Yield gain (%)
1997 1998 1999 Mean
Vivek Dhan 82 4.92 4.58 5.21 4.94 –K39 (national check) 1.82 3.84 3.57 3.35 47.3K448-1-2 (regional check) – – 3.60 3.60 45.5a
Local check 3.88 4.58 4.16 4.26 15.8
aBased on 1999 only.
○ ○ ○ ○ ○ ○ ○ ○ ○ ○ ○ ○ ○ ○ ○ ○ ○ ○ ○

25IRRN 28.2
The rainfed lowland is a predomi-nant rice ecology in Bihar (2.7million ha). As it is monsoon-based, sowing and transplantingof rice are invariably delayed. Thecrop also faces flood and drought,singly or in combination, at anygrowth stage. Because of theseconstraints, the high-yielding va-rieties developed for this ecologythrough on-station efforts are notwidely adopted. Traditionally, todevelop varieties adapted to thisecology, photoperiod-sensitivecultivars are grown. A participa-tory approach began in 1995 atRAU. The program was furtherstrengthened when an IRRI-spon-sored participatory breedingproject was launched in 1998.From the beginning, farmers werepartners in varietal selection.
An on-farm research trialconsisting of 12 improved variet-ies and advanced breeding lines(including local checks) that dif-fered in height and growth dura-tion was conducted at three rep-resentative sites in farmers’ fields.Of these materials, four entrieswere selected, mainly on the ba-sis of high yields, and were in-cluded in large-scale multiloca-tion on-farm trials. A survey con-ducted under the Farmers’ Par-ticipatory Breeding (FPB) Projectfound that RAU 1306-4-3-2-2, aline included in the 1995 on-farmtrial, was already being grown inseveral villages. Farmers liked itsexcellent grain and cooking qual-ity and tolerance for submergenceand drought. It is about 15 d ear-lier than some popular local cul-tivars such as Bakol. This entry
Santosh—a high-yielding variety for the rainfed lowland ofBihar, India, developed through participatory breeding
R. Thakur, N.K. Singh, S.B. Mishra, A.K. Singh, and K.K. Singh, Rajendra Agricultural University (RAU), Pusa, Samastipur,Bihar; and R.K. Singh, IRRI India Office, New Delhi, India
was thus included in the ongoingmulti-location on-farm trials toassess its performance in farmers’fields. All the entries were evalu-ated at the vegetative and repro-ductive stages and a relative rank-ing, by both scientists and farm-ers, was made. RAU 1306-4-3-2-2was rated the best by farmers.
RAU1306-4-3-2-2 was en-
tered in the All-India Coordinated(ACRIP) and state varietal trialsas IET15773. The performancedata formed the basis of its re-lease. In the ACRIP trials, its yieldranged from 2.7 to 5.3 t ha–1 andits average yield was 4.0 t ha–1 (thenational check yielded 3.5 t ha–1)(Table 1). In state varietal trials atdifferent locations during the
Table 1. Yield (t ha–1) of RAU1306-4-3-2-2 (IET15773) under an initial varietal trial with shallowwater at different coordinating centers, 1997 kharif.
Location RAU1306-4-3-2-2 Salivahan Local check CD at 5% CV (%)(national check)
Jeypore 4.6 4.1 3.5 13.3 16.1Chinsurah 3.5 3.5 4.0 7.8 11.7Kharagpur 3.5 5.0 4.0 11.7 14.9Pusa 4.1 3.3 2.7 11.2 17.0Ranchi 2.7 6.2 1.7 9.3 19.7Varanasi 4.2 3.4 3.2 14.5 23.4Raipur 3.9 2.6 3.7 10.8 17.8Titabar 3.8 5.0 4.1 6.0 7.6Karimganj 3.8 3.7 4.0 5.5 8.5Arundhati Nagar 5.3 4.4 5.4 2.7 13.6 Mean 4.0 3.5 3.6 – –
Table 2. Yield (t ha–1) of RAU1306-4-3-2-2 in on-station varietal trials at Patna, Pusa, andSabour.
Year/location RAU1306- Rajshree Mahsuri CD at 5% CV% 4-3-2-2
1993a
Patna 2.6 2.0 3.0 8.84 18.6 Pusa 2.8 1.8 1.8 6.87 19.3 Sabour 3.5 1.4 1.9 7.70 21.41994 Patna 6.0 – 1.3 – – Pusa 7.2 5.0 2.4 9.16 10.46 Sabour 3.8 1.6 1.5 8.94 30.891995 Patna 5.5 3.7 3.2 10.2 19.2 Pusa 4.7 3.3 2.7 9.5 20.0 Sabour 4.2 3.3 2.8 – 24.41996 Patna 4.8 3.8 2.9 11.5 21.5 Pusa 4.4 5.1 4.2 9.2 17.3 Sabour 4.5 3.1 – – 23.5Pooled mean 4.5 3.1 2.7 – –
aDrought year.
26 December 2003
1993-96 wet seasons, its averageyield was better than that ofpopular check varieties Rajshreeand Mahsuri (Table 2). In 18 on-farm trials conducted in 1999 and2000, the mean yield ofRAU 1306-4-3-2-2 (4.4 ± 0.5 t ha–1)was higher than that of Rajshree(4.2 ± 0.4 t ha–1) and the farmers’variety Bakol (3.9 ± 0.4 t ha–1).RAU 1306-4-3-2-2 outyieldedBakol at 15 out of 18 sites.
Our survey revealed that,before its release, many farmers
were growing RAU 1306-4-3-2-2in both Malinagar and neighbor-ing villages. In Malinagar village,it covered about 40% of therainfed lowland and mediumland area. Farmers preferred thisvariety because of its high yield,its excellent grain and eatingquality, and its duration. In recenttimes, quality has become a de-ciding factor in varietal selectionand adoption.
RAU 1306-4-3-2-2 was re-leased by the RAU Research
Council in 2001 as Santosh (mean-ing “satisfaction”). It is tall (130cm) and nonlodging and has erectleaves, long panicles, and brownhusk. It can tolerate zinc defi-ciency and is adapted to delayedplanting. Availability of seed,though, was a major constraint.However, with its release, seedproduction is expected to in-crease.
○ ○ ○ ○ ○ ○ ○ ○ ○ ○ ○ ○ ○ ○ ○ ○ ○ ○ ○
“Graindell” is a children’s storybook published by the International RiceResearch Institute (IRRI). Written by renowned Filipino children’s au-thor Rene O. Villanueva, the book captures the organization’s goalfor all the children of the world—a “home for tomorrow,” a progres-sive community where no one will go hungry. Through this first titlein a series of children’s publications, IRRI introduces its future stake-holders to important issues relating to rice, “the grain of life,” foodto half the world’s population, especially in Asia.
Graindell, “the planetoid shaped like a little eye,” tells thestory of two friends, Abu and Thor, who share a commondream—to turn their home into the greatest place to live. Thesimple, yet moving, tale comes alive with the masterful ren-derings of Redge Abos, a young and talented artist fromIlustrador ng Kabataan (INK), in watercolor, combined withdigital technology.
With the release of this first children’s storybook, IRRIlaunches the “Graindell Community,” which espouses the call
for a dynamic, well-developed countryside through multisectoral par-ticipation. Membership is open to children and their stewards, including par-
ents, teachers, scientists, children’s storywriters and illustrators, and other concernedcitizens.
The members of the “Graindell Community” converge at the educational Web site, Graindell.com,where IRRI’s own scientists lend their expertise to build a popular knowledge bank on rice, against the backdrop of
science, food and nutrition, environment, arts and culture, literacy, and community participation. The site teaches childrento “aspire, persevere, and achieve” through games, instructional materials, and interactive learning exercises with otherchildren, as well as their stewards.
The story of “Graindell” celebrates what IRRI is all about. It portrays the organization’s endeavor to create a new genera-tion of rice farmers and consumers who will embrace the traditional wisdom of farm life, understand the need for new andcreative technology, and work together for a self-sufficient and well-developed society. By involving children now, they canmarch fearlessly into the future, knowing that “a home for tomorrow” is not only possible—it is achievable.
Graindell is IRRI’s first project for the United NationsInternational Year of Rice to be celebrated in 2004.
Please visit www.graindell.com <http://www.graindell.com> to sign up, get more information, and contribute content to the site.
IRRI launches first children’s storybook
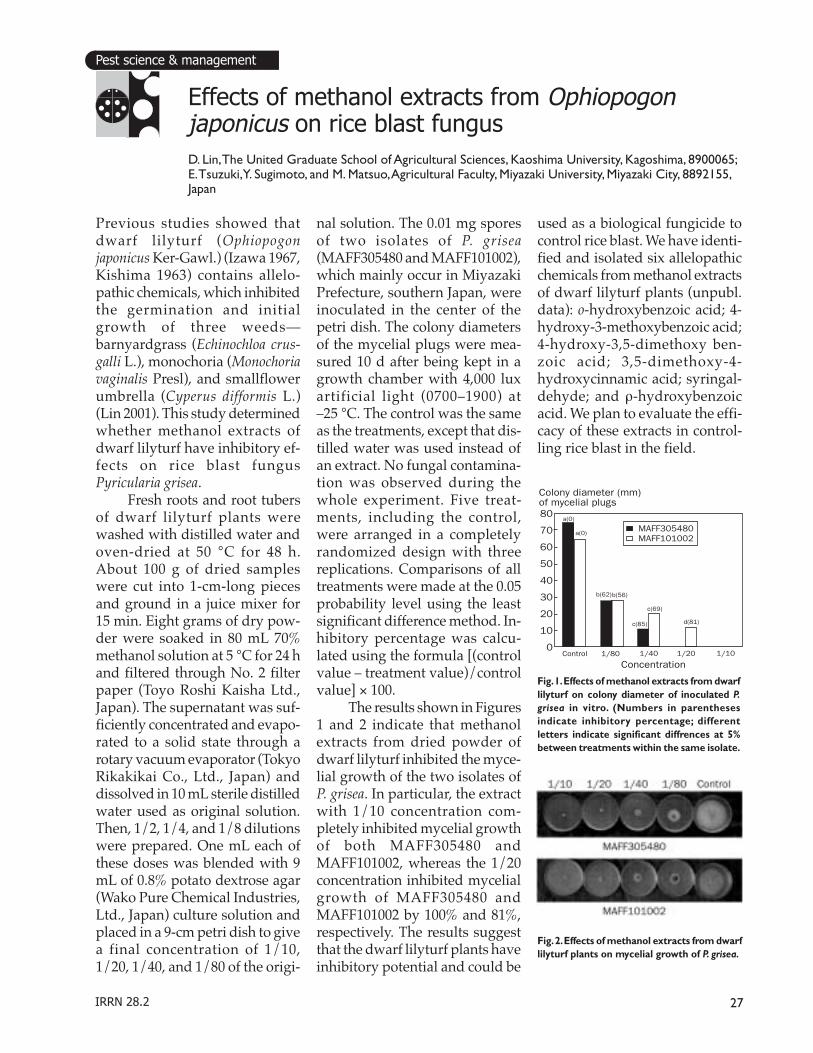
27IRRN 28.2
Pest science & management
Previous studies showed thatdwarf lilyturf (Ophiopogonjaponicus Ker-Gawl.) (Izawa 1967,Kishima 1963) contains allelo-pathic chemicals, which inhibitedthe germination and initialgrowth of three weeds—barnyardgrass (Echinochloa crus-galli L.), monochoria (Monochoriavaginalis Presl), and smallflowerumbrella (Cyperus difformis L.)(Lin 2001). This study determinedwhether methanol extracts ofdwarf lilyturf have inhibitory ef-fects on rice blast fungusPyricularia grisea.
Fresh roots and root tubersof dwarf lilyturf plants werewashed with distilled water andoven-dried at 50 °C for 48 h.About 100 g of dried sampleswere cut into 1-cm-long piecesand ground in a juice mixer for15 min. Eight grams of dry pow-der were soaked in 80 mL 70%methanol solution at 5 °C for 24 hand filtered through No. 2 filterpaper (Toyo Roshi Kaisha Ltd.,Japan). The supernatant was suf-ficiently concentrated and evapo-rated to a solid state through arotary vacuum evaporator (TokyoRikakikai Co., Ltd., Japan) anddissolved in 10 mL sterile distilledwater used as original solution.Then, 1/2, 1/4, and 1/8 dilutionswere prepared. One mL each ofthese doses was blended with 9mL of 0.8% potato dextrose agar(Wako Pure Chemical Industries,Ltd., Japan) culture solution andplaced in a 9-cm petri dish to givea final concentration of 1/10,1/20, 1/40, and 1/80 of the origi-
Effects of methanol extracts from Ophiopogonjaponicus on rice blast fungus
D. Lin, The United Graduate School of Agricultural Sciences, Kaoshima University, Kagoshima, 8900065;E. Tsuzuki, Y. Sugimoto, and M. Matsuo, Agricultural Faculty, Miyazaki University, Miyazaki City, 8892155,Japan
nal solution. The 0.01 mg sporesof two isolates of P. grisea(MAFF305480 and MAFF101002),which mainly occur in MiyazakiPrefecture, southern Japan, wereinoculated in the center of thepetri dish. The colony diametersof the mycelial plugs were mea-sured 10 d after being kept in agrowth chamber with 4,000 luxartificial light (0700–1900) at–25 °C. The control was the sameas the treatments, except that dis-tilled water was used instead ofan extract. No fungal contamina-tion was observed during thewhole experiment. Five treat-ments, including the control,were arranged in a completelyrandomized design with threereplications. Comparisons of alltreatments were made at the 0.05probability level using the leastsignificant difference method. In-hibitory percentage was calcu-lated using the formula [(controlvalue – treatment value)/controlvalue] × 100.
The results shown in Figures1 and 2 indicate that methanolextracts from dried powder ofdwarf lilyturf inhibited the myce-lial growth of the two isolates ofP. grisea. In particular, the extractwith 1/10 concentration com-pletely inhibited mycelial growthof both MAFF305480 andMAFF101002, whereas the 1/20concentration inhibited mycelialgrowth of MAFF305480 andMAFF101002 by 100% and 81%,respectively. The results suggestthat the dwarf lilyturf plants haveinhibitory potential and could be
used as a biological fungicide tocontrol rice blast. We have identi-fied and isolated six allelopathicchemicals from methanol extractsof dwarf lilyturf plants (unpubl.data): o-hydroxybenzoic acid; 4-hydroxy-3-methoxybenzoic acid;4-hydroxy-3,5-dimethoxy ben-zoic acid; 3,5-dimethoxy-4-hydroxycinnamic acid; syringal-dehyde; and ρ-hydroxybenzoicacid. We plan to evaluate the effi-cacy of these extracts in control-ling rice blast in the field.
Fig. 2. Effects of methanol extracts from dwarflilyturf plants on mycelial growth of P. grisea.
80
70
60
50
40
30
20
10
0Control 1/80 1/40 1/20 1/10
Concentration
Colony diameter (mm)of mycelial plugs
a(0)
a(0)
b(62)b(56)
c(69)
c(85) d(81)
MAFF305480MAFF101002
Fig. 1. Effects of methanol extracts from dwarflilyturf on colony diameter of inoculated P.grisea in vitro. (Numbers in parenthesesindicate inhibitory percentage; differentletters indicate significant diffrences at 5%between treatments within the same isolate.
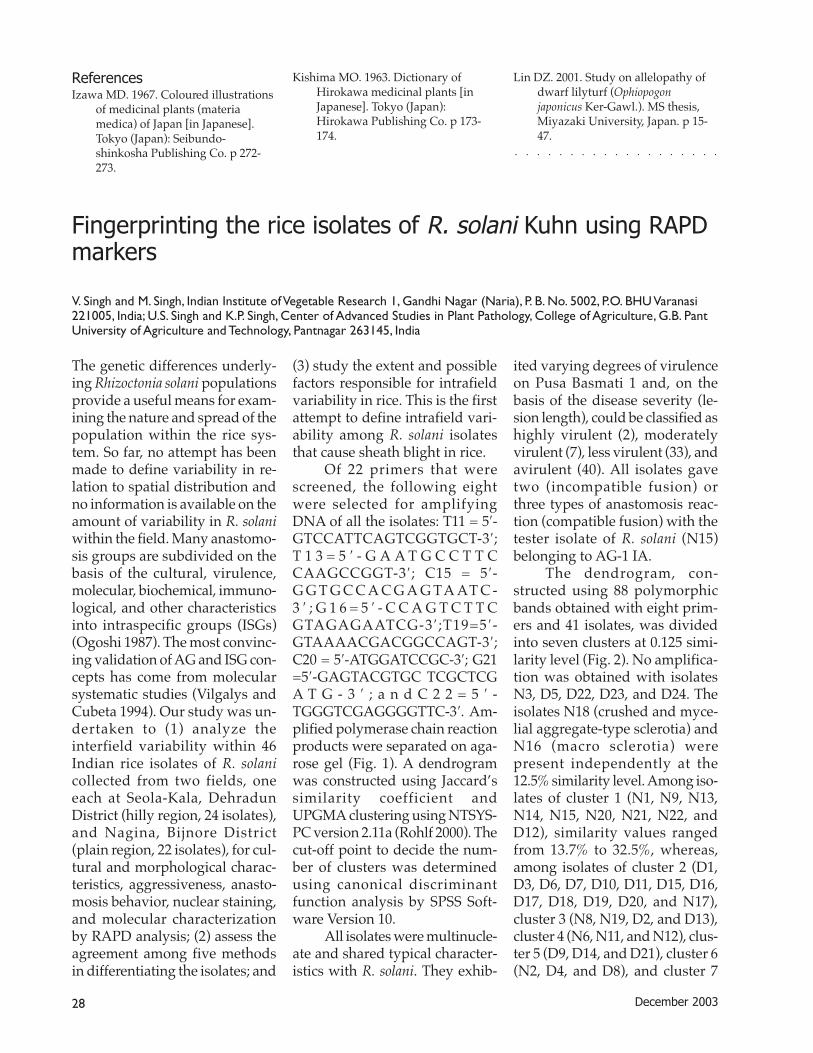
28 December 2003
The genetic differences underly-ing Rhizoctonia solani populationsprovide a useful means for exam-ining the nature and spread of thepopulation within the rice sys-tem. So far, no attempt has beenmade to define variability in re-lation to spatial distribution andno information is available on theamount of variability in R. solaniwithin the field. Many anastomo-sis groups are subdivided on thebasis of the cultural, virulence,molecular, biochemical, immuno-logical, and other characteristicsinto intraspecific groups (ISGs)(Ogoshi 1987). The most convinc-ing validation of AG and ISG con-cepts has come from molecularsystematic studies (Vilgalys andCubeta 1994). Our study was un-dertaken to (1) analyze theinterfield variability within 46Indian rice isolates of R. solanicollected from two fields, oneeach at Seola-Kala, DehradunDistrict (hilly region, 24 isolates),and Nagina, Bijnore District(plain region, 22 isolates), for cul-tural and morphological charac-teristics, aggressiveness, anasto-mosis behavior, nuclear staining,and molecular characterizationby RAPD analysis; (2) assess theagreement among five methodsin differentiating the isolates; and
Fingerprinting the rice isolates of R. solani Kuhn using RAPDmarkers
V. Singh and M. Singh, Indian Institute of Vegetable Research 1, Gandhi Nagar (Naria), P. B. No. 5002, P.O. BHU Varanasi221005, India; U.S. Singh and K.P. Singh, Center of Advanced Studies in Plant Pathology, College of Agriculture, G.B. PantUniversity of Agriculture and Technology, Pantnagar 263145, India
(3) study the extent and possiblefactors responsible for intrafieldvariability in rice. This is the firstattempt to define intrafield vari-ability among R. solani isolatesthat cause sheath blight in rice.
Of 22 primers that werescreened, the following eightwere selected for amplifyingDNA of all the isolates: T11 = 5′-GTCCATTCAGTCGGTGCT-3′;T 1 3 = 5 ′ - G A A T G C C T T CCAAGCCGGT-3′; C15 = 5′-G G T G C C A C G A G TA AT C -3 ′ ; G 1 6 = 5 ′ - C C A G T C T T CGTAGAGAATCG-3 ′ ;T19=5 ′-GTAAAACGACGGCCAGT-3′;C20 = 5′-ATGGATCCGC-3′; G21=5′-GAGTACGTGC TCGCTCGA T G - 3 ′ ; a n d C 2 2 = 5 ′ -TGGGTCGAGGGGTTC-3′. Am-plified polymerase chain reactionproducts were separated on aga-rose gel (Fig. 1). A dendrogramwas constructed using Jaccard’ssimilarity coefficient andUPGMA clustering using NTSYS-PC version 2.11a (Rohlf 2000). Thecut-off point to decide the num-ber of clusters was determinedusing canonical discriminantfunction analysis by SPSS Soft-ware Version 10.
All isolates were multinucle-ate and shared typical character-istics with R. solani. They exhib-
ited varying degrees of virulenceon Pusa Basmati 1 and, on thebasis of the disease severity (le-sion length), could be classified ashighly virulent (2), moderatelyvirulent (7), less virulent (33), andavirulent (40). All isolates gavetwo (incompatible fusion) orthree types of anastomosis reac-tion (compatible fusion) with thetester isolate of R. solani (N15)belonging to AG-1 IA.
The dendrogram, con-structed using 88 polymorphicbands obtained with eight prim-ers and 41 isolates, was dividedinto seven clusters at 0.125 simi-larity level (Fig. 2). No amplifica-tion was obtained with isolatesN3, D5, D22, D23, and D24. Theisolates N18 (crushed and myce-lial aggregate-type sclerotia) andN16 (macro sclerotia) werepresent independently at the12.5% similarity level. Among iso-lates of cluster 1 (N1, N9, N13,N14, N15, N20, N21, N22, andD12), similarity values rangedfrom 13.7% to 32.5%, whereas,among isolates of cluster 2 (D1,D3, D6, D7, D10, D11, D15, D16,D17, D18, D19, D20, and N17),cluster 3 (N8, N19, D2, and D13),cluster 4 (N6, N11, and N12), clus-ter 5 (D9, D14, and D21), cluster 6(N2, D4, and D8), and cluster 7
ReferencesIzawa MD. 1967. Coloured illustrations
of medicinal plants (materiamedica) of Japan [in Japanese].Tokyo (Japan): Seibundo-shinkosha Publishing Co. p 272-273.
Kishima MO. 1963. Dictionary ofHirokawa medicinal plants [inJapanese]. Tokyo (Japan):Hirokawa Publishing Co. p 173-174.
Lin DZ. 2001. Study on allelopathy ofdwarf lilyturf (Ophiopogonjaponicus Ker-Gawl.). MS thesis,Miyazaki University, Japan. p 15-47.
○ ○ ○ ○ ○ ○ ○ ○ ○ ○ ○ ○ ○ ○ ○ ○ ○ ○ ○

29IRRN 28.2
(N4, N5, N7, and N10), the simi-larity values ranged from 13.7%to 74.5%, 12.5% to 40%, 15% to30%, 15% to 32.5%, 12.5% to 50%,and 13.80% to 42.5%, respectively.Distinct subclusters were de-tected within clusters 1 and 2, in-dicating a more complex patternof genetic variation. In contrast,isolates of clusters 3, 4, 5, 6, and 7were less differentiated intomarked subclusters. The microsclerotia-forming isolates (N20,N21, and N22) formed a distinctsubcluster within cluster 1 at 35%similarity level. All isolates be-longing to cluster 7, which wereisolated from Nagina, were lessvirulent on rice and depicted twotypes of anastomosis reaction.
The lack of a perfect state,wide intrafield variability, andcompatible fusion among mor-phologically and virulent-wisedissimilar isolates (D19 and N14),demonstrated for the first timeduring this investigation, indicateheterokaryosis as a major mecha-nism for creating intrafield vari-ability. Isolate-specific primersopen up the possibility to useRAPD to study population dy-namics and survival of R. solaniin the soil and polymorphism inthe R. solani complex in rice.
N1(HV-Macro-3)N14(AV-Micro-3)
1.00 0.90 0.80 0.70 0.60 0.50 0.40 0.30 0.20 0.10 0.00Jaccard similarity coefficient
N9(AV-CM-2)N13(LV-Macro-2)
N15(MV-Macro-2)D12(LV-Macro-2)
N20(LV-Micro-2)N21(LV-Micro-2)N22(LV-Micro-2)D6(LV-Macro-2)
D15(LV-Macro-3)D16(LV-Macro-2)
D10(MV-Macro-3)
D17(LV-Macro-2)D11(LV-Macro-2)
D18(LV-Macro-3)D19(LV-CM-3)
D20(LV-Macro-2)N17(MV-Macro-2)
D3(LV-Macro-3)
D7(MV-Macro-2)D1(LV-Macro-2)
N8(LV-Macro-2)N19(AV-Macro-2)
D2(LV-Macro-3)
D9(MV-Macro-3)
D13(LV-Macro-3)N6(MV-Macro-3)
N11(LV-Macro-2)N12(LV-Micro-2)
D8(LV-Macro-3)
D14(HV-Macro-2)D21(LV-CM-2)
N2(AV-Micro-2)D4(LV-Macro-3)
N5(LV-Macro-2)
N16(LV-Macro-2)
N4(LV-Macro-2)
N7(LV-Macro-2)N10(LV-Macro-2)
N18(LV-CM-2)
Fig. 2. Dendrogram of 41 rice isolates of Rhizoctonia solani revealed by UPGMA cluster analysisof genetic similarities based on RAPD data of 88 fragments amplified with 8 primers. N1 toN22 = Nagina isolates and D1 to D24 = Dehradun isolates. HV = highly virulent, MV = moderatelyvirulent, LV = less virulent, and AV = avirulent. Macro = macro sclerotia, micro = micro sclerotia,and CM = crushed and mycelial aggregate type of sclerotia. 3 = 3-type anastomosis reaction(compatible fusion) and 2 = 2-type anastomosis reaction (incompatible fusion).
Fig. 1. Agarose gel showing PCR amplification products of 25 isolates obtained with the primer T13. Numbers on the right indicate band size inkilobase pairs. Lanes 1–22 = Nagina isolates (N1 to N22); lanes 23–25, Dehradun isolates (D1 to D3), and M = molecular weight marker, lambdaHindIII/EcoRI double-digested.
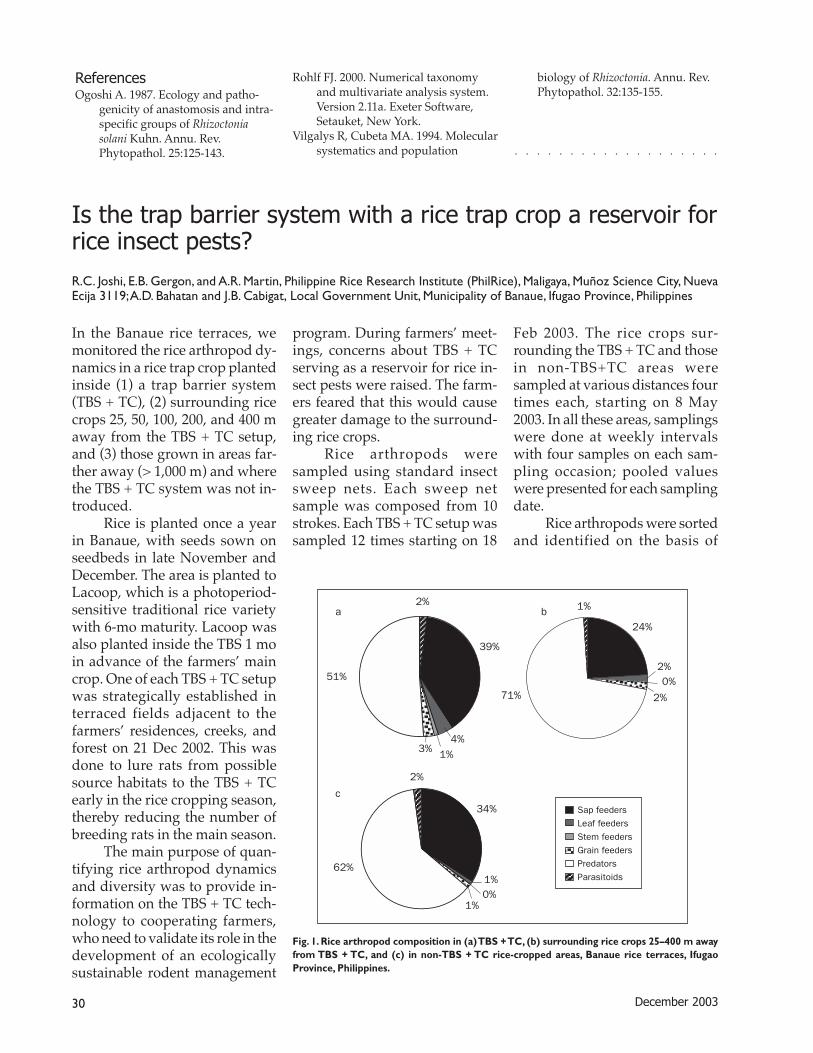
30 December 2003
In the Banaue rice terraces, wemonitored the rice arthropod dy-namics in a rice trap crop plantedinside (1) a trap barrier system(TBS + TC), (2) surrounding ricecrops 25, 50, 100, 200, and 400 maway from the TBS + TC setup,and (3) those grown in areas far-ther away (> 1,000 m) and wherethe TBS + TC system was not in-troduced.
Rice is planted once a yearin Banaue, with seeds sown onseedbeds in late November andDecember. The area is planted toLacoop, which is a photoperiod-sensitive traditional rice varietywith 6-mo maturity. Lacoop wasalso planted inside the TBS 1 moin advance of the farmers’ maincrop. One of each TBS + TC setupwas strategically established interraced fields adjacent to thefarmers’ residences, creeks, andforest on 21 Dec 2002. This wasdone to lure rats from possiblesource habitats to the TBS + TCearly in the rice cropping season,thereby reducing the number ofbreeding rats in the main season.
The main purpose of quan-tifying rice arthropod dynamicsand diversity was to provide in-formation on the TBS + TC tech-nology to cooperating farmers,who need to validate its role in thedevelopment of an ecologicallysustainable rodent management
Is the trap barrier system with a rice trap crop a reservoir forrice insect pests?
R.C. Joshi, E.B. Gergon, and A.R. Martin, Philippine Rice Research Institute (PhilRice), Maligaya, Muñoz Science City, NuevaEcija 3119; A.D. Bahatan and J.B. Cabigat, Local Government Unit, Municipality of Banaue, Ifugao Province, Philippines
program. During farmers’ meet-ings, concerns about TBS + TCserving as a reservoir for rice in-sect pests were raised. The farm-ers feared that this would causegreater damage to the surround-ing rice crops.
Rice arthropods weresampled using standard insectsweep nets. Each sweep netsample was composed from 10strokes. Each TBS + TC setup wassampled 12 times starting on 18
Feb 2003. The rice crops sur-rounding the TBS + TC and thosein non-TBS+TC areas weresampled at various distances fourtimes each, starting on 8 May2003. In all these areas, samplingswere done at weekly intervalswith four samples on each sam-pling occasion; pooled valueswere presented for each samplingdate.
Rice arthropods were sortedand identified on the basis of
ReferencesOgoshi A. 1987. Ecology and patho-
genicity of anastomosis and intra-specific groups of Rhizoctoniasolani Kuhn. Annu. Rev.Phytopathol. 25:125-143.
Rohlf FJ. 2000. Numerical taxonomyand multivariate analysis system.Version 2.11a. Exeter Software,Setauket, New York.
Vilgalys R, Cubeta MA. 1994. Molecularsystematics and population
biology of Rhizoctonia. Annu. Rev.Phytopathol. 32:135-155.
Fig. 1. Rice arthropod composition in (a) TBS + TC, (b) surrounding rice crops 25–400 m awayfrom TBS + TC, and (c) in non-TBS + TC rice-cropped areas, Banaue rice terraces, IfugaoProvince, Philippines.
1%
24%
2%0%
2%71%
2%
39%
4%3%
51%
1%
34%
2%
62%1%0%
1%
Sap feedersLeaf feedersStem feedersGrain feedersPredatorsParasitoids
a b
c
○ ○ ○ ○ ○ ○ ○ ○ ○ ○ ○ ○ ○ ○ ○ ○ ○ ○ ○
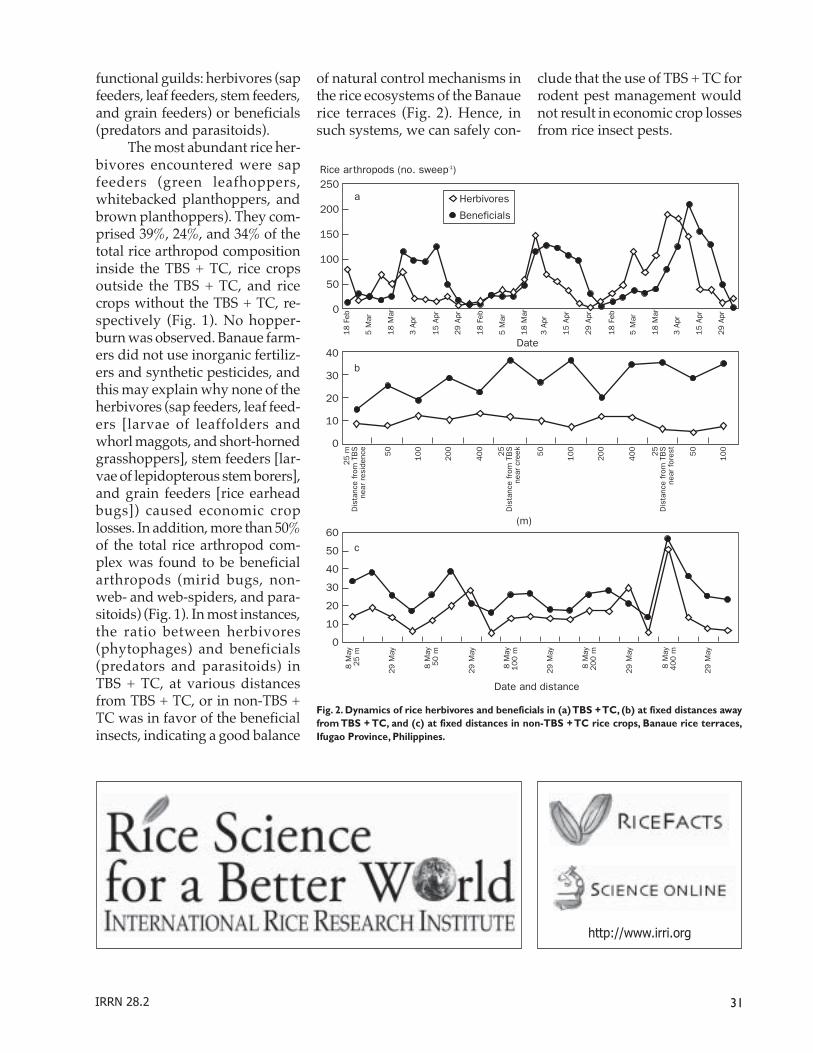
31IRRN 28.2
functional guilds: herbivores (sapfeeders, leaf feeders, stem feeders,and grain feeders) or beneficials(predators and parasitoids).
The most abundant rice her-bivores encountered were sapfeeders (green leafhoppers,whitebacked planthoppers, andbrown planthoppers). They com-prised 39%, 24%, and 34% of thetotal rice arthropod compositioninside the TBS + TC, rice cropsoutside the TBS + TC, and ricecrops without the TBS + TC, re-spectively (Fig. 1). No hopper-burn was observed. Banaue farm-ers did not use inorganic fertiliz-ers and synthetic pesticides, andthis may explain why none of theherbivores (sap feeders, leaf feed-ers [larvae of leaffolders andwhorl maggots, and short-hornedgrasshoppers], stem feeders [lar-vae of lepidopterous stem borers],and grain feeders [rice earheadbugs]) caused economic croplosses. In addition, more than 50%of the total rice arthropod com-plex was found to be beneficialarthropods (mirid bugs, non-web- and web-spiders, and para-sitoids) (Fig. 1). In most instances,the ratio between herbivores(phytophages) and beneficials(predators and parasitoids) inTBS + TC, at various distancesfrom TBS + TC, or in non-TBS +TC was in favor of the beneficialinsects, indicating a good balance
250
200
150
100
50
0
18
Feb
5 M
ar
18
Mar
3 A
pr
15
Apr
29
Apr
18
Feb
5 M
ar
18
Mar
3 A
pr
15
Apr
29
Apr
18
Feb
5 M
ar
18
Mar
3 A
pr
15
Apr
29
Apr
Rice arthropods (no. sweep-1)
Herbivores
Beneficials
8 M
ay2
5 m
29
May
8 M
ay5
0 m
29
May
8 M
ay1
00
m
29
May
8 M
ay2
00
m
29
May
8 M
ay4
00
m
29
May
Date and distance
60
50
40
30
20
10
0
40
30
20
10
0
50
10
0
20
0
40
0
50
10
0
20
0
40
0
50
10
0
25
mD
ista
nce
from
TB
Sne
ar r
esid
ence 25
Dis
tanc
e fr
om T
BS
near
cre
ek 25
Dis
tanc
e fr
om T
BS
near
for
est
a
b
c
Date
(m)
Fig. 2. Dynamics of rice herbivores and beneficials in (a) TBS + TC, (b) at fixed distances awayfrom TBS + TC, and (c) at fixed distances in non-TBS + TC rice crops, Banaue rice terraces,Ifugao Province, Philippines.
of natural control mechanisms inthe rice ecosystems of the Banauerice terraces (Fig. 2). Hence, insuch systems, we can safely con-
clude that the use of TBS + TC forrodent pest management wouldnot result in economic crop lossesfrom rice insect pests.
http://www.irri.org
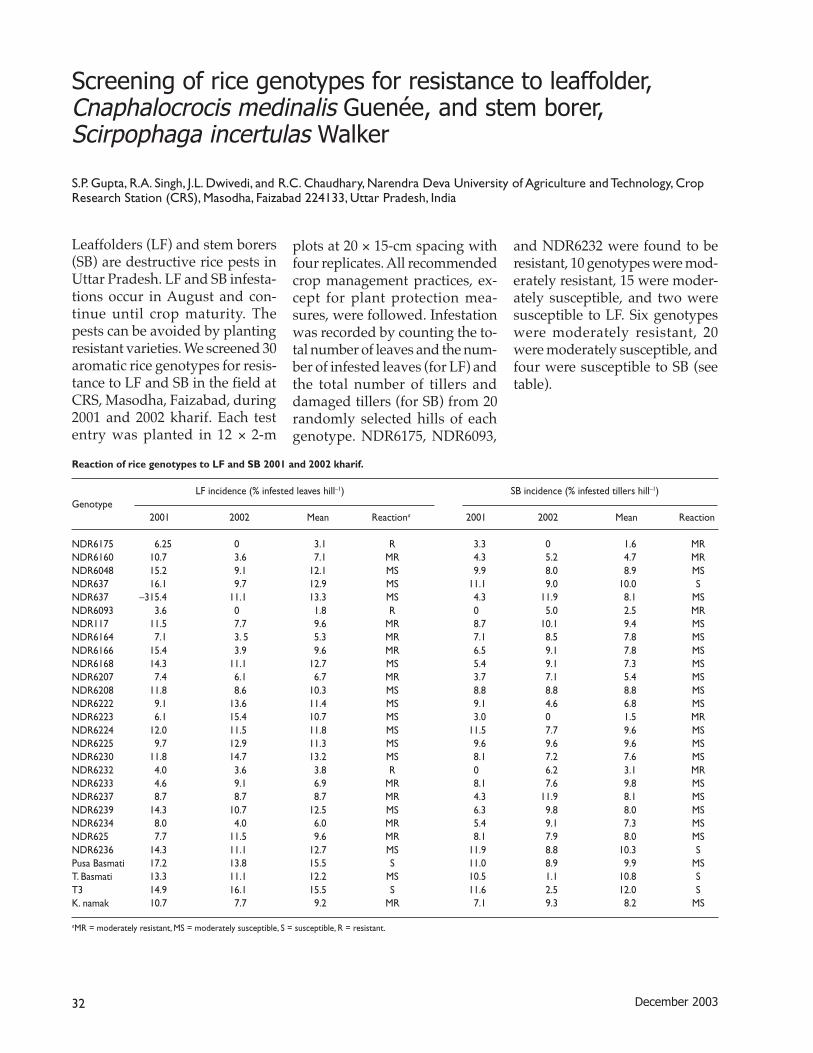
32 December 2003
Leaffolders (LF) and stem borers(SB) are destructive rice pests inUttar Pradesh. LF and SB infesta-tions occur in August and con-tinue until crop maturity. Thepests can be avoided by plantingresistant varieties. We screened 30aromatic rice genotypes for resis-tance to LF and SB in the field atCRS, Masodha, Faizabad, during2001 and 2002 kharif. Each testentry was planted in 12 × 2-m
Reaction of rice genotypes to LF and SB 2001 and 2002 kharif.
LF incidence (% infested leaves hill–1) SB incidence (% infested tillers hill–1)Genotype
2001 2002 Mean Reactiona 2001 2002 Mean Reaction
NDR6175 6.25 0 3.1 R 3.3 0 1.6 MRNDR6160 10.7 3.6 7.1 MR 4.3 5.2 4.7 MRNDR6048 15.2 9.1 12.1 MS 9.9 8.0 8.9 MSNDR637 16.1 9.7 12.9 MS 11.1 9.0 10.0 SNDR637 –315.4 11.1 13.3 MS 4.3 11.9 8.1 MSNDR6093 3.6 0 1.8 R 0 5.0 2.5 MRNDR117 11.5 7.7 9.6 MR 8.7 10.1 9.4 MSNDR6164 7.1 3. 5 5.3 MR 7.1 8.5 7.8 MSNDR6166 15.4 3.9 9.6 MR 6.5 9.1 7.8 MSNDR6168 14.3 11.1 12.7 MS 5.4 9.1 7.3 MSNDR6207 7.4 6.1 6.7 MR 3.7 7.1 5.4 MSNDR6208 11.8 8.6 10.3 MS 8.8 8.8 8.8 MSNDR6222 9.1 13.6 11.4 MS 9.1 4.6 6.8 MSNDR6223 6.1 15.4 10.7 MS 3.0 0 1.5 MRNDR6224 12.0 11.5 11.8 MS 11.5 7.7 9.6 MSNDR6225 9.7 12.9 11.3 MS 9.6 9.6 9.6 MSNDR6230 11.8 14.7 13.2 MS 8.1 7.2 7.6 MSNDR6232 4.0 3.6 3.8 R 0 6.2 3.1 MRNDR6233 4.6 9.1 6.9 MR 8.1 7.6 9.8 MSNDR6237 8.7 8.7 8.7 MR 4.3 11.9 8.1 MSNDR6239 14.3 10.7 12.5 MS 6.3 9.8 8.0 MSNDR6234 8.0 4.0 6.0 MR 5.4 9.1 7.3 MSNDR625 7.7 11.5 9.6 MR 8.1 7.9 8.0 MSNDR6236 14.3 11.1 12.7 MS 11.9 8.8 10.3 SPusa Basmati 17.2 13.8 15.5 S 11.0 8.9 9.9 MST. Basmati 13.3 11.1 12.2 MS 10.5 1.1 10.8 ST3 14.9 16.1 15.5 S 11.6 2.5 12.0 SK. namak 10.7 7.7 9.2 MR 7.1 9.3 8.2 MS
aMR = moderately resistant, MS = moderately susceptible, S = susceptible, R = resistant.
Screening of rice genotypes for resistance to leaffolder,Cnaphalocrocis medinalis Guenée, and stem borer,Scirpophaga incertulas Walker
S.P. Gupta, R.A. Singh, J.L. Dwivedi, and R.C. Chaudhary, Narendra Deva University of Agriculture and Technology, CropResearch Station (CRS), Masodha, Faizabad 224133, Uttar Pradesh, India
plots at 20 × 15-cm spacing withfour replicates. All recommendedcrop management practices, ex-cept for plant protection mea-sures, were followed. Infestationwas recorded by counting the to-tal number of leaves and the num-ber of infested leaves (for LF) andthe total number of tillers anddamaged tillers (for SB) from 20randomly selected hills of eachgenotype. NDR6175, NDR6093,
and NDR6232 were found to beresistant, 10 genotypes were mod-erately resistant, 15 were moder-ately susceptible, and two weresusceptible to LF. Six genotypeswere moderately resistant, 20were moderately susceptible, andfour were susceptible to SB (seetable).
33IRRN 28.2
Rodents generally cause chronicpreharvest losses of 5–10% in riceand, in some regions, the problemis escalating (Singleton 2003). Im-pacts of pests on smallholder ricefarmers also have important so-cial and environmental dimen-sions (Heong 1999). Farmers of-ten use inappropriate methods intheir desperate attempts to reducethe impacts of rodents. This in-cludes the use of broad-spectrumpoisons such as endosulfans, or-ganophosphates, and carbamates.Occasionally, these are mixedwith used engine oil before apply-ing them to flooded rice crops(Sudarmaji et al 2003). Thesechemicals and their inappropriateuse are of major environmentalconcern. Another managementaction is the use of power mainsto electrocute rats in flooded ricefields. This has led to deaths ofpeople in the Philippines andVietnam and therefore has majorsocial implications.
Since 1996, there has been aconcerted effort in Southeast Asiato develop an integrated packageof ecologically based methods tomanage rodent pests in lowlandirrigated rice agroecosystems.This led to the development ofvillage-level studies in West Java,Indonesia (Cilamaya; 1999-2002),and in the Red River (Vinh Phuc;2000-02) and Mekong River del-tas in Vietnam (Tien Giang andSoc Trang; 2001-02). We assessedwhether these integrated prac-tices lessened the impact of rats
Reduction in chemical use following integrated ecologicallybased rodent management
G.R. Singleton, Commonwealth Scientific and Industrial Research Organisation (CSIRO) Sustainable Ecosystems, GPOBox 284, Canberra, 2601, Australia; Sudarmaji, Indonesian Institute for Rice Research, Jl Raya No. 9, Sukamandi, Subang,41256 West Java, Indonesia; N.P. Tuan, National Institute of Plant Protection, Chem Tu Liem, Hanoi, Vietnam; P.M. Sang andN.H. Huan, Plant Protection Department, 28 Mac Dinh Chi, Ho Chi Minh City, Vietnam; P.R. Brown and J. Jacob, CSIRO;and K.L. Heong and M.M. Escalada, IRRI
economically and environmen-tally and whether the involve-ment of smallholder farmers inthe study influenced their percep-tions and practices of rodent man-agement. This paper reports onone element of this study: the useof chemicals, plastic exclusionbarriers, and electrocution by in-dividual farmers after they hadparticipated in a community-based program of integrated ro-dent management.
Each region had two treatedand two untreated villages wherelowland irrigated rice was grownon more than 80–120 ha. Beforethese farmer participatory stud-ies, 30–100 farmers from each vil-lage were interviewed on theirknowledge, attitudes, and prac-tices of rat control (see Escaladaand Heong 1997 for details). Theintegrated management actionswere taken for 3 years in WestJava, 3 years in the Red RiverDelta, and 1.5 years in theMekong River Delta. At thecompletion of the study, the farm-ers were interviewed again to as-sess changes in their perceptionsand practices.
In West Java, the rice fieldrat, Rattus argentiventer, is thedominant rodent pest. In both theRed River and Mekong River del-tas in Vietnam, the rice field rat isthe most common species, but thelesser rice field rat, R. losea, alsooccurs in moderate densities. Al-though this study was conductedin different countries and regions,
chemical control was the mostcommon method used to managerats in lowland irrigated ricecrops (see table). Interestingly, thechemicals used are often those notregistered for killing rodents: en-dosulfan plus oil in Indonesia(100% of farmers in a village usedit in 1999 and 88% in 2002) and aChinese “rodenticide” in Vietnam(37% of farmers in Soc Trang usedit in 2001). From our experiences,farmers tend not to report theiruse of power mains to electrocuterats because it is banned in Indo-nesia and Vietnam. We weretherefore surprised that approxi-mately 40% of the farmers regu-larly used this method in SocTrang Province. Another methodof environmental concern is thewidespread use of plastic fencesto physically exclude rats fromcrops in the Red River Delta. Theenvironmental issue is the dis-posal of the plastic, which is dis-carded after two crop seasons. Analternative we recommended wasto convert a few of their plasticfences to trap-barrier systems(TBS) (Singleton et al 1998), whichachieve two purposes. First, onlyone TBS per 10 ha is required aspart of the integrated manage-ment practices for rodents, whichreduces markedly the amount ofplastic in the fields. Second, giventhat the average farm size is lessthan 2 ha, the wider coverage ofa TBS encourages a communityapproach to rodent management.
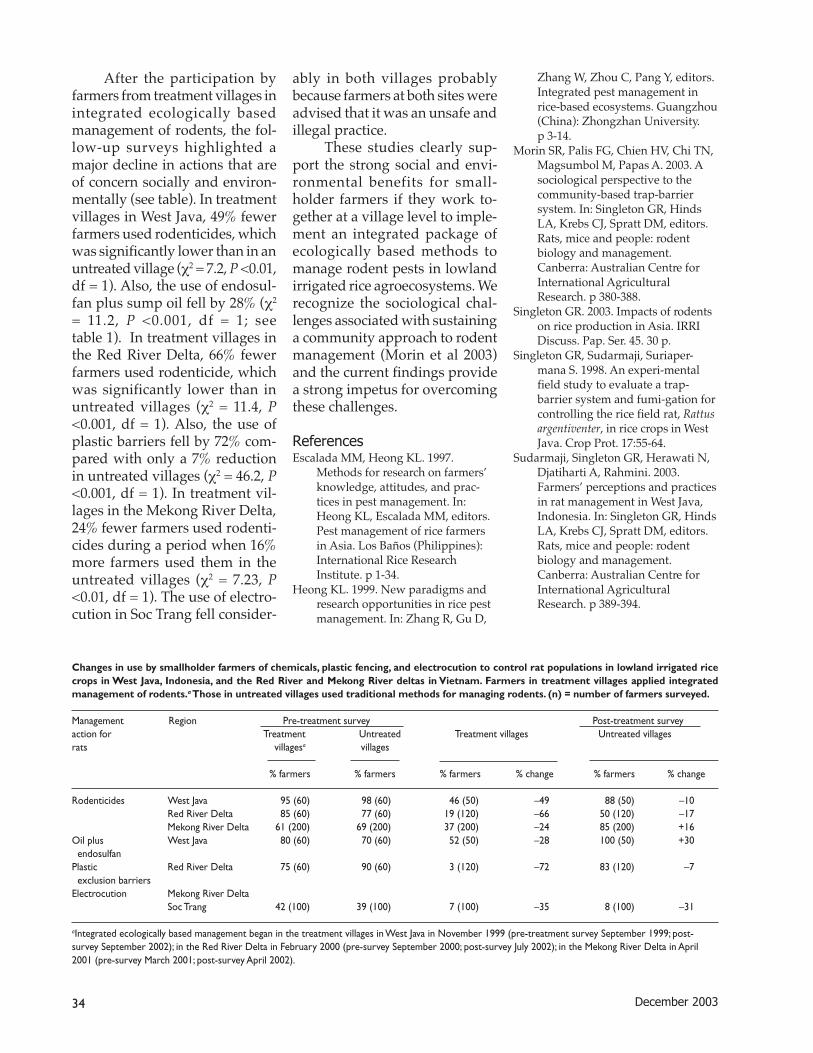
34 December 2003
After the participation byfarmers from treatment villages inintegrated ecologically basedmanagement of rodents, the fol-low-up surveys highlighted amajor decline in actions that areof concern socially and environ-mentally (see table). In treatmentvillages in West Java, 49% fewerfarmers used rodenticides, whichwas significantly lower than in anuntreated village (χ2 = 7.2, P <0.01,df = 1). Also, the use of endosul-fan plus sump oil fell by 28% (χ2
= 11.2, P <0.001, df = 1; seetable 1). In treatment villages inthe Red River Delta, 66% fewerfarmers used rodenticide, whichwas significantly lower than inuntreated villages (χ2 = 11.4, P<0.001, df = 1). Also, the use ofplastic barriers fell by 72% com-pared with only a 7% reductionin untreated villages (χ2 = 46.2, P<0.001, df = 1). In treatment vil-lages in the Mekong River Delta,24% fewer farmers used rodenti-cides during a period when 16%more farmers used them in theuntreated villages (χ2 = 7.23, P<0.01, df = 1). The use of electro-cution in Soc Trang fell consider-
ably in both villages probablybecause farmers at both sites wereadvised that it was an unsafe andillegal practice.
These studies clearly sup-port the strong social and envi-ronmental benefits for small-holder farmers if they work to-gether at a village level to imple-ment an integrated package ofecologically based methods tomanage rodent pests in lowlandirrigated rice agroecosystems. Werecognize the sociological chal-lenges associated with sustaininga community approach to rodentmanagement (Morin et al 2003)and the current findings providea strong impetus for overcomingthese challenges.
ReferencesEscalada MM, Heong KL. 1997.
Methods for research on farmers’knowledge, attitudes, and prac-tices in pest management. In:Heong KL, Escalada MM, editors.Pest management of rice farmersin Asia. Los Baños (Philippines):International Rice ResearchInstitute. p 1-34.
Heong KL. 1999. New paradigms andresearch opportunities in rice pestmanagement. In: Zhang R, Gu D,
Zhang W, Zhou C, Pang Y, editors.Integrated pest management inrice-based ecosystems. Guangzhou(China): Zhongzhan University.p 3-14.
Morin SR, Palis FG, Chien HV, Chi TN,Magsumbol M, Papas A. 2003. Asociological perspective to thecommunity-based trap-barriersystem. In: Singleton GR, HindsLA, Krebs CJ, Spratt DM, editors.Rats, mice and people: rodentbiology and management.Canberra: Australian Centre forInternational AgriculturalResearch. p 380-388.
Singleton GR. 2003. Impacts of rodentson rice production in Asia. IRRIDiscuss. Pap. Ser. 45. 30 p.
Singleton GR, Sudarmaji, Suriaper-mana S. 1998. An experi-mentalfield study to evaluate a trap-barrier system and fumi-gation forcontrolling the rice field rat, Rattusargentiventer, in rice crops in WestJava. Crop Prot. 17:55-64.
Sudarmaji, Singleton GR, Herawati N,Djatiharti A, Rahmini. 2003.Farmers’ perceptions and practicesin rat management in West Java,Indonesia. In: Singleton GR, HindsLA, Krebs CJ, Spratt DM, editors.Rats, mice and people: rodentbiology and management.Canberra: Australian Centre forInternational AgriculturalResearch. p 389-394.
Changes in use by smallholder farmers of chemicals, plastic fencing, and electrocution to control rat populations in lowland irrigated ricecrops in West Java, Indonesia, and the Red River and Mekong River deltas in Vietnam. Farmers in treatment villages applied integratedmanagement of rodents.a Those in untreated villages used traditional methods for managing rodents. (n) = number of farmers surveyed.
Management Region Pre-treatment survey Post-treatment surveyaction for Treatment Untreated Treatment villages Untreated villagesrats villagesa villages
% farmers % farmers % farmers % change % farmers % change
Rodenticides West Java 95 (60) 98 (60) 46 (50) –49 88 (50) –10Red River Delta 85 (60) 77 (60) 19 (120) –66 50 (120) –17Mekong River Delta 61 (200) 69 (200) 37 (200) –24 85 (200) +16
Oil plus West Java 80 (60) 70 (60) 52 (50) –28 100 (50) +30 endosulfanPlastic Red River Delta 75 (60) 90 (60) 3 (120) –72 83 (120) –7 exclusion barriersElectrocution Mekong River Delta
Soc Trang 42 (100) 39 (100) 7 (100) –35 8 (100) –31
aIntegrated ecologically based management began in the treatment villages in West Java in November 1999 (pre-treatment survey September 1999; post-survey September 2002); in the Red River Delta in February 2000 (pre-survey September 2000; post-survey July 2002); in the Mekong River Delta in April2001 (pre-survey March 2001; post-survey April 2002).
35IRRN 28.2
During the 2001 wet season (Jun-Nov), the popular, high-yielding,and widely adapted cultivarSwarna was observed to havemany linear red-brown spots.These had light-colored marginsand light brown to gray centers.Observed on leaves during thelater (dough and mature grain)growth stages, the spots were re-stricted between the veins. Theexperimental plots of the rice-wheat system of the Rice Re-search Station, Chinsurah, wereexposed to these weather condi-tions: mean maximum tempera-ture, 32 °C; mean minimum tem-perature, 25 °C; relative humid-ity, 98%; and rainfall, 942 mm. Asimilar type of lesions was alsofound on the leaf sheaths,pedicels, and glumes. The lesionswere 2–10 × 0.5–1 mm and theycoalesced to form long, threadlike
AcknowledgmentsThis research was funded by the Austra-lian Centre for International AgriculturalResearch (As1/98/36) in West Java and
the Red River Delta, and by the Austra-lian Agency for International Develop-ment (Centre for Agricultural Research
and Development) in the Mekong RiverDelta. We thank Susan Williams for herassistance with the Red River Delta study.
First report of narrow brown leaf spot disease of rice in WestBengal, India
A. Biswas, Rice Research Station, Chinsurah 712102, West Bengal, India
brown lesions parallel to the veinson the entire leaves.
A preliminary microscopicstudy of the 20-d-old fungalcolony revealed that the conidio-phores emerge from host stomata;are pale brown, geniculate, inclusters of 3–5, and uniform incolor; have three or more septa;are irregular in width and haverounded tips; and the old scarpsare rounded on conspicuousshoulders or on short peg-likeprotrusions, measuring 80–140 ×4–6 mm. Conidia were light oliveand cylindrical to subclavate,with 3–10 septa, an obeonic base,blunt tips, in whorls of 3–4 on theconidiophore tip and measuring15–60 × 3–5 mm. Conidia pro-duced in rice-straw agar-culturemedia were hyaline. These con-firmed that the fungus isCercospora janseana (Racib.) O.
Const. and it causes narrowbrown leaf spot (NBLS) orcercospora leaf spot disease.
Pathogenicity tests weredone on Swarna during panicleemergence. The plants weresprayed with spore suspension (8× 10⁴ spores mL–1 water) in lateafternoon, then covered with apolythene sheet to preserve themoisture. The plants were sur-face-irrigated profusely by usingtube-well water. Typical NBLSsymptoms appeared within 21–25d after inoculation. This is the firstreport of this disease from thestate of West Bengal, India.
The affected leaf area wasonly 5%. As such, the incidencewas not considered to be seriousbut close monitoring is necessaryto prevent its spread.
○ ○ ○ ○ ○ ○ ○ ○ ○ ○ ○ ○ ○ ○ ○ ○ ○ ○ ○
www.irri.org
For the latest news on rice, read
IRRI’s new biannual magazine
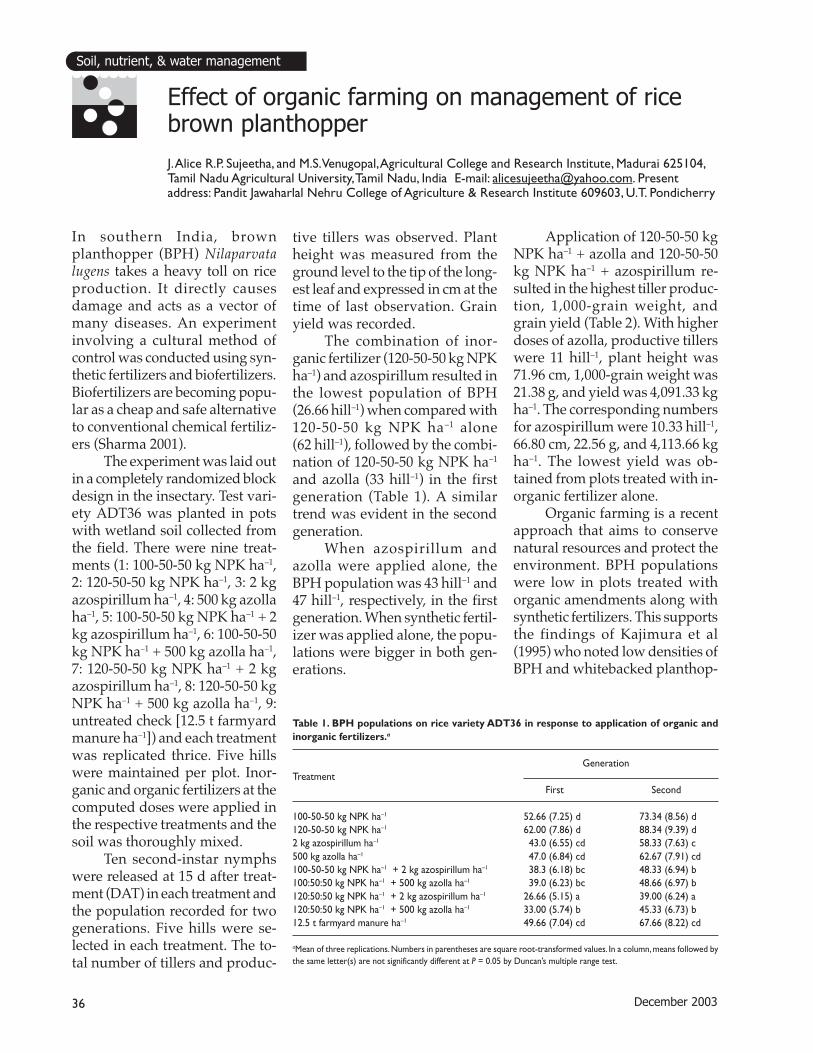
36 December 2003
Soil, nutrient, & water management
In southern India, brownplanthopper (BPH) Nilaparvatalugens takes a heavy toll on riceproduction. It directly causesdamage and acts as a vector ofmany diseases. An experimentinvolving a cultural method ofcontrol was conducted using syn-thetic fertilizers and biofertilizers.Biofertilizers are becoming popu-lar as a cheap and safe alternativeto conventional chemical fertiliz-ers (Sharma 2001).
The experiment was laid outin a completely randomized blockdesign in the insectary. Test vari-ety ADT36 was planted in potswith wetland soil collected fromthe field. There were nine treat-ments (1: 100-50-50 kg NPK ha–1,2: 120-50-50 kg NPK ha–1, 3: 2 kgazospirillum ha–1, 4: 500 kg azollaha–1, 5: 100-50-50 kg NPK ha–1 + 2kg azospirillum ha–1, 6: 100-50-50kg NPK ha–1 + 500 kg azolla ha–1,7: 120-50-50 kg NPK ha–1 + 2 kgazospirillum ha–1, 8: 120-50-50 kgNPK ha–1 + 500 kg azolla ha–1, 9:untreated check [12.5 t farmyardmanure ha–1]) and each treatmentwas replicated thrice. Five hillswere maintained per plot. Inor-ganic and organic fertilizers at thecomputed doses were applied inthe respective treatments and thesoil was thoroughly mixed.
Ten second-instar nymphswere released at 15 d after treat-ment (DAT) in each treatment andthe population recorded for twogenerations. Five hills were se-lected in each treatment. The to-tal number of tillers and produc-
Effect of organic farming on management of ricebrown planthopper
J. Alice R.P. Sujeetha, and M.S. Venugopal, Agricultural College and Research Institute, Madurai 625104,Tamil Nadu Agricultural University, Tamil Nadu, India E-mail: [email protected]. Presentaddress: Pandit Jawaharlal Nehru College of Agriculture & Research Institute 609603, U.T. Pondicherry
tive tillers was observed. Plantheight was measured from theground level to the tip of the long-est leaf and expressed in cm at thetime of last observation. Grainyield was recorded.
The combination of inor-ganic fertilizer (120-50-50 kg NPKha–1) and azospirillum resulted inthe lowest population of BPH(26.66 hill–1) when compared with120-50-50 kg NPK ha–1 alone(62 hill–1), followed by the combi-nation of 120-50-50 kg NPK ha–1
and azolla (33 hill–1) in the firstgeneration (Table 1). A similartrend was evident in the secondgeneration.
When azospirillum andazolla were applied alone, theBPH population was 43 hill–1 and47 hill–1, respectively, in the firstgeneration. When synthetic fertil-izer was applied alone, the popu-lations were bigger in both gen-erations.
Application of 120-50-50 kgNPK ha–1 + azolla and 120-50-50kg NPK ha–1 + azospirillum re-sulted in the highest tiller produc-tion, 1,000-grain weight, andgrain yield (Table 2). With higherdoses of azolla, productive tillerswere 11 hill–1, plant height was71.96 cm, 1,000-grain weight was21.38 g, and yield was 4,091.33 kgha–1. The corresponding numbersfor azospirillum were 10.33 hill–1,66.80 cm, 22.56 g, and 4,113.66 kgha–1. The lowest yield was ob-tained from plots treated with in-organic fertilizer alone.
Organic farming is a recentapproach that aims to conservenatural resources and protect theenvironment. BPH populationswere low in plots treated withorganic amendments along withsynthetic fertilizers. This supportsthe findings of Kajimura et al(1995) who noted low densities ofBPH and whitebacked planthop-
Table 1. BPH populations on rice variety ADT36 in response to application of organic andinorganic fertilizers.a
GenerationTreatment
First Second
100-50-50 kg NPK ha–1 52.66 (7.25) d 73.34 (8.56) d120-50-50 kg NPK ha–1 62.00 (7.86) d 88.34 (9.39) d2 kg azospirillum ha–1 43.0 (6.55) cd 58.33 (7.63) c500 kg azolla ha–1 47.0 (6.84) cd 62.67 (7.91) cd100-50-50 kg NPK ha–1 + 2 kg azospirillum ha–1 38.3 (6.18) bc 48.33 (6.94) b100:50:50 kg NPK ha–1 + 500 kg azolla ha–1 39.0 (6.23) bc 48.66 (6.97) b120:50:50 kg NPK ha–1 + 2 kg azospirillum ha–1 26.66 (5.15) a 39.00 (6.24) a120:50:50 kg NPK ha–1 + 500 kg azolla ha–1 33.00 (5.74) b 45.33 (6.73) b12.5 t farmyard manure ha–1 49.66 (7.04) cd 67.66 (8.22) cd
aMean of three replications. Numbers in parentheses are square root-transformed values. In a column, means followed bythe same letter(s) are not significantly different at P = 0.05 by Duncan’s multiple range test.

37IRRN 28.2
per in organically farmed fieldsand those with low N content.Chino et al (1987) reported thatasparagine content of plant ph-loem sap was significantly lowerunder organic cultivation,thereby adversely affecting thefeeding activity of BPH. Plotstreated with 120-50-50 kg NPKha–1 had significantly higher lev-els of BPH (Table 1). But BPH lev-
els in azolla plots were not signifi-cantly different from those in con-trol plots (with farmyard ma-nure).
ReferencesChino M, Hayashi H, Fukumota T.
1987. Composition of rice phloemsap and its fluctuation. J. PlantNutr. 10:1651-1661.
Kajimura T, Fujisaki K, Nagasuji F.
1995. Effect of organic rice farmingon leafhoppers and planthoppersand amino acid contents in ricephloem sap and survival rate ofplanthoppers. Appl. Entomol.30:17-22.
Sharma AK. 2001. A handbook oforganic farming. Jodhpur (India):Agrobios. 219 p.
Table 2. Growth and yield characteristics of rice variety ADT36 as affected by application of organic and inorganic fertilizers and biofertilizers.a
Treatment Total tillers Productive tillers Plant height 1,000-grain Grain yieldhill–1(no.) hill–1(no.) (cm) weight(g) (t ha–1)
100-50-50 kg NPK ha–1 10.66 c 7.33 c 52.46 c 18.5 bc 3.4 d120-50-50 kg NPK ha–1 12.33 b 9.66 ab 56.46 bc 19.66 abc 3.6 c2 kg azospirillum ha–1 12.66 b 9.00 b 53.43 c 19.66 abc 3.5 cd500 kg azolla ha–1 13.00 b 9.33 b 59.50 bcd 19.1 abc 3.4 d100-50-50 kg NPK ha–1 + 2 kg azospirillum ha–1 12.66 b 9.66 ab 66.93 abc 21.73 a 3.9 b100:50:50 kg NPK ha–1 + 500 kg azolla ha–1 12.33 b 9.66 ab 67.63 ab 21.23 a 3.9 b120:50:50 kg NPK ha–1 + 2 kg azospirillum ha–1 14.33 a 10.33 ab 66.80 abc 22.56 a 4.1 a120:50:50 kg NPK ha–1 + 500 kg azolla ha–1 14.66 a 11.00 a 71.96 a 21.38 a 4.1 a12.5 t farmyard manure ha–1 12.33 b 9.33 b 64.13 abc 20.66 ab 3.6 c
aMean of three replications. In a column, means followed by the same letter(s) are not significantly different at P = 0.05 by Duncan’s multiple range test.
Previous studies have shown thatiron (Fe) content of rice grain mayvary widely among rice geno-types (Senadhira et al 1998, Prom-u-thai and Rerkasem 2001). Inaddition, grain Fe may also be af-fected by environmental andmanagement conditions. This ex-periment measured grain Fe con-centration in five rice genotypes(KDML 105, IR68144, Ubon 2,Basmati 370, and RD6) grownunder three levels of N (0, 60, and120 kg N ha–1). The field experi-ment was in a split-plot designwith three replications. Basal fer-tilizer consisted of 6.6 kg P and12.4 kg K ha–1. The basal fertilizerand half of the N were applied attransplanting and the other half
The effect of nitrogen on rice grain iron
C. Prom-u-thai and B. Rerkasem, Department of Agronomy, Faculty of Agriculture, Chiang Mai University, Chiang Mai50200, Thailand E-mail: [email protected]
of N was applied after 4 wk. Feconcentration was determined inmature grain, as unhusked(whole grain with palea andlemma intact) and brown rice(palea and lemma removed),husk (palea and lemma), and pol-ished grain (30 s) by dry-ashingand atomic absorption spectrom-etry (Emmanuel et al 1984).
In all five genotypes, grainyield increased slightly with theapplication of 60 kg N ha–1, butthere was no further effect of in-creasing N to 120 kg ha–1 (P<0.05)(Table 1). Nitrogen fertilizer gen-erally increased N content of therice grain (Table 2). On the otherhand, grain Fe concentrations inthe five genotypes were affected
differently by N rates (Table 3).The Fe concentration in unhuskedKDML 105, IR68144, Ubon 2,Basmasti 370, and RD6 increased
Table 1. Grain yield (t ha–1) of five genotypesgrown at three levels of nitrogen (0, 60, 120kg N ha–1).
Grain yield (t ha–1)Genotype
0 kg N 60 kg N 120 kg N
KDML 105 3.6 4.0 3.8IR68144 2.7 4.7 3.9Ubon 2 4.1 4.0 3.7RD6 3.1 3.4 3.3Basmati 370 3.7 3.3 3.4
3.2 a 3.8 b 3.6 bAnalysis of variance
P (genotypes [G]) nsP (N) <0.05P (G × N) nsLSD (N, 0.05) 0.4
○ ○ ○ ○ ○ ○ ○ ○ ○ ○ ○ ○ ○ ○ ○ ○ ○ ○ ○
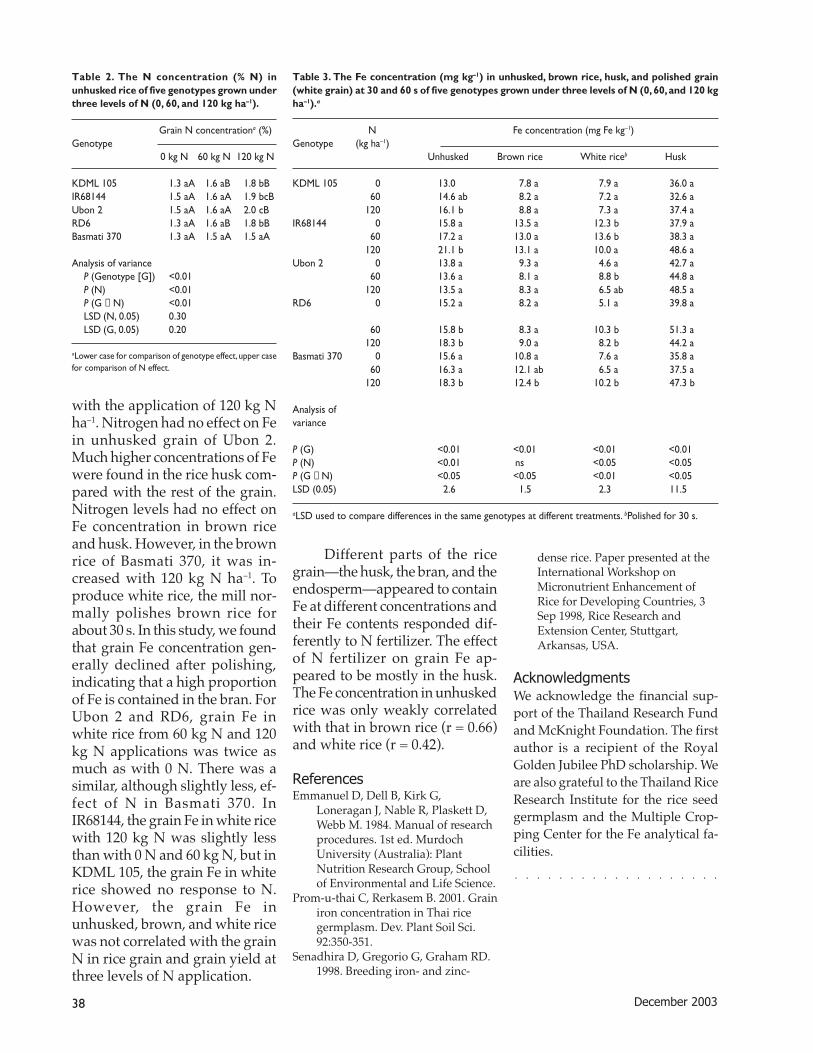
38 December 2003
with the application of 120 kg Nha–1. Nitrogen had no effect on Fein unhusked grain of Ubon 2.Much higher concentrations of Fewere found in the rice husk com-pared with the rest of the grain.Nitrogen levels had no effect onFe concentration in brown riceand husk. However, in the brownrice of Basmati 370, it was in-creased with 120 kg N ha–1. Toproduce white rice, the mill nor-mally polishes brown rice forabout 30 s. In this study, we foundthat grain Fe concentration gen-erally declined after polishing,indicating that a high proportionof Fe is contained in the bran. ForUbon 2 and RD6, grain Fe inwhite rice from 60 kg N and 120kg N applications was twice asmuch as with 0 N. There was asimilar, although slightly less, ef-fect of N in Basmati 370. InIR68144, the grain Fe in white ricewith 120 kg N was slightly lessthan with 0 N and 60 kg N, but inKDML 105, the grain Fe in whiterice showed no response to N.However, the grain Fe inunhusked, brown, and white ricewas not correlated with the grainN in rice grain and grain yield atthree levels of N application.
Table 2. The N concentration (% N) inunhusked rice of five genotypes grown underthree levels of N (0, 60, and 120 kg ha–1).
Grain N concentrationa (%)Genotype
0 kg N 60 kg N 120 kg N
KDML 105 1.3 aA 1.6 aB 1.8 bBIR68144 1.5 aA 1.6 aA 1.9 bcBUbon 2 1.5 aA 1.6 aA 2.0 cBRD6 1.3 aA 1.6 aB 1.8 bBBasmati 370 1.3 aA 1.5 aA 1.5 aA
Analysis of varianceP (Genotype [G]) <0.01P (N) <0.01P (G × N) <0.01LSD (N, 0.05) 0.30LSD (G, 0.05) 0.20
aLower case for comparison of genotype effect, upper casefor comparison of N effect.
Different parts of the ricegrain—the husk, the bran, and theendosperm—appeared to containFe at different concentrations andtheir Fe contents responded dif-ferently to N fertilizer. The effectof N fertilizer on grain Fe ap-peared to be mostly in the husk.The Fe concentration in unhuskedrice was only weakly correlatedwith that in brown rice (r = 0.66)and white rice (r = 0.42).
ReferencesEmmanuel D, Dell B, Kirk G,
Loneragan J, Nable R, Plaskett D,Webb M. 1984. Manual of researchprocedures. 1st ed. MurdochUniversity (Australia): PlantNutrition Research Group, Schoolof Environmental and Life Science.
Prom-u-thai C, Rerkasem B. 2001. Grainiron concentration in Thai ricegermplasm. Dev. Plant Soil Sci.92:350-351.
Senadhira D, Gregorio G, Graham RD.1998. Breeding iron- and zinc-
Table 3. The Fe concentration (mg kg–1) in unhusked, brown rice, husk, and polished grain(white grain) at 30 and 60 s of five genotypes grown under three levels of N (0, 60, and 120 kgha–1).a
N Fe concentration (mg Fe kg–1)Genotype (kg ha–1)
Unhusked Brown rice White riceb Husk
KDML 105 0 13.0 7.8 a 7.9 a 36.0 a60 14.6 ab 8.2 a 7.2 a 32.6 a
120 16.1 b 8.8 a 7.3 a 37.4 aIR68144 0 15.8 a 13.5 a 12.3 b 37.9 a
60 17.2 a 13.0 a 13.6 b 38.3 a120 21.1 b 13.1 a 10.0 a 48.6 a
Ubon 2 0 13.8 a 9.3 a 4.6 a 42.7 a60 13.6 a 8.1 a 8.8 b 44.8 a
120 13.5 a 8.3 a 6.5 ab 48.5 aRD6 0 15.2 a 8.2 a 5.1 a 39.8 a
60 15.8 b 8.3 a 10.3 b 51.3 a120 18.3 b 9.0 a 8.2 b 44.2 a
Basmati 370 0 15.6 a 10.8 a 7.6 a 35.8 a60 16.3 a 12.1 ab 6.5 a 37.5 a
120 18.3 b 12.4 b 10.2 b 47.3 b
Analysis ofvariance
P (G) <0.01 <0.01 <0.01 <0.01P (N) <0.01 ns <0.05 <0.05P (G × N) <0.05 <0.05 <0.01 <0.05LSD (0.05) 2.6 1.5 2.3 11.5
aLSD used to compare differences in the same genotypes at different treatments. bPolished for 30 s.
dense rice. Paper presented at theInternational Workshop onMicronutrient Enhancement ofRice for Developing Countries, 3Sep 1998, Rice Research andExtension Center, Stuttgart,Arkansas, USA.
AcknowledgmentsWe acknowledge the financial sup-port of the Thailand Research Fundand McKnight Foundation. The firstauthor is a recipient of the RoyalGolden Jubilee PhD scholarship. Weare also grateful to the Thailand RiceResearch Institute for the rice seedgermplasm and the Multiple Crop-ping Center for the Fe analytical fa-cilities.
○ ○ ○ ○ ○ ○ ○ ○ ○ ○ ○ ○ ○ ○ ○ ○ ○ ○ ○
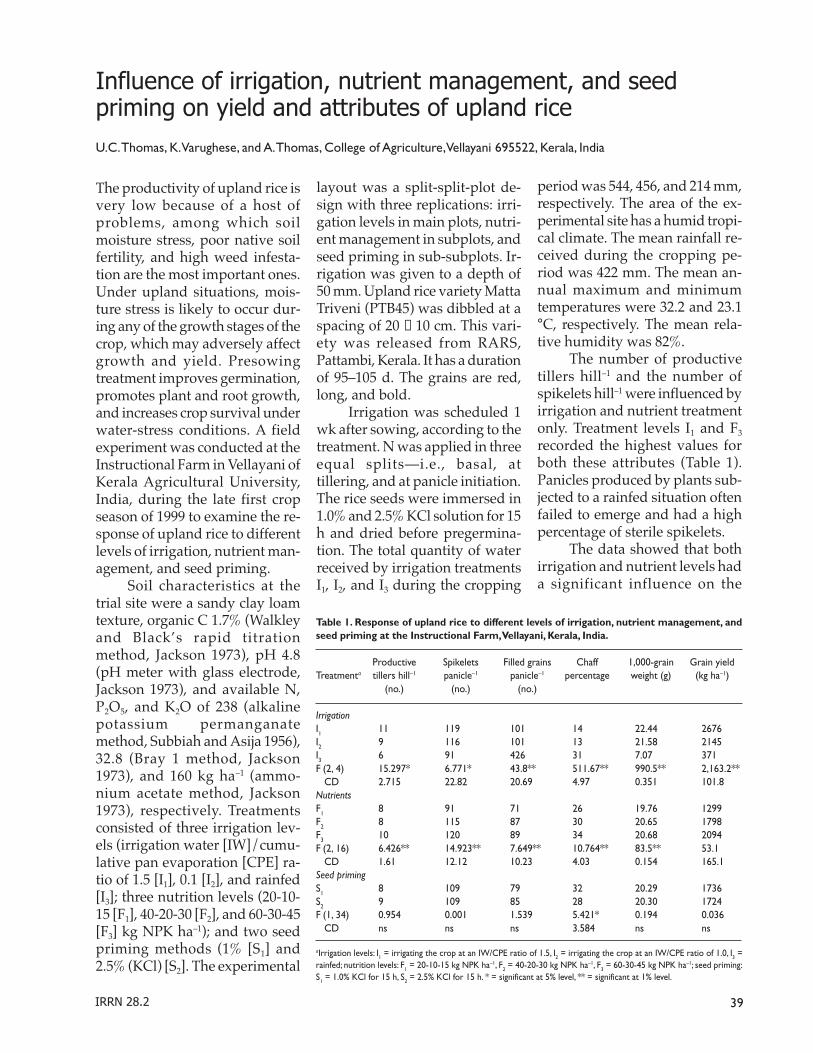
39IRRN 28.2
The productivity of upland rice isvery low because of a host ofproblems, among which soilmoisture stress, poor native soilfertility, and high weed infesta-tion are the most important ones.Under upland situations, mois-ture stress is likely to occur dur-ing any of the growth stages of thecrop, which may adversely affectgrowth and yield. Presowingtreatment improves germination,promotes plant and root growth,and increases crop survival underwater-stress conditions. A fieldexperiment was conducted at theInstructional Farm in Vellayani ofKerala Agricultural University,India, during the late first cropseason of 1999 to examine the re-sponse of upland rice to differentlevels of irrigation, nutrient man-agement, and seed priming.
Soil characteristics at thetrial site were a sandy clay loamtexture, organic C 1.7% (Walkleyand Black’s rapid titrationmethod, Jackson 1973), pH 4.8(pH meter with glass electrode,Jackson 1973), and available N,P2O5, and K2O of 238 (alkalinepotassium permanganatemethod, Subbiah and Asija 1956),32.8 (Bray 1 method, Jackson1973), and 160 kg ha–1 (ammo-nium acetate method, Jackson1973), respectively. Treatmentsconsisted of three irrigation lev-els (irrigation water [IW]/cumu-lative pan evaporation [CPE] ra-tio of 1.5 [I1], 0.1 [I2], and rainfed[I3]; three nutrition levels (20-10-15 [F1], 40-20-30 [F2], and 60-30-45[F3] kg NPK ha–1); and two seedpriming methods (1% [S1] and2.5% (KCl) [S2]. The experimental
Influence of irrigation, nutrient management, and seedpriming on yield and attributes of upland rice
U.C. Thomas, K. Varughese, and A. Thomas, College of Agriculture, Vellayani 695522, Kerala, India
layout was a split-split-plot de-sign with three replications: irri-gation levels in main plots, nutri-ent management in subplots, andseed priming in sub-subplots. Ir-rigation was given to a depth of50 mm. Upland rice variety MattaTriveni (PTB45) was dibbled at aspacing of 20 × 10 cm. This vari-ety was released from RARS,Pattambi, Kerala. It has a durationof 95–105 d. The grains are red,long, and bold.
Irrigation was scheduled 1wk after sowing, according to thetreatment. N was applied in threeequal splits—i.e., basal, attillering, and at panicle initiation.The rice seeds were immersed in1.0% and 2.5% KCl solution for 15h and dried before pregermina-tion. The total quantity of waterreceived by irrigation treatmentsI1, I2, and I3 during the cropping
period was 544, 456, and 214 mm,respectively. The area of the ex-perimental site has a humid tropi-cal climate. The mean rainfall re-ceived during the cropping pe-riod was 422 mm. The mean an-nual maximum and minimumtemperatures were 32.2 and 23.1°C, respectively. The mean rela-tive humidity was 82%.
The number of productivetillers hill–1 and the number ofspikelets hill–1 were influenced byirrigation and nutrient treatmentonly. Treatment levels I1 and F3
recorded the highest values forboth these attributes (Table 1).Panicles produced by plants sub-jected to a rainfed situation oftenfailed to emerge and had a highpercentage of sterile spikelets.
The data showed that bothirrigation and nutrient levels hada significant influence on the
Table 1. Response of upland rice to different levels of irrigation, nutrient management, andseed priming at the Instructional Farm, Vellayani, Kerala, India.
Productive Spikelets Filled grains Chaff 1,000-grain Grain yieldTreatmenta tillers hill–1 panicle–1 panicle–1 percentage weight (g) (kg ha–1)
(no.) (no.) (no.)
IrrigationI1 11 119 101 14 22.44 2676I2 9 116 101 13 21.58 2145I3 6 91 426 31 7.07 371F (2, 4) 15.297* 6.771* 43.8** 511.67** 990.5** 2,163.2** CD 2.715 22.82 20.69 4.97 0.351 101.8NutrientsF1 8 91 71 26 19.76 1299F2 8 115 87 30 20.65 1798F3 10 120 89 34 20.68 2094F (2, 16) 6.426** 14.923** 7.649** 10.764** 83.5** 53.1 CD 1.61 12.12 10.23 4.03 0.154 165.1Seed primingS1 8 109 79 32 20.29 1736S2 9 109 85 28 20.30 1724F (1, 34) 0.954 0.001 1.539 5.421* 0.194 0.036 CD ns ns ns 3.584 ns ns
aIrrigation levels: I1 = irrigating the crop at an IW/CPE ratio of 1.5, I2 = irrigating the crop at an IW/CPE ratio of 1.0, I3 =rainfed; nutrition levels: F1 = 20-10-15 kg NPK ha–1, F2 = 40-20-30 kg NPK ha–1, F3 = 60-30-45 kg NPK ha–1; seed priming:S1 = 1.0% KCl for 15 h, S2 = 2.5% KCl for 15 h. * = significant at 5% level, ** = significant at 1% level.

40 December 2003
Table 2. Interaction effects of irrigation, nutrients, and seed priming on number of spikeletspanicle–1, number of filled grains panicle–1, chaff percentage, 1,000-grain weight (g), and grainyield (kg ha–1).a
Treatment Spikelets Filled grains Chaff 1,000-grain Grain yieldpanicle–1(no.) panicle–1(no.) percentage weight (g) (kg ha–1)
I1 F1 110 101 9.83 21.11 2,155I1 F2 112 96 13.83 23.14 2,650I1 F
3136 113 17.33 23.45 3,223
I2 F1 91 79 13 21.73 1,431I2 F2 139 121 14.67 21.20 2,386I2 F
3118 104 12.83 21.80 2,617
I3 F1 72 34 53.83 16.43 313I3 F2 95 43 75.17 17.60 358I3 F
3107 49 60.17 17.20 441
F(4, 16) 14.9** 4.37* 6.997** 53.616** 11.106** CD 12.121 17.721 6.9 0.367 286.05I1F
1S
1107 97 8.33 21.63 2,029
I1F1S2 113 105 11.33 20.60 2,279I1F2S1 113 102 9.67 23.25 2,599I1F
2S
2110 90 18 23.00 2,701
I1F3S1 142 115 19 22.40 3,276I1F2S2 129 110 15.67 22.50 3,169I2F
1S
193 80 13.33 22.47 1,355
I2F1S2 89 78 12.67 21.00 1,506I2F2S1 110 94 17.67 21.40 2,742I2F
2S
2167 148 10.67 21.00 2,030
I2F3S1 128 116 10.67 22.20 2,828I2F3S2 107 92 15 21.40 2,406I3F
1S
173 33 56 15.47 177
I3F1S2 70 34 51.67 17.40 449I3F2S1 99 36 91.33 17.00 261I3F
2S
291 50 59 18.20 456
I3F3S1 113 42 62.67 16.77 358I3F3S2 101 57 57.67 17.60 523F(4, 34) 2.649 3.696* 4.173** 20.7** 1.461 CD – 27.45 10.17 0.888 –
a* = significant at 5%, ** = significant at 1%.
number of filled grains panicle–1.Irrigation treatments I1 and I2
were on a par with each other andwere significantly superior to I3.
Similarly, F2 and F3 were on a parwith each other and were signifi-cantly superior to F1. The interac-tion I × F was significant and thetreatment combination I2 F2 re-corded the highest number offilled grains panicle–1 (Table 2).
Both the irrigation treat-ments I1 and I2 registered lesschaff percentage compared withthe rainfed treatment (Table 1).The nutrient level F3 producedsignificantly higher values ofchaff percentage than F1 and F2.A higher fertilizer dose increasedvegetative growth, resulting inhigher leaf area index, and thismight have resulted in mutualshading, which affected photo-synthesis and thus gave a highchaff percentage. The seed prim-ing treatment S2 recorded lowervalues of chaff. Lowest chaff per-centage values were found incombinations I1 F1 and I1 F1 S1.
Irrigation at the I1 level re-corded significantly higher 1,000-grain weight over I2 and I3. Simi-larly, the highest level of NPK (F3)produced a higher 1,000-grainweight than F2 and F1. The inter-action effect of I × F indicated thatthe highest level tested in the trial(I1 F3) gave the highest test weightand was on a par with I1 F2.Among I × F × S combinations, I1
F2 S1 recorded the highest testweight and was on a par with I1
F2 S2.Data indicated that the fac-
tors irrigation and nutrition andthe interaction I × F had a signifi-cant influence on grain yield. I1
gave the highest grain yield (2,676kg ha–1), which was significantlysuperior to I2 (2,145 kg ha–1) andI3 (371 kg ha–1). I1 recorded a yieldincrease of 24.8% in grain yieldover I2 (IW/CPE = 1.0). This in-
crease in yield was due to the con-comitant increase of the yield at-tributes at higher levels of irriga-tion. The drastic reduction inyield under moisture stress wasmainly due to the increased num-ber of unfilled grains panicle–1
rather than a reduction in panicleper unit area. Among the nutri-ent levels tested, F3 recorded thehighest grain yield of 2,094 kgha–1, which was significantly su-perior to the other two levels.Among I × F combinations, I1 F3
registered the highest grain yieldof 3,223 kg ha–1. This value indi-cates that good water availabilityand better nutrition result inhigher yields and that seed prim-ing has no influence. It is evidentfrom the study that the crop re-
sponds to an irrigation level withan IW/CPC ratio of 1.5 and thatan NPK level of 60-30-45 kg ha–1
helps attain maximum yield.
ReferencesJackson ML. 1973. Soil chemical
analysis. 2nd ed. New Delhi:Prentice Hall of India Pvt. Ltd.498 p.
Subbiah BV, Asija LL. 1956. A rapidprocedure for estimation ofavailable nitrogen in soils. Curr.Sci. 25:259-260.
○ ○ ○ ○ ○ ○ ○ ○ ○ ○ ○ ○ ○ ○ ○ ○ ○ ○ ○
41IRRN 28.2
The use of indigenous rock phos-phate (RP) as fertilizer is becom-ing increasingly important in In-dia. The RP deposit in India wasestimated to be about 260 t(Narayanasamy and Biswas1998). Khasawnch and Doll (1986)reported that RP is as effective aswater-soluble P fertilizer undersuitable environments. As theavailability of RP increases slowlyand continuously when in contactwith the soil, its effectiveness wastwo to three times more than thatof triple superphosphate (Chienand Hammond 1988).
The application of RP withorganic manure enhances the dis-solution of RP in the soil and thusincreases the plant availability ofP. The organic acids producedduring the decomposition of or-ganic manure supply protons (W)for RP dissolution (Bagava-thiammal and Mahimairaja 1999).In association with phosphate-solubilizing microorganisms andorganic manure, RP could be usedas a P source in many crops. Themechanism behind the solubiliza-tion of P from RP by microorgan-isms is related to the productionof organic acids and chelatingsubstances (Datta et al 1982). Theresidual effect of RP is more pro-nounced in the presence of or-ganic manure in a rice-rice crop-ping system (Panda 1989). Roy etal (1997) found that in UdicUstochrepts, rice yield and soilenrichment could be improved byusing Mussoorie RP (MRP) incor-porated with legume straw andphosphobacteria (PB) (Bacillus
Effect of organic and inorganic P fertilizers on sustainabilityof soil fertility and grain yield in a rice-pulse system
D. Selvi, S. Mahimairaja, P. Santhy, and B. Rajkannan, Department of Soil Science and Agricultural Chemistry, Tamil NaduAgricultural University, Coimbatore 641003, India
polymyxa and Pseudomonas striata)in neutral to slightly alkaline soils.Because not much work on theeffectiveness of Rajphos (UdaipurRP, a product of Rajasthan Minesand Minerals Ltd., Udaipur, In-dia) as a source of P was done, weevaluated its agronomic effective-ness along with other sources ofP. The study aimed to determinethe effect of organic manure andbiofertilizer on the effectivenessof Rajphos and to examine theresidual effect of Rajphos appli-cation in rice soil. Different inor-ganic P fertilizers were used withorganic manures (e.g., green leafmanure, [GLM ] was pungam leafPongamia glabra) and biofertilizer-phosphobacteria. The yields ofrice and blackgram and soil fer-tility changes were noted.
The field experiments wereconducted in 1996-97 at theTNAU Soil Science Departmentin Coimbatore. Soil is a clay loamalluvial with pH 7.86, EC 0.48 dSm–1, 0.42% organic C, 183 kgKMnO4-N ha–1, 17.8 kg Olsen Pha–1, and 543 kg NH4OAcK ha–1.The average total P (dry weightbasis) was 7.2%, 8.3%, 20.1%, and0.17% in Udaipur RP (Rajphos),MRP, diammonium phosphate(DAP), and GLM, respectively.The treatments were replicatedthree times in a randomized blockdesign. Short-duration rice vari-ety ADT36 (110 d) was planted inthe first week of December everyyear using 15 ¥ l0-cm spacing.Freshly collected leaves of P.glabra were incorporated at 6.25 tha–1 (equivalent to 1.875 t ha–1 on
a dry weight basis) into the field1 wk before transplanting.Phosphobacteria as biofertilizerwere applied at 2 kg ha–1. Thephosphobacterial inoculant wasprepared with lignite as a carrier.Rock phosphates and other fertil-izers were applied as basal 3 dbefore transplanting. Recom-mended doses of N (120 kg ha–1)as urea and K (41.5 kg ha–1) asmuriate of potash were applied infour equal splits at initial,tillering, panicle initiation, andflowering stages. Plots were irri-gated and 25-d-old rice seedlingswere transplanted in the puddledfield. Other cultivation practicessuch as weeding (four times) andplant protection measures (twotimes) were carried out. The cropwas harvested at maturity and itsyield recorded. Postharvest soilsamples after rice were analyzedfor Olsen P with 0.5 M NaHCO3
(pH 8.5) as extractant. Represen-tative soil samples were collectedat 0-15-cm depths, air-dried,sieved through a 2-mm sieve, andanalyzed.
At first, the highest grainyield of rice was obtained withDA, followed by the RPs(Table 1). Though MRP containsrelatively higher total P content(8.3%) than Rajphos (7.2%), thelatter appeared to perform rela-tively better in rice soil than theformer. However, MRP andRajphos were on a par at the 5%level. This may be due to the dif-ferences in chemical compositionand varying dissolution patternsof P from these two RPs. Rajphos,
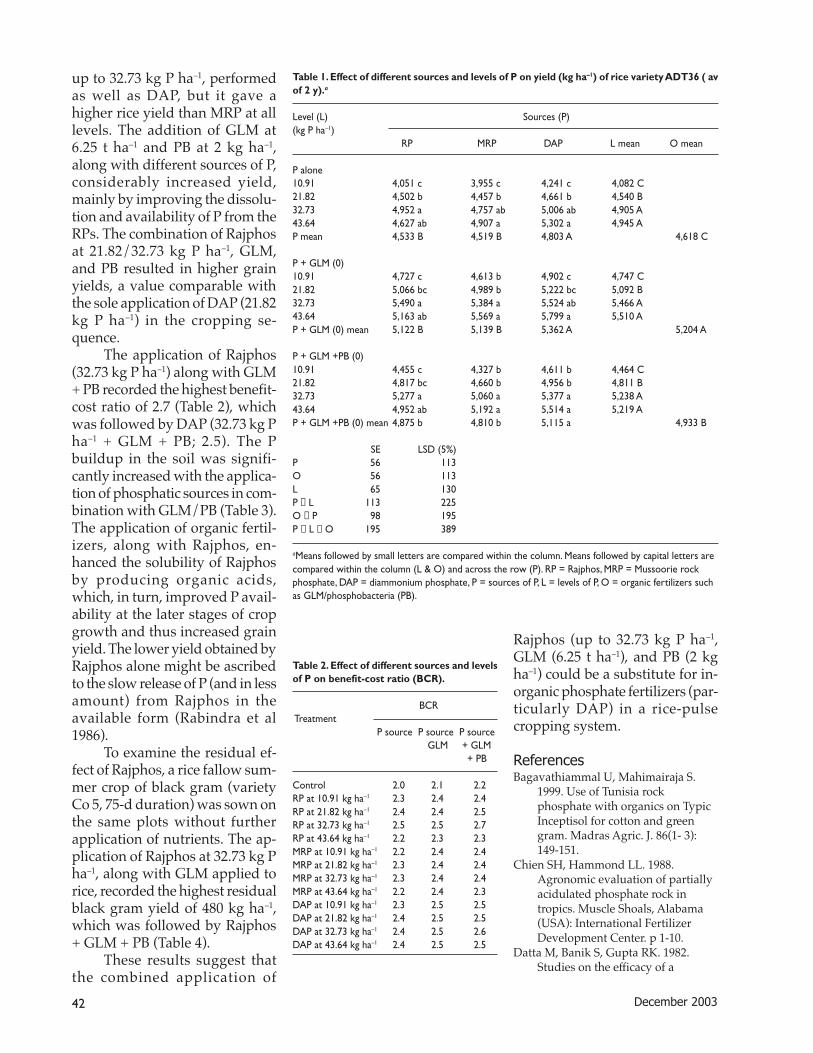
42 December 2003
up to 32.73 kg P ha–1, performedas well as DAP, but it gave ahigher rice yield than MRP at alllevels. The addition of GLM at6.25 t ha–1 and PB at 2 kg ha–1,along with different sources of P,considerably increased yield,mainly by improving the dissolu-tion and availability of P from theRPs. The combination of Rajphosat 21.82/32.73 kg P ha–1, GLM,and PB resulted in higher grainyields, a value comparable withthe sole application of DAP (21.82kg P ha–1) in the cropping se-quence.
The application of Rajphos(32.73 kg P ha–1) along with GLM+ PB recorded the highest benefit-cost ratio of 2.7 (Table 2), whichwas followed by DAP (32.73 kg Pha–1 + GLM + PB; 2.5). The Pbuildup in the soil was signifi-cantly increased with the applica-tion of phosphatic sources in com-bination with GLM/PB (Table 3).The application of organic fertil-izers, along with Rajphos, en-hanced the solubility of Rajphosby producing organic acids,which, in turn, improved P avail-ability at the later stages of cropgrowth and thus increased grainyield. The lower yield obtained byRajphos alone might be ascribedto the slow release of P (and in lessamount) from Rajphos in theavailable form (Rabindra et al1986).
To examine the residual ef-fect of Rajphos, a rice fallow sum-mer crop of black gram (varietyCo 5, 75-d duration) was sown onthe same plots without furtherapplication of nutrients. The ap-plication of Rajphos at 32.73 kg Pha–1, along with GLM applied torice, recorded the highest residualblack gram yield of 480 kg ha–1,which was followed by Rajphos+ GLM + PB (Table 4).
These results suggest thatthe combined application of
Rajphos (up to 32.73 kg P ha–1,GLM (6.25 t ha–1), and PB (2 kgha–1) could be a substitute for in-organic phosphate fertilizers (par-ticularly DAP) in a rice-pulsecropping system.
ReferencesBagavathiammal U, Mahimairaja S.
1999. Use of Tunisia rockphosphate with organics on TypicInceptisol for cotton and greengram. Madras Agric. J. 86(1- 3):149-151.
Chien SH, Hammond LL. 1988.Agronomic evaluation of partiallyacidulated phosphate rock intropics. Muscle Shoals, Alabama(USA): International FertilizerDevelopment Center. p 1-10.
Datta M, Banik S, Gupta RK. 1982.Studies on the efficacy of a
Table 1. Effect of different sources and levels of P on yield (kg ha–1) of rice variety ADT36 ( avof 2 y).a
Level (L) Sources (P)(kg P ha–1)
RP MRP DAP L mean O mean
P alone10.91 4,051 c 3,955 c 4,241 c 4,082 C21.82 4,502 b 4,457 b 4,661 b 4,540 B32.73 4,952 a 4,757 ab 5,006 ab 4,905 A43.64 4,627 ab 4,907 a 5,302 a 4,945 AP mean 4,533 B 4,519 B 4,803 A 4,618 C
P + GLM (0)10.91 4,727 c 4,613 b 4,902 c 4,747 C21.82 5,066 bc 4,989 b 5,222 bc 5,092 B32.73 5,490 a 5,384 a 5,524 ab 5,466 A43.64 5,163 ab 5,569 a 5,799 a 5,510 AP + GLM (0) mean 5,122 B 5,139 B 5,362 A 5,204 A
P + GLM +PB (0)10.91 4,455 c 4,327 b 4,611 b 4,464 C21.82 4,817 bc 4,660 b 4,956 b 4,811 B32.73 5,277 a 5,060 a 5,377 a 5,238 A43.64 4,952 ab 5,192 a 5,514 a 5,219 AP + GLM +PB (0) mean 4,875 b 4,810 b 5,115 a 4,933 B
SE LSD (5%)P 56 113O 56 113L 65 130P × L 113 225O × P 98 195P × L × O 195 389
aMeans followed by small letters are compared within the column. Means followed by capital letters arecompared within the column (L & O) and across the row (P). RP = Rajphos, MRP = Mussoorie rockphosphate, DAP = diammonium phosphate, P = sources of P, L = levels of P, O = organic fertilizers suchas GLM/phosphobacteria (PB).
Table 2. Effect of different sources and levelsof P on benefit-cost ratio (BCR).
BCR Treatment
P source P source P source GLM + GLM
+ PB
Control 2.0 2.1 2.2RP at 10.91 kg ha–1 2.3 2.4 2.4RP at 21.82 kg ha–1 2.4 2.4 2.5RP at 32.73 kg ha–1 2.5 2.5 2.7RP at 43.64 kg ha–1 2.2 2.3 2.3MRP at 10.91 kg ha–1 2.2 2.4 2.4MRP at 21.82 kg ha–1 2.3 2.4 2.4MRP at 32.73 kg ha–1 2.3 2.4 2.4MRP at 43.64 kg ha–1 2.2 2.4 2.3DAP at 10.91 kg ha–1 2.3 2.5 2.5DAP at 21.82 kg ha–1 2.4 2.5 2.5DAP at 32.73 kg ha–1 2.4 2.5 2.6DAP at 43.64 kg ha–1 2.4 2.5 2.5
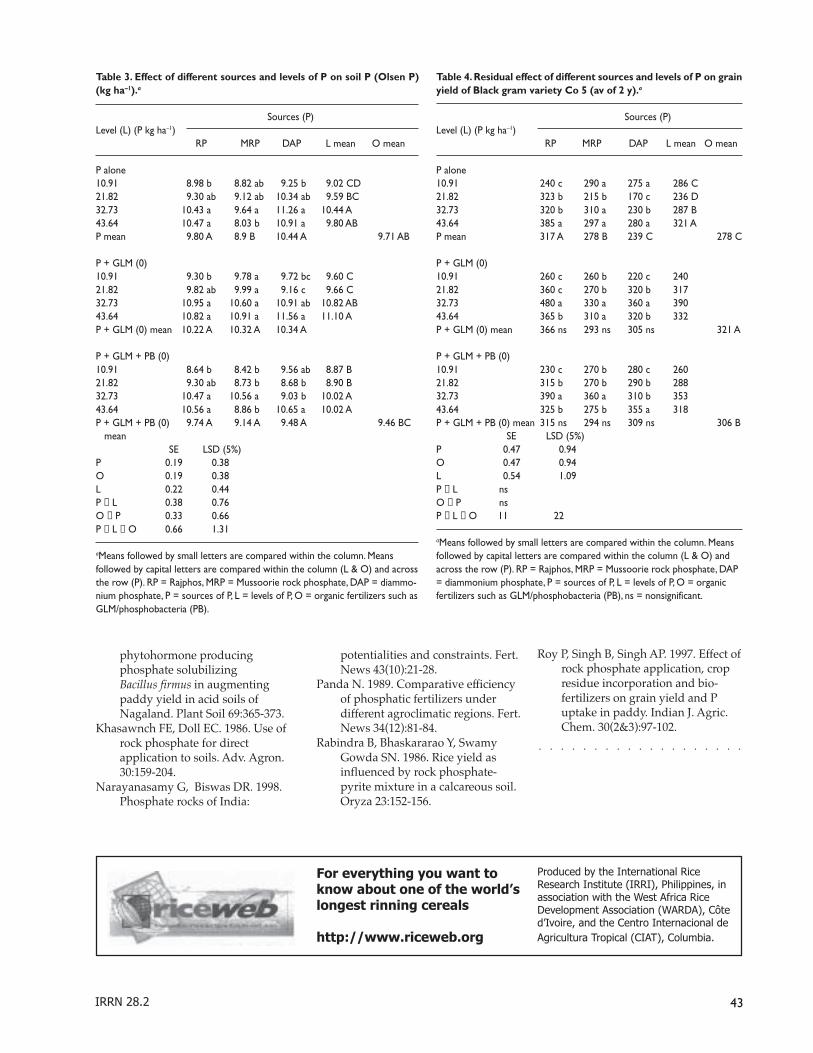
43IRRN 28.2
Table 3. Effect of different sources and levels of P on soil P (Olsen P)(kg ha–1).a
Sources (P)Level (L) (P kg ha–1)
RP MRP DAP L mean O mean
P alone10.91 8.98 b 8.82 ab 9.25 b 9.02 CD21.82 9.30 ab 9.12 ab 10.34 ab 9.59 BC32.73 10.43 a 9.64 a 11.26 a 10.44 A43.64 10.47 a 8.03 b 10.91 a 9.80 ABP mean 9.80 A 8.9 B 10.44 A 9.71 AB
P + GLM (0)10.91 9.30 b 9.78 a 9.72 bc 9.60 C21.82 9.82 ab 9.99 a 9.16 c 9.66 C32.73 10.95 a 10.60 a 10.91 ab 10.82 AB43.64 10.82 a 10.91 a 11.56 a 11.10 AP + GLM (0) mean 10.22 A 10.32 A 10.34 A
P + GLM + PB (0)10.91 8.64 b 8.42 b 9.56 ab 8.87 B21.82 9.30 ab 8.73 b 8.68 b 8.90 B32.73 10.47 a 10.56 a 9.03 b 10.02 A43.64 10.56 a 8.86 b 10.65 a 10.02 AP + GLM + PB (0) 9.74 A 9.14 A 9.48 A 9.46 BC mean
SE LSD (5%)P 0.19 0.38O 0.19 0.38L 0.22 0.44P × L 0.38 0.76O × P 0.33 0.66P × L × O 0.66 1.31
aMeans followed by small letters are compared within the column. Meansfollowed by capital letters are compared within the column (L & O) and acrossthe row (P). RP = Rajphos, MRP = Mussoorie rock phosphate, DAP = diammo-nium phosphate, P = sources of P, L = levels of P, O = organic fertilizers such asGLM/phosphobacteria (PB).
Table 4. Residual effect of different sources and levels of P on grainyield of Black gram variety Co 5 (av of 2 y).a
Sources (P)Level (L) (P kg ha–1)
RP MRP DAP L mean O mean
P alone10.91 240 c 290 a 275 a 286 C21.82 323 b 215 b 170 c 236 D32.73 320 b 310 a 230 b 287 B43.64 385 a 297 a 280 a 321 AP mean 317 A 278 B 239 C 278 C
P + GLM (0)10.91 260 c 260 b 220 c 24021.82 360 c 270 b 320 b 31732.73 480 a 330 a 360 a 39043.64 365 b 310 a 320 b 332P + GLM (0) mean 366 ns 293 ns 305 ns 321 A
P + GLM + PB (0)10.91 230 c 270 b 280 c 26021.82 315 b 270 b 290 b 28832.73 390 a 360 a 310 b 35343.64 325 b 275 b 355 a 318P + GLM + PB (0) mean 315 ns 294 ns 309 ns 306 B
SE LSD (5%)P 0.47 0.94O 0.47 0.94L 0.54 1.09P × L nsO × P nsP × L × O 11 22
aMeans followed by small letters are compared within the column. Meansfollowed by capital letters are compared within the column (L & O) andacross the row (P). RP = Rajphos, MRP = Mussoorie rock phosphate, DAP= diammonium phosphate, P = sources of P, L = levels of P, O = organicfertilizers such as GLM/phosphobacteria (PB), ns = nonsignificant.
phytohormone producingphosphate solubilizingBacillus firmus in augmentingpaddy yield in acid soils ofNagaland. Plant Soil 69:365-373.
Khasawnch FE, Doll EC. 1986. Use ofrock phosphate for directapplication to soils. Adv. Agron.30:159-204.
Narayanasamy G, Biswas DR. 1998.Phosphate rocks of India:
potentialities and constraints. Fert.News 43(10):21-28.
Panda N. 1989. Comparative efficiencyof phosphatic fertilizers underdifferent agroclimatic regions. Fert.News 34(12):81-84.
Rabindra B, Bhaskararao Y, SwamyGowda SN. 1986. Rice yield asinfluenced by rock phosphate-pyrite mixture in a calcareous soil.Oryza 23:152-156.
○ ○ ○ ○ ○ ○ ○ ○ ○ ○ ○ ○ ○ ○ ○ ○ ○ ○ ○
Roy P, Singh B, Singh AP. 1997. Effect ofrock phosphate application, cropresidue incorporation and bio-fertilizers on grain yield and Puptake in paddy. Indian J. Agric.Chem. 30(2&3):97-102.
For everything you want toknow about one of the world’slongest rinning cereals
http://www.riceweb.org
Produced by the International RiceResearch Institute (IRRI), Philippines, inassociation with the West Africa RiceDevelopment Association (WARDA), Côted’Ivoire, and the Centro Internacional de
Agricultura Tropical (CIAT), Columbia.
44 December 2003
Irrigation facilities have beenbuilt for considerable areas ofcropped land, but the desiredlevel of output by way of in-creased irrigated area and agricul-tural production has not beenachieved. This is mainly attrib-uted to the wastage of water atcertain reaches. As rice is a majorconsumer of irrigation water,much has to be done to improvewater-use efficiency in rice fieldsand this is possible only throughfarmers’ participation. Farmersgenerally have the impressionthat field-to-field flowing water isbest for rice growth. They are re-luctant to follow scientific recom-mendations in water manage-ment. (Scientific water manage-ment relates to maintaining thestanding water at 1-2 cm fromtransplanting to tillering and 1-5cm from tillering to 10 d beforeharvest.) Rice yield can be influ-enced by different water manage-ment practices such as continuoussubmergence (Mandal andChatterjee 1984), varying levels ofsubmergence at different growthstages (Thorat et al 1987), andshallow submergence (5 ± 2 cm)during the crop’s entire growthcycle (Jha and Sahoo 1988). Ourstudy aimed to evaluate the effectof scientific water managementalong with farmers’ practices onrice cultivation and to demon-strate how farmer participation inthe research program can enhancewater management.
This study was conducted inthe Ichannur subdistributorycommand of the Kuttiyadi Irriga-tion Project in Kerala, India, in the1999-2000 summer seasons (Jan-
Participatory research on the effect of on-farm watermanagement practices
K. Joseph, Centre for Water Resources Development and Management, Kozhikode 673571, Kerala, India
May). The field boothies (canalsbelow the subdistributory andabove the outlet of the commandarea) were lined with concreteand the field and drainage chan-nels laid out with the participa-tion of the members of the Ben-eficiary Farmers’ Association.These interventions ensured reli-able water delivery in the com-mand area. Even with this, farm-ers practiced only field-to-fieldflowing irrigation, which resultedin enormous wastage of water. Tooptimize water use, an experi-ment was set up in outlets 7 and12 of the Ichannur subdistri-butory, where farmers’ associa-tions were active and initiated theexperiment.
Rice variety Triveni (PTB38)was used in the study and a com-mon nursery was raised. Nurseryraising, transplanting, manureand fertilizer application, after-care, and harvest were done fol-lowing the recommendations ofthe Kerala Agricultural Univer-sity. The treatments consisted ofscientific water management (T1)and the farmers’ practice of wa-ter management (T2). Scientificwater management relates tomaintaining standing water at1-2 cm from transplanting totillering and 1-5 cm from tilleringto 10 d before harvest. It also in-volves complete drainage 1 dprior to N topdressing and irriga-tion 12 h after topdressing. Wateris let into the field from the fieldirrigation channel, either througha siphon or small regulatory slotsmade for the purpose. The farm-ers’ practice is letting water intothe fields to maintain standing
water of a convenient height (asdecided by them) and adoptingfield-to-field irrigation.
In both outlets, two adjacentplots (about 10,000 m2 each) wereselected. There were thus twomajor plots for each treatment.Soil at the experimental site wasclay loam with medium fertilityand pH 5.3. Treatments were im-posed accordingly and waterdepth was maintained usingmarking pegs distributed ran-domly to various portions in thefield. Evaporation from the fieldwas recorded using canevaporimeters. The quantity ofwater diverted to each plot wasalso recorded. Observation sitesin each plot were fixed randomlyat 10 different spots, each havingan area of 1 m2. From this area, 10plants were selected for observa-tion. Grain and straw yields weretaken from the harvested pro-duce. At harvest, plant height,number of tillers, and number ofpanicles were recorded. Grainyield and straw yield were re-corded after drying to 14% mois-ture content. Water-use efficiencywas calculated as the ratio ofgrain yield to total quantity ofwater used (expressed as kg ha–1
cm–1). Statistical analysis wasdone using methods specified byPanse and Sukhatme (1978). Theresults on growth, yield, and yieldattributes are presented in thetable.
Plant height did not varysignificantly in both years, indi-cating that this growth attributeis not influenced by differences inconditions under both flowingand standing water in the field.
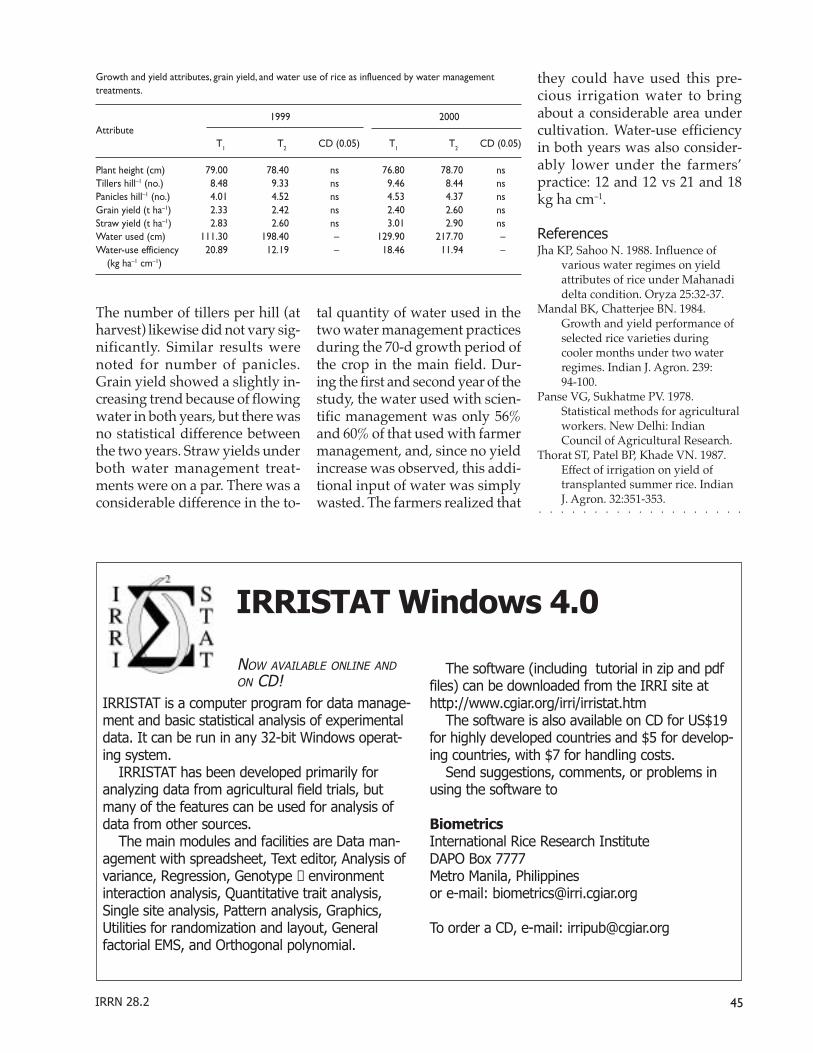
45IRRN 28.2
The number of tillers per hill (atharvest) likewise did not vary sig-nificantly. Similar results werenoted for number of panicles.Grain yield showed a slightly in-creasing trend because of flowingwater in both years, but there wasno statistical difference betweenthe two years. Straw yields underboth water management treat-ments were on a par. There was aconsiderable difference in the to-
Growth and yield attributes, grain yield, and water use of rice as influenced by water managementtreatments.
1999 2000Attribute
T1 T2 CD (0.05) T1 T2 CD (0.05)
Plant height (cm) 79.00 78.40 ns 76.80 78.70 nsTillers hill–1 (no.) 8.48 9.33 ns 9.46 8.44 nsPanicles hill–1 (no.) 4.01 4.52 ns 4.53 4.37 nsGrain yield (t ha–1) 2.33 2.42 ns 2.40 2.60 nsStraw yield (t ha–1) 2.83 2.60 ns 3.01 2.90 nsWater used (cm) 111.30 198.40 – 129.90 217.70 –Water-use efficiency 20.89 12.19 – 18.46 11.94 – (kg ha–1 cm–1)
tal quantity of water used in thetwo water management practicesduring the 70-d growth period ofthe crop in the main field. Dur-ing the first and second year of thestudy, the water used with scien-tific management was only 56%and 60% of that used with farmermanagement, and, since no yieldincrease was observed, this addi-tional input of water was simplywasted. The farmers realized that
they could have used this pre-cious irrigation water to bringabout a considerable area undercultivation. Water-use efficiencyin both years was also consider-ably lower under the farmers’practice: 12 and 12 vs 21 and 18kg ha cm–1.
ReferencesJha KP, Sahoo N. 1988. Influence of
various water regimes on yieldattributes of rice under Mahanadidelta condition. Oryza 25:32-37.
Mandal BK, Chatterjee BN. 1984.Growth and yield performance ofselected rice varieties duringcooler months under two waterregimes. Indian J. Agron. 239:94-100.
Panse VG, Sukhatme PV. 1978.Statistical methods for agriculturalworkers. New Delhi: IndianCouncil of Agricultural Research.
Thorat ST, Patel BP, Khade VN. 1987.Effect of irrigation on yield oftransplanted summer rice. IndianJ. Agron. 32:351-353.
○ ○ ○ ○ ○ ○ ○ ○ ○ ○ ○ ○ ○ ○ ○ ○ ○ ○ ○
IRRISTAT is a computer program for data manage-ment and basic statistical analysis of experimentaldata. It can be run in any 32-bit Windows operat-ing system.
IRRISTAT has been developed primarily foranalyzing data from agricultural field trials, butmany of the features can be used for analysis ofdata from other sources.
The main modules and facilities are Data man-agement with spreadsheet, Text editor, Analysis ofvariance, Regression, Genotype × environmentinteraction analysis, Quantitative trait analysis,Single site analysis, Pattern analysis, Graphics,Utilities for randomization and layout, Generalfactorial EMS, and Orthogonal polynomial.
IRRISTAT Windows 4.0
NOW AVAILABLE ONLINE AND
ON CD!The software (including tutorial in zip and pdf
files) can be downloaded from the IRRI site athttp://www.cgiar.org/irri/irristat.htm
The software is also available on CD for US$19for highly developed countries and $5 for develop-ing countries, with $7 for handling costs.
Send suggestions, comments, or problems inusing the software to
BiometricsInternational Rice Research InstituteDAPO Box 7777Metro Manila, Philippinesor e-mail: [email protected]
To order a CD, e-mail: [email protected]

46 December 2003
Crop management & physiology
Root exudates, along with deadroot hairs, epidermal cells, androot caps, are a source of energyfor the microbial community inthe rhizoplane and rhizosphere.They aid in the mineralization oforganic matter, nutrient cycling,and trace gas (CH4, N2O, etc.) pro-duction (Aulakh et al 2001).MacRae and Castro (1966),Marathe (1970), and Waschutza etal (1992) have identified raffinose,glucose, fructose, arabinose, ri-bose, and xylose in rice exudates.Glucose is the most abundant ofall sugar exudates of plants ingeneral (Boureau 1977). Withgrowth of rice, the exudation oforganic acids such as oxalic, suc-cinic, aconitic, citric, malic, tar-taric, and lactic acids substitutesfor the exudation of sugars(Aulakh et al 2001, Boureau 1977).Root and shoot biomass was posi-tively correlated with carbon exu-dation, suggesting that it is drivenby plant biomass (Aulakh et al2001). A decrease in exudationwas observed by Vancura et al(1977) when the source of seed-ling nutrition shifted from storedsubstances in the seeds and theendosperm to photosynthesizingleaves. As the nutrient supplyfrom the leaves increases, rootexudation increases again andmaintains a rising trend up to thetime of flowering.
Our study was undertakento estimate the sugar exudation
Temporal variation in sugar exudation rate ofhydroponically grown Pusa Basmati 1 at seedlingstage
S. Ghosh, Office of the Soil Conservation Officer, Detailed Soil Survey, M.C.A.D.P., Suri, West Bengal731101, India; and D. Majumdar, Department of Environmental Sciences, Institute of Science andTechnology for Advanced Studies and Research, Vallabh Vidyanagar, Gujarat 388120, IndiaE-mail: [email protected]; [email protected]
rate of rice cultivar Pusa Basmati1 during the seedling stage in anutrient culture (Hoagland’s so-lution). Pusa Basmati 1 is one ofthe most important rice varietiesgrown in India and in many otherrice-growing Southeast Asiancountries. The possibility of fit-ting the sugar exudation rate intomathematical functions was alsoexplored.
Seeds of rice cultivar PusaBasmati 1, obtained from the Di-vision of Genetics of the IndianAgricultural Research Institute,were surface-sterilized by shak-ing with 70% ethanol for 2 minand then washing them thor-oughly with sterile distilled wa-ter. Subsequently, the seeds weretreated with 0.2% mercuric chlo-ride solution for 30 min followedby repeated washing in steriledistilled water (MacRae andCastro 1996). The seeds were thenallowed to germinate over moistfilter paper inpetri plates andallowed to growfor 96 h at 30 °Cuntil the rootswere conspicu-ous.
The seed-lings were thentransferred to cy-lindrical plasticc o n t a i n e r s(approx. 800cm3), containing Fig. 1. Cultivating rice seedlings in nutrient solution.
Hoagland’s solution (1/4strength as described by Johnsonet al [1957]). Four seedlings werefixed in four small apertures atthe top of each container. The con-tainers were filled withHoagland’s solution up to thebrim so that roots of the growingseedlings remained immersed insolution. The solution in the con-tainers was aerated at regular in-tervals with the help of anaquarium pump to supply oxy-gen for root respiration (Fig. 1).Although root respiration of riceunder anaerobic conditions takesplace mainly via oxygen supplythrough the aerenchyma, in trans-planted rice culture seedlings re-main in the nursery for around 25d initially, where the soil is notpuddled and remains primarilyaerobic. To simulate this condi-tion in the seedbed, the nutrientsolution was aerated at regularintervals.
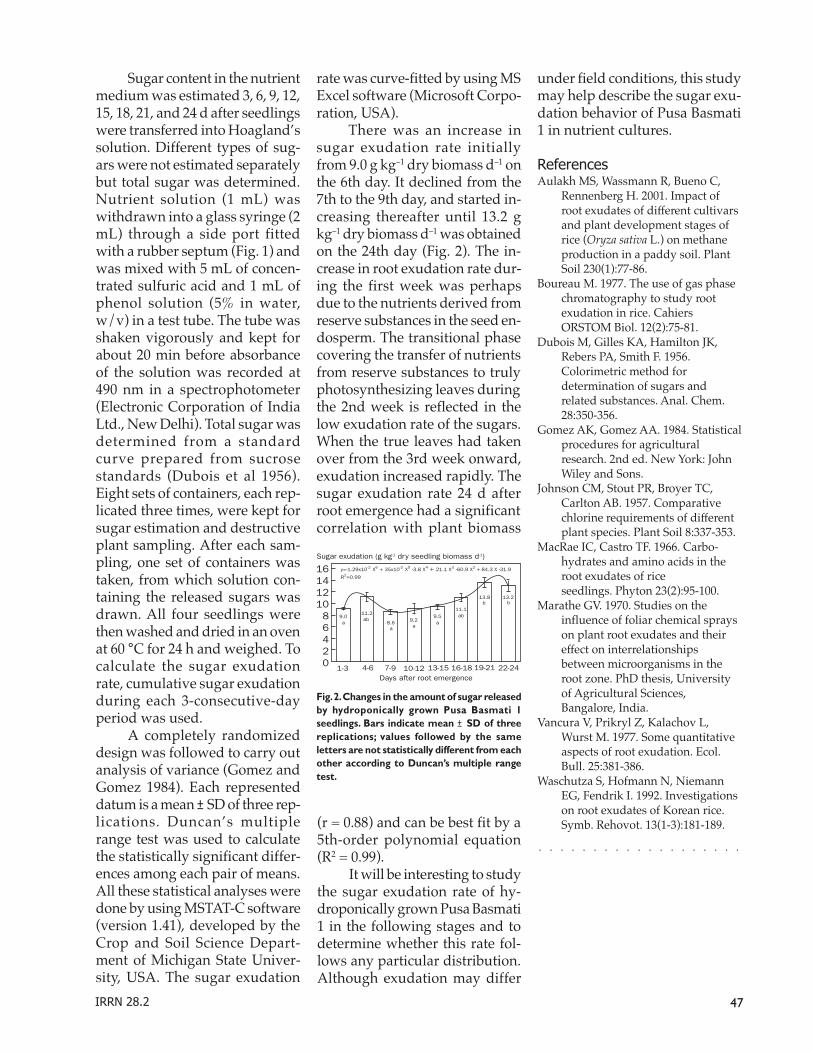
47IRRN 28.2
1-3
1614121086420 4-6 7-9 10-12 13-15 16-18 19-21 22-24
y=-1.29x10-2 X6 + 35x10-2 X5 -3.8 X4 + 21.1 X3 -60.9 X2 + 84.3 X -31.9
R2=0.99
Sugar exudation (g kg-1 dry seedling biomass d-1)
9.011.2
8.6 9.29.5
11.1
13.8 13.2
aab
a aa
ab
b b
Days after root emergence
Sugar content in the nutrientmedium was estimated 3, 6, 9, 12,15, 18, 21, and 24 d after seedlingswere transferred into Hoagland’ssolution. Different types of sug-ars were not estimated separatelybut total sugar was determined.Nutrient solution (1 mL) waswithdrawn into a glass syringe (2mL) through a side port fittedwith a rubber septum (Fig. 1) andwas mixed with 5 mL of concen-trated sulfuric acid and 1 mL ofphenol solution (5% in water,w/v) in a test tube. The tube wasshaken vigorously and kept forabout 20 min before absorbanceof the solution was recorded at490 nm in a spectrophotometer(Electronic Corporation of IndiaLtd., New Delhi). Total sugar wasdetermined from a standardcurve prepared from sucrosestandards (Dubois et al 1956).Eight sets of containers, each rep-licated three times, were kept forsugar estimation and destructiveplant sampling. After each sam-pling, one set of containers wastaken, from which solution con-taining the released sugars wasdrawn. All four seedlings werethen washed and dried in an ovenat 60 °C for 24 h and weighed. Tocalculate the sugar exudationrate, cumulative sugar exudationduring each 3-consecutive-dayperiod was used.
A completely randomizeddesign was followed to carry outanalysis of variance (Gomez andGomez 1984). Each representeddatum is a mean ± SD of three rep-lications. Duncan’s multiplerange test was used to calculatethe statistically significant differ-ences among each pair of means.All these statistical analyses weredone by using MSTAT-C software(version 1.41), developed by theCrop and Soil Science Depart-ment of Michigan State Univer-sity, USA. The sugar exudation
rate was curve-fitted by using MSExcel software (Microsoft Corpo-ration, USA).
There was an increase insugar exudation rate initiallyfrom 9.0 g kg–1 dry biomass d–1 onthe 6th day. It declined from the7th to the 9th day, and started in-creasing thereafter until 13.2 gkg–1 dry biomass d–1 was obtainedon the 24th day (Fig. 2). The in-crease in root exudation rate dur-ing the first week was perhapsdue to the nutrients derived fromreserve substances in the seed en-dosperm. The transitional phasecovering the transfer of nutrientsfrom reserve substances to trulyphotosynthesizing leaves duringthe 2nd week is reflected in thelow exudation rate of the sugars.When the true leaves had takenover from the 3rd week onward,exudation increased rapidly. Thesugar exudation rate 24 d afterroot emergence had a significantcorrelation with plant biomass
(r = 0.88) and can be best fit by a5th-order polynomial equation(R2 = 0.99).
It will be interesting to studythe sugar exudation rate of hy-droponically grown Pusa Basmati1 in the following stages and todetermine whether this rate fol-lows any particular distribution.Although exudation may differ
Fig. 2. Changes in the amount of sugar releasedby hydroponically grown Pusa Basmati 1seedlings. Bars indicate mean ± SD of threereplications; values followed by the sameletters are not statistically different from eachother according to Duncan’s multiple rangetest.
under field conditions, this studymay help describe the sugar exu-dation behavior of Pusa Basmati1 in nutrient cultures.
ReferencesAulakh MS, Wassmann R, Bueno C,
Rennenberg H. 2001. Impact ofroot exudates of different cultivarsand plant development stages ofrice (Oryza sativa L.) on methaneproduction in a paddy soil. PlantSoil 230(1):77-86.
Boureau M. 1977. The use of gas phasechromatography to study rootexudation in rice. CahiersORSTOM Biol. 12(2):75-81.
Dubois M, Gilles KA, Hamilton JK,Rebers PA, Smith F. 1956.Colorimetric method fordetermination of sugars andrelated substances. Anal. Chem.28:350-356.
Gomez AK, Gomez AA. 1984. Statisticalprocedures for agriculturalresearch. 2nd ed. New York: JohnWiley and Sons.
Johnson CM, Stout PR, Broyer TC,Carlton AB. 1957. Comparativechlorine requirements of differentplant species. Plant Soil 8:337-353.
MacRae IC, Castro TF. 1966. Carbo-hydrates and amino acids in theroot exudates of riceseedlings. Phyton 23(2):95-100.
Marathe GV. 1970. Studies on theinfluence of foliar chemical sprayson plant root exudates and theireffect on interrelationshipsbetween microorganisms in theroot zone. PhD thesis, Universityof Agricultural Sciences,Bangalore, India.
Vancura V, Prikryl Z, Kalachov L,Wurst M. 1977. Some quantitativeaspects of root exudation. Ecol.Bull. 25:381-386.
Waschutza S, Hofmann N, NiemannEG, Fendrik I. 1992. Investigationson root exudates of Korean rice.Symb. Rehovot. 13(1-3):181-189.
○ ○ ○ ○ ○ ○ ○ ○ ○ ○ ○ ○ ○ ○ ○ ○ ○ ○ ○

48 December 2003
Because rice is a staple and animportant export commodity forPakistan, an economical andtime-saving cultivation methodbecomes indispensable. Thisstudy aimed to develop a pack-age of technologies to supportdirect seeding by identifyingweed management strategies, es-tablishing appropriate time anddate of seeding, and promotingefficient application of herbicides.
An experiment using a split-plot design with three replica-tions was conducted in 1999 and2000. A subplot size of 5 × 3 m2
was used in each treatment. Mainplots were assigned to different
Impact of pulse applications of herbicides on biomass ofgrasses and sedges and their effects on the yield and yieldcomponents of direct wet-seeded rice
I.U. Awan, M.A. Nadim, and F. Anjam, Department of Agronomy, Faculty of Agriculture, Gomal University, D.I. Khan,NWFP-Pakistan; and K. Hayat, Agricultural Research Institute, D.I.Khan, NWFP-Pakistan. E-mail: [email protected],[email protected], [email protected]
herbicide application times (3, 6,and 9 wk after seeding [WAS]),whereas the subplots comprisedfour herbicides (Ronstar-12 L at 2L ha–1, Topstar-800 WG at 100 gha–1, Rifit-500 EC at 1 L ha–1, andAcelor-50 EC at 250 mL ha–1) withone control treatment. Fertilizersat 120-39.6-49.8 kg NPK ha–1 wereused. Full doses of P and K andhalf of N were applied at the timeof planting, while the remaininghalf of N was applied at panicleinitiation. Pregerminated seeds ofIR6 (100 kg ha–1) were used. Thesoil is mostly silty clay. Annualprecipitation (250–300 mm)mostly occurs in July and August.
The 1999 experiments took placeon a field where the previous cropwas Brassica napus, while the 2000experiments followed a wheatcrop. Soil under the experimentsduring both years (1999-2000) hada pH of 8.2 and 8.5, respectively.
Rifit proved superior withhigher rice and straw yields,number of panicles m–2, numberof spikelets panicle–1, and 1,000-grain weight (g), and lower dryweed biomass (g m–2) (Table 1)and sterility (%). Higher net in-come and benefit-cost ratios(BCR) were likewise obtainedwhen it was applied at 3 WAS.Averaging over the time intervals
Table 1. Impact of variable times of herbicide application on biomass of grasses and sedges and their effects on yield and yieldcomponents of IRG, 1999 and 2000.
Herbicides Application timesItem Year
Ronstar Topstar Rifit Acelor Control 3 WASa 6 WAS 9 WAS
15 DAAb (no. m–2) 1999 17.5 b 16.4 b 18.0 b 19.0 b 58.3 a 15.7 c 23.2 b 38.5 a
2000 18.9 bc 18.0 c 19.3 bc 20.4 b 55.7 a 14.8 c 21.8 b 42.7 a
Dry weed biomass 1999 99.7 b 40.7 d 58.0 e 79.0 c 114.9 a 79.0 c 83.8 b 88.3 a 15 DAA (g m–2)
2000 104.4 b 83.0 d 75.8 e 92.3 c 122.0 a 90.9 b 93.9 b 101.8 a
1999 261.6 a 262.9 a 268.3 a 260.3 a 236.2 b 262.4 NS 253.6 257.6Tillers (no. m–2)
2000 255.3 b 270.6 a 273.3 a 251.4 b 224.9 c 267.6 a 245.5 b 252.2 b
1999 231.2 b 237.2 b 256.0 a 235.7 b 195.1 c 241.7 a 223.5 b 227.9 bPanicles (no. m–2)
2000 229.0 c 276.5 a 279.5 a 260.2 b 220.3 d 256.5 NS 251.9 250.9
1999 6.1 c 8.3 ab 8.7 a 7.7 b 5.1 d 7.5 NS 7.1 6.9Rice yield (t ha–1)
2000 6.2 d 7.2 a 7.4 a 6.9 ab 5.2 c 6.7 NS 6.6 6.5
aWAS = weeks after seeding. bDAA = days after application of herbicides.
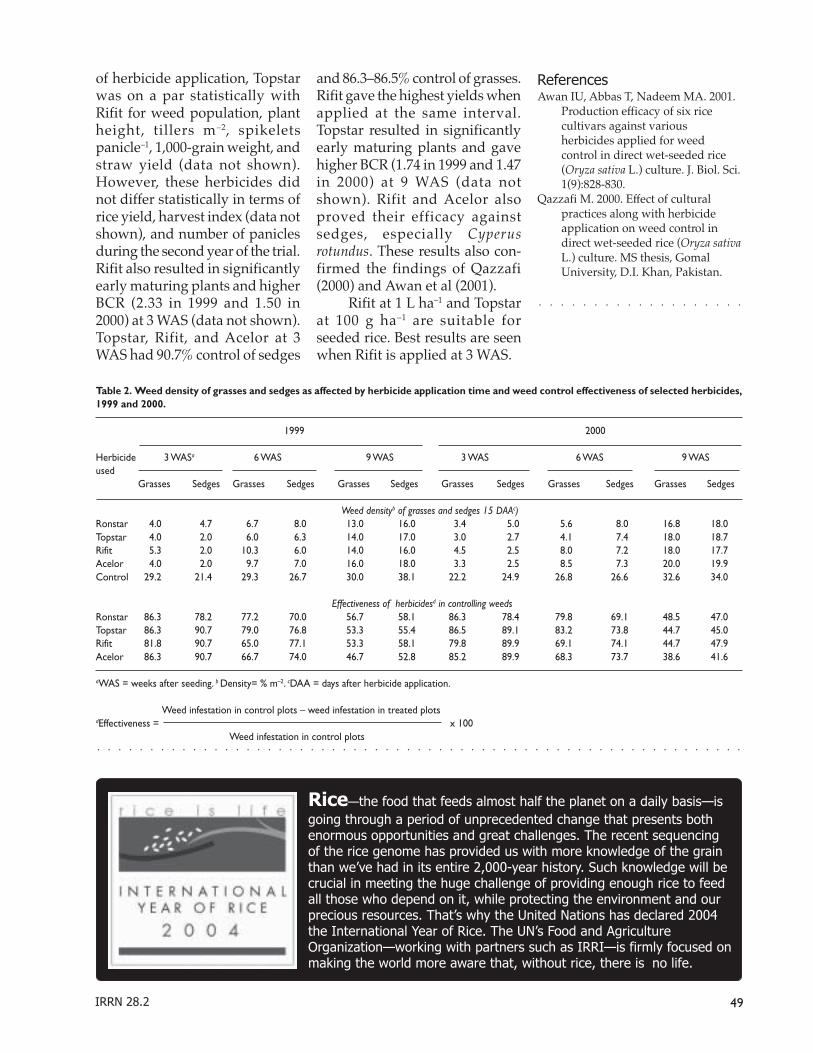
49IRRN 28.2
of herbicide application, Topstarwas on a par statistically withRifit for weed population, plantheight, tillers m–2, spikeletspanicle–1, 1,000-grain weight, andstraw yield (data not shown).However, these herbicides didnot differ statistically in terms ofrice yield, harvest index (data notshown), and number of paniclesduring the second year of the trial.Rifit also resulted in significantlyearly maturing plants and higherBCR (2.33 in 1999 and 1.50 in2000) at 3 WAS (data not shown).Topstar, Rifit, and Acelor at 3WAS had 90.7% control of sedges
and 86.3–86.5% control of grasses.Rifit gave the highest yields whenapplied at the same interval.Topstar resulted in significantlyearly maturing plants and gavehigher BCR (1.74 in 1999 and 1.47in 2000) at 9 WAS (data notshown). Rifit and Acelor alsoproved their efficacy againstsedges, especially Cyperusrotundus. These results also con-firmed the findings of Qazzafi(2000) and Awan et al (2001).
Rifit at 1 L ha–1 and Topstarat 100 g ha–1 are suitable forseeded rice. Best results are seenwhen Rifit is applied at 3 WAS.
ReferencesAwan IU, Abbas T, Nadeem MA. 2001.
Production efficacy of six ricecultivars against variousherbicides applied for weedcontrol in direct wet-seeded rice(Oryza sativa L.) culture. J. Biol. Sci.1(9):828-830.
Qazzafi M. 2000. Effect of culturalpractices along with herbicideapplication on weed control indirect wet-seeded rice (Oryza sativaL.) culture. MS thesis, GomalUniversity, D.I. Khan, Pakistan.
Table 2. Weed density of grasses and sedges as affected by herbicide application time and weed control effectiveness of selected herbicides,1999 and 2000.
1999 2000
Herbicide 3 WASa 6 WAS 9 WAS 3 WAS 6 WAS 9 WASused
Grasses Sedges Grasses Sedges Grasses Sedges Grasses Sedges Grasses Sedges Grasses Sedges
Weed densityb of grasses and sedges 15 DAAc)Ronstar 4.0 4.7 6.7 8.0 13.0 16.0 3.4 5.0 5.6 8.0 16.8 18.0Topstar 4.0 2.0 6.0 6.3 14.0 17.0 3.0 2.7 4.1 7.4 18.0 18.7Rifit 5.3 2.0 10.3 6.0 14.0 16.0 4.5 2.5 8.0 7.2 18.0 17.7Acelor 4.0 2.0 9.7 7.0 16.0 18.0 3.3 2.5 8.5 7.3 20.0 19.9Control 29.2 21.4 29.3 26.7 30.0 38.1 22.2 24.9 26.8 26.6 32.6 34.0
Effectiveness of herbicidesd in controlling weedsRonstar 86.3 78.2 77.2 70.0 56.7 58.1 86.3 78.4 79.8 69.1 48.5 47.0Topstar 86.3 90.7 79.0 76.8 53.3 55.4 86.5 89.1 83.2 73.8 44.7 45.0Rifit 81.8 90.7 65.0 77.1 53.3 58.1 79.8 89.9 69.1 74.1 44.7 47.9Acelor 86.3 90.7 66.7 74.0 46.7 52.8 85.2 89.9 68.3 73.7 38.6 41.6
aWAS = weeks after seeding. b Density= % m–2. cDAA = days after herbicide application.
Weed infestation in control plots – weed infestation in treated plotsdEffectiveness = x 100 Weed infestation in control plots
○ ○ ○ ○ ○ ○ ○ ○ ○ ○ ○ ○ ○ ○ ○ ○ ○ ○ ○
Rice—the food that feeds almost half the planet on a daily basis—is
going through a period of unprecedented change that presents bothenormous opportunities and great challenges. The recent sequencingof the rice genome has provided us with more knowledge of the grainthan we’ve had in its entire 2,000-year history. Such knowledge will becrucial in meeting the huge challenge of providing enough rice to feedall those who depend on it, while protecting the environment and ourprecious resources. That’s why the United Nations has declared 2004the International Year of Rice. The UN’s Food and AgricultureOrganization—working with partners such as IRRI—is firmly focused onmaking the world more aware that, without rice, there is no life.
○ ○ ○ ○ ○ ○ ○ ○ ○ ○ ○ ○ ○ ○ ○ ○ ○ ○ ○ ○ ○ ○ ○ ○ ○ ○ ○ ○ ○ ○ ○ ○ ○ ○ ○ ○ ○ ○ ○ ○ ○ ○ ○ ○ ○ ○ ○ ○ ○ ○ ○ ○ ○ ○ ○ ○ ○ ○ ○ ○ ○
50 December 2003
During rabi (Nov-Dec), thegrowth of rice seedlings in nurs-eries in some of the rice-growingareas in Andhra Pradesh, India,is poor due to the prevailing lowtemperature. The suppressedgrowth of seedlings caused bylow temperature is described ascold injury (Shibata 1970). Also,absorption of phosphorus wasmost strongly inhibited at lowtemperature (<16 °C). The lowconcentration of P in soil solutionP (2.5 times less) during coolermonths necessitates the applica-tion of higher doses of P (Katyaland Venkatramaya 1983). Hence,there exists a need for producingvigorous seedlings throughproper nursery management. Afield study was conducted duringthe 2001-02 rabi season at CollegeFarm, Rajendranagar, to evaluatethe effect of low temperature andP fertilization on seedling growthof rice variety IR64. The treat-ments consisted of three dates ofwet nursery sowing (20 Nov, 1Dec, and 10 Dec) and four levelsof P fertilization (0.5, 1.0, and 2.0kg P2O5 100 m–2). Soil was a sandy
Effect of nursery seeding date and phosphorus fertilizationon rice seedling growth
K. Ashok Kumar and M.D. Reddy, A.N.G.R. Agricultural University, Agronomy Department, College of Agriculture,Rajendranagar, Hyderabad 500030, Andhra Pradesh, India
clay loam with pH 7.9, low inavailable N (223 kg ha–1), andmedium in P (17 kg ha–1) and K(242 kg ha–1). The experiment waslaid out in a randomized com-plete block design (factorial) withthree replications. Each nurseryplot was 2 m × 3 m and was fertil-ized with a uniform dose of N andK at 1.0 kg 100 m–2.
The time required for seedsto sprout increased with delay insowing. Seeds sown on 20 Novtook 2 d to sprout, whereas thosesown on 1 Dec and 10 Dec re-quired 3 and 4 d, respectively(Table 1). This delay was due to adecrease in temperature insidethe incubated seed lots from 29 °Con 10 Dec. The plumule andradicle lengths of sprouted seedat the time of sowing were con-siderably greater in the 20 Novsowing than in the 10 Dec sow-ing. The shortest plumule andradicle were noticed with the 10Dec sowing. The reduced plu-mule and radicle lengths wereattributed to low emergence abil-ity at lower temperatures (Inouyeet al 1967).
With delay in sowing, thenumber of days required foremergence of the 1st, 2nd, and 3rdleaf increased (Table 2, see figure).However, P fertilization did notinfluence the emergence time ofleaves. Root length and shoot dryweight recorded at 10, 20, and 30days after sowing (DAS) werehigher in the 20 Nov sowing thanin the 1 Dec and 10 Dec sowings.Previously, the early growth rateof seedlings was found to increasewith increasing temperature(Tanaka and Yamaguchi 1969).There was a positive relation be-tween minimum temperatureand root length and betweenseedling height and seedlingweight, confirming that a tem-perature decline resulted in de-creased growth of rice seedlings(see figure).
Fertilization with 2.0 kg P2O5
100 m–2 resulted in greater rootlength, seedling height, and shootdry weight compared with 0.5 kgP2O5 and 1.0 kg P2O5 100 m–2,though it was on a par with 1.5kg P2O5 100 m–2 (Table 2). Appli-cation of P resulted in more vig-
Table 1. Effect of dates of nursery sowing on days for sprouting and plumule and radicle length.
Date of Atmospheric temperature Days required for Temperature inside Plumule Radiclenursery sprouting incubation at length (mm) length (mm)sowing Initial 30-day range after germination
sowing (°C) (°C)
Max Min
20 Nov 27.7-31.7 8.1-18.0 2 29.0 3.20 21.61 Dec 26.7-31.7 8.1-15.9 3 24.5 1.43 6.010 Dec 26.2-31.7 6.3-18.1 4 24.2 0.77 5.7 SE 0.2 0.42 1.24 CD (P = 0.05) 0.7 1.21 3.74

51IRRN 28.2
orous roots as previously re-ported (Bhattacharya andChatterjee 1978). Application of Pat 18.9 kg P ha–1 was found to in-
Table 2. Effect of nursery sowing date and P fertilization on growth of nursery seedlings.
Days required for Root length (cm) Seedling height (cm) Shoot dry weight (mg) 10 seedlings–1
Treatment emergence ofDAS DAS DAS
1st leaf 2nd leaf 3rd leaf 10 20 30 10 20 30 10 20 30
Date of nursery sowing20 Nov 5.9 9.8 15.3 4.0 11.4 18.7 9.1 13.7 17.4 255 384 5691 Dec 10.9 18.0 23.0 5.3 8.7 15.6 4.0 5.9 12.5 108 156 40310 Dec 12.2 19.8 28.6 2.8 5.7 8.7 2.4 4.0 7.9 53 124 212 SE 0.2 0.2 0.3 0.2 0.3 0.4 0.2 0.3 0.2 10 11.82 12.25 CD (P = 0.05) 0.7 0.7 1.0 0.5 0.8 1.1 0.5 0.8 0.7 22 34.64 35.88Levels of P2O5
(kg 100 m–2)0.5 10.0 16.4 22.8 3.4 7.2 12.9 4.1 6.8 11.8 92 170 3091.0 9.7 15.8 22.8 3.8 8.5 14.1 4.8 7.4 12.1 117 197 3641.5 9.7 15.3 22.0 4.3 9.3 14.7 6.1 8.2 13.0 167 247 4482.0 9.3 15.8 21.8 4.7 9.5 15.6 5.6 9.0 13.5 181 270 459 SE 0.2 0.3 0.4 0.2 0.3 0.3 7 13.62 14.3 CD (P = 0.05) ns ns nd 0.6 0.9 1.2 0.6 0.9 0.8 21 39.90 41.43
10
9
8
7
6
5
4
3
2
1
010 11 12 13 14 15 16
300
250
200
150
100
50
0
Root length (cm); seedlingheight (cm)
Seedling weight (mg/10seedlings)
Root length (cm); seedlingheight (cm)16
14
12
10
8
6
4
2
450
400
350
300
250
200
150
100
50
010 11 12 13 14 15 16
Seedling weight (mg/10seedlings)
10 11 12 13 14 15 8 10 12 14 1616Average minimum temperature (°C)
30 DAS Leaf emergence
10 DAS 20 DASY = 10.47 + 0.4759x
R2 = 0.9999
21
19
17
15
13
11
9
7
5
35
30
25
20
15
10
5
0
700
600
500
400
300
200
100
0
Y = 10.7227 + 0.0159xR2 = 0.9994
Y = 11.7638 + 0.29xR2 = 0.0474NS
Y = 8.8345 + 0.5560xR2 = 0.7727
Y = 9.4427 + 0.0088xR2 = 0.9002
Y = 8.6682 + 0.3385xR2 = 0.9325
Y = 16.3905 – 0.204xR2 = 0.9674
Y = 17.7 – 0.325xR2 = 0.9825
Y = 18.15 – 0.55xR2 = 0.9758
1st leaf
2nd leaf
3rd leaf
Root length
Seedling height (cm)
Shoot weight (mg/10 seedlings)
Y = 8.1520 + 0.5560xR2 = 0.9061
Y = 10..3889 + 0.3235xR2 = 0.961
Y = 10.3553 + 0.0159xR2 = 0.9833
No. of days
crease seedling dry weight(Anwarulla et al 1995). Delayedsowing drastically reduced rootlength, seedling height, and shoot
dry matter because the low tem-perature caused slower vegeta-tive growth (Kaneda and Beachell1974). This is possibly due to re-
Effects of average minimum temperature on root length, seedling height, seedling weight, and days of leaf emergence 10, 20, and 30 days afternursery sowing.

52 December 2003
duced mitotic activity in the cellsof the vegetative shoot apex onaccount of the low temperature(Shimizu 1958). Application of Pat higher levels resulted in bettergrowth of seedlings, but thiscould not compensate for thepositive effects of early sowing.
ReferencesAnwarulla MS, Shadakshari YG,
Vasudev HS, Poonacha NM. 1995.Managing rice nurseries duringwinter season in the hill zone,Karnataka, India. Int. Rice Res.
Newsl. 20(1):23-24.Bhattacharya KK, Chatterjee BN. 1978.
Growth of rice as influenced byphosphorus. Indian J. Agric. Sci.48(10):589-597.
Inouye J, Anayama T, Katayama T 1967.1. Studies on the emergence of riceseedlings in direct sowing culture.2. Effect of submersion treatmenton the emergence of plumule.Proc. Crop Sci. Soc. Jpn. 36:25-31.
Kaneda C, Beachell HM. 1974.Response of indica-japonica ricehybrids to low temperatures.SABRAO J. 6:17-32.
Katyal J C, Venkatramaya K. 1983.Seasonal differences in soil
solution phosphorus in vertisoland phosphorus nutrition oflowland rice. J. Indian Soc. Soil Sci.31:192-196.
Shibata M. 1970. Present conditions andsubjects of rice breeding for coldtolerance in Japan. JARQ5(2):1-4.
Shimizu M. 1958. Effects of temperatureon the structure and physiology ofthe vegetative shoot apex in therice plant. Jpn. J. Breed. 8:195.
Tanaka A, Yamaguchi J. 1969. Studieson the growth efficiency of cropplants: growth efficiency duringgermination in the dark [inJapanese]. J. Sci. Manure 40:38-42.
○ ○ ○ ○ ○ ○ ○ ○ ○ ○ ○ ○ ○ ○ ○ ○ ○ ○ ○
Golden Apple Snail (GAS): CD-ROM
Title: Scientific Information Database on Golden Apple Snail (Pomacea spp.)
ISBN 971-92558-7-0
The golden apple snail (GAS) Pomacea spp. CD-ROM provides a quick and easy access to about threedecades of literature on ecology, damage, management options, and utilization. GAS is classified as analien invasive pest of rice, taro, and other plants that grow in aquatic environments. It includes over 400articles and over 100 images. The information is sourced from experts around the world. This CD-ROMis designed as a reference tool or a resource package for agricultural technicians, researchers, advisers,students, and those engaged in GAS research, extension, and training. The user can take this CD-ROMand study, while on travel. It is easy to use, as all the software needed are supplied on the disc. Theinformation is easily accessed through Adobe Acrobat Reader. Information on this CD-ROM is searchableby author, title, and year of publication, journal title, and keywords.
Future plans include developing web wizards, establishing mirror sites for web page, and translatingCD contents into Spanish, Chinese, Thai, Khmer, Vietnamese, Indonesian, and other languages.
We envisage that the cooperation between the GAS collaborators and institutions now contributingwill continue to improve and strengthen in future as well.
Suggested citation:Joshi, R. C., Baucas, N.S., Joshi, E. E. and Verzola, E. E. 2003. Scientific Information Database on Golden AppleSnail (Pomacea spp.). CD-ROM. Baguio: Department of Agriculture-Regional Field Unit-Cordillera AdministrativeRegion (DA-RFU-CAR) in collaboration with Department of Agriculture-Philippine Rice Research Institute (DA-PhilRice), Agricultural Librarians Association of the Philippines (ALAP), and the Department of Agriculture-Cordillera
Highland Agricultural Resource Management Project (DA-CHARMP).
For orders, contactMs. Salome Ledesma, president, Agricultural Librarians Association of the Philippines (ALAP), University of the Philippines LosBaños, Main Library, College, Laguna 4031, Philippines. Each CD-ROM costs 500 Philippine pesos (local purchase) and 50 USdollars (foreign purchase exclusive of postage and handling).
E-mail: [email protected]; [email protected]
NEW PUBLICATION
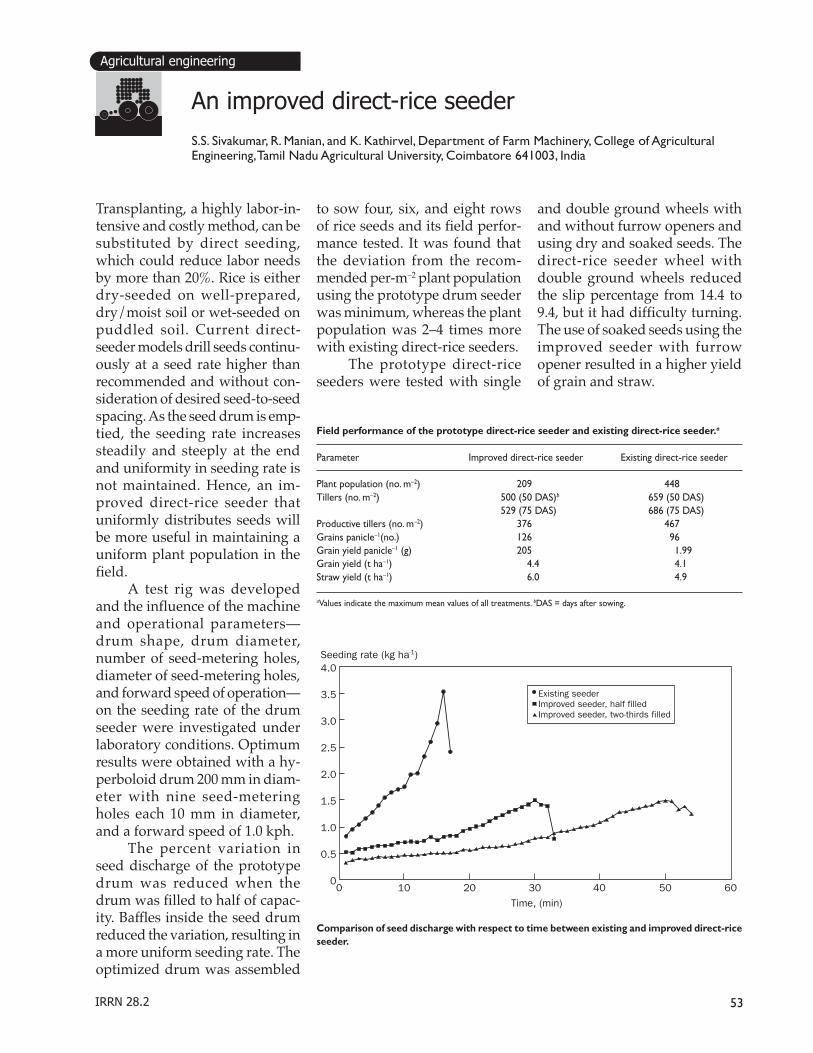
53IRRN 28.2
Agricultural engineering
Transplanting, a highly labor-in-tensive and costly method, can besubstituted by direct seeding,which could reduce labor needsby more than 20%. Rice is eitherdry-seeded on well-prepared,dry/moist soil or wet-seeded onpuddled soil. Current direct-seeder models drill seeds continu-ously at a seed rate higher thanrecommended and without con-sideration of desired seed-to-seedspacing. As the seed drum is emp-tied, the seeding rate increasessteadily and steeply at the endand uniformity in seeding rate isnot maintained. Hence, an im-proved direct-rice seeder thatuniformly distributes seeds willbe more useful in maintaining auniform plant population in thefield.
A test rig was developedand the influence of the machineand operational parameters—drum shape, drum diameter,number of seed-metering holes,diameter of seed-metering holes,and forward speed of operation—on the seeding rate of the drumseeder were investigated underlaboratory conditions. Optimumresults were obtained with a hy-perboloid drum 200 mm in diam-eter with nine seed-meteringholes each 10 mm in diameter,and a forward speed of 1.0 kph.
The percent variation inseed discharge of the prototypedrum was reduced when thedrum was filled to half of capac-ity. Baffles inside the seed drumreduced the variation, resulting ina more uniform seeding rate. Theoptimized drum was assembled
An improved direct-rice seeder
S.S. Sivakumar, R. Manian, and K. Kathirvel, Department of Farm Machinery, College of AgriculturalEngineering, Tamil Nadu Agricultural University, Coimbatore 641003, India
to sow four, six, and eight rowsof rice seeds and its field perfor-mance tested. It was found thatthe deviation from the recom-mended per-m–2 plant populationusing the prototype drum seederwas minimum, whereas the plantpopulation was 2–4 times morewith existing direct-rice seeders.
The prototype direct-riceseeders were tested with single
and double ground wheels withand without furrow openers andusing dry and soaked seeds. Thedirect-rice seeder wheel withdouble ground wheels reducedthe slip percentage from 14.4 to9.4, but it had difficulty turning.The use of soaked seeds using theimproved seeder with furrowopener resulted in a higher yieldof grain and straw.
4.0
3.5
3.0
2.5
2.0
1.5
1.0
0.5
0
Seeding rate (kg ha-1)
0
Time, (min)
10 20 30 40 50 60
Existing seederImproved seeder, half filledImproved seeder, two-thirds filled
Comparison of seed discharge with respect to time between existing and improved direct-riceseeder.
Field performance of the prototype direct-rice seeder and existing direct-rice seeder.a
Parameter Improved direct-rice seeder Existing direct-rice seeder
Plant population (no. m–2) 209 448Tillers (no. m–2) 500 (50 DAS)b 659 (50 DAS)
529 (75 DAS) 686 (75 DAS)Productive tillers (no. m–2) 376 467Grains panicle–1(no.) 126 96Grain yield panicle–1 (g) 205 1.99Grain yield (t ha–1) 4.4 4.1Straw yield (t ha–1) 6.0 4.9
aValues indicate the maximum mean values of all treatments. bDAS = days after sowing.
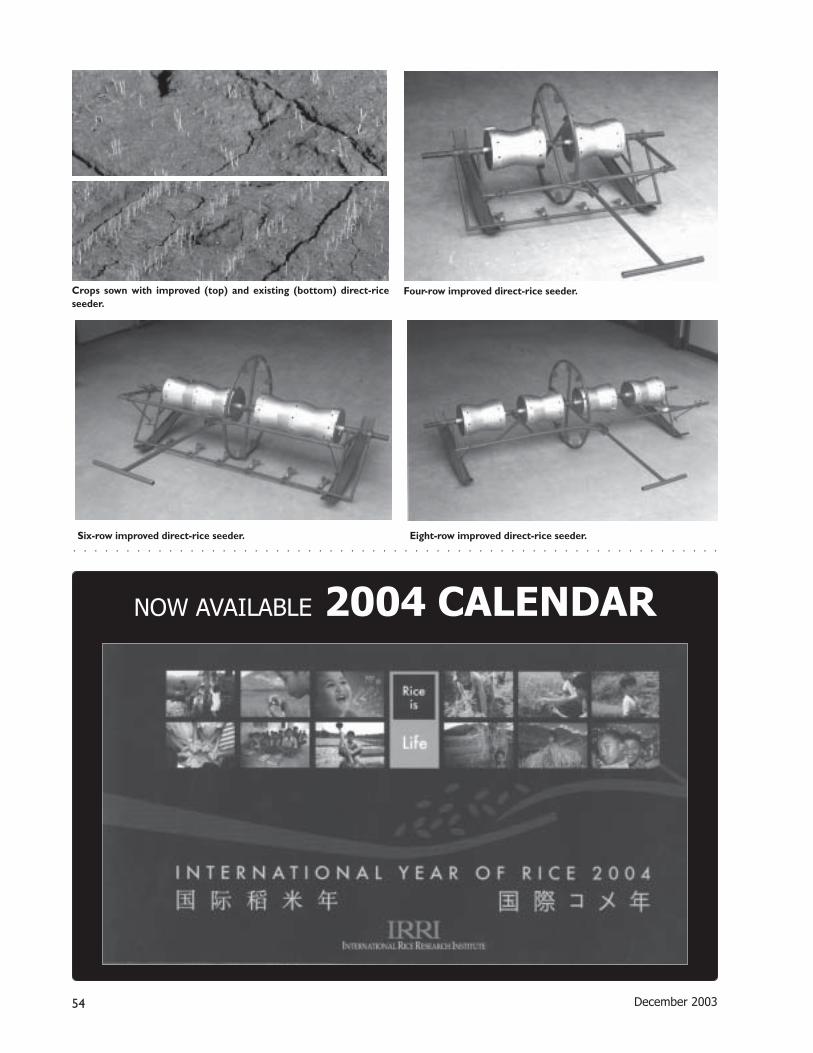
54 December 2003
Eight-row improved direct-rice seeder.Six-row improved direct-rice seeder.
Four-row improved direct-rice seeder.Crops sown with improved (top) and existing (bottom) direct-riceseeder.
○ ○ ○ ○ ○ ○ ○ ○ ○ ○ ○ ○ ○ ○ ○ ○ ○ ○ ○ ○ ○ ○ ○ ○ ○ ○ ○ ○ ○ ○ ○ ○ ○ ○ ○ ○ ○ ○ ○ ○ ○ ○ ○ ○ ○ ○ ○ ○ ○ ○ ○ ○ ○ ○ ○ ○ ○ ○ ○ ○ ○
NOW AVAILABLE 2004 CALENDAR
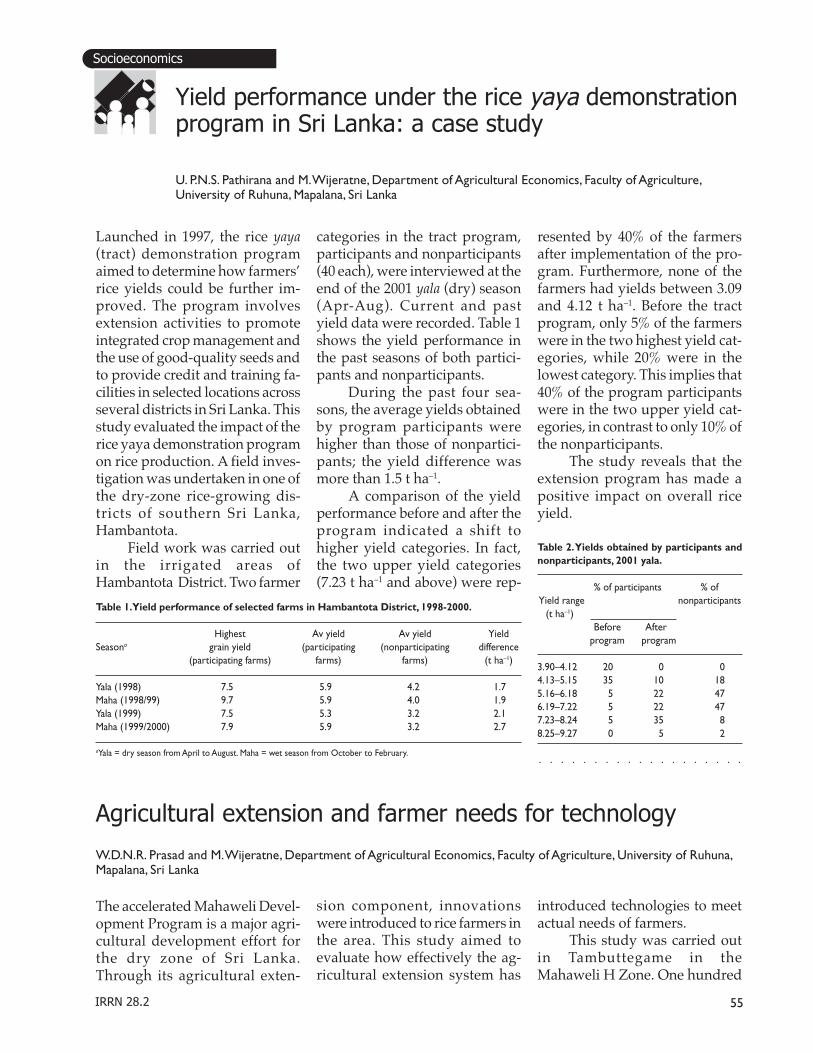
55IRRN 28.2
Socioeconomics
Launched in 1997, the rice yaya(tract) demonstration programaimed to determine how farmers’rice yields could be further im-proved. The program involvesextension activities to promoteintegrated crop management andthe use of good-quality seeds andto provide credit and training fa-cilities in selected locations acrossseveral districts in Sri Lanka. Thisstudy evaluated the impact of therice yaya demonstration programon rice production. A field inves-tigation was undertaken in one ofthe dry-zone rice-growing dis-tricts of southern Sri Lanka,Hambantota.
Field work was carried outin the irrigated areas ofHambantota District. Two farmer
Yield performance under the rice yaya demonstrationprogram in Sri Lanka: a case study
U. P.N.S. Pathirana and M. Wijeratne, Department of Agricultural Economics, Faculty of Agriculture,University of Ruhuna, Mapalana, Sri Lanka
Table 1. Yield performance of selected farms in Hambantota District, 1998-2000.
Highest Av yield Av yield YieldSeasona grain yield (participating (nonparticipating difference
(participating farms) farms) farms) (t ha–1)
Yala (1998) 7.5 5.9 4.2 1.7Maha (1998/99) 9.7 5.9 4.0 1.9Yala (1999) 7.5 5.3 3.2 2.1Maha (1999/2000) 7.9 5.9 3.2 2.7
aYala = dry season from April to August. Maha = wet season from October to February.
Table 2. Yields obtained by participants andnonparticipants, 2001 yala.
% of participants % of Yield range nonparticipants (t ha–1)
Before After program program
3.90–4.12 20 0 04.13–5.15 35 10 185.16–6.18 5 22 476.19–7.22 5 22 477.23–8.24 5 35 88.25–9.27 0 5 2
categories in the tract program,participants and nonparticipants(40 each), were interviewed at theend of the 2001 yala (dry) season(Apr-Aug). Current and pastyield data were recorded. Table 1shows the yield performance inthe past seasons of both partici-pants and nonparticipants.
During the past four sea-sons, the average yields obtainedby program participants werehigher than those of nonpartici-pants; the yield difference wasmore than 1.5 t ha–1.
A comparison of the yieldperformance before and after theprogram indicated a shift tohigher yield categories. In fact,the two upper yield categories(7.23 t ha–1 and above) were rep-
resented by 40% of the farmersafter implementation of the pro-gram. Furthermore, none of thefarmers had yields between 3.09and 4.12 t ha–1. Before the tractprogram, only 5% of the farmerswere in the two highest yield cat-egories, while 20% were in thelowest category. This implies that40% of the program participantswere in the two upper yield cat-egories, in contrast to only 10% ofthe nonparticipants.
The study reveals that theextension program has made apositive impact on overall riceyield.
The accelerated Mahaweli Devel-opment Program is a major agri-cultural development effort forthe dry zone of Sri Lanka.Through its agricultural exten-
Agricultural extension and farmer needs for technology
W.D.N.R. Prasad and M. Wijeratne, Department of Agricultural Economics, Faculty of Agriculture, University of Ruhuna,Mapalana, Sri Lanka
sion component, innovationswere introduced to rice farmers inthe area. This study aimed toevaluate how effectively the ag-ricultural extension system has
introduced technologies to meetactual needs of farmers.
This study was carried outin Tambuttegame in theMahaweli H Zone. One hundred
○ ○ ○ ○ ○ ○ ○ ○ ○ ○ ○ ○ ○ ○ ○ ○ ○ ○ ○
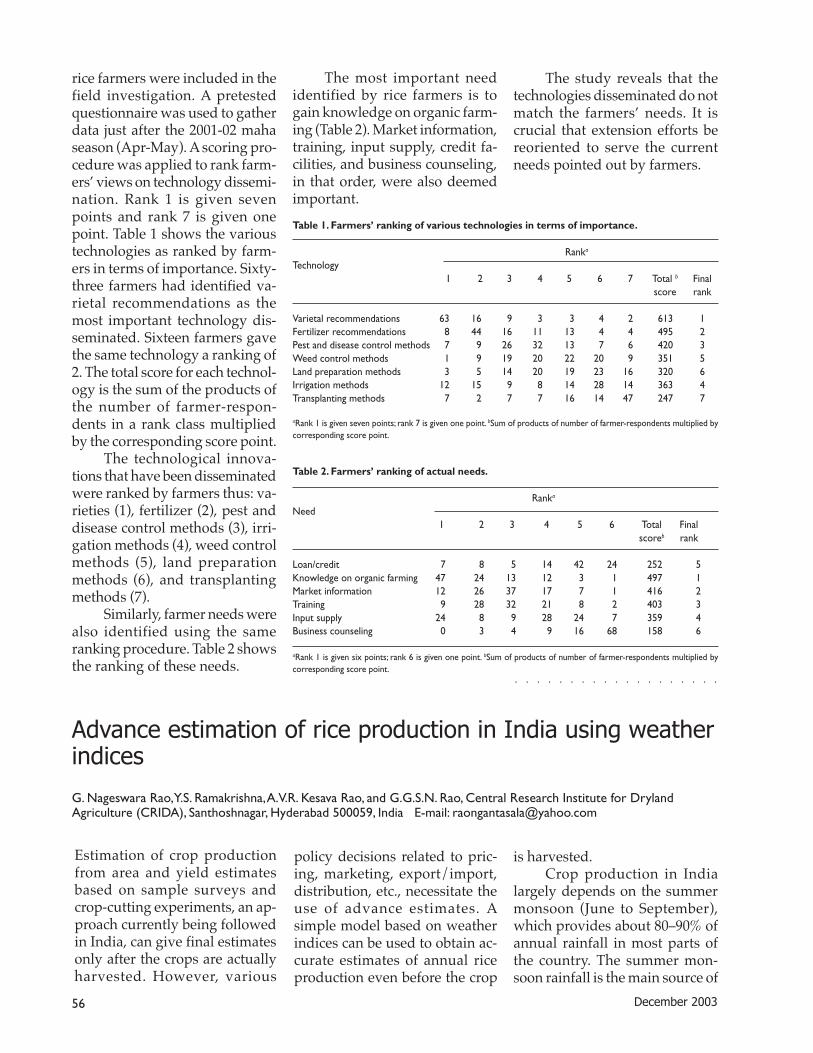
56 December 2003
Table 1. Farmers’ ranking of various technologies in terms of importance.
Ranka
Technology1 2 3 4 5 6 7 Total b Final
score rank
Varietal recommendations 63 16 9 3 3 4 2 613 1Fertilizer recommendations 8 44 16 11 13 4 4 495 2Pest and disease control methods 7 9 26 32 13 7 6 420 3Weed control methods 1 9 19 20 22 20 9 351 5Land preparation methods 3 5 14 20 19 23 16 320 6Irrigation methods 12 15 9 8 14 28 14 363 4Transplanting methods 7 2 7 7 16 14 47 247 7
aRank 1 is given seven points; rank 7 is given one point. bSum of products of number of farmer-respondents multiplied bycorresponding score point.
Table 2. Farmers’ ranking of actual needs.
Ranka
Need1 2 3 4 5 6 Total Final
scoreb rank
Loan/credit 7 8 5 14 42 24 252 5Knowledge on organic farming 47 24 13 12 3 1 497 1Market information 12 26 37 17 7 1 416 2Training 9 28 32 21 8 2 403 3Input supply 24 8 9 28 24 7 359 4Business counseling 0 3 4 9 16 68 158 6
aRank 1 is given six points; rank 6 is given one point. bSum of products of number of farmer-respondents multiplied bycorresponding score point.
Estimation of crop productionfrom area and yield estimatesbased on sample surveys andcrop-cutting experiments, an ap-proach currently being followedin India, can give final estimatesonly after the crops are actuallyharvested. However, various
Advance estimation of rice production in India using weatherindices
G. Nageswara Rao, Y.S. Ramakrishna, A.V.R. Kesava Rao, and G.G.S.N. Rao, Central Research Institute for DrylandAgriculture (CRIDA), Santhoshnagar, Hyderabad 500059, India E-mail: [email protected]
policy decisions related to pric-ing, marketing, export/import,distribution, etc., necessitate theuse of advance estimates. Asimple model based on weatherindices can be used to obtain ac-curate estimates of annual riceproduction even before the crop
is harvested.Crop production in India
largely depends on the summermonsoon (June to September),which provides about 80–90% ofannual rainfall in most parts ofthe country. The summer mon-soon rainfall is the main source of
rice farmers were included in thefield investigation. A pretestedquestionnaire was used to gatherdata just after the 2001-02 mahaseason (Apr-May). A scoring pro-cedure was applied to rank farm-ers’ views on technology dissemi-nation. Rank 1 is given sevenpoints and rank 7 is given onepoint. Table 1 shows the varioustechnologies as ranked by farm-ers in terms of importance. Sixty-three farmers had identified va-rietal recommendations as themost important technology dis-seminated. Sixteen farmers gavethe same technology a ranking of2. The total score for each technol-ogy is the sum of the products ofthe number of farmer-respon-dents in a rank class multipliedby the corresponding score point.
The technological innova-tions that have been disseminatedwere ranked by farmers thus: va-rieties (1), fertilizer (2), pest anddisease control methods (3), irri-gation methods (4), weed controlmethods (5), land preparationmethods (6), and transplantingmethods (7).
Similarly, farmer needs werealso identified using the sameranking procedure. Table 2 showsthe ranking of these needs.
The most important needidentified by rice farmers is togain knowledge on organic farm-ing (Table 2). Market information,training, input supply, credit fa-cilities, and business counseling,in that order, were also deemedimportant.
The study reveals that thetechnologies disseminated do notmatch the farmers’ needs. It iscrucial that extension efforts bereoriented to serve the currentneeds pointed out by farmers.
○ ○ ○ ○ ○ ○ ○ ○ ○ ○ ○ ○ ○ ○ ○ ○ ○ ○ ○
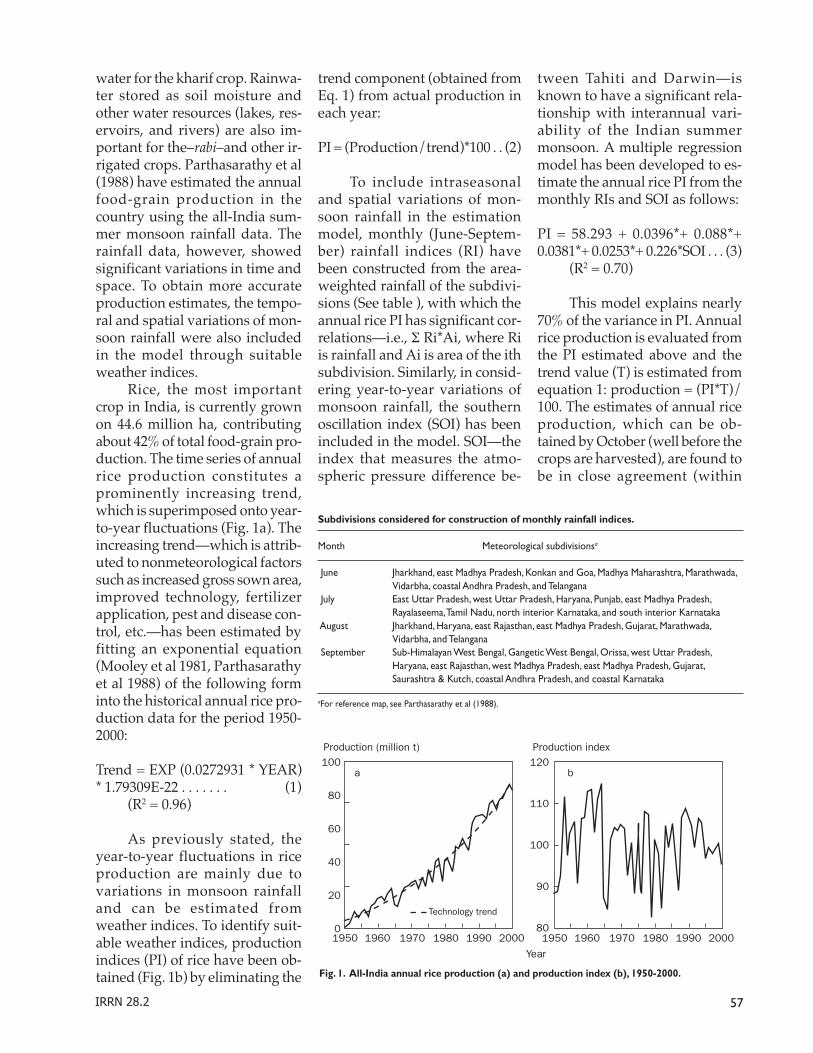
57IRRN 28.2
Year
1950 1960 1970 1980 1990 2000
120
110
100
90
80
Production index100
80
60
40
20
01950 1960 1970 1980 1990 2000
Technology trend
Production (million t)
a b
Fig. 1. All-India annual rice production (a) and production index (b), 1950-2000.
water for the kharif crop. Rainwa-ter stored as soil moisture andother water resources (lakes, res-ervoirs, and rivers) are also im-portant for the–rabi–and other ir-rigated crops. Parthasarathy et al(1988) have estimated the annualfood-grain production in thecountry using the all-India sum-mer monsoon rainfall data. Therainfall data, however, showedsignificant variations in time andspace. To obtain more accurateproduction estimates, the tempo-ral and spatial variations of mon-soon rainfall were also includedin the model through suitableweather indices.
Rice, the most importantcrop in India, is currently grownon 44.6 million ha, contributingabout 42% of total food-grain pro-duction. The time series of annualrice production constitutes aprominently increasing trend,which is superimposed onto year-to-year fluctuations (Fig. 1a). Theincreasing trend—which is attrib-uted to nonmeteorological factorssuch as increased gross sown area,improved technology, fertilizerapplication, pest and disease con-trol, etc.—has been estimated byfitting an exponential equation(Mooley et al 1981, Parthasarathyet al 1988) of the following forminto the historical annual rice pro-duction data for the period 1950-2000:
Trend = EXP (0.0272931 * YEAR)* 1.79309E-22 . . . . . . . (1)
(R2 = 0.96)
As previously stated, theyear-to-year fluctuations in riceproduction are mainly due tovariations in monsoon rainfalland can be estimated fromweather indices. To identify suit-able weather indices, productionindices (PI) of rice have been ob-tained (Fig. 1b) by eliminating the
trend component (obtained fromEq. 1) from actual production ineach year:
PI = (Production/trend)*100 . . (2)
To include intraseasonaland spatial variations of mon-soon rainfall in the estimationmodel, monthly (June-Septem-ber) rainfall indices (RI) havebeen constructed from the area-weighted rainfall of the subdivi-sions (See table ), with which theannual rice PI has significant cor-relations—i.e., Σ Ri*Ai, where Riis rainfall and Ai is area of the ithsubdivision. Similarly, in consid-ering year-to-year variations ofmonsoon rainfall, the southernoscillation index (SOI) has beenincluded in the model. SOI—theindex that measures the atmo-spheric pressure difference be-
tween Tahiti and Darwin—isknown to have a significant rela-tionship with interannual vari-ability of the Indian summermonsoon. A multiple regressionmodel has been developed to es-timate the annual rice PI from themonthly RIs and SOI as follows:
PI = 58.293 + 0.0396*+ 0.088*+0.0381*+ 0.0253*+ 0.226*SOI . . . (3)
(R2 = 0.70)
This model explains nearly70% of the variance in PI. Annualrice production is evaluated fromthe PI estimated above and thetrend value (T) is estimated fromequation 1: production = (PI*T)/100. The estimates of annual riceproduction, which can be ob-tained by October (well before thecrops are harvested), are found tobe in close agreement (within
Subdivisions considered for construction of monthly rainfall indices.
Month Meteorological subdivisionsa
June Jharkhand, east Madhya Pradesh, Konkan and Goa, Madhya Maharashtra, Marathwada,Vidarbha, coastal Andhra Pradesh, and Telangana
July East Uttar Pradesh, west Uttar Pradesh, Haryana, Punjab, east Madhya Pradesh,Rayalaseema, Tamil Nadu, north interior Karnataka, and south interior Karnataka
August Jharkhand, Haryana, east Rajasthan, east Madhya Pradesh, Gujarat, Marathwada,Vidarbha, and Telangana
September Sub-Himalayan West Bengal, Gangetic West Bengal, Orissa, west Uttar Pradesh,Haryana, east Rajasthan, west Madhya Pradesh, east Madhya Pradesh, Gujarat,Saurashtra & Kutch, coastal Andhra Pradesh, and coastal Karnataka
aFor reference map, see Parthasarathy et al (1988).
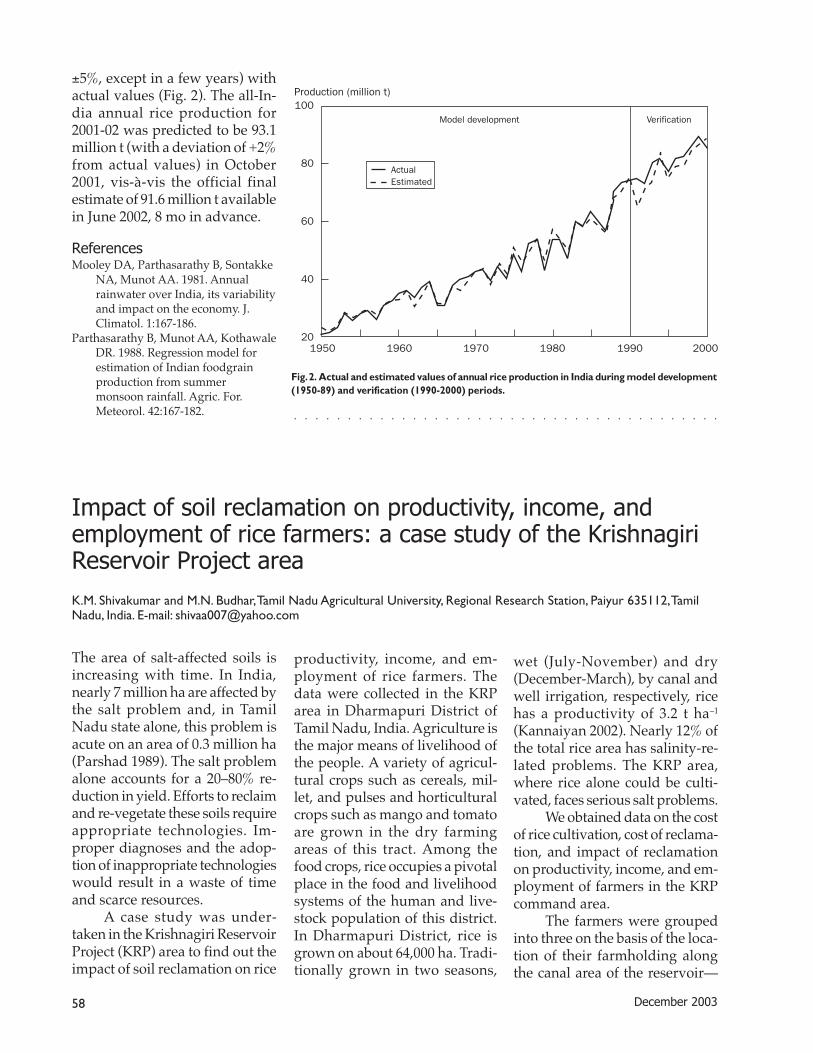
58 December 2003
100
80
60
40
20
ActualEstimated
1950 1960 1970 1980 1990 2000
Production (million t)
Model development Verification
Fig. 2. Actual and estimated values of annual rice production in India during model development(1950-89) and verification (1990-2000) periods.
The area of salt-affected soils isincreasing with time. In India,nearly 7 million ha are affected bythe salt problem and, in TamilNadu state alone, this problem isacute on an area of 0.3 million ha(Parshad 1989). The salt problemalone accounts for a 20–80% re-duction in yield. Efforts to reclaimand re-vegetate these soils requireappropriate technologies. Im-proper diagnoses and the adop-tion of inappropriate technologieswould result in a waste of timeand scarce resources.
A case study was under-taken in the Krishnagiri ReservoirProject (KRP) area to find out theimpact of soil reclamation on rice
Impact of soil reclamation on productivity, income, andemployment of rice farmers: a case study of the KrishnagiriReservoir Project area
K.M. Shivakumar and M.N. Budhar, Tamil Nadu Agricultural University, Regional Research Station, Paiyur 635112, TamilNadu, India. E-mail: [email protected]
productivity, income, and em-ployment of rice farmers. Thedata were collected in the KRParea in Dharmapuri District ofTamil Nadu, India. Agriculture isthe major means of livelihood ofthe people. A variety of agricul-tural crops such as cereals, mil-let, and pulses and horticulturalcrops such as mango and tomatoare grown in the dry farmingareas of this tract. Among thefood crops, rice occupies a pivotalplace in the food and livelihoodsystems of the human and live-stock population of this district.In Dharmapuri District, rice isgrown on about 64,000 ha. Tradi-tionally grown in two seasons,
wet (July-November) and dry(December-March), by canal andwell irrigation, respectively, ricehas a productivity of 3.2 t ha–1
(Kannaiyan 2002). Nearly 12% ofthe total rice area has salinity-re-lated problems. The KRP area,where rice alone could be culti-vated, faces serious salt problems.
We obtained data on the costof rice cultivation, cost of reclama-tion, and impact of reclamationon productivity, income, and em-ployment of farmers in the KRPcommand area.
The farmers were groupedinto three on the basis of the loca-tion of their farmholding alongthe canal area of the reservoir—
±5%, except in a few years) withactual values (Fig. 2). The all-In-dia annual rice production for2001-02 was predicted to be 93.1million t (with a deviation of +2%from actual values) in October2001, vis-à-vis the official finalestimate of 91.6 million t availablein June 2002, 8 mo in advance.
ReferencesMooley DA, Parthasarathy B, Sontakke
NA, Munot AA. 1981. Annualrainwater over India, its variabilityand impact on the economy. J.Climatol. 1:167-186.
Parthasarathy B, Munot AA, KothawaleDR. 1988. Regression model forestimation of Indian foodgrainproduction from summermonsoon rainfall. Agric. For.Meteorol. 42:167-182.
○ ○ ○ ○ ○ ○ ○ ○ ○ ○ ○ ○ ○ ○ ○ ○ ○ ○ ○ ○ ○ ○ ○ ○ ○ ○ ○ ○ ○ ○ ○ ○ ○ ○ ○ ○ ○ ○ ○ ○
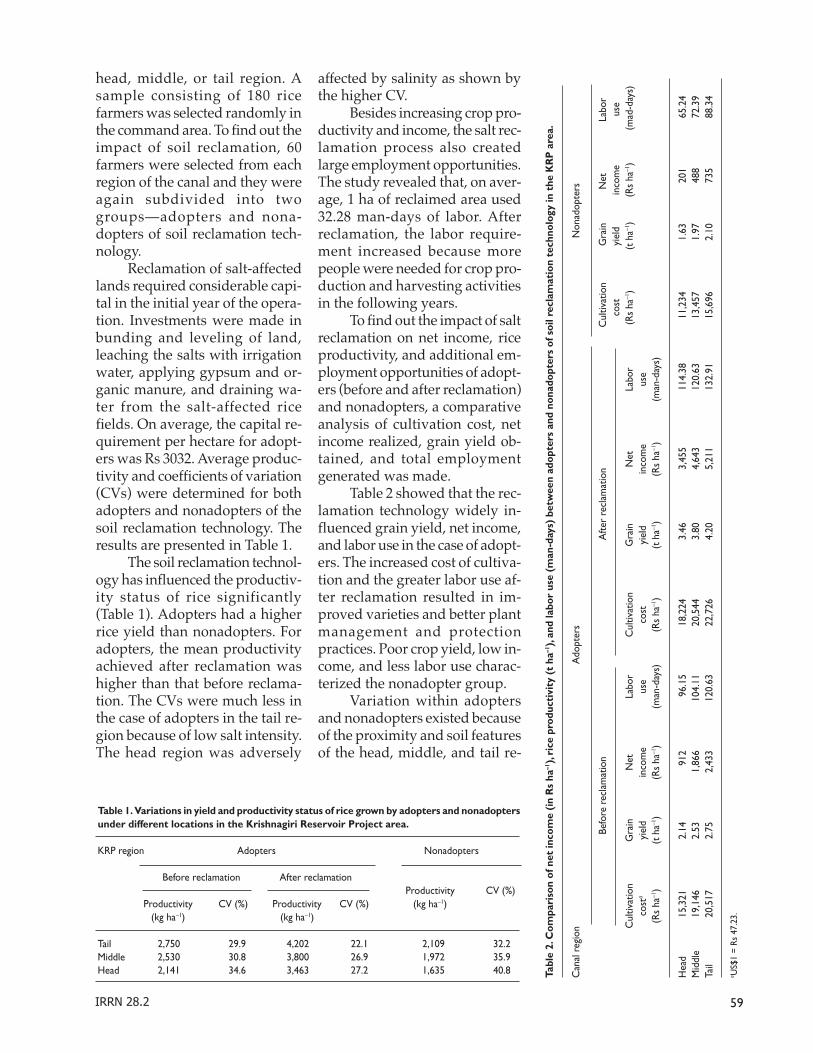
59IRRN 28.2
Table 1. Variations in yield and productivity status of rice grown by adopters and nonadoptersunder different locations in the Krishnagiri Reservoir Project area.
KRP region Adopters Nonadopters
Before reclamation After reclamationProductivity CV (%)
Productivity CV (%) Productivity CV (%) (kg ha–1)(kg ha–1) (kg ha–1)
Tail 2,750 29.9 4,202 22.1 2,109 32.2Middle 2,530 30.8 3,800 26.9 1,972 35.9Head 2,141 34.6 3,463 27.2 1,635 40.8
head, middle, or tail region. Asample consisting of 180 ricefarmers was selected randomly inthe command area. To find out theimpact of soil reclamation, 60farmers were selected from eachregion of the canal and they wereagain subdivided into twogroups—adopters and nona-dopters of soil reclamation tech-nology.
Reclamation of salt-affectedlands required considerable capi-tal in the initial year of the opera-tion. Investments were made inbunding and leveling of land,leaching the salts with irrigationwater, applying gypsum and or-ganic manure, and draining wa-ter from the salt-affected ricefields. On average, the capital re-quirement per hectare for adopt-ers was Rs 3032. Average produc-tivity and coefficients of variation(CVs) were determined for bothadopters and nonadopters of thesoil reclamation technology. Theresults are presented in Table 1.
The soil reclamation technol-ogy has influenced the productiv-ity status of rice significantly(Table 1). Adopters had a higherrice yield than nonadopters. Foradopters, the mean productivityachieved after reclamation washigher than that before reclama-tion. The CVs were much less inthe case of adopters in the tail re-gion because of low salt intensity.The head region was adversely
affected by salinity as shown bythe higher CV.
Besides increasing crop pro-ductivity and income, the salt rec-lamation process also createdlarge employment opportunities.The study revealed that, on aver-age, 1 ha of reclaimed area used32.28 man-days of labor. Afterreclamation, the labor require-ment increased because morepeople were needed for crop pro-duction and harvesting activitiesin the following years.
To find out the impact of saltreclamation on net income, riceproductivity, and additional em-ployment opportunities of adopt-ers (before and after reclamation)and nonadopters, a comparativeanalysis of cultivation cost, netincome realized, grain yield ob-tained, and total employmentgenerated was made.
Table 2 showed that the rec-lamation technology widely in-fluenced grain yield, net income,and labor use in the case of adopt-ers. The increased cost of cultiva-tion and the greater labor use af-ter reclamation resulted in im-proved varieties and better plantmanagement and protectionpractices. Poor crop yield, low in-come, and less labor use charac-terized the nonadopter group.
Variation within adoptersand nonadopters existed becauseof the proximity and soil featuresof the head, middle, and tail re-
Tabl
e 2.
Com
pari
son
of n
et in
com
e (i
n R
s ha
–1),
rice
pro
duct
ivit
y (t
ha–1
), an
d la
bor
use
(man
-day
s) b
etw
een
adop
ters
and
non
adop
ters
of s
oil r
ecla
mat
ion
tech
nolo
gy in
the
KR
P a
rea.
Can
al r
egio
n
A
dopt
ers
Non
adop
ters
B
efor
e re
clam
atio
n
Afte
r re
clam
atio
n
C
ultiv
atio
n
G
rain
Net
La
bor
cos
t
yie
ld
in
com
e
use
Cul
tivat
ion
Gra
inN
etLa
bor
Cul
tivat
ion
Gra
inN
etLa
bor
(Rs
ha–1
)(t
ha–1
)(R
s ha
–1)
(mad
-day
s)co
sta
yiel
din
com
eus
eco
styi
eld
inco
me
use
(Rs
ha–1
)(t
ha–1
)(R
s ha
–1)
(man
-day
s)(R
s ha
–1)
(t h
a–1)
( Rs
ha–1
)(m
an-d
ays)
Hea
d15
,321
2.14
912
96.1
518
,224
3.46
3,45
511
4.38
11,2
341.
6320
165
.24
Mid
dle
19,1
462.
531,
866
104.
1120
,544
3.80
4,64
312
0.63
13,4
571.
9748
872
.39
Tail
20,5
172.
752,
433
120.
6322
,726
4.20
5,21
113
2.91
15,6
962.
1073
588
.34
a US$
1 =
Rs 4
7.23
.

60 December 2003
Floodplain agriculture inBangladesh is characterized bysmallholders operating marginalparcels of land, with heavy reli-ance on the winter rice crop.When the annual floods, whichnormally begin in early or mid-June, arrive even a week or twoearly, they may submerge thestanding rice crop prior to har-vest, often causing considerabledamage. Where overbank flood-ing from main river channels isthe principal source of early floodrisk, as in the case with flashfloods in the northeast, structuralmeans of flood control such assubmersible embankments maybe effectively employed. In north-central Bangladesh, however,much of the early flooding is fromlocal rainfall impoundment, andtherefore structural methods areless helpful. Using biophysicaland socioeconomic data collectedin north-central Bangladesh, weinvestigated (1) the extent andpatterns of damage caused by 1-and 2-wk early floods and (2)what readily available (nonstruc-tural) opportunities existed to re-duce such risk.
A previous floodplain live-lihood project (Barr 2000) in theCharan beel (floodplain waterbody) and floodplain area inTangail District had collected a setof biophysical and socioeconomic
Exposure of Bangladeshi rice farmers to early flood risk
B. Shankar, University of Reading, P.O. Box 237, Reading, UK, and J. Barr, ITAD Ltd., Ditchling, Hassocks, West Sussex, UK
data over the 1997-98 hydrologi-cal year. These included flooddepth and spread measurements,plot-level cropping pattern,monthly crop growth stage, andsocioeconomic information.These data were stored in aproject geographic informationsystem (GIS). The start of theflood in 1997-98 was perceived inthe study area as normal. On thatbasis, we took these data as thebaseline, simulated the arrival of1- and 2-wk early flood eventsusing GIS methods, computeddamage estimates using simplewater depth and yield damageparameters to answer question 1,and queried the plot-specificcropping pattern information toanswer question 2 above.
Results revealed that, as ex-pected, plot-level damage due toearly floods was strongly dictatedby elevation of the land. Follow-ing the standard definition ofland elevation in Bangladesh,45% of the very low (VL) plotswere seen from the simulations tosuffer some damage even from a1-wk early flood. Significantly,when the damage does occur, itis likely to be substantial. Most ofthe affected VL plots are almostcompletely damaged by a 1-wkearly flood. Two-week early flooddamaged about half the VL plots.For the low (L) plots, 1-wk early
gions of the reservoir area. Thesalt reclamation process indeedhad a direct impact on rice pro-ductivity, net farm income, andemployment generation. The in-direct benefits were an increase in
land value and conservation ofthe soil-crop environment.
ReferencesParshad R. 1989. Technology for
reclamation of sodic soils. IndianFarming 39:26-27.
Kannaiyan S. 2002. Research activitiesin crop improvement of rice,agricultural education andextension activities in Tamil NaduAgricultural University,Directorate of Research. TamilNadu (India): TNAU. p 18-24.
floods damaged only 8% of theplots, while 2-wk early floodsdamaged about 40% of the plots.Higher land elevations were notseen to suffer any damage fromthese simulated flood events.
It is not surprising that VLplots suffer most from early floodevents. But what factors explainthe damage to some VL plots,while others remain undamaged?Analysis of plot-level croppingpatterns provided an interestingclue in this regard. Every singleundamaged VL plot was found tobe devoted to a single crop of win-ter rice, whereas 90% of the dam-aged VL plots were found to in-clude a mustard crop just prior tothe winter rice. Mustard is a cashcrop, and the farmers in the areause proceeds from its sale to fi-nance expensive inputs for thehigh-yielding rice crop (HYV) im-mediately following. The neces-sity for some farmers to do thisappears to be delaying the plant-ing of rice, resulting in corre-spondingly later harvests and in-creased exposure to early floods.Another interesting patternfound in the data was that thedamaged VL plots were mostlyplanted to the older generation ofrelatively long-duration HYVssuch as IR8, while shorter dura-tion varieties with comparableyield, such as BR26 and BR28,
○ ○ ○ ○ ○ ○ ○ ○ ○ ○ ○ ○ ○ ○ ○ ○ ○ ○ ○

61IRRN 28.2
have been available for some timenow.
In summary, our results showthat even the slightly early floodevents (1 to 2 wk) that occur withreasonable frequency in north-cen-tral Bangladesh are prone to causesignificant damage to very low el-evation winter rice plots. Yet, ourevidence shows that this is not aproblem requiring new invest-ments in technology. Rather, creditprovision for input financing and
extension help with existentshorter duration varieties can goa long way in ameliorating thissituation.
ReferenceBarr JJF. 2000. Investigation of
livelihood strategies and resourceuse patterns in floodplainproduction systems in Bangladesh.Project final technical report toDepartment for InternationalDevelopment-Natural ResourceSystems Programme, UK.
AcknowledgmentsThis document is an output from aproject funded by the UK Departmentfor International Development (DFID)for the benefit of developingcountries. The project was fundedunder DFID’s Renewable NaturalResources Research Strategy (RNRRS)through the Natural Resource SystemsProgramme (NRSP).
○ ○ ○ ○ ○ ○ ○ ○ ○ ○ ○ ○ ○ ○ ○ ○ ○ ○ ○
World Rice Research Conference
“Rice Is Life”Celebrating the International Year of Rice
4-7 November 2004Tokyo and Tsukuba, Japan
For updated information on the conference speakers and program,please visit the conference Web site at www.irri.org/wrrc2004
62 December 2003
NOTES FROM THE FIELD
Shahdol is predominantly atribal district in the central In-dian state of Madhya Pradesh.Tribals are indigenous forest-de-pendent communities. Consti-tuting 46% of the district popu-lation, the tribe members havelow income and low literacyrates.
Agriculture is one of themain sources of livelihood inShahdol. The district receives amean annual rainfall of 1,072mm, usually, from July to Sep-tember. The number of rainydays during the period mayreach 48. Rainfall is erratic andits distribution uneven. The un-dulating terrain and sandy soilfail to retain the rainwater thatflows rapidly, carrying with itthe topsoil. The soil is predomi-nantly sandy, though black soilis also found in small mosaicpatterns in the district.
A majority of the farmersbelong to the complex diverserisk-prone (CDR) group. Only7% of the total cultivated area(343,900 ha) in the district is irri-gated from various sources.Thus, the wet season is the maincultivation period and rice is themain crop, occupying 204,234 haor 60% of the total cultivatedarea. Lowland rice occupies 40%;the rest is upland rice. The erraticrainfall, the poor moisture-hold-ing capacity and fertility of thesoil, as well as the socioeconomicconditions of the CDR farmerscompel them to practice low-in-put rainfed rice farming. The re-sulting yields are usually poor(0.05 and 0.13 t ha–1, respectively,
Low-input managementof swarming caterpillaroutbreak in central India
M. Thomas, Krishi Vigyan Kendra,Shahdol 484001, India
from upland and lowland undernormal conditions).
In July 1999, there was anoutbreak of swarming caterpillarSpodoptera mauritia in the Kotmablock, one of nine developmentblocks in Shahdol, where rice iscultivated on 15,346 ha. It oc-curred in two villages, Changariand Gohendra, covering an areaof around 250 ha. During the sur-vey, S. mauritia was found tocause severe damage to the ricecrop, more in late-sown rice andin low-lying rice fields. Direct-sown rice, mostly in the upland,escaped the attack. However,crops raised by broadcasting ofpregerminated seeds and througha nursery were not spared. Thelarval population density (LPD)was greater in the lowland thanin the upland areas. The LPD var-ied from 10 to 12 m–2 in rice fieldswhere pregerminated seeds werebroadcast. Such fields were usu-ally located in the lower portionsof the uplands and from wherethe lowlands begin. In the low-land, the LPD was 1–2 per plant.In nursery beds, the LPD was138–142 m–2, with a populationdensity of almost 7–9 per plant.The transplanted fields had acomparatively lower LPD (76–79m–2), with 3–5 per plant).
The S. mauritia larvae werefound devouring rice foliage evenduring daylight hours. In thebunds of low-lying fields, larvaewere found in clusters, one overthe other. In the beginning, farm-ers thought that stray cattlecaused the damage when theygrazed at night. But there were nohoof marks. A closer look re-vealed larvae in large numbersdevouring the rice plants. A fewfarmers tried resowing but resultswere discouraging.
Because farmers in the areacannot afford pesticides, theytried to pour kerosene into the
stagnant water in the bundedfields (2 L of kerosene or burnedengine oil per half hectare). Withthe use of a long rope stretchedacross the bunds, two personswalked through the field, shakingthe plants rigorously. The larvaethat fell into the water with kero-sene died. Methyl parathion (2%dust applied at 25 kg ha–1) alongthe bunds of the field killed thepest, preventing migration toother rice fields. The techniquewas widely adopted because itproved to be a cheap and effec-tive method for managing the S.mauritia epidemic within a shorttime.
In the Ifugao rice terraces (IRT),farmers consistently rank rats astheir most important biotic con-straint to rice crop production(Joshi et al 2000). However, thesefarmers’ sociodemographic char-acteristics and existing knowl-edge, attitudes, and practices onrat management are undocu-mented. Hence, prior to introduc-ing the community-trap barriersystem (C-TBS) in two Ifugao mu-nicipalities, Banaue andHungduan, PhilRice and thetowns’ local government units(LGUs) initiated a baseline surveyin November 2002.
Knowledge, attitudes, andpractices on rat manage-ment of Ifugao rice farm-ers, Philippines
B.M. Catudan, R.C. Joshi, E.B. Gergon,N.V. Desamero, L.S. Sebastian,Philippine Rice Research Institute(PhilRice), Maligaya, Muñoz ScienceCity, 3119 Nueva Ecija: J.C. Cabigat,Local Government Unit (LGU),Banaue, Ifugao; and A. Cayong, LGU,Hungduan, Ifugao, Philippines
○ ○ ○ ○ ○ ○ ○ ○ ○ ○ ○ ○ ○ ○ ○ ○ ○ ○ ○
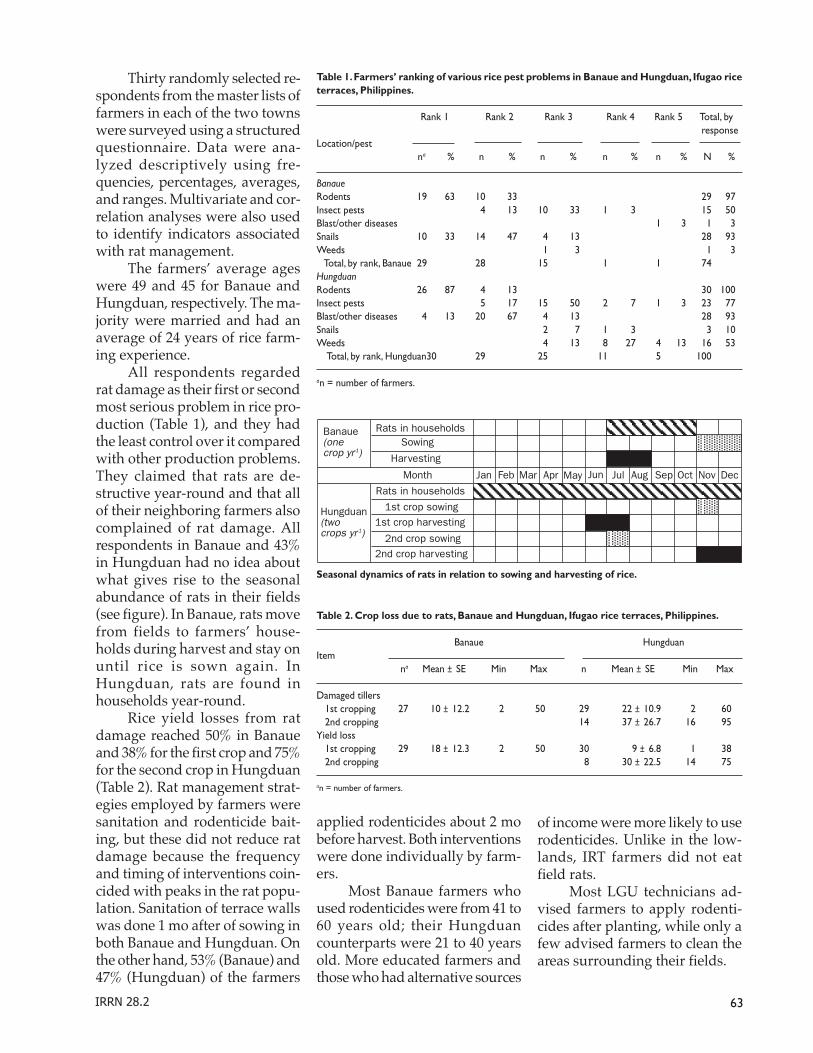
63IRRN 28.2
Thirty randomly selected re-spondents from the master lists offarmers in each of the two townswere surveyed using a structuredquestionnaire. Data were ana-lyzed descriptively using fre-quencies, percentages, averages,and ranges. Multivariate and cor-relation analyses were also usedto identify indicators associatedwith rat management.
The farmers’ average ageswere 49 and 45 for Banaue andHungduan, respectively. The ma-jority were married and had anaverage of 24 years of rice farm-ing experience.
All respondents regardedrat damage as their first or secondmost serious problem in rice pro-duction (Table 1), and they hadthe least control over it comparedwith other production problems.They claimed that rats are de-structive year-round and that allof their neighboring farmers alsocomplained of rat damage. Allrespondents in Banaue and 43%in Hungduan had no idea aboutwhat gives rise to the seasonalabundance of rats in their fields(see figure). In Banaue, rats movefrom fields to farmers’ house-holds during harvest and stay onuntil rice is sown again. InHungduan, rats are found inhouseholds year-round.
Rice yield losses from ratdamage reached 50% in Banaueand 38% for the first crop and 75%for the second crop in Hungduan(Table 2). Rat management strat-egies employed by farmers weresanitation and rodenticide bait-ing, but these did not reduce ratdamage because the frequencyand timing of interventions coin-cided with peaks in the rat popu-lation. Sanitation of terrace wallswas done 1 mo after of sowing inboth Banaue and Hungduan. Onthe other hand, 53% (Banaue) and47% (Hungduan) of the farmers
applied rodenticides about 2 mobefore harvest. Both interventionswere done individually by farm-ers.
Most Banaue farmers whoused rodenticides were from 41 to60 years old; their Hungduancounterparts were 21 to 40 yearsold. More educated farmers andthose who had alternative sources
Table 1. Farmers’ ranking of various rice pest problems in Banaue and Hungduan, Ifugao riceterraces, Philippines.
Rank 1 Rank 2 Rank 3 Rank 4 Rank 5 Total, by responseLocation/pest
na % n % n % n % n % N %
BanaueRodents 19 63 10 33 29 97Insect pests 4 13 10 33 1 3 15 50Blast/other diseases 1 3 1 3Snails 10 33 14 47 4 13 28 93Weeds 1 3 1 3 Total, by rank, Banaue 29 28 15 1 1 74HungduanRodents 26 87 4 13 30 100Insect pests 5 17 15 50 2 7 1 3 23 77Blast/other diseases 4 13 20 67 4 13 28 93Snails 2 7 1 3 3 10Weeds 4 13 8 27 4 13 16 53 Total, by rank, Hungduan30 29 25 11 5 100
an = number of farmers.
Banaue(onecrop yr-1)
Hungduan(twocrops yr-1)
Rats in householdsSowing
Harvesting
Month
Rats in households
1st crop sowing1st crop harvesting
2nd crop sowing2nd crop harvesting
Jan Feb Mar Apr May Jun Jul Aug Sep Oct Nov Dec
Seasonal dynamics of rats in relation to sowing and harvesting of rice.
of income were more likely to userodenticides. Unlike in the low-lands, IRT farmers did not eatfield rats.
Most LGU technicians ad-vised farmers to apply rodenti-cides after planting, while only afew advised farmers to clean theareas surrounding their fields.
Table 2. Crop loss due to rats, Banaue and Hungduan, Ifugao rice terraces, Philippines.
Banaue HungduanItem
na Mean ± SE Min Max n Mean ± SE Min Max
Damaged tillers 1st cropping 27 10 ± 12.2 2 50 29 22 ± 10.9 2 60 2nd cropping 14 37 ± 26.7 16 95Yield loss 1st cropping 29 18 ± 12.3 2 50 30 9 ± 6.8 1 38 2nd cropping 8 30 ± 22.5 14 75
an = number of farmers.
64 December 2003
We are currently identifyingthe rat species present in the IRTand studying their ecology andmanagement in the IRT, in part-nership with scientists from theCommunity Ecology Group ofthe Commonwealth Scientific and
Industrial Research Organisation(CSIRO), Australia.
ReferenceJoshi RC, Matchoc ORO, Bahatan RG,
Dela Peña FA. 2000. Farmers’knowledge, attitudes and practices
of rice crop and pest managementat Ifugao Rice Terraces,Philippines. Int. J. Pest Manage.46(1):43-48.
○ ○ ○ ○ ○ ○ ○ ○ ○ ○ ○ ○ ○ ○ ○ ○ ○ ○ ○
2004 IRRI group training courses (tentative listing)
Course Duration Target date Coordinator(s)/ (wk) course facilitator
*English for Conversation 2 9-20 Feb A Arboleda/D GavinoRice Breeding (with IRIS component) 3 9-27 Feb G Atlin/E CastroARBN Genomics Workshop 1 23-26 Feb H Leong/A ArboledaDeveloping Integrated Nutrient 2 1-12 Mar R Buresh/D Gavino Management Options for DeliveryRice Production I 2 15-26 Mar V Bala/E CastroBasic Experimental Designs and Data 1 19-23 Apr G McLaren/ Analysis Using IRRISTAT for Windows V Bartolome/S MagadiaScientific Writing and Presentation 2 May D Shires/A ArboledaIntroduction to the SAS System 1 21-25 Jun G McLaren/V Bartolome/
S Magadia*Intensive English 1 12 Jul-Sep A Arboleda/D GavinoGenetic Engineering, Food Safety & Awareness 1 Sep S Datta/D GavinoRice Production II 2 6-17 Sep V Bala/E CastroWater Management 1 Oct B BoumanLeadership Course for Asian Women in Ag R & D 2 Oct-Nov T Paris/G Zarsadias*Intensive English 2 3 Nov A Arboleda/D GavinoAnalysis of Unbalanced Data 1 15-19 Nov G McLaren/V Bartolome/
S MagadiaGrain Quality Management 1 TBA J Rickman/D GavinoIntellectual Property Rights 1 TBA TBAIN-COUNTRY COURSES
ORYZA2000, China 1 Apr B BoumanRice Technology Transfer Systems in Asia (RDA) 2 27 Sep-8 Oct J Lapitan/G ZarsadiasGrain Quality Management, Cambodia 1 TBA J RickmanGrain Quality Management, Bangladesh 1 TBA J RickmanWater Management, Myanmar 1 TBA J RickmanTractor Training, India 1 TBA J RickmanIntegrated Pest Management, Malaysia 2 TBA KL HeongIntegrated Pest Management, Vietnam 2 TBA KL HeongIntegrated Pest Management, Thailand 2 TBA KL HeongIntegrated Pest Management, Iran 2 TBA KL Heong
TBA = to be arranged. * = after 5 pm classes only. For details, email [email protected].
65IRRN 28.2

66 December 2004
IRRN welcomes three types of submittedmanuscripts: research notes, mini reviews, and“notes from the field.” All manuscripts musthave international or pan-national relevanceto rice science or production, be written inEnglish, and be an original work of theauthor(s), and must not have been previouslypublished elsewhere.
Research notesResearch notes submitted to IRRN should
• report on work conducted during theimmediate past 3 yr or work in progress
• advance rice knowledge• use appropriate research design and
data collection methodology• report pertinent, adequate data• apply appropriate statistical analysis,
and• reach supportable conclusions.Routine research. Reports of screening
trials of varieties, fertilizer, cropping methods,and other routine observations using standardmethodologies to establish local recommen-dations are not ordinarily accepted.
Preliminary research findings. To reachwell-supported conclusions, field trials shouldbe repeated across more than one season, inmultiple seasons, or in more than one loca-tion as appropriate. Preliminary research find-ings from a single season or location may beaccepted for publication in IRRN if the find-ings are of exceptional interest.
Preliminary data published in IRRN maylater be published as part of a more extensivestudy in another peer-reviewed publication,if the original IRRN article is cited. However,a note submitted to IRRN should not consistsolely of data that have been extracted from alarger publication that has already been or willsoon be published elsewhere.
Multiple submissions. Normally, onlyone report for a single experiment will be ac-cepted. Two or more items about the samework submitted at the same time will be re-turned for merging. Submitting at differenttimes multiple notes from the same experi-ment is highly inappropriate. Detection willresult in the rejection of all submissions onthat research.
Manuscript preparation. Arrange thenote as a brief statement of research objec-tives, a short description of project design, anda succinct discussion of results. Relate resultsto the objectives. Do not include abstracts.Up to five references may be cited. Restrainacknowledgments. Limit each note to no morethan two pages of double-spaced typewrittentext (approximately 500 words).
INSTRUCTIONS TO CONTRIBUTORS
Each note may include up to two tablesand/or figures (graphs, illustrations, or pho-tos). Refer to all tables and figures in the text.Group tables and figures at the end of the note,each on a separate page. Tables and figuresmust have clear titles that adequately explaincontents.
Apply these rules, as appropriate, to allresearch notes:
Methodology• Include an internationally known
check or control treatment in all ex-periments.
• Report grain yield at 14% moisturecontent.
• Quantify survey data, such as infectionpercentage, degree of severity, and sam-pling base.
• When evaluating susceptibility, resis-tance, and tolerance, report the actualquantification of damage due to stress,which was used to assess level or inci-dence. Specify the measurements used.
• Provide the genetic background fornew varieties or breeding lines.
• Specify the rice production systems asirrigated, rainfed lowland, upland, andflood-prone (deepwater and tidal wet-lands).
• Indicate the type of rice culture (trans-planted, wet seeded, dry seeded).
Terminology• If local terms for seasons are used, de-
fine them by characteristic weather(dry season, wet season, monsoon) andby months.
• Use standard, internationally recog-nized terms to describe rice plant parts,growth stages, and management prac-tices. Do not use local names.
• Provide scientific names for diseases,insects, weeds, and crop plants. Do notuse local names alone.
• Do not use local monetary units. Ex-press all economic data in terms of theUS$, and include the exchange rateused.
• Use generic names, not trade names,for all chemicals.
• Use the International System of Unitsfor all measurements. For example, ex-press yield data in metric tons per hect-are (t ha-1) for field studies. Do not uselocal units of measure.
• When using acronyms or abbrevia-tions, write the name in full on firstmention, followed by the acronym orabbreviation in parentheses. Use theabbreviation thereafter.
• Define any nonstandard abbreviationor symbol used in tables or figures in afootnote, caption, or legend.
Mini reviewsMini reviews should address topics of currentinterest to a broad selection of rice research-ers, and highlight new developments that areshaping current work in the field. Authorsshould contact the appropriate editorial boardmember before submitting a mini review toverify that the subject is appropriate and thatno similar reviews are already in preparation.(A list of the editors and their areas of respon-sibility appears on the inside front cover ofeach IRRN issue.) Because only 1-2 mini re-views can be published per issue, IRRN willrequire high quality standards for manuscriptsaccepted for publication. The reviews shouldbe 2000-3000 words long, including refer-ences. Refer to the guidelines for research notesfor other aspects of writing and content.
Notes from the fieldNotes from the field should address impor-tant new observations or trends in rice-grow-ing areas, such as pest outbreaks or new pestintroductions, or the adoption or spread ofnew crop management practices. These ob-servations, while not the result of experiments,must be carefully described and documented.Notes should be approximately 250 words inlength. Refer to the guidelines for researchnotes for other aspects of writing and con-tent.
Review of manuscriptsThe IRRN managing editor will send an ac-knowledgment card or an email message whena note is received. An IRRI scientist, selectedby the editorial board, reviews each note. De-pending on the reviewer’s report, a note willbe accepted for publication, rejected, or re-turned to the author(s) for revision.
Submission of manuscriptsSubmit the original manuscript and a dupli-cate, each with a clear copy of all tables andfigures, to IRRN. Retain a copy of the noteand of all tables and figures.
Send manuscripts, correspondence, andcomments or suggestions about IRRN by mailor email to:
The IRRN Managing EditorIRRI, DAPO Box 7777Metro ManilaPhilippinesFax: +63 (2) 580-5699; 891-1174E-mail: [email protected]

What better way to celebrate the International Year of Rice (IYR) than to honor the people who work in rice research.Rice researchers work quietly in the fields and laboratories, conducting studies that they hope will make a difference in the lives of millions of rice producers and rice consumers all over the world. In its 28-year existence, the
International Rice Research Notes (IRRN) has been an active partner in bringing the fruits of their labor to the scientificcommunity. To commemorate 2004 as IYR, the Best Article Award is being established to recognize the contributions of riceresearchers from national agricultural research and extension systems (NARES) in developing countries toward the advance-ment of rice-related knowledge and technology.
Beginning in August 2003, papers submitted for publication in the IRRN will be evaluated on the basis of scientificcontent, originality, relevance, and organization. There will be up to six winning papers from the six sections of IRRN—plantbreeding (includes papers on molecular biology and biotechnology); genetic resources; pest science and management; soil,nutrient, and water management; crop management and physiology; and socioeconomics. The winners will be chosen by theIRRN Editorial Board and invited reviewers. The winning entries will be announced in the October 2004 issue of Rice Todayand will be published in the December 2004 issue of IRRN.
The competition is open to all NARES rice researchers. The Award will be given to the first author of each paper.Additional authors may come from any organization. Research for all categories must have been conducted in a developingcountry. Each winner will receive a $500 cash prize.
The deadline for submission is 31 July 2004.
For details, contact theIRRN Managing EditorIRRI, DAPO Box 7777
Metro Manila, PhilippinesFax: +63 (2) 580-5699; 891-1174
E-mail: [email protected]
Best Article Awards
International Year of Rice
Last year, the United Nations General Assembly declared 2004 as theInternational Year of Rice. The International Year of Rice aims to“promote the ecological, social, and cultural diversity of rice-based
production systems as a prism through which key global concerns can beaddressed, such as poverty and hunger alleviation, undernourishment, foodsafety, environmental protection, and other important issues.”
The Food and Agriculture Organization (FAO) of the UN will facilitate theimplementation of activities related to the celebration through a network ofstakeholders that include donors, a global working group, regional workinggroups, national working groups, and community working groups includingfarmers’ groups, nongovernment organizations, and the private sector.
The initiative for the celebration was spearheaded by a Philippine-ledresolution cosponsored by 43 member countries to promote awareness onsustainable development of this staple food for more than half of the world’spopulation. Through increased awareness of the rice system, food andagricultural policy and technical, economic, social, and development goals will bebetter focused by all stakeholders involved in the sustainability of food systems.
The International Year of Rice logo—Rice is life—aptly captures the essenceof this important staple food. The official launching of the event will be held onOctober 31 in New York.
As a member of the International Year of Rice Committee, IRRI is alreadyinitiating several projects that involve all rice sectors in the celebration, startingwith the IRRN Best Article Awards and the publication of Graindell, a children’sstorybook.
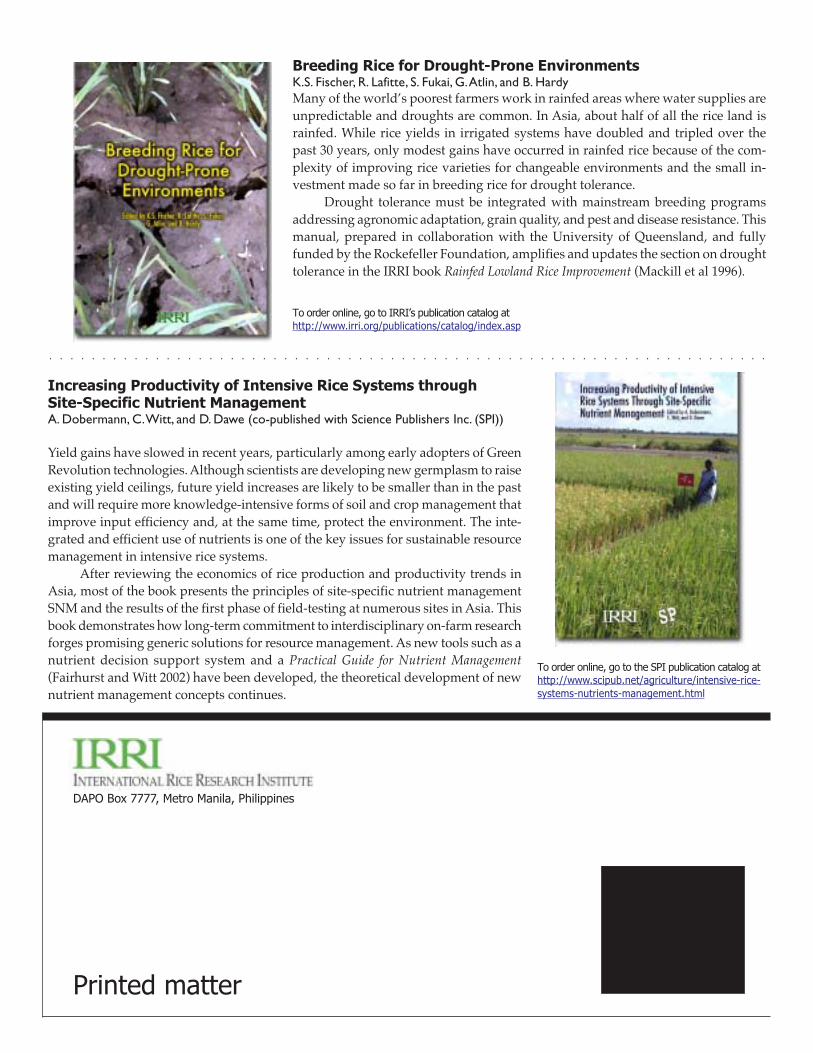
DAPO Box 7777, Metro Manila, Philippines
Printed matter
○ ○ ○ ○ ○ ○ ○ ○ ○ ○ ○ ○ ○ ○ ○ ○ ○ ○ ○ ○ ○ ○ ○ ○ ○ ○ ○ ○ ○ ○ ○ ○ ○ ○ ○ ○ ○ ○ ○ ○ ○ ○ ○ ○ ○ ○ ○ ○ ○ ○ ○ ○ ○ ○ ○ ○ ○ ○ ○ ○ ○ ○ ○ ○ ○ ○ ○ ○
Breeding Rice for Drought-Prone EnvironmentsK.S. Fischer, R. Lafitte, S. Fukai, G. Atlin, and B. HardyMany of the world’s poorest farmers work in rainfed areas where water supplies areunpredictable and droughts are common. In Asia, about half of all the rice land israinfed. While rice yields in irrigated systems have doubled and tripled over thepast 30 years, only modest gains have occurred in rainfed rice because of the com-plexity of improving rice varieties for changeable environments and the small in-vestment made so far in breeding rice for drought tolerance.
Drought tolerance must be integrated with mainstream breeding programsaddressing agronomic adaptation, grain quality, and pest and disease resistance. Thismanual, prepared in collaboration with the University of Queensland, and fullyfunded by the Rockefeller Foundation, amplifies and updates the section on droughttolerance in the IRRI book Rainfed Lowland Rice Improvement (Mackill et al 1996).
Increasing Productivity of Intensive Rice Systems throughSite-Specific Nutrient ManagementA. Dobermann, C. Witt, and D. Dawe (co-published with Science Publishers Inc. (SPI))
Yield gains have slowed in recent years, particularly among early adopters of GreenRevolution technologies. Although scientists are developing new germplasm to raiseexisting yield ceilings, future yield increases are likely to be smaller than in the pastand will require more knowledge-intensive forms of soil and crop management thatimprove input efficiency and, at the same time, protect the environment. The inte-grated and efficient use of nutrients is one of the key issues for sustainable resourcemanagement in intensive rice systems.
After reviewing the economics of rice production and productivity trends inAsia, most of the book presents the principles of site-specific nutrient managementSNM and the results of the first phase of field-testing at numerous sites in Asia. Thisbook demonstrates how long-term commitment to interdisciplinary on-farm researchforges promising generic solutions for resource management. As new tools such as anutrient decision support system and a Practical Guide for Nutrient Management(Fairhurst and Witt 2002) have been developed, the theoretical development of newnutrient management concepts continues.
To order online, go to IRRI’s publication catalog at
http://www.irri.org/publications/catalog/index.asp
To order online, go to the SPI publication catalog at
http://www.scipub.net/agriculture/intensive-rice-
systems-nutrients-management.html


![Joseph and Akhenaten: The Case for Reinterpreting Amarnas3.amazonaws.com/zanran_storage/mysite.verizon.net/ContentPages/... · [2] “blessing” which granted them “the breath](https://img.dokumen.tips/doc/110x75/5a9e1a097f8b9ad2298d49d0/joseph-and-akhenaten-the-case-for-reinterpreting-2-blessing-which-granted.jpg)


