Embed Size (px)
Citation preview

High Throughput Modules for Performance and Mechanism Assessment of Flame Retardants in
Polymeric Materials Vorgelegt von
Dipl.-Chem.
Sebastian Rabe
geb. in Berlin
Von der Fakultät II – Mathematik und Naturwissenschaften
der Technischen Universität Berlin
zur Erlangung des akademischen Grades
Doktor der Naturwissenschaften
- Dr. rer. nat. -
genehmigte Dissertation
Promotionsausschuss:
Vorsitzende: Prof. Dr. rer. nat. Karola Rück-Braun, TU Berlin
Gutachter: Priv.-Doz. Dr. rer. nat. habil. Bernhard Schartel, FU Berlin
Gutachter: Prof. Dr. rer. nat. Reinhard Schomäcker, TU Berlin
Tag der wissenschaftlichen Aussprache: 12.10.2017
Berlin 2017

ii

iii
Danksagung
Mein Dank gilt in erster Linie Herrn PD Dr. Bernhard Schartel und Herrn Prof. Dr. Reinhard
Schomäcker für die Betreuung und Begutachtung der vorliegenden Arbeit. Insbesondere Herrn
Schartel als meinem Vorgesetzten während meiner Zeit an der BAM danke ich für die
hilfreichen und konstruktiven Diskussionen und Kritiken, die immer zielführend und
ergebnisorientiert waren.
Ich danke meinen ehemaligen und derzeitigen Kollegen der Flammschutzgruppe des
Fachbereichs 7.5 an der BAM: Dr. Kirsten Langfeld, Dr. Antje Wilke, Dr. Marie-Claire
Despinasse, Dr. Karoline Täuber, Dr. Bettina Dittrich, Dr. Patrick Müller, Dr. Huajie Yin, Dr.
Nora Konnertz, Dr. Daniele Frasca, Andreas Hörold, Michael Morys, Sebastian Timme, Tim
Rappsilber, Lars-Henrik Dauß, Patrick Klack, Alexander Battig, Melissa Matzen, Benjamin
Zirnstein, Weronika Tabaka, Martin Günther, Yuttapong Chuenban, Analice Turski-Silva Diniz
und alle, die ich hier vergessen habe oder mit denen ich nur für eine kurze Zeit
zusammengearbeitet habe. Sie haben mir gezeigt, dass Kollegen auch zu Freunden werden
können.
Danke auch an die Werkstatt der 7.5, insbesondere Michael Schneider und Tobias Kukofka, die
mir bei allen handwerklichen Arbeiten tatkräftig beiseite standen und meine Vorstellungen
immer zu meiner Zufriedenheit erfüllt haben.
Ein besonderer Dank gilt meiner Familie, Stefanie und allen, die mich mental unterstützt und
immer an mich geglaubt haben.
Dr. Aleksandra Sut danke ich für die emotionale Unterstützung und die endlose Geduld bei all
meinen Vorhaben.

iv
Index of abbreviations
AlPi Aluminium diethyl phosphinate
APP Ammonium polyphosphate
BDP Bisphenol A bis(diphenyl phosphate)
EHC Effective heat of combustion
EP Epoxy resin
FAA Federal Aviation Administration
FIGRA Fire growth rate index
FPI Fire performance index
FTIR Fourier-transform infrared
HRR Heat release rate
LOI Limiting oxygen index
MARHE Maximum average rate of heat emission
MCC Microscale combustion calorimeter
MDH Magnesium hydroxide
NIST National Institute of Standards and Technology
PA Polyamide
PCABS Polycarbonate Acrylonitrile-butadiene-nitrile
PCFC Pyrolysis combustion flow calorimeter
PEEK Poly ether ether ketone
PER Pentaerythritol
PHRR Peak heat release rate
PMMA Polymethyl methacrylate
PP Polypropylene
PS Polystyrene
PTFE Polytetrafluoroethylene
RP Red phosphorus

v
TGA Thermogravimetric analysis
THE Total heat evolved
THR Total heat released
TPES Styrene-based thermoplastic elastomer
UL Underwriters Laboratories

vi
Table of Contents
Danksagung ............................................................................................................................................ iii
Index of abbreviations ............................................................................................................................ iv
Table of Contents ................................................................................................................................... vi
1 Background and Motivation ................................................................................................................. 1
1.1 Flame retardancy of polymeric materials ...................................................................................... 1
1.2 Motivation ..................................................................................................................................... 5
1.3 High throughput in flame retardancy ............................................................................................ 7
1.4 Materials ........................................................................................................................................ 9
1.5 Methods ....................................................................................................................................... 10
1.5.1 Pyrolysis – Thermogravimetry coupled with infrared spectroscopy .................................... 10
1.5.2 Pyrolysis combustion flow calorimeter ................................................................................ 11
1.5.3 Flammability – limiting oxygen index (LOI) ....................................................................... 11
1.5.4 Cone calorimeter .................................................................................................................. 12
1.5.5 Rapid mass calorimeter ........................................................................................................ 14
2 Concluding discussion ........................................................................................................................ 17
2.1 Part I: screening for performance of flame retardants ................................................................. 17
2.1.1 Size reduction experiments ................................................................................................... 17
2.1.2 Correlation with other fire tests ............................................................................................ 19
2.1.3 In-detail analysis of heat release rate in the rapid mass calorimeter .................................... 22
2.2 Part II: screening for modes of action of flame retardants .......................................................... 25
2.2.1 Dependency of flame retardant mode of action on polymeric matrix .................................. 25
2.2.2 Dependency of flame retardant mode of action on phosphorus species ............................... 27
2.2.3 Dependency of flame retardant mode of action on phosphorus content............................... 28
3 Publications ........................................................................................................................................ 32
3.1 The rapid mass calorimeter: A route to high throughput fire testing .......................................... 32
3.2 The rapid mass calorimeter: Understanding reduced-scale fire test results ................................ 48
3.3 Exploring the Modes of Action of Phosphorus-Based Flame Retardants in Polymeric Systems 60
Summary ............................................................................................................................................... 85
Zusammenfassung ................................................................................................................................. 87
References ............................................................................................................................................. 89
Index of figures ..................................................................................................................................... 92
List of publications, presentations and posters ...................................................................................... 93

vii

1.1 Flame retardancy of polymeric materials
1
1 Background and Motivation
1.1 Flame retardancy of polymeric materials
Nowadays polymeric materials are an indispensable part of our daily lives. Their relatively low
cost and high processability are reason for their ever-growing use. Unfortunately, a lot of
polymers are highly flammable and have increased fire risk. Especially items of first ignition,
like electronic casings or upholstery, need to be made resistant to flame and high temperatures.
In the past, flame retardancy was achieved by addition of halogenated flame retardants. Those
mostly brominated additives, however, were found to be hazardous to health and environment,
thus increasing the demand for non-halogenated flame retardants [ 1, 2].
Phosphorus containing compounds were found to be promising alternatives to halogenated
flame retardants. Phosphinates, phosphonates, and phosphates among others are used to achieve
excellent flame retardancy performance in several polymeric materials and are easily mixed
with the polymer matrix [ 3, 4, 5, 6]. However, they may alter the mechanical and other
properties when the concentration is too high. A balance must be made between maximum
flame retardant load, to achieve the desired flame retardancy performance, and the minimum
concentration, at which the other important properties of the polymeric material are not altered
significantly. An auspicious approach towards reducing the amount of additive is the use of
multicomponent systems, in which the interactions between the additive components show
synergistic effects and the total additive load can be lowered [ 7, 8, 9].
Flame retardants can work via different modes of action. They can work in the gas phase as
well as in the condensed phase of a burning material via chemical and physical mechanisms,
respectively. However, the processes occurring during the burning of a polymeric material need
to be known first. They are displayed in Figure 1.

1.1 Flame retardancy of polymeric materials
2
Figure 1. Schematic of processes occurring during burning of a polymeric material
After ignition of the material, the surface is pyrolyzed under predominantly anaerobic
conditions. Volatile pyrolysis products are released into the gas phase and the combustible gases
are oxidized, creating the flame. This leads to increased heating of the polymer surface, stronger
pyrolysis and increased release of combustible gases. When all material is consumed, the flame
extinguishes. This cycle can be overcome by influencing certain key features. Fuel release can
be hindered by increasing the amount of produced char, radical scavengers can interfere with
oxidation reactions in the gas phase and cooling effects like endothermic reactions, and flame
dilution due to water release or the buildup of an intumescent heat barrier can reduce heat
transfer to the pyrolysis zone. The rate at which heat is released during steady burning is defined
as the product of the combustion efficiency , the ratio of effective heat of combustion of the
fuel gases and the required heat for gasification , the mass fraction of released fuel
and the received effective heat flux according to equation (I) [ 10]. The effective heat flux
is the sum of reradiated heat flux , heat flux from an external source , heat flux from
the flame , and loss of heat via conduction .

1.1 Flame retardancy of polymeric materials
3
(I)
The mode of action of a flame retardant is dependant of several factors. Besides the chemical
structure of the flame retardant itself, its interaction during pyrolysis with the chemical
environment plays a great role on the mechanisms by which a flame retardant is working [ 11,
12]. The addition of synergists and other adjuvants can influence the way a flame retardant
works and can be used to optimize its efficiency by changing emphasis to a desired mode of
action [ 8, 13].
Figure 2. Chemical structures of aluminium diethyl phosphinate (1), bisphenol A-bis(diphenyl phosphate) (2) and ammonium polyphosphate (3).
Common phosphorus based flame retardants are displayed in Figure 2. Aluminium diethyl
phosphinate (AlPi, 1) is an aluminium salt of the diethylphosphinic acid, which shows excellent
flame retarding properties especially in the gaseous phase by reacting with OH and H radicals
and thus slowing down oxidation reactions, leading to incomplete combustion and reduction of
the combustion efficiency. A flame retardant which looks like an optimal precursor for a
charring flame retardancy effect is bisphenol A- bis(diphenyl phosphate) (BDP, 2). It acts as an
acid precursor, and undergoes esterification and dehydration in the condensed phase.
Nonetheless, phosphate esters are also able to act in the gas phase via flame inhibition if their
volatility is high enough and they are released during burning. Ammonium polyphosphate
(APP, 3) is a great example of a flame retardant with predominant action in the condensed phase
due to the formation of an intumescent protective layer. The pyrolyzing and melting material is
esterified by produced acid, and released gases act as a blowing agent to form a foam-like
structure, which hinders fuel and heat transport [ 14, 15, 16]. Past and present research still

1.1 Flame retardancy of polymeric materials
4
focuses on the development of novel phosphorus-based flame retardants such as hyperbranched
polyphosphates [ 17, 18].
Flame retardants are supposed to reduce the fire risk and the fire hazard of the items which are
the first items of ignition and the origin of a fully developed room fire. That means if ignition
of such items, for example a TV housing, cannot be prevented in the first place, the goal is to
restrain fire growth in the early phase. Figure 3 shows the typical steps in the formation of a
room fire. After the ignition of an item in the room, the fire initially grows slowly and hot
pyrolysis gases accumulate underneath the ceiling. The increasing temperature leads to stronger
irradiation on all objects in the room and eventually to ignition of all flammable material, the
so-called flashover. This indicates the transition from a developing fire to a fully developed
fire. When all fuel is consumed, the fire will decay slowly.
Figure 3. Temperature profile of a room fire.
The single steps of the fire formation can be divided by different length scales involved and by
properties of the material. Ignition takes place in the range of centimeters and flammability
(reaction to an ignition source) as well as the ability to self-extinguish are important for a
material. The developing fire is defined by a length scale of decimeters to meters. Resulting
irradiance ranges from 20 to 60 kW/m² and heat release rate as well as flame spread are crucial
to describe the further fire behavior of a material. When the fire is considered fully developed,
the focus is on the fire resistance of an item in the length scale of several meters [ 19]. Different
test methods simulating the described conditions exist for all of these steps in the development

1.2 Motivation
5
of a room fire. For the development of novel flame retardants or combinations of flame
retardants, flammability as well as the investigation of burning behavior under forced flaming
conditions in lab scale are the most important characteristics. The flammability test UL 94
(Underwriters Laboratories 94) allows for classification of a material depending on its reaction
to a small flame; the LOI (limiting oxygen index) is used to investigate the minimal oxygen
concentration needed to have a sustained flame. For the assessment of heat release rate and
burning behavior under irradiation, the cone calorimeter is one of the most widely used
methods.
1.2 Motivation
Nowadays, polymeric materials are combined with a variety of additives to increase their
mechanical and other properties. Besides flame retardants, a range of fillers, adjuvants,
plasticizers, stabilizers, antioxidants, and so on, lead to a large library of potential formulations.
Additionally, the concentration, particle size distribution, morphology, and all kinds of
modification of the components can be varied to achieve optimal performance in all respects.
All of the above-mentioned variations possibly change the burning behavior of the system, thus
generating a vast matrix of materials which ought to be screened for the best performing
formulation in terms of flame retardancy. Until now, this task was tackled either with very time
and material consuming methods or was accompanied by loss of information in the results.
There is a strong need for methods which combine a fast and material saving approach with
reliability while retaining significance and detail in the results. It is possible to apply such high
throughput methods at different stages in material development. Possible application areas lie
in both basic research of new flame retardants for understanding their mechanisms in different
polymer matrices, and in performance screening of developed flame retardants in
multicomponent polymeric systems. Therefore, two main scientific goals of this work were set
and addressed:

1.2 Motivation
6
1. For the performance screening of multicomponent flame retarded systems a new
method was developed. The research on the significance of the obtained results and
comparison with established fire testing methods was a crucial point in the presented
work.
2. In order to screen and quantify the mode of action of phosphorus-based flame
retardants in relation to phosphorus content and species, as well as their reaction to
different polymer matrices, a new approach was elaborated and established.
The first part of this work was developing the rapid mass calorimeter and evaluating the results
produced with this method. The use of specimens reduced in size is crucial for the significant
time and material saving this work aims at. Research on the effect of reduced specimen size on
the burning behavior and the validity of the results is the challenge for this part of the work. For
this, a large database of various flame retarded as well as non-flame retarded materials was
created, which is the foundation for the scientific discussion and comparison with the already
established methods. It enables an evaluation of the flame retardancy performance on a wider
range and does not only focus on specific sample series with a limited scope. In addition,
investigations of specific series of samples reveal detailed coherences between sample size
reduction and achieved results and allows for ranking the rapid mass calorimeter in terms of
significance compared to the state of the art.
The rapid assessment of the modes of action of phosphorus-based flame retardants is covered
in the second part of this work. In this approach, a systematic variation of phosphorus species,
polymeric matrix, and flame retardant additive concentration is the key to a sufficient
understanding of the occurring phenomena. The use of easily-preparable resins as polymeric
matrices ought to reduce the effort needed for sample preparation. Quantification of the modes
of action contributing to the overall fire performance of a formulation allows for easier
comparison of the flame retardant-polymer-systems and faster evaluation of the prevalent mode
of action.

1.3 High throughput in flame retardancy
7
1.3 High throughput in flame retardancy
In the last two decades there have been several approaches towards establishing high throughput
techniques in fire testing. The microscale combustion calorimeter (MCC), also known as the
pyrolysis combustion flow calorimeter (PCFC), was developed by the Federal Aviation
Administration (FAA) in 2002 as a tool for rapid heat release rate screening of milligram-scale
specimens [ 20, 21, 22, 23]. While the PCFC is commercially available and successful, its
results lack the informative value that results from cone calorimeter measurements contain.
Flame inhibiting effects cannot be detected using the PCFC because of the absence of a real
flame, and the use of milligram-scale samples impedes statements about macroscopic effects
like intumescence, dripping, wicking, or the formation of a protective layer [ 24, 25]. Published
in 2006, the National Institute of Standards and Technology (NIST) as well as the Marquette
University worked on a research project dealing with novel approaches for high throughput
techniques for the evaluation of fire retardancy [ 26, 27]. A device for rapid assessment of
burning time as a means for fire retardancy effectiveness was described and the coherences of
burning time and total heat release were investigated. High throughput flammability
characterization was examined with the use of a gradient heat flux, enabling determination of
the minimal heat flux needed for sustaining flame spread. A schematic of this process is
displayed in Figure 4.
Figure 4. Schematic of the flammability assessment using a heat flux gradient. [ 26]
The most promising approach towards high throughput fire testing was the development of the
rapid cone calorimeter. Here, a cone calorimeter was equipped with a conveyor belt in order to
provide a continuous sample supply as opposed to the separate measurement of each specimen

1.3 High throughput in flame retardancy
8
in the standard cone calorimeter test. The use of smaller samples also contributes to the
acceleration of measurements. A first test series on six flame retarded polystyrene specimens
showed that a screening for the best performing formulation in terms of heat release rate could
be achieved in under 20 minutes of measurement time. The heat release rate results as well as
a schematic of the rapid cone calorimeter are presented in Figure 5. Unfortunately, further
research on the rapid cone calorimeter, despite its interesting potential, was halted after only
two sample series.
Figure 5. Schematic of the continuous sample supply in the rapid cone calorimeter (a) and heat release rate of a sample series of flame retarded polystyrene specimen (b, PS: polystyrene, APP: ammonium polyphosphate, PER: pentaerythritol, 15A:
Cloisite 15A ammonium montmorillonite). [ 26]
The nature of a high throughput method is the fast and automated analysis and the parallel
execution of process steps. The reduction of sample size plays an important role in all high
throughput methods. However, since burning behavior is not able to be accelerated without
changing the fire scenario, a loss of information and correlation in comparison to the cone

1.4 Materials
9
calorimeter test is to be expected. An automatization of the method and the parallelization of
individual work steps is hardly possible due to safety regulations and the importance of the user
during test procedure. Therefore, a balance must be found in those key factors for developing
high throughput methods to achieve a considerable test acceleration while maintaining a
relatively high grade of significance in the results.
1.4 Materials
In order to create a statistical approach towards reliability and repeatability of the results
obtained with the rapid mass calorimeter, 71 different materials were investigated, which covers
different material classes and flame retarded materials. Size reduction experiments in the rapid
mass calorimeter were conducted on non-flame retarded polymers, namely poly(methyl
methacrylate) (PMMA), polypropylene (PP), polyamide 6 (PA6), polyether ether ketone
(PEEK), and pine sapwood (WOOD). They were chosen to represent different burning
behaviors. The high-performance polymer PEEK, for example, has excellent thermal and
mechanical properties. It is intrinsically flame retarded due to a strong charring effect caused
by crosslinking reactions of the aromatic backbone structure. Around 70 % of char residue is
left in a real fire scenario. Thanks to this, it was possible to make a statement about the size
reduction effects on only slightly burning specimens.
The major part of measured materials consisted of halogen-free flame retarded polymeric
materials. Flame retardants which work by means of flame inhibition, charring, intumescence,
flame dilution, cooling, or additive and synergistic effects of multicomponent systems, were
used in several polymeric matrices and at different concentrations. Furthermore, the thicknesses
of the specimens were varied, which plays an important role in burning behavior. Of these 71
materials, some were chosen for detailed research based on their typical heat release rate curve
in cone calorimeter measurements. Polyamide 6.6 (PA66) as well as polyamide 12 (PA12)
reinforced with 30 wt% glass fiber were chosen as examples for inert filler effects. A typical

1.5 Methods
10
heat release rate curve for a flame inhibition effect was observed for a styrene-based
thermoplastic elastomer (TPES) containing 30 wt% of AlPi. The effect of a protection layer on
the heat release rate curve was investigated on different loads of exposed or encapsulated APP
in PP. Magnesium hydroxide (MDH) was used in TPES as well as in PP to analyze the resulting
heat release curves, and BDP and PTFE in polycarbonate/acrylonitrile butadiene styrene blend
(PCABS) revealed heat release rate curves which showed combinations of charring and flame
inhibiting effects.
To screen and investigate the modes of action of phosphorus-based flame retardants in a high
throughput manner, four different model systems were chosen. Bisphenol A diglycidyl ether
with isophorone diamine as a curing agent was chosen to represent the group of epoxy resins,
whereas a PMMA resin and the polyester resin L800 cover the ranges of acrylate and polyester
polymers. Polyolefins are represented by the use of paraffin as a matrix for the flame retardants.
The phosphorus-based flame retardants BDP, red phosphorus (RP), as well as AlPi in two
different particle size distributions were selected and incorporated in the model systems. While
BDP has a phosphorus content of around 8.9 wt%, AlPi contains about 23.5 wt% of phosphorus.
Red phosphorus has the highest phosphorus content with around 99 wt%. This way, a
systematic sample series was created, in which the mode of action of the respective flame
retardant was investigated in terms of phosphorus species, phosphorus content, particle size
distribution, and polymeric matrix.
1.5 Methods
1.5.1 Pyrolysis – Thermogravimetry coupled with infrared spectroscopy
When a material is heated to a certain temperature, thermal decomposition, also known as
pyrolysis, takes place. The pyrolysis happening during burning of a material with a stable flame
is usually considered anaerobic. Several processes take place during thermal decomposition,
such as elimination, chain scission, depolymerization, or cross-linking, which lead to volatile
1.5 Methods
11
as well as non-volatile compounds. The mass of non-volatile remains is investigated via
thermogravimetric analysis and the nature of products released into the gas phase is detected
using infrared spectroscopy. Thanks to the coupling of both methods, it is possible to assign
certain gas phase species to significant steps in the mass loss rate during the pyrolysis [ 28, 29].
1.5.2 Pyrolysis combustion flow calorimeter
To evaluate the heat release of the combustible volatiles released during pyrolysis, the pyrolysis
combustion flow calorimeter is used. The principle of the pyrolysis is the same as in the TGA,
but all resulting gases are then introduced into a nitrogen/oxygen gas flow combination with a
ratio of 80/20. The gas mixture is led into a combustion chamber, where it is combusted at 900
°C. The released heat, as well as the rate and temperature at which the heat was released, are
then calculated by how much oxygen was consumed. Similar to the TGA, the PCFC only uses
around 5 mg of a sample for a measurement [ 30, 20].
1.5.3 Flammability – limiting oxygen index (LOI)
The limiting oxygen index test is a vertical flammability test carried out on specimens with a
size of 8 by 1 centimeters and a thickness of 4 millimeters in a gas flow mixture of oxygen and
nitrogen flowing upwards through a chimney. The sample is ignited on the top and time and
length of burning are recorded. A schematic of the LOI test is provided with Figure 6. The test
is performed with varying oxygen concentrations, allowing assessment of the minimum oxygen
concentration needed for a sustained flame. Sustained burning in this test is defined as longer
than 3 minutes after removal of the ignition flame or advancing of the flame front for more than
5 centimeters downwards [ 31]. However, it should be noted, that the oxygen index is not a
material property, since it is heavily dependent on parameters like the specimen thickness. Thus,
it describes a tendency for self-extinguishment under those specific conditions.

1.5 Methods
12
Figure 6. Schematic of the limiting oxygen index flammability test setup. [ 31]
1.5.4 Cone calorimeter
The most used bench-scale method for the evaluation of heat release rate is the cone calorimeter.
As mentioned before, it is mainly simulating the conditions of a developing fire, thus the
commonly used specimen size of 10 by 10 centimeters with a thickness of up to 1 centimeter.
The sample is irradiated by a heating cone, which can generate heat fluxes up to 100 kW/m².
Depending on the intumescence potential of the investigated specimen, the distance from
sample to heating coil can be adjusted, however, irradiation was shown to be most regular at
distances ranging from 25 to 35 millimeters. Sufficient irradiation leads to accumulation of
volatile combustible gases across the surface of the sample. If the critical concentration and
temperature is reached, the gases are ignited by the spark igniter. During the measurement,
sample mass is constantly recorded by a load cell, smoke evolution is monitored by a laser,
times needed to ignition and flameout are recorded with the press of a button, and CO, CO2,
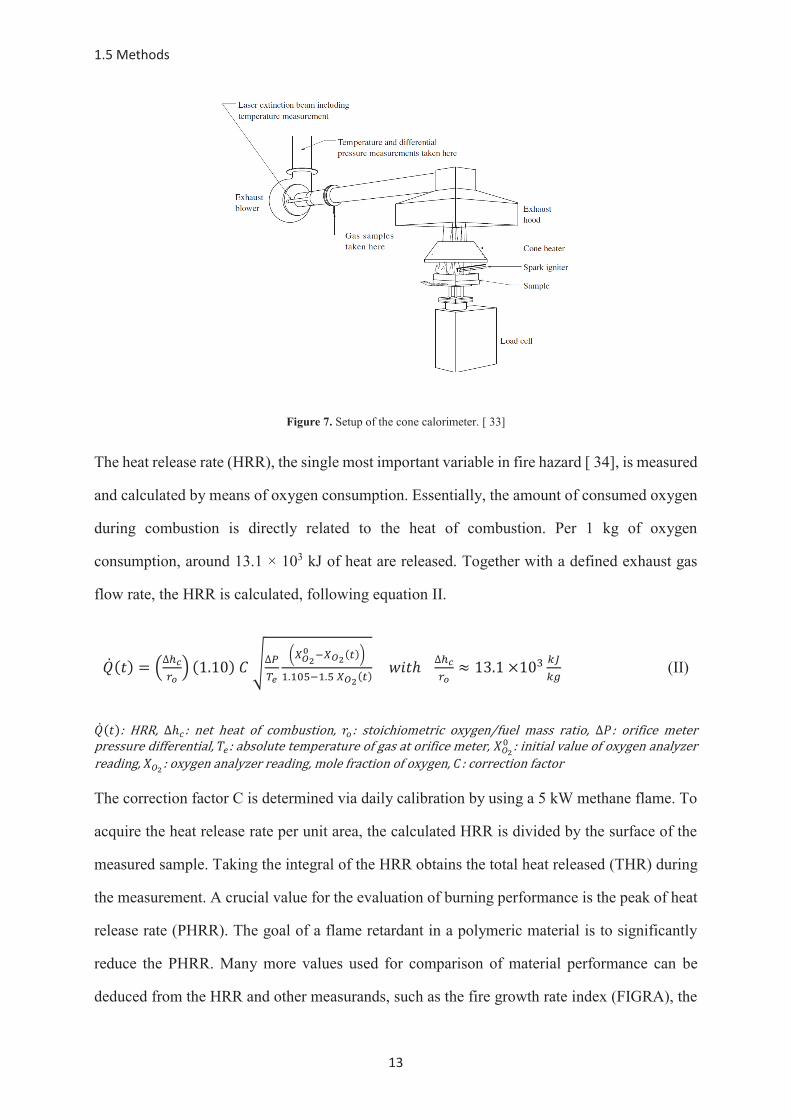
and O2 concentrations are analyzed by the respective gas cells. Figure 7 shows a schematic of
the cone calorimeter setup [ 32, 33, 19].
1.5 Methods
13
Figure 7. Setup of the cone calorimeter. [ 33]
The heat release rate (HRR), the single most important variable in fire hazard [ 34], is measured
and calculated by means of oxygen consumption. Essentially, the amount of consumed oxygen
during combustion is directly related to the heat of combustion. Per 1 kg of oxygen
consumption, around 13.1 × 10³ kJ of heat are released. Together with a defined exhaust gas
flow rate, the HRR is calculated, following equation II.
(II)
The correction factor C is determined via daily calibration by using a 5 kW methane flame. To
acquire the heat release rate per unit area, the calculated HRR is divided by the surface of the
measured sample. Taking the integral of the HRR obtains the total heat released (THR) during
the measurement. A crucial value for the evaluation of burning performance is the peak of heat
release rate (PHRR). The goal of a flame retardant in a polymeric material is to significantly
reduce the PHRR. Many more values used for comparison of material performance can be
deduced from the HRR and other measurands, such as the fire growth rate index (FIGRA), the

1.5 Methods
14
maximum average rate of heat emission (MARHE), the average heat release rate from time to
ignition to time of flameout (HRRavg), the fire performance index (FPI), and the PHRR divided
by time to ignition (PHRR/tig) as a fire growth index.
1.5.5 Rapid mass calorimeter
The rapid mass calorimeter is based on a standard mass loss calorimeter with attached
thermopile chimney for heat release rate measurement [ 35]. Contrary to the cone calorimeter,
heat release rate is measured by means of a voltage change in the circularly arranged
thermoelements. This thermopile is calibrated prior to the measurement by using a methane
flame according to ISO 13927 [ 36]. The balance, which is normally used in the mass loss
calorimeter, was replaced by a linear motion unit, on which a mount for two sample holders
was constructed. This enabled for exchange of the burned sample with a new one during the
measurement of the specimen on the second sample holder. Both sample holders were located
at a distance of 250 mm edge to edge. Figure 8 shows a picture of the setup of the rapid mass
calorimeter.

1.5 Methods
15
Figure 8. Setup of the rapid mass calorimeter.
The basic principle, i.e. heating up of the sample by a conical heater and ignition of the pyrolysis
gases with a spark igniter, is the same as in the cone calorimeter. However, the measurements
in the rapid mass calorimeter were performed in continuous tests, as opposed to the cone
calorimeter, in which for each sample a new test is conducted. The linear motion unit was
programmed to execute a simple loop motion, in which the wait time in between movements
equals the dwell time of the specimen under the cone heater. Prior to the test, a dwell time of
80 seconds for an empty sample holder was chosen in order to allow the software to collect
baseline data. After this duration, the linear motion unit changes the sample holder to provide
the first specimen. The dwell time for samples to be measured depends on their burning times
and the time the thermopile needs to relapse back to baseline. The dwell time must be chosen

1.5 Methods
16
in a way that a complete burning of the sample and a subsequent baseline collection is ensured.
Concurrently, the dwell time should be chosen to result in optimal time saving.

2.1 Part I: screening for performance of flame retardants
17
2 Concluding discussion
2.1 Part I: screening for performance of flame retardants
2.1.1 Size reduction experiments
High throughput methods are often accompanied by a reduction in sample amount. In the rapid
mass calorimeter, this was accomplished by reducing the standard cone calorimeter plates from
10 by 10 centimeters to two by two centimeters while maintaining the thickness of the
specimens. To investigate the effects in heat release rate that accompany a size reduction, square
specimens with edge lengths of 10, 7.5, 5, 2.5, 2 and 1 centimeters were measured in the rapid
mass calorimeter. It was found, that with decreasing specimen size, the tendency for an edge
burning effect, the horizontal spread of the flame over the edges of the specimen, increased.
This was a problem insofar as the heat release rate is measured as a surface dependent value;
its unit is kW/m². That means that when the thermocouples, which measure the heat release
rate, receive a heat impact greater than the actual sample size, the surface dependent value is
flawed. With decreasing sample size, the heat release rate values become unrealistically high
due to the increasing ratio of sample surface area and horizontal flame spread area. Therefore,
it was decided to eliminate the surface dependency by using absolute heat release rate values.
Figure 9. Surface-dependent (A) and surface-independent (B) heat release rates (HRR) for squared poly(ether ether ketone) (PEEK) specimens with varying edge lengths.

2.1 Part I: screening for performance of flame retardants
18
For investigation of size reduction effects on heat release rate, five different polymers were
chosen, which all have differences in burning behavior and intensity. PP burns with a high
PHRR while PMMA shows a steadier burning. PA66 develops a passivation layer prior to
ignition but burns moderately strong. PEEK is a high-performance polymer which is
intrinsically flame retarded via a strong charring mechanism and WOOD shows a low heat
release rate while producing a fair amount of char residue. For all tested polymers, it was
observed that the form of the heat release rate curve changed to a less characteristic peak with
decreasing sample size. A standard sized peak sample, for example, showed a plateau of steady
burning which lasted for around 200 seconds (Figure 9). Already with a sample the size of 7.5
times 7.5 centimeters the plateau transformed into a slope with steadily increasing heat release
rate up to the PHRR due to an already appearing edge burning effect. For even smaller samples,
the heat release rate took peak shape. As an example, for size reduction effects occurring in a
flame retarded polymeric system, a blend of APP in PP, an intumescent system, was chosen.
Standard sized specimens show interesting characteristics in the heat release rate curve shape,
from which the burning behavior can be deduced. First, the HRR rises to an initial peak, after
which it rapidly decreases and shows a steady burning plateau. This is due to the formation of
a protective layer, which acts as a heat barrier and hinders the pyrolysis gases from feeding the
flame. Eventually, the protective layer cracks and its effectiveness decreases. The HRR rises
again, until the PHRR is reached and the flameout occurs. When the sample size is decreased
to an edge length of 7.5 cm, these characteristics begin to merge into one peak. The former
initial peak, which is now only a shoulder followed by a small plateau, is still recognizable
although the difference between shoulder and PHRR becomes significantly less. Decreasing the
sample size further to an edge length of 5 cm, the shoulder is now only detectable as a remnant.
Based on this finding it was hypothesized that HRR curves of smaller samples depict an average
over the entire HRR curve of the standard sized sample, combining characteristics into a peak-
shaped HRR curve. This hypothesis was checked by investigating correlations of cone
calorimeter results with results from size-reduced samples measured in the cone calorimeter.
The results of the correlation investigations are summarized in section 3.1.2. On first glance,

2.1 Part I: screening for performance of flame retardants
19
the characteristics of a HRR curve are lost when decreasing the sample size even more.
However, in comparing studies with cone calorimeter results it was found that it is still possible
to interpret burning behavior based on HRR curves obtained from samples with an edge length
of only two centimeters. This is summarized in section 3.1.3 and shows that the rapid mass
calorimeter is a valuable tool for the rapid assessment of the behavior of polymeric material
specimens under forced flaming conditions.
2.1.2 Correlation with other fire tests
The results which were obtained with the rapid mass calorimeter were compared with cone
calorimeter results. For this, the most important values of heat release rate measurements, like
PHRR, THE, FIGRA, MARHE, etc., were correlated with each other in several ways. On the
one hand, these indices were checked for correlation within one method, the rapid mass
calorimeter, and the resulting correlation coefficients were then compared with those obtained
from the other method, the cone calorimeter. For example, a correlation between the PHRR and
the FIGRA of the rapid mass calorimeter resulted in a strong correlation coefficient of 0.92
(Figure 10) whereas the same values in the cone calorimeter showed a coefficient of 0.82. This
is one example of a correlation which is more pronounced in the rapid mass calorimeter. This
strong correlation is explained by the fact that for peak-shaped curves with a defined width, the
slope of the peak is proportional to the peak height. Since cone calorimeter HRR curves exhibit
more characteristics than just a peak, this correlation is weaker. In general, all the values which
correlate strongly in the established cone calorimeter also show strong correlation in the rapid
mass calorimeter. This proves that both tests are related to each other.

2.1 Part I: screening for performance of flame retardants
20
Figure 10. Correlation between rapid mass calorimeter fire growth rate index (FIGRA) and peak heat release rate (PHRR) for all specimens (A) and for specific sample series (B).
Another way of investigating the correlation of results between the rapid mass calorimeter and
the cone calorimeter is the direct correlation between both methods. PHRR, THE, FIGRA and
other indices from the rapid mass calorimeter were checked for their correlation coefficients
with the same values obtained from cone calorimeter measurements. It was revealed, that
mainly the averaging parameters, like MARHE or HRRavg, showed moderate to strong
correlation. This supports the thesis, that HRR measurements on samples with reduced size tend
to depict an average over all characteristics of a HRR curve of a standard-sized sample. Figure
11 displays the correlation between PHRR from rapid mass calorimeter measurements and the
MARHE results from the cone calorimeter. Additionally, it was found out that besides the
PHRR of both methods, the FIGRA from the rapid mass calorimeter and the PHRR from the
cone calorimeter exhibited strong correlation coefficients with each other.
In conclusion, the rapid mass calorimeter was shown to exhibit equivalently good results as the
cone calorimeter when focusing on the properties with the strongest correlation coefficients,
namely PHRR, FIGRA, and MARHE. Considering the drastically reduced sample size to two
by two centimeters and the strong dependency of burning behavior on the length scale of the
specimen, the achieved results are very valuable and promising for future applications.

2.1 Part I: screening for performance of flame retardants
21
Figure 11. Correlation between PHRR of the rapid mass calorimeter and maximum average rate of heat emission (MARHE) of the cone calorimeter for specific sample series.
Results from the limiting oxygen index test were also correlated to rapid mass calorimeter as
well as cone calorimeter results. Due to lack of material or results from previous works, oxygen
index measurements were not existing for all 71 materials. However, for the tested materials, a
strong non-linear correlation was found between the oxygen index and the PHRR of the cone
calorimeter. Despite several deviant findings in literature concerning correlations between LOI
and cone calorimeter [ 37, 38], a curve with the equation III was revealed.
(III)
A similarly good correlation between the oxygen index and the PHRR of the materials in the
rapid mass calorimeter further proves the reliability of this test and confirms the relation
between the cone calorimeter and the rapid mass calorimeter. Equation IV was found to
describe the connection between the oxygen index test and the PHRR obtained in the rapid mass
calorimeter.
(IV)
This correlation shows that materials which exhibit a relatively low PHRR in either method,
cone calorimeter or rapid mass calorimeter, will exhibit a high limiting oxygen concentration
2.1 Part I: screening for performance of flame retardants
22
where self-extinguishment still occurs. This fact, that a similarly good correlation is found for
both rapid mass calorimeter and cone calorimeter, further shows that they are related tests and
the obtained PHRR values are comparable to a great extent.
2.1.3 In-detail analysis of heat release rate in the rapid mass calorimeter
Several materials with characteristic burning behavior and therefore characteristic heat release
rate curves in the cone calorimeter were chosen to be examined in detail. In general, the flame
retarded system was compared to the non-flame retarded polymer to observe the changes in
heat release rate. This was done to check whether the heat release rate curves contain more
information than just peak height and if some form of burning behavior interpretation is
possible. The heat release rate curves obtained in the rapid mass calorimeter still contain
valuable characteristics which allow for an assessment of burning behavior together with
observations made during the burning test. However, there are significant differences which
result from the size reduction and the accompanying edge burning effect.
In the cone calorimeter, polyamide 6.6 filled with 35 wt% of glass fibers shows a noticeable
plateau of steady burning occurring after the PHRR was reached. This is explained by the
consumption of polymer matrix during burning until a certain amount of inert glass fiber filler
is accumulated on the surface of the pyrolysis zone to form a glass fiber mat. The deceleration
of the heat release rate and the steady burning are the results of the protective effect of the glass
fiber mat. In the rapid mass calorimeter, however, this plateau of steady burning occurs prior to
the actual PHRR. When the edge burning effect becomes pronounced enough, the glass fiber
mat is not sufficient to protect the material from irradiation and to hinder fuel transport to the
flame. If polyamide 12 is reinforced with glass fiber filler, the same effect is observed also in
the cone calorimeter. However, the reason here is not the edge burning effect, but simply the
stronger burning of the polymer matrix.
2.1 Part I: screening for performance of flame retardants
23
A typical example of a heat release rate curve where a flame inhibiting effect is evident, is the
incorporation of AlPi in styrene-based thermoplastic elastomers (TPES). Compared with the
non-flame retarded TPES, the addition of AlPi leads to a reduction of the slope and of the PHRR
in the cone calorimeter measurements. The flameout occurs right after PHRR was reached and
the HRR is abruptly reduced again. Since hardly any residue is produced and heat release rate
clearly shows a non-charring behavior, flame inhibition must have been the main mode of
action in this system. In the rapid mass calorimeter, the same effects are observed and slope and
PHRR reduction are not as pronounced as in the cone calorimeter. This shows that changes in
heat release rate and burning behavior are well detectable with the rapid mass calorimeter.
Rapid mass calorimeter results were also compared with results from the established screening
method, the PCFC. Heat release rate curves in the PCFC are created by subjecting the material
to a heating ramp. If at a certain temperature pyrolysis gases are set free, they are introduced
into an oxygen/nitrogen gas stream and completely combusted. Because of this, no real
interpretation of burning behavior is possible. Additionally, the lack of a real flame as well as
the milligram scale of the samples limit the detectable flame retardant effects. For example, the
previously described effect occurring by incorporating glass fibers as an inert filler into
polyamide 12, the shielding effect of a glass fiber mat during burning is not visible in the PCFC
measurements. Merely the reduction of fuel by replacing polymer matrix with the inert filler is
depicted by peak height reduction. The rapid mass calorimeter on the other hand, is able to
detect such macroscopic effects and furthermore allows for an assessment of flame inhibition
effects since the used samples are burning with a real flame.
Lopez-Cuesta et al. [ 39] described the discrepancies between the efficiency of flame retardants
measured with the cone calorimeter and the PCFC by checking the correlation between PHRR
reduction in the cone calorimeter and HRC reduction in PCFC. This approach was used to check
whether the rapid mass calorimeter exhibits a more or less pronounced efficiency than the cone
calorimeter by plotting the ratio of PHRR of flame retarded material to non-flame retarded
material in the rapid mass calorimeter versus the similar ratio of PHRR in the cone calorimeter
(Figure 12). If the materials would show the same efficiency in both methods, all data points

2.1 Part I: screening for performance of flame retardants
24
would be located on the ideal line. However, it was found that all data points were positioned
above the ideal line, which means that the efficiency of a flame retardant is not as distinct in
the rapid mass calorimeter than in the cone calorimeter.
Figure 12. Correlation between the ratio PHRR of flame retarded to non-flame retarded material in the rapid mass calorimeter (R1) and the same ratio in the cone calorimeter (R2) (A) and the influence of sample size on this correlation (B).
While the lowered efficiency in the PCFC was demonstrated to be the result of the inability to
detect certain flame retardant effects, it was hypothesized that the lowered efficiency in the
rapid mass calorimeter is mainly due to the size reduction and the associated edge burning
effect. To prove this, two polymeric systems were selected and the flame retarded and non-
flame retarded formulations of those systems were varied in size and were measured in the rapid
mass calorimeter. By comparing the PHRR ratio of the different sized formulations in the rapid
mass calorimeter with the PHRR ratio of the constant size formulations in the cone calorimeter,
it was detected that with increasing specimen size the data points approached the ideal line.
This confirms that merely the size reduction of the specimens is reason for the apparent worse
performance compared to the cone calorimeter. By keeping that in mind, the rapid mass
calorimeter is still able to assess all kinds of effects occurring during burning of flame retarded
formulations.

2.2 Part II: screening for modes of action of flame retardants
25
2.2 Part II: screening for modes of action of flame retardants
2.2.1 Dependency of flame retardant mode of action on polymeric matrix
Phosphorus-based flame retardants were incorporated in a range of model system thermosets
representative for groups of thermoplastics. By means of thermogravimetric analysis it was
found out that epoxy resin and polyester resin model systems are more prone to produce residue
from pyrolysis than PMMA resin and paraffin model systems. AlPi incorporated in epoxy resin,
for example, does not increase the amount of residue by much. However, the effects of AlPi on
residue formation in the polyester system are much more different. Exolit OP935 promoted the
formation of residue up to a total amount of 14 wt%.
Differences of flame retardant effects and efficiencies depending on the polymeric matrix
become even clearer when measured in the cone calorimeter under forced flaming conditions.
The effect of a single flame retardant was studied in all four polymer matrices by plotting the
normalized effective heat of combustion (EHC) versus the phosphorus content release in the
gas phase. This was done for each used flame retardant. The AlPi flame retardants Exolit OP935
and OP1230 were compared in all four polymer matrices to provide a statement about the effect
of different particle size distributions (Figure 13 A and B). In both cases, the epoxy and
polyester resins exhibit the most distinct EHC reduction while those flame retardants achieve
only a marginal EHC reduction in PMMA resin and almost no EHC reduction in paraffin. It is
also apparent that the finer-grained Exolit OP935 is most effective in epoxy resin, while the
coarser-grained Exolit OP1230 shows a slightly better effectiveness in polyester resin when it
comes to reduction of the effective heat of combustion.

2.2 Part II: screening for modes of action of flame retardants
26
Figure 13. Effective heat of combustion in relation to the phosphorus content in the gas phase for Exolit OP935 (A) and Exolit OP1230 (B) in epoxy resin, polyester resin, PMMA resin and paraffin.
In the epoxy resin, BDP is able to induce residue formation of up to 17 wt%, whereas in the
polyester resin, the amount of residue only reaches about 5 wt%. In the PMMA resin model
system, almost no residue is formed. It was also observed that BDP at every loading has a much
higher reduction in EHC than the AlPi flame retardants when incorporated into epoxy resin or
polyester resin. In the PMMA resin, however, EHC reduction lies in the same low range for
both kinds of flame retardants (Figure 14 A). Red phosphorus showed a strong reduction of
EHC in epoxy resin but only a slight reduction when incorporated into paraffin. In epoxy resin,
red phosphorus reduces the EHC to around 60 % whereas in paraffin the EHC reaches only
around 90 % at the highest loading (Figure 14 B).
Figure 14. Effective heat of combustion in relation to the phosphorus content in the gas phase for BDP (A) and red phosphorus (B) in different matrices.

2.2 Part II: screening for modes of action of flame retardants
27
These results show that the used flame retardants are performing best in the DGEBA/IPDA
epoxy resin system. The leveling off of efficiency is most noticeable in this matrix. When
paraffin is used as the polymer matrix for incorporation of flame retardants, the fire retardancy
performance was only marginal, making it not suitable for this kind of screening.
2.2.2 Dependency of flame retardant mode of action on phosphorus species
The mode of action of a phosphorus-based flame retardant is dependent on the phosphorus
species. In general, phosphates like the used Bisphenol-A bis(diphenyl phosphate) act as
precursors for the increased condensed phase mode of action, mainly charring. Furthermore,
red phosphorus is known as a char inducing agent as well due to its reaction with phosphoric
acid. This is especially the case in polymeric matrices with a high oxygen or nitrogen content.
In hydrocarbon polymers, the formation and release of P4 leads to gas phase activity [ 14].
Aluminum diethyl phosphinate was found to react mainly in the gas phase as a flame inhibiting
agent in most polymer matrices. The flame retardant – polymer matrix combinations studied in
this work were chosen under the premise that flame inhibition is the predominant mode of
action. This way, the condensed phase actions of the flame retardants become more noticeable
when the amount of incorporated flame retardant is increased. In fact, it was found out, that
BDP in epoxy resin exhibited the largest increase in residue formation while having the lowest
phosphorus content of all tested flame retardants. Moreover, BDP was the only flame retardant
whose incorporation in epoxy resin led to the formation of a protective layer. This was
additionally concluded by the nature of the formed residue. The surface of the residue of sample
EP-25-BDP, for example, exhibited a very closed and compact texture while the residues of
other formulations featured a brittle and loose structure. A calculation of the amount of
protective layer effect contributing to the overall flame retardant performance concluded that
up to 35 % of the PHRR reduction is attributed to this protective layer effect. In conclusion, the
assessment of different flame retardants in polymeric matrices revealed their preferred mode of

2.2 Part II: screening for modes of action of flame retardants
28
action and the novel way of quantification enabled a statement about the contribution to the
overall fire retardancy performance in the respective matrix.
2.2.3 Dependency of flame retardant mode of action on phosphorus content
Flame retardancy performance is strongly dependent on the amount of phosphorus content
incorporated into the polymer matrix. Several effects come into play when the flame retardant
load, and thus the phosphorus content, is increased. The ability to release phosphorus into the
gas phase as well as the effectiveness of a flame retardant in gas phase and condensed phase
changes heavily. For investigations of dependencies of phosphorus content in the gas phase on
flame inhibition performance, the EHC was monitored in the cone calorimeter. It was observed
that with higher phosphorus concentration in the gas phase, the decrease in EHC follows a non-
linear decay, up to a leveling off. This means that an increase in flame retardant load and
therefore phosphorus content is of no advantage after a critical concentration. It might even be
detrimental for the effectiveness since additionally released phosphorus species which do not
take part in flame inhibition may increase the EHC again (Figure 15 B III). For epoxy resin and
polyester resin, all the flame retardants exhibit this leveling off phenomenon (Figure 15 A). In
PMMA resin, a tendency towards leveling off is still noticeable, whereas the EHC of the flame
retarded paraffin model system formulations follow a linear behavior.

2.2 Part II: screening for modes of action of flame retardants
29
Figure 15. Effective heat of combustion in relation to the phosphorus content in the gas phase for the four different flame retardants in epoxy resin (A) and a schematic of the proposed curve progression (B).
In the same way, the condensed phase activity, monitored by residue formation, was
investigated. An increase in flame retardant load, and therefore in phosphorus content, leads to
an increase in residue amount and in remaining phosphorus in the residue. But this relation is
only valid up to a certain concentration of phosphorus in the residue. In the cases of BDP
incorporated into epoxy resin and polyester resin, this concentration lies at around 6 and 8 wt%
respectively. By increasing the phosphorus concentration further, the amount of residue
increases rapidly, exhibiting a sigmoidal curve behavior. This effect is displayed in Figure 16.
The reason for that is the tendency of BDP, or other flame retardants, to build up a protective
layer, shielding the material from heat and hindering fuel transport to the flame. Because of
this, the amount of incompletely pyrolyzed material in the residue increased and caused the
jump in the curve. If the phosphorus concentration in the residue increases even further, the
curve adopts a linear behavior again.

2.2 Part II: screening for modes of action of flame retardants
30
Figure 16. Residue formation in relation to the phosphorus content in the residue for flame retardants in epoxy resin (A) and a model curve progression for some of the investigated formulations showing a nearly linear increase of residue with
phosphorus content (I), a step in residue formation (II) and a relapse back to linear curve progression (III).
The nature of the formed residues allowed to further prove this conclusion. It was observed that
the residue which resulted from burning the epoxy-BDP-system exhibited a more closed and
even surface (Figure 17 B), whereas formulations with AlPi or RP as flame retardants in epoxy
resin produce a more brittle and rough char (Figure 17 A). In the polyester resin system, the
amount of residue from the formulation with a load of 25 wt% of BDP only lies at 3.5 wt%.
This is evidence that the main effect of BDP in the polyester resin system must be a flame
inhibiting effect in the gas phase.
Figure 17. Photographs of residues of EP-15-ExOP935 (A) and EP-25-BDP (B).

2.2 Part II: screening for modes of action of flame retardants
31
The investigation of the dependencies of flame retardant performance on the phosphorus
content in the gas phase and condensed phase, respectively, brought new insight into the
behavior of the different phosphorus-based flame retardants. Separate observation of gas phase
and condensed phase performance allowed for the discovery of the predominant mode of action
of a flame retardant in a specific polymeric matrix. Increasing phosphorus content in the gas
phase as well as in the residue revealed the levelling off of flame inhibition effectiveness and
the step-like change in residue amount. These findings contribute to the overall understanding
of phosphorus-based flame retardant behavior in different polymeric matrices and provide a
basis for future development of flame retarded polymeric systems.
3.1 The rapid mass calorimeter: A route to high throughput fire testing
32
3 Publications
3.1 The rapid mass calorimeter: A route to high throughput
fire testing
Sebastian Rabe, Bernhard Schartel, Fire and Materials 2017, 41, 834-847.
https://doi.org/10.1002/fam.2420
This article was accepted and published.
First author contribution:
Conceptualizing the working packages
Setting up the rapid mass calorimeter
Choosing the materials for statistical and detailed approaches
Development of the rapid mass calorimeter method
Cone calorimeter, rapid mass calorimeter, PCFC and all other measurements
Analysis and interpretation of the data
Scientific discussion and conclusions
Conceptualizing and writing the manuscript
Contributions from other authors:
Bernhard Schartel:
o Conceptualizing and writing of funding application
o Contribution to the scientific discussion
o Contribution to the concept of the manuscript

3.1 The rapid mass calorimeter: A route to high throughput fire testing
33
Abstract: The rapid mass calorimeter based on reduced size specimens is proposed for
accelerated fire testing and put up for discussion, particularly for flame retarded polymeric
materials. A mass loss calorimeter is combined with a semiautomatic sample changer.
Experiments on specimens of reduced size were conducted on poly(methyl methacrylate),
poly(propylene), polyamide 66, poly(ether ether ketone), and pine sapwood square samples
with edge lengths of 100, 75, 50, 25, 20, and 10 mm. Specimens of 20 × 20 mm2 were selected
to achieve a crucial reduction in specimen size and a measuring protocol developed. A total of
71 different polymeric materials were investigated in the rapid mass calorimeter and cone
calorimeter for comparison and several materials known to have different heat release rate
characteristics in the pyrolysis combustion flow calorimeter were used to test this additional
screening method as well. The important fire properties obtained in the rapid mass calorimeter
show reasonable correlation with the cone calorimeter results and also with the oxygen index.
All in all, the rapid mass calorimeter produces reliable and meaningful results and, despite
acceleration and size reduction, still allows for a certain degree of burning behavior
interpretation. Material savings of 96% and time savings of around 60% 70% are achieved
compared to cone calorimeter measurements.

R E S E A R CH AR T I C L E
The rapid mass calorimeter: A route to high throughput firetesting
Sebastian Rabe | Bernhard Schartel
Bundesanstalt für Materialforschung
und –prüfung (BAM), Unter den Eichen 87,
12205 Berlin, Germany
Correspondence
Bernhard Schartel, Bundesanstalt für
Materialforschung und –prüfung (BAM), Unter
den Eichen 87, 12205 Berlin, Germany.
Email: [email protected]
SummaryThe rapid mass calorimeter based on reduced‐size specimens is proposed for accelerated fire
testing and put up for discussion, particularly for flame retarded polymeric materials. A mass loss
calorimeter is combined with a semiautomatic sample changer. Experiments on specimens of
reduced size were conducted on poly(methyl methacrylate), poly(propylene), polyamide 66,
poly(ether ether ketone), and pine sapwood square samples with edge lengths of 100, 75, 50,
25, 20, and 10 mm. Specimens of 20 × 20 mm2 were selected to achieve a crucial reduction in
specimen size and a measuring protocol developed. A total of 71 different polymeric materials
were investigated in the rapid mass calorimeter and cone calorimeter for comparison and several
materials with different heat release rate characteristics in the pyrolysis combustion flow calorim-
eter to test this additional screening method as well. The important fire properties obtained in the
rapid mass calorimeter show reasonable correlation with the cone calorimeter results but also
with the oxygen index. All in all, the rapid mass calorimeter produces reliable and meaningful
results and, despite acceleration and size reduction, still allows for a certain degree of burning
behavior interpretation. Material savings of 96% and time savings of around 60%‐70% are
achieved compared to measure cone calorimeter.
KEYWORDS
cone calorimeter, fire testing, high throughput, mass loss calorimeter, rapid mass calorimeter
1 | INTRODUCTION
Modern flame‐retardant polymeric materials contain a variety of addi-
tives that make them multicomponent systems. Flame retardants,
flame‐retardant combinations, fillers, adjuvants, and synergists, as well
as their concentration, particle size distribution, and so forth have an
influence on burning behavior. Thus, accelerated screening methods
are needed to find the best formulation in terms of fire performance
for this large and complex multidimensional matrix. Because of limita-
tions in time, materials, and therefore costs, no complete comprehen-
sive elucidation of all possible formulations is possible. In the last
decade the NIST (National Institute of Standards and Technology)
worked on a larger project from which several ideas for high through-
put fire tests emerged,1–4 eg, fire testing based on a gradient heat flux
and reduced specimen size, so that the fire performance of several
formulations can be evaluated at once. Moreover, the rapid cone calo-
rimeter was developed. For this, a cone calorimeter was equipped with
a conveyor belt to provide a constant supply of reduced‐size samples.
Despite the great research potential illuminated in this project, the
topic has not been pursued to a significant extent.
The same holds for other high‐throughput approaches dealing
successfully with large number of materials but stick to a singular
work.5 The pyrolysis combustion flow calorimeter (PCFC, also called
the microscale combustion calorimeter) is the only method commer-
cially available today that provides small‐scale fast heat release rate
(HRR) measurement via oxygen consumption.6 However, its measuring
principle and the nature of the milligram specimens limit the signifi-
cance of the results obtained and thus the PCFC's field of application
with respect to flame‐retarded polymeric materials.7,8 Certain impor-
tant modes of action by flame retardants, like flame inhibition, changed
dripping behavior, protection layer effects, and so on are not covered
because of the combustion conditions, the milligram scale specimens,
and the lack of a real flame.
Thus the task is to preserve the conditions of a fire test, such as
diffusion flame, forced flaming conditions, and pyrolysis of a macro-
scopic specimen and transfer them to reduced‐scale and accelerated
testing without losing a good correlation. The basic principle of the
rapid cone calorimeter was adopted and the rapid mass calorimeter
developed and proposed to function as an accelerated kind of cone
calorimeter testing. Moreover, the potential of the rapid mass
Received: 10 June 2016 Revised: 2 December 2016 Accepted: 2 December 2016
DOI 10.1002/fam.2420
Fire and Materials. 2017;1–14. Copyright © 2017 John Wiley & Sons, Ltd.wileyonlinelibrary.com/journal/fam 1

calorimeter as a high‐throughput fire test is discussed for flame‐
retarded polymeric materials by investigating in detail the fire behavior
of reduced‐size specimens and a large variety of different materials.
2 | EXPERIMENTAL
2.1 | Rapid mass calorimeter
The principle of the rapid cone calorimeter is adopted, but to further
reduce the time and effort demanded for steps such as maintenance
and calibration, the rapid mass calorimeter was built, using a mass loss
calorimeter (Fire Testing Technologies, UK) with a thermopile chimney
attached according to ISO 13927.9 Heat release rate is measured, but
the balance was exchanged by a linear motion unit (Oriental motor, JP)
with mounts for 2 sample holders located at a distance of 350 mm
from each other from center to center and 250 mm edge to edge. This
ensured a safe exchange of residues with new specimens while also
preventing heat radiation from reaching the subsequent sample. The
setup is illustrated in Figure 1A. The linear motion unit can be
programmed for various purposes. For this research, a basic loop pro-
gram was used to make measuring semiautomatic. A dwell time of
60 seconds for an empty specimen holder is used to record the HRR
baseline, followed by a simple loop motion with certain dwell times
in each position. While the automation is not the key factor when it
comes to reducing the fire testing time, it certainly adds a level of com-
fort and improves repeatability. The main factor reducing fire testing
time is the specimen size reduction. A specimen size of 20 mm × 20mm
and a dwell time of 200 seconds under the cone heater were chosen,
as discussed in detail in Section 3 of this study. The measurements
were done in triplicate. The user was responsible for exchanging the
burned sample with a new specimen. Additionally, observation plays
a significant role in describing the burning behavior of polymeric
materials.
For safety reasons, the rapid mass calorimeter was enclosed in a
housing. A box was built of 5‐mm thick Isoplan 1100 ceramic fiber
plates, able to withstand temperatures of up to 1100°C, as shown in
Figure 1B. Built‐in windows on each side allow for safe and easy
sample handling as well as observation of the burning process, while
additional ventilation holes ensure optimal air circulation. A detailed
scheme of the sample holder linear motion unit is displayed in
Figure 1C.
2.2 | Mass loss calorimeter and cone calorimeter
A mass loss calorimeter (Fire Testing Technologies, UK) with an
attached thermopile chimney was used according to ISO 13927.9
Square specimens of different sizes (edge length = 100, 75, 50, 25,
FIGURE 1 The rapidmass calorimeter; A, Setupwith linearmotionunit underneathmass loss calorimeter, B, Rapidmass calorimeter housing and dataacquisition, andC,Construction schematics of thedual sample holder on the linearmotionunit [Colour figure canbe viewedatwileyonlinelibrary.com]
2 RABE AND SCHARTEL

20, and 10 mm) were investigated. Cone calorimeter (FTT, UK) mea-
surements were performed on specimens 100 × 100 mm in size with
thicknesses between 3 and 10 mm according10 to ISO 5660. The spec-
imens, wrapped in an aluminum tray, were placed 25 mm under the
cone heater and irradiated with a heat flux of 50 kW/m2. All measure-
ments took place without a retainer frame. The measurements were
usually performed only in duplicate but in triplicate whenever any fire
property showed a deviation between the first 2 measurements
greater than 10%.
2.3 | Pyrolysis combustion flow calorimeter
All measurements with the PCFC were performed with a combustor
temperature of 900°C and a pyrolyzer temperature gradient ranging
from 150°C to 750°C, at a heating rate of 1 K/s. The specimen mass
amounted to 5.00 ± 0.05 mg. For data analysis, a Gauss fit was per-
formed on the obtained peak HRR (PHRR) to determine the heat
release capacity (HRC = peak of the Gauss fit of the HRR/heating rate).
In the case of multiple peaks, the values were summed up to obtain the
HRC sum.8,11 All PCFC measurements were done in triplicate, and the
results averaged.
2.4 | Materials
A large number of different polymeric materials were tested, 71 in
total (Table 1), including different polymers, woods, and halogen‐free
flame‐retarded polymeric materials to provide maximum variety.
Most of them were taken from former studies8,12–23; thus the atten-
tion of readers interested in more details on the individual materials
and their processing is directed to these original studies. All of the
investigated polymeric materials and corresponding test specimens
were provided by partners with high competence in compounding
and processing and showed sufficiently high quality. Certain formula-
tions were examined in detail with the rapid mass calorimeter, PCFC,
and cone calorimeter to reveal more about burning behavior and
assist in the interpretation of the results. These materials were cho-
sen for their characteristic HRR curve shapes in cone calorimeter
tests,24 which depend on their fire behavior and on the mode of
action of the flame retardants used. For experiments on reduced‐size
specimens and method development, 5 polymers with different
burning behaviors and performances were used, ranging from highly
flammable polymers like poly(propylene) (PP) and poly(methyl meth-
acrylate) (PMMA) over polyamide 66 (PA66) to intrinsically flame‐
retarded charring poly(ether ether ketone) (PEEK), and pine sapwood
(WOOD).
2.5 | Correlation determination
Correlations were ascertained using a linear fit function. The Pearson
correlation coefficient was used to measure the linear relationship
between parameters, which can range from −1 to +1 for an exact neg-
ative or exact positive linear dependence, respectively.25 Correlation
coefficient strengths are defined in Table 2.
3 | RESULTS AND DISCUSSION
3.1 | Reducing specimen size
Size reduction of the specimen is the most crucial premise to accelerate
testing. Unfortunately, since burning behavior is always the response of
a defined specimen in a specific fire scenario, it changes with specimen
size.26,27 Thus, every development of a fire test featuring high through-
put not only faces the dilemma that reducing specimen size is manda-
tory for speeding up testing but also gives rise to serious limitations.
For scale reduction experiments, PMMA, PP, PA66, PEEK, and WOOD
square plates with 6 different surface areas between 100 and
10 000 mm2 were measured in the mass loss calorimeter. The results
of this, depicted in Figures 2, 3, and 4, show that with decreasing spec-
imen size, both the HRR per unit area and the absolute HRR reachmuch
higher values than expected when the surface area is decreased.
Because of an edge burning effect and the horizontal spread of the
flame across the surface of the entire sample, the thermopile encoun-
ters much greater thermal impact than expected for the corresponding
surface area of the top of the specimen. In fact, the ratio of flame size to
specimen size increases with smaller samples, leading to very high
peaks for the smallest specimen, with a surface of 10 × 10 mm2. This
effect is depicted in Figure 5, where PHRR and total heat evolved
(THE) are plotted versus the surface area of the top of the specimen.
With decreasing specimen size, the deviations rise. This is more distinct
for strongly burning materials like PP than for more intrinsically flame‐
retarded materials such as WOOD and PEEK. In Figures 2, 3, and 4, the
HRR curves are depicted as HRR per unit area as well as in absolute
values. This way, the obtained results clearly show the change in burn-
ing intensity, the basic HRR curve shape, and thus the change in burning
behavior with different specimen sizes.
Experiments on PEEK specimens of varying sizes in the mass loss
calorimeter show an interesting change in HRR curve shape (Figure 2).
Standard‐sized specimens with an edge length of 100 mm show a dis-
tinct, steadily burning plateau in which the rates of char formation
and fuel release are in equilibrium. Decreasing the specimen size
shifts this equilibrium in favor of fuel release. Because of the edge
burning effect, char formation is no longer sufficient to provide this
balance. With a specimen size of 50 × 50 mm, the steady‐burning pla-
teau changed into a shoulder still indicating this effect, whereas this
did not occur in smaller specimens. Nevertheless, the good fire per-
formance of PEEK is still exhibited in smaller specimens and can be
evaluated. Polyamide 66 (Figure 3) and PMMA (Figure 4) show
simpler curve shapes, which remain more or less unchanged with
decreasing specimen size.
To increase the significance of burning behavior results and their
interpretation, we conducted experiments on reduced‐size specimens
not only on pure polymers and nonflame–retarded materials but also
on an intumescent flame‐retarded system. The HRR curve behavior
shows a characteristic initial peak followed by a minimum (Figure 6).
The material burns until a protective layer is formed, which hinders
the fuel from reaching the flame. After a while, the protective layer
cracks and the flame is again provided with fuel until depletion. This
is shown in the HRR by a maximum. When specimen size is
decreased, those characteristics are lost. With an edge length of
RABE AND SCHARTEL 3

TABLE 1 Polymeric materials and their thicknesses used for the investigation of reduced‐size specimens, to develop the measuring protocol forthe rapid mass calorimeter, comparison between rapid mass calorimeter, the PCFC and cone calorimeter, and materials measured in the rapid masscalorimeter and the cone calorimeter
Material Label Thickness, mm
Experiments on Reduced‐Size Specimens
Poly(methyl methacrylate) PMMA 3
Poly(propylene) PP 3
Polyamide 66 (Ultramid® A3) PA66 3
Poly(ether‐ether ketone) PEEK 4
Pine sapwood WOOD 5
Comparing rapid mass calorimeter with cone calorimeter and PCFC
PA66/35 wt.‐% glass fiber PA66‐35GF 3
PA66/35 wt.‐% GF + red phosphorus PA66‐35GF‐RP 3
Bisphenol A polycarbonate/acrylonitrile butadiene styrene/Polytetrafluoroethylene PCABS/TF 3
PC/ABS/TF + resorcinol bis(diphenyl phosphate) PCABS/TF‐RDP 3
PC/ABS/TF + triphenyl phosphate PCABS/TF‐TPP 3
Styrene Ethylene Butylene Styrene/PP/mineral oil/antioxidant TPES 5.8
TPES +30 wt.‐% aluminum diethyl phosphinate TPES‐30AlPi 5.8
Polyamide 12 PA12 4
PA12 + 30 wt.‐% GF PA12‐30GF 4
Poly(butylene terephthalate) PBT 5
PBT + 30 wt.‐% GF PBT‐30GF 5
PP + 25 wt.‐% ammonium polyphosphate PP‐25APP 3
PP + 25 wt.‐% coated APP PP‐25APP* 3
PP + 20 wt.‐% APP* PP‐20APP* 3
PP + 30 wt.‐% flax PP‐30FLAX 4
PP + 30 wt.‐% flax 25 wt% APP PP‐30FLAX‐25APP 4
Cone calorimeter and rapid mass calorimeter
PP + 30 wt.‐% flax +25 wt.‐% expandable graphite PP‐30FLAX‐25GR 4
PP + 30 wt.‐% Flax +15 wt.‐% EG PP‐30FLAX‐15EG 4
PA66 + 25 wt.‐% GF + RP PA66‐25GF‐RP 3
PA66 + 25 wt.‐% GF + RP + rubber PA66‐25GF‐FR‐Rubber 3
PC/ABS/TF + 5 wt.‐% Talk + BDP PCABS‐TF‐5 T‐BDP 3
PC/ABS/TF + 20 wt.‐% Talk + BDP PCABS‐TF‐20 T‐BDP 3
PC/ABS/TF + 10 wt‐% Talk + zinc borate + BDP PCABS‐TF‐10 T‐ZnB‐BDP 3
PC/ABS/TF + BDP PCABS‐TF‐BDP 3
PA66 + 20 wt.‐% Sidistar® T 120 PA66‐20SID 4
PA12 + 20 wt.‐% SID PA12‐20SID 4
High‐density poly(ethylene) (Hostalen® GM 5050) HDPE3mm 3
HDPE HDPE6mm 6
HDPE +15 wt.‐% Mg(OH)2 HDPE3mm‐15MDH 3
HDPE +15MDH HDPE6mm‐15MDH 6
HDPE +30 wt.‐% MDH HDPE3mm‐30MDH 3
Pine PINE 10
Beech Belmadur BELMA 10
Pinus radiata PINUS 10
Accoya ACCO 10
Flame retarded PCABS (Bayblend® FR 3005) BayblendFR3005 4
Flame retarded PCABS (Bayblend® FR 2000) BayblendFR2000 4
Flame retarded PCABS (Bayblend® FR 3000) BayblendFR3000 4
Flame retarded PCABS (Bayblend® FR 3030) BayblendFR3030 4
Flame retarded PCABS (Bayblend® KU 2–1514) BayblendKU2–1514 4
Epoxy resin (Araldite® GY 250/Aradur® 250, 2:1) EP 5
(Continues)
4 RABE AND SCHARTEL

75 mm, an initial peak due to the protective layer formation is visible
in the form of a shoulder. For smaller specimen sizes, only 1 broad
peak is observable. Because of the edge burning effect, the protective
layer is not capable of creating a sufficient barrier between fuel and
flame, which leads to continuous fuel support. Nevertheless, the intu-
mescent flame retardant still broadens and thus decreases the HRR in
smaller samples.
A specimen size of 20 mm × 20 mm was proposed to be used as
the standard size for rapid mass calorimeter testing. It is proposed to
achieve crucial reduction in materials needed for testing and burning
time but still offer repeatability and reliability of the results. Obviously,
larger samples, such as 50 mm × 50 mm, offer a burning behavior more
similar to cone calorimeter test results but would lack with respect to
the goal of the publication. At the end of the day, it is a compromise
between loosing similarities with the cone calorimeter results and
gaining a benefit of accelerated testing. Going for 20 mm × 20 mm
seems to max out the limits in the investigated samples (Figures 2–6)
and is a clear alternative to standard‐sized cone calorimeter testing.
Only 4% of a standard cone calorimeter test specimen is used, provid-
ing significant savings in material.
3.2 | Rapid mass calorimeter
To develop the method and measurement procedure, the same set of 5
materials were used as for the experiments on reduced‐size specimens.
The method had to be developed to ensure complete burning of the
specimen and optimal time savings. For this, the linear motion unit
was programmed for different dwell times under the cone heating unit.
These times depended strongly on the burning time of thematerial to be
tested. Figure 7 shows HRR curves and residues for sample series with
different dwell times under the cone heater. With a dwell time of
TABLE 1 (Continued)
Material Label Thickness, mm
EP + 5 wt.‐% layered silicate (Nanomer® I.30E) EP‐5NANO 5
EP + 5 wt.‐% layered silicate +7 wt.‐% SID EP‐5NANO‐7SID 5
Poly(vinyl chloride) + 5 wt.‐% ZnS PVC‐5ZnS 4
PBT + AlPi PBT‐AlPi 5
PBT + 30 wt.‐% GF PBT‐30GF 4
Low density poly(ethylene) (LD 615BA) LDPE 4
Polystyrene (Lacqrene 1810) PS 4
Impact‐resistant PP (Moplen) + 5 wt.‐% expanded graphite EP300K‐5EG60 3
EP300K + 5 wt.‐% multilayer graphene (BET =350 m2 g−1) EP300K‐5MLG350 3
PC/ABS PCABS 3
PC/ABS + BDP PCABS‐BDP 3
PC/ABS + TF PCABS‐TF 3
PC/ABS + TF + 1 wt.‐% boehmite + BDP PCABS‐TF‐1Al‐BDP 3
PP + 53 wt.‐% Mg(OH)2 PP‐53MDH 3
PP + 53 wt.‐% Mg(OH)2 + 1 wt.‐% thermally reduced graphite oxide PP‐53MDH‐1TRGO 3
PP + 54 wt.‐% Mg(OH)2 PP‐54MDH 3
PP + 54 wt.‐% Mg(OH)2 + 1 wt.‐% TRGO PP‐54MDH‐1TRGO 3
PP + 59 wt.‐% Mg(OH)2 PP‐59MDH 3
PP + 59 wt.‐% Mg(OH)2 + 1 wt.‐% TRGO PP‐59MDH‐1TRGO 3
Flame retarded polystyrene (FR 3180) PS4 3
Shorea bracteolata MERANTI 10
Chipboard CHIP 10
TPE‐S + 30 wt.‐% APP TPES‐APP 5.8
TPE‐S + 30 wt.‐% AlPi TPES‐AlPi 5.8
TPE‐S + 7.5 wt.‐% APP +22.5 wt.‐% EG TPES‐APP‐EG 5.8
TPE‐S + 50 wt.‐% Mg(OH)2 TPES‐MDH 5.8
TPE‐S + 15 wt.‐% APP +7.5 wt.‐% AlPi +7.5 wt.‐% dipentaerythritol TPES‐APP‐AlPi‐DiPer 5.8
TPE‐S + 6.2 wt.‐% APP* + 18.7 wt.‐% EG + 5 wt.‐% AlPi TPES‐APP*‐EG‐AlPi 5.8
TPE‐S + 6.2 wt.‐% APP +18.7 wt.‐% EG + 5 wt.‐% AlPi TPES‐APP‐EG‐AlPi 5.8
TPE‐S + 30 wt.‐% Mg(OH)2 + 2.5 wt.‐% ZnB + 2.5 wt.‐% glass frits +10 wt.‐% EG + 5 wt.‐% APP TPES‐MDH‐ZB‐GF‐EG‐APP 5.8
Abbreviation: PCFC, pyrolysis combustion flow calorimeter.
TABLE 2 Pearson correlation coefficient R definition
Correlation Strength Pearson R
Strong 0.85 ≤ |R|
Moderate 0.70 ≤ |R| < 0.85
Marginal 0.55 ≤ |R| < 0.70
Weak 0.40 ≤ |R| < 0.55
Poor |R| < 0.40
RABE AND SCHARTEL 5

FIGURE 2 A, HRR per unit area in kW/m2 and B, HRR in kW forvarious sizes of PEEK specimens. HRR, heat release rate; PEEK,poly(ether ether ketone)
FIGURE 3 A, HRR per unit area in kW/m2 and B, HRR in kW forvarious sizes of PA66 specimens. HRR, heat release rate; PA,Polyamide 66
FIGURE 4 A, HRR per unit area in kW/m2 and B, HRR in kW forvarious sizes of PMMA specimens. HRR, heat release rate; PMMA,poly(methyl methacrylate)
FIGURE 5 A, PHRR and B, THE of PMMA, PP, PA, WOOD, and PEEKplotted versus specimen size. PA, Polyamide; PEEK, poly(ether etherketone); PHRR, peak heat release rate; PMMA, poly(methylmethacrylate); PP, poly(propylene); THE, total heat evolved; WOOD,pine sapwood
6 RABE AND SCHARTEL

100 seconds complete burning of PA66 is not ensured, which is appar-
ent in the residue picture aswell as in the lowHRRpeak. Since PEEKhas
a long time to ignition, a dwell time of 100 seconds is much too short
even to show a change in HRR. By extending the dwell time to 150 sec-
onds, both PA66 and PEEK are allowed to burn completely. However,
the time is not long enough to allow the HRR to revert back to the base-
line. Thus, a dwell time of 200 seconds was concluded to be optimal for
this set and order of samples. A longer dwell time of 250 seconds was
deemed unnecessary because it needlessly increased testing time.
Because repeatability was good, the rapid mass loss calorimeter
seems to be a suitable tool to clearly rank the fire risks of different
polymers (Figure 8). Uncertainty was below 6% for the PHRR and less
than 5 seconds for time to ignition. Analogous to cone calorimeter, for
several kinds of materials measuring in duplicate may be enough.
At first glance, the HRR curves produced (Figure 8) are similar to
results obtained from PCFC,28 but upon close examination, they are
not.Mostpolymersmeasured inPCFCresult inonly1peak,which is then
evaluated using a peak fit function. Multicomponent systems usually
show more than 1 peak in PCFC, a result of the diverse decomposition
temperatures of the different components. Evaluation becomes more
complicated, especially when peaks overlap. At the end of the day, the
HRRcurvemeasuredinPCFCiscontrolledbythepyrolysissteps.8 Incon-
trast,HRRcurves fromrapidmasscalorimetermeasurements showchar-
acteristics that are connected to their burning behavior under forced
flaming combustion. As depicted in Figure 8, the HRR curve of PMMA
shows a shoulder prior to reaching the PHRR. This is the result of the
pyrolysis front moving, similar to fire behavior in the cone calorimeter.
For thickersamples,HRRreachesasteadyburningplateauuntil a specific
thermal thickness is reached. Other characteristics like peak broadening
forPEEKorprolongeddecayare alsoobserved in the rapidmass calorim-
eter, just as in the cone calorimeter.
As a consequence, the rapid mass calorimeter harbors the poten-
tial to screen not only polymers such as PP, PA66, PMMA, PEEK, and
WOOD but also flame‐retarded polymeric materials with less simple
burning behavior. A first test series of flame‐retarded polymeric mate-
rials was investigated, consisting of 3 different intumescent PP/ammo-
nium polyphosphate (APP) formulations, PA12, PA12‐30GF, and
PVC‐5ZnS (Figure 9). The PHRR, THE, and other parameters of the
HRR curve showed tendencies similar to those reported for the cone
calorimeter results and clear differences in pyrolysis.13,21 The PHRR
FIGURE 6 A, HRR per unit area in kW/m2, B, HRR in kW of theintumescent flame‐retarded PP‐25APP specimen in various sizes, andC, PHRR plotted versus specimen size for 3 different intumescentPP‐25APP, PP‐25APP*, and PP‐20APP* compared to PP. HRR, heatrelease rate, PHRR, peak heat release rate
FIGURE 7 The HRR curves and residues of a sample series consisting of A, PMMA, B, PP, C, PA66, D, PEEK, and E, WOOD measured in the rapidmass calorimeter with the linear sample changer set to different dwell times. HRR, heat release rate; PA, Polyamide 66; PEEK, poly(ether etherketone); PMMA, poly(methyl methacrylate); PP, poly(propylene); WOOD, pine sapwood [Colour figure can be viewed at wileyonlinelibrary.com]
RABE AND SCHARTEL 7

of PA12 and PA12‐GF were greater than that of the others; PA12‐GF
showed a shoulder. The PHRR of PP‐25APP was a little bit higher than
that of PP‐25APP* but less than that of PP‐20APP*, while PVC‐5ZnS
produced the smallest but broadest peak. These characteristics
FIGURE 9 The HRR measured with the rapid mass calorimeter for aseries of filled and flame retarded polymers: A, PP‐25APP, B, PP‐25APP*, C, PP‐20APP*, D, PA12, E, PA12‐30GF, and F, PVC‐5ZnS.HRR, heat release rate
TABLE 3 Pyrolysis combustion flow calorimeter results
Sample T@PHRR, °C HR, kJ/gHRC,J/g‐K
Residue,wt.‐%
PA66 465 ± 5 30 ± 1 655 ± 19 1
PA66‐GF35 455 ± 3 18 ± 1 363 ± 1 36
PA66‐GF35‐FR 390 ± 11 18 ± 1 286 ± 11 36
PA12 475 ± 5 35 ± 1 902 ± 30 0
PA12‐GF 477 ± 3 31 ± 1 858 ± 12 10
PBT 419 ± 1 22 ± 1 607 ± 8 5
PBT‐30GF 420 ± 3 16 ± 1 415 ± 1 34
TPES 447 ± 1 43 ± 1 548 ± 25 0
TPES‐30AlPi 440 ± 10 37 ± 1 493 ± 20 3
PP 473 ± 1 43 ± 1 1114 ± 11 0
PP‐25APP 480 ± 2 33 ± 1 861 ± 10 11
PP‐25APP* 480 ± 1 33 ± 1 860 ± 20 11
PP‐20APP* 480 ± 1 34 ± 1 900 ± 30 9
PP‐30FLAX 477 ± 7 33 ± 1 863 ± 16 5
PP‐30FLAX‐25APP 482 ± 4 18 ± 1 514 ± 7 23
TABLE 4 Cone calorimeter and rapid mass calorimeter test results
Sample
Cone Calorimeter Rapid Mass Calorimeter
PHRR, kW/m2 THE, MJ/m2 Residue, wt.‐% PHRR, W THE, kJ Residue, wt.‐%
PA66 1509 ± 10 100 ± 2 0 1102 ± 27 35 ± 1 0
PA66‐GF35 582 ± 3 80 ± 1 34 377 ± 25 15 ± 1 28
PA66‐GF35‐FR 299 ± 10 66 ± 2 43 233 ± 15 12 ± 1 35
PA12 2205 ± 70 164 ± 1 0 832 ± 60 31 ± 2 0
PA12‐GF 1992 ± 50 153 ± 2 10 800 ± 40 33 ± 2 11
PBT 2523 ± 37 112 ± 1 1 571 ± 30 16 ± 1 2
PBT‐30GF 690 ± 10 84 ± 1 30 294 ± 25 23 ± 1 27
TPES 2346 ± 140 215 ± 4 0 779 ± 6 29 ± 1 0
TPES‐30AlPi 1048 ± 35 160 ± 2 1 623 ± 5 38 ± 3 0
PP 2349 ± 90 123 ± 2 0 1252 ± 90 63 ± 2 0
PP‐25APP 345 ± 14 95 ± 2 16 373 ± 34 20 ± 1 17
PP‐25APP* 260 ± 20 93 ± 4 16 370 ± 34 24 ± 2 17
PP‐20APP* 288 ± 4 101 ± 1 8 411 ± 38 22 ± 1 17
PP‐30FLAX 809 ± 40 138 ± 10 2 389 ± 36 28 ± 2 5
PP‐30FLAX‐25APP 363 ± 14 99 ± 3 21 251 ± 23 25 ± 2 33
FIGURE 8 A, Rapid mass calorimeter sample series of selected purepolymers and B, Repeatability for PHRR and tig of this series. PHRR,peak heat release rate; HRR, heat release rate; PA, Polyamide 66;PEEK, poly(ether ether ketone); PMMA, poly(methyl methacrylate); PP,poly(propylene); WOOD, pine sapwood
8 RABE AND SCHARTEL

indicate the potential of this method to be used in screening various
flame‐retarded polymeric materials. This point is discussed in detail in
the following.
3.3 | Comparison of rapid mass calorimeter, PCFC,and cone calorimeter results
To clarify the differences between the rapidmass calorimeter andPCFC,
we compared the results of both methods with the state‐of‐the‐art
cone calorimeter fire testing method. For this comparison, the com-
pounds listed inTables 1, 3, and 4 were used, with the premise of pro-
viding variety in the HRR curve shapes from cone calorimeter
experiments. The HRR behavior is conditional on the underlying mode
of action of the flame retardant incorporated in the respective com-
pound. Hence, the gas phase inhibiting effect of the flame‐retardant
aluminum diethyl phosphinate (AlPi) in styrene based thermoplastic
elastomer (TPES) will show a different characteristic HRR curve than,
for instance, a flame retardant inducing intumescence like APP in PP.
Inert fillers like glass fibers often show a characteristic HRR curve
in the cone calorimeter (Figure 10). The PA66‐30GF shows a PHRR at
the beginning of burning, where the polymer matrix burns until a glass
fiber mat builds up a kind of protective layer at the top of the burning
specimen. The protective effect of this fiber mat reduces fuel transport
to the flame, which shows as a plateau in the HRR. Compared to PA66,
the PHRR of PA66‐30GF is reduced by more than 50%. When the
char‐inducing flame‐retardant red phosphorus is added, PHRR is again
reduced to around 50% and the HRR curve shape shows characteristic
behavior for a charring material.12
Although the same formulations measured with the rapid mass
calorimeter show similar PHRR reductions, their curve shapes differ
FIGURE 10 A, Cone calorimeter, B, Rapid mass calorimeter, and C,PCFC HRR curves for flame‐retarded and nonflame–retarded glassfiber reinforced polyamide 66. PCFC, pyrolysis combustion flowcalorimeter; HRR, heat release rate
FIGURE 11 The HRR curves of PA12 and PA12 reinforced with 30%glass fiber derived from A, Cone calorimeter, B, Rapid masscalorimeter, and C, PCFC. PCFC, pyrolysis combustion flowcalorimeter; HRR, heat release rate
RABE AND SCHARTEL 9

somewhat from cone calorimeter measurements. Nevertheless, they
still have the ability to display the different flame‐retardancy effects.
The addition of inert glass fiber filler results in a HRR curve that shows
a shoulder prior to its PHRR. The glass fiber mat produced during burn-
ing is not as efficient at preventing fuel supply to the flame as it was in
the cone calorimeter test. Because of the edge burning effect, fuel pro-
vided by the polymer matrix evades the protective glass fiber mat and
produces the peak in HRR at the end of the curve. The addition of red
phosphorus leads to a general reduction in HRR. In comparison to cone
calorimeter results, the increased charring has less influence on the
burning behavior due to the edge burning effect.
The PCFC showed a reduction in HRR for PA66‐35GF and PA66‐
35GF‐FR but does not allow burning behavior to be interpreted. The
PA66 and PA66‐35GF showed 1 peak according to their pyrolysis;
the reduction for PA66‐35GF is due to the replacement of fuel. Since
the PCFC monitors the HRR per specimen mass, 35GF resulted in a
35% reduction, a level found in hardly any fire test. Adding red phos-
phorus to PA66 has been reported to separate the different pyrolysis
steps and result in a 2‐step decomposition pathway.12 The change in
pyrolysis controlled the change in HRR monitored by the PCFC.
In the cases of PA12 and PA12‐30GF, the HRR curves observed in
the cone calorimeter and rapid mass calorimeter are very similar
(Figure 11). The PA12‐30GF shows a shortened time to ignition, a
shoulder prior to the maximum, and a reduced PHRR compared to
PA12. The glass fiber mat produced is less efficient in PA12 than in
the PA66 discussed above and shows the same effect on the HRR
curve in the cone calorimeter as it does in the rapid mass calorimeter.
Besides the slight reduction in PHRR, a plateau prior to the peak was
introduced. Thus, the protective layer effect is overshadowed and
the HRR increases again until all material is consumed.
An HRC decrease from pure PA12 to glass fiber–reinforced PA12
is evident in PCFC and in the same range as the PHRR decreases in the
FIGURE 12 A, Cone calorimeter, B, Rapid mass calorimeter, and C,PCFC HRR curves of TPES and 30% AlPi flame‐retarded TPES. HRR,heat release rate; PCFC, pyrolysis combustion flow calorimeter; TPES,thermoplastic elastomers
FIGURE 13 The HRR curves of intumescent PP‐APP formulationsfrom A, Cone calorimeter, B, Rapid mass calorimeter, and C, PCFC.HRR, heat release rate; PCFC, pyrolysis combustion flow calorimeter
10 RABE AND SCHARTEL

rapid mass calorimeter. In PCFC, this effect is attributed solely to the
replacement of fuel with inert filler. No flame‐retardant mechanism is
identifiable. Neither did an earlier heat release occur nor was there a
change to a more structured HRR curve.
A typical HRR curve for a flame‐inhibiting mode of action is found
in the system TPES/30AlPi.20 In cone calorimeter experiments, the
most obvious difference, besides the lowered PHRR, is the decrease
in slope and the corresponding prolonged time until flameout
(Figure 12). The basic shape of the HRR curve is not changed, since
only combustion efficiency is reduced in the gas phase. The AlPi flame
retardant did not show any activity in the solid phase since no signifi-
cant residue was formed. Rapid mass calorimeter experiments show a
similar curve progression. The PHRR reduction, slope reduction, and
prolonged time to flameout are not as distinct as in the cone calorim-
eter; nevertheless, the effect of the flame retardant is observed. Since
the change in curve behavior is the same as in the cone calorimeter
tests, the mode of action of the flame retardant is deducible even with-
out knowledge of the standard scale results.
In contrast, PCFC results showed complex HRR curves that are
rather difficult to interpret. The multicomponent TPES showed several
decomposition steps with increasing temperature, which exhibit differ-
ences in intensity and width. Introducing AlPi increased the complexity
of the HRR curve and decreased the overall HRC. The second main
decomposition step is decreased and an additional decomposition step
introduced after the main decomposition.
Different PP/APP formulations were examined with regard to their
characteristic HRR curve progressions (Figure 13). The different stages
of the burning process in cone calorimeter experiments have already
been explained in Section 3.1. Compared to PP, great improvement in
burning performance was achieved. The PHRR was reduced by up to
90%when loaded with 25 wt.‐%APP*. Simultaneously, time to flameout
was increased many times over. Additionally, one is able to describe the
differences in HRR progression occurring because of encapsulation of
APP or reduction of load by 5 wt.‐%. It is obvious that encapsulation
not only reduces PHRR and THE but is also capable of extending the
time until the protective layer suffers cracks, thus prolonging the plateau
at the minimum of the HRR curve. Furthermore, the decay of HRR is
prolonged as well. Comparing 25 wt.‐% APP with 20 wt.‐% of encapsu-
lated APP* shows a reduction of PHRR caused by encapsulation but a
shorter time to flameout. TheTHE is higher with lower APP load.
Compared to the cone calorimeter, rapid mass calorimeter mea-
surements allow for similar conclusions despite some differences in
HRR. Compared to PP, a pronounced reduction in PHRR occurred
because of the protective layer effect. The time to PHRR is prolonged
as well. There is no significant reduction in PHRR between 25% nonen-
capsulated and encapsulated APP. Nevertheless, the HRR curve of PP‐
25APP* is broader and shows a longer decay than that of PP‐25APP.
Decreasing the load from 25% APP* to 20% APP* leads to an increased
PHRR and a shortened burning time.
The PCFC test results do not contain much valuable information.
Compared to PP, the HRC was reduced but only by around 20% and
25%. Because the PCFC measures the HRR per specimen mass, the
replacement of fuel was monitored well, whereas the protective layer
effect did not occur on the milligram scale. The time to PHRR was
not prolonged as in the cone calorimeter and the rapid mass
calorimeter. The 3 flame‐retarded formulations show almost no differ-
ence at all in HRC and heat release per specimen mass (HR). The PCFC
allows pyrolysis to be analyzed but cannot account for residue proper-
ties, which affect a flaming combustion. It is not possible to find the
best performing formulation using the PCFC alone.
Another example of a characteristic HRR curve is exhibited in
PP‐30FLAX (Figure 14). The addition of 30 wt.‐% flax leads to a low-
ering of the PHRR to about 30% that of PP; THE was not signifi-
cantly changed, and 5 wt.‐% residue was formed. What is most
remarkable is the change in the HRR curve shape from 1 high peak
to 2 peaks with a local minimum in between. Since 30 wt.‐% of
noncharring PP was replaced by flax, a residue was formed, leading
to a reduction in PHRR at the beginning of burning. Since flax is
not an inert filler, it still contributes to oxygen consumption during
burning. Cracking of the char during later stages of combustion
FIGURE 14 The HRR curves of PP, PP‐30FLAX, and PP‐30FLAX‐25APP derived from A, Cone calorimeter, B, Rapid mass calorimeter,and C, PCFC. HRR, heat release rate; PCFC, pyrolysis combustion flowcalorimeter
RABE AND SCHARTEL 11

explains the formation of the second peak. Inclusion of the intumes-
cent flame‐retardant APP reduces the PHRR to around 40% than
that of PP‐30FLAX and changes the HRR curve yet again. As typical
for intumescent systems, the curve shows an initial rise in HRR, after
which the protective layer is formed. In contrast to the previously
observed PP‐APP systems, no second peak occurs in the system
PP‐30FLAX‐25APP. This plateau of steady burning results from a
compact intumescent layer, which is not prone to cracking. Because
of this flame‐retardancy effect, fuel can reach the flame only on the
area of transition from pyrolyzing material to combusted material
around the edges of the specimen.
The rapid mass calorimeter shows similar fire behavior under
forced flaming combustion conditions. However, neither the 2 peaks
for PP‐30FLAX nor the sharp initial peak from PP‐30FLAX‐25APP is
found in the HRR curves. Instead, added flax filler leads to a broaden-
ing of the peak, perhaps averaging and scaling down the HRR curve
monitored in the cone calorimeter. The same applies to the intumes-
cent system, in which instead of the initial peak and the relatively low
steady‐burning plateau, an even broader peak results with the rem-
nant of the initial peak in the form of a small shoulder with a subse-
quent plateau around the 60‐ to 70‐second mark.
The PCFC measurements show a reduction of 23% in HRC as well
as HR from pure PP to PP‐30FLAX. Addition of 25% APP leads to fur-
ther HRC reduction of 40% and HR reduction of 45%. The reductions
are mainly the result of the replacement of PP with additive. Flax fibers
alone were shown to decompose under equal conditions at a tempera-
ture of around 350°C.29 This decomposition step appears in the PCFC
HRR curve for PP‐30FLAX, whereas in PP‐30FLAX‐25APP, it is shifted
to lower temperatures and results in an elevation of the baseline until
decomposition of PP starts. The PCFCmeasurements alone do not pro-
vide significant representation of the flame‐retarding potential of flax
incorporated in a polymer like PP. Addition of the intumescence‐induc-
ing flame‐retardant APP increases performance in the PCFC, but results
do not allow for conclusions about the underlying mode of action.
All the comparisons discussed demonstrate that using
20 mm × 20 mm specimen, the rapid mass calorimeter still monitors
the macroscopic burning behavior of a plate specimen but deteriorated
particular by edge burning effects.
3.4 | Correlation between rapid mass calorimeterand cone calorimeter
Correlation coefficients between parameters (Table 5) derived from
rapid mass calorimeter and state‐of‐the‐art cone calorimeter were ana-
lyzed to yield insight into the significance and reliability of the results
and allow to detect and explain coherencies and differences between
the 2 methods. They also show which parameters are most suited for
comparison in a screening with the rapid mass calorimeter.
Since all parameters are derived over all of the 71 samples, many
different flame retardants and additives and their modes of action
were taken into consideration and provide a large variation. The corre-
lation coefficients provide a more statistical and general statement
about the significance and the reliability of reduced‐scale rapid mass
calorimeter results. This leads to a generalization of the method and
shows that the higher the correlation coefficient of a pair of parame-
ters, the greater the probability that the rapid mass calorimeter param-
eter is suitable for screening.
The PHRR in both methods, cone calorimeter and rapid mass cal-
orimeter, correlates strongly with each other over all specimens
(R = 0.88), flame retarded and nonflame retarded. In contrast, the
PCFC was shown to have a strong correlation between the HRC and
PHRR of the cone calorimeter only for pure polymers.28 Flame‐
retarded polymers, however, were not able to show even a marginal
correlation coefficient in the case of PCFC.31,32 An even stronger cor-
relation exists between the PHRR of cone calorimeter and fire growth
rate index (FIGRA) obtained by rapid mass calorimeter (R = 0.89),
because of the fact that the signals mostly occur in the shape of peaks.
Higher peaks will show a steeper rise, thus resulting in a higher FIGRA.
The times to ignition of both methods correlate strongly with each
other, showing proportionality in tig and specimen size. Cone calorim-
eter THE and the maximum average rate of heat emission from rapid
mass calorimeter give a correlation coefficient of moderate strength
(R = 0.82). Nevertheless, this correlation is stronger than that between
the THE in the 2 methods (R = 0.75).
The averaging parameters maximum average rate of heat emission
and HRRavg derived from the cone calorimeter (Figure 15) show
strong‐to‐moderate correlation with the PHRR (R = 0.87 and 0.84)
TABLE 5 Pearson correlation coefficients between rapid mass calorimeter and cone calorimeter
RAPID MASS CALORIMETER
PHRR tig THE FIGRA PHRR/tig FPI MARHE tb HRRavg b Mass Loss
Cone calorimetrer PHRR 0.88 0.43 0.41 0.89 0.27 ‐0.43 0.68 ‐0.47 0.79 ‐0.34 0.55
tig 0.37 0.88 0.02 0.31 ‐0.46 0.32 0.12 ‐0.47 0.42 ‐0.72 0.31
THE 0.75 0.04 0.75 0.61 0.64 ‐0.62 0.82 0.02 0.74 0.23 0.16
FIGRA 0.63 0.17 0.4 0.72 0.31 ‐0.47 0.56 ‐0.34 0.58 ‐0.2 0.53
PHRR/tig 0.71 ‐0.01 0.43 0.76 0.57 ‐0.61 0.68 ‐0.3 0.58 0.01 0.45
FPI ‐0.63 0.1 ‐0.58 ‐0.63 ‐0.6 0.72 ‐0.68 0.11 ‐0.59 ‐0.16 ‐0.37
MARHE 0.87 0.34 0.5 0.88 0.37 ‐0.52 0.77 ‐0.44 0.81 ‐0.24 0.53
tb ‐0.49 ‐0.57 ‐0.07 ‐0.55 0.2 0.05 ‐0.36 0.56 ‐0.5 0.53 ‐0.59
HRRavg 0.84 0.41 0.47 0.83 0.28 ‐0.45 0.72 ‐0.42 0.8 ‐0.29 0.52
b 0.84 0.39 0.48 0.83 0.3 ‐0.46 0.73 ‐0.41 0.79 ‐0.27 0.51
Mass Loss 0.65 0.13 0.25 0.7 0.34 ‐0.56 0.51 ‐0.54 0.55 ‐0.25 0.77
Abbreviations: tig: time to ignition, FPI: Fire Performance Index, tb: time of burning, HRRavg: average HRR from tig to flameout, b: b‐parameter.30
12 RABE AND SCHARTEL

and FIGRA (R = 0.88 and 0.83). This supports the assumption that the
small‐scale rapid mass calorimeter results depict an average over the
standard‐scale burning behavior and merge particular features from
the cone calorimeter HRR into a more generic curve shape.
3.5 | Correlation with oxygen index
Correlations with other fire tests were checked exemplarily to yield
insight into the relation between reduced‐scale fire tests under
forced flaming conditions and flammability tested against a small
flame. Oxygen index (OI) was chosen because of the availability of
the data. Previous work has shown different results regarding the
correlation between the PHRR measured in the cone calorimeter
and the OI.33,34 Overall, the OI of 22 of the materials investigated
was available, including the polycarbonate acrylonitrile butadiene sty-
rene and TPES formulations, PP/30FLAX with various flame retar-
dants, EP/Nanomer, and EP300K materials. Nonlinear fitting of the
data points led to a good accordance with the curve function of
Equation 1:
OI ¼ 17þ 3117PHRR
; R2 ¼ 0:92 (1)
Apart from slight deviations due to melt flow effects in OI exper-
iments, the results show surprisingly great correlation with R2 = 0.92
(Figure 16). A similar and good correlation was found between OI
and PHRR from the rapid mass calorimeter. Deviations are visible,
but most data points are located on and around the correlation curve
with the Equation 2 and an R2 of 0.89. Therefore rapid mass calorime-
ter may be used not only for estimating the performance in the cone
calorimeter test but also even for a more general assessment.
OI ¼ 12þ 3:92PHRR
; R2 ¼ 0:89 (2)
4 | CONCLUSION
In this work, the rapid mass calorimeter was introduced as a high‐
throughput screening method under forced flaming combustion and
put up for discussion. The effects of reducing specimen scale were
investigated especially with regard to key factors to ensure accelerated
testing with acceptable deterioration of the results. It was shown that
results obtained with the rapid mass calorimeter and a specimen size of
20 × 20 mm2 as a compromise between those 2 key factors allow for
interpretation in a similar fashion as standard‐sized samples measured
with the cone calorimeter. Different approaches and modes of action
of flame retardants and additives were considered to provide large
coverage over burning behavior scenarios.
The rapid mass calorimeter was proven to be an interesting and
promising tool for the assessment of high‐throughput screening of
flame‐retardant polymeric materials. Because of the reduction of
the specimens to 1/25th of a standard scale cone calorimeter speci-
men, material savings of 96% were achieved. Reduction of the mea-
surement time yielded around 60%‐70% savings in time, not
FIGURE 16 Correlation between OI and PHRR derived from A, Rapidmass calorimeter and B, cone calorimeterPHRR, peak heat release rateFIGURE 15 Correlations between MARHE from A, Cone calorimeter
and PHRR and FIGRA from B, Rapid mass calorimeter, respectively.FIGRA, fire growth rate index; MARHE, maximum average rate of heatemission; PHRR, peak heat release rate
RABE AND SCHARTEL 13

including the additional time savings because of the reduced calibra-
tion efforts.
ACKNOWLEDGEMENTS
Thanks go to everyone helping to build the rapid mass calorimeter, P.
Klack and T. Kukofka. Thanks to P. Klack also for his support at the
PCFC and cone calorimeter. Several companies and research institutes
are acknowledged for supporting us with samples, including ELKEM,
Bayer MaterialScience (now Convestro), BASF, University Freiburg,
TITK (Rudolstadt), and SKZ (Würzburg).
REFERENCES
1. Gilman JW, Bourbigot S, Shields JR, et al. High throughput methods forpolymer nanocomposites research: extrusion, NMR characterizationand flammability property screening. J Mater Sci 2003;38:4451–4460.
2. Wilkie CA, Chigwada G, Gilman JW, Lyon RE. High‐throughput tech-niques for the evaluation of fire retardancy. J Mater Chem2006;16:2023–2029.
3. Davis RD, Lyon RE, Takemori MT, Eidelman N. High throughput tech-niques for fire resistant materials development. In: Wilkie CA, MorganAB, eds. Fire Retardancy of Polymeric Materials. Second ed. Boca Raton,FL, USA: CRC press; 2010:421–451.
4. Gilman JW, Brassell LD, Davis RD, et al. Evaluation of iron carbonate asa flame retardant for polyolefins. In: Schartel B, ed. Advances in theFlame Retardancy of Polymeric Materials: Current perspectives presentedat FRPM'05. Germany: Books on Demand; 2007:131–140.
5. Chigwada G, Wilkie CA. Synergy between conventional phosphorusfire retardants and organically‐modified clays can lead to fireretardancy of styrenics. Polym Degrad Stab 2003;80:551–557.
6. Lyon RE, Walters RN. Pyrolysis combustion flow calorimetry. J AnalAppl Pyrolysis 2004;71:27–46.
7. Lyon RE, Walters RN, Stoliarov SI. Screening flame retardants for plas-tics using microscale combustion calorimetry. Polym Eng Sci2007;47:1501–1510.
8. Schartel B, Pawlowski KH, Lyon RE. Pyrolysis combustion flow calorim-eter: a tool to assess flame retarded PC/ABS materials? ThermochimActa 2007;462:1–14.
9. Plastics—simple heat release test using a conical radiant heater and athermopile detector. 1st ed. ISO 13927; 2001.
10. Reaction‐to‐fire tests—heat release, smoke production and mass lossrate. 3rd ed. ISO 5660‐1, 2015‐03.
11. Standard test method for determining flammability characteristics ofplastics and other solid materials using microscale combustion calorim-etry. ASTM D 7309; 2011.
12. Schartel B, Kunze R, Neubert D. Red phosphorus‐controlled decompo-sition for fire retardant PA 66. J Appl Polym Sci 2002;83:2060–2071.
13. Schartel B, Kunze R, Neubert D, Tidjani A. ZnS as fire retardant in plas-ticized PVC. Polym Int 2002;51:213–222.
14. Schartel B, Braun U, Schwarz U, Reinemann S. Fire retardancy of poly-propylene/flax blends. Polymer 2003;44:6241–6250.
15. Pawlowski KH, Schartel B. Flame retardancy mechanism of triphenylphosphate, resorcinol bis(diphenyl phosphate) and bisphenol Abis(diphenyl phosphate) in polycarbonate/acrylonitrile‐butadiene‐styrene blends. Polym Int 2007;56:1404–1414.
16. Braun U, Schartel B. Flame retardancy mechanisms of aluminiumphosphinate in combination with melamine cyanurate in glass‐fibre‐reinforced poly(1,4‐butylene terephthalate). Macromol Mater Eng2008;293:206–217.
17. Schartel B, Richter KH, Böhning M. Synergistic Use of Talc in Halogen‐free Flame Retarded Polycarbonate/Acrylonitrile‐Butadiene‐Styrene
Blends. In: Morgan AB, Wilkie CA, Nelson GL, eds. Fire and PolymersVI: New Advances in Flame Retardant Chamistry and Science. ACS sympo-sium series 1118. Washington, DC, USA: ACS; 2012 :15–36.chap. 2
18. Dittrich B, Wartig K‐A, Hofmann D, Mülhaupt R, Schartel B. Flameretardancy through carbon nanomaterials: carbon black, multiwallnanotubes, expanded graphite, multi‐layer grapheme and grapheme inpolypropylene. Polym Degrad Stab 2013;98:1495–1505.
19. Dittrich B, Wartig K‐A, Mülhaupt R, Schartel B. Flame‐retardancy prop-erties of intumescent ammonium poly(phosphate) and mineral fillermagnesium hydroxide in combination with graphene. Polymers2014;6:2875–2895.
20. Langfeld K, Wilke A, Sut A, et al. Halogen‐free fire retardant styrene‐ethylene‐butylene‐styrene‐based thermoplastic elastomers using syn-ergistic aluminum diethylphosphinate‐based combinations. J Fire Sci2015;33:157–177.
21. Braun U, Wachtendorf V, Geburtig A, Bahr H, Schartel B. Weatheringresistance of halogen‐free flame retardance in thermoplastics. PolymDegrad Stab 2010;95:2421–2429.
22. Gallo E, Schartel B, Braun U, Russo P, Acierno D. Fire retardant syner-gisms between nanometric Fe2O3 and aluminium phosphinate inpoly(butylene terephthalate). Polym Adv Technol 2011;22:2382–2391.
23. Schartel B, Schmaucks G. Flame retardancy synergism in polymersthrough different inert fillers' geometry. Polym Eng Sci 2017; doi:10.1002/pen.24485
24. Schartel B, Hull TR. Development of fire‐retarded materials—interpre-tation of cone calorimeter data. Fire Mater 2007;31:327–354.
25. Havlicek LL, Crane RD. Practical Statistics for the Physical Sciences.Washington, DC: American Chemical Society; 1988.
26. Lindolm J, Brink A, Hupa M. Influence of decreased sample size on conecalorimeter results. Fire Mater 2012;36:63–73.
27. Janssens M, Huczek J, Faw A. Effect of specimen size on test resultsobtained in the cone calorimeter. FLAME 2008 conf. proceedings,Stamford, CT, USA.
28. Lyon RE, Walters RN, Stoliarov SI. Thermal analysis of flammability. JTherm Anal Calorim 2007;89:441–448.
29. Sonnier R, Otazaghine B, Viretto A, Apolinario G, Ienny P. Improving theflame retardancy of flax fabrics by radiation grafting of phosphoruscompounds. Eur Polym J 2015;68:313–325.
30. Cleary TG, Fire Retardant Chemicals Association. Technical and mar-keting issues impacting the fire safety of building and constructionand home furnishings applications. Spring Conference. March 29‐April1, 1992, Orlando, FL, Lancaster, PA, USA: Technomic Publishing Co.;1992.
31. Lin TS, Cogen JM, Lyon RE. Correlations between microscale combus-tion calorimetry and conventional flammability tests for flameretardant wire and cable compounds. 56th International Wire & CableSymposium. Lake Buena Vista (Orlando), FL, USA; 2007.
32. Cogen JM, Lin TS, Lyon RE. Correlations between pyrolysis combus-tion flow calorimetry and conventional flammability tests withhalogen‐free flame retardant polyolefin compounds. Fire Mater2009;33:33–50.
33. Weil ED, Hirschler MM, Patel NG, Said MM, Shakir S. Oxygen index:correlations to other fire tests. Fire Mater 1992;16:159–167.
34. Schartel B. Uses of Fire Tests in Materials Flammability Development.In: Wilkie CA, Morgan AB, eds. Fire Retardancy of Polymeric Materials.2nd ed. Boca Raton, FL, USA: CRC press; 2010:421–451.
How to cite this article: Rabe S, Schartel B. The rapid mass
calorimeter: A route to high throughput fire testing. Fire and
Materials. 2017;0:1–14. https://doi.org/10.1002/fam.2420
14 RABE AND SCHARTEL

3.2 The rapid mass calorimeter: Understanding reduced-scale fire test results
48
3.2 The rapid mass calorimeter: Understanding reduced-
scale fire test results
Sebastian Rabe, Bernhard Schartel, Polymer Testing 2017, 57, 165-174.
https://doi.org/10.1016/j.polymertesting.2016.11.027
This article was accepted and published.
First author contribution:
Conceptualization of the working plan
Cone calorimeter and rapid mass calorimeter measurements
Collection, analysis and interpretation of the data
Generation of correlation coefficient matrices
Scientific discussion and conclusion
Writing of the outline and the final manuscript
Contributions from other authors:
Bernhard Schartel:
o Conceptualizing and writing of funding application
o Contribution to the scientific discussion
o Contribution to the concept of the manuscript

3.2 The rapid mass calorimeter: Understanding reduced-scale fire test results
49
Abstract: The effects of reducing specimen size on the fire behavior of polymeric materials
were investigated by means of the rapid mass calorimeter, a high-throughput screening
instrument. Results from the rapid mass calorimeter were compared with those from the cone
calorimeter. Correlation coefficients between the different measures of each method and
between the two methods are discussed to elucidate the differences and similarities in the two
methods. Materials with characteristic heat release rate (HRR) curves in the cone calorimeter
were evaluated in detail. The rapid mass calorimeter produces valuable and interpretable results
with HRR curve characteristics similar to cone calorimeter results. Compared to cone
calorimeter measurements, material savings of 96% are achieved, while maintaining the
advantages of a macroscopic fire test.

Test Method
The rapid mass calorimeter: Understanding reduced-scale fire testresults
Sebastian Rabe, Bernhard Schartel*
Bundesanstalt für Materialforschung und eprüfung (BAM), Unter den Eichen 87, 12205 Berlin, Germany
a r t i c l e i n f o
Article history:Received 18 October 2016Accepted 21 November 2016Available online 23 November 2016
Keywords:Rapid mass calorimeterHigh throughputCone calorimeterFlame retardancy
a b s t r a c t
The effects of reducing specimen size on the fire behavior of polymeric materials were investigated bymeans of the rapid mass calorimeter, a high-throughput screening instrument. Results from the rapidmass calorimeter were compared with those from the cone calorimeter. Correlation coefficients betweenthe different measures of each method and between the two methods are discussed to elucidate thedifferences and similarities in the two methods. Materials with characteristic heat release rate (HRR)curves in the cone calorimeter were evaluated in detail. The rapid mass calorimeter produces valuableand interpretable results with HRR curve characteristics similar to cone calorimeter results. Compared tocone calorimeter measurements, material savings of 96% are achieved, while maintaining the advantagesof a macroscopic fire test.
© 2016 Elsevier Ltd. All rights reserved.
1. Introduction
Modern polymeric materials are multicomponent systems.Many variables must be considered during the development of anovel material. Additives, plasticizers [1e3], adjuvants, synergists[4,5] and so forth can be varied in kind, concentration, particle sizedistribution [6,7] and other parameters, yielding an extensivematrix of possible systems. To assess the fire performance of theseformulations and to find the best performing material, highthroughput screening methods are essential. Until now, the per-formance of such materials in terms of fire behavior under flamingconditions has been evaluated with the cone calorimeter. For fastevaluation of fire performance, the pyrolysis combustion flowcalorimeter (PCFC, or microscale combustion calorimeter, MCC) hasbeen proposed [8]. While the cone calorimeter is a fire test using100 mm � 100 mm plates, the latter performs fast screening of thepyrolysis of specimens on the milligram scale. Macroscopic modesof action like the formation of protective layers, dripping, wickingand so forth, as well as flame inhibition, cannot be observed in thePCFC [9]. There is a pronounced dilemma between proper firetesting based on macroscopic specimen and accelerated testingdemanding reduction of the specimen size. The rapid mass calo-rimeter aims to reduce specimen size while maintaining fire testing
of a macroscopic specimen. The rapid mass calorimeter has beenproposed and discussed in a previous publication [10]. Selectedaccording to their characteristic heat release rate (HRR) curveshapes in the cone calorimeter, various sets of materials wereevaluated in the rapid mass calorimeter, and the results comparedwith those from the cone calorimeter to assess the value of rapidmass calorimeter testing.
Scale reduction is crucial if the forced-flaming combustion testis to be accelerated [11]. The rapid mass calorimeter should still beoperated on a macroscopic scale, limiting the minimum size towhich the specimens can be reduced. Changes in length scale andthickness of specimens alter the obtained fire properties dramati-cally [12e15]. Modes of action like heat and fuel transport barrierscreated from inert filler or from an intumescent system alsoshowed different performance [10]. Further flame retarding effectswere not as distinct in the rapid mass calorimeter as in the conecalorimeter. Therefore, the task is to reveal and understand thereasons for this divergent behavior. For this, correlation coefficientsderived from the heat release rate (HRR) of the rapid mass calo-rimeter and cone calorimeter results are elucidated; as well as thecorrelation coefficients of the results within each method. Thedifferences in correlation strength between the methods are dis-cussed, explaining effects that occur when specimen size is reducedto 20 mm � 20 mm. A set of 73 different materials was used,including a large number of flame retarded materials. Severalcharacteristic materials were selected to discuss the reduced sizeeffect in detail, particularly with respect to flame retardancy.
* Corresponding author.E-mail address: [email protected] (B. Schartel).
Contents lists available at ScienceDirect
Polymer Testing
journal homepage: www.elsevier .com/locate/polytest
http://dx.doi.org/10.1016/j.polymertesting.2016.11.0270142-9418/© 2016 Elsevier Ltd. All rights reserved.
Polymer Testing 57 (2017) 165e174

2. Experimental
2.1. Rapid mass calorimeter
The rapid mass calorimeter consists of a mass loss calorimeter(Fire Testing Technology, UK) equipped with a chimney withthermoelements to record the heat release rate (HRR) according toISO 13927 [16]. The balance has been replaced with a linear motionunit (Oriental Motor, JP) to facilitate semi-automatic sample ex-change. The 20 mm � 20 mm samples were wrapped in analuminum tray and placed on the center of the sample holder. Thedistance from sample surface to cone heater was 25 mm and theheat flux was 50 kW/m2. The setup and method were described indetail in a previous publication [10].
2.2. Cone calorimeter
Forced-flaming combustion tests were performed with a conecalorimeter (FTT, UK). Specimens 100 mm � 100 mm in size andencased in an aluminum tray were irradiated with a heat flux of50 kW/m2 at a distance of 25 mm. Thicknesses of the samplesranged from 3 mm to 10 mm. No retainer frame was used [17].
2.3. Correlation analysis
The results from bothmethods, rapidmass calorimeter and conecalorimeter, were checked for their Pearson R correlation co-efficients, within each method and also between the two methods.Pearson R values can range from ±1 for perfect linear correlation to0 for no correlation at all, as seen in Table 1 [18].
2.4. Materials
In total, 73 different polymeric materials (Table 2) weremeasured in the cone calorimeter and the rapid mass calorimeter.From those materials certain systematic series were selected forfurther evaluation and comparison. All investigated systems origi-nate from earlier projects and were provided by partners with highcompounding and processing competence [9,19e30].
3. Results and discussion
3.1. Comparison of correlation coefficients within each method
The rapid mass calorimeter allows for accelerated screening offlame retarded polymeric materials. The HRR is measured via thevoltage difference in the thermopile, and mass is recorded beforeand after the test with a separate balance. The test yields similarmeasures as the cone calorimeter test. To compare the character ofboth methods, correlation coefficients are evaluated either be-tween the measures of each method or between the measures ofboth methods.
Tables 3 and 4 clarify the similarity of both methods byproviding correlation coefficients of the HRR measurement results.
Results that correlate strongly in the cone calorimeter also showstrong correlation in the rapid mass calorimeter. In general, all ofthe tendencies of the correlation coefficients are the same. Thissimilar correlation pattern proves that the rapid mass calorimeterand cone calorimeter are strongly related tests. The time to ignitionshows no significant correlation at all, no matter the method withwhich the results were obtained, because tig is not directly relatedto any of the other fire properties. A flame retardant can achieve areduction of, e.g. PHRR or THE and prolong the time of burning, butmust not necessarily prolong the time to ignition of the material.
At first glance, rapid mass calorimeter HRR curves show a slope,a peak and a decay. The most important characteristic of a peak isits peak height. Flame retardants incorporated in a polymeric ma-terial serve to lower the peak height. PHRR and THE do not corre-late well with each other, which leads to the conclusion that addedflame retardants change more than just the peak height of the HRRcurve. In fact, HRR curves obtained with the rapid mass calorimetershow the same or similar characteristics as HRR curves from thecone calorimeter and thus can be interpreted similarly.
Values that show about the same correlation in both methodsare MARHE 4 THE, PHRR 4 HRRavg and MARHE 4 FIGRA. Therelation between MARHE and HRRavg shows strong correlationwith a coefficient of R ¼ 0.90 in the rapid mass calorimeter (Fig. 1),and is about the same strength in the cone calorimeter (R ¼ 0.97).This similarity shows that MARHE and HRRavg proportions aremainly unaffected by specimen size and method variation. Spec-imen size does not seem to alter the relation between these twomeasures very much.
Those averaged measures are also among the few that show anymoderate to strong correlation in the rapid mass calorimeter. Theycorrelate well mainly with PHRR, FIGRA and with each other. WhenHRRavg is calculated from rapid mass calorimeter HRR data, it willalways result in a value dependent on burning duration and PHRR.This explains the strong correlation coefficient values with PHRR(R¼ 0.90) and FIGRA (R¼ 0.83). Thesemeasures are also among thevalues that change most obviously in the rapid mass calorimeterresults when a flame retardant is integrated or its content varied ina polymeric material. Averaging the value of the HRR from the timeof ignition to flameout (HRRavg) is a tool to combine the completeburning behavior into a single value (see Fig. 2).
Correlations between FIGRA and PHRR as well as FIGRA andHRRavg are among the strongest when comparing measuresderived from the rapid mass calorimeter. Increasing peak heightdue to heavily burning specimens often results in a steeper slope ofthe recorded HRR curve. If a sample shows high flame retardantperformance, resulting in a low PHRR, the slope of the curve willalso be less steep. However, if the burning behavior of the inves-tigated specimen results in a HRR curve that shows not a distinctivepeak, but a rather wide plateau, this relation no longer applies. Agood correlation of HRR results over all testedmaterials is statisticalevidence for the significance of measurements with the rapid masscalorimeter. Correlation between measurement results of specific,coherent specimens are stronger, and show more clearly thatchanges in HRR values are consistent among sample series withsimilar characteristic curve shapes. Such stronger correlations dueto structure-property relationships are depicted for four differentsample series in Fig. 3. The sample sequence consisting of glassfiber reinforced PA66 with and without red phosphorus as a char-inducing flame retardant shows the strongest correlation be-tween FIGRA and PHRR, exhibiting a correlation coefficient ofR ¼ 0.99. Formulations with APP in PP also show a strong depen-dence of both values, while specimens with MDH and TRGO in PPcorrelate only marginally for the FIGRA and PHRR. The correlationin the PCABS sample series is weak at R ¼ 0.32. The single outlierthat lowers the correlation between FIGRA and PHRR was PCABS-
Table 1Correlation strength definition for the Pearson correlation coefficientR.
Correlation Strength Pearson R
Poor jRj < 0.40Weak 0.40 � jRj < 0.55Marginal 0.55 � jRj < 0.70Moderate 0.70 � jRj < 0.85Strong 0.85 � jRj
S. Rabe, B. Schartel / Polymer Testing 57 (2017) 165e174166
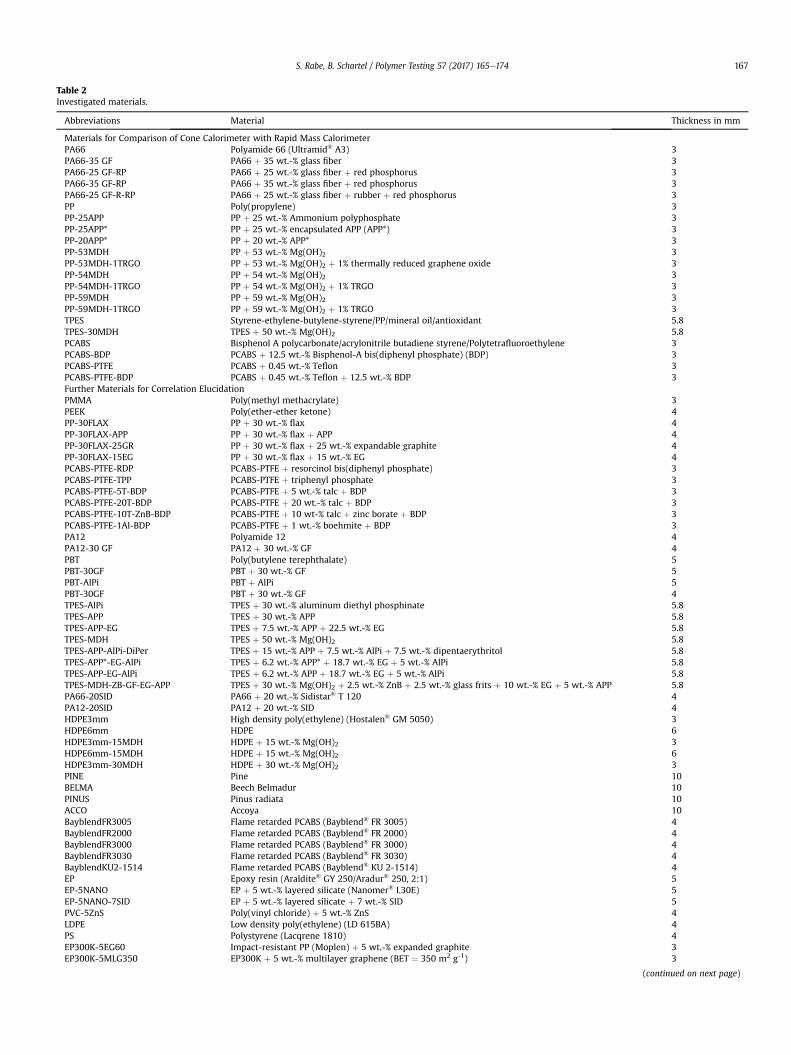
Table 2Investigated materials.
Abbreviations Material Thickness in mm
Materials for Comparison of Cone Calorimeter with Rapid Mass CalorimeterPA66 Polyamide 66 (Ultramid® A3) 3PA66-35 GF PA66 þ 35 wt.-% glass fiber 3PA66-25 GF-RP PA66 þ 25 wt.-% glass fiber þ red phosphorus 3PA66-35 GF-RP PA66 þ 35 wt.-% glass fiber þ red phosphorus 3PA66-25 GF-R-RP PA66 þ 25 wt.-% glass fiber þ rubber þ red phosphorus 3PP Poly(propylene) 3PP-25APP PP þ 25 wt.-% Ammonium polyphosphate 3PP-25APP* PP þ 25 wt.-% encapsulated APP (APP*) 3PP-20APP* PP þ 20 wt.-% APP* 3PP-53MDH PP þ 53 wt.-% Mg(OH)2 3PP-53MDH-1TRGO PP þ 53 wt.-% Mg(OH)2 þ 1% thermally reduced graphene oxide 3PP-54MDH PP þ 54 wt.-% Mg(OH)2 3PP-54MDH-1TRGO PP þ 54 wt.-% Mg(OH)2 þ 1% TRGO 3PP-59MDH PP þ 59 wt.-% Mg(OH)2 3PP-59MDH-1TRGO PP þ 59 wt.-% Mg(OH)2 þ 1% TRGO 3TPES Styrene-ethylene-butylene-styrene/PP/mineral oil/antioxidant 5.8TPES-30MDH TPES þ 50 wt.-% Mg(OH)2 5.8PCABS Bisphenol A polycarbonate/acrylonitrile butadiene styrene/Polytetrafluoroethylene 3PCABS-BDP PCABS þ 12.5 wt.-% Bisphenol-A bis(diphenyl phosphate) (BDP) 3PCABS-PTFE PCABS þ 0.45 wt.-% Teflon 3PCABS-PTFE-BDP PCABS þ 0.45 wt.-% Teflon þ 12.5 wt.-% BDP 3Further Materials for Correlation ElucidationPMMA Poly(methyl methacrylate) 3PEEK Poly(ether-ether ketone) 4PP-30FLAX PP þ 30 wt.-% flax 4PP-30FLAX-APP PP þ 30 wt.-% flax þ APP 4PP-30FLAX-25GR PP þ 30 wt.-% flax þ 25 wt.-% expandable graphite 4PP-30FLAX-15EG PP þ 30 wt.-% flax þ 15 wt.-% EG 4PCABS-PTFE-RDP PCABS-PTFE þ resorcinol bis(diphenyl phosphate) 3PCABS-PTFE-TPP PCABS-PTFE þ triphenyl phosphate 3PCABS-PTFE-5T-BDP PCABS-PTFE þ 5 wt.-% talc þ BDP 3PCABS-PTFE-20T-BDP PCABS-PTFE þ 20 wt.-% talc þ BDP 3PCABS-PTFE-10T-ZnB-BDP PCABS-PTFE þ 10 wt-% talc þ zinc borate þ BDP 3PCABS-PTFE-1Al-BDP PCABS-PTFE þ 1 wt.-% boehmite þ BDP 3PA12 Polyamide 12 4PA12-30 GF PA12 þ 30 wt.-% GF 4PBT Poly(butylene terephthalate) 5PBT-30GF PBT þ 30 wt.-% GF 5PBT-AlPi PBT þ AlPi 5PBT-30GF PBT þ 30 wt.-% GF 4TPES-AlPi TPES þ 30 wt.-% aluminum diethyl phosphinate 5.8TPES-APP TPES þ 30 wt.-% APP 5.8TPES-APP-EG TPES þ 7.5 wt.-% APP þ 22.5 wt.-% EG 5.8TPES-MDH TPES þ 50 wt.-% Mg(OH)2 5.8TPES-APP-AlPi-DiPer TPES þ 15 wt.-% APP þ 7.5 wt.-% AlPi þ 7.5 wt.-% dipentaerythritol 5.8TPES-APP*-EG-AlPi TPES þ 6.2 wt.-% APP* þ 18.7 wt.-% EG þ 5 wt.-% AlPi 5.8TPES-APP-EG-AlPi TPES þ 6.2 wt.-% APP þ 18.7 wt.-% EG þ 5 wt.-% AlPi 5.8TPES-MDH-ZB-GF-EG-APP TPES þ 30 wt.-% Mg(OH)2 þ 2.5 wt.-% ZnB þ 2.5 wt.-% glass frits þ 10 wt.-% EG þ 5 wt.-% APP 5.8PA66-20SID PA66 þ 20 wt.-% Sidistar® T 120 4PA12-20SID PA12 þ 20 wt.-% SID 4HDPE3mm High density poly(ethylene) (Hostalen® GM 5050) 3HDPE6mm HDPE 6HDPE3mm-15MDH HDPE þ 15 wt.-% Mg(OH)2 3HDPE6mm-15MDH HDPE þ 15 wt.-% Mg(OH)2 6HDPE3mm-30MDH HDPE þ 30 wt.-% Mg(OH)2 3PINE Pine 10BELMA Beech Belmadur 10PINUS Pinus radiata 10ACCO Accoya 10BayblendFR3005 Flame retarded PCABS (Bayblend® FR 3005) 4BayblendFR2000 Flame retarded PCABS (Bayblend® FR 2000) 4BayblendFR3000 Flame retarded PCABS (Bayblend® FR 3000) 4BayblendFR3030 Flame retarded PCABS (Bayblend® FR 3030) 4BayblendKU2-1514 Flame retarded PCABS (Bayblend® KU 2-1514) 4EP Epoxy resin (Araldite® GY 250/Aradur® 250, 2:1) 5EP-5NANO EP þ 5 wt.-% layered silicate (Nanomer® I.30E) 5EP-5NANO-7SID EP þ 5 wt.-% layered silicate þ 7 wt.-% SID 5PVC-5ZnS Poly(vinyl chloride) þ 5 wt.-% ZnS 4LDPE Low density poly(ethylene) (LD 615BA) 4PS Polystyrene (Lacqrene 1810) 4EP300K-5EG60 Impact-resistant PP (Moplen) þ 5 wt.-% expanded graphite 3EP300K-5MLG350 EP300K þ 5 wt.-% multilayer graphene (BET ¼ 350 m2 g-1) 3
(continued on next page)
S. Rabe, B. Schartel / Polymer Testing 57 (2017) 165e174 167

PTFE. In the rapid mass calorimeter the slope of the HRR curvebecame larger while the PHRR decreased. This explains the outlierfound in that particular example. The PP-MDH-TRGO sample seriesactually shows strong correlation when divided into two groups,with and without TRGO as an adjuvant. When TRGOwas added to aPP-MDH formulation, the rapid mass calorimeter HRR curves weredecreased in PHRR with increasing MDH load, but the slope of the
curve decreased at a different rate than it did without TRGO. Thisanalysis shows that curve shape and burning behavior stronglyinfluence the FIGRA and the PHRR, which makes them the mostimportant values in describing and comparing rapid mass calo-rimeter results.
3.2. Correlations between rapid mass calorimeter and conecalorimeter results
Comparing the results of both the cone calorimeter and rapidmass calorimetermethod allows a statement about the reliability ofresults obtained with the rapid mass calorimeter (see Table 5).
Calculation of the average rate of heat emission (ARHE) has theeffect that cone calorimeter HRR curves are always reduced to anaverage curve, which has less pronounced peaks and often only one
Table 2 (continued )
Abbreviations Material Thickness in mm
PS4 Flame retarded polystyrene (FR 3180) 3MERANTI Shorea bracteolata 10CHIP Chipboard 10WOOD Pine sapwood 5
Table 3Coefficients of correlations among results derived from the rapid mass calorimeter.PHRR: peak of heat release rate, tig: time of ignition, THE: total heat evolved, FIGRA:fire growth rate index, MARHE: maximum average rate of heat emission, HRRavg:average heat release rate from time of ignition to time of flameout.
Rapid Mass Calorimeter
PHRR tig THE FIGRA MARHE HRRavg
RAPID MASSCALORIMETER
PHRR 1.00tig 0.44 1.00THE 0.55 �0.03 1.00FIGRA 0.92 0.33 0.47 1.00MARHE 0.85 0.16 0.77 0.79 1.00HRRavg 0.90 0.49 0.64 0.83 0.90 1.00
Table 4Correlation coefficients of results derived from the cone calorimeter. PHRR: peak ofheat release rate, tig: time of ignition, THE: total heat evolved, FIGRA: fire growth rateindex, MARHE: maximum average rate of heat emission, HRRavg: average heatrelease rate from time of ignition to time of flameout.
Cone Calorimeter
PHRR tig THE FIGRA MARHE HRRavg
CONE CALORIMETER PHRR 1.00tig 0.38 1.00THE 0.65 0.05 1.00FIGRA 0.82 0.08 0.43 1.00MARHE 0.95 0.28 0.73 0.81 1.00HRRavg 0.93 0.36 0.71 0.76 0.97 1.00
Fig. 1. Correlation between MARHE and HRRavg from the rapid mass calorimeter.Fig. 2. Relationships between rapid mass calorimeter results for MARHE and PHRR (a)and FIGRA and PHRR (b).
S. Rabe, B. Schartel / Polymer Testing 57 (2017) 165e174168

maximum, no matter how many local maxima were found in theHRR curve. Due to the fact that the rapid mass calorimeter HRRcurves show only one maximum, the strong correlation betweenMARHE from the cone calorimeter and PHRR as well as FIGRA isexplained. Fig. 4 depicts the correlations of the whole set ofmeasured materials compared to single material series. The overallcorrelation between the MARHE from the cone calorimeter and thePHRR derived from the rapid mass calorimeter is already strong,with a coefficient of R ¼ 0.86. Evaluating a particular sample series
provides information about how well the assumption fits thatARHE curves from cone calorimeter results become similar to rapidmass calorimeter HRR curves. In most cases the correlation co-efficients grow even stronger. The samples series consisting of glassfiber reinforced PA66 with and without red phosphorus shows acoefficient of R ¼ 0.95, while PCABS with and without PTFE or BDPand the combination of both correlate with each other with a co-efficient of R ¼ 0.99. Both series show characteristic HRR curveswhen measured in the cone calorimeter, which are summarizedinto ARHE curves showing behavior similar to reduced-scale HRRcurves in the rapid mass calorimeter. PP filled with magnesiumhydroxide shows strong correlations when split in two groups: onewith, and one without the addition of 1 wt.-% of the adjuvant TRGO(R ¼ 0.89 and R ¼ 1.00, respectively).
The HRRavg shows similar behavior as regards to the correlationwith the PHRR from rapid mass calorimeter results (Fig. 5). With acoefficient of R ¼ 0.88, only the sample series consisting of thedifferent PP-APP formulations shows a better correlation whencompared to the cone calorimeter MARHE. This analysis shows thatthe rapid mass calorimeter and cone calorimeter results are in verygood accordance. The averaging HRR results like MARHE andHRRavg are most important when comparing results of bothmethods. A more detailed evaluation of the differences in burningbehavior and HRR measurement results between the cone calo-rimeter and the rapid mass calorimeter is elucidated in section 3.3.
3.3. Comparison of heat release rate curve forms from the conecalorimeter and the rapid mass calorimeter
The distinct materials shown in Table 6 were analyzed in detailto provide insight into how the burning behavior and the HRRcurve shape change for different sample sizes.
Fig. 6 displays the typical HRR curve form for a glass fiber filledpolymer in the cone calorimeter, e.g. PA66-35 GF. The polymermatrix is consumed in the fire until a sufficient amount of glassfiber is left over, forming a protective glass fiber mat on top of thespecimen. This impedes the transport of heat from the flame to thepyrolysis zone, resulting in a plateau after the PHRR in the HRRcurve. Addition of red phosphorus as a char-inducing flame retar-dant in PA66 results in a lowering of the PHRR and a significantprolongation of burning time. The HRR curve is typical for charringburning behavior. When the amount of glass fiber was reducedfrom 35 to 25 wt.-%, a slight deterioration in PHRR and in the height
Fig. 3. Correlation between rapid mass calorimeter PHRR and FIGRA for all testedmaterials, and specifically for PA66(-GF)(-FR), PP-APP, PCABS(-X) and PP-MDH-TRGO.
Table 5Correlation coefficients for selected measures.
Rapid Mass Calorimeter
PHRR tig THE FIGRA MARHE HRRavg
Cone Calorimeter PHRR 0.88 0.43 0.41 0.89 0.68 0.79tig 0.37 0.88 0.02 0.31 0.12 0.42THE 0.75 0.04 0.75 0.61 0.82 0.74FIGRA 0.63 0.17 0.40 0.72 0.56 0.58MARHE 0.87 0.34 0.50 0.88 0.77 0.81HRRavg 0.84 0.41 0.47 0.83 0.72 0.80
Fig. 4. Correlation between MARHE from the cone calorimeter and PHRR from therapid mass calorimeter for all measured formulations and the specific systematicsequences.
Fig. 5. Correlation between the cone calorimeter HRRavg and PHRR from the rapidmass calorimeter.
S. Rabe, B. Schartel / Polymer Testing 57 (2017) 165e174 169

of the steady burning phase was observed. In total, the differencesof the two formulations flame retarded with red phosphorus areonly marginal when looking at the HRR curves in cone calorimetermeasurements. Their burning behaviors are similar [19].
Reduced-scale measurements in the rapid mass calorimetershow interesting results, which allow for similar interpretation. Theformulation without red phosphorus, PA66-35 GF, shows thehighest PHRR and the shortest burning time. However, it shows ashoulder prior to the PHRR, which indicates the effect of the glassfiber mat. In contrast to the cone calorimeter results, the peak oc-curs after the shoulder because the protection effect is over-shadowed by edge burning effects. Fuel transport occurs throughthe edges of the glass fibermat. The addition of red phosphorus alsoresults in a different HRR curve than was observed in the conecalorimeter. The shoulder prior to the peak HRR is now moredistinct and the overall burning time is greatly prolonged. Reduc-tion of the amount of glass fiber filler, however, increases the PHRRin a similar way as in the cone calorimeter experiments. Theshoulder is much less pronounced with 10 wt.-% less inert filler,which leads to a much better differentiation of the two formula-tions in the rapid mass calorimeter experiments than in the conecalorimeter.
PP-APP formulations show the typical HRR curve behavior whenmeasured in the cone calorimeter, as shown in Fig. 7. The initialpeak after ignition, the decrease in HRR and the subsequent for-mation of the PHRR are characteristic for many intumescent sys-tems. This sample series shows the influence of encapsulation andthe reduction of APP loading by 5wt.-%. Encapsulation alone resultsin an increased flame retardancy performance, by prolonging notonly the overall burning time, but also the time to cracking of theprotection layer. The PHRR as well as the height of the initial peakwere reduced. Comparing PP-25APP* with PP-20APP* shows thateven with reduced APP load the effect of encapsulation ensures alower PHRR. Nevertheless, the THE of PP-20APP* is the highest of allthree formulations.
When measured in the rapid mass calorimeter, the three intu-mescent PP-APP systems show a different order of fire performanceranking on first glance. Comparing the PHRR of the systems aloneleads to the assumption that PP-20APP* shows a higher PHRR andthus worse performance than PP with 25 wt.-% of non-encapsulated APP. PP-25APP and PP-25APP*, however, show asimilar ranking in fire performance as in the cone calorimeter whenlooking at the PHRR. The HRRavg values of the cone calorimeterresults are similar to the PHRR values from the rapid mass
calorimeter in terms of their relative differences and their order.The highest HRRavg value is found in the PP-20APP* system, fol-lowed by the formulation with APP, namely PP-25APP. PP-25APP*shows the lowest HRRavg in the cone calorimeter. This coincides
Table 6Cone calorimeter and rapid mass calorimeter results for the formulations examined in detail.
Sample Cone Calorimeter Rapid Mass Calorimeter
PHRR/kW/m2 THE/MJ/m2 Residue/wt.-% PHRR/W THE/kJ Residue/wt.-%
PA66 1509 ± 10 100 ± 2 0 1102 ± 27 35 ± 1 0PA66-35 GF 582 ± 3 80 ± 1 34 377 ± 25 15 ± 1 28PA66-25 GF-FR 322 ± 15 74 ± 1 12 253 ± 5 19 ± 1 41PA66-35 GF-FR 299 ± 10 66 ± 2 43 233 ± 15 12 ± 1 35PA66-25 GF-R-FR 326 ± 2 71 ± 1 11 223 ± 9 10 ± 1 21PP 2349 ± 90 123 ± 2 0 1252 ± 90 63 ± 2 0PP-25APP 345 ± 14 95 ± 2 16 373 ± 34 20 ± 1 17PP-25APP* 260 ± 20 93 ± 4 16 370 ± 34 24 ± 2 17PP-20APP* 288 ± 4 101 ± 1 8 411 ± 38 22 ± 1 17PP-54MDH 219 ± 2 80 ± 1 14 244 ± 11 15 ± 1 67PP-54MDH-1TRGO 205 ± 4 80 ± 1 15 151 ± 5 17 ± 1 45TPES 2346 ± 140 215 ± 4 0 779 ± 6 29 ± 1 0TPES-50MDH 191 ± 1 151 ± 2 28 198 ± 12 44 ± 2 48PCABS 607 ± 30 68 ± 1 6 336 ± 15 9 ± 1 7PCABS-BDP 378 ± 38 60 ± 1 4 320 ± 16 10 ± 1 6PCABS-PTFE 424 ± 42 64 ± 2 6 315 ± 15 14 ± 1 7PCABS-PTFE-BDP 294 ± 28 57 ± 1 6 270 ± 15 12 ± 1 7
Fig. 6. Typical HRR curve behavior of an intermediate thick inert filler thermoplastic(PA66-35 GF) and added char-inducing flame retardant red phosphorus (PA66-25 GF-FR and PA66-35 GF-FR) in the cone calorimeter (a) and the rapid mass calorimeter (b).
S. Rabe, B. Schartel / Polymer Testing 57 (2017) 165e174170

with the PHRR values of the rapid mass calorimeter measurementsand serves as proof that the rapid mass calorimeter HRR curves areactual representations of averaged cone calorimeter curves.
PCABS shows a distinct peak at the beginning of the HRR curvein cone calorimeter measurements, after which a second, broaderpeak of around 250 kW/m2 is reached. The addition of the anti-dripping agent PTFE lowers the PHRR to 67% and creates aplateau of steady burning between both peaks of around 150 kW/m2. The time of burning is increased by around 150 s due to thechar-inducing effect of PTFE [22]. The flame retardant BDP in PCABSprolongs the time to ignition, decreases the FIGRA and lowers thePHRR to around 63%. Furthermore, it leads to a broadening of thefirst peak and a reduction in burning time.
Both additives together cause a reduction of PHRR to 50% as wellas a decrease in both the height and length of the steadily burningplateau in PCABS. The HRR curves are shown in Fig. 8 [9].
This example demonstrates the combined effect of charring andflame inhibition, exhibiting a characteristic HRR curve with itshighest peak in the beginning, a phase of steady burning and asmaller peak shortly before flameout. The trends that were iden-tified in the cone calorimeter forced-flaming tests also occurred inthe rapid mass calorimeter when samples 20 mm � 20 mm in sizewere used. PCABS treated only with BDP has a slightly lower PHRRthan PCABS with PTFE while the incorporation of both additivesleads to the strongest decrease. Additionally, the HRR curves of thesystems containing PTFE show a broadening of the peak, similar to
the cone calorimeter tests, where a plateau of steady burning wasintroduced. This supports the hypothesis that testing under forced-flaming conditions on a smaller scale depicts an average of thecharacteristics shown by an HRR curve from the cone calorimeter.However, the trends in time to ignition show different results in therapid mass calorimeter than in the cone calorimeter. In the conecalorimeter tests, time to ignition was prolonged when PTFE, BDP,or both were added. The rapid mass calorimeter scale showed areduction in tig when PTFE or BDP was added. Comparison of theARHE curves from cone calorimeter measurements (Fig. 9) and theheat release rates from the reduced-scale rapid mass calorimeterreveals similarities in their maximums. The non-flame retardedPCABS has the highest MARHE value in the cone calorimeter as wellas the highest PHRR observed in the rapid mass calorimeter. TheMARHE value from results of PCABS-PTFE is greater than of PCABS-BDP, and the combination of both PTFE and BDP in PCABS has thelowest MARHE. The same order reappears in the PHRR values ofreduced-scale measurements in the rapid mass calorimeter. TheARHE also gives clearer insight into the differences in performancedue to the rather complicated HRR curves, and is thus a suitablecriterion to compare these particular materials.
The PHRR of polypropylene is reduced significantly, by over 90%,when combinedwith 54wt.-% of magnesium hydroxide (Fig.10). Itsburning behavior changed such that it yields a characteristic HRR
Fig. 7. HRR and ARHE curves of an intumescent system (PP-APP) from the conecalorimeter (a) and HRR curve from the rapid mass calorimeter (b). Fig. 8. HRR curves of PCABS, PCABS flame retarded with BDP, PCABS with PTFE as an
anti-dripping agent and the combination of both derived from a) cone calorimeter andb) rapid mass calorimeter.
S. Rabe, B. Schartel / Polymer Testing 57 (2017) 165e174 171

curve. It consists of two peaks of about the same height, occurringat the beginning and at the end of burning, with a stretched localminimum in between. The high amount of mineral filler not onlyreduces the amount of polymer matrix consumed as fuel by theflame, but also releases water during the burning process, which
dilutes and cools down the flame. An increase in the HRR shortlybefore flameout occurs due to the fact that the pyrolysis front hasmoved so far that the sample can now be considered thermallythin. Addition of only 1 wt.-% TRGO causes only a small reduction inPHRR, but decreases the height of the steady burning phase andincreases its duration as well as the burning time in general [25].
The difference in the intensity of the HRR curves between PPand the other two formulations in the rapid mass calorimeter areclearly recognizable. While PP shows a very sharp and intense peak,the flame retarded formulations are strongly reduced in height. Infact, PHRR is reduced to 22 and 14%, respectively. This leads to asmall but still distinguishable difference in PHRR between the twoformulations, containing and lacking 1 wt.-% of the adjuvant TRGO.This enables even small changes in HRR to be evaluated on thesmall scale of the rapid mass calorimeter samples. However, theadvantages of adding 1 wt.-% of TRGO to the system of 54 wt.-%MDH in PP do not become as clear in the rapid mass calorimeter asthey do in the cone calorimeter. A simple calculation was made inorder to confirm the conclusion that HRR curves are compressedwhen going from cone calorimeter samples to the reduced spec-imen size in the rapid mass calorimeter. The reduction in PHRRbetween the formulation with only 54 wt.-% MDH and the systemwith added TRGO in the rapid mass calorimeter is 35%. This equalsexactly the reduction of HRRavg between both materials in thecone calorimeter.
TPES shows a dramatic change in burning behavior monitoredby the cone calorimeter when 50 wt.-% of MDH are incorporated(Fig. 11). The characteristically strong slope in HRR at the beginningof the burning remains, but as soon as the temperature is reached atwhich MDH releases water into the gas phase and thus dilutes theflame, the HRR decreases again. The PHRR is reduced drastically toless than 10% and burning time is prolonged significantly fromaround 200 s to more than 1200 s. In contrast to the PP-MDHsystems discussed above, TPES-50MDH does not show a secondpeak at the end of burning; the HRR curve is more of a classicexample of a constant heat release decay when a mineral filler isincluded.
HRR results from the rapidmass calorimeter for the TPES showastrong slope and an abrupt decay similar to cone calorimeter tests.When 50 wt.-% of the mineral filler are added, curve behavior startsto differ from the tests. Instead of maintaining the strong HRR in-crease in the beginning, the HRR shows a rather weak slope.However, upon reaching the PHRR, the reduced-size sample un-dergoes a slow decay in HRR similar to that of the100 mm � 100 mm specimen. The PHRR is decreased to about 25%and allows the assertion that significant PHRR reductions areobserved in the rapid mass calorimeter.
3.4. Comparison of fire performance between the rapid masscalorimeter and cone calorimeter
Following the approach of Lopez-Cuesta et al. [31], sample seriesconsisting of polymeric materials and their flame retarded equiv-alents were pictured in a performance ratio plot (Fig. 12). R1 standsfor the ratio between the PHRR of the flame retardedmaterial to thePHRR of the material in the rapid mass calorimeter, while R2 iscalculated by dividing the PHRR of the flame retarded material bythe PHRR of the material in the cone calorimetermeasurements. Allof the data points are located above the ideal correlation line. Thismeans that the PHRR reduction is more apparent in the conecalorimeter than in the rapid mass calorimeter. The only reason forthis divergent behavior is the reduced sample size and thus theincrease in edge burning effect. To prove this, HDPE with 30 wt.-%of MDH and a thickness of 3 mm, HDPE with 15 wt.-% MDH and athickness of 6 mm, and their respective non-flame retarded
Fig. 9. ARHE curves of the investigated PCABS formulations from the cone calorimeter.
Fig. 10. Characteristic HRR curve obtained with the cone calorimeter (a) showing apeak at the beginning and at the end of burning respectively, and the rapid masscalorimeter (b).
S. Rabe, B. Schartel / Polymer Testing 57 (2017) 165e174172

counterparts were varied in size and measured in the rapid masscalorimeter. Calculating the performance ratios of the respectivePHRR values reveals that with increasing sample size, the datapoints approach the line of ideal correlation (Fig. 12). The effectslike edge burning, which accompany a reduction in sample size,decreased and the fire performance of a material in the rapid masscalorimeter approximates the performance in the cone calorimeter.Modes of action like flame inhibition and the effect of a protectionlayer are detectable in the rapid mass calorimeter.
4. Conclusion
The reduced-scale measurements show many similarities withresults from the cone calorimeter. The change in length scale whilemaintaining the same thickness and using another mode of heatrelease recording has vast consequences for the obtained results. Itwas demonstrated that the rapid mass calorimeter is both a ver-satile screening tool and a method to investigate burning behavior.Comparing the correlation coefficients of HRR values from eachmethod shows a more or less strong peculiarity of certain mea-sures, and thus is used to render the character of the rapid masscalorimeter more clearly. Additionally, correlations between themethods, especially regarding specific sample series, yield infor-mation about how certain curve forms change when the samplesize is reduced. The combination of both the correlation over all
formulations as a statistical approach, and over specific systematicseries of samples, helps clarify the similarities between the conecalorimeter and the rapid mass calorimeter, and shows how thetwo tests are related. Performance correlations indicated a lesspronounced performance effect of a flame retardant in a polymericmaterial in the rapidmass calorimeter than in the cone calorimeter.This was proven to depend solely on the sample size, and is not aresult of changes in measurement conditions.
Acknowledgements
This research did not receive any specific grant from fundingagencies in the public, commercial, or not-for-profit sectors. Wewould like to acknowledge our sample providers, flame retardedand non-flame retarded, inter alia ELKEM, Bayer MaterialScience(now Convestro), BASF, University Freiburg, TITK (Rudolstadt), andSKZ (Würzburg). Thanks also go to P. Klack for helping set up therapid mass calorimeter.
References
[1] M.P. Stevens, Polymer additives: Part I. Mechanical property modifiers,J. Chem. Educ. 70 (6) (1993) 444.
[2] M.P. Stevens, Polymer additives: II. Chemical and aesthetic property modifiers,J. Chem. Educ. 70 (7) (1993) 535.
Fig. 12. Ratio correlation of PHRR from both methods. The plot shows the ratio ofPHRR of non-flame retarded material to flame retarded material in the rapid masscalorimeter (R1) over the cone calorimeter (R2).
Fig. 11. Cone calorimeter (a) and rapid mass calorimeter (b) HRR curves of TPES andTPES with added mineral filler showing the typical characteristic curve form in thecone calorimeter.
S. Rabe, B. Schartel / Polymer Testing 57 (2017) 165e174 173

[3] M.P. Stevens, Polymer additives: III. Surface property and processing modi-fiers, J. Chem. Educ. 70 (9) (1993) 713.
[4] E.D. Weil, S.V. Levchik, Flame retardants for polystyrenes in commercial use ordevelopment, J. Fire Sci. 25 (2007) 241e265.
[5] E.D. Weil, S.V. Levchik, Flame retardants in commercial use or developmentfor polyolefins, J. Fire Sci. 26 (2008) 5e43.
[6] P. Hughes, G.V. Jackson, R.N. Rothon, Particle morphology effects on theperformance of PMMA filled with aluminium hydroxide in a variety of firetests, Makromol. Chem. Macromol. Symp. 74 (1) (1993) 179e183.
[7] H. Huang, M. Tian, W. Liang, L. Zhang, Effect of particle size on flame retard-ancy of Mg(OH)2-filled ethylene vinyl acetate copolymer composites, J. Appl.Polym. Sci. 100 (6) (2006) 4461e4469.
[8] R.E. Lyon, R.N. Walters, Pyrolysis combustion flow calorimetry, J. Anal. Appl.Pyrolysis 71 (1) (2004) 27e46.
[9] B. Schartel, K.H. Pawlowski, R.E. Lyon, Pyrolysis combustion flow calorimeter:a tool to assess flame retarded PC/ABS materials? Thermochim. Acta 462 (1)(2007) 1e14.
[10] S. Rabe, B. Schartel, The Rapid Mass Calorimeter: a route to high throughputfire testing, Fire Mater., (2016) (accepted).
[11] C.A. Wilkie, G. Chigwada, J.W. Gilman, R.E. Lyon, High-throughput techniquesfor the evaluation of fire retardancy, J. Mater. Chem. 16 (2006) 2023e2029.
[12] J. Lindholm, A. Brink, M. Hupa, Influence of decreased sample size on conecalorimeter results, Fire Mater 36 (1) (2012) 63e73.
[13] V. Babrauskas, in: P.J. DiNenno, D. Drysdale, C.L. Beyler, W.D. Walton,R.L.P. Custer, J.R. Hall Jr., J.M. Watts Jr. (Eds.), Heat Release Rates. The SFPEHandbook of Fire Protection Engineering, third ed., National Fire ProtectionAssociation, Inc, 2002, pp. 3e8.
[14] S.J. Ritchie, K.D. Steckler, A. Hamins, T.G. Cleary, J.C. Yang, T. Kashiwagi. Theeffect of sample size on the heat release rate of charring materials, in: FireSafety Science e Proceedings of the Fifth International Symposium, Mel-bourne, (1997). 177e188.
[15] M. Janssens, J. Huczek, A. Faw. Effect of specimen size on test results obtainedin the cone calorimeter, in: Proceedings of the BCC Conference on FlameRetardancy, Norwalk, CT, (2008).
[16] Plastics e Simple heat release test, Plastics e Simple Heat Release Test Using aConical Radiant Heater and a Thermopile Detector, ISO 13927, first ed., 2001.
[17] Reaction-to-fire tests e Heat release, Smoke Production and Mass Loss Rate,ISO 5660e1, third ed., 2015-03.
[18] L.L. Havlicek, R.D. Crane, Practical Statistics for the Physical Sciences, AmericanChemical Society, Washington, DC, 1988.
[19] B. Schartel, R. Kunze, D. Neubert, Red phosphorus-controlled decompositionfor fire retardant PA 66, J. Appl. Polym. Sci. 83 (10) (2002) 2060e2071.
[20] B. Schartel, R. Kunze, D. Neubert, A. Tidjani, ZnS as fire retardant in plasticizedPVC, Polym. Int. 51 (3) (2002) 213e222.
[21] B. Schartel, U. Braun, U. Schwarz, S. Reinemann, Fire retardancy of poly-propylene/flax blends, Polymer 44 (20) (2003) 6241e6250.
[22] K.H. Pawlowski, B. Schartel, Flame retardancy mechanism of triphenyl phos-phate, resorcinol bis(diphenyl phosphate) and bisphenol A bis(diphenylphosphate) in polycarbonate/acrylonitrile-butadiene-styrene blends, Polym.Int. 56 (11) (2007) 1404e1414.
[23] U. Braun, B. Schartel, Flame retardancy mechanisms of aluminium phosphi-nate in combination with melamine cyanurate in Glass-Fibre-Reinforcedpoly(1,4-butylene terephthalate), Macromol. Mater. Eng. 293 (3) (2008)206e217.
[24] B. Schartel, K.H. Richter, M. B€ohning, Synergistic use of talc in Halogen-freeFflame retarded polycarbonate/acrylonitrile-butadiene-styrene blends, ACSSymposium Series 1118, in: A.B. Morgan, C.A. Wilkie, G.L. Nelson (Eds.), Fireand Polymers VI: New Advances in Flame Retardant Chemistry and Science,ACS, Washington, DC, USA, 2012, pp. 15e36. chap. 2.
[25] B. Dittrich, K.A. Wartig, D. Hofmann, R. Mülhaupt, B. Schartel, Flame retard-ancy through carbon nanomaterials: carbon black, multiwall nanotubes,expanded graphite, multi-layer grapheme and grapheme in polypropylene,Polym. Degrad. Stab. 98 (8) (2013) 1495e1505.
[26] B. Dittrich, K.A. Wartig, R. Mülhaupt, B. Schartel, Flame-retardancy Propertiesof intumescent ammonium poly(Phosphate) and mineral filler magnesiumhydroxide in combination with graphene, Polymers 6 (11) (2014) 2875e2895.
[27] K. Langfeld, A. Wilke, A. Sut, S. Greiser, B. Ulmer, V. Andrievici, P. Limbach,M. Bastian, B. Schartel, Halogen-free fire retardant styrene-ethylene-butylene-styrene-based thermoplastic elastomers using synergisticaluminum diethylphosphinate-based combinations, J. Fire Sci. 33 (2) (2015)157e177.
[28] U. Braun, V. Wachtendorf, A. Geburtig, H. Bahr, B. Schartel, Weatheringresistance of halogen-free flame retardance in thermoplastics, Polym. Degrad.Stab. 95 (12) (2010) 2421e2429.
[29] E. Gallo, B. Schartel, U. Braun, P. Russo, D. Acierno, Fire retardant synergismsbetween nanometric Fe2O3 and aluminium phosphinate in poly(butyleneterephthalate), Polym. Adv. Technol. 22 (12) (2011) 2382e2391.
[30] B. Schartel, G. Schmaucks. Flame retardancy synergism in polymers throughdifferent inert fillers' geometry, Polym. Eng. Sci. (in press), http://dx.doi.org/10.1002/pen.24485.
[31] R. Sonnier, L. Ferry, C. Longuet, F. Laoutid, B. Friederich, A. Laachachi, J.-M. Lopez-Cuesta, Combining cone calorimeter and PCFC to determine themode of action of flame-retardant additives, Polym. Adv. Technol. 22 (7)(2011) 1091e1099.
S. Rabe, B. Schartel / Polymer Testing 57 (2017) 165e174174

3.3 Exploring the Modes of Action of Phosphorus-Based Flame Retardants in Polymeric Systems
60
3.3 Exploring the Modes of Action of Phosphorus-Based
Flame Retardants in Polymeric Systems
Sebastian Rabe, Yuttapong Chuenban, Bernhard Schartel, Materials 2017, 10, 455.
https://doi.org/10.3390/ma10050455
This article was accepted and published.
First author contribution:
Conceptualization of the working packages
Manufacturing of the polyester resin and paraffin specimen
TG-FTIR and cone calorimeter measurements of the manufactured specimens
Analysis and interpretation of all results
Scientific discussion and conclusions
Outline and writing of the manuscript
Contributions from other authors:
Yuttapong Chuenban:
o Manufacturing of the epoxy resin and PMMA resin specimens
o TG-FTIR and cone calorimeter measurements of the manufacture specimen
o Contribution to the analysis of the results
Bernhard Schartel:
o Writing of the funding application
o Contribution to the scientific discussion
o Contribution to the outline of the manuscript

3.3 Exploring the Modes of Action of Phosphorus-Based Flame Retardants in Polymeric Systems
61
Abstract: Phosphorus-based flame retardants were incorporated into different, easily
preparable matrices such as polymeric thermoset resins and paraffin as a proposed model for
polyolefins and were investigated for their flame retardancy performance. The favored mode of
action of each flame retardant was identified in each respective system and at each respective
concentration. Thermogravimetric analysis was used in combination with infrared spectroscopy
of the evolved gas to determine the pyrolysis behavior, residue formation and the release of
phosphorus species. Forced flaming tests in the cone calorimeter provided insight into burning
behavior and macroscopic residue effects. The results were put in relation to the phosphorus
content to reveal correlations between phosphorus concentration in the gas phase and flame
inhibition performance, as well as between phosphorus concentration in the residue and
condensed phase activity. Total heat evolved (fire load) and peak heat release rate were
calculated based on changes in the effective heat of combustion and residue, and then were
compared with the measured values to address the modes of action of the flame retardants
quantitatively. The quantification of flame inhibition, charring, and the protective layer effect
measure the non-linear flame retardancy effects as functions of the phosphorus concentration.
Overall, this screening approach using easily preparable polymer systems provides great insight
into the effect of phosphorus in different flame retarded polymers with regard to polymer
structure, phosphorus concentration, and phosphorus species.

materials
Article
Exploring the Modes of Action of Phosphorus-BasedFlame Retardants in Polymeric Systems
Sebastian Rabe, Yuttapong Chuenban and Bernhard Schartel *
Bundesanstalt für Materialforschung und -prüfung (BAM), 12205 Berlin, Germany;[email protected] (S.R.); [email protected] (Y.C.)* Correspondence: [email protected]; Tel.: +49-30-8104-1021
Academic Editor: De-Yi WangReceived: 20 February 2017; Accepted: 20 April 2017; Published: 26 April 2017
Abstract: Phosphorus-based flame retardants were incorporated into different, easily preparablematrices, such as polymeric thermoset resins and paraffin as a proposed model for polyolefinsand investigated for their flame retardancy performance. The favored mode of action of eachflame retardant was identified in each respective system and at each respective concentration.Thermogravimetric analysis was used in combination with infrared spectroscopy of the evolvedgas to determine the pyrolysis behavior, residue formation and the release of phosphorus species.Forced flaming tests in the cone calorimeter provided insight into burning behavior and macroscopicresidue effects. The results were put into relation to the phosphorus content to reveal correlationsbetween phosphorus concentration in the gas phase and flame inhibition performance, as well asphosphorus concentration in the residue and condensed phase activity. Total heat evolved (fire load)and peak heat release rate were calculated based on changes in the effective heat of combustion andresidue, and then compared with the measured values to address the modes of action of the flameretardants quantitatively. The quantification of flame inhibition, charring, and the protective layereffect measure the non-linear flame retardancy effects as functions of the phosphorus concentration.Overall, this screening approach using easily preparable polymer systems provides great insightinto the effect of phosphorus in different flame retarded polymers, with regard to polymer structure,phosphorus concentration, and phosphorus species.
Keywords: flame retardants; flame inhibition; cone calorimeter; aluminum diethyl phosphinate;polyester; PMMA; epoxy resin; red phosphorus; BDP
1. Introduction
Nowadays, the ever growing numbers of different flame retardants for all kinds of applications,along with their variations in concentration, particle size distribution and so on, create a need forscreening methods that allow time and material savings while yielding significant results and enablingreasonable conclusions. Several different approaches have been taken to accelerate fire testing, such asthe microscale combustion calorimeter, the rapid cone calorimeter and the rapid mass calorimeter [1–4].These methods are specifically designed for screening the fire performance of large numbers of samples.However, all of the methods require specific sample preparation, such as extrusion and injectionmolding, to ensure homogenous implementation of the flame retardant in the thermoplastic. With theacceleration of the actual testing method, the bottleneck shifts towards sample preparation. Thus, herea screening approach is presented that uses cone calorimeter investigations on different thermosetsand on paraffin, which is proposed as a model for polyolefins, to address different phosphorous flameretardants in different concentrations.
Phosphorus-based flame retardants have been proposed to replace halogenated flame retardingadditives due to their good fire properties and better environmental sustainability [5–7]. They exhibit
Materials 2017, 10, 455; doi:10.3390/ma10050455 www.mdpi.com/journal/materials

Materials 2017, 10, 455 2 of 23
all kinds of flame retardant modes of action, such as flame inhibition in the gas phase and charenhancement, and intumescence and formation of inorganic glass in the condensed phase [6,8–16].In many polymers, aluminum diethyl phosphinate (AlPi) is reported to exhibit high activity in thegas phase by releasing diethylphosphinic acid [17–20]. Often only a small fraction of it remains in thecondensed phase to induce some char or residue formation [21]. Phosphate-based flame retardants arereported to act in the condensed phase as acid precursors, leading to char formation by esterificationand dehydration [22–24]. Nevertheless, if the phosphate esters are released into the gas phase insteadof reacting with the decomposing polymer, they show high flame inhibiting effects [25,26]. Thus,phosphate flame retardants such as bisphenol-A bis(diphenyl phosphate) (BDP), triphenyl phosphate(TPP) and resorcinol bis(diphenyl phosphate) (RDP) have different flame inhibition effectiveness, dueto variations in decomposition behavior and releasability [25,27]. Despite its flammability hazard, redphosphorus is used as a flame retardant as well. It can act in both the gas phase and the condensedphase [8,16,28]. Indeed, phosphorous flame retardants often act in the condensed phase and in thegas phase at the same time [8,10,26,29]. It was also demonstrated that the existence and efficiency ofthe mode of action as well as its effect on the performance of the flame retardant depends not onlyon its chemical structure, but also strongly on its interaction with the polymeric matrix in which it isincorporated [8,11,15,26,30].
In this work, two AlPi flame retardants with different particle size distributions were used, as wellas BDP and red phosphorus. Thus, it was possible to investigate and compare a range of differentphosphorus sources with different phosphorus content and particle sizes. To achieve easier andfaster sample preparation, the flame retardants were incorporated into resins, which are cured underlaboratory conditions and into paraffin. Here, epoxy-, polyester- and acrylate-based resins were usedby simply mixing them with the additive and molding in small amounts in the laboratory. It hasto be noted, however, that the used epoxy resin cannot be seen as an example for all epoxy resins,since burning behavior and behavior of the flame retardants in the respective resin may be different.The group of polyolefins was replaced by paraffin. The relatively fast compounding aims to shift thebottleneck in the testing process away from sample preparation. Furthermore, the results obtained bymeans of these easily compounded polymeric systems are explained using general model assumptions.
2. Materials and Methods
2.1. Thermogravimetric Analysis Coupled with FTIR
Thermogravimetric analysis was conducted on a TG 209 F1 Iris (Netzsch Instruments, Selb,Germany). Specimens were provided in 5 mg portions of powder in a ceramic crucible, which werepyrolyzed under nitrogen at a heating rate of 10 K/min. Pyrolysis was performed in the absence ofoxygen to simulate the oxygen-lean conditions in a laminar flame. To analyze and identify the gasesduring pyrolysis, the TGA was coupled via a transfer line with a Tensor 27 infrared spectrometer(Bruker Optics, Ettlingen, Germany). The gas cell and transfer line were operated at a temperature of270 ◦C to ensure transport of the pyrolysis gases without condensation effects [31].
2.2. Cone Calorimeter
Forced flaming combustion tests were performed using a cone calorimeter (FTT, East Grinstead,UK) in accordance with ISO 5660. Specimens 100 × 100 × 3 mm3 in size were conditioned for 48 hat 23 ◦C and 50% relative humidity, wrapped in an aluminum tray, and irradiated with 50 kW/m2
at a distance of 35 mm from the cone heater [32] to ensure sufficient spacing for the greatest possibleresidue formation. Samples were measured in triplicate when the first two measurements deviated bymore than 10% in any result.

Materials 2017, 10, 455 3 of 23
2.3. Elemental Analysis
Elemental analysis was performed by Mikroanalytisches Laboratorium Kolbe (Mühlheim an derRuhr, Germany).
2.4. Materials
2.4.1. Flame Retardants
Aluminum diethylphosphinate (AlPi) was used in two different varieties, Exolit OP935 and ExolitOP1230 (Clariant). Exolit OP935 is a fine-grained AlPi developed especially for adhesive applications,and is established as an effective flame inhibitor in epoxy, acrylic and TPE resins [18,33]. The highlystable Exolit OP 1230 is widely used for high-temperature polyamides, as well as in polyamide-AlPimixtures [34–36]. Both flame retardants contain around 23.5 wt % phosphorus. Red phosphorus(Exolit RP607, Clariant) is typically used in thermoplastics for electronics applications [28]. As it is themost concentrated source of phosphorus as a flame retardant, its application concentration generallylies below 10 wt %, and it is usually applied as encapsulated material. Bisphenol-A bis(diphenylphosphate) (BDP) is an oligomeric aryl phosphate ester designed for use in engineering resins suchas PC/ABS [5,6]. Since BDP contains only around 9 wt % of phosphorus, a higher BDP load must beconsidered in the material. BDP was used in concentrations of 10, 20, 25 and 35 wt % to reach theeffective range of phosphorus concentration. All other investigated flame retardants were concentratedat 5, 10, 15 and 20 wt %.
2.4.2. Resin Systems
Epoxy resins have become important materials for electronics and lightweight construction,especially as fiber reinforced composites [37,38]. Bisphenol-A diglycidyl ether (DGEBA, AralditMY740, Bodo Möller Chemie GmbH, Offenbach, Germany) and isophorone diamine (IPDA, MerckKGaA, Darmstadt, Germany) was used as an example for an epoxy resin [39]. IPDA and the respectiveflame retardant were added to DGEBA and stirred until a homogenous mixture was obtained. Fortygrams of the mixture was poured into a 100 × 100 × 6 mm3 aluminum mold and cured for 30 minat 80 ◦C and for 70 min at 120 ◦C. The aluminum frame was stabilized with weights to preventdeformation during curing. The edges of the finished specimens had to be ground down in order toobtain a flat surface. The rest of the mixture was also cured as described above, followed by grindingto obtain powder for TGA-FTIR measurements.
As an acrylate thermoset, a pre-accelerated PMMA resin with an incorporated, UV-induced curingagent was used (S. u. K. Hock GmbH, Regen, Germany). The respective flame retardant was addedto the methyl methacrylate resin and stirred until homogeneity was achieved. The mixture was thenpoured into aluminum molds and cured at room temperature and irradiated by a daylight spectrumlamp for 12 h. Systems with red phosphorus could not be produced because the curing process washindered so that complete hardening could not be achieved.
For preparation of the polyester system, the flame retardant was added to a mixture of polyesterresin L800 and the curing agent methyl ethyl ketone peroxide (MEKP) (S. u. K. Hock GmbH, Regen,Germany). The mixture was then poured into aluminum molds and cured at room temperaturefor 8 h. The edges of the molds were also weighed down to prevent deformation during curing.Red phosphorus prevented the resin from curing, so that a polyester formulation with RP as flameretardant could not be manufactured.

Materials 2017, 10, 455 4 of 23
To represent the group of polyolefins, paraffin pellets were melted at 75 ◦C and combined withthe flame retardant. The hot mixture was poured into the aluminum molds and cooled down toroom temperature. It was not possible to implement BDP into paraffin because the two phases wereimmiscible. BDP accumulated as a bubble underneath the paraffin in the mold. All produced materialswere given a label according to Table 1.
Table 1. Nomenclature of the produced flame retarded polymeric materials with x = concentration ofthe flame retardant, 5, 10, 15 or 20 wt % for Exolit OP935, OP1230 and RP607 and 10, 20, 25 and 35 wt %for BDP respectively.
Exolit OP935 Exolit OP1230 Exolit RP607 BDP
DGEBA/IPDA EP-x-ExOP935 EP-x-ExOP1230 EP-x-ExRP EP-x-BDPPMMA-resin PMMA-x-ExOP935 PMMA-x-ExOP1230 — PMMA-x-BDP
Polyester-resin Pes-x-ExOP935 Pes-x-ExOP1230 — Pes-x-BDPParaffin P-x-ExOP935 P-x-ExOP1230 P-x-ExRP —
3. Results and Discussion
3.1. Thermogravimetric Analysis Results
All investigated systems, with and without flame retardant, were investigated viathermogravimetric analysis in the absence of oxygen. Mass and DTG curves are displayed in Figure 1and results are listed in Table 2.
Figure 1. Thermogravimetric (TG) and derivative thermogravimetric (DTG) results for selected flameretarded and non-flame retarded specimens with: epoxy resin (a); polyester resin (b); PMMA resin (c);and paraffin (d) as polymer matrix.

Materials 2017, 10, 455 5 of 23
Table 2. Results from thermogravimetric analysis (TGA). T5% ML is the temperature at which 5 wt % ofthe mass is lost, TDTGmax is the temperature of the maximum of the mass loss rate. The residue wasdetermined at 800 ◦C.
MaterialT5% ML TDTGmax Residue
◦C ◦C wt %
EP 326 ± 1 360 ± 2 10.7 ± 0.1EP-10-ExOP935 320 ± 1 355 ± 1 12.1 ± 0.3EP-10-ExOP1230 320 ± 2 353 ± 1 12.1 ± 0.3
EP-5-ExRP 318 ± 1 349 ± 1 17.0 ± 0.2EP-10-BDP 265 ± 1 365 ± 1 3.0 ± 0.1
Pes 204 ± 1 380 ± 2 2.9 ± 0.1Pes-10-ExOP935 211 ± 1 378 ± 1 14.0 ± 0.4Pes-10-ExOP1230 210 ± 1 382 ± 2 11.7 ± 0.2
Pes-20-BDP 277 ± 2 380 ± 2 2.6 ± 0.1PMMA 192 ± 1 370 ± 2 1.7 ± 0.1
PMMA-10-ExOP935 229 ± 2 368 ± 1 4.6 ± 0.2PMMA-10-ExOP1230 228 ± 1 370 ± 2 4.5 ± 0.1
PMMA-10-BDP 246 ± 2 364 ± 1 0.7 ± 0.1P 223 ± 1 296 ± 1 0.1 ± 0.1
P-10-ExOP935 207 ± 1 274 ± 1 0.2 ± 0.1P-10-ExOP1230 225 ± 2 454 ± 3 1.4 ± 0.2
P-10-ExRP 207 ± 1 273 ± 1 2.1 ± 0.2
The start of the decomposition T5% ML (at which 5 wt % of the material was lost) for epoxy resinformulations shifted towards lower temperatures when flame retardants were added. EP-10-ExOP935and EP-10-ExOP1230 showed decomposition behavior similar to the pure epoxy resin. The temperatureof the maximum mass loss rate, TDTGmax, was shifted to temperatures 5 and 7 ◦C lower, respectively.With the non-flame retarded epoxy resin producing 10.7 wt % of residue, replacement of 10 wt % of theresin with AlPi flame retardants would still produce 9.6 wt % residue. Since residue formation increasedto 12.1 wt %, 2.5 wt % of the residue results from the incorporation of the flame retardant. Epoxyresin with 5 wt % of red phosphorus flame retardant added began decomposition at an even lowertemperature, exhibiting a lower TDTGmax, and an increase in residue of around 6.8 wt %. This meansthat carbonaceous char was produced. Besides the drastic lowering of the temperature at the start ofdecomposition, incorporation of 10 wt % of BDP in the epoxy resin resulted in a second decompositionstep prior to the main one. It also formed much less residue than the other epoxy formulations, leadingto the conclusion that this amount of BDP prevents residue production in epoxy resin. The temperatureof maximum decomposition was shifted to temperatures 5 ◦C higher.
For the polyester system, the beginning of decomposition shifted to temperatures only slightlyhigher for Pes-10-ExOP935 and Pes-10-ExOP1230, but the effect was stronger when BDP was added.Ten weight percent of Exolit OP935 promoted the production of residue, increasing the amount by11.4 wt %. Carbonaceous char was formed. For 10 wt % of Exolit OP1230 in polyester resin, the residueformation was promoted by 9.1 wt % compared to the non-flame retarded polyester resin. Pes-20-BDPproduced only 0.3 wt % more residue. The temperatures of maximum decomposition did not altermuch with the addition of a respective flame retardant.
In the PMMA resin, the starting temperature for decomposition shifted to higher temperatureswith the addition of flame retardants. Incorporation of 10 wt % Exolit OP935 or OP1230 increased thetemperature of 5 wt % mass loss by around 37 ◦C, whereas BDP raised it by more than 50 ◦C. Thereare no differences in decomposition observed between Exolit OP935 and OP1230. Ten weight percentof either flame retardant in PMMA resin increased the amount of residue by 3 wt %, consisting ofinorganic ash. The amount of residue of PMMA-10-BDP was insignificant. Only for 10% BDP was arelevant shift of TDTGmax by 6% to lower temperatures observed.
For paraffin, all of the flame retarded formulations showed a two-step decomposition process,clearly visible in both the mass loss and the mass loss rate curves (Figure 1d). The AlPi flameretardant Exolit OP935 as well as the red phosphorus caused a decrease in the temperature at which

Materials 2017, 10, 455 6 of 23
decomposition begins. Furthermore, both flame retardants caused a shift in the maximum of the massloss rate to temperatures 22 to 23% lower. In the DTG curves it becomes clear that the formulationwith 10 wt % of Exolit OP1230 showed the highest mass loss rate in the second step of decomposition.It was even higher than what is considered the main decomposition step for the other formulations,changing the TDTGmax to 454 ◦C. The residues produced by all paraffin formulations are negligible.These results clarified that the phosphorus-based flame retardants only slightly promote the formationof a residue, especially at relatively low concentrations of up to 10 wt %, and thus are mainly releasedinto the gas phase. The varied particle size distribution in Exolit OP935 and Exolit OP1230 had nosignificant influence on the thermal decomposition properties.
3.2. FTIR Spectra of the Gaseous Phase
To confirm that phosphorus species were released into the gas phase, the pyrolysis gases evolvedfrom TGA measurements were introduced into an IR cell. It was possible to identify various volatilephosphorus species. The FTIR spectra of the investigated formulations are shown in Figure 2. Theseexperiments simply serve as a way to enable a discussion about the gas phase activity due to therelease of phosphorus species.
Figure 2. Fourier transform infrared (FTIR) spectra at the respective main decomposition step of flameretardants in: epoxy (a); polyester (b); PMMA (c); and paraffin (d) systems. Dotted lines were includedas an aid to highlight smaller peaks from phosphorus species.
The AlPi flame retardants Exolit OP935 and OP1230 showed peaks at wavenumbers 854, 3650and 1265 cm−1 in the epoxy resin, indicating the P–O, P–OH and P=O-stretch of diethylphosphinicacid. At 1078 cm−1, a weak peak expressed the PO2− anion of the AlPi molecule, whereas the peakat 952 cm−1 signified the production of ethene by a P–C bond break in AlPi. A phosphinate peakwas found at 670 cm−1 [21,40,41]. Red phosphorus showed peaks at 670, 922, 1256 and 2375 cm−1,which are representative for PO4
3−, P–OP, P=O and P–OH vibrations. In the EP-10-BDP formulation,several peaks corresponding to phenolic derivatives of bisphenol-A were found at 1261, 1173, 1490and 1620 cm−1, which represent aromatic phosphate esters.

Materials 2017, 10, 455 7 of 23
In the polyester resin, Exolit OP935 and 1230 showed peaks at 1105 and 1053 cm−1, which displayPO2− vibration. The peak at 1257 cm−1 is attributed to P=O. A peak for a P–O–P vibration was foundat 910 cm−1. In BDP, those vibrations occurred at 1165, 1087, 1230 and 910 cm−1.
Peaks related to phosphorus species are less pronounced in the flame retarded PMMA resinformulations. The strong release of methyl methycrylate, verified by the characteristic peaks such asthe C–H stretch at around 2950 cm−1, the C=O stretch at 1700 cm−1, the C=C stretch at 1600 cm−1 andthe C–O stretch at around 1200 cm−1, concealed most of the phosphorus-related peaks. Only the peaksat 1056 and 1168 cm−1 suggest the existence of PO2− species in the gas phase. However, Exolit OP935and OP1230 incorporated into paraffin showed strong PO2− peaks at 1156 and 1085 cm−1, as wellas a peak at 775 cm−1 which is attributed to diethylphosphinic acid. Red phosphorus in paraffindid not exhibit phosphorus-related peaks at the first decomposition step. However, at the seconddecomposition step, phosphorus was released as mixtures of undefined low-oxidized phosphorusoxides indicated by broad peaks at around 1300 and 950 cm−1. Earlier work showed that phosphoruswas released as P4 molecules, breaking down to P2 molecules with increasing temperature [16].
The results from the FTIR experiments demonstrated that phosphorus species are traceable in thegaseous phase and thus are released during pyrolysis of the formulations. This is the premise of thefollowing investigations into the extent to which phosphorus compounds and the concentration ofphosphorus in the gas phase are attributed to flame inhibition, and whether the remaining phosphorusin the residue has any effect on other modes of action in flame retardancy.
3.3. Forced Flaming Fire Behavior: Cone Calorimeter
3.3.1. Comparison of Heat Release Rates
Forced flaming fire tests were conducted in the cone calorimeter. At first, it was interesting tosee the differences between the investigated flame retardants at the same concentration in differentmatrices. The heat release rate (HRR) curves are displayed in Figure 3. The results of all conecalorimeter measurements are summarized in Table 3.
Figure 3. Cone calorimeter heat release rate (HRR) curves of flame retardants in: DGEBA/IPDA (a);Pes-resin (b); PMMA resin (c); and paraffin (d) with a concentration of 10 wt %.

Materials 2017, 10, 455 8 of 23
Table 3. Cone calorimeter results.
Systemtig PHRR THE EHC Residue at End of Test
s kW/m2 MJ/m2 MJ/kg wt %
EP 39 ± 1 1858 ± 41 81.3 ± 0.1 24.7 ± 0.1 0.5 ± 0.0EP-5-ExOP935 30 ± 1 1632 ± 4 71.1 ± 2.1 21.6 ± 0.4 4.3 ± 0.3EP-10-ExOP935 32 ± 1 969 ± 57 59.0 ± 1.3 19.2 ± 0.3 6.3 ± 0.3EP-15-ExOP935 30 ± 1 864 ± 9 57.0 ± 0.3 18.3 ± 0.0 8.6 ± 0.3EP-20-ExOP935 30 ± 0 817 ± 25 52.3 ± 0.1 17.7 ± 0.1 11.3 ± 0.6EP-5-ExOP1230 31 ± 2 1105 ± 52 71.6 ± 0.3 19.9 ± 1.4 4.9 ± 0.1
EP-10-ExOP1230 32 ± 1 1097 ± 50 61.1 ± 0.1 19.0 ± 0.0 6.3 ± 0.2EP-15-ExOP1230 30 ± 0 1007 ± 16 58.9 ± 0.8 18.2 ± 0.2 8.6 ± 0.2EP-20-ExOP1230 31 ± 2 861 ± 2 54.0 ± 0.3 18.0 ± 0.1 10.8 ± 0.0
EP-5-ExRP 29 ± 1 964 ± 16 51.1 ± 1.9 15.7 ± 0.3 6.3 ± 0.1EP-10-ExRP 33 ± 1 786 ± 24 47.2 ± 1.0 15.4 ± 0.4 8.0 ± 0.1EP-15-ExRP 34 ± 2 673 ± 125 42.4 ± 0.9 13.5 ± 0.4 8.7 ± 0.5EP-20-ExRP 32 ± 2 873 ± 56 50.1 ± 0.4 16.6 ± 0.3 9.9 ± 1.5EP-10-BDP 25 ± 3 1468 ± 44 74.0 ± 4.1 22.7 ± 1.4 5.0 ± 0.3EP-20-BDP 26 ± 1 688 ± 3 49.0 ± 0.7 16.9 ± 0.1 14.9 ± 1.1EP-25-BDP 22 ± 2 660 ± 1 45.0 ± 0.3 15.5 ± 0.1 15.8 ± 1.7EP-35-BDP 28 ± 1 628 ± 3 42.5 ± 0.6 15.3 ± 0.3 17.3 ± 0.4
Pes 26 ± 1 1017 ± 16 94.3 ± 2.9 19.9 ± 0.9 0.1 ± 0.1Pes-5-ExOP935 33 ± 2 854 ± 38 85.5 ± 0.4 19.1 ± 0.1 4.1 ± 0.2
Pes-10-ExOP935 32 ± 1 599 ± 6 64.5 ± 1.3 15.7 ± 0.1 7.7 ± 0.5Pes-15-ExOP935 36 ± 2 577 ± 29 70.9 ± 0.0 16.5 ± 0.2 8.5 ± 0.3Pes-20-ExOP935 34 ± 1 521 ± 15 60.9 ± 3.2 14.7 ± 0.6 8.6 ± 0.5Pes-5-ExOP1230 31 ± 2 969 ± 33 89.8 ± 0.1 19.8 ± 0.1 3.7 ± 0.3
Pes-10-ExOP1230 32 ± 5 428 ± 27 69.4 ± 2.2 14.9 ± 2.0 8.5 ± 0.1Pes-15-ExOP1230 30 ± 2 603 ± 37 73.4 ± 4.0 13.9 ± 2.3 9.4 ± 0.4Pes-20-ExOP1230 33 ± 1 456 ± 8 61.2 ± 1.7 14.4 ± 0.4 10.0 ± 0.1
Pes-10-BDP 35 ± 1 727 ± 80 77.8 ± 1.4 16.9 ± 0.3 1.1 ± 0.4Pes-20-BDP 32 ± 1 629 ± 63 66.5 ± 0.7 11.3 ± 3.2 2.1 ± 0.5Pes-25-BDP 37 ± 6 570 ± 17 59.6 ± 0.6 11.7 ± 1.7 3.5 ± 0.5Pes-35-BDP 34 ± 5 538 ± 49 55.9 ± 1.4 12.1 ± 0.4 4.8 ± 0.3
PMMA 32 ± 1 1051 ± 41 106.9 ± 0.6 25.1 ± 0.5 0.1 ± 0.0PMMA-5-ExOP935 26 ± 1 836 ± 1 93.7 ± 2.5 22.8 ± 0.7 1.2 ± 0.2PMMA-10-ExOP935 25 ± 1 792 ± 21 88.8 ± 0.5 22.8 ± 0.2 2.5 ± 0.1PMMA-15-ExOP935 24 ± 1 740 ± 37 83.8 ± 0.3 20.9 ± 0.1 3.8 ± 0.0PMMA-20-ExOP935 22 ± 1 615 ± 33 81.8 ± 1.0 21.0 ± 0.4 5.7 ± 0.5PMMA-5-ExOP1230 23 ± 1 852 ± 20 97.0 ± 1.0 23.2 ± 1.8 1.5 ± 0.1PMMA-10-ExOP1230 22 ± 0 722 ± 16 89.2 ± 1.1 22.6 ± 0.4 2.9 ± 0.0PMMA-15-ExOP1230 24 ± 2 678 ± 63 86.6 ± 3.0 21.6 ± 0.6 3.4 ± 0.1PMMA-20-ExOP1230 26 ± 2 620 ± 4 82.8 ± 0.6 21.4 ± 04 4.8 ± 0.5
PMMA-10-BDP 29 ± 0 1079 ± 25 108.4 ± 0.3 24.7 ± 2.3 0.5 ± 0.1PMMA-20-BDP 31 ± 1 994 ± 38 97.4 ± 0.9 23.4 ± 0.4 0.6 ± 0.0PMMA-25-BDP 28 ± 1 868 ± 48 91.5 ± 1.9 21.7 ± 0.1 0.7 ± 0.1PMMA-35-BDP 28 ± 1 928 ± 19 93.0 ± 0.2 22.3 ± 0.4 0.8 ± 0.1
P 40 ± 3 2996 ± 24 210.1 ± 2.9 44.1 ± 0.5 0.1 ± 0.0P-5-ExOP935 32 ± 1 1935 ± 167 198.8 ± 7.1 42.3 ± 0.7 0.0 ± 0.0P-10-ExOP935 27 ± 2 1593 ± 96 189.9 ± 27.1 41.4 ± 1.0 0.0 ± 0.2P-15-ExOP935 23 ± 1 1371 ± 101 183.8 ± 1.3 39.4 ± 0.1 2.1 ± 0.3P-20-ExOP935 23 ± 2 1130 ± 69 187.6 ± 3.7 38.9 ± 0.4 1 ± 0.6P-5-ExOP1230 37 ± 2 2872 ± 318 197.2 ± 1.5 44.0 ± 0.2 0.1 ± 0.1
P-10-ExOP1230 42 ± 6 2868 ± 123 209.9 ± 2.9 43.3 ± 0.3 1.3 ± 0.8P-15-ExOP1230 29 ± 1 2559 ± 223 195.8 ± 3.5 42.4 ± 0.7 2.9 ± 0.3P-20-ExOP1230 27 ± 4 2257 ± 67 188.6 ± 12.6 40.7 ± 1.6 4.3 ± 1.0
P-5-ExRP 33 ± 1 2945 ± 13 212.5 ± 10.9 43.2 ± 0.2 0.5 ± 0.5P-10-ExRP 34 ± 1 2781 ± 150 201.1 ± 1.6 41.4 ± 0.1 0.5 ± 0.0P-15-ExRP 29 ± 3 2559 ± 219 191.8 ± 1.5 40.4 ± 0.6 0.2 ± 0.1P-20-ExRP 35 ± 4 2519 ± 35 189.9 ± 2.6 38.5 ± 0.7 0.3 ± 0.6

Materials 2017, 10, 455 9 of 23
Except for paraffin, the systems clearly showed improvements in terms of flame retardancy,such as reduction in peak heat release rate (PHRR) and total heat evolved (THE). In the epoxy resin,the formulation with 10 wt % of BDP was the least effective; it lowered the PHRR but shortened thetime to ignition. Ten weight percent of Exolit OP935 and OP1230 further reduced PHRR, with OP935showing slightly better performance. However, their efficiency at 10 wt % was similar. Comparedto the residue analysis results from TGA, the increase in residue was much more evident in the conecalorimeter, with an increase of 10% for the highest investigated flame retardant load. Red phosphorusinduced the largest reduction in HRR, although an even greater reduction was expected because of thehigh phosphorus content. This suggests that not only the phosphorus content of a flame retardant isresponsible for its performance, but also the way the phosphorus is incorporated. Compared to theresults from the thermogravimetric analysis, the residue produced is not as distinct, especially notfor red phosphorus. At the same time, THE is reduced by almost 50% for EP-15-ExRP. This allowsthe conclusion that gas phase activity is mainly responsible for the high THE reduction. However,the residue produced by BDP increased strongly with higher flame retardant load. This suggeststhat there is a clear tendency for condensed phase activity of BDP. In the epoxy resin, 15 wt % of redphosphorus as well as 35 wt % of BDP showed the best HRR and THE reduction.
Polyester resin showed a PHRR of 900 to 1000 kW/m2 without any flame retardant. The flameretardants Exolit OP935 and BDP caused a similar reduction in PHRR to around 600 kW/m2, eventhough BDP has lower phosphorus content. The performance of 10 wt % Exolit OP1230 in polyesterresin exceeded those of the other polyester formulations, as the PHRR was reduced further, to around400 kW/m2. In the PMMA resin, the formulation with 10 wt % of BDP had about the same performanceas the non-flame retarded resin. Residue formation of the polyester resin formulations did not showsalience; amounts increased with increasing flame retardant load, but remained below 10 wt %. It wasfound that Exolit OP1230 resulted in the greatest HRR and THE reduction, especially at 20 wt %.
When Exolit OP935 or 1230 were incorporated into PMMA resin, the PHRR decreased but thetime to ignition was shortened. Exolit OP1230 showed slightly lower PHRR but a longer time ofburning. Residue formations were in great accordance with results from thermogravimetric analysis,and demonstrated that all flame retardants work mainly via gas phase activity. Incorporation ofBDP did not deliver satisfying results in HRR and THE reduction and was thus considered the worstadditive for these purposes.
Forced flaming heat release tests on paraffin and the respective flame retarded formulations didnot differ substantially as a pure system or with 10 wt % flame retardant load. Only the system with10 wt % of Exolit OP935 showed prolongation of the small plateau of steady burning and a slightshift of the PHRR to later times. Observation of the burning process of the formulations including redphosphorus showed a peculiarity—at the end of the burning process the flame became very brightand smoke production increased. Red phosphorus did not contribute significantly to inhibiting theburning process. Rather, it burned away at the end of the burning process. Reductions in PHRR werethus due to fuel replacement by the flame retardant. No significant residue was formed. Only at highconcentrations of the AlPi flame retardants were 2 to 4 wt % of residue measured. However, it wasobserved that they formed towards the end of the burning, when the flame was about to extinguish;thus, they were not able to affect the burning behavior through condensed phase activity. Overall,20 wt % of Exolit OP935 reduced PHRR from 2972 to 1130 kW/m2 and THE from 210 to 188 MJ/m2,and is thus considered to be the best suited additive in paraffin.
One of the most important characteristics when it comes to the fire performance of a flameretardant in a polymeric system is the change in PHRR. The reduction in PHRR signifies severalother phenomena: reduction in the effective heat of combustion, reduction in released fuel due toan increased amount of residue, and the effect of a protective layer are all reflected by this measure.To illustrate the correlation between PHRR reduction and phosphorus content in a flame retardant,they were plotted in Figure 4.
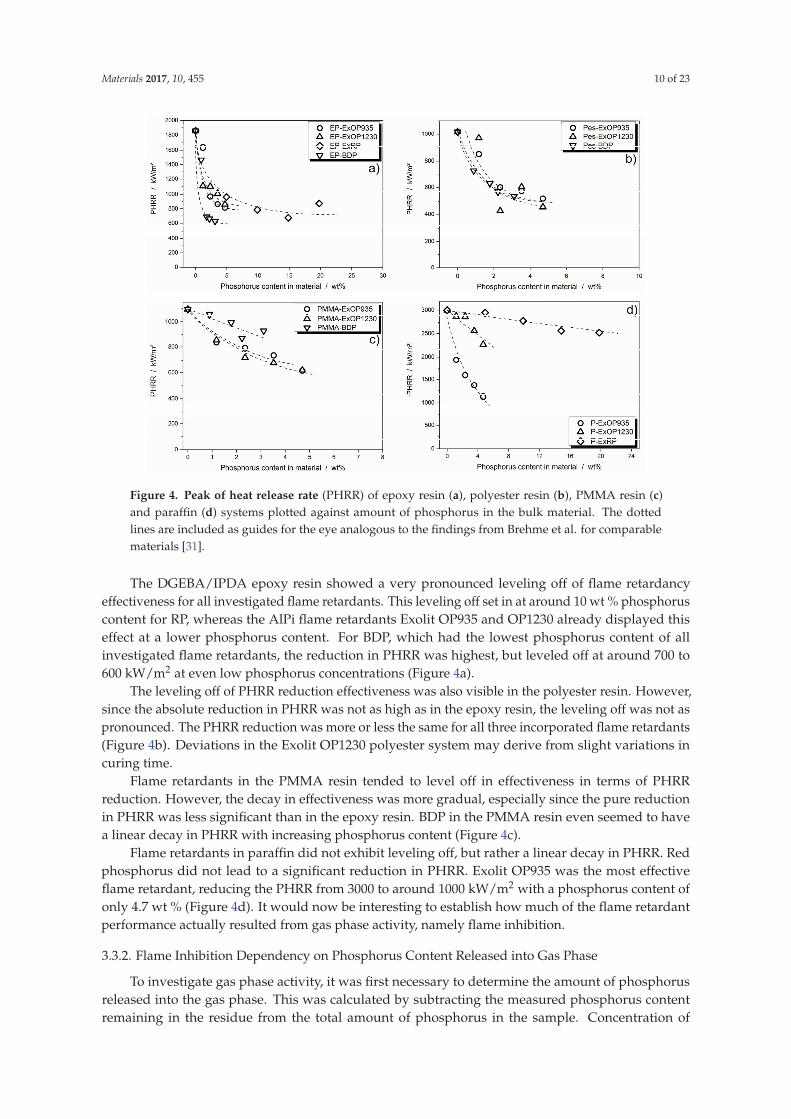
Materials 2017, 10, 455 10 of 23
Figure 4. Peak of heat release rate (PHRR) of epoxy resin (a), polyester resin (b), PMMA resin (c)and paraffin (d) systems plotted against amount of phosphorus in the bulk material. The dottedlines are included as guides for the eye analogous to the findings from Brehme et al. for comparablematerials [31].
The DGEBA/IPDA epoxy resin showed a very pronounced leveling off of flame retardancyeffectiveness for all investigated flame retardants. This leveling off set in at around 10 wt % phosphoruscontent for RP, whereas the AlPi flame retardants Exolit OP935 and OP1230 already displayed thiseffect at a lower phosphorus content. For BDP, which had the lowest phosphorus content of allinvestigated flame retardants, the reduction in PHRR was highest, but leveled off at around 700 to600 kW/m2 at even low phosphorus concentrations (Figure 4a).
The leveling off of PHRR reduction effectiveness was also visible in the polyester resin. However,since the absolute reduction in PHRR was not as high as in the epoxy resin, the leveling off was not aspronounced. The PHRR reduction was more or less the same for all three incorporated flame retardants(Figure 4b). Deviations in the Exolit OP1230 polyester system may derive from slight variations incuring time.
Flame retardants in the PMMA resin tended to level off in effectiveness in terms of PHRRreduction. However, the decay in effectiveness was more gradual, especially since the pure reductionin PHRR was less significant than in the epoxy resin. BDP in the PMMA resin even seemed to havea linear decay in PHRR with increasing phosphorus content (Figure 4c).
Flame retardants in paraffin did not exhibit leveling off, but rather a linear decay in PHRR. Redphosphorus did not lead to a significant reduction in PHRR. Exolit OP935 was the most effectiveflame retardant, reducing the PHRR from 3000 to around 1000 kW/m2 with a phosphorus content ofonly 4.7 wt % (Figure 4d). It would now be interesting to establish how much of the flame retardantperformance actually resulted from gas phase activity, namely flame inhibition.
3.3.2. Flame Inhibition Dependency on Phosphorus Content Released into Gas Phase
To investigate gas phase activity, it was first necessary to determine the amount of phosphorusreleased into the gas phase. This was calculated by subtracting the measured phosphorus contentremaining in the residue from the total amount of phosphorus in the sample. Concentration of

Materials 2017, 10, 455 11 of 23
phosphorus inside the residue was measured via elemental analysis. For visualization purposes,phosphorus release is depicted in a bar graph for every formulation in Figure 5.
Figure 5. Bar graphs of the percentage of phosphorus released in the gas phase during combustion forepoxy resin (a); polyester resin (b); PMMA resin (c); and paraffin (d) formulations.
In the epoxy resin, there were no differences in phosphorus release between Exolit OP935 andOP1230. At any flame retardant load in the sample, around 70% of the phosphorus was released intothe gas phase. Phosphorus release at 10 wt % flame retardant load was similar to that of the AlPi flameretardants at any concentration, but with increasing BDP load, this amount was significantly reducedto less than half of the phosphorus released into the gas phase. Red phosphorus released over 90% ofits phosphorus into the gas phase and showed a slight increase with increasing flame retardant load(Figure 5a).
Exolit OP935 in polyester resin had a higher phosphorus release than Exolit OP1230. The highestrelease of phosphorus was also at the highest flame retardant load. By contrast, formulations withBDP had the highest phosphorus release at 10 wt % of BDP load, which gradually decreased to around80% with increasing amounts of BDP (Figure 5b).
In the PMMA resin, Exolit OP935 showed the maximum phosphorus release at the lowest amountof flame retardant. This decreased with increasing flame retardant load. The phosphorus release ofExolit OP1230 was constant at around 80 to 85% at all investigated flame retardant loads. For BDP thephosphorus release was at a very high level, at around 90 to 95% with increasing load in the matrix(Figure 5c).
Exolit OP935 and OP1230 in paraffin both showed decreasing phosphorus release with increasingflame retardant load. However, this effect was more significant with Exolit OP1230. The highestphosphorus release into the gas phase was at 10 wt % of flame retardant load. Formulations with RPleft no residue at all; thus, all phosphorus was released into gas phase during burning (Figure 5d).It was observed that, towards the end of the burning process, the flame turned very bright. It isassumed that the red phosphorus was burning separately, resulting in this bright flame, and thus didnot take part in any pyrolysis reaction with the matrix. This is supported by monitoring the effectiveheat of combustion (EHC) during the test. As seen in Figure 6, the EHC is split into two areas, the first

Materials 2017, 10, 455 12 of 23
one attributed to the burning of the paraffin matrix at around 40 MJ/kg. After reaching the PHRRat around 200 s, the EHC curve features a second, lower plateau at approximately 20 MJ/kg with afinal decay, which is associated with the burning of red phosphorus. This is in analogy to the differentburning phases observed for example in polymer blends [42]. Contrarily, the EHC of 20 wt % AlPiincorporated in paraffin features a constant EHC throughout the entire period of burning. This shows,that the decomposition temperatures of red phosphorus and the paraffin matrix were not overlappingand thus did not ensure an active flame retardancy.
Figure 6. Effective heat of combustion: for P-20-ExRP exhibiting a two-part progression (a); and forP-20-ExOP935 as an example for a constant EHC (b).
Overall, it is demonstrated that phosphorus release is controlled by the polymer matrix, thephosphorus species itself and the concentration of phosphorus in the specimen. To learn about the wayflame inhibition is influenced by the amount of phosphorus release into the gas phase, the effectiveheat of combustion (EHC) is plotted versus phosphorus concentration in the gas phase (Figure 7).The EHC measured by the cone calorimeter includes the effective heat of the combustion of the volatilesmultiplied by the combustion efficiency of the flame, and thus is a measure for the efficiency of a flameretardant in terms of flame inhibition and gas phase activity in general.
As seen in Figure 7a especially, the curve progression of EHC levels off with increasing phosphoruscontent in the gas phase. The model curve in Figure 8 is proposed as a basis for the following discussionand is based on findings in previous works [31,43], in which the EHC first dwindles in a linear fashion(I), up to a certain level where the effectiveness in EHC reduction levels off (II). This effect is veryprominent in epoxy resin, and less pronounced in the polyester system. The phase is described as(III) in Figure 8, which depicts an increase in EHC with even higher amounts of phosphorus in thegas phase. This converse effect occurs due to increased burning of the phosphorus species withoutexhibiting any flame inhibiting effect.
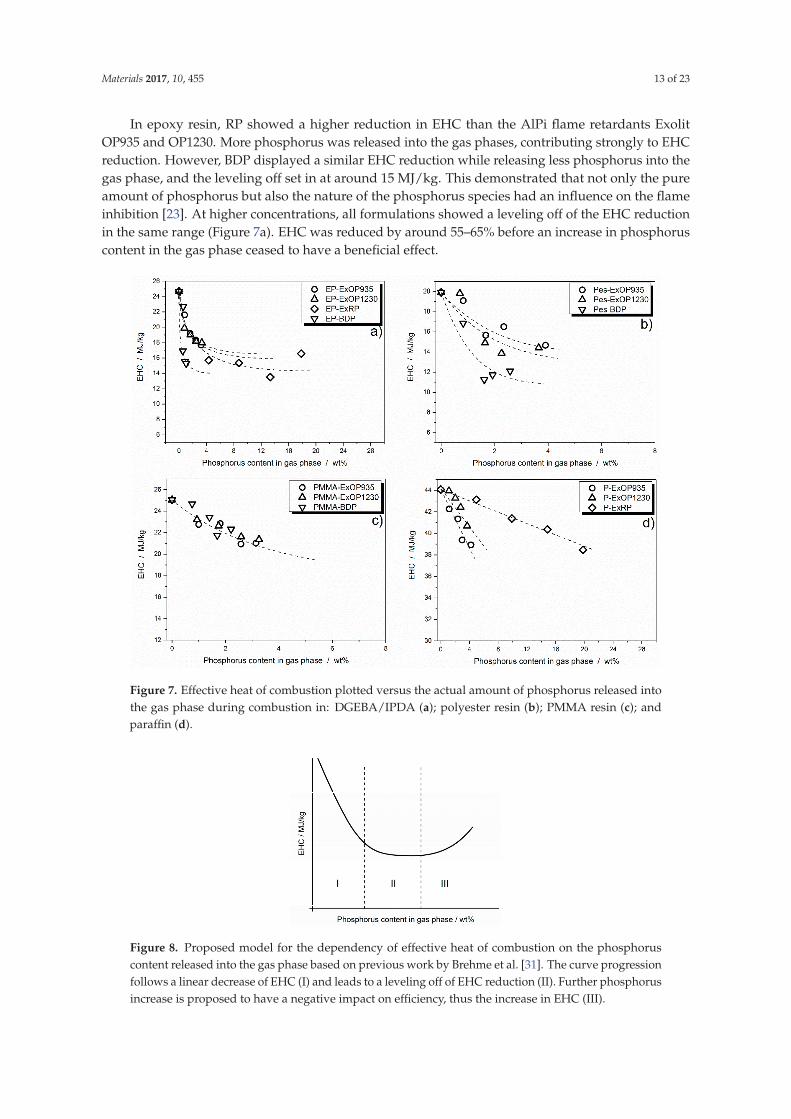
Materials 2017, 10, 455 13 of 23
In epoxy resin, RP showed a higher reduction in EHC than the AlPi flame retardants ExolitOP935 and OP1230. More phosphorus was released into the gas phases, contributing strongly to EHCreduction. However, BDP displayed a similar EHC reduction while releasing less phosphorus into thegas phase, and the leveling off set in at around 15 MJ/kg. This demonstrated that not only the pureamount of phosphorus but also the nature of the phosphorus species had an influence on the flameinhibition [23]. At higher concentrations, all formulations showed a leveling off of the EHC reductionin the same range (Figure 7a). EHC was reduced by around 55–65% before an increase in phosphoruscontent in the gas phase ceased to have a beneficial effect.
Figure 7. Effective heat of combustion plotted versus the actual amount of phosphorus released intothe gas phase during combustion in: DGEBA/IPDA (a); polyester resin (b); PMMA resin (c); andparaffin (d).
Figure 8. Proposed model for the dependency of effective heat of combustion on the phosphoruscontent released into the gas phase based on previous work by Brehme et al. [31]. The curve progressionfollows a linear decrease of EHC (I) and leads to a leveling off of EHC reduction (II). Further phosphorusincrease is proposed to have a negative impact on efficiency, thus the increase in EHC (III).
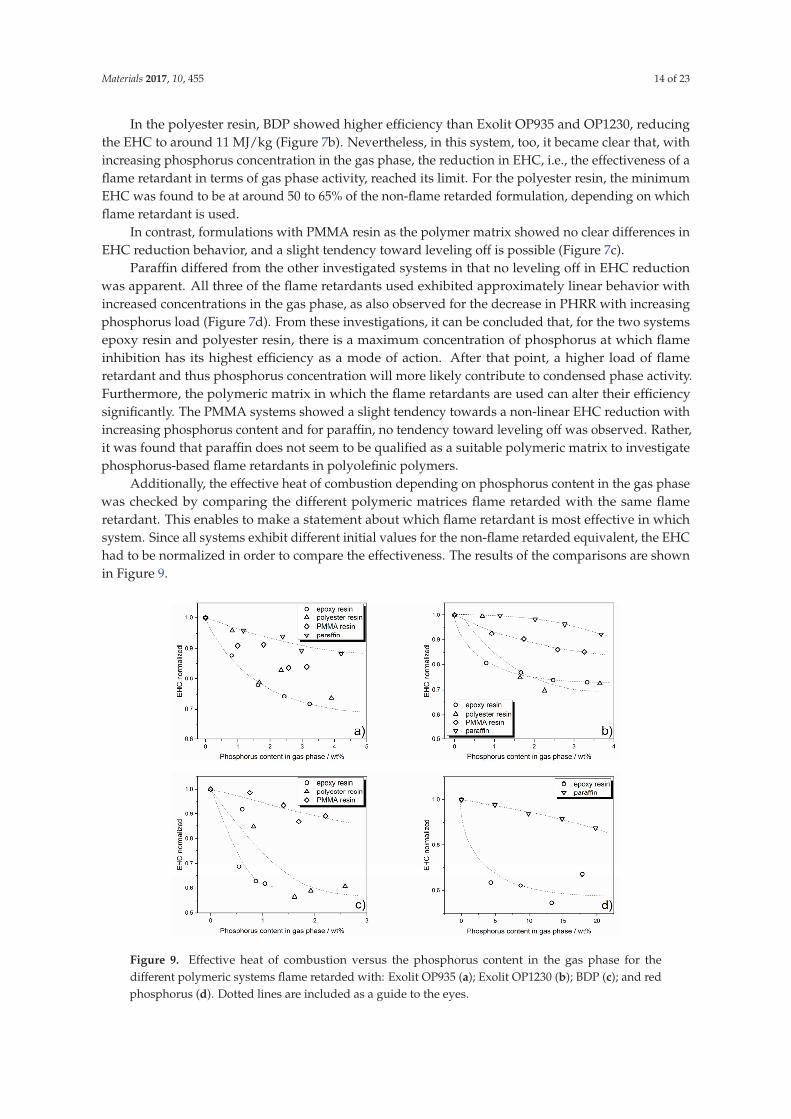
Materials 2017, 10, 455 14 of 23
In the polyester resin, BDP showed higher efficiency than Exolit OP935 and OP1230, reducingthe EHC to around 11 MJ/kg (Figure 7b). Nevertheless, in this system, too, it became clear that, withincreasing phosphorus concentration in the gas phase, the reduction in EHC, i.e., the effectiveness of aflame retardant in terms of gas phase activity, reached its limit. For the polyester resin, the minimumEHC was found to be at around 50 to 65% of the non-flame retarded formulation, depending on whichflame retardant is used.
In contrast, formulations with PMMA resin as the polymer matrix showed no clear differences inEHC reduction behavior, and a slight tendency toward leveling off is possible (Figure 7c).
Paraffin differed from the other investigated systems in that no leveling off in EHC reductionwas apparent. All three of the flame retardants used exhibited approximately linear behavior withincreased concentrations in the gas phase, as also observed for the decrease in PHRR with increasingphosphorus load (Figure 7d). From these investigations, it can be concluded that, for the two systemsepoxy resin and polyester resin, there is a maximum concentration of phosphorus at which flameinhibition has its highest efficiency as a mode of action. After that point, a higher load of flameretardant and thus phosphorus concentration will more likely contribute to condensed phase activity.Furthermore, the polymeric matrix in which the flame retardants are used can alter their efficiencysignificantly. The PMMA systems showed a slight tendency towards a non-linear EHC reduction withincreasing phosphorus content and for paraffin, no tendency toward leveling off was observed. Rather,it was found that paraffin does not seem to be qualified as a suitable polymeric matrix to investigatephosphorus-based flame retardants in polyolefinic polymers.
Additionally, the effective heat of combustion depending on phosphorus content in the gas phasewas checked by comparing the different polymeric matrices flame retarded with the same flameretardant. This enables to make a statement about which flame retardant is most effective in whichsystem. Since all systems exhibit different initial values for the non-flame retarded equivalent, the EHChad to be normalized in order to compare the effectiveness. The results of the comparisons are shownin Figure 9.
Figure 9. Effective heat of combustion versus the phosphorus content in the gas phase for thedifferent polymeric systems flame retarded with: Exolit OP935 (a); Exolit OP1230 (b); BDP (c); and redphosphorus (d). Dotted lines are included as a guide to the eyes.
Materials 2017, 10, 455 15 of 23
In order to compare the differences occurring with varying particle size distributions, both AlPiflame retardants Exolit OP935 and Exolit OP1230 are compared in the four different polymer matrices.Exolit OP935 is least efficient in paraffin, achieving only a reduction in EHC to 90%. In PMMA,a reduction to 85% is observed, followed by a reduction to around 75% in polyester resin. Exolit OP935performs best in epoxy resin, when it comes to reduction in EHC.
Exolit OP1230 shows only a minor effect in paraffin, reducing the EHC to 95% at the highestloading. In PMMA resin, the efficiency is higher. The EHC is reduced up to 85%. In epoxy resin andpolyester resin, Exolit OP1230 exhibits equally good EHC reduction, making both the ideal matrix forthis flame retardant.
This comparison showed that there are slight differences in effectiveness depending on thepolymer matrix resulting from different particle size distributions of Exolit OP935 and Exolit OP1230.Due to incorporation of BDP into the polymeric systems (Figure 9c), the EHC was reduced to around60% in the epoxy resin at around 1 wt % of phosphorus in the gas phase. In the polyester resin, a higherphosphorus content in the gas phase was observed, reducing the EHC to around 55% at 1.5 wt % ofreleased phosphorus. In the PMMA resin, only a reduction to around 85% was achieved.
Red phosphorus was incorporated into epoxy resin and paraffin. Both systems exhibit a totallydifferent behavior. As shown in Figure 6, the EHC of the separately burning red phosphorus is lowerthan the EHC of the paraffin matrix. The mean EHC depicted here is decreasing with higher flameretardant load, because the duration of burning red phosphorus increases. It is not a result of an activeflame inhibiting effect. In the epoxy system, red phosphorus shows a maximum reduction of EHC toaround 55% while releasing 13 wt % of phosphorus into the gas phase.
This matrix comparison for each flame retardant showed, that the effectiveness with increasingflame retardant load and thus phosphorus content is highly dependent on the polymer matrix.All systems, except for paraffin, exhibit a more or less distinctive non-linear leveling off behavior.In addition, modifications such as the particle size distributions may play a minor role in whether aflame retardant is more effective in one or another polymeric matrix. Furthermore, paraffin was shownto be unsuitable to simulate the fire behavior of a polyolefinic polymer matrix.
3.3.3. Dependency of Condensed Phase Activity on Phosphorus Content
Phosphorus remaining in the residue after burning reacted during pyrolysis to contribute tocondensed phase activity. The residue at the end of the cone calorimeter measurement is plotted versusthe phosphorus content remaining in the residue in Figure 10. This plot gives information about theinfluence of increasing phosphorus content in the residue on residue formation.
We propose that the curves resulting from all of the measured formulations take S-shapes, or areassumed to take an S-shape, as depicted in Figure 11. This is because the buildup of a protective layeris ever more significant with increasing amounts of flame retardant, in this case phosphorus content.The point of inflection of the sigmoidal curves, described by area II in Figure 11, is considered to be theamount of phosphorus needed to induce formation of a protective layer. After this inflection point,the amount of residue flattens again and results in a continuous increase with increasing phosphoruscontent (Figure 11 III).
In epoxy resin, the curve of residue increase for the BDP formulations has its point of inflection ata relatively low phosphorus concentration in the residue. This means that a protective layer effect, andthus the level of decomposition, started to influence the burning behavior after the inflection point,found at around 7 wt % of phosphorus in the residue. This is in accordance with previous results, inwhich BDP was shown to be a good precursor for condensed phase activity [6]. Depending on the stepheight of the sigmoidal curve, the degree of decomposition changes, up to a point, where the materialis incompletely pyrolyzed [44–46]. For BDP in epoxy resin, this step height is observed from around5 wt % to 15 wt % of residue. For Exolit OP935 and OP1230, the highest concentration of phosphorusin the investigated samples was at around 13 wt %. Up to this point, it is observed that the slope ofthe curve gradually increases. It is imaginable, that with higher flame retardant load, and thus higher

Materials 2017, 10, 455 16 of 23
concentrations of phosphorus found in the residue, the curve will exhibit a point of inflection as well,and continue as a sigmoidal curve. Red phosphorus incorporated in epoxy resin released more than90% of phosphorus into the gas phase during burning. Nevertheless, the concentration of phosphorusin the residue increased with higher flame retardant load. Since this increase was not as significantas for the AlPi flame retardants, the point of inflection will occur at a much higher concentration ofphosphorus in the residue (Figure 10a).
Figure 10. Residue plotted against the phosphorus content in the residue: DGEBA/IPDA (a); polyester(b); PMMA (c); and paraffin (d) system.
Figure 11. Proposed progression of residue formation with increasing phosphorus in the residue.The curve is divided into: an approximately linear phosphorus-residue relation (I); an area of inflectionof the curve (II); and a continuous increase of residue with phosphorus content after the inflectionpoint (III) [45].
BDP in the polyester resin had a similar effect as in the epoxy resin, exhibiting the sigmoidal curveprogression at relatively low concentrations of phosphorus in the residue. However, the amount ofresidue was relatively low as well, with only 4 wt % at the highest phosphorus concentration measured.The area of inflection in this system lies at around 7 wt % to 9 wt % of phosphorus in the residue.

Materials 2017, 10, 455 17 of 23
Since the height of the curve increases only slightly during the inflection, by around 2%, the changein decomposition level was much less than in the epoxy resin system. Residue formation was muchhigher for Exolit OP935 and OP1230, but the amount of phosphorus remaining in the residue variedmoderately, as was the case for the amount of phosphorus released into the gas phase (Figure 10b).
In the PMMA resin, BDP formed almost no residue at all. Only 1 wt % was built up at around13 wt % of phosphorus in the residue. For Exolit OP 935 and OP1230 a residue formation of 5 wt %was observed at a phosphorus concentration of around 14 wt % in the residue, which was the highestflame retardant load investigated (Figure 10c). In paraffin, the AlPi flame retardants Exolit OP935and OP1230 exhibited a very high concentration of phosphorus in the residue. The phosphorusconcentration stagnated at around 24 wt %, while the amount of residue formation increased up to4 wt %. Formulations with red phosphorus did not form any residue from which a sample could betaken for elemental analysis. Thus, it was assumed that all of the phosphorus content was released intothe gas phase (Figure 10d). In the PMMA resin and paraffin system, a trend such as the one proposedin Figure 11 was not recognizable. In fact, the phosphorus concentration in the residue was observedto be constant in the range of 0 to 20 wt % of flame retardant load. However, it is conceivable, that witheven higher load, the amount of phosphorus in the residue will increase additionally to the amountof residue.
For the epoxy and polyester resin formulations, it was observed that with increasing flameretardant load, the amount of phosphorus remaining in the residue increased as well, up to a pointwhere the concentration of phosphorus stagnated. Because of the increase in residue formation, it wasassumed that this is the point where the effect of a change in decomposition level, up to the presenceof incompletely pyrolyzed polymer due to a protective layer effect contributes more and more to theoverall flame retardancy performance.
Residue pictures of flame retarded epoxy resin formulations reveal the influence of a protectivelayer on burning performance (Figure 12). Whereas residues from EP-15-ExOP935 and EP-15-ExOP1230show beginnings of a closed residue surface that can serve as a protective layer, the residue of 15 wt %of RP in the epoxy resin is loose and brittle with no significant sign of a protective layer. In contrast tothose examples, the completely closed surface of the residue of EP-25-BDP is evidence of a protectivelayer effect on burning performance, which prevented the complete combustion of some of the material.
Figure 12. Residue pictures: EP (a); EP-15-ExOP935 (b); EP-15-ExOP1230 (c); EP-15-ExRP (d); andEP-25-BDP (e).
Exolit OP935 and OP1230 in polyester resin produced a residue that was very compact and hada closed surface, even though it was very light (Figure 13). However, due to the strong deformationduring burning, the residue broke and a significant effect of a protective layer was lost. Pes-25-BDP,
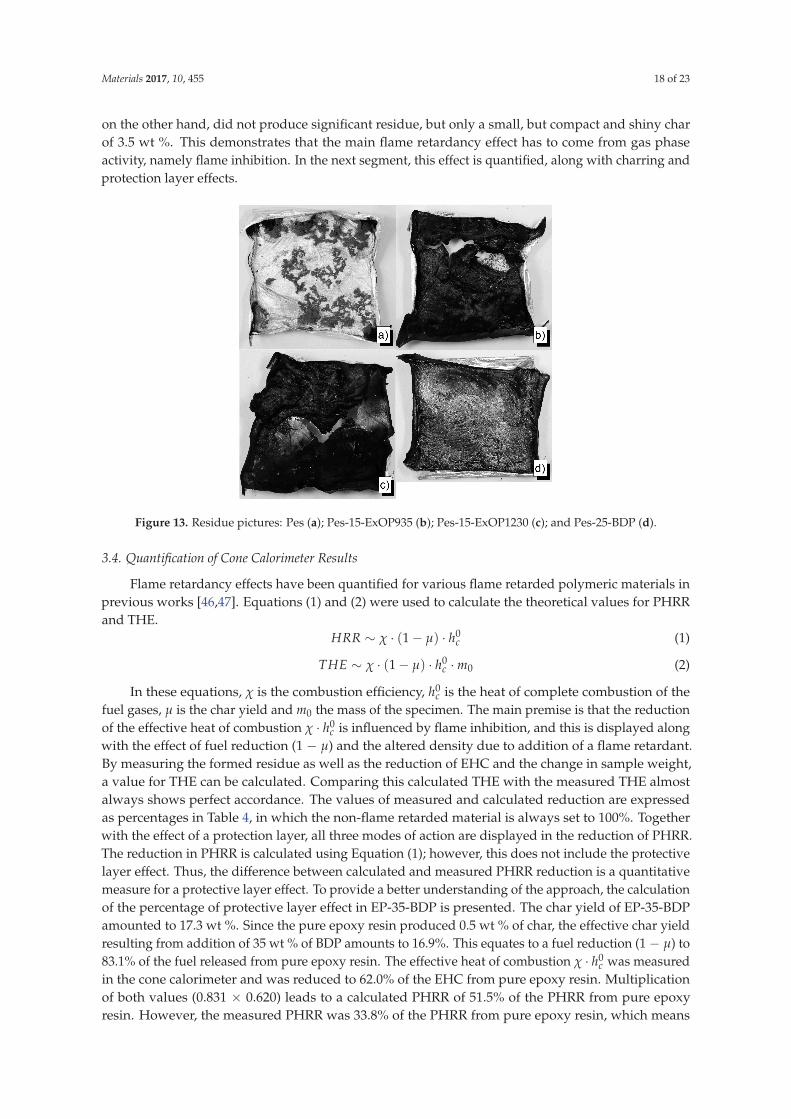
Materials 2017, 10, 455 18 of 23
on the other hand, did not produce significant residue, but only a small, but compact and shiny charof 3.5 wt %. This demonstrates that the main flame retardancy effect has to come from gas phaseactivity, namely flame inhibition. In the next segment, this effect is quantified, along with charring andprotection layer effects.
Figure 13. Residue pictures: Pes (a); Pes-15-ExOP935 (b); Pes-15-ExOP1230 (c); and Pes-25-BDP (d).
3.4. Quantification of Cone Calorimeter Results
Flame retardancy effects have been quantified for various flame retarded polymeric materials inprevious works [46,47]. Equations (1) and (2) were used to calculate the theoretical values for PHRRand THE.
HRR ∼ χ · (1 − μ) · h0c (1)
THE ∼ χ · (1 − μ) · h0c · m0 (2)
In these equations, χ is the combustion efficiency, h0c is the heat of complete combustion of the
fuel gases, μ is the char yield and m0 the mass of the specimen. The main premise is that the reductionof the effective heat of combustion χ · h0
c is influenced by flame inhibition, and this is displayed alongwith the effect of fuel reduction (1 − μ) and the altered density due to addition of a flame retardant.By measuring the formed residue as well as the reduction of EHC and the change in sample weight,a value for THE can be calculated. Comparing this calculated THE with the measured THE almostalways shows perfect accordance. The values of measured and calculated reduction are expressedas percentages in Table 4, in which the non-flame retarded material is always set to 100%. Togetherwith the effect of a protection layer, all three modes of action are displayed in the reduction of PHRR.The reduction in PHRR is calculated using Equation (1); however, this does not include the protectivelayer effect. Thus, the difference between calculated and measured PHRR reduction is a quantitativemeasure for a protective layer effect. To provide a better understanding of the approach, the calculationof the percentage of protective layer effect in EP-35-BDP is presented. The char yield of EP-35-BDPamounted to 17.3 wt %. Since the pure epoxy resin produced 0.5 wt % of char, the effective char yieldresulting from addition of 35 wt % of BDP amounts to 16.9%. This equates to a fuel reduction (1 − μ) to83.1% of the fuel released from pure epoxy resin. The effective heat of combustion χ · h0
c was measuredin the cone calorimeter and was reduced to 62.0% of the EHC from pure epoxy resin. Multiplicationof both values (0.831 × 0.620) leads to a calculated PHRR of 51.5% of the PHRR from pure epoxyresin. However, the measured PHRR was 33.8% of the PHRR from pure epoxy resin, which means

Materials 2017, 10, 455 19 of 23
that this further reduction has to be the result of other effects than fuel reduction and flame inhibition,which is mainly a protective layer effect. While more than those indices play a role in reducing thePHRR, it is considered to be one approximation to monitor protective layer effect. The change in steadystate burning phase would be more accurate, but hardly any of our materials exhibited such a phase.The efficiency of a protective layer is also different, when the measurement method changes, leadingto deviant behaviors in the cone calorimeter, UL94 and LOI tests.
Table 4. Quantification of the reduction in THE and PHRR due to the flame retardancy modes of action:charring, gas phase action, and residual protection layer for all of the examined systems.
Material(1 − μ) Ø·h0
c m0 Cal. THE THE Cal. PHRR PHRR Prot. Layer
% % % % % % % %
EP 100.0 100.0 100.0 100.0 100.0 100.0 100.0 0.0EP-5-ExOP935 96.1 87.7 103.8 87.5 87.5 84.3 87.9 −4.3EP-10-ExOP935 94.2 77.9 98.9 72.5 72.6 73.3 52.2 28.9EP-15-ExOP935 91.9 74.3 102.7 70.1 70.1 68.3 46.5 31.9EP-20-ExOP935 89.2 71.7 100.7 64.4 64.4 63.9 44.0 31.2EP-5-ExOP1230 95.6 80.6 105.5 81.3 88.2 77.1 59.5 22.8
EP-10-ExOP1230 94.1 77.1 103.6 75.2 75.2 72.5 59.0 18.6EP-15-ExOP1230 91.8 73.8 107.0 72.5 72.5 67.8 54.2 20.0EP-20-ExOP1230 89.7 72.9 101.7 66.5 66.5 65.4 46.3 29.2
EP-5-ExRP 94.2 63.7 104.8 62.9 62.9 60.0 51.9 13.5EP-10-ExRP 92.4 62.3 101.0 58.1 58.1 57.5 42.3 26.5EP-15-ExRP 91.8 54.8 103.7 52.2 52.1 50.3 36.2 27.9EP-20-ExRP 90.5 67.2 101.4 61.7 61.6 60.8 47.0 22.7EP-10-BDP 95.4 92.0 103.7 91.1 91.0 87.8 79.0 10.0EP-20-BDP 85.5 68.6 102.8 60.3 60.3 58.7 37.0 36.9EP-25-BDP 84.6 63.0 104.0 55.4 55.4 53.3 35.5 33.3EP-35-BDP 83.1 62.0 101.4 52.3 52.3 51.5 33.8 34.4
Pes 100.0 100.0 100.0 100.0 100.0 100.0 100.0 0.0Pes-5-ExOP935 96.0 95.9 101.3 93.3 90.7 92.1 84.0 8.8Pes-10-ExOP935 92.4 78.7 96.6 70.2 68.4 72.7 58.9 18.9Pes-15-ExOP935 91.6 82.9 102.3 77.6 75.2 75.9 56.8 25.2Pes-20-ExOP935 91.5 73.6 98.9 66.6 64.6 67.4 51.2 24.0Pes-5-ExOP1230 96.4 99.5 102.4 98.2 95.2 95.9 95.3 0.5
Pes-10-ExOP1230 91.6 74.8 102.4 70.2 73.7 68.6 42.1 38.6Pes-15-ExOP1230 90.8 69.7 101.1 63.9 77.8 63.2 59.3 6.2Pes-20-ExOP1230 90.1 72.4 101.3 66.1 64.9 65.3 44.8 31.3
Pes-10-BDP 99.0 84.6 100.3 84.0 82.5 83.8 71.5 14.7Pes-20-BDP 98.0 56.5 100.3 55.5 70.5 55.4 61.8 -11.7Pes-25-BDP 96.6 58.9 99.3 56.5 63.2 56.9 56.0 1.4Pes-35-BDP 95.4 60.8 98.9 57.3 59.3 58.0 52.9 8.8
PMMA 100.0 100.0 100.0 100.0 100.0 100.0 100.0 0.0PMMA-5-ExOP935 98.9 90.9 97.5 87.6 87.6 89.9 79.6 11.4PMMA-10-ExOP935 97.6 91.2 93.4 83.1 83.1 89.0 75.4 15.2PMMA-15-ExOP935 96.3 83.6 97.4 78.4 78.4 80.5 70.4 12.6PMMA-20-ExOP935 94.4 83.9 96.5 76.4 76.5 79.2 58.6 26.0PMMA-5-ExOP1230 98.6 92.6 99.4 90.8 90.7 91.3 81.1 11.1PMMA-10-ExOP1230 97.2 90.3 95.0 83.4 83.4 87.8 68.7 21.7PMMA-15-ExOP1230 96.7 86.3 97.1 80.9 81.0 83.4 64.5 22.6PMMA-20-ExOP1230 95.3 85.3 95.2 77.4 77.4 81.3 59.0 27.4
PMMA-10-BDP 99.6 104.6 97.6 101.7 101.4 104.2 102.6 1.5PMMA-20-BDP 99.5 93.5 97.9 91.1 91.1 93.0 94.6 -1.7PMMA-25-BDP 99.4 86.8 99.2 85.6 85.6 86.3 82.6 4.3PMMA-35-BDP 99.3 89.1 98.3 87.0 87.0 88.5 88.3 0.2
P 100.0 100.0 100.0 100.0 100.0 100.0 100.0 0.0P-5-ExOP935 100.1 95.9 98.2 94.2 94.7 96.0 64.6 32.7
P-10-ExOP935 100.1 93.2 96.3 90.4 90.4 93.9 53.2 43.4P-15-ExOP935 98.0 89.4 99.1 86.8 87.5 87.5 45.8 47.7P-20-ExOP935 98.1 88.3 103.3 89.5 89.3 86.6 37.7 56.5P-5-ExOP1230 99.9 99.7 94.5 94.1 93.9 99.7 95.9 3.8P-10-ExOP1230 98.7 98.2 102.9 99.8 99.9 97.0 95.7 1.3P-15-ExOP1230 97.1 96.3 98.0 91.6 93.2 93.5 85.4 8.6P-20-ExOP1230 95.8 92.3 102.2 90.4 89.8 88.5 75.3 14.9
P-5-ExRP 99.6 97.9 103.1 100.5 101.1 97.5 98.3 -0.8P-10-ExRP 99.5 93.9 102.5 95.8 95.7 93.5 92.8 0.7P-15-ExRP 99.8 100.7 100.1 91.5 91.3 91.4 85.4 6.5P-20-ExRP 99.8 87.3 104.2 90.8 90.4 87.1 84.1 3.5

Materials 2017, 10, 455 20 of 23
For most of the specimens investigated, the effect of a protective layer was quite low. In the caseof BDP in epoxy resin, the share of flame retardancy performance coming from a protective layer modeof action increased with increasing BDP load. This confirms the previous conclusions and complieswith the conclusions from observing the residue pictures. Both AlPi flame retardants gave similarresults in the epoxy resin, reducing the PHRR to around 45% at a flame retardant load of 20 wt %.They worked mainly in the gas phase. Red phosphorus, at a load of 20 wt %, was calculated to have thelowest protective layer effect of all tested flame retardants in epoxy resin, while achieving a satisfactoryreduction in PHRR.
The ratio between PHRR reduction and the share in effectiveness that does not come from aprotective layer effect was especially good in the polyester resin-BDP system. The PHRR was reducedto around 53%, and only 9% of this reduction is due to a protective layer effect. Twenty weight percentof ExOP1230 showed a slightly better PHRR reduction than ExOP935, but the share of the protectivelayer effect was also higher, at 39% compared to 26%.
BDP incorporated in the PMMA resin had the worst performance of any BDP formulation. At aload of 20 wt %, the PHRR was reduced to only 88%. Practically no protective layer effect could bedetected. Both AlPi flame retardants showed about the same PHRR reduction at 20 wt % load, and theshare in protection layer effect was similar as well.
In paraffin, a reduction of PHRR of around 64% was achieved with 20 wt % of Exolit OP935.However, 59% of the flame retardant effect was due to a protective layer. Those calculated values arenot in accordance with the observations made during burning. No protective layer was formed duringthe forced flaming combustion tests in the cone calorimeter. Rather, the residue formed right beforethe flames extinguished.
According to the results depicted in Table 4, BDP and red phosphorus are the most effective flameretardants in epoxy resin. Up to a load of 25 wt %, the flame inhibition efficiency of BDP reaches itsmaximum. For red phosphorus, 15 wt % were concluded to be the optimal concentration in this system.In the polyester resin, Exolit OP1230 at a load of 10 to 20 wt % was most efficient. In the PMMA resin,the AlPi flame retardants showed their best performance at 20 wt %, while the incorporation of BDPdid not result in satisfactory results even at high loads of 35 wt %. Differences in both tested AlPi flameretardants were most pronounced in paraffin. Twenty weight percent of Exolit OP935 in paraffin wasconcluded to be the best combination.
4. Conclusions
The use of easily preparable thermosets for investigating flame retardant modes of action,particularly flame inhibition in this work, was shown to be an effective method. Commerciallyavailable resins as well as paraffin were used to replace the time-consuming extrusion and injectionmolding of specimens. Although some flame retardants could not be implemented in certain matricesdue to interferences with the curing process, much was learned from thermogravimetric analysis,infrared spectroscopy and burning behavior under forced flaming conditions. The dependence of EHCreduction and residue formation on phosphorus content in the gas phase and on residue, respectively,was revealed and investigated for each polymer matrix. Additionally, the performance in terms ofEHC of a single flame retardant was compared among the different polymeric matrices. It was foundthat paraffin is not a suitable matrix for the rapid incorporation and investigation of modes of actionof flame retardants and failed as a model for polyolefinic systems. The other polymer matrices gavegreat insight into the leveling off of flame inhibition efficiency of phosphorus-based flame retardants.Furthermore, the effect of particle size distribution was observed by comparing Exolit OP935 andExolit OP1230 in epoxy resin and polyester resin, respectively. It was found that the finer grainedExolit OP935 is most effective in epoxy resin, whereas incorporation of Exolit OP1230 does not exhibita large difference in epoxy resin and polyester resin. To investigate and explain the behavior ofresidue formation with increasing phosphorus content in the residue, a thesis for a crucial phosphorusconcentration inducing a protective layer effect was proposed and proven in certain formulations, such
Materials 2017, 10, 455 21 of 23
as for BDP in epoxy or polyester resin. It was proposed that, for these specific formulations, there is acritical phosphorus concentration, at which the level of degradation changes significantly, up to theretention of incompletely pyrolyzed polymer due to a protective layer. The results were quantified withsimple calculations and it was shown that they are in great accordance with observed and measuredoutcomes. However, it has to be mentioned that flame retardant behavior and performance in apolymeric system is not easy to generalize. There are noticeable trends when it comes to the changes ineffectiveness and flame retardant mode of action of varying loads of BDP in epoxy resin, for example,but they do not allow predictions of behavior for a different epoxy-based polymeric system. Thesesystems do not give a statement about the fire behavior of any epoxy-, acrylate- or polyester-basedpolymer, besides the ones studied. Overall, several new relations between polymer matrix, phosphorusspecies, phosphorus concentration and results under forced flaming conditions were clarified.
Author Contributions: Sebastian Rabe conceptualized the working packages for this project and the scientificwork. Sebastian Rabe carried out specimen preparation, experiments and data evaluation as well as thescientific discussion. Sebastian Rabe wrote this publication. Yuttapong Chuenban performed sample preparation,experiments, and data evaluation, and contributed to the interpretation of the results. Bernhard Schartel acquiredthe project and conceived the basic idea of the project. Bernhard Schartel supervised the work and contributedto the scientific discussion of the results and the conclusions. Bernhard Schartel collaborated on the writing ofthis publication.
Conflicts of Interest: The authors declare no conflict of interest.
References
1. Lyon, R.E.; Walters, R.N. Pyrolysis combustion flow calorimetry. J. Anal. Appl. Pyrolysis 2004, 71, 27–46.[CrossRef]
2. Wilkie, C.A.; Chigwada, G.; Gilman, J.W.; Lyon, R.E. High-throughput techniques for the evaluation of fireretardancy. J. Mater. Chem. 2006, 16, 2023–2029. [CrossRef]
3. Rabe, S.; Schartel, B. The Rapid Mass Calorimeter: A route to high throughput fire testing. Fire Mater. 2016.[CrossRef]
4. Rabe, S.; Schartel, B. The rapid mass calorimeter: Understanding reduced-scale fire test results. Polym. Test.2017, 57, 165–174. [CrossRef]
5. Weil, E.D.; Levchik, S.V. Flame retardants for plastics and textiles. In Practical Applications, 2nd ed.;Carl Hansen Verlag: Munich, Germany, 2015.
6. Levchik, S.V. A review of recent progress in phosphorus-based flame retardants. J. Fire Sci. 2006, 24, 345–364.[CrossRef]
7. Levchik, S.V.; Weil, E.D. Developments in phosphorus flame retardants. In Advances in Fire Retardant Materials;Horrocks, A.R., Price, D., Eds.; Woodhead Publishing Ltd.: Cambridge, UK, 2008; pp. 41–66.
8. Brauman, S.K. Phosphorus fire retardants in polymers. 1. General mode of action. J. Fire Retard. Chem. 1977,4, 18–37.
9. Hastie, J.W. Molecular basis of flame inhibition. J. Res. Natl. Stand. Sec. A 1973, 77A, 733–754. [CrossRef]10. Brehme, S.; Schartel, B.; Goebbels, J.; Fischer, O.; Pospiech, D.; Bykov, Y.; Döring, M. Phosphorus Polyester
Versus Aluminium Phosphinate in Poly(butylene terephthalate) (PBT): Flame Retardancy Performance andMechanisms. Polym. Degrad. Stab. 2011, 96, 875–884. [CrossRef]
11. Schartel, B. Phosphorus-based flame retardancy mechanisms—Old hat or a starting point for futuredevelopment? Materials 2010, 3, 4710–4745. [CrossRef]
12. Levchick, S.V. Introduction to flame retardancy and polymer flammability. In Flame Retardant PolymerNanocomposites; Morgan, A.B., Wilkie, C.A., Eds.; John Wiley & Sons: Hoboken, NJ, USA, 2007; Chapter 1;pp. 1–29.
13. Bourbigot, S.; Le Bras, M.; Duquesne, S.; Rochery, M. Recent Advances for Intumescent Polymers.Macromol. Mater. Eng. 2004, 289, 499–511. [CrossRef]
14. Camino, G.; Lomakin, S. Intumescent materials. In Fire Retardant Materials; Horrocks, A.R., Price, D., Eds.;Woodhead Publishing: Cambridge, UK, 2001; Chapter 10; pp. 318–336.
15. Brauman, S.K. Phosphorus fire retardance in polymers. 2. Retardant-polymer substrate interactions. J. FireRetard. Chem. 1977, 4, 38–58.

Materials 2017, 10, 455 22 of 23
16. Braun, U.; Schartel, B. Effect of Red Phosphorus and Melamine Polyphosphate on the Fire Behavior of HIPS.J. Fire Sci. 2005, 23, 5–30. [CrossRef]
17. Braun, U.; Schartel, B. Flame Retardancy Mechanisms of Aluminium Phosphinate in Combination withMelamine Cyanurate in Glass-Fibre.Reinforced Poly(1,4-butylene terephthalate). Macromol. Mater. Eng. 2008,293, 206–217. [CrossRef]
18. Langfeld, K.; Wilke, A.; Sut, A.; Greiser, A.; Ulmer, B.; Andrievici, V.; Limbach, P.; Bastian, M.; Schartel, B.Halogen-free fire retardant styrene–ethylene–butylene–styrene-based thermoplastic elastomers usingsynergistic aluminum diethylphosphinate-based combinations. J. Fire Sci. 2015, 33, 157–177. [CrossRef]
19. Gallo, E.; Schartel, B.; Braun, U.; Russo, P.; Acierno, D. Fire Retardant Synergisms between Nanometric Fe2O3
and Aluminium Phosphinate in Poly(butylene terephthalate). Polym. Adv. Technol. 2011, 22, 2382–2391.[CrossRef]
20. Gallo, E.; Schartel, B.; Acierno, D.; Russo, P. Flame Retardant Biocomposites: Synergism between Phosphinateand Nanometric Metal Oxides. Eur. Polym. J. 2011, 47, 1390–1401. [CrossRef]
21. Braun, U.; Bahr, H.; Sturm, H.; Schartel, B. Flame retardancy mechanisms of metal phosphinates andmetal phosphinates in combination with melamine cyanurate in glass-fiber reinforced poly(1,4-butyleneterephthalate): The influence of metal cation. Polym. Adv. Technol. 2008, 19, 680–692. [CrossRef]
22. Lyons, J.W. Mechanisms of Fire Retardation with Phosphorus Compound: Some Speculations. J. Fire Flam.1970, 1, 302–311.
23. Braun, U.; Balabanovich, A.I.; Schartel, B.; Knoll, U.; Artner, J.; Ciesielski, M.; Döring, M.; Perez, R.;Sandler, J.K.W.; Altstädt, V.; et al. Influence of the Oxidation State of Phosphorus on the Decomposition andFire Behaviour of Flame-Retarded Epoxy Resin Composites. Polymer 2006, 47, 8495–8508. [CrossRef]
24. Hergenrother, P.M.; Thompson, C.M.; Smith, J.G., Jr.; Connell, J.W.; Hinkley, J.A.; Lyon, R.E.; Moulton, R.Flame retardant aircraft epoxy resins containing phosphorus. Polymer 2005, 46, 5012–5024. [CrossRef]
25. Perret, B.; Pawlowski, K.H.; Schartel, B. Fire Retardancy Mechanisms of Arylphosphates in Polycarbonate(PC) and PC/Acrylonitrile-Butadiene-Styrene: The Key Role of Decomposition Temperature. J. Therm.Anal. Calorim. 2009, 97, 949–958. [CrossRef]
26. Pawlowski, K.H.; Schartel, B. Flame retardancy mechanisms of triphenyl phosphate, resorcinol bis(diphenylphosphate) and bisphenol-A bis(diphenylphosphate) in polycarbonate/acrylonitrile-butadiene-styreneblends. Polym. Int. 2007, 56, 1404–1414. [CrossRef]
27. Wawrzyn, E.; Schartel, B.; Ciesielski, M.; Kretzschmar, B.; Braun, U.; Döring, M. Are Novel ArylPhosphates Competitors for Bisphenol A bis(diphenyl phosphate) in Halogen-free Flame-retardedPolycarbonate/Acrylonitrile-butadiene-styrene Blends? Eur. Polym. J. 2012, 48, 1561–1574. [CrossRef]
28. Schartel, B.; Kunze, R.; Neubert, D. Red phosphorus-controlled decomposition for fire retardant PA 66.J. Appl. Polym. Sci. 2002, 83, 2060–2071. [CrossRef]
29. Schartel, B.; Balabanovich, A.I.; Braun, U.; Knoll, U.; Artner, J.; Ciesielski, M.; Döring, M.; Perez, R.;Sandler, J.K.W.; Altstädt, V.; et al. Pyrolysis of epoxy resins and fire behavior of epoxy resin compositesflame-retarded with 9,10-dihydro-9-oxa-10-phosphaphenanthrene-10-oxide additives. J. Appl. Polym. Sci.2007, 104, 2260–2269. [CrossRef]
30. Schartel, B.; Perret, B.; Dittrich, B.; Ciesielski, M.; Krämer, J.; Müller, P.; Altstädt, V.; Zang, L.; Döring, M. FlameRetardancy of Polymers: The Role of Specific Reactions in the Condensed Phase. Macromol. Mater. Eng. 2016,301, 9–35. [CrossRef]
31. Brehme, S.; Köppl, T.; Schartel, B.; Altstädt, V. Competition in aluminium phosphinate-based halogen-freeflame retardancy of poly(butylene terephthalate) and its glass-fibre composites. E-Polymers 2014, 14, 193–208.[CrossRef]
32. Schartel, B.; Bartholmai, M.; Knoll, U. Some comments on the use of cone calorimeter data. Polym. Degrad. Stab.2005, 88, 540–547. [CrossRef]
33. Liu, X.Q.; Liu, J.Y.; Sun, S.; Chen, J. A New Type of Flame Retarded Epoxy Resin Based on Metal Phosphinates.Polym. Polym. Compos. 2012, 20, 151–154.
34. Braun, U.; Schartel, B.; Fichera, M.A.; Jäger, C. Flame retardancy mechanisms of aluminium phosphinatein combination with melamine polyphosphate and zinc borate in glass-fibre reinforced polyamide 6,6.Polym. Degrad. Stab. 2017, 92, 1528–1545. [CrossRef]
35. Braun, U.; Bahr, H.; Schartel, B. Fire retardancy effect of aluminium phosphinate and melaminepolyphosphate in glass fibre reinforced polyamide 6. E-Polymers 2010, 10, 443–456.

Materials 2017, 10, 455 23 of 23
36. Seefeldt, H.; Duemichen, E.; Braun, U. Flame retardancy of glass fiber reinforced high temperature polyamideby use of aluminium diethylphosphinate: Thermal and thermo-oxidative effects. Polym. Int. 2013, 62,1608–1616.
37. Ellis, B. Chemistry and Technology of Epoxy Resin; Blackie Academic & Professional: London, UK, 1993.38. Pham, H.Q.; Marks, M.J. Epoxy Resins; Wiley-VCH: Weinheim, Germany, 2005.39. Täuber, K.; Marsico, F.; Wurm, F.R.; Schartel, B. Hyperbranched poly(phosphoester)s as flame retardants for
technical and high performance polymers. Polym. Chem. 2014, 5, 7042–7053. [CrossRef]40. Sut, A.; Greiser, S.; Jäger, C.; Schartel, B. Interactions in multicomponent flame-retardant polymers: Solid-state
NMR identifying the chemistry behind it. Polym. Degrad. Stab. 2015, 121, 116–125. [CrossRef]41. Duquesne, S.; Fontaine, G.; Cérin-Delaval, O.; Gardelle, B.; Tricot, G.; Bourbigot, S. Study of the thermal
degradation of an aluminium phosphinate-aluminium trihydrate combination. Thermochim. Acta 2013, 551,175–183. [CrossRef]
42. Sonnier, R.; Viretto, A.; Dumazert, L.; Gallard, B. A method to study the two-step decomposition of binaryblends in cone calorimeter. Combust. Flame 2016, 169, 1–10. [CrossRef]
43. Levchik, G.F.; Levchik, S.V.; Camino, G.; Weil, E.D. Fire retardant action of red phosphorus in Nylon 6.In Fire Retardancy of Polymers the Use of Intumescence; Le Bras, M., Camino, G., Bourbigot, S., Delobel, R., Eds.;The Royal Society of Chemistry: London, UK, 1998; pp. 304–315.
44. Wang, X.; Xing, W.; Feng, X.; Yu, B.; Song, L.; Hu, Y. Functionalization of graphene with graftedpolyphosphamide for flame retardant epoxy composites: Synthesis, flammability and mechanism.Polym. Chem. 2014, 5, 1145–1154. [CrossRef]
45. Eckel, T. The most important flame retardant plastics. In Plastics Flammability Handbook; Troitzsch, J, Ed.;Hanser: Munich, Germany, 2004; pp. 158–172.
46. Brehme, S.; Köppl, T.; Schartel, B.; Fischer, O.; Altstädt, V.; Pospiech, D.; Döring, M. PhosphorusPolyester—An Alternative to Low-Molecular-Weight Flame Retardants in Poly(Butylene Terephthalate)?Macromol. Chem. Phys. 2012, 213, 2386–2397. [CrossRef]
47. Pappalardo, S.; Russo, P.; Acierno, D.; Rabe, S.; Schartel, B. The synergistic effect of organically modifiedsepiolite in intumescent flame retardant polypropylene. Eur. Polym. J. 2016, 76, 196–207. [CrossRef]
© 2017 by the authors. Licensee MDPI, Basel, Switzerland. This article is an open accessarticle distributed under the terms and conditions of the Creative Commons Attribution(CC BY) license (http://creativecommons.org/licenses/by/4.0/).

85
Summary
Due to the ever-increasing number of additives, adjuvants, synergists, and fillers, together with
variations in concentration, particle size distribution and other modifications, methods for
accelerated assessment of flame retarded polymeric materials are strongly needed. This work
presents two novel approaches to assess the rapid screening of flame retardants in polymeric
materials. Furthermore, flame retardants exhibit varying behavior in different polymer matrices
and at different concentrations. The mode of action of a flame retardant ought to be quickly
investigated to find the optimal conditions for the desired application. These two premises, the
need for rapid flame retardant performance screening and the desire for a quick and reliable
mode of action evaluation, are the foundation of the presented work.
High throughput performance screening of flame retardants in polymeric systems was realized
by establishing an expedient measurement setup based on a commercially available mass loss
calorimeter. The resulting rapid mass calorimeter combines the advantages of both state-of-the-
art methods for this kind of assessment, namely the cone calorimeter and the pyrolysis
combustion flow calorimeter. By reducing the size of a cone calorimeter specimen from ten by
ten to two by two centimeters in surface area, the measurement time was drastically reduced
while maintaining the possibility to assess macroscopic effects in fire behavior. The aim of this
work was, besides developing a reliable screening method with the rapid mass calorimeter, to
investigate the change in burning behavior with varying specimen size and to evaluate the
significance of the obtained results by analyzing correlations with existing fire tests. The rapid
mass calorimeter was shown to be a useful tool for the rapid screening of flame retarded
polymeric materials by producing significant results while overcoming the challenge of sample
size reduction.
Furthermore, a screening method for the rapid investigation of modes of action of flame
retardants in polymeric systems is presented. Here, the use of easily preparable polymeric resins
in the laboratory in small scale, as opposed to extrusion and injection molding, aims to shift the

86
bottleneck of the whole process away from sample preparation. Four different phosphorus-
based flame retardants were used in four different polymeric systems at varying concentrations,
providing a great data pool to investigate miscellaneous dependencies of the mode of action of
a flame retardant. The role of phosphorus in these experiments was examined by measuring the
amount of phosphorus which remained in the residue after burning. An interesting relationship
between the amount of formed residue and the phosphorus content in the residue was found for
some flame retardant – matrix – combinations. Additionally, the amount of phosphorus which
was released into the gas phase during burning was calculated and the relationship between a
flame inhibiting effect and phosphorus content in the gas phase was studied. For most
formulations, a leveling off effect was found with increasing phosphorus concentration, hinting
at a limited effectiveness of phosphorus-based flame retardants for higher concentrations in
terms of gas phase activity. Quantification of the flame retardancy effects clarified the
respective contributions of the modes of action to the overall performance of a flame retardant.
In conclusion, this approach presented a valuable method for identifying and quantifying the
main mode of action of a phosphorus-based flame retardant in a polymeric matrix.

87
Zusammenfassung
Aufgrund der stetig steigenden Zahl an Additiven, Hilfsmitteln, Synergisten, Füllstoffen usw.,
die in Konzentration, Partikelgrößenverteilung oder anderen Modfikationen variiert werden
können, sind Methoden zur beschleunigten Beurteilung flammgeschützter Polymerwerkstoffe
heutzutage dringend nötig. Flammschutzmittel zeigen unterschiedliches Verhalten in
unterschiedlichen Polymermatrizen und variierenden Konzentrationen. Daher muss auch hier
eine Methode gefunden werden, um die Wirkmechanismen eines Flammschutzmittels in
Abhängigkeit der genannten Variablen zu untersuchen, um letztendlich die optimalen
Bedingungen für die gewünschte Anwendung zu ermitteln. Diese beiden Ausgangspunkte, der
Bedarf an einer schnellen Screeningmethode nach Flammschutzmitteleffektivität und der
Wunsch nach einer schnellen Untersuchung der Wirkmechanismen von Flammschutzmitteln,
sind die Grundlage der vorliegenden Arbeit.
Ein Hochdurchsatzverfahren zur Beurteilung der Effektivität von Flammschutzmitteln in
Polymerwerkstoffen wurde mit Hilfe eines Messaufbaus realisiert, der auf dem kommerziell
verfügbaren mass loss calorimeter basiert. Das daraus hervorgehende rapid mass calorimeter
vereint die Vorteile beider heutzutage etablierter Messmethoden, namentlich cone calorimeter
und pyrolysis combustion flow calorimeter. Indem die Probengröße einer cone calorimeter-
Probe von zehn mal zehn mm² auf zwei mal zwei mm² in der Oberfläche reduziert wurde,
konnte die benötigte Messzeit drastisch verringert werden, während die Möglichkeit zur
Untersuchung makroskopischer Brandeffekte erhalten werden konnte. Neben dem Ziel, eine
verlässliche und reproduzierbare Messmethode mit dem rapid mass calorimeter zu entwickeln,
wurde das Brandverhalten der in der Größe reduzierten Proben im Detail analysiert. Die
Aussagekraft der mit dem rapid mass calorimeter erhaltenen Resultate wurde durch
Korrelationsuntersuchungen mit bereits existierenden Brandtests analysiert.
Des Weiteren wird eine Methode zur schnellen Untersuchung der Wirkungsweisen von
Flammschutzmitteln in Polymerwerkstoffen vorgestellt. Dabei war es unter anderem das Ziel,

88
den Flaschenhals des gesamten Prozesses von der Probenherstellung wegzubewegen, indem
einfach im Labormaßstab herzustellende Polymerharze verwendet werden. Vier verschiedene
phosphorbasierte Flammschutzmittel wurden in vier verschiedene polymere Systeme mit
variierenden Konzentrationen integriert. Diese Menge an Daten ermöglicht es, verschiedenste
Abhängigkeiten der Wirkmechanismen von Flammschutzmitteln zu untersuchen. Die Rolle des
in den Flammschutzmitteln enthaltenen Phosphors wurde durch Ermitteln des Phosphorgehalts
im Brandrückstand untersucht. Dabei wurden für einige Flammschutzmittel - Polymerharz -
Kombinationen interessante Beziehungen gefunden. Zusätzlich wurde die Menge an während
des Brandes in die Gasphase austretenden Phosphors berechnet. Dies ermöglichte die
Untersuchung der Flammenvergiftung in Abhängigkeit von der Phosphorkonzentration in der
Gasphase. Für die meisten Formulierungen wurde dabei eine abklingende Effektivität bei
höheren Konzentrationen festgestellt, was auf eine eingeschränkte Wirksamkeit hinweist. Um
die Beiträge der einzelnen Flammschutzeffekte zur gesamten Leistung des Flammschutzmittels
zu ermitteln, wurden die Ergebnisse quantifiziert. Alles in Allem stellt dieser Teil der
vorgelegten Arbeit eine Herangehensweise dar, die es erlaubt, die wichtigsten Wirkungsweisen
von Flammschutzmitteln in Polymeren auf schnellem Wege zu identifizieren und zu
quantifizieren.

89
References
1. Alaee M, Wenning RJ. The significance of brominated flame retardants in the environment: current understanding, issues and challenges. Chemosphere. 2002;46:579-582.
2. de Wit CA. An overview of brominated flame retardants in the environment. Chemosphere. 2002:583-624.
3. Schartel B. Phosphorus-based Flame Retardancy Mechanisms - Old Hat or a Starting Point for Future Development? Materials. 2010;10:4710-4745.
4. Braun U, Schartel B, Fichera MA, Jäger C. Flame retardancy mechanisms of aluminium phosphinate in combination with melamine polyphosphate and zinc borate in glass-fibre reinforced polyamide 6,6. Polymer Degradation and Stability. 2007;8:1528-1545.
5. Levchik SV, Weil ED. A review of recent progress in phosphorus-based flame retardants. Journal of Fire Science. 2006;5:345-364.
6. Pawlowski KH, Schartel B. Flame retardancy mechanisms of aryl phosphates in combination with boehmite in bisphenol A polycarbonate/acrylonitrile-butadiene-styrene blends. Polymer Degradation and Stability. 2008;3:657-667.
7. Lewin M. Synergism and Catalysis in Flame Retardancy of polymers. Polymers for Advanced Technologies. 2001;12:215-222.
8. Weil ED. Synergists, adjuvants and antagonists in flame-retardant systems. In: Grand AF, Wilkie CA, eds. Fire retardancy of polymeric materials. Vol 1. 1st ed. New York: Marcel Dekker, Inc.; 2000.
9. Lewin M. Synergistic and catalytic effects in flame retardancy of polymeric materials - an overview. Journal of Fire Sciences ;1:3-19.
10. Lyon RE. Plastics and Rubber. In: Harper CA, ed. Handbook of Building Materials for Fire Protection. New York: McGraw-Hill; 2004.
11. Braumann SK. Phosphorus fire retardance in polymers. 2. Retardant-Polymer Substrate Interactions. Journal of Fire Retardant Chemistry. 1977:18-58.
12. Braun U, Balabanovich AI, Schartel B, Knoll U, Artner J. Influence of the oxidation state of phosphorus on the decomposition and fire behaviour of flame-retarded epoxy resin composites. Polymer. 2006;26:8495-8508.
13. Wilkie CA. How Important is Synergy? Paper presented at: 27th Annual Conference on Recent Advancs in Flame Retardancy of Polymeric Materials FLAME, 2016; Stamford, CT, USA.

90
14. Green J. Phosphorus-Containing Flame Retardants. In: Grand AF, Wilkie CA, eds. Fire Retardancy of Polymeric Materials. 1st ed. New York: Marcel Dekker, Inc.; 2000.
15. Bourbigot S, Le Bras M, Duquesne S, Rochery M. Recent Advances for Intumescent Polymers. Macromolecular Materials and Engineering. 2004;6:499-511.
16. Le Bras M, Camino G, Bourbigot S, Delobel R, eds. Fire Retardancy of Polymers - The Use of Intumescence. Vol 1. 1 ed. Cambridge: The Royal Society of Chemistry; 1998.
17. Wang Q, Shi W. Synthesis and thermal decomposition of a novel hyperbranched polyphosphonate ester used for flame retardant systems. Polymer Degradation and Stability. 2006;6:1289-1294.
18. Täuber K, Marsico F, Wurm FR, Schartel B. Hyperbranched poly(phosphoester)s as flame retardants for technical and high performance polymers. Polymer Chemistry. 2014;5:7042-7053.
19. Schartel B. Development of fire-retarded materials - Interpretation of cone calorimeter data. Fire and Materials. 2007;31:327-354.
20. Lyon RE, Walters R. A Microscale Combustion Calorimeter. Washington, DC: Federal Aviation Administration; 2002. DOT/FAA/AR-01/117.
21. Lyon RE, Walters RN. Pyrolysis combustion flow calorimetry. Journal of Analytical and Applied Pyrolysis. 2004;1:27-46.
22. Lyon RE, Walters RN, Inventors. Microscale combustion calorimeter. US 5981290 A. Nov. 9., 1999.
23. Standard Test Method for Determining Flammability Characteristics of Plastics and Other Solid Materials Using Microscale Combustion Calorimetry. West Conshohocken: ASTM; 2007. ASTM D 7307-07.
24. Zhuge J, Chen X, KS A, Manica DP. Microscale combustion calorimeter - application and limitation. Fire and Materials. 2016;8:987-998.
25. Schartel B, Pawlowski KH, Lyon RE. Pyrolysis combustion flow calorimeter: A tool to assess flame retarded PC/ABS materials? 2007;1:1-14.
26. Davis RD, Lyon RE, Takemori MT, Eidelman N. High Throughput Techniques for Fire Resistant Materials Development. In: Wilkie CA, Morgan AB, eds. Fire Retardancy of Polymeric Materials. 2nd ed. Boca Raton, Fl, USA: Tayler & Francis Group; 2009.
27. Wilkie CA, Chigwada G, Gilman JW, Lyon RE. High-throughput techniques for the evaluation of fire retardancy. 2006;21:2023-2030.
28. Plastics - Thermogravimetry (TG) of polymers - General principles. ISO 11358:1997(E). 1st ed; 1997.
91
29. Brehme S, Köppl T, Schartel B, Altstädt V. Competition in aluminium phosphinate-based halogen-free flame retardancy of poly(butylene terephtalate) and its glass-fibre composites. e-Polymers. 2014;3:193-208.
30. Standard Test Method for Determining Flammability Characteristics of Plastics and Other Solid Materials Using Microscale Combustion Calorimetry. ASTM D7309-11. 2nd ed; 2011.
31. Plastics - Determination of burning behaviour by oxygen index - Part 2: Ambient-temperature test. DIN EN ISO 4589-2:2006-06. 2nd ed; 2006.
32. Reaction-to-fire tests - Heat Release, Smoke Production and Mass Loss Rate. ISO 5660-1. 3rd ed; 2015.
33. Babrauskas V. Development of the Cone Calorimeter - A Bench-scale Heat Release Rate Apparatus Based on Oxygen Consumption. Fire and Materials. 1984;2:81-95.
34. Babrauskas V, Peacock RD. Heat release rate: The single most important variable in fire hazard. Fire Safety Journal. 1992;3:255-272.
35. Madrigal J, Hernando C, Guijarro M, Díez C, Marino E. Evaluation of Forest Fuel Flammability and Combustion Properties with an Adapted Mass Loss Calorimeter Device. Journal of Fire Sciences. 2009;4:323-342.
36. Plastics - Simple Heat Release Test using a Conical Radiant Heater and a Thermopile Detector. ISO 13927. 1st ed; 2001.
37. Weil ED, Hirschler MM, Patel NG, Said MM, Shakir S. Oxygen Index: Correlations to Other Fire Tests. Fire and Materials. 1992:159-167.
38. Rychly J, Costa L. Modelling of Polymer Ignition and Burning Adopted for Cone Calorimeter Measurements: The Correlation between the Rate of Heat Release and Oxygen Index. Fire and Materials. 1995;19:215-220.
39. Sonnier R, Ferry L, Longuet C, et al. Combining cone calorimeter and PCFC to determine the mode of action of flame-retardant additives. Polymers Advanced Technologies. 2011;7:1091-1099.
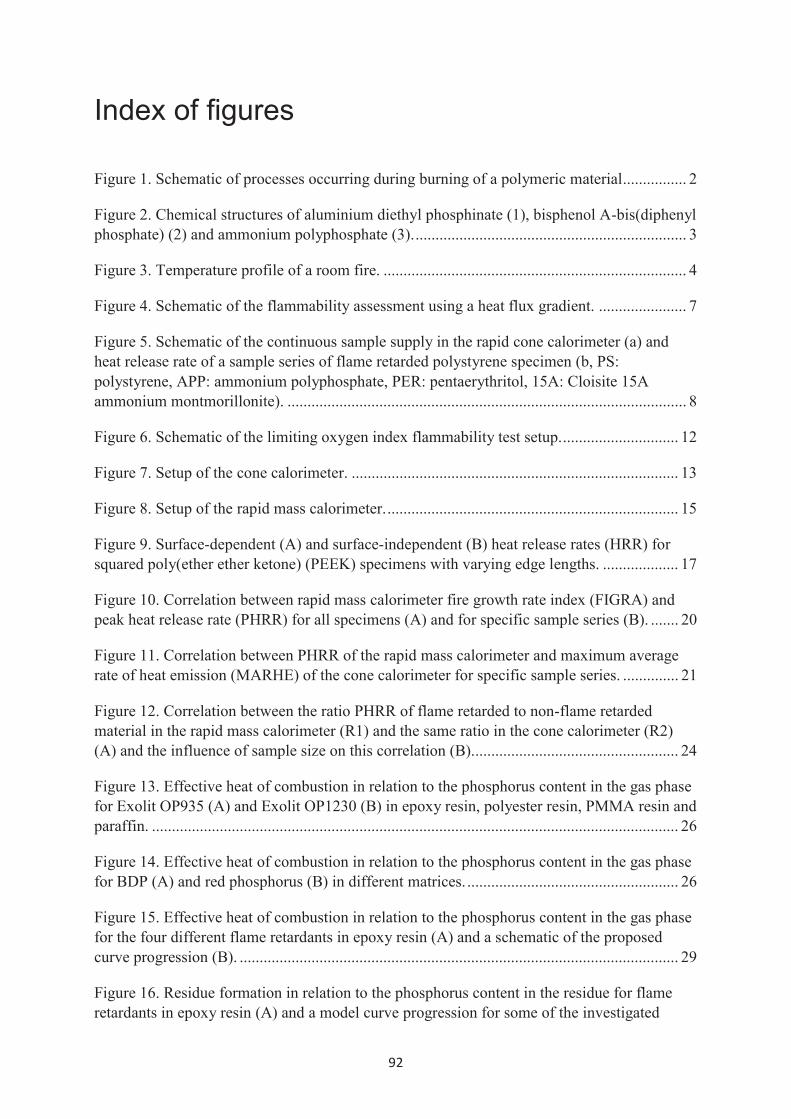
92
Index of figures
Figure 1. Schematic of processes occurring during burning of a polymeric material................ 2
Figure 2. Chemical structures of aluminium diethyl phosphinate (1), bisphenol A-bis(diphenyl phosphate) (2) and ammonium polyphosphate (3). .................................................................... 3
Figure 3. Temperature profile of a room fire. ............................................................................ 4
Figure 4. Schematic of the flammability assessment using a heat flux gradient. ...................... 7
Figure 5. Schematic of the continuous sample supply in the rapid cone calorimeter (a) and heat release rate of a sample series of flame retarded polystyrene specimen (b, PS: polystyrene, APP: ammonium polyphosphate, PER: pentaerythritol, 15A: Cloisite 15A ammonium montmorillonite). .................................................................................................... 8
Figure 6. Schematic of the limiting oxygen index flammability test setup. ............................. 12
Figure 7. Setup of the cone calorimeter. .................................................................................. 13
Figure 8. Setup of the rapid mass calorimeter. ......................................................................... 15
Figure 9. Surface-dependent (A) and surface-independent (B) heat release rates (HRR) for squared poly(ether ether ketone) (PEEK) specimens with varying edge lengths. ................... 17
Figure 10. Correlation between rapid mass calorimeter fire growth rate index (FIGRA) and peak heat release rate (PHRR) for all specimens (A) and for specific sample series (B). ....... 20
Figure 11. Correlation between PHRR of the rapid mass calorimeter and maximum average rate of heat emission (MARHE) of the cone calorimeter for specific sample series. .............. 21
Figure 12. Correlation between the ratio PHRR of flame retarded to non-flame retarded material in the rapid mass calorimeter (R1) and the same ratio in the cone calorimeter (R2) (A) and the influence of sample size on this correlation (B).................................................... 24
Figure 13. Effective heat of combustion in relation to the phosphorus content in the gas phase for Exolit OP935 (A) and Exolit OP1230 (B) in epoxy resin, polyester resin, PMMA resin and paraffin. .................................................................................................................................... 26
Figure 14. Effective heat of combustion in relation to the phosphorus content in the gas phase for BDP (A) and red phosphorus (B) in different matrices. ..................................................... 26
Figure 15. Effective heat of combustion in relation to the phosphorus content in the gas phase for the four different flame retardants in epoxy resin (A) and a schematic of the proposed curve progression (B). .............................................................................................................. 29
Figure 16. Residue formation in relation to the phosphorus content in the residue for flame retardants in epoxy resin (A) and a model curve progression for some of the investigated

93
formulations showing a nearly linear increase of residue with phosphorus content (I), a step in residue formation (II) and a relapse back to linear curve progression (III). ............................ 30
Figure 17. Photographs of residues of EP-15-ExOP935 (A) and EP-25-BDP (B). ................. 30
List of publications, presentations and posters
Rabe S, Schartel B. The rapid mass calorimeter: A route to high throughput fire testing. Fire &
Materials. 2017. DOI 10.1002/fam.2420.
Rabe S, Schartel B. The rapid mass calorimeter: Understanding reduced-scale fire test results.
Polymer Testing. 2016;57:165-174.
Rabe S, Chuenban Y, Schartel B. Exploring the Modes of Action of Phosphorus-Based Flame
Retardants in Polymeric Systems. Materials. 2017;10:455.
Pappalardo S, Russo P, Acierno D, Rabe S, Schartel B. The synergistic effect of organically
modified sepiolite in intumescent flame retardant polypropylene. European Polymer Journal.
2016;76:196-207.
Rabe S, Schartel B. Poster: High-Throughput Evaluation of Flame Retarded Polymeric
Materials with the Rapid Mass Calorimeter. 15th European Meeting on Fire Retardancy and
Protection of Materials. 22 June – 25 June 2015, Berlin, Germany.
Rabe S, Schartel B. Presentation: Rapid mass calorimeter: High throughput fire performance
screening. 27th Conference on Recent Advances in Flame Retardancy of Polymeric Materials,
FLAME. 23 May – 25 May 2016, Stamford (CT), USA.