Embed Size (px)
Citation preview

HIGH STRENGTH REINFORCING STEEL BARS:
LOW CYCLE FATIGUE BEHAVIOR
Final Report – Part B
SPR 762


HIGH STRENGTH REINFORCING STEEL BARS: LOW CYCLE FATIGUE BEHAVIOR
Final Report – Part B
SPR 762
By
André R. Barbosa, Ph.D., David Trejo, Ph.D., Drew Nielson, Vandad Mazerei, Cody Tibbits Oregon State University
for
Oregon Department of Transportation Research Section
555 13th Street NE, Suite 1 Salem OR 97301
and
Federal Highway Administration 1200 New Jersey Avenue SE
Washington, DC 20590
March 2017


i
Technical Report Documentation Page
1. Report No.
FHWA-OR-RD-17-09
2. Government Accession No.
3. Recipient’s Catalog No.
4. Title and Subtitle
High Strength Reinforcing Steel Bars: Low–Cycle Fatigue Behavior
5. Report Date
-March 2017
6. Performing Organization Code
7. Author(s) Andre R. Barbosa, David Trejo, Drew Nielson, Vandad Mazerei, and CodyTibbits
8. Performing Organization Report No. SPR 762 – Part B
9. Performing Organization Name and Address Oregon State University
101 Kearney Hall Corvallis, OR 97331
10. Work Unit No. (TRAIS)
11. Contract or Grant No.
12. Sponsoring Agency Name and Address
Oregon Dept. of Transportation Research Section and Federal Highway Admin. 555 13th Street NE, Suite 1 1200 New Jersey Avenue SE Salem, OR 97301 Washington, DC 20590
13. Type of Report and Period Covered
Final Report: Oct. 1, 2013 – June 30, 2015
14. Sponsoring Agency Code
15. Supplementary Notes
16. Abstract High-strength steel (HSS) reinforcing steel, specifically ASTM A706 Grade 80 (550), is now permitted by the AASHTO LRFD Bridge Design Specifications for use in reinforced concrete bridge components in non-seismic regions. Using Grade 80 (550) reinforcing steel bars instead of Grade 60 (420) reinforcing steel bars reduces material and construction costs. However, state highway agencies (SHAs) only allow Grade 80 (550) reinforcing steel in bridge structural elements that are not expected to undergo large strain reversals (low cycle fatigue) during an earthquake. AASHTO and SHAs have concerns with using Grade 80 (550) reinforcing steel in elements designed for low cycle fatigue due to the lack of experimental data. The report presented details research done on performance of Grade 80 (550) reinforcing steel under low cycle fatigue, which is crucial to provide designers data on cyclic/seismic performance of bridge columns. Low cycle fatigue testing under a universal testing machine uniaxial material testing was performed to compare toughness fatigue life predictions for the four types of reinforcing steel bar (ASTM A615 and ASTM A706 at Grade 60 and Grade 80). Results in this report provide for benchmark test data for ASTM A706 Grade 80 steel bars for use in design of compression members under flexural loading. 17. Key Words
18. Distribution Statement
Copies available from NTIS, and online at http://www.oregon.gov/ODOT/TD/TP_RES/
19. Security Classification (of this report) Unclassified
20. Security Classification (of this page)
Unclassified
21. No. of Pages
70
22. Price
Technical Report Form DOT F 1700.7 (8-72) Reproduction of completed page authorized Printed on recycled paper

ii

iii
SI* (MODERN METRIC) CONVERSION FACTORS APPROXIMATE CONVERSIONS TO SI UNITS APPROXIMATE CONVERSIONS FROM SI UNITS
Symbol When You Know
Multiply By To Find Symbol Symbol When You
Know Multiply
By To Find Symbol
LENGTH LENGTH in inches 25.4 millimeters mm mm millimeters 0.039 inches in ft feet 0.305 meters m m meters 3.28 feet ft yd yards 0.914 meters m m meters 1.09 yards yd mi miles 1.61 kilometers km km kilometers 0.621 miles mi
AREA AREA
in2 square inches 645.2 millimeters squared mm2 mm2 millimeters
squared 0.0016 square inches in2
ft2 square feet 0.093 meters squared m2 m2 meters squared 10.764 square feet ft2 yd2 square yards 0.836 meters squared m2 m2 meters squared 1.196 square yards yd2 ac acres 0.405 hectares ha ha hectares 2.47 acres ac
mi2 square miles 2.59 kilometers squared km2 km2 kilometers
squared 0.386 square miles mi2
VOLUME VOLUME fl oz fluid ounces 29.57 milliliters ml ml milliliters 0.034 fluid ounces fl oz gal gallons 3.785 liters L L liters 0.264 gallons gal ft3 cubic feet 0.028 meters cubed m3 m3 meters cubed 35.315 cubic feet ft3 yd3 cubic yards 0.765 meters cubed m3 m3 meters cubed 1.308 cubic yards yd3
NOTE: Volumes greater than 1000 L shall be shown in m3. MASS MASS
oz ounces 28.35 grams g g grams 0.035 ounces oz lb pounds 0.454 kilograms kg kg kilograms 2.205 pounds lb
T short tons (2000 lb) 0.907 megagrams Mg Mg megagrams 1.102 short tons (2000 lb) T
TEMPERATURE (exact) TEMPERATURE (exact)
°F Fahrenheit (F-32)/1.8 Celsius °C °C Celsius 1.8C+3
2 Fahrenheit °F
*SI is the symbol for the International System of Measurement

iv

v
ACKNOWLEDGEMENTS
The authors would first like to acknowledge the Oregon Department of Transportation (ODOT) and the Pacific Northwest Transportation Consortium Region 10 (PacTrans) for providing the funding for this research project. At ODOT, we would like to acknowledge Steven Soltesz, Matthew Mabey, Tanarat Potisuk, Craig Shike, and other engineers at the ODOT’s Bridge Standards and Bridge Design units. At PacTrans, the authors appreciate the support provided by Christopher Bell and Linda Boyle, former PacTrans board members. The authors thank Jeff Gent and James Batti for their technical assistance during testing at Oregon State University. Several graduate and undergraduate students also contributed at various levels to work performed in the laboratory; their help on this project is truly appreciated. NuCor steel provided reinforcing steel bars for this project. Special thanks to Thomas Murphy and Dennis Lauber from Cascade Steel (McMinnville, OR) for producing a special heat of the Grade 80 [550] HSS steel reinforcement.
DISCLAIMER
This document is disseminated under the sponsorship of the Oregon Department of Transportation and the United States Department of Transportation in the interest of information exchange. The State of Oregon and the United States Government assume no liability of its contents or use thereof.
The contents of this report reflect the view of the authors who are solely responsible for the facts and accuracy of the material presented. The contents do not necessarily reflect the official views of the Oregon Department of Transportation or the United States Department of Transportation.
The State of Oregon and the United States Government do not endorse products of manufacturers. Trademarks or manufacturers’ names appear herein only because they are considered essential to the object of this document.
This report does not constitute a standard, specification, or regulation.

vi

vii
EXECUTIVE SUMMARY
INTRODUCTION
The use of Grade 80 (550) reinforcing steel bars instead of Grade 60 (420) reinforcing steel bars, if used at its full design strength, could reduce material and construction costs of bridge and building projects. However, current federal and state codes have restrictions on the use of HSS in some cases. This is why Grade 80 [550] steel, though commercially available, is not commonly or widely used. More research needs to be done to determine the behavior of HSS in bridge and building components in order for designers to receive the full economic benefit of HSS for their projects.
This section summarizes results of a report entitled High Strength Reinforcing Steel Bars: Low Cycle Fatigue Behavior. The report provides an analysis and characterization of the low-cycle fatigue behavior of HSS, namely ASTM A615 Grade 80 and ASTM A706 Grade 80.
Current bridge and building code provisions do not allow HSS in plastic hinge energy dissipation components. This is a limitation that originates in the lack of information on the material properties of the Grade 80 (550) reinforcing steel.
OBJECTIVES
The overall objective of this research is to study the behavior of HSS so that designers can use the reinforcing steel in more types of bridge and building components.
The main objective of the low-cycle fatigue research is to test the cyclic behavior of individual reinforcing bars to gain information on the energy dissipation behavior, number of half-cycles to failure under different strain histories.
METHODOLOGY
A total of 400 tests were performed, including 40 tensile and 360 cyclic tests. The cyclic tests varied in: (a) reinforcing bar grade (Grade 60 and Grade 80 (420 and 550)); (b) lateral support spacing to bar diameter ratios (4 and 6); (c) ratio of peak compressive strain to peak tensile strain (0.10, 0.50, and 1.00); (d) and maximum tensile and compressive strain (2%, 4%, and 6%). The tensile tests provided basic information needed to characterize the reinforcing steel bars and to provide basic information needed for the cyclic testing.
The general procedure followed in this research included the following steps:
(1) A literature review was performed to identify key concepts and to review experimental results available in the literature.
(2) An experimental program was designed and new testing procedure developed. This program included the design of the test setup and new testing fixtures.

viii
(3) Experimental results were summarized and discussed.
(4) Conclusions were drawn from the comparisons of the different steel grades and testing parameters, and recommendations for future research were made.
SUMMARY OF MAIN FINDINGS
Overall, the results show a promising step forward for the utilization of HSS in bridge and building components. A new experimental setup and testing procedure was developed to evaluate the low-cycle fatigue performance of four reinforcing steels, including two high-strength reinforcing steels. The research program included testing of more than 400 reinforcing bar specimens. The low-cycle fatigue behavior of these four reinforcing bars, A615 Grade 60, A615 Grade 80, A706 Grade 60, and A706 Grade 80, were assessed in this research. The main findings that can be drawn from the results of this research are:
1. Comparison of the results from the A615 Grade 60 and A615 Grade 80 testing indicates that at higher maximum tensile strains (εt = 6%) the A615 Grade 80 specimens exhibited larger energy dissipation per cycle than the A615 Grade 60 specimens. Results from statistical testing (t-tests) indicate that there is no statistically significant difference between A615 Grade 60 and A615 Grade 80 for tests with lower total strain ranges for all other parameters assessed.
2. Comparison of the A706 Grade 60 and A706 Grade 80 results indicate that even though A706 Grade 80 exhibited larger mean values for energy dissipated per cycle than the A706 Grade 60, there is no statistically significant difference in the low-cycle fatigue behavior of these specimens for most test conditions.
3. Comparison of A615 Grade 80 and A706 Grade 80 test results indicate that the A706 Grade 80 specimens exhibit higher mean values for energy dissipated per cycle than the A615 Grade 80 specimens for all test cases. However, statistical analyses comparing the means of the groups indicate that there is no statistically significant difference in the low-cycle fatigue behavior of these groups.
4. When specimens were tested with shorter lateral support spacing, specimens were cycled through a larger number of inelastic cycles. In addition, for specimens with longer lateral support spacing, low-cycle fatigue failures occurred at lower numbers of inelastic cycles and the onset of buckling occurred at lower strains.
5. When the total strain amplitude, εa, was increased, all steels evaluated exhibited shorter fatigue lives. The Grade 60 reinforcing steels exhibited higher fatigue lives than the Grade 80 reinforcing steels when subjected to larger inelastic strains. However, when total strains were below 0.036 for the case when sh/db = 4 and below 0.022 for the case when sh/db = 6, the A615 Grade 80 exhibited longer fatigue lives.
ix
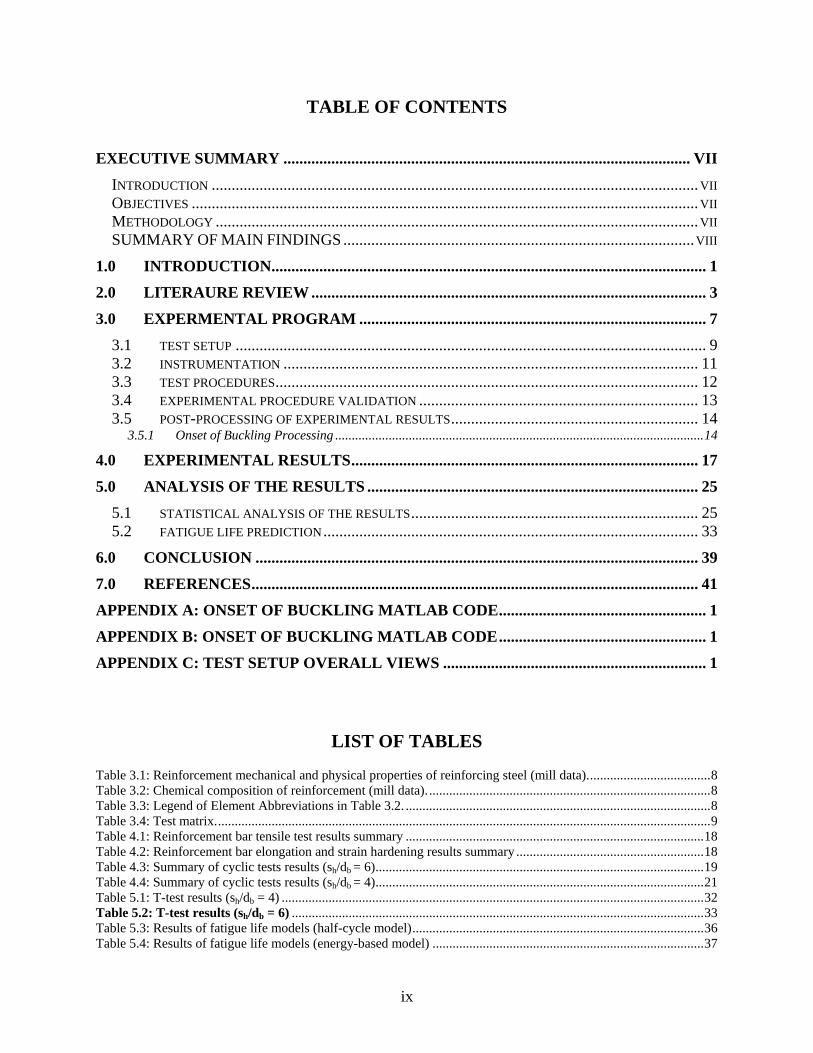
TABLE OF CONTENTS
EXECUTIVE SUMMARY ...................................................................................................... VII
INTRODUCTION .......................................................................................................................... VII OBJECTIVES ............................................................................................................................... VII METHODOLOGY ......................................................................................................................... VII SUMMARY OF MAIN FINDINGS ........................................................................................ VIII
1.0 INTRODUCTION............................................................................................................. 1
2.0 LITERAURE REVIEW ................................................................................................... 3
3.0 EXPERMENTAL PROGRAM ....................................................................................... 7
3.1 TEST SETUP ...................................................................................................................... 9 3.2 INSTRUMENTATION ........................................................................................................ 11 3.3 TEST PROCEDURES .......................................................................................................... 12 3.4 EXPERIMENTAL PROCEDURE VALIDATION ...................................................................... 13 3.5 POST-PROCESSING OF EXPERIMENTAL RESULTS .............................................................. 14
3.5.1 Onset of Buckling Processing .............................................................................................................. 14
4.0 EXPERIMENTAL RESULTS ....................................................................................... 17
5.0 ANALYSIS OF THE RESULTS ................................................................................... 25
5.1 STATISTICAL ANALYSIS OF THE RESULTS ........................................................................ 25 5.2 FATIGUE LIFE PREDICTION .............................................................................................. 33
6.0 CONCLUSION ............................................................................................................... 39
7.0 REFERENCES ................................................................................................................ 41
APPENDIX A: ONSET OF BUCKLING MATLAB CODE .................................................... 1
APPENDIX B: ONSET OF BUCKLING MATLAB CODE .................................................... 1
APPENDIX C: TEST SETUP OVERALL VIEWS .................................................................. 1
LIST OF TABLES
Table 3.1: Reinforcement mechanical and physical properties of reinforcing steel (mill data). .................................... 8 Table 3.2: Chemical composition of reinforcement (mill data). .................................................................................... 8 Table 3.3: Legend of Element Abbreviations in Table 3.2. ........................................................................................... 8 Table 3.4: Test matrix. ................................................................................................................................................... 9 Table 4.1: Reinforcement bar tensile test results summary ......................................................................................... 18 Table 4.2: Reinforcement bar elongation and strain hardening results summary ........................................................ 18 Table 4.3: Summary of cyclic tests results (sh/db = 6) .................................................................................................. 19 Table 4.4: Summary of cyclic tests results (sh/db = 4) .................................................................................................. 21 Table 5.1: T-test results (sh/db = 4) .............................................................................................................................. 32 Table 5.2: T-test results (sh/db = 6) ........................................................................................................................... 33 Table 5.3: Results of fatigue life models (half-cycle model) ....................................................................................... 36 Table 5.4: Results of fatigue life models (energy-based model) ................................................................................. 37

x
LIST OF FIGURES
Figure 2.1: Experimental monotonic compressive curves (after Mander et al. 1994)................................................... 4 Figure 2.2: Cyclic stress-strain curve for steel. .............................................................................................................. 5 Figure 2.3: Comparison of fatigue life for different reinforcement sizes after (modified from Brown and Kunnath,
2004). ................................................................................................................................................................... 6 Figure 3.1: Naming convention of the cyclic and monotonic tests. ............................................................................... 8 Figure 3.2: Schematic view of the UTM test frame with experimental setup: (a) EW elevation, (b) NS elevation .... 10 Figure 3.3: Photograph of the test setup ...................................................................................................................... 10 Figure 3.4: Schematic view of the clamps with a bar (side view) ............................................................................... 11 Figure 3.5: A spacing jig used to adjust and set the distance between the clamps (side view) .................................... 11 Figure 3.6: A setup jig used to adjust and set the distance between the clamps and grips .......................................... 11 Figure 3.7: An extensometer attached on the reinforcing bar sample centered along the unbraced length ................. 12 Figure 3.8: Stress-strain curve of a cyclic test with 1 0C T .ε ε = ................................................................................ 14 Figure 3.9: (a) Buckling mode for fixed-fixed condition, and (b) reinforcement midpoint change before and after
buckling. ............................................................................................................................................................. 16 Figure 4.1: Stress-strain results for monotonic tests .................................................................................................... 18 Figure 4.2: Selection of typical strain-stress curve for 0.2-2 cyclic tests ..................................................................... 22 Figure 4.3: Selection of typical strain-stress curve for 1-2 cyclic tests ....................................................................... 23 Figure 4.4: Selection of typical strain-stress curve for 2-4 cyclic tests ....................................................................... 23 Figure 4.5: Selection of typical strain-stress curve for 3-6 cyclic tests ....................................................................... 24 Figure 4.6: Selection of typical rupture section of cyclic tests .................................................................................... 24 Figure 5.1: Mean number of cycles to failure for reinforcement with sh/db = 4 ........................................................... 28 Figure 5.2: Mean energy dissipated for reinforcement with sh/db = 4 ........................................................................ 29 Figure 5.3: Mean energy dissipated per cycle for reinforcement with sh/db = 4 .......................................................... 29 Figure 5.4: Strain at onset of buckling for reinforcement with sh/db = 4 ...................................................................... 30 Figure 5.5: Mean number of cycles to failure for reinforcement with sh/db = 6 ........................................................... 30 Figure 5.6: Mean total energy dissipated for reinforcement with sh/db = 6 .................................................................. 31 Figure 5.7: Mean energy dissipated per cycle for ASTM A615 reinforcement with sh/db = 6 ..................................... 31 Figure 5.8: Mean strain at onset of buckling for reinforcement with sh/db = 6 ............................................................ 32 Figure 5.9: Fatigue life relationship based on half-cycle to failure: (a) ASTM615 G60 specimens with Sh/db=4; and
(b) ASTM615 G60 specimens with Sh/db=6. ..................................................................................................... 34 Figure 5.10: Fatigue life relationship based on total energy: (a) ASTM A615 G60 specimens with sh/db = 4; and (b)
ASTM A615 G60 specimens with sh/db = 6. ...................................................................................................... 34 Figure 5.11: Fatigue life prediction for specimens with sh/db = 4 .............................................................................. 35 Figure 5.12: Fatigue life prediction for specimens with sh/db = 6 .............................................................................. 35

1
1.0 INTRODUCTION
Results in Trejo et al. (Trejo et al. 2014) and Barbosa et al. (Barbosa et al. 2015) indicated that use of Grade 80 high strength steel (HSS) reinforcement achieved similar resistances to Grade 60 reinforcement, when the ratio of the area of the area of Grade 80 reinforcing steel bars used was 75 percent of the area of the Grade 60 reinforcing steel bars. The authors suggested a reduction in longitudinal reinforcement congestion could significantly reduce cost if large quantities were manufactured. A concern that arose in conclusion of the ODOT research funded program that served as the basis for Trejo et al. (Trejo et al. 2014), which was that as the column reinforcing steel was reduced, low-cycle fatigue of HSS needed to be characterized.
This report summarizes the testing program performed to characterize the performance of Grade 80 reinforcing steel under low-cycle fatigue. The report includes 5 chapters. A brief description of each chapter follows.
Chapter 1 introduces the research program and provides a basic description of the contents in each chapter.
Chapter 2 includes a literature review used to develop the experimental program.
Chapter 3 presents the experimental program, design of the test setup, instrumentation, specimen preparation and test procedures, and finally methods used for post-processing experimental results.
Chapter 4 presents the experimental results for the test specimens.
Chapter 5 describes the analysis of the results, including a detailed statistical analysis of the results. An equation for low-cycle fatigue life prediction based on the testing results is proposed.
Finally, chapter 6 provides a summary of the research program and states the main conclusions obtained.

2

3
2.0 LITERAURE REVIEW
Failure of longitudinal reinforcing steel elements due to low-cycle fatigue in reinforced concrete (RC) structures, such as columns in buildings or bridge piers (Trejo et al. 2014), is one of the main failure modes expected for well-designed columns in a seismic event. Low-cycle fatigue is defined here as the failure of a material below 1000 cycles (Brown and Kunnath 2004). The number of cycles at specific strain amplitudes before failure will be defined here as the fatigue life of that material.
In RC elements, large cyclic loading of plastic hinges causes spalling of the concrete cover over the longitudinal reinforcing steel elements. By losing the concrete cover, reinforcing steel is exposed to the air and its compression unbraced length becomes the spacing between stirrups. If the concrete in the core of an RC element is able to restrict movements of the bars, it is reasonable to expect that the bars would buckle under compression in the outward direction (away from the core). The large inelastic strains in compression and tension, and the additional effects of buckling of the bars, induce what is known as low-cycle fatigue failures, which are characterized by the formation of micro-cracks in the steel bars under inelastic compression and subsequent failure in a following tension excursion. Since low-cycle fatigue develops mainly after spalling of the concrete cover of RC elements, it is reasonable to test the cyclic behavior of individual reinforcing bars, with controlled braced lengths, to understand the low-cycle behavior and energy dissipation behavior of the materials. Stress-strain behavior of reinforcing bars, including the effect of buckling, has been studied by several researchers as is summarized in this section. However, difficulties in measuring strain values in compression and defining the onset of buckling make this topic extremely difficult and has hindered more research in the topic. This chapter presents a review of the literature on the topic of low-cycle fatigue.
Monti and Nuti (Monti and Nuti 1992) studied the cyclic behavior of reinforcing bars including buckling in a testing program that included conducting cyclic and monotonic compression tests of reinforcing steel bar specimens. Reinforcing bars with lateral supporting spacing, sh, to bar diameter, db, values of 5, 8, and 11 were tested. The sh value is approximately equivalent to the unbraced length of the bars. The results showed that when sh /db goes beyond the critical value of 5, inelastic buckling of reinforcing bars develop. Results from the monotonic axial compression tests are shown in Figure 2.1. As illustrated in this figure, the monotonic axial compression for sh /db = 5 (L/D = 5 in Figure 2.1) is similar to the tensile curve while curves for larger sh /db values deviate from the tensile curve once the yield point is reached.
Mander et al. (Mander et al. 1994) studied the low-cycle fatigue behavior of #5 (#16M) reinforcing steel bars. The researchers tested ASTM A722 Grade 157 ksi (1080 MPa) high-strength steel threaded bars and ASTM A615 Grade 40 ksi (280 MPa) reinforcing bars with lateral support spacing, sh, to bar diameter, db, values of 6, 8, and 9. The researchers concluded that sh/db values greater than 6 result in a reduction in strength below the yield value of the reinforcing bar under large compressive strains as a result of severe inelastic buckling. The authors reported that inelastic buckling occurs when a member fails between the plastic and

4
elastic zones. The results of this study also showed that HSS bars have a higher energy dissipation capacity than conventional reinforcing steel bars.
Figure 2.1: Experimental monotonic compressive curves (after Mander et al. 1994).
Rodriguez et al. (Rodriguez et al. 1999) studied the cyclic stress-strain behavior of reinforcing bars, including the effect of buckling. The authors conducted a series of monotonic and cyclic tests on reinforcing steel bars. The experimental program included testing of 0.62 in. (16 mm) diameter steel coupons with lateral supporting spacing to bar diameter, sh/db, values of 2.5, 4, 6, and 8. For cyclic tests, a cyclic frequency of 0.005 Hz was used for all tests. Two extensometers with a gauge length of 1.18 in. (30 mm) were used to measure the strains on both sides of the test specimens to estimate the onset of buckling. The strain, ε1, was measured along the fiber on the compressive side of the bar and the strain, ε2, was measured along the fiber on the tensile side of the bar. The onset of buckling is defined as the point where the difference between, ε1, and, ε2, is equal to or greater than 20% of ε1 for the monotonic test, and ( )+ -
m m0.2 ε - ε for the cyclic test,
where εm+ and εm
- are the peak strains reached. Rodriguez et al. (Rodriguez et al.1999) concluded that the onset of buckling subjected to cyclic loading may occur after the reversal from tension and is dependent on the maximum value of the tensile strain reached before the reversal. In this case, the buckling of reinforcing steel may occur on the tension side of the hysteresis cycle. A procedure was proposed by the authors to predict the strain at the onset of buckling of a reinforcing bar with the definition as follows:
0* *p pε = ε − ε (2.1)
where parameters +0ε and Pε are defined as the axial strain at zero loading after return from a
tensile strain and the axial strain at buckling, respectively, as shown in Figure 2.2. From the
definition above, if +0 Pε ε> , then the buckling of the longitudinal reinforcing bar would occur in
the tensile strain region. Figure 2.2 also shows the energy dissipated per cycle, Eh.
Brown and Kunnath (Brown and Kunnath 2004) studied the effect of reinforcing bar size on fatigue life for sh/db values of 6. Results in Brown and Kunnath indicate that the fatigue life
D=16 mm (compression)D=20 mm (compression)D=24 mm (compression)Tensile Monotonic Curve
Nor
mal
ized
Str
ess
Normalized Strain
1.25
1.50
1.00
0.75
0.50
0.25
/ 5=L D
/ 8=L D
/ 11=L D
0 2 4 6 8 10 12 140.0

5
(number of half-cycles before fatigue failure is observed) is influenced by the reinforcing bar size. Figure 2.3 shows a compilation of the results by the authors from which the main conclusions can be inferred. First, the authors concluded that reinforcing bars with larger diameters, such as #9 (#29M), show longer fatigue life at lower strain amplitudes than reinforcement with smaller diameters, such as #6 (#19M), as shown in. Second, the authors also concluded that fatigue life failure with increasing strain is more severe (achieving a smaller number of half-cycles) for reinforcing bars with larger diameters.
In summary, low-cycle fatigue failure on longitudinal reinforcing elements is influenced by parameters such as lateral supporting spacing, reinforcing bar diameter values, and maximum value of the tensile strain before the reversal. However, insufficient research has been performed on the low-cycle fatigue behavior of ASTM A615 and ASTM A706 HSS reinforcing steel bars.
Figure 2.2: Cyclic stress-strain curve for steel.
ε P
( , )ε+ +
m mf
- -( , )εm mf
( , )εP Pf
*ε P
0ε+
Strain
Stress
hE

6
Figure 2.3: Comparison of fatigue life for different reinforcement sizes after (modified from
Brown and Kunnath, 2004).
0.01
0.11 10 100
Tota
l str
ain
ampl
itude
Number of half-cycles to failure (2Nf)
#6#7#8#9

7
3.0 EXPERMENTAL PROGRAM
A series of monotonic and cyclic tests of reinforcing bars were performed at the Structural Engineering Research Laboratory at Oregon State University. The experimental program was developed to study the low-cycle fatigue behavior, including the effect of buckling for four test variables:
1. Steel reinforcement types: Four grades of #5 (#16M) reinforcing steel were used in this research. These included ASTM A706 Grade 60 ksi (420 MPa), ASTM A706 Grade 80 ksi (550 MPa), ASTM A615 Grade 60 ksi (420 MPa), and ASTM A615 Grade 80 ksi (550 MPa). All the reinforcing steels were produced by Nucor Steel in Seattle, WA. Mechanical properties and chemical compositions of the reinforcing steel are shown in Table 3.1 and Error! Reference source not found., respectively.
2. Lateral supporting spacing to bar diameter (sh/db): sh/db values of 4 and 6 were used in this research. The sh/db value of 6 represents the tie spacing most commonly used in reinforced concrete structures according to the current building and bridge design codes. The sh/db of 4 was used to provide additional results on the effect of buckling on specimens with reduced nonlinear geometry effects.
3. Maximum tensile strain (εt): Three values were included in the experimental plan, including of 2.0 percent, 4.0 percent, and 6.0 percent.
4. Ratio of peak compressive strain to peak tensile strain (εc/εt): Three values of 0.1, 0.5 and 1.0 εc/εt were considered. Ratios of εc/εt of 0.1 and 0.5 are used to represent unsymmetrical strain histories observed in a longitudinal reinforcement in lightly loaded and heavily loaded columns or wall piers, respectively. An εc/εt = 1.0 is not a typical strain history in reinforced concrete. However, it is used for comparison with other low-cycle fatigue tests available in the literature (e.g., Mander et al. 1994).
Table 3.1 and Table 3.2 list the mechanical, physical, and chemical properties of the four reinforcing steel types tested in this research program. All four steels were subjected to low-cycle fatigue tests. Table 3.3 shows the legend for elements in the steel composition.
Figure 3.1 shows the naming convention used for each test, while Table 3.4 shows the test matrix. Five specimens from each criterion were tested resulting in a total of 40 tensile and 360 cyclic tests.

8
Table 3.1: Reinforcement mechanical and physical properties of reinforcing steel (mill data).
Bar size Grade
ksi (MPa)
ASTM Manufacturer Heat # Yield
strength, ksi (MPa)
Tensile strength, ksi (MPa)
Elong. % 8 in. (0.2 m)
Nom. Wt, %
#5 (#16M)
Gr. 60 (420) A615 Nucor SE14102513 68.7 (474) 101.4
(699) 18.8 95.2
#5 (#16M)
Gr. 60 (420) A706 Nucor SE14102491 64.3 (444) 92.4 (638) 17.2 95.9
#5 (#16M)
Gr. 80 (550) A615 Nucor SE14101983 82.1 (566) 114.9
(793) 13.3 95.2
#5 (#16M)
Gr. 80 (550) A706 Nucor SE14101987 90.4 (624) 116.9
(806) 12.5 95.4
Table 3.2: Chemical composition of reinforcement (mill data).
Bar size Grade,
ksi (MPa)
ASTM C (%) Mn
(%) P
(%) S (%) Si (%) Cu (%)
Ni (%)
Cr (%)
Mo (%)
V (%) CE
#5 (#16M)
Gr. 60 (420) A615 0.390 0.980 0.011 0.038 0.210 0.320 0.11 0.13 0.03 0.01 0.5
#5 (#16M)
Gr. 60 (420) A706 0.300 1.210 0.015 0.041 0.210 0.300 0.09 0.12 0.01 0.24 0.5
#5 (#16M)
Gr. 80 (550) A615 0.380 1.280 0.011 0.047 0.240 0.250 0.09 0.09 0.02 0.05 0.6
#5 (#16M)
Gr. 80 (550) A706 0.290 1.270 0.014 0.043 0.210 0.290 0.11 0.13 0.03 0.12 0.5
Table 3.3: Legend of Element Abbreviations in Table 3.2.
Element Abbrev. C Mn P S Si Cu Ni Cr Mo V
Element Name Carbon Mang-
anese Phos-phorus Sulfur Silicon Copper Nickel Chrom-
ium Moly-
bdenum Vana-dium
Figure 3.1: Naming convention of the cyclic and monotonic tests.

9
Table 3.4: Test matrix. C
yclic
test
Reinforcement Type sh/db
Tensile Strain, 𝜺𝜺𝑻𝑻
Compressive Strain, 𝜺𝜺𝒄𝒄
R (𝜺𝜺𝒄𝒄/𝜺𝜺𝑻𝑻)
# of Specimens
A615 G60, A615 G80, A706 G60, A706 G80 4, 6 2.00% 0.20% 0.10 5
A615 G60, A615 G80, A706 G60, A706 G80 4, 6 2.00% 1.00% 0.50 5
A615 G60, A615 G80, A706 G60, A706 G80 4, 6 2.00% 2.00% 1.00 5
A615 G60, A615 G80, A706 G60, A706 G80 4, 6 4.00% 0.40% 0.10 5
A615 G60, A615 G80, A706 G60, A706 G80 4, 6 4.00% 2.00% 0.50 5
A615 G60, A615 G80, A706 G60, A706 G80 4, 6 4.00% 4.00% 1.00 5
A615 G60, A615 G80, A706 G60, A706 G80 4, 6 6.00% 0.60% 0.10 5
A615 G60, A615 G80, A706 G60, A706 G80 4, 6 6.00% 3.00% 0.50 5
A615 G60, A615 G80, A706 G60, A706 G80 4, 6 6.00% 6.00% 1.00 5
Tens
ile
test
A615 G60, A615 G80, A706 G60, A706 G80 4, 6 - 5
3.1 TEST SETUP
Tensile and cyclic tests were performed using a MTS Universal Testing Machine (UTM) model 641.38 with a maximum clamp pressure of 5000 psi (35 MPa), which was set to record the force and displacement at a frequency of 10 Hz. The UTM was connected to a FlexTest model 493.02 controller to control the test type, test rate, and displacement amplitude. A schematic of the test frame is shown in Figure 3.2. Figure 3.3 shows a photograph of the test setup.
To achieve the correct support spacing, custom grips (clamps) were machined and utilized with the grips of the UTM machine. A schematic view of the grip is shown in Figure 3.4. Reinforcing bars were cut to length based on the sh/db of each test to ensure that the reinforcing bar was secured by the test clamps (typically 8 inches (203 mm) on top and bottom clamps). Figure 3.5 shows the spacing jig that was used to adjust the distance between the clamps to provide appropriate and consistent lengths. A setup jig was attached to the clamps before placing the reinforcing bar specimen into the lower UTM head grip. The setup jig ensured the specimen was vertical and aligned with the UTM load path, as illustrated in Figure 3.6. After gripping the lower clamps, the vertical alignment of the specimen was then checked, followed by the removal of the setup jig. The cyclic testing was then performed using displacement control mode.

10
(a) (b) Figure 3.2: Schematic view of the UTM test frame with experimental setup: (a) EW elevation,
(b) NS elevation
Figure 3.3: Photograph of the test setup
Custom made measurement fixture
Universal Testing Machine (UTM) Cross-frame
Lower head of the UTM

11
Figure 3.4: Schematic view of the clamps with a bar (side view)
Figure 3.5: A spacing jig used to adjust and set the distance between the clamps (side view)
Figure 3.6: A setup jig used to adjust and set the distance between the clamps and grips
3.2 INSTRUMENTATION
The extensometer shown in Figure 3.7 was attached directly to the reinforcing bar sample and centered along the unbraced length. The extensometer is a 2 in. (51 mm) gauge length extensometer meeting ASTM E83-10a Standard Practice for Verification and Classification of Extensometer Systems, which was used to measure the strains in the tension tests as well as the strains up to the first reversal from the first maximum tension displacement in the cyclic tests. Since reinforcing bar samples could buckle in compression during cyclic testing, the extensometer was removed from the sample after reaching the first peak tensile strain to prevent
Custom-made measurement fixture
Setup jig
Clamps

12
damage to the extensometer. For the tensile tests, the extensometer was removed from the samples at the onset of necking to prevent damage to the extensometer.
Figure 3.7: An extensometer attached on the reinforcing bar sample centered along the unbraced
length
Three horizontal string potentiometers (string pots) at a 60-degree pattern (120 degree angles in plan between string potentiometers) were connected to the midspan of the reinforcing bar specimen to obtain buckling direction behavior. Horizontal string pots were looped around the center of the unbraced height of the reinforcing bar after gripping the lower clamps. A string bubble level was used to level the horizontal string pots. The midpoint displacement of the specimen measured by the horizontal string pots is used later in this report, along with equations defined in Rodriguez et al. (Rodriguez et al. 1999), to estimate the onset of the buckling in cyclic tests. Care was taken to prevent horizontal string pot wires from touching the extensometer.
Three vertical string pots were also placed at a 60-degree pattern (120 degree angles in plan between potentiometers). The vertical string potentiometers measured relative displacement between the specimen facing faces of lower and upper head of the UTM. These potentiometers were attached to an aluminum frame to measure the vertical displacement of the reinforcing bar samples after removing the extensometer. In addition, the head displacement of the MTS machine was also tracked during testing.
The mean displacement of the vertical string pots was used to compute the strain of the reinforcing bar sample after removing the extensometer. The strain measured by the vertical string pots is a function of the gauge length. Due to additional, but limited, elastic response of the UTM testing frame elements and clamps, the actual gauge length of the samples differs from the lateral support spacing of the specimen (grip-to-grip). To estimate the actual gauge length of the specimen, the maximum strain at the first cycle read by the extensometer was fitted to the average vertical string pot strain at the peak tension (referred to as strain fitting):
Maximum extensometer displacement Extensometer gauge length (2 in. [51 mm])
= Average maximum displacement of string pot Specimen gauge length, (2 in. [51 mm])
(3.1)
3.3 TEST PROCEDURES
The experimental procedure included first performing tensile tests, which served as control tests for estimating reference strain values to be used in the cyclic testing program.

13
Tensile testing was performed following ASTM E8/E8M-13a, Standard Test Methods for Tension Testing of Metallic Materials and ASTM A370-12a, Standard Test Methods and Definitions for Mechanical Testing of Steel Products. For the tensile tests, the displacements corresponding to strain values of 0.02, 0.04 and 0.06 in./in. (mm/mm) were measured for all types of reinforcing bars. For tensile tests, a constant displacement rate of 0.0003 in./s (0.00762 mm/s) was used for all the tests until the initiation of strain hardening of the reinforcing steel bar specimens. Then, the strain rate was increased to 0.0005 in./min (0.0127 mm/s), 0.0007 in./min (0.01778 mm/s), 0.001 in./min (0.0254 mm/s), 0.002 in./min (0.0508 mm/s), 0.003 in./min (0.0762 mm/s), 0.004 in./min (0.1016 mm/s) and 0.005 in./min (0.1270 mm/s) subsequently every 15 seconds until the failure of the sample.
For cyclic testing, a setup jig was attached to the clamps before placing the reinforcing bar specimen and gripping at the lower head of the UTM. The setup jig ensured the specimen was vertical and aligned with the UTM load path as illustrated in Figure 3.6. After gripping the lower clamps, and verifying for vertical alignment of the specimen, the setup jig was removed. Then, the upper clamps were gripped. Next, vertical string pots were attached between the lower and upper heads of the UTM. All of the string pots were rechecked before starting the tests. Values of frequency (Hz), amplitude (in.), and start point (in.), for each cyclic test, were inserted to the FlexTest controller before running the test. A reference strain rate of 0.00083 in./s (0.02108 mm/s) was used for the cyclic tests. The frequency (Hz) of each test was calculated based on required maximum tensile and compressive displacements and the reference strain rate. Maximum tensile and compressive displacements were calculated for each test based on the results of the tensile tests. Cyclic loading continued until the initiation of fatigue cracking on the test specimen or bar failure.
3.4 EXPERIMENTAL PROCEDURE VALIDATION
Figure 3.8 illustrates the stress-strain curve of a cyclic test with εT = 6.0 percent and εC = 6.0 percent (εC/εT = 1.0). The figure shows a good fit between the strains measured by the extensometer and the average strains measured using the string pots, after reversal from the tensile displacement. This adds evidence to the validity of the proposed procedure for measuring the strains in the compression region.

14
Figure 3.8: Stress-strain curve of a cyclic test with 1 0C T .ε ε =
3.5 POST-PROCESSING OF EXPERIMENTAL RESULTS
The average displacement of vertical string pots was used to compute the strain of the reinforcing bar samples after removing the extensometer. This strain was calibrated based on the extensometer strain that was explained above. By obtaining forces from the UTM, normalized by the nominal areas of the bars, and strains computed based on the displacements measured using the string pots, the stress-strain plots can be developed for each test.
3.5.1 Onset of Buckling Processing
Three horizontal string pots at 120 degree angles were connected to the midspan of the reinforcing bar specimen to obtain midpoint displacement of the specimen. To model the onset of buckling, relations between peak strains and midspan displacement were developed. According to Rodriguez et al. (Rodriguez et al. 1999), “the onset of buckling for the cyclic tests was defined by using the strain readings for ε1 and ε2 and relating these strains to the peak strains reached in the corresponding cycle, εm
+ and εm-. This critical condition was defined when ε1 - ε2
was equal or greater than 0.2 (εm+-εm
-).” Based on the Rodriguez et al. (1999) equation, the relation between reinforcement midpoint displacement (a), bar diameter (d), maximum tensile strain (εm
+) and maximum compressive strain (εm-), as shown in Figure 3.9, may be determined
as follows:
( )1 2 0 2 + −− = −m m . ε ε ε ε (3.2)
where
1 2
2 22 2
e e
d db tanθ b tanθε , ε
l l
+ − = =
(3.3)
15
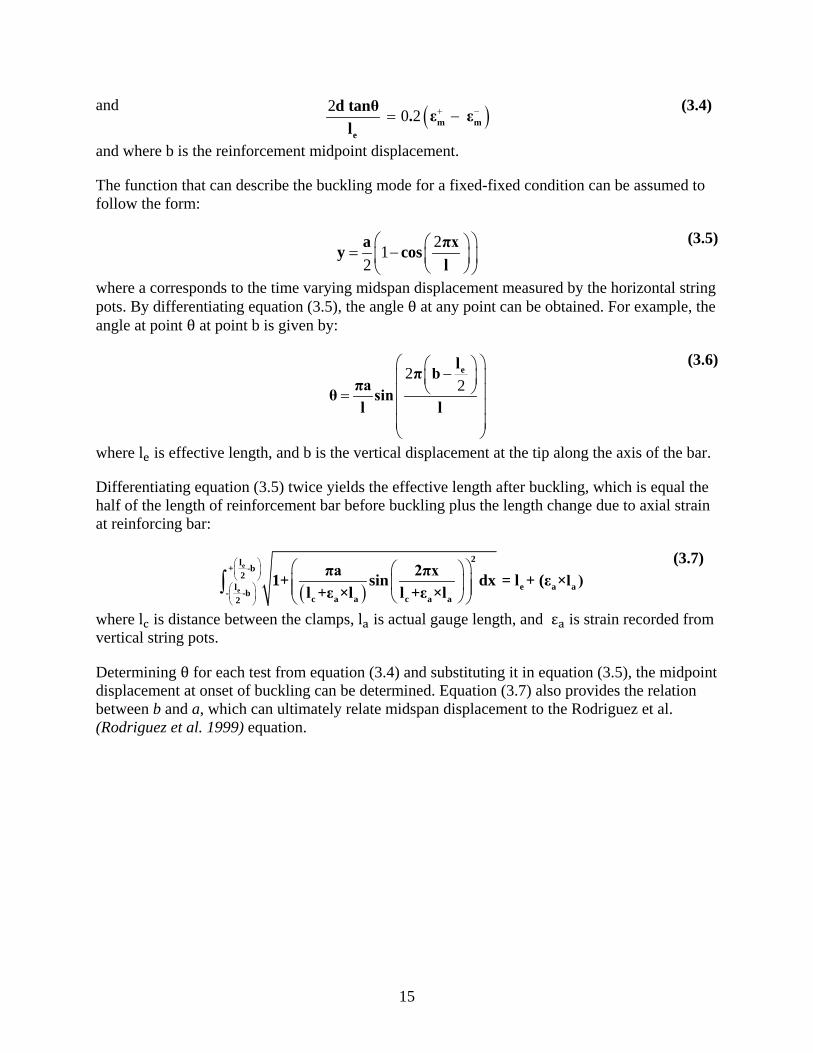
and ( )2 0 2 m me
d tanθ . ε εl
+ −= − (3.4)
and where b is the reinforcement midpoint displacement.
The function that can describe the buckling mode for a fixed-fixed condition can be assumed to follow the form:
212a πxy cos
l = −
(3.5)
where a corresponds to the time varying midspan displacement measured by the horizontal string pots. By differentiating equation (3.5), the angle θ at any point can be obtained. For example, the angle at point θ at point b is given by:
2
2elπ b
πaθ sinl l
− =
(3.6)
where le is effective length, and b is the vertical displacement at the tip along the axis of the bar.
Differentiating equation (3.5) twice yields the effective length after buckling, which is equal the half of the length of reinforcement bar before buckling plus the length change due to axial strain at reinforcing bar:
( )
∫e
e
2l+ -b
2e a al
- -b c a a c a a2
πa 2πx1+ sin dx = l + (ε l )l +ε ×l l
×+ε ×l
(3.7)
where lc is distance between the clamps, la is actual gauge length, and εa is strain recorded from vertical string pots.
Determining θ for each test from equation (3.4) and substituting it in equation (3.5), the midpoint displacement at onset of buckling can be determined. Equation (3.7) also provides the relation between b and a, which can ultimately relate midspan displacement to the Rodriguez et al. (Rodriguez et al. 1999) equation.

16
(a) (b)
Figure 3.9: (a) Buckling mode for fixed-fixed condition, and (b) reinforcement midpoint change before and after buckling.

17
4.0 EXPERIMENTAL RESULTS
This section provides the test results from the monotonic and cyclic tests. The test matrix, details of the test, and experimental procedures can be found in Chapter 3.
Figure 4.1 presents the typical stress-strain relation of each of the bar types. Table 4.1 shows a summary of the mean tensile test results for Grade 60 and Grade 80 reinforcement meeting ASTM A615 and ASTM A706 standards, respectively. ASTM values reported include the yield stress, strain computed using the 0.2% offset method, and the 0.0035 in./in. (mm/mm) strain extension under load (EUL). These variables were recorded in accordance with ASTM E8/E8M. In addition, the tensile strength and corresponding strain, and the ultimate strength and corresponding strain are also reported.
Table 4.2 to Table 4.4 include the following results:
(1) Total energy (ksi, MPa): Total energy dissipated until failure of the specimen (WfT). This is determined by numerically integrating of the area the stress-strain curve for the entire test history.
(2) Cycles to failure (Nf): The number of cycles achieved before failure. This is determined as the product of the total time between initial loading and initiation of fatigue cracks with the frequency of the test.
(3) Energy per cycle (ksi, MPa): Normalized results for energy dissipated per cycle by dividing the total energy dissipated by the number of cycles for each test.
(4) Strain at onset of buckling (in./in., mm/mm): The strain at initiation of buckling was based on the equations discussed in above for each cyclic test.
(5) Midspan displacement at onset of buckling (in., mm): The midspan displacement at initiation of buckling was determined based on the equations provided in Chapter 3, for each cyclic test.
In Table 4.4, the mean values reported are based on at least 3 samples. However, due to misalignment of the UTM heads in the compression region during testing of some of the specimens, the midspan displacement measured with horizontal string pots were not sufficiently accurate for a few cases, and therefore the buckling behavior of these tests were not modeled with the proposed equations for onset of buckling, including the 3% - 6% tests for the Grade 80 reinforcing steel bars and the 6% - 6% for all cases.
Figure 4.2 to Figure 4.5 show illustrative plots of the stress-strain results obtained for specimens with sh/db = 6. The fracture surfaces of the selected test specimen are presented in Figure 4.6.

18
Figure 4.1: Stress-strain results for monotonic tests
Table 4.1: Reinforcement bar tensile test results summary
Bar Size Grade,
ksi (MPa)
ASTM Desig.
Yield Point (0.2% offset)
Yield Point (0.0035 EUL) Tensile Strength Ultimate Strain
Stress, ksi
(MPa)
Strain, in./in.
(mm/mm)
Stress, ksi
(MPa)
Strain, in./in.
(mm/mm)
Stress, ksi
(MPa)
Strain, in./in.
(mm/mm)
Stress, ksi
(MPa)
Strain, in./in.
(mm/mm)
#5 (#16M)
Gr. 60 (420) A615 68.1
(469) 0.0042 68.1 (469) 0.0035 102.2
(705) 0.1169 75.2 (518) 0.1492
#5 (#16M)
Gr. 60 (420) A706 64.6
(445) 0.0043 64.3 (443) 0.0035 93.8
(647) 0.1180 67.6 (466) 0.2239
#5 (#16M)
Gr. 80 (550) A615 80.7
(556) 0.0053 80.4 (554) 0.0035 115.9
(799) 0.1105 93.75 (646) 0.1973
#5 (#16M)
Gr. 80 (550) A706 86.2
(594) 0.0051 85.4 (589) 0.0035 114.3
(788) 0.1066 86.8 (598) 0.1555
Table 4.2: Reinforcement bar elongation and strain hardening results summary
Bar Size Grade,
ksi (MPa)
ASTM Desig. Elongation
Strain Hardening Point
Stress, ksi (MPa) Strain, in./in. (mm/mm)
#5 (#16M)
Gr. 60 (420) A615 18 % 68.2 (470) 0.0098
#5 (#16M)
Gr. 60 (420) A706 18 % 64.5 (445) 0.0089
#5 (#16M)
Gr. 80 (550) A615 14 % 81.2 (560) 0.0089
#5 (#16M)
Gr. 80 (550) A706 14 % 85.9 (592) 0.0084

19
Table 4.3: Summary of cyclic tests results (sh/db = 6)
𝜺𝜺𝑪𝑪 − 𝜺𝜺𝑻𝑻, %-% 𝜺𝜺𝑪𝑪/𝜺𝜺𝑻𝑻
Grade, ksi
(MPa) ASTM WfT, ksi
(MPa) Nf Energy/cycle,
ksi (MPa)
Strain at onset of
buckling, in./in.
(mm/mm)
Midspan displacement
at onset of buckling, in.
(mm)
0.2-2 0.1
Gr. 60 (420)
A615 93.4 (644) 54.2 1.72 (11.9) * *
A706 120.2 (828) 90.4 1.33 (9.2) * *
Gr. 80 (550)
A615 99.5 (686) 63.9 1.56 (10.7) * *
A706 87.2 (601) 54.9 1.59 (10.9) * *
1-2 0.5
Gr. 60 (420)
A615 44.4 (306) 16.4 2.70 (18.6) -0.001 0.07 (0.18)
A706 55.5 (383) 21.5 2.58 (17.8) -0.005 0.07 (0.17)
Gr. 80 (550)
A615 46.2 (318) 16.6 2.78 (19.2) -0.003 0.07 (0.18)
A706 36.6 (252) 12.5 2.94 (20.3) -0.004 0.09 (0.24)
2-2 1
Gr. 60 (420)
A615 26.4 (182) 6.6 4.03 (27.8) -0.005 0.09 (0.24)
A706 27.8 (192) 8.8 3.16 (21.8) -0.009 0.09 (0.24)
Gr. 80 (550)
A615 27.7 (191) 7.1 3.92 (27.0) -0.006 0.08 (0.21)
A706 21.4 (147) 4.8 4.47 (30.8) -0.009 0.09 (0.23)
0.4-4 0.1
Gr. 60 (420)
A615 23.4 (161) 6.0 3.93 (27.1) 0.009 0.11 (0.27)
A706 32.8 (226) 9.6 3.42 (23.6) 0.005 0.10 (0.25)
Gr. 80 (550)
A615 30.2 (208) 6.5 4.62 (31.8) 0.009 0.09 (0.23)
A706 24.7 (170) 4.6 5.36 (36.9) 0.004 0.09 (0.23)
2-4 0.5
Gr. 60 (420)
A615 14.6 (101) 2.7 5.44 (37.5) -0.001 0.13 (0.34)
A706 20.0 (138) 4.1 4.92 (33.9) 0.012 0.14 (0.35)
Gr. 80 (550)
A615 17.9 (123) 3.3 5.42 (37.3) -0.002 0.14 (0.36)
A706 14.7 (101) 2.4 6.21 (42.8) 0.013 0.14 (0.36)
4-4 1
Gr. 60 (420)
A615 17.7 (122) 2.0 8.83 (60.8) 0.01 0.20 (0.51)
A706 16.1 (111) 2.1 7.57 (52.1) 0.008 0.18 (0.47)
Gr. 80 (550)
A615 10.3 (71) 1.1 8.98 (61.9) 0.002 0.18 (0.46)
A706 10.3 (71) 1.4 7.55 (52.0) 0.003 0.19 (0.47) *: Did not show evidence of buckling before fracture was reached

20
Table 4.3: Summary of cyclic tests results (sh/db = 6) (continued)
𝜺𝜺𝑪𝑪 − 𝜺𝜺𝑻𝑻, %-% 𝜺𝜺𝑪𝑪/𝜺𝜺𝑻𝑻
Grade, ksi
(MPa) ASTM WfT, ksi
(MPa) Nf Energy/cycle,
ksi (MPa)
Strain at onset of
buckling, in./in.
(mm/mm)
Midspan displacement
at onset of buckling, in.
(mm)
0.6-6 0.1
Gr. 60 (420)
A615 14.1 (97) 2.6 5.34 (36.8) 0.035 0.16 (0.40)
A706 17.2 (119) 3.7 4.70 (32.4) 0.033 0.16 (0.41)
Gr. 80 (550)
A615 15.2 (104) 2.7 5.58 (38.4) 0.021 0.16 (0.40)
A706 17.1 (118) 2.6 6.51 (44.9) 0.028 0.16 (0.40)
3-6 0.5
Gr. 60 (420)
A615 9.6 (66) 2.1 4.68 (32.2) 0.029 0.22 (0.55)
A706 8.7 (60) 1.6 5.57 (38.4) 0.027 0.22 (0.55)
Gr. 80 (550)
A615 11.4 (78) 1.3 8.92 (61.5) 0.023 0.21 (0.54)
A706 11.8 (81) 1.3 8.89 (61.2) 0.026 0.22 (0.55)
6-6 1
Gr. 60 (420)
A615 12.0 (82) 0.9 13.26 (91.4) 0.025 0.29 (0.73)
A706 12.6 (87) 1.1 11.72 (80.7) 0.023 0.28 (0.72)
Gr. 80 (550)
A615 12.7 (88) 0.9 14.28 (98.4) 0.017 0.27 (0.69)
A706 14.3 (98) 0.9 16.26 (112.0) 0.022 0.28 (0.72) *: Did not show evidence of buckling

21
Table 4.4: Summary of cyclic tests results (sh/db = 4)
𝜺𝜺𝑪𝑪 − 𝜺𝜺𝑻𝑻, %-% 𝜺𝜺𝑪𝑪/𝜺𝜺𝑻𝑻
Grade, ksi
(MPa) ASTM WfT, ksi
(MPa) Nf Energy/cyc
le, ksi (MPa)
Strain at onset of
buckling, in./in.
(mm/mm)
Midspan displacement
at onset of buckling, in.
(mm)
0.2-2 0.1
Gr. 60 (420)
A615 192.3 (1325) 131 1.47 (10.1) * *
A706 184.2 (1269) 107 1.71 (11.8) * *
Gr. 80 (550)
A615 127.9 (881) 86.6 1.48 (10.2) * *
A706 103.3 (712) 68.7 1.50 (10.4) * *
1-2 0.5
Gr. 60 (420)
A615 97.1 (669) 39.1 2.48 (17.1) -0.005 0.031
A706 99.7 (687) 41.6 2.39 (16.5) -0.008 0.030
Gr. 80 (550)
A615 83.7 (577) 29.2 2.86 (19.7) -0.006 0.031
A706 60.2 (415) 19.7 3.06 (21.1) -0.007 0.029
2-2 1
Gr. 60 (420)
A615 43.9 (302) 11.5 3.82 (26.3) -0.010 0.043
A706 67.3 (464) 17.7 3.79 (26.1) -0.016 0.041
Gr. 80 (550)
A615 45.4 (313) 9.8 4.64 (32.0) -0.012 0.040
A706 35.5 (245) 7.0 5.09 (35.1) -0.015 0.042
0.4-4 0.1
Gr. 60 (420)
A615 24.5 (169) 11.7 2.09 (14.4) 0.002 0.032
A706 55.0 (379) 13.7 4.01 (27.6) -0.001 0.046
Gr. 80 (550)
A615 26.0 (179) 11.2 2.32 (16.0) 0.001 0.027
A706 16.7 (115) 6.8 2.45 (16.9) -0.002 0.026
2-4 0.5
Gr. 60 (420)
A615 19.5 (134) 2.8 7.03 (48.4) -0.004 0.061
A706 18.2 (125) 2.9 6.20 (42.7) 0.002 0.061
Gr. 80 (550)
A615 24.2 (167) 3.5 6.87 (47.3) -0.005 0.062
A706 19.7 (136) 2.6 7.61 (52.4) 0.003 0.062
4-4 1
Gr. 60 (420)
A615 19.9 (137) 2.1 9.65 (66.5) -0.012 0.081
A706 23.3 (160) 3.0 7.82 (53.9) -0.013 0.084
Gr. 80 (550)
A615 21.6 (149) 2.0 10.77 (74.2) -0.014 0.080
A706 11.4 (79) 1.0 11.20 (77.2) -0.015 0.079
*: Did not show evidence of buckling

22
Table 4.4: Summary of cyclic tests results (sh/db = 4) (continued)
𝜺𝜺𝑪𝑪 − 𝜺𝜺𝑻𝑻, %-% 𝜺𝜺𝑪𝑪/𝜺𝜺𝑻𝑻
Grade, ksi
(MPa) ASTM WfT, ksi
(MPa) Nf Energy/cyc
le, ksi (MPa)
Strain at onset of
buckling, in./in.
(mm/mm)
Midspan displacement
at onset of buckling, in.
(mm)
0.6-6 0.1
Gr. 60 (420)
A615 15.6 (107) 2.7 5.84 (40.3) 0.012 0.070
A706 27.5 (189) 3.8 7.27 (50.1) 0.011 0.069
Gr. 80 (550)
A615 31.2 (215) 3.5 9.04 (62.3) 0.005 0.068
A706 24.3 (167) 2.4 10.23 (70.5) 0.008 0.070
3-6 0.5 Gr. 60 (420)
A615 11.5 (79) 1.4 8.44 (58.2) 0.002 0.096
A706 21.7 (150) 2.4 9.24 (63.7) 0.001 0.093
*: Did not show evidence of buckling
Figure 4.2: Selection of typical strain-stress curve for 0.2-2 cyclic tests

23
Figure 4.3: Selection of typical strain-stress curve for 1-2 cyclic tests
Figure 4.4: Selection of typical strain-stress curve for 2-4 cyclic tests

24
Figure 4.5: Selection of typical strain-stress curve for 3-6 cyclic tests
(a) (b)
(b) (d)
Figure 4.6: Selection of typical rupture section of cyclic tests

25
5.0 ANALYSIS OF THE RESULTS
5.1 STATISTICAL ANALYSIS OF THE RESULTS
This section presents the statistical analysis of the test results. This analysis is intended to assist the reader in evaluating and predicting the low-cycle fatigue performance and/or behavior of different types and grades of steel reinforcement. For the steel reinforcement evaluated in this research, the following were analyzed: (i) Total energy, WfT; (ii) number of cycles to failure, Nf; (iii) hysteretic energy dissipated per cycle; (iv) strain at onset of buckling; and (v) midspan displacement at onset of buckling. The analysis and graphs presented in this section were created using the statistical software IBM SPSS v0.22 using data obtained from cyclic tests presented in Chapter 4.0 (Table 4.2) and Table 5.1 and Table 5.2 in this section. Table 5.1 and Table 5.2 provide statistical analysis of the test results. P-values below 0.05 in these tables represent that there is a significant difference between the mean values of the analyzed data groups. A comparison of the results was performed for five groups: (1) the ASTM A615 specimens; (2) the ASTM A706 specimens; (3) the Grade 60 specimens; (4) the Grade 80 specimens; and for the (5) Lateral spacing to reinforcement bar diameter (sh/db = 4 and 6).
ASTM A615 specimen comparison
This section compares the results from the A615 Grade 60 (G60) and A615 Grade 80 (G80) specimens with sh/db values of 4 and 6. Figures 5.1 through 5.8 show the following for tests with sh/db of 4 and 6 for tests with different εc/εt values: (i) the mean number of cycles to failure, Nf; (ii) the mean total energy dissipated, WfT; (iii) the mean energy dissipated per cycle; and (iv) the mean strain at onset of buckling.
From the figures it can be seen that the mean number of cycles to failure for the A615 G60 reinforcing steel bars is higher than the mean number of cycles to failure for the A615 G80 specimens for all tests except for the 2-4% and 0.6-6% tests in the sh/db = 4 group. In addition, in tests with the same tensile strain (εt = 2%, 4% and 6%) and across all compressive strain values, the mean number of cycles to failure increase with decreasing compressive strains for both sh/db values (4 and 6). Lastly, the difference between the mean number of cycles to failure for the A615 G80 and the A615 G60 specimens increases with decreasing maximum compressive strain for tests with a Sh/db of 4. This result elucidates on the effect of maximum compressive strain on the low-cycle fatigue failure of longitudinal reinforcing steel elements with shorter lateral spacings.
With a few exceptions, the mean energy dissipated per cycle values exhibit similar results. The exceptions are the 0.4-4%, 0.6-6% and 3-6% test results when sh/db = 4 and test results with maximum tensile strains of 6% when sh/db = 6. In these cases, the A615 G80 specimens exhibit higher energy per cycle than the A615 G60 specimens. It can be seen that the results for specimens tested under the same tensile strains, the mean energy dissipated per cycle increases with increasing compressive strains for both lateral spacing conditions (sh/db = 4 and sh/db = 6).

26
The onset of buckling for the A615 G60 specimens occurs at larger positive strains than the A615 G80 specimens for all the tests with sh/db values of 4 and 6. It also can be seen that for the sh/db = 6 specimens, the difference between the results from the A615 G60 and A615 G80 specimens increase with larger maximum tensile strains.
Results of t-tests indicate that there is no statistically significant difference between the mean values of the A615 G60 and A615 G80 specimens for tests with lower total strain ranges (0.2-2%, 1-2%, 2-2% and 0.4-4%). When tensile strains increase (e.g., εt = 6%) the difference between the A615 G60 and A615 G80 results increase for both the sh/db = 4 and 6 specimens.
ASTM A706 specimen comparison
This section compares the results from the A706 G60 and A706 G80 for specimens with sh/db = 4 and 6. Unlike the A615 specimens, the A706 G60 and A706 G80 specimens exhibited different behaviors.
The mean number of cycles to failure of the A706 G60 specimens were consistently higher than the mean number of cycles to failure of the A706 G80 specimens for tests with sh/db values of 4 and 6. Results of the t-test of the mean number of cycles to failure confirm that this difference is statistically significant.
The mean total energy dissipated for the A706 G60 specimens were consistently higher than the A706 G80 specimens for both tests with sh/db = 4 and 6. This difference was higher for tests with lower maximum tensile strains (εt = 2% and 4%). However, the results of t-tests of the mean total energy dissipated indicates that the 0.2-2% and 2-4% tests with and sh/db = 4 and tests with lower total strain ranges (0.2-2%, 1-2%, 2-2%, 0.4-4% and 0.6-6%) for the sh/db = 6 group do not exhibit significant differences in the mean values.
As can be seen from the plots, there is a meaningful difference in mean energy dissipated per cycle values for the A706 G80 and the A706 G60 specimens for the Sh/db = 4 and 6 specimens. The A706 G80 specimens exhibit higher values in all the tests. However, this difference is not significant in all the tests. The difference is more significant when total strain range is higher, especially for the sh/db = 6 group. This is believed to be due to effect of buckling on specimens with longer lateral support spacing.
The A706 G60 and A706 G80 specimens exhibit similar behavior in buckling under all the test conditions. The onset of buckling is also similar in both sh/db groups (4 and 6). T-test results indicate that there is no statistically significant difference between the mean strain at onset of buckling of A706 G60 and A706 G80 in tests with smaller total strain range (0.2-2%, 1-2%, 2-2% and 0.4-4%).
Grade 60 specimen comparison
This section compares the results from the A615 G60 and A706 G60 for specimens with sh/db = 4 and 6.
From Figure 5.1 (mean number of cycles to failure) and Figure 5.2 (mean total energy dissipated), it can be seen there are similar trends between the sh/db = 4 and 6 specimens. In the

27
specimens with sh/db = 4 and 6 the A706 G60 specimens exhibit higher mean number of cycles to failure and higher mean total energy dissipated than the A615 G60 specimens. It should be noted that the 0.2-2% test with a sh/db value of 4 and the 4-4% test with a sh/db value of 6 did not follow this trend. In the specimens with sh/db = 6, the energy per cycle for the A615 G60 specimens exhibit higher values for all tests except the 3-6% test. This is likely due to the lower number of cycles to failure that occur with the A615 G60 reinforcing bars, which is likely a result of the higher overall ductility of the A615 G60 specimens.
The results of the mean energy dissipated per cycle show larger scatter for the sh/db = 4 test conditions and no general trends are observed. However, by separating the sh/db = 4 tests into 3 groups based on the maximum tensile strain (εt = 2%, 4% and 6%), a trend seems to emerge. In each group, the mean energy dissipated per cycle for the A615 G60 specimens is less than the mean energy dissipated per cycle for the A706 G60 specimens at lower maximum compressive strain. By increasing the maximum compressive strain, the A615 G60 exhibit higher energy per cycle than the A706 G60 specimens. This indicates that the effect of maximum compressive strain on cyclic behavior of A615 G60 and A706 G60 reinforcing bars is significant. Results of t-testing indicates significant differences between the mean values of the A615 G60 and A706 G60 specimens for mean number of cycles to failure. T-testing also indicates no significant difference in means for total energy dissipated and mean energy dissipated per cycle for the same groups. However, statistical testing indicates that there is significant difference on mean values for the total energy dissipated and mean energy dissipated per cycle for the tests with larger total strains.
Except for the 4-4% test, the A615 G60 specimens exhibit larger positive strains at the onset of buckling than the A706 G60 specimens for all the test conditions. In the 4-4% tests with sh/db = 4 and 6, the A706 G60 specimens exhibit evidence of buckling lower than the A615 G60 specimens. However, t-test results indicate that there is no statistically significant difference between the mean strain at onset of buckling for the A615 G60 and A706 G60 specimens tested at higher total strains (4-4%, 0.6-6%, 3-6% and 6-6%).
Grade 80 specimen comparison
This section compares the results from the A615 G80 and A706 G80 specimens with sh/db = 4 and 6.
The A615 G80 specimens exhibited higher mean number of cycles to failure and higher mean total energy dissipated than the A706 G80 specimens for both lateral support spacings (sh/db = 4 and sh/db = 6).
Comparison on the initiation of buckling for the A615 G80 and A706 G80 specimens are separated into two groups. The A615 G80 specimens exhibit higher strains at the onset of buckling than the A706 G80 specimens for tests with maximum tensile strains of less than 2%. When the maximum tensile strain exceeds 2% the behavior changes and the A706 G80 specimens exhibit higher strains at the onset of buckling. T-test results indicate that with the exception of the 4-4% and 1-2% tests in the sh/db = 4 group and the 1-2%, 2-2% and 4-4% tests in sh/db = 6 group, that all tests exhibit significant differences in mean values.

28
Lateral spacing to reinforcement bar diameter (sh/db = 4, 6) specimen comparison
This section compares the results from the tests with sh/db = 4 and 6. Overall, increasing lateral spacing results in lower mean number of cycles to failure, lower mean total energy dissipated, lower mean energy dissipated per cycle, and lower mean strains at onset of buckling. This behavior was expected because larger values of sh/db increase the effects of buckling on failure of the specimens during cyclic loading.
Figure 5.1: Mean number of cycles to failure for reinforcement with sh/db = 4

29
Figure 5.2: Mean energy dissipated for reinforcement with sh/db = 4
Figure 5.3: Mean energy dissipated per cycle for reinforcement with sh/db = 4

30
Figure 5.4: Strain at onset of buckling for reinforcement with sh/db = 4
Figure 5.5: Mean number of cycles to failure for reinforcement with sh/db = 6

31
Figure 5.6: Mean total energy dissipated for reinforcement with sh/db = 6
Figure 5.7: Mean energy dissipated per cycle for ASTM A615 reinforcement with sh/db = 6
32
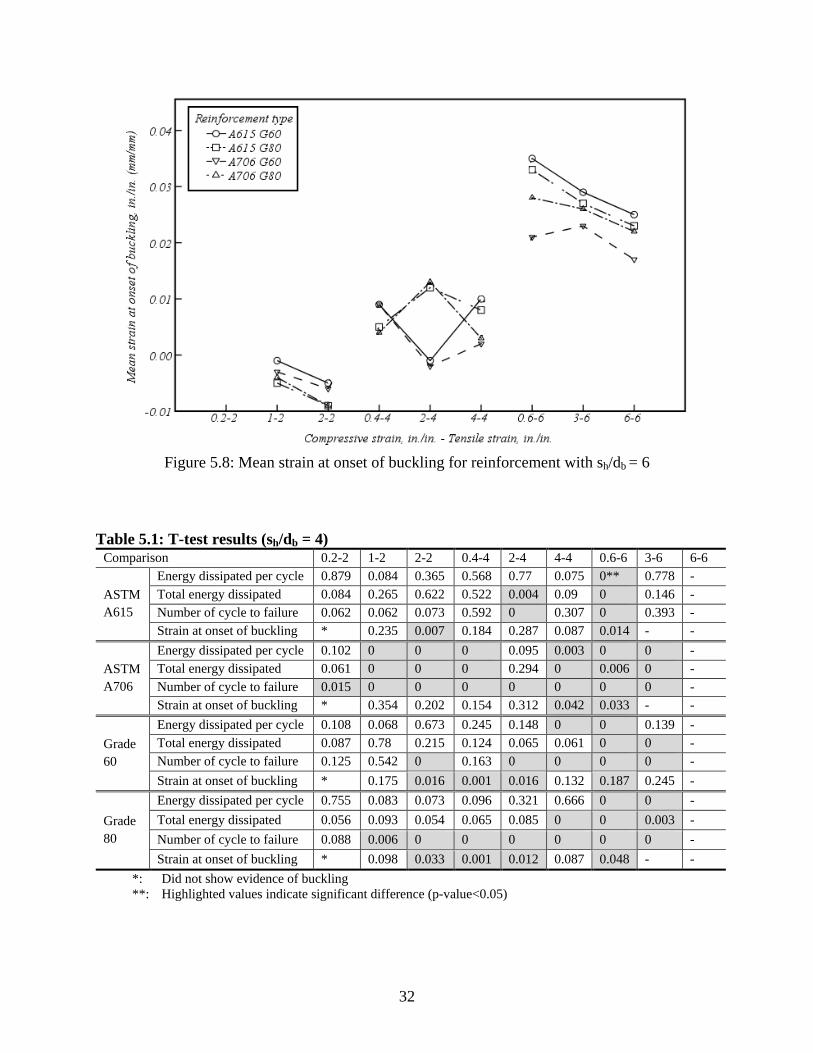
Figure 5.8: Mean strain at onset of buckling for reinforcement with sh/db = 6
Table 5.1: T-test results (sh/db = 4) Comparison 0.2-2 1-2 2-2 0.4-4 2-4 4-4 0.6-6 3-6 6-6
ASTM A615
Energy dissipated per cycle 0.879 0.084 0.365 0.568 0.77 0.075 0** 0.778 - Total energy dissipated 0.084 0.265 0.622 0.522 0.004 0.09 0 0.146 - Number of cycle to failure 0.062 0.062 0.073 0.592 0 0.307 0 0.393 - Strain at onset of buckling * 0.235 0.007 0.184 0.287 0.087 0.014 - -
ASTM A706
Energy dissipated per cycle 0.102 0 0 0 0.095 0.003 0 0 - Total energy dissipated 0.061 0 0 0 0.294 0 0.006 0 - Number of cycle to failure 0.015 0 0 0 0 0 0 0 - Strain at onset of buckling * 0.354 0.202 0.154 0.312 0.042 0.033 - -
Grade 60
Energy dissipated per cycle 0.108 0.068 0.673 0.245 0.148 0 0 0.139 - Total energy dissipated 0.087 0.78 0.215 0.124 0.065 0.061 0 0 - Number of cycle to failure 0.125 0.542 0 0.163 0 0 0 0 - Strain at onset of buckling * 0.175 0.016 0.001 0.016 0.132 0.187 0.245 -
Grade 80
Energy dissipated per cycle 0.755 0.083 0.073 0.096 0.321 0.666 0 0 - Total energy dissipated 0.056 0.093 0.054 0.065 0.085 0 0 0.003 - Number of cycle to failure 0.088 0.006 0 0 0 0 0 0 - Strain at onset of buckling * 0.098 0.033 0.001 0.012 0.087 0.048 - -
*: Did not show evidence of buckling **: Highlighted values indicate significant difference (p-value<0.05)

33
Table 5.2: T-test results (sh/db = 6) Comparison 0.2-2 1-2 2-2 0.4-4 2-4 4-4 0.6-6 3-6 6-6
ASTM A615
Energy dissipated per cycle 0.053 0.358 0.578 0.085 0.915 0.811 0.299 0** 0.071 Total energy dissipated 0.576 0.593 0.604 0.06 0.072 0 0 0 0.114 Number of cycle to failure 0.164 0.916 0.48 0.193 0.013 0 0.467 0 0.687 Strain at onset of buckling * 0.06 0.112 0.541 0.171 0.012 0.007 0.016 0.082
ASTM A706
Energy dissipated per cycle 0.068 0.232 0.071 0.1 0 0.961 0 0 0 Total energy dissipated 0.313 0.073 0.068 0.083 0 0 0.933 0 0.004 Number of cycle to failure 0.003 0 0 0 0 0 0.001 0.001 0 Strain at onset of buckling * 0.123 0.654 0.145 0.161 0.021 0.021 0.124 0.133
Grade 60
Energy dissipated per cycle 0.685 0.678 0.081 0.079 0.121 0.097 0.004 0.001 0.004 Total energy dissipated 0.059 0.069 0.524 0.09 0.101 0.207 0.025 0.002 0.185 Number of cycle to failure 0.001 0 0.014 0 0.001 0.005 0.001 0 0.001
Strain at onset of buckling * 0.023 0.025 0.017 0.0076 0.064 0.056 0.063 0.089
Grade 80
Energy dissipated per cycle 0.125 0.158 0.055 0.266 0.096 0.014 0.005 0.891 0.052
Total energy dissipated 0.313 0.062 0.062 0.09 0.001 0.994 0 0.038 0.097
Number of cycle to failure 0.271 0.014 0.069 0 0 0.012 0.418 0.509 0.463
Strain at onset of buckling * 0.145 0.085 0.036 0.006 0.174 0.014 0 0.021 *: Did not show evidence of buckling **: Highlighted values indicate significant difference (p-value<0.05)
5.2 FATIGUE LIFE PREDICTION
Fatigue life models have been developed to predict the low-cycle fatigue behavior of steel reinforcement. Koh and Stephans (Koh and Stephans 1991) developed the following model to relate total strain (ɛa) with fatigue life data:
( )ma fε M 2N = (5.1)
where M and m are the material constants, εa is total strain amplitude, and 2Nf is the number of half-cycles to failure. By plotting the models on a log-log scale, constants can be determined using the least squared method. Another approach to develop models for fatigue life is to use plastic strain (ɛp) instead of total strain (ɛa). Plastic strain is used in many fatigue life models. However, this presents challenges due to difficulties resulting from the Bauschinger effects. Table 5.3 provides equations for best fit and their respective correlation coefficients (R2) for both elastic strain and plastic strain models. Figure 5.9 shows the fatigue life relationship based on half-cycle to failure for ASTM A615 G60 specimens with sh/db=4 and 6, respectively.
The energy-based model is another form of representing fatigue life prediction. Mander et al. (Mander et al. 1994) proposed the following model by eliminating the half-cycle to failure and directly relating total energy to failure to the strain amplitude:
( )W W= pfT a a ε (5.2)

34
where Wa and p are material constants. Both total strain and plastic strain can be used in this model which is represented by ɛa. Table 5.4 provides best fit equations and their respective R2 values.
The energy based models (Table 5.4) provide lower R2 values compared to the models that use half-cycle to failure (Table 5.3). This indicates that the half-cycle model provides a better fit than the energy-based model. Figure 5.10 shows the fatigue life relationship based on total energy dissipated for A615 G60 specimens with sh/db=4 and 6.
Figure 5.11 and Figure 5.12 present fatigue life prediction equations for specimens with sh/db=4 and 6, respectively. The relationships proposed by Brown and Kunnath (Brown and Kunnath 2004) are also included in Figure 5.12 for comparison. Tables 5.3 and 5.4 show results of fatigue life models equations based on the half-cycle models and the energy-based models. It can be seen that the R2 values for the half-cycle model are near 1, and in all cases these are higher than the R2 values obtained for the energy models.
(a) (b)
Figure 5.9: Fatigue life relationship based on half-cycle to failure: (a) ASTM615 G60 specimens with Sh/db=4; and (b) ASTM615 G60 specimens with Sh/db=6.
(a) (b)
Figure 5.10: Fatigue life relationship based on total energy: (a) ASTM A615 G60 specimens with sh/db = 4; and (b) ASTM A615 G60 specimens with sh/db = 6.
0.01
0.11 10 100
Tota
l str
ain
ampl
itude
Half-cycles to failure (2Nf)
A615 G60
0.01
0.11 10 100
Tota
l str
ain
ampl
itude
Half-cycles to failure (2Nf)
A615 G60
0.01
0.11.00 10.00 100.00
Tota
l str
ain
ampl
itude
Total energy to failure (Wft)
A615 G60
0.01
0.11.00 10.00 100.00
Tota
l str
ain
ampl
itude
Total energy to failure (Wft)
A615 G60

35
Figure 5.11: Fatigue life prediction for specimens with sh/db = 4
Figure 5.12: Fatigue life prediction for specimens with sh/db = 6
0.01
0.11 10 100
Tota
l str
ain
ampl
itude
Number of half-cycles to failure (2Nf)
A615 G60A615 G80A706 G60A706 G80
0.01
0.11 10 100
To
tal s
trai
n am
plitu
de
Number of half-cycles to failure (2Nf)
A615 G60A615 G80A706 G60A706 G80#6#7#8#9
Brown and Kunnath

36
Table 5.3: Results of fatigue life models (half-cycle model)
Model type Bar size Grade, ksi
(MPa) ASTM Gage length Equation R2 To
tal s
train
#5 (#16M) Gr. 60 (420) A615
4db ɛa = 0.061 (2Nf)-0.32 0.96
6db ɛa = 0.069 (2Nf)-0.42 0.95
#5 (#16M) Gr. 60 (420) A706
4db ɛa = 0.069 (2Nf)-0.34 0.96
6db ɛa = 0.070 (2Nf)-0.38 0.96
#5 (#16M) Gr. 80 (550) A615
4db ɛa = 0.065 (2Nf)-0.36 0.98
6db ɛa = 0.062 (2Nf)-0.38 0.95
#5 (#16M) Gr. 80 (550) A706
4db ɛa = 0.057 (2Nf)-0.35 0.97
6db ɛa = 0.062 (2Nf)-0.41 0.93
Plas
tic st
rain
#5 (#16M) Gr. 60 (420) A615
4db ɛp = 0.058 (2Nf)-0.35 0.95
6db ɛp = 0.067 (2Nf)-0.47 0.93
#5 (#16M) Gr. 60 (420) A706
4db ɛp = 0.068 (2Nf)-0.38 0.97
6db ɛp = 0.069 (2Nf)-0.43 0.97
#5 (#16M) Gr. 80 (550) A615
4db ɛp = 0.063 (2Nf)-0.40 0.98
6db ɛp = 0.061 (2Nf)-0.43 0.96
#5 (#16M) Gr. 80 (550) A706
4db ɛp = 0.054 (2Nf)-0.39 0.97
6db ɛp = 0.061 (2Nf)-0.46 0.94

37
Table 5.4: Results of fatigue life models (energy-based model)
Model type Bar size Grade, ksi
(MPa) ASTM Gage length Equation R2 To
tal s
train
#5 (#16M) Gr. 60 (420) A615
4db ɛa = 0.164 (Wft)-0.52 0.82
6db ɛa = 0.240 (Wft)-0.71 0.86
#5 (#16M) Gr. 60 (420) A706
4db ɛa = 0.252 (Wft)-0.60 0.91
6db ɛa = 0.215 (Wft)-0.64 0.89
#5 (#16M) Gr. 80 (550) A615
4db ɛa = 0.275 (Wft)-0.66 0.87
6db ɛa = 0.235 (Wft)-0.69 0.89
#5 (#16M) Gr. 80 (550) A706
4db ɛa = 0.225 (Wft)-0.65 0.80
6db ɛa = 0.255 (Wft)-0.74 0.80
Plas
tic st
rain
#5 (#16M) Gr. 60 (420) A615
4db ɛp = 0.181 (Wft)-0.59 0.85
6db ɛp = 0.274 (Wft)-0.79 0.88
#5 (#16M) Gr. 60 (420) A706
4db ɛp = 0.289 (Wft)-0.67 0.92
6db ɛp = 0.242 (Wft)-0.72 0.90
#5 (#16M) Gr. 80 (550) A615
4db ɛp = 0.319 (Wft)-0.74 0.88
6db ɛp = 0.268 (Wft)-0.77 0.91
#5 (#16M) Gr. 80 (550) A706
4db ɛp = 0.257 (Wft)-0.74 0.81
6db ɛp = 0.298 (Wft)-0.83 0.82

38
39
6.0 CONCLUSION
A new experimental setup and testing procedure was developed to evaluate the low-cycle fatigue performance of four reinforcing steels, including two high-strength reinforcing steels. The research program included testing of more than 400 reinforcing bar specimens. The low-cycle fatigue behavior of these four reinforcing bars, A615 G60, A615 G80, A706 G60, and A706 G80, were assessed in this research. The main conclusions that can be drawn from the results of this study are:
1. Comparison of the results from the A615 G60 and A615 G80 testing indicates that at higher maximum tensile strains (εt = 6%) the A615 G80 specimens exhibited larger energy dissipation per cycle than the A615 G60 specimens. Results from statistical testing (t-tests) indicate that there is no statistically significant difference between A615 G60 and A615 G80 for tests with lower total strain ranges for all other parameters assessed.
2. Comparison of the A706 G60 and A706 G80 results indicate that even though A706 G80 exhibited larger mean values for energy dissipated per cycle than the A706 G60, there is no statistically significant difference in the low-cycle fatigue behavior of these specimens for most test conditions.
3. Comparison of A615 G80 and A706 G80 test results indicate that the A706 G80 specimens exhibit higher mean values for energy dissipated per cycle than the A615 G80 specimens for all test cases. However, statistical analyses comparing the means of the groups indicate that there is no statistically significant difference in the low-cycle fatigue behavior of these groups.
4. When specimens were tested with shorter lateral support spacing, specimens were cycled through a larger number of inelastic cycles. In addition, for specimens with longer lateral support spacing, low-cycle fatigue failures occurred at lower numbers of inelastic cycles and the onset of buckling occurred at lower strains.
5. When the total strain amplitude, εa, was increased, all reinforcement evaluated exhibited shorter fatigue lives. The Grade 60 reinforcements exhibited higher fatigue lives than the Grade 80 reinforcements when subjected to larger inelastic strains. However, when total strains were below 0.036 for the case when sh/db = 4 and below 0.022 for the case when sh/db = 6, the A615 G80 exhibited longer fatigue lives.
Although this research has made significant contributions to understanding the low-cycle fatigue of conventional and high-strength steel reinforcement, other research topics could be value-adding. Some suggested topics follow:
• Sensing for tracking of out-of-plane buckling would be beneficial and should be developed. This could include LED-based sensing or others;

40
• All tests performed in this research were #5 (#16M) reinforcing steel bar specimens. Several researchers have shown that there may be an effect of bar size on the low-cycle fatigue performance of reinforcing steel. Additional research on the topic is needed, especially for high-strength steel reinforcement (including grades higher than 80 ksi (550 MPa) with larger diameter bars).

41
7.0 REFERENCES
ASTM Standard A706/A706M, 2014. Standard Specification for Low-Alloy Steel Deformed and Plain Bars for Concrete Reinforcement. ASTM International, West Conshocken, PA, 2014, DOI: 10.1520/A0706_A0706M. www.astm.org ASTM Standard A615/A615M, 2014. Standard Specification for Deformed and Plain Carbon-Steel Bars for Concrete Reinforcement. ASTM International, West Conshocken, PA, 2014, DOI: 10.1520/A0615_A0615M. www.astm.org ASTM Standard E8/E8M, 2013a. Standard Test Methods for Tension Testing of Metallic Materials. ASTM International, West Conshocken, PA, 2013. www.astm.org ASTM Standard E83, 2010a. Standard Practice for Verification and Classification of Extensometer Systems. ASTM International, West Conshocken, PA, 2010, www.astm.org Barbosa, A., T. Link, and D. Trejo. Seismic Performance of High-Strength Steel RC Bridge Columns. Journal of Bridge Engineering, Vol. 21, No. 2, 2015. 10.1061/(ASCE)BE.1943-5592.0000769, 04015044. Brown, J., and S.K. Kunnath. Low-Cycle Fatigue Failure of Reinforcing Steel Bars. ACI Materials Journal, Vol. 101, No. 6, 2004, pp. 457–66. Koh, S.K., and R.I. Stephens. Mean Stress Effects on Low Cycle Fatigue for a High Strength Steel. Fatigue Fracture of Engineering Materials and Structures, Vol. 14, No. 4, 1991, pp. 413-428. Mander, J.B., F.D. Panthaki, and A. Kasalanati. Low‐Cycle Fatigue Behavior of Reinforcing Steel. Journal of Materials in Civil Engineering, Vol. 6, No. 4, 1994, pp. 453–68. doi:10.1061/(ASCE)0899-1561(1994)6:4(453). Monti, G., and C. Nuti. Nonlinear Cyclic Behavior of Reinforcing Bars Including Buckling. Journal of Structural Engineering, Vol. 118, No. 12, 1992, pp. 3268–84. doi:10.1061/(ASCE)0733-9445(1992)118:12(3268). Rodriguez, M.E., J.C.Botero, and J. Villa. Cyclic Stress-Strain Behavior of Reinforcing Steel Including Effect of Buckling. Journal of Structural Engineering, Vol. 125, No. 6, 1999, pp. 605–12. doi:10.1061/(ASCE)0733-9445(1999)125:6(605). Trejo, D., A.R. Barbosa, and T. Link. Seismic Performance of Circular Reinforced Concrete Bridge Columns Constructed with Grade 80 Reinforcement, No. FHWA-OR-RD-15-02. 2014.

42

APPENDIX A
ONSET OF BUCKLIN MATLAB CODE


A-1
APPENDIX A: ONSET OF BUCKLING MATLAB CODE
Definition of onset of buckling in a cyclic test: “The onset of buckling for the cyclic tests was defined by using the strain readings for ε1 and ε2 and relating these strains to the peak strains reached in the corresponding cycle, εm
+ and εm- . This
critical condition was defined when ε1 - ε2 was equal or greater than 0.2(εm+ -εm
- ).” Rodriguez et al. (1999). To model the onset of buckling, relations between peak strains and midspan displacement developed. Definition of parameters: lc = distance between the supports (in) la = actual gauge length (in) le = effective length (in) d = bar diameter (in) a = midspan displacement (in) εm
+ = peak tensile strain (in/in) εm
- = peak compressive strain (in/in) ε1 = strain along the fiber on the compressive side of the bar (in/in) ε2 = strain along the fiber on the tensile side of the bar (in/in) b = reinforcement midpoint change before and after buckling (in) 𝜃𝜃 = reinforcement midpoint angle Formulation: For fixed-fixed condition, the effective length is half of the distance between the supports:
2c
ell
= (A-1)
To estimate the actual gauge length (𝑙𝑙𝑎𝑎) of the specimen, the maximum strain at the first cycle read by the extensometer was fitted to the average vertical spot strain at the peak tension:
Maximum extensometer displacement Average maximum displacement of string potsExtensometer gauge length (2 in.) Specimen actual gauge length
= (A-2)
The onset of buckling under cyclic loading based on Rodriguez et al. (1999):
( )1 2 0 2 m m.ε ε ε ε+ −− = − (A-3)
Relating Eq. A-3 to Figure A.1 the compressive stains are given by:
1
22
b
e
db tan
l
θε
+ =
(A-4)
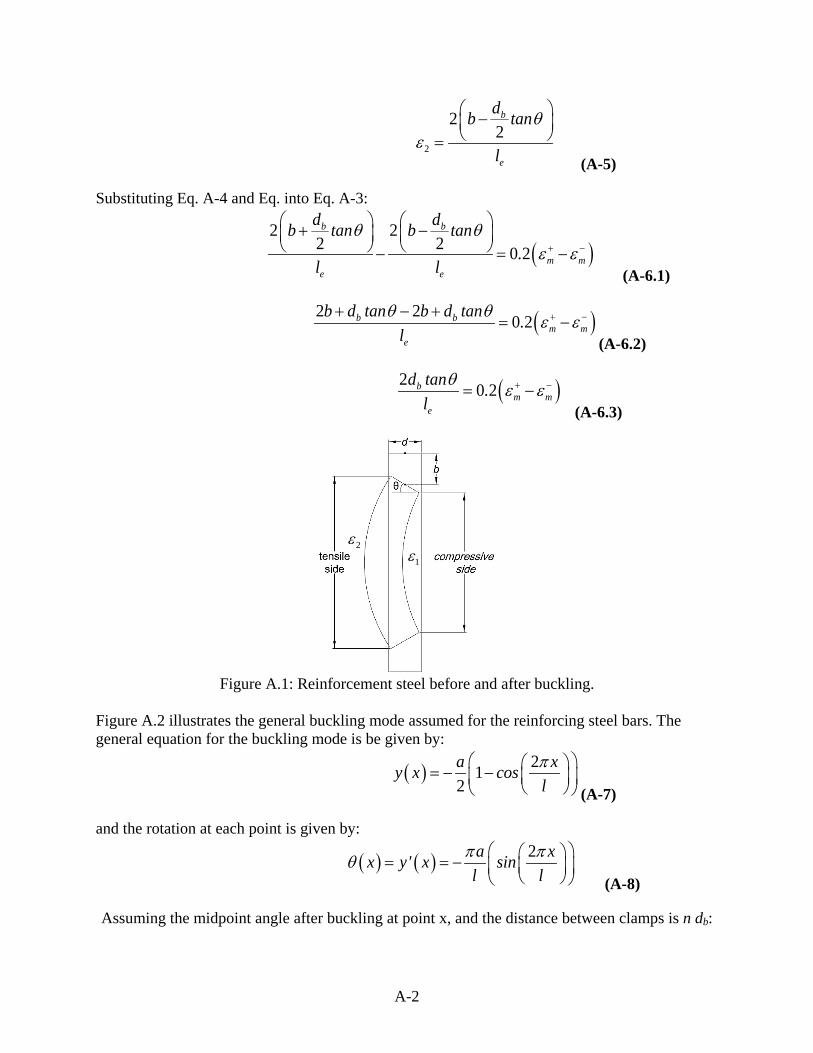
A-2
2
22
b
e
db tan
l
θε
− =
(A-5)
Substituting Eq. A-4 and Eq. into Eq. A-3:
( )
2 22 2 0 2
b b
m me e
d db tan b tan.
l l
θ θε ε+ −
+ − − = −
(A-6.1)
( )2 2 0 2b b
m me
b d tan b d tan .l
θ θ ε ε+ −+ − += −
(A-6.2)
( )2 0 2b
m me
d tan .l
θ ε ε+ −= − (A-6.3)
Figure A.1: Reinforcement steel before and after buckling.
Figure A.2 illustrates the general buckling mode assumed for the reinforcing steel bars. The general equation for the buckling mode is be given by:
( ) 21
2a xy x cos
lπ = − − (A-7)
and the rotation at each point is given by:
( ) ( ) 2a xx y' x sin
l lπ πθ = = − (A-8)
Assuming the midpoint angle after buckling at point x, and the distance between clamps is n db:
2ε1ε

A-3
( )
2 2
22
e b
b
l ndx b b
ndbax sinl l
ππθ
= − + = −
− = − (A-9)
and for a given value of a, the length of the bar between supports is given by:
c a al l lε= + (A-10)
and the rotation is therefore given by:
( )2
2b
c a a c a a
ndbax sin
l l l l
ππθε ε
− = −+ +
(A-11)
Using trigonometric relations and equating to the updated length of the bar:
( )
2
22 21
x
e a axc a ac a a
a xcos l ll ll l
π π εεε−
+ = + + ×+
∫ (A-12)
Figure A.2: Buckling mode for fixed-fixed condition.

A-4
Equations (A.3), (A6.3), and (A.12) relate the midspan displacement to the equation proposed by Rodriguez et al. (1999). Figure A.3 presents the onset of buckling for Cyclic_1-2_A615_G60_6db test. The obtained results show a good correlation to Figure 10 in Rodriguez et al. (1999). The codes for this modeling generated in Matlab software and presented in APPENDIX B.
Figure A.3: onset of buckling for Cyclic_1-2_A615_G60_6db test.

APPENDIX B
ONSET OF BUCKLING MATLAB CODE


B-1
APPENDIX B: ONSET OF BUCKLING MATLAB CODE
Codes generated in Matlab to model the onset of buckling: clc clear a; % (Read in vector of test results for midspan disp.) E; % (Read in vector with strains values) r = 6; % (Lateral spacing to bar diameter ratio, r= 4 or 6) d = 0.625; % (Bar diameter (in)) lc=r*d; % (Lateral spacing (in)) le=lc/2; % (Effective length (in)) la; % (Updated gauge length – see Chapter 3 for Proc.) emax=0.02; % (Max tension strain, 0.02 for 2%-2% test) emin=0.02; % (Max compression strain, 0.02 for 2%-2% test) syms x z for i = 1:length(a) y = sqrt(1+((2*pi^2*a(i)/((lc+E(i)*la)^2)))*(cos(2*pi*x/(lc+E(i)*la)))); I = int(y,z-0.9375,0.9375-z); B = solve(I-(le+E(i)*la) ==0, z); b(i) = double(B); T = -(pi*a(i)/(lc+E(i)*la))*sin(2*pi*(b(i)-0.9375)/(lc+E(i)*la)); teta(i) = double(T); end R=0.2*(emax+emin); for i = 1:length(teta) if (teta(i) -(atan((le*R)/(2*d))) < 0.001); ans(i) = teta(i); N(i) = i; else break; end end


APPENDIX C
TEST SETUP OVERALL VIEWS


C-1
APPENDIX C: TEST SETUP OVERALL VIEWS

C-2