Embed Size (px)
Citation preview

Part Two of a Series of Five Reports
High School Reform in Chicago Public Schools: Instructional Development SystemsAugust 2009
Susan E. Sporte
Macarena Correa
Holly M. Hart
Marjorie E. Wechsler
2

These reports were produced by a team of researchers from SRI International and The Consortium on Chicago School Research. The research team included Daniel C. Humphrey, Marjorie E. Wechsler, Viki M. Young, Ashley Campbell, Patrick M. Shields, Maria I. Abasi, Lauren Cassidy, Raymond McGhee, Jr., and Samantha Murray from SRI; and Sue E. Sporte, Macarena Correa, Holly M. Hart, Joy K. Lesnick, Lauren Sartain, Sara Ray Stoelinga, Julia Gwynne, Jimmy Sebastian, and W. David Stevens from the CCSR. The authors wish to acknowledge our partnership with the Chicago Public Schools in conducting this research, and particularly thank Bret Feranchak for his extensive assistance. In addition, we wish to thank Steve Cantrell and Ramona Thomas of the Bill & Melinda Gates Foundation for their guidance. The research was supported by the Bill & Melinda Gates Foundation. The views, findings, and conclusions expressed herein are those of the authors and do not necessarily express the views of the foundation. Any formal endorsement by CCSR’s Steering Committee, their organizations, or CCSR’s directors should not be assumed.

1
High School Reform in Chicago: Instructional Development Systems
Introduction
For most of the past decade, the Chicago Public Schools (CPS) have received significant
support from the Bill and Melinda Gates Foundation (BMGF) to improve the performance of city
high schools. As part of that support, the Foundation contracted with SRI International (SRI) and
the Consortium for Chicago School Research (CCSR) to conduct a comprehensive evaluation of
high school reform in Chicago. A major part of those reform measures, the Instructional
Development System (IDS), is addressed in this report.
The investigation into IDS was initially designed to follow the initiative for 4 years, but the
BMGF decided to redirect its resources and end the evaluation after the first round of data
collection. This report, therefore, sets forth preliminary evaluative work concerning the
implementation and early outcomes of the IDS initiative. Using data collected from school visits
in fall 2008 and administrative data, we describe the successes and challenges associated with
implementing the IDS initiative, indicate what instruction looked like in the first two waves of
IDS schools, and examine early evidence of the initiative’s impact on student performance.
Background
IDS is an ambitious reform model first implemented in 14 CPS high schools in the fall of
2006. IDS focuses on increasing the rigor and relevance of high school courses by strengthening
the curricula and improving. CPS worked with educational experts to develop two to three
comprehensive curricula in each of three subjects: English, mathematics, and science from which
participating schools could choose. Each subject-area IDS includes curricular strategies,
classroom materials, formative and summative assessments, targeted professional development,
and personalized coaching. The goal of each IDS curriculum is to prepare students for college
and the workforce, and each will be aligned to both state and college readiness standards.
Three “waves” of schools applied to be part of the initiative through a request for proposal
process. In most schools, implementation of the IDS begins in ninth grade during the first year,
adding tenth and eleventh grades during the second and third years of the initiative, respectively.
Wave 1 schools began in 2006-07, Wave 2 in 2007-08, and Wave 3 in 2008-09. A total of 43
schools CPS schools now participate in the IDS initiative (see Exhibit 1).
Exhibit 1
Number of CPS Schools Participating in the IDS Initiative
First Year of Implementation
Grades Currently Implemented
Number of Schools in 2008-09
Wave 1 2006-2007 9 through 11 13**
Wave 2 2007-2008 9 and 10 11
Wave 3 2008-2009 9 only* 19
* Two of the 19 schools in Wave 3 implemented IDS in grades 9-11 in their first year. ** Fourteen schools implemented IDS as part of the Wave 1 group during 2006-07 and 2007-08.
One of these schools closed in the spring of 2008. Its students were absorbed into a new turnaround school in Wave 3. The number of Wave 1 schools currently implementing IDS is 13.

2
This report answers the following questions about the IDS initiative:
• To what extent do teachers support and use the components of the IDS strategy
intended to improve instruction? We examine the implementation of the four main
components of IDS in depth: curriculum and materials, assessment, professional
development, and coaching.
• What does instruction look like at IDS schools? We present our findings on
classroom instruction based on interview and observation data. We include
descriptions of teacher expectations of students, student engagement, and academic
challenge.
• What are the effects of IDS on student performance? We examine student outcomes
such as attendance, course performance, failures, and test scores.
• What factors may be limiting the impact of IDS on instruction and student
achievement? We examine barriers at the student, school, and system levels that
affect the implementation and effectiveness of IDS.
First, we describe our data collection efforts in IDS schools. We then discuss the
implementation of the four main components of IDS: curriculum and materials, assessment,
professional development, and coaching. Next, we present student outcomes, including student
absences, course performance, and test score gains. Then, we describe current instruction in IDS
classrooms, based on classroom observations. We conclude with a discussion of challenges that
may be affecting IDS.
Method
This report is based on qualitative and quantitative data collected in fall 2008. We
conducted case studies in a stratified random sample of IDS schools, which included five Wave 1
schools, three Wave 2 schools, and five Wave 3 schools. Teams of two or three researchers spent
1 day in each of the schools. Across all case study schools, researchers conducted 148
interviews, including interviews with 112 teachers, as well as 36 principals, guidance counselors,
and assistant principals. (Appendix A provides the interview protocols.)
Researchers also conducted classroom observations in a subgroup of schools in our sample.
We observed teachers in 36 IDS classrooms in the 8 schools that were in their second or third
year of implementing the IDS curriculum. Exhibit 2 provides more detail about the
characteristics of the sample.

3
Exhibit 2 Characteristics of the Teacher Sample
*Five observed teachers taught multiple grades; we record the grade we observed. Ten unobserved teachers taught multiple grades; we record them as “multiple grades.”
Researchers used Charlotte Danielson’s Framework for Teaching as the instrument for
recording classroom practice (Danielson, 2007). An expert in this framework trained 13
researchers in how to use the rubric for rating teachers on 24 elements in two of Danielson’s four
“domains”—classroom environment and instruction. Researchers visited classrooms for one
class period (typically 45 minutes) and recorded qualitative field notes. They subsequently made
ratings for each element on a four-point scale—unsatisfactory, basic, proficient, or
distinguished—supplying evidence from the notes to support the rating. Appendix B provides
further information about the rubric and examples of each of the four rating levels.1
Additionally, we analyzed student achievement data to provide descriptive data on the
effect of the initiative on four indicators of interest: absences; student grade point average
(GPA), percent of students receiving an F in English, mathematics, or science; and a comparison
of actual and expected gains between the EXPLORE test taken in early ninth grade and the
PLAN test taken in early tenth grade.
1 For additional information and findings from the classroom observation, see A Snapshot of High School
Instruction in CPS, another report in this series.
Wave 1 interviewed (subset observed)
Wave 2 interviewed (subset observed)
Wave 3 interviewed
Total 49 (24) 23 (12) 44
Subject taught
English/reading 15 (7) 8 (5) 12
Mathematics 17 (10) 8 (4) 15
Science 17 (7) 6 (3) 14
Multiple subjects 1 3
Experience
2 years or less 7 (4) 7 (5) 8
3 years or more 42 (20) 16 (7) 36
Grade taught*
9th grade 22 (15) 17 (11) 35
10th or 11th grade 24 (10) 4 (1) 4
Multiple grades 3 2 5

4
IDS Implementation
The IDS strategy relies on providing mathematics, English, and science teachers with an
academically demanding, inquiry-based curriculum and sufficient materials to implement it;
common assessments; directed professional development; and intensive coaching. Theoretically,
the curriculum and pacing should serve to increase academic challenge and raise teachers’
expectations for their students, and the assessments should support pacing and data-driven
instructional decisions. The professional development should provide an understanding of the
curriculum itself and teaching strategies for implementing it, as well as opportunities for cross-
school networking. The coaching should provide on-the-ground support in teaching strategies,
data use, planning, and instructional problem-solving. Taken together, these components should
increase student engagement and improve instructional practice, ideally leading to improved
student outcomes. Exhibit 3 portrays how the primary IDS strategies are expected to affect
student outcomes.
Exhibit 3 IDS Strategy
In this section, we present findings regarding the implementation of the components of IDS
intended to affect instruction: curriculum and materials, assessment, professional development,
and coaching. We describe teachers’ support of these components as of fall 2008, and discuss
some of the logistics involved with their implementation.

5
Curriculum and Materials
According to the data, the majority of schools and teachers supported the IDS curriculum,
especially in Waves 1 and 2. Materials were plentiful, although timely delivery of the materials
after the first 2 years of implementation was problematic. As a result of having common
curricula and materials, teachers reported coherence, similar pacing schedules, and increased
collaboration.
The majority of schools and teachers supported the IDS curriculum and appreciated
the materials they received.
About two-thirds of interviewed teachers and 10 of 13 schools backed the IDS curriculum.
Schools in the first and second IDS waves were more likely to endorse the curriculum than were
schools in Wave 3, many of which were forced to participate in IDS.2 However, all waves had
positive comments to make about the initiative. For example, a Wave 3 English teacher said:
I can’t say enough about the curriculum. It identifies everything you need to know
and everything you need to do the job. It gives teachers options.
A Wave 2 mathematics teacher said, “I would advise anyone to go for it any day.” Across the
disciplines, science teachers were most supportive of their curricula. Exhibits 4 and 5 indicate the
degree of teacher support for the curriculum by wave and by subject, respectively.
Exhibit 4
Degree of Teacher Support for IDS Curriculum by Wave
2 Negative comments also were more prevalent among Wave 1 schools during their first year of implementation in
2006–07 than they were in the current data collection effort.

6
Exhibit 5 Degree of Teacher Support for IDS Curriculum by Subject (all waves)
Most of the schools also lauded the materials and resources that they received through IDS.
Teachers noted that materials were generally plentiful. One Wave 1 mathematics teacher
indicated the school was “overwhelmed with resources.” A Wave 1 principal in a different
school described the abundance of materials and their positive effects on the school:
With IDS all kids have books to take home. We have computer labs, laptop carts,
which is a big difference from [before]. It’s been 3 years of having everything.
That alone will impact scores…. [Finding] resources is my last thing to worry
about. That's great for a principal. I can think about instruction now.
In the first 2 years of the initiative materials arrived in a timely manner. By year 3, however,
problems with both the delivery and the appropriateness of materials were encountered. This
issue is discussed further in the section on barriers to implementation.
IDS helped create coherence, similar pacing, and collaboration within academic
disciplines.
Teachers reported that coherence, similar pacing, and collaboration increased as a result of
IDS. In addition to providing common curriculum and materials, the IDS initiative also required
schools to institute common planning time for teachers. Across all waves, teachers reported they
valued the time they had to meet together. Because the common curriculum and pacing guide
meant that most teachers were teaching the same topics at approximately the same time, teachers
reported that they were collaborating more around curriculum and instruction. According to a
Wave 2 English teacher:

7
[Through] having a common curriculum the teachers work so much together. The
students benefit from that as well. I know what other teachers’ students are doing
and vice versa and we can support each other.
Assessment
According to the data, teachers’ use of IDS assessments improved over time. Although
some teachers reported that tests were too difficult for students, others described how the
frequency of the formative tests (now referred to as “quarterlies”) helped the teachers stay on
pace in following the curriculum. Finally, the usefulness of test data was related to the timeliness
of receiving the test results and the extent to which teachers understood how to interpret the data.
Teachers perceived that the formative IDS assessments and their ability to use them
improved over time. They reported that data provided by the quarterly assessments
were useful and that they used them regularly to guide their decision-making.
Wave 1 and 2 schools reported that their early struggles with the formative and summative
assessments had been mitigated over time. A common perception in Wave 1 and Wave 2 schools
was that the assessment system had improved—or that teachers had become more adept at
understanding it. As a Wave 1 science teacher described:
No one knew how to use the formatives in year 1, but last year we found them
helpful.
Teachers reported that they were able to use the data to adjust their instruction or pacing.
One Wave 2 science teacher explained:
The data is sent to teachers in hard copy via individual coaches, item by item for
each student in the entire class. I think it’s pretty useful—color coded. I can see
what concepts I should go back and reteach.
Likewise, at another school, a science teacher said she looked at the scores for her students, for
the school, and for all of the IDS schools. She said the data indicated to teachers how they could
modify their instruction, such as what topics needed to be stressed more and what strategies
teachers needed to improve. Similarly, at still another school, mathematics teachers used the
examination data at the end of the previous year to determine how to teach different concepts in
the current school year.
Although the use of formative assessments improved, concerns remained about
excessive lag time in receiving assessment results in a timely fashion, which reduced their utility for teachers.
Some teachers expressed frustration with the timeliness of receiving formative assessment
data, noting that their use of the data was limited because it took too long to receive. A Wave 3
mathematics teacher reported:
We won’t have time to get the grades back in time for the first quarter report card
grades—frustrating because that’s the assessment of the quarter and should be
included in the [report card] grades. We are getting around that by manually
grading the tests to get the grades in on time, which kind of defeats the purpose
of having the warehouse.
At the time of our school visits in the fall, six of the eight schools we visited reported not having
received summative assessments from the previous spring. The other two schools did not

8
indicate whether they had received summative data in a timely fashion. One English teacher told
us:!
Data is not readily available. IDS will say it got sent to the principal, but the
principal doesn’t have it, and maybe we’ll see it a few months later. It’s not very
efficient.
Although many teachers adjusted to IDS curriculum, pace, and assessments, in at
least four schools, concern remained that the tests were too difficult for students.
Teachers in Waves 1 and 2 reported that the tests were too difficult for their students. A
Wave 1 mathematics teacher said:
I don’t think it matches their skill level very well. I think the assessment tool
could be better. I think the kids feel somewhat defeated when they take it. [It]
hurts their feelings that they don't do better on the assessments. It's one thing to
challenge someone and another to frustrate him/her.
Professional Development
Teachers we interviewed in Wave 1 and 2 schools were generally positive about
professional development, whereas teachers in Wave 3 schools were less positive. Teachers in all
waves reported that the IDS providers tried to be receptive to their needs, although some of their
attempts met with mixed success. They described specific ways in which the professional
development was geared toward supporting and improving instruction.
Teacher reports of IDS professional development were mixed. Among teachers in
Wave 1 and Wave 2 schools, 65% were generally positive, compared with only 47% of teachers in Wave 3 schools. Teachers who were positive reported that providers
had been flexible and responsive to changing needs, both in logistics and content,
and that the professional development helped them change their instruction. Others, however, felt that the professional development did not meet their needs.
Teachers in Wave 1 and Wave 2 schools were generally appreciative of the IDS-provided
professional development, with 44 of 68 (65%) teachers generally positive and an additional 11
(16%) reporting a mixed experience (e.g., the teacher liked the summer institute but not the fall
workshops) or a neutral experience (e.g., “it was ok” or “it was sort of helpful”). That was not
the case in Wave 3 schools, where only 10 teachers (23%) expressed positive opinions about the
value of the professional development. The remaining teachers were either negative (39%) or
expressed mixed opinions (39%). Exhibit 6 displays the degree of teacher support for the
professional development by wave.!

9
Exhibit 6 Teacher Perceptions of Professional Development, by Wave
Teachers who spoke most positively about their professional development reported that the
IDS providers were responsive to their needs. For example, a Wave 3 mathematics teacher
described how a summer professional development session was improved as a result of teacher
feedback. Science teachers in a Wave 1 school commented that in response to feedback, their
IDS provider no longer had all science teachers in the same building meet on the same day,
which have been disruptive for the school. Instead, professional development was now
conducted by science subject area. In addition, teachers reported that some IDS providers held an
abbreviated summer professional development session in late August to meet the needs of
schools with late hires. Although comments about flexibility were generally positive, a minority
of teachers noted that the changes were not desirable.
In addition to appreciating the flexibility of the IDS providers, teachers described a number
of ways in which professional development had provided support in changing instruction,
including modeling lessons, providing strategies, and affording time for working together. As
one Wave 1 science teacher described:
During the professional development, teachers get help with lesson and activity
plans, classroom management, review guides, and test banks.
In contrast, a minority of teachers reported that professional development had not been
helpful. Some teachers complained that it was repetitive. For example, one Wave 1 mathematics
teacher reported that he heard exactly the same presentation on special education three or four
times. Other teachers complained that the professional development was geared toward novice

10
teachers or those with less knowledge. For example, a Wave 2 English teacher commented that
the professional development was most beneficial for “rookies.” This teacher went on to say:
If there’s anything that IDS does right, at least it gets in the ear of the new
teacher.
Other teachers reported that the professional development did not meet their needs. A Wave 3
mathematics teacher said:
When you start the year it has to be much more practical… I need to know how
to make this work. We felt it was a waste of time. And we were out of the
classroom.
Coaching
IDS coaches worked one-on-one with teachers and with subject-matter teams to help
teachers learn the curriculum, implement the instructional strategies, and reflect on data.
Teachers in Waves 1 and 2 were generally satisfied with the coaching they received;
teachers in Wave 3, in general, were less satisfied.
About three-quarters of the teachers in Wave 1 and Wave 2 schools were satisfied with the
quality of support they received from their coaches. As displayed in Exhibit 7, 51 of 68 Wave 1
and 2 teachers interviewed (75%) reported they were helped by their coaches, with an additional
6 teachers (9%) providing mixed or neutral responses. Only 10 teachers in the Wave 1 and 2
schools (16%) had generally negative comments about coaching.
As was the case with professional development, Wave 3 teachers were much less positive.
Only 17 of 44 (39%) made generally positive comments about their coaches, whereas 18 (41%)
were generally negative. The others made mixed or neutral comments. It is important to note that
the level of satisfaction varied depending on whether the schools had volunteered (more positive)
or had been forced into participating (less positive).

11
Exhibit 7 Teacher Perception of Coaching, by Wave
Coaches supported teachers in making data-driven decisions about instruction, ensuring teachers stayed on pace, and supporting instructional improvements. A
minority of teachers, however, reported that their coaches had not been helpful in
developing their practice.
Teachers we interviewed in all eight of the Wave 1 and Wave 2 schools reported that their
coaches had been instrumental in helping them understand and use data to guide their instruction.
As noted in the assessment section, the usefulness of data about student performance is related
not only to the timeliness of receiving the results, but also to the ease with which teachers and
leaders are able to interpret the data. Coaches worked with teachers to help them learn this skill.
For example, one teacher reported that her coach came to meetings once a week and helped
teachers interpret data from tests and plan instruction accordingly. Another teacher indicated
that:
The coach has a detailed analysis of how many kids meet the standards, exceed
them, or are below them. They also go over the percentage of questions students
got right and which questions they need to work on.
In addition to supporting data use, teachers also reported that coaches played a role in
ensuring that they stayed on pace by talking to them about pacing and helping to make sure they
were planning with that in mind. As one Wave 1 science teacher indicated:

12
The coach talks with us about how we can each stay on course in terms of the
curriculum.
A clear majority of teachers in our sample reported that their coaches played a useful role
in improving instruction. Those teachers who reported a generally positive feeling toward their
coaches provided examples of the ways in which their coaches were involved in supporting
teacher practice. One Wave 2 English teacher reported:
[The] coach came in and helped and then gave suggestions afterwards. She’s
really present as a coach.
Some teachers reported that the coach was very involved. For example, one Wave 3 English
teacher reported that her coach helped her with planning and had even co-taught a few reading
classes.
Not all teacher reports of their coaches were positive, however. Across the sample of
teachers, a minority of teachers reported that their coaches had not helped them modify the
curriculum or improve their instruction. Some teachers reported that their coaches did not know
the curriculum very well or the particular needs of the student population. As one Wave 2
mathematics teacher reported:
A lot of our coaches either haven’t used [the specific curriculum] or haven’t been
in a Chicago public school room…. [They are] not very understanding of the fact
that we are in Chicago public schools.
Another Wave 3 mathematics teacher said, “I feel like our coach has never taught using the
curriculum.”
Teachers also lamented the lack of specialized coaching for special education teachers. One
Wave 1 science teacher said:
There was supposed to be a special needs coordinator through the IDS, but I have
not seen such a person.
Another Wave 2 mathematics teacher said:
It would be nice to have a special ed coach from [our IDS provider]. Basically our
coaches have all been regular ed teachers.
Coaches successfully supported lead teachers in becoming instructional leaders in
their schools.
The coaches were also instrumental in training and supporting lead teachers in developing
their instructional leadership skills. A majority of lead teachers in our sample serve as “materials
clerks,” and have some responsibility for such things as maintenance of the laptop carts.
However, as their knowledge and skills developed as a result of working with the coaches, so too
did their responsibilities. In at least 7 of the 8 Wave 1 and Wave 2 schools in our sample, lead
teachers talked about their responsibility for instructional meetings and described how other
teachers in their departments were turning to them for advice and instructional support. As one
Wave 1 English teacher described:
For my [the lead teacher] meetings we usually go over concerns about the
curriculum, best lesson sharing, things that worked well, and then we work on
lesson plans for the future.

13
Another Wave 1 science teacher likewise reported:
It has been a positive experience for all of us… I had been trying as department
chair to accomplish this, but hadn’t gotten very far. Now we discuss student
assignments, test scores, planning-together. Even if we’re eating lunch, we’re
planning.
The idea of the lead teacher taking on some of the coaching roles was corroborated by
other nonlead teachers we interviewed. For example, a Wave 1 English teacher said:
[The lead teacher]’s very helpful. She’s taught in all 3 [IDS] years. She got me
some information from the summer PD [professional development], sat with me.
She shared old lesson plans with me, things like that. She said ‘this worked for
me, didn’t work for me.’ It was very, very helpful.
Summary of IDS Implementation
In sum, IDS implementation was generally positive, with the variability that could be
expected among 43 urban schools. The majority of teachers favored the IDS curriculum and
materials, and reported that IDS created coherence and collaboration among teachers. Formative
assessments improved over time, and teachers began to use them to guide instruction, although
assessment results were not consistently provided in a timely manner, and teachers questioned
whether they were at the appropriate level for the students. Teachers’ perceptions about
professional development and coaching were mixed, with some teachers reporting that they were
instrumental in changing instructional practice, and others reporting that they did not meet their
needs and were not helpful in developing their practice.
IDS is premised on the theory that all of these supports will positively affect teachers’
instruction, ultimately improving student outcomes. Given the mixed reports about
implementation, the question arises: What does instruction look like in IDS schools. We turn to
observed instructional practices next.
Instruction in IDS Classrooms
As described in the method section, we visited 36 classrooms across 8 schools in Waves 1
and 2. We rated those classrooms on 24 elements of teaching, with ratings based on a 4-point
rating scale: unsatisfactory, basic, proficient, and distinguished. Not every teacher received a
rating for all elements; sometimes researchers did not have enough evidence to support a rating.
For example, a computer lab class would not provide enough evidence to assign a rating to the
teacher’s discussion and questioning techniques.
Fewer than half of the instructional observations rated teachers as proficient or
distinguished. Instruction levels varied both between and within schools.
We made a total of 742 ratings across the 36 classrooms in our sample. Overall, 12% of
ratings were unsatisfactory, 42% were basic, 43% were proficient, and 3% were distinguished
(see Exhibit 8).

14
Exhibit 8 Distribution of Ratings Across IDS Classrooms
Observation Rating Percent of Ratings
Unsatisfactory 12
Basic 42
Proficient 43
Distinguished 3
The percentages shown in Exhibit 7 summarize ratings across all teachers in our sample.
Within those overall ratings we found variation, both between and within schools. Exhibit 9
illustrates the between-school variation by placing schools in different categories based on
classroom ratings.
Exhibit 9
IDS Schools Categorized by Classroom Observation Ratings
Category
Mean Academic Achievement of
Incoming Freshmen*
Number of
Schools Rating
Low 1st quartile = 1 school
3rd
quartile = 1 school 2
More than 20% unsatisfactory and more than 70% unsatisfactory/basic
Low mixed 1
st quartile = 2 schools
3rd
quartile = 1 school 3
More than 20% unsatisfactory and less than 70% basic or more than 70%
unsatisfactory/basic
Mid range 1
st quartile = 1 school
2nd
quartile = 1 school 2
Less than 70% unsatisfactory/basic, less than 70% proficient/distinguished
High 4th quartile = 1 school 1 More than 70% proficient/distinguished
*Quartiles are based on average eighth grade ISAT scores of incoming freshmen. Achievement academies and alternative schools were removed before quartiles were assigned.
We see that the school in our sample with the highest achievement levels for incoming
students also received the highest ratings. That may lend some credence to those who say that
teaching and learning are based on the student body. However, we also noted variation in ratings
among teachers within schools, even in those schools with roughly the same incoming student
achievement levels. Although Exhibit 8 is based on differences in total ratings, those differences
could have been based on a random scattering of ratings across teachers. Indeed, many teachers
received a variety of ratings. However, we also noted that some teachers received consistently
high ratings. Of the 36 classrooms we visited, 7 were generally proficient and above, and
received no more than 1 “basic” rating across all 24 elements we rated. Those teachers were
spread across five schools in each of the categories listed above, including one school in the
“low” category. We observed three classrooms where teachers received “basic” or
“unsatisfactory” on all ratings. These classrooms were in the two schools in the low category.
The remaining 26 teachers received a mixture of ratings.

15
Most IDS teachers received ratings of “basic” on elements intended to measure
teacher expectations for students, student engagement, and academic demand.
We were particularly interested in elements that measure teacher expectations, student
engagement, and academic challenge, given that IDS focuses on these specific pieces of
instruction. The three elements we used to illustrate these constructs were (1) expectations for
learning and achievement, (2) activities and assignments, and (3) quality of questions. Exhibit 10
displays the distribution of teacher ratings for each of the three selected elements. The following
text box indicates how to interpret the stacked bar charts.
Exhibit 10
Summary of Observational Ratings
Interpreting Exhibit 10: Exhibit 10 illustrates the distribution of unsatisfactory, basic, proficient, and distinguished ratings across the 36 classrooms that we observed:
• Each vertical bar adds to 100%. The percentage of unsatisfactory ratings appears at the bottom of the bar. Reading from bottom up, basic is placed on top of unsatisfactory. On top of that is the percentage of teachers receiving proficient ratings. There were no distinguished ratings.
• The numbers in each section of the vertical bars represent the number of classrooms observed in which that
rating took place. If a rating was recorded for all classrooms, the numbers in the section total 36. In some cases, the researchers did not have enough information to make a rating. Therefore, the total number of observations (and thus, the denominator for calculating the percent of classrooms) is less than 36.

16
Expectations for Learning and Achievement
This element is part of a cluster of elements describing a culture for learning in which both
students and teachers take pride in their work and in which the teacher conveys that it is not
sufficient for students to follow procedures without understanding why the procedures are in
place. In such a culture, teachers do not simplify the curriculum. In contrast, basic and
unsatisfactory practice is typified by “low or modest expectations for student learning and
achievement” based on student activities and classroom interactions. In such classrooms,
students “get by” or “punch the time clock” as opposed to working hard (Danielson, 2007).
Expectations for student learning and achievement were generally low among IDS
teachers.
As Exhibit 10 shows, almost 70% of IDS teachers in the sample received a rating of basic
or unsatisfactory on this element. The following example from an observer’s field notes
describes an unsatisfactory rating for teacher expectations about learning and achievement. In
this example, the teacher allowed some students to sit idly and copy their work after the fact:
The teacher goes over the answers to the bellringer [the initial activity students
complete when they first enter the classroom] with her students. Students who
haven’t done their work yet write down all the answers as she goes over the
examples.
Other teachers received a rating of “proficient” on this element. Exhibit 10 shows that in
our sample, 11 of 35 teachers (31%) received such ratings. One observer of a Wave 2 English
class that received a proficient rating noted that:
The teacher modeled four different responses to poetry and students practiced
each response one at a time: (1) describing what comes to mind, (2) sketching an
image, (3) identifying key lines, and (4) making connections to other writing. The
class had a lengthy discussion about similarities between the poem and the book
the class is currently reading.
Activities and Assignments
Danielson believes that the activities and assignments that teachers choose are key to
advancing both academic demand and student engagement. According to her definition,
engagement is not the same as “time on task”; students also need to be cognitively engaged with
their activities. Ideally, “there is nothing mechanical about what students are asked to do”
(Danielson, 2007, p. 83).
A majority of IDS teachers received low ratings on measures of activities and assignments.
Exhibit 10 shows that the majority of classrooms (75%) were rated basic or unsatisfactory,
which Danielson defines as activities “inappropriate for student age and background,” and/or by
activities that few students participate in. An observer of a Wave 1 science class described a
classroom rated as basic on activities and assignments:
Students were supposed to do a project illustrating what they had been studying.
The suggestions for how to do this creatively included: letter, picture, cartoon,
essay, speech or public service announcement, play or story, song. What students

17
were doing was copying pieces of the text, or just coloring with markers. Students
on computers were just cutting and pasting from a single site.
In contrast, we observed nine classrooms where demanding activities engaged students
cognitively. An observer of a Wave 1 mathematics class rated as “proficient” noted that:
It appeared most students were focused and making progress. I could see
computer screens changing and students consulting their notes or doing
computations on paper before going back to the screen. The pieces of
conversation I could hear between students were almost entirely about math
concepts—“How do you calculate the area?” “You subtract here.” “How can you
have length and width in a square?” There were only two boys that I saw who did
not appear to be fully focused on the work.
The Quality of Questions
We selected the quality of questions to illustrate academic demand because teacher skill in
this area is particularly valuable both for obtaining evidence of student understanding and for
exploring new concepts. Good questions tend to be divergent, phrased in a way to promote
thinking—not just as a “quiz” to test student knowledge. The Danielson Framework for Teaching
describes basic and unsatisfactory questions as those “posed in rapid succession, only some
invite a thoughtful response” or “with low cognitive challenge and single correct responses”
(Danielson, 2007, p.82).
Of all of the observation elements, quality of questions received the fewest
proficient ratings.
The quality of questions proved to be the element receiving the lowest ratings. An excerpt
from a Wave 1 English classroom observation that received an unsatisfactory rating regarding
this practice follows:
For most of the lesson, there was no opportunity for students to answer questions
because the teacher didn’t ask a lot of questions. When she did, she asked
exclusively one-word factual answer questions. A lot of the times she answered
the questions herself.
However, Exhibit 10 above shows that 7 of 31 teachers received a proficient rating for the
quality of questions element. Those 7 teachers were in 4 of the 8 schools. The teacher allowed
enough time for the questions to generate answers, and answers were characterized by thoughtful
student responses (Danielson, 2007). The following field notes illustrate a Wave 1 mathematics
teacher rated proficient on quality of questions:
The questions seemed to be leading to student understanding. Can she make a
triangle with these 3 pieces of linguini? Is it a triangle if 2 sides don’t meet? Why
can’t she make a triangle? So what do we know from this?
Summary of Instructional Practices
IDS, in part, was intended to support teachers in improving their instructional practices by
providing a rigorous curriculum and professional development and coaching support to
implement effective instructional practices. Actual instructional practices after at least 1 year of
IDS implementation, however, showed that instruction in IDS classrooms generally needed
improvement. Although observations in IDS schools found both strong and weak instruction,

18
ratings of unsatisfactory and basic predominated over proficient. Ratings of distinguished were
rare. Without stronger instruction, can IDS improve student outcomes? We turn to outcomes
next.
Early Outcomes of IDS Schools
The main goal of the IDS initiative is to raise student performance through rigorous
curriculum and effective instruction. In this section we look at four indicators of student
engagement and performance—attendance, course performance, GPA, and test score growth—to
explore the extent to which the goal of increased student outcomes had been achieved.
Attendance
One underlying assumption of the IDS strategy is that if students are engaged with their
courses they will come to class. That assumption may be flawed, however. As one Wave 2
principal said during our site visit:
Attendance is bigger than the curriculum. There are lots of things that keep kids
out of school…. Good curriculum helps, buts it’s not the end all be all. Kids come
with a lot of other baggage.
Regardless of whether curriculum is sufficient to combat absences, in many of the schools
we visited, teachers and principals reported that poor student attendance remains a significant
problem. One Wave 2 science teacher told us:
There is no doubt in my mind that that we would be so far ahead of where we are
but we end up having huge attendance issues. Kids aren't here for a full week at a
time. We have kids coming to school 3 days out of 5.
Data indicate the problem of student absenteeism has not been mitigated by the
implementation of IDS.
As Exhibit 11 below shows, students in IDS schools are absent more days than students in
CPS overall. The exhibit indicates the number of days non-truant3 freshmen were absent from
school in 2005-06 and 2007-08.4 Because the procedure for collecting attendance data changed
in 2006, data from 2005-06 cannot be compared with data from 2007-08. Instead, we compare
the average number of days freshmen attending IDS schools were absent with the number of
days freshmen attending all CPS high schools were absent within that year.
As Exhibit 11 shows, before IDS implementation, students in Waves 1 and 2 were absent
on average 2.9 and 2.4 more days per year than the CPS average. After implementation, absences
became comparatively worse—students in Wave 1 schools were absent on average 5.1 days
more than CPS students overall, a statistically significant difference, and students in Wave 2
schools were absent on average 2.2 days more than CPS students. Wave 3 students were absent
on average 3.1 days more than those in CPS before IDS was initiated; we do not know how they
will fare after the first year of implementation.
3 Non-truant students are those who accumulated fewer than 30 days of absence in a semester.
4 We do not have absence data for 2006–07, so it is not presented here.

19
Exhibit 11 Student Absences
Average Days Absent per Year, Nontruants 2005–06
Average Days Absent per Year, Nontruants 2007–08
CPS overall (88 schools)
14.4 (SD=5.9)
CPS overall (90 schools)
20.5 (SD=8.5)
Wave 1, before IDS implementation (14 schools)
17.3 (SD=14.3)
Wave 1, 2nd year of IDS implementation
(14 schools)
25.6 (SD=6.6)
Difference between Wave 1 and CPS
-2.9 (SD=5.7)
Difference between Wave 1 and CPS
-5.1* (SD=8.3)
Wave 2, before IDS implementation (8 schools)
16.8 (SD=7.2)
Wave 2, 1st year of IDS implementation (8 schools)
22.7 (SD=10.1)
Difference between Wave 2 and CPS
-2.4 (SD=6.0)
Difference between Wave 2 and CPS
-2.2 (SD=8.7)
Wave 3, before IDS implementation
(18 schools)
23.5 (SD=5.2)
Difference between Wave 3 and CPS
-3.0 (SD=8.1)
* = The difference is statistically significant (p < .05). Note: The minus sign on the differences means CPS schools overall had fewer days absent, on average, than IDS schools.
Individual school absentee rates highlight how large this problem is, and how average rates
mask the variability across schools. For Wave 1 IDS schools, school absences in 2007-08 (post
implementation) varied between 15 and 36 days a year for schools. For Wave 2 IDS schools,
school absences varied between 11 and 40 days a year.5
Course Performance
Another assumption underlying IDS is that if students are engaged with their courses, not
only will they attend class, they will also do more of the work. We used percent failures as an
indicator of whether the students engaged with the material and of the degree to which they
learned the content.
The percent of freshmen students failing core courses decreased slightly after the
implementation of IDS.
Exhibit 12 provides composite English, mathematics, and science course failures over time
for schools in the first three waves of IDS, with the boxes around the data points indicating years
in which the schools participated in IDS. We divided the number of Fs earned by freshmen in
English courses (including reading), mathematics courses, and mathematics courses (including
double period courses) by the number of English, mathematics, and science courses attempted.
5 Our computation included only students who were at the same school for both semesters; consequently, we may
be underreporting student absentee rates.

20
The CPS overall percent failure rate in these three courses is represented by the solid black line.
This rate fluctuated slightly, moving between 23% and 25% between 2003-04 and 2007-08.
As the data show, the percent of core course failures for all IDS schools is higher than the
percent of core course failures for CPS overall. The differences between Waves 1 and 2 and CPS
overall are not statistically significant either before or after IDS implementation; the differences
between Wave 3 and CPS overall are statistically significant in all years prior to
implementation—we do not yet know what they will be at the end of the first year. The percent
of failures in Wave 1 and Wave 2 schools has declined with IDS implementation. For example,
2006-07 to 2007-08, the percent of failures in core courses at Wave 1 schools decreased from
26% to 23%, while the percent of failures in Wave 2 schools decreased from 29% to 25%. In
both cases, this decrease narrowed the gap between IDS schools and CPS overall, although the
decrease in the size of the gap is not statistically significant. (See Appendix C for course failures
rates separately for English, mathematics, and science.)
These averages mask variability between individual schools. In 2007-08, the mean percent of
failures in core classes for Wave 1 schools was 23%, with a standard deviation of 0.08. That means that,
on average, about two-thirds of schools had freshman failure rates of between 15% and 31% in the three
core courses, with a range between 10% and 41%. There was a bigger difference among Wave 2
schools, where the mean was 25% failures in core courses, and the standard deviation was 12%. That
means that about two-thirds of Wave 2 schools had mean freshman failure rates between 13% and 37%,
with the high and low rates varying between 8% and 47%.

21
Exhibit 12 Percent Failures for Freshmen
in English, Mathematics, and Science Classes Over Time
GPA
The public typically views student grades as an indicator of learning with some skepticism,
believing grades depend too much on the quality of teacher-made assessments, the nature of
subjective teacher judgments, and nonuniformity across teachers’ grading policies. Nonetheless,
CCSR research has consistently found that freshman grade point averages predict on-time high
school graduation 80% of the time, whereas a combination of eighth-grade test scores and prior
risk factors correctly predicts graduation only 65% of the time (Allensworth & Easton, 2007).
Further, Roderick et al. (2006) found that increases in GPA are much more strongly related to
college attendance than increases in ACT scores. Other researchers have also consistently
reported that GPA is at least as predictive of college grades as college entrance examination
scores (ACT, 2008; Geiser & Santalieces, 2007; Noble & Sawyer, 2002).
Grade points averages have improved slightly with IDS participation, generally
mirroring performance in CPS overall.
As the data show, freshmen GPAs in English, mathematics, and science in Wave 1, 2, and
3 schools were lower than the freshmen GPAs for CPS overall. These differences were generally
not statistically significant. All IDS schools saw a slight increase in core GPA between 2006-07
and 2007-08. During this year, IDS Wave 2 schools narrowed the gap with CPS overall
significantly. In 2007-08, CPS freshmen overall had GPAs in the three core courses of about 1.8;

22
IDS Waves 1 and 2 had core GPAs of about 1.7. Wave 3 schools had a core GPA of about 1.6
prior to implementation. (See Appendix C for GPAs separately for English, mathematics, and
science.)
Again, these averages mask some variability between schools. Among Wave 1 schools in
2007, the second year of implementation, the average freshman GPA in the three core subjects of
mathematics, English, and science was 1.67, with a standard deviation of 0.28. This means that
the middle two-thirds of IDS Wave 1 schools had mean GPAs between 1.39 (not quite a D+) and
1.95 (not quite a C). The Wave 1 school with the lowest mean freshman GPA had a core GPA of
1.10; the highest mean GPA among Wave 1 schools was 2.08.
As with the percent failures, there was more variation in the average freshman core GPA
among Wave 2 schools. The average was 1.69, with a standard deviation of 0.37. The middle
two-thirds of schools ranged from 1.32 to 2.06; the schools with the highest and lowest mean
freshman GPAs in the three cores subtests had GPAs of 1.07 and 2.19, respectively.
Exhibit 13
Freshman GPAs in English, Mathematics, and Science Classes Over Time
Test Score Growth
Students in CPS take the EXPLORE test at the beginning of their freshman year and the
PLAN test at the beginning of their sophomore year. Determining growth based on these two
tests is somewhat complicated because of at least two problems. First, the amount of growth a

23
student is “expected” to make differs by subject and by the student’s initial EXPLORE score.
The text box below explains this issue in more detail. Second, “form effects” are possible.
Students do not take exactly the same PLAN test every year. Although test makers strive to
ensure comparability across test versions, doing so is not always possible, especially in all
student contexts. For example, replacing one reading passage with another requires more than
being sure the difficulty of the words in the two passages match; each new passage must also
have context clues for all readers equivalent to the passage it replaces.
Understanding the Relationship Between the EXPLORE and PLAN Tests
Intuitively, it seems like it should be possible to measure test score growth by finding the
difference in scores between tests taken at two different times. However, ACT, the creator of
EXPLORE and PLAN, has found empirically that students’ initial scores on EXPLORE are
related to how much they are expected to grow before taking PLAN. Furthermore, the
relationship between EXPLORE and PLAN is related to the subject matter being tested. That
relationship is complicated. For example, consider a student with an EXPLORE score of 12 on
each subtest. If such a student scored 14 on PLAN in all 4 areas—a gain of 2—that student
would be making “expected gains” in mathematics, English, and reading, but not in science. If a
student with an EXPLORE score of 15 in all subtests received a score of 17 on all PLAN
subtests—again a gain of 2—that student’s score would be 1 point higher than expected in
English and science, 2 points more than expected in mathematics, but would just meet
expectations in reading.
To account for the first problem, we developed a metric called “meets gains,” created by
subtracting a student’s expected gain from his actual gain. If a student attains his expected gain,
his “meets gains” score would be 0. Students whose gains are smaller than expected, given their
initial EXPLORE score and the subject area, would receive negative “meets” scores; students
whose actual gains are better than expected would receive positive “meets” scores.
To account for the second problem, we included the system average “meets gains” score as
a comparison point. We believe that form effects, if any, were reflected in IDS performance in
the same way they were reflected in overall CPS performance. We therefore considered whether
IDS schools were improving relative to CPS as well as whether they were improving over time.
In general we found no differences in test score growth between schools
implementing IDS and the rest of CPS.
On the composite EXPLORE to PLAN gains, CPS students moved from not meeting
expected gains in 2002-03 to almost meeting that expectation in 2003-04 and 2004-05.
Performance then declined through 2006-07, when, on average, students in CPS failed to meet
expected gains by about half a point. CPS overall then rebounded in 2007-08. Students in Wave
1 mirror this progression, although their average “meets gains” score is less than CPS overall. In
2006-07, the first year of the initiative, average “meets gains” scores decreased, although this
decrease paralleled the district’s. In 2007-08, “meets gains” scores increased, although again, this
increase roughly paralleled the district’s increase. Exhibit 14 presents composite “meets gains”
scores for all waves and for the system.

24
Exhibit 14 Composite Test Score Growth: Actual Gains Minus Expected Gains
As Exhibit 14 shows, in general IDS schools have “meets gains” scores that are lower than CPS
overall, although the difference is only statistically significant for Wave 1 schools in 2007-08. The graph
also shows that all IDS waves showed improvement in 2007-08 after generally declining performance
starting in 2004. CPS schools in general followed this same pattern, and the differences between CPS
and schools in Waves 1 and 2 did not change significantly. Wave 3 schools showed statistically stronger
improvement than CPS overall in this one-year period before they became part of the initiative.
In 2007-08, schools in Wave 1 had a “meets gains” score of -0.46, meaning that in the
average Wave 1 school, the average student had actual gains from EXPLORE to PLAN that were
about a half a point below expectations on the subject matter tests of English, mathematics,
science, and reading. The standard deviation was 0.27, so the middle two-thirds of schools
ranged between -0.73 and -0.19. There were two schools with the lowest average of -0.89. The
Wave 1 school with the highest average “meets gains” score had an average of 0.03, meaning
that the typical student in that school was meeting his or her expected gain. (See Appendix C for
“meets gains” scores separately for English, mathematics, science, and reading.)
The picture is similar for Wave 2 schools, which had a mean “meets gains” scores of -0.41 and a
standard deviation of 0.27. In the lowest performing Wave 2 school, the average difference between
actual and expected gains was -0.87; in the highest performing Wave 2 school this difference was -0.04.

25
Summary of Outcome Data
Overall, outcome data on IDS schools were mixed. On the one hand, student absenteeism
remained a problem. While there were some slight improvements in students’ GPAs, failures,
and the extent to which students met their expected test score gains, these changes were small
and generally mirrored changes throughout the system.
In sum, IDS has not yet not realized the student outcomes that it was hypothesized to
create. Perhaps its limitations were due to its less-than-perfect implementation and the weak
instruction still apparent in the schools. However, our research identified factors outside of the
IDS theory of action that affected its implementation and outcomes, suggesting that even perfect
implementation may not have been sufficient to deliver the intended outcomes. We discuss these
factors next.
Challenges to IDS Implementation
In this section, we identify barriers and challenges that may have limited the impact that
IDS had on instruction and on student outcomes. We list factors relating to students, to teachers,
and to the interaction between students and teachers. We also discuss the roles of the central
office, logistics, and of principals as emerging issues.
Student Background
IDS seeks to bring an academically challenging college-prep curriculum to middle and low
achieving high schools in CPS, but students’ incoming achievement levels and academic
behaviors have made meeting this goal a difficult challenge.
Many students were ill-prepared for the demanding IDS curricula because of the low
achievement levels with which they entered high school.
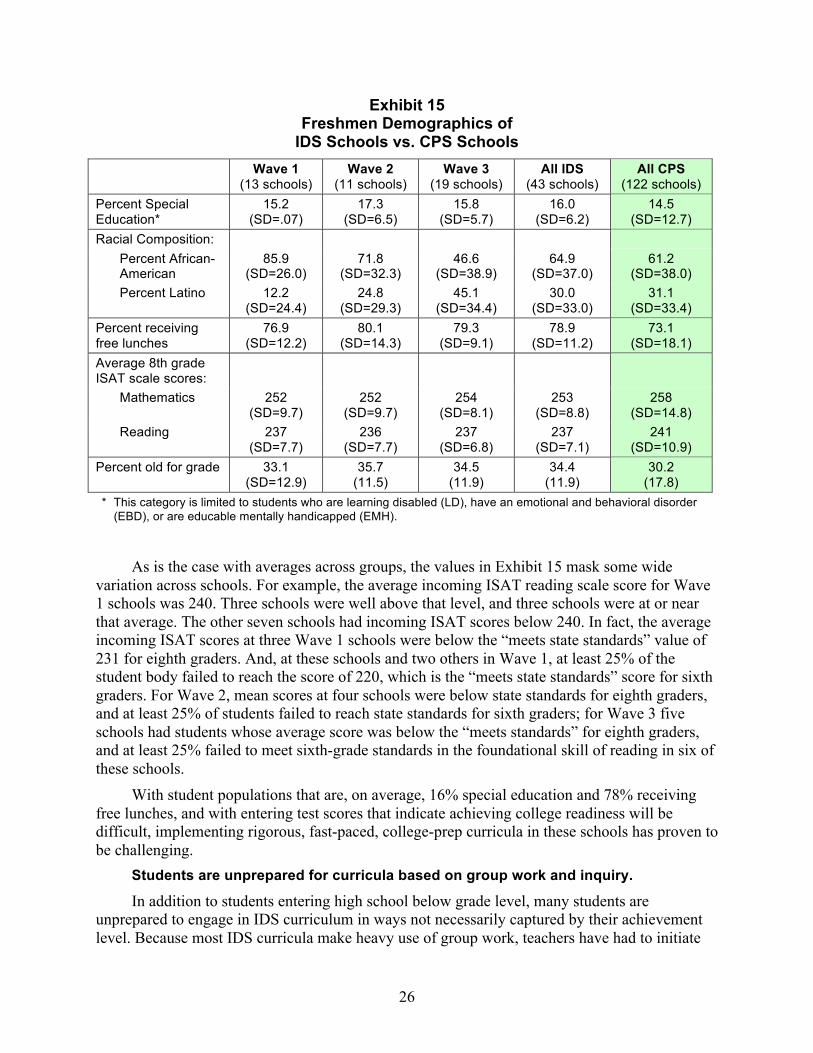
As Exhibit 15 shows, the IDS schools were fairly typical of CPS schools in terms of
achievement. They served similar proportions of special education students and students old for
their grade (an indication that students had been retained), and similar average test scores.
However, average district performance itself was quite low if the goal was college readiness.
Students with average incoming ISAT scores between 251 and 255 in mathematics and 235 and
240 in reading would be predicted to get only a 16 or 17 on the ACT—far short of the entrance
requirements for many of the state’s 4-year colleges. Furthermore, Wave 2 IDS schools had
higher percentage of special education students and much higher percentages of students who
were old for grade than did CPS overall, with nearly 4 in 10 students having been retained at
some point in their elementary school career. This is an important factor, given that research has
shown that students who are old for grade are more likely to drop out than other students (see for
example Allensworth, 2004).
26
Exhibit 15 Freshmen Demographics of
IDS Schools vs. CPS Schools
Wave 1 (13 schools)
Wave 2 (11 schools)
Wave 3 (19 schools)
All IDS (43 schools)
All CPS (122 schools)
Percent Special Education*
15.2 (SD=.07)
17.3 (SD=6.5)
15.8 (SD=5.7)
16.0 (SD=6.2)
14.5 (SD=12.7)
Racial Composition:
Percent African-American
85.9 (SD=26.0)
71.8 (SD=32.3)
46.6 (SD=38.9)
64.9 (SD=37.0)
61.2 (SD=38.0)
Percent Latino 12.2 (SD=24.4)
24.8 (SD=29.3)
45.1 (SD=34.4)
30.0 (SD=33.0)
31.1 (SD=33.4)
Percent receiving free lunches
76.9 (SD=12.2)
80.1 (SD=14.3)
79.3 (SD=9.1)
78.9 (SD=11.2)
73.1 (SD=18.1)
Average 8th grade ISAT scale scores:
Mathematics 252 (SD=9.7)
252 (SD=9.7)
254 (SD=8.1)
253 (SD=8.8)
258 (SD=14.8)
Reading 237 (SD=7.7)
236 (SD=7.7)
237 (SD=6.8)
237 (SD=7.1)
241 (SD=10.9)
Percent old for grade 33.1 (SD=12.9)
35.7 (11.5)
34.5 (11.9)
34.4 (11.9)
30.2 (17.8)
* This category is limited to students who are learning disabled (LD), have an emotional and behavioral disorder
(EBD), or are educable mentally handicapped (EMH).
As is the case with averages across groups, the values in Exhibit 15 mask some wide
variation across schools. For example, the average incoming ISAT reading scale score for Wave
1 schools was 240. Three schools were well above that level, and three schools were at or near
that average. The other seven schools had incoming ISAT scores below 240. In fact, the average
incoming ISAT scores at three Wave 1 schools were below the “meets state standards” value of
231 for eighth graders. And, at these schools and two others in Wave 1, at least 25% of the
student body failed to reach the score of 220, which is the “meets state standards” score for sixth
graders. For Wave 2, mean scores at four schools were below state standards for eighth graders,
and at least 25% of students failed to reach state standards for sixth graders; for Wave 3 five
schools had students whose average score was below the “meets standards” for eighth graders,
and at least 25% failed to meet sixth-grade standards in the foundational skill of reading in six of
these schools.
With student populations that are, on average, 16% special education and 78% receiving
free lunches, and with entering test scores that indicate achieving college readiness will be
difficult, implementing rigorous, fast-paced, college-prep curricula in these schools has proven to
be challenging.
Students are unprepared for curricula based on group work and inquiry.
In addition to students entering high school below grade level, many students are
unprepared to engage in IDS curriculum in ways not necessarily captured by their achievement
level. Because most IDS curricula make heavy use of group work, teachers have had to initiate

27
students into this valuable skill. An observer of a Wave 1 mathematics teacher noted the
following difficulty in getting students into groups:
The teacher announced that students will be working on more group work and
begins to divide the class into groups. The class banters about what group they get
to be in. The teacher asks that students all line up at the front board and count off
into groups. Students try to shuffle around in the line and they have to start the
count over. There is a lot of complaining and shuffling as the students are still
trying to move into groups of their choice.
Additionally, IDS curricula tend to focus on inquiry learning, an area with which both
students and teachers have little experience and that may require more support. A science teacher
described his students’ resistance:
In the beginning of the year I had a lot of resistance. It was a battle with the
students trying to convince them this is what needs to happen. The class and I
argued. They were winning. I’m not teaching anything; we’re just arguing over
how I should be teaching. At some point you have to ignore that and just keep
going. And what I found is they respond.
Student Absenteeism and Tardiness
Students can only learn when they are in school. When students are absent, they
automatically fall behind in the curriculum.
Attendance and tardiness created implementation problems for IDS curricula.
With the pacing set for the curriculum and little accommodation in the calendar of
scheduled work, teachers struggle with planning around student absence. Tardy students, too,
create problems for teachers trying to maintain the quick pace of the IDS curriculum. Tardy
students usually interrupt instruction and require adjustments for the instruction they have
missed. The attendance data provided earlier bear this out: students miss too many days, making
their learning and teachers’ lesson planning difficult.
Classroom Behavior
According to Danielson, a lack of student engagement may manifest itself in idle goofing
off and possibly as serious discipline problems. Improving pedagogy is difficult in classrooms
where behavior problems create a chaotic environment for learning.
Many IDS classrooms have behavior management problems, impeding teaching and
learning.
Part of creating a classroom environment for learning involves the manner in which
students are permitted to treat one another. Students in classrooms with behavior problems tend
to ignore one another or interact with “conflict, sarcasm, or put-downs” (Danielson, 2007, p. 66).
Teachers in classrooms with poor environments may ignore misbehavior or respond
inconsistently and thus achieve inconsistent results. In the worst cases, the response is “overly
repressive, or does not respect the student’s dignity” (Danielson, 2007, p. 74) In 60% of IDS
classroom observations, teachers were rated as basic or unsatisfactory on teacher response to

28
student misbehavior. For example, one observer noted the following about a chaotic mathematics
classroom:
The students have asked the teacher to go over an example on the board. One
student disrupts the class because people won’t sit with him to work. The teacher
ignores them. [The teacher] finally whistles for their attention and shouts,
“Enough!” The teacher goes around checking homework, but many people don’t
have anything done. They’re going to get 20 minutes to work on it. At one table
nobody has their work out. They don’t have the homework at all.
In addition to struggling with student behavior, 55% of observed teachers also were rated
as basic or below on the ways in which they managed the flow of activities in their classrooms.
For example, an observer in a Wave 2 science class noted the following:
The major loss of instructional time occurred at the beginning of the class period.
The teacher asked the class, “Do you all have your book? If you don’t have it, go
get it quickly now.” Half of the class left to go get it and three others said they left
it at home. Only about four students had books with them. In addition, the
transition from the individual activity to the quiz was not smooth. Most students
hadn’t finished the activity—directions about what to do in that case were not
clear.

29
Exhibit 16 Teacher Ratings for Classroom Management Skills
Although some IDS teachers managed their students and their classrooms proficiently, doing so
was not the norm. Regardless of the strength of the curriculum, learning does not occur if
students are not listening and are not participating in the learning activities, and if significant
time is lost because of teachers’ weak classroom management skills.
The Rapid Growth of IDS
Some implementation issues were directly related to the rapid growth in the number of IDS
schools and grade-levels served. When the initiative started, it had 14 schools, with only ninth
grade involved. In the second year, the initiative grew to include 14 schools with tenth graders,
and 25 schools with ninth graders, for a total of 39 school-grade combinations. Finally, in the
third year, the initiative consisted of 43 schools with ninth graders, 27 with tenth graders, and 16
with eleventh graders, for a total of 139 school-grade combinations.
The rapid scale-up of IDS without an increase in central office staff has created
challenges related to communication between the district and IDS schools, the ordering of materials, and the maintenance of technology.
As the IDS initiative grew, communication between schools and the central office became
more difficult. As a result, providing logistical and trouble-shooting support for schools proved a
challenge. As one Wave 2 principal said:
[Wave] 1 and 2 schools were used to having services and calling people who
could make things happen… I’m not even sure who to call over there right now.

30
Likewise, as IDS providers became responsible for more and more schools, schools reported that
communications with the providers had become more difficult. A Wave 1 mathematics teacher
reported challenges communicating with IDS. This teacher said he wished they were easier to
contact and provided straight answers. He feels that sometimes when he has issues he gets
bounced around from person to person.
Just as communication became more challenging with the expansion of IDS, so did the
ordering and delivery of materials. Expansion of the IDS program to more schools was not
coupled with increases in central office staff, which was stretched far too thin. Widespread
logistical issues with materials resulted in year 3, with materials often late in arriving at a school,
insufficient, or inappropriate. One Wave 3 principal said:
There was a lot of confusion. When they outsourced, they didn’t get our timing or
understand our needs. There was miscommunication on that level. But at the end
of the day, that hurt our students.
In addition to problems with timing, the lack of personnel to attend to details created
substantial mishaps. A Wave 3 science teacher reported:
I wish they would have asked what we needed. We received four new
refrigerators and we really only needed one. We could have used the credit for
something else.
Furthermore, ongoing problems with technology maintenance and school infrastructure in
at least seven of the schools in our sample had not been solved. In one school, for example,
teachers had trouble implementing the technical side of the curriculum because the computers
were often down and there was no lab technician. Another school reported that its basic
infrastructure problems adversely affected teachers’ ability to implement the IDS curriculum. A
Wave 2 science teacher reported:
IDS comes in with wonderful materials, but there’s no storage and no basics. We
had to buy bookshelves. Running water-—I’m waiting for that to be turned on in
my classroom.
The Principal’s Role
In interviews in spring 2008, CPS administrators discussed the importance of principals as
instructional leaders. One Wave 1 lead teacher, for example, said:
The only way to improve schools is to improve student achievement, and the only
way to do that is to improve instruction. Instructional improvement happens at the
school level and principals lead instructional improvement, and the rest of us are
here to support principals and differentiate that support based on performance and
need… I do think the expectations of principals, through the IDS,… [are] that
they are leaders of instructional change.
Yet, aspects of IDS interfered with the principals as instruction leader, and principals received no
training and had little communication with the central office about IDS.6
The role of the principal in IDS implementation was not clear. Further, IDS coaches
occasionally interfered with the principal’s role as instructional leader.
6 Between the time of data collection and publishing this report, IDS representatives, coaches, principals, and lead
teachers have begun meeting regularly.

31
The very design of IDS providers and the coaches’ role may have served unintentionally to
diminish the principals’ instructional leadership role in their schools. Because coaches were
intended to support teachers, coach-teacher trust was a necessity. The coach’s role, therefore,
was explicitly nonevaluative. Overall, this relationship worked well for creating a sense among
teachers that coaches were there only to support their teaching practice. However, the coach-
principal relationship was never well-defined. Coaches expressed concern that principals were
trying to draw them into a more evaluative role, whereas principals expressed frustration that
coaches were interested only in teachers’ ability to deliver their curriculum and not in the overall
success of the school. One Wave 1 principal said:
I just feel that there needs to be much more frequent communication, dialogue
about all of these issues of what's going on in the classrooms… Coaches are only
interested in the fidelity of implementation and there's got to be more to it… We
have to bring all three pieces together—the teachers, the coach, and the
administration.
Further, given the provision of curriculum and professional development by outside “experts,”
questions arose about lines of authority between school-based instructional leaders and the
external providers. One Wave 3 principal reported:
We have had a few discussions with the coaches or IDS leads because our
philosophies are different. I have had to make it clear—I had a very long meeting
with the [IDS] in which I had to put them in their place because they were
presenting themselves as the experts. Even in meetings I have had to go in and
make sure coaches understand their role.
Finally, accountability for IDS success is unclear to school personnel and especially to
principals. Although schools are the curriculum providers’ consumers, the district is the
providers’ client and the one to whom they are accountable. In fall 2008, schools perceived that a
clear conduit was lacking to inform the central office of their satisfaction or concerns with
providers and coaches. A Wave 3 principal said:
No one appears to be holding the IDS’s accountable for the quality of coaching,
the quality of the curriculum, the effectiveness of the programs, organization such
as having the quarterly assessments available to the schools in times for the
teachers to make the necessary modification.
Principals received minimal support in implementing the initiative.
In addition to having an unclear role in IDS, of the 13 principals we interviewed, 10 said
they had little or no contact with central office, regardless of which wave they represented.7 The
general tone was similar to the comments of the following principal, who noted:
There has been no professional development this year for school leaders
associated with IDS.
Five of the eight principals from Waves 1 and 2 commented that they used to receive more
support. One said, “There used to be IDS meetings for principals, but they stopped.” Another
7 The other three principals did not have positive comments. One said (s)he needed to attend quarterly IDS teacher
meetings to “get the big picture another complained about district’s leadership support in general, and the third
had nothing good to say about IDS in general.

32
said he was supposed to get a coach under the old CPS leadership but did not. Instead, as one
principal described, “IDS staff at the district have sporadic contact, but are not actively
involved.”
Principals mentioned two types of support that they thought would be helpful. First, they
indicated they needed more help for long-range planning and budgeting. A Wave 3 principal
said:
We didn’t receive any support for planning for future funding for IDS, nor any
help in figuring out how to pay for it this year.
Wave 1 principals were especially concerned about funding for next year, although they said a
meeting had been planned.
Principals also reported wanting more support in understanding the curriculum. One
principal described going to selected monthly PD meetings with lead teachers “to build
relationships with the vendors.” Another Wave 2 principal wanted to be involved in curricular
meetings. She said:
I would like to have seen more professional development around what the
curriculum looks like, you know like some of the professional development
teachers were given: how to understand the curriculum better, and then how to
work with the teacher, course teams, on what they’re talking about in the
curriculum.
Lack of Evidence
The IDS curriculum—in fact, the entire IDS initiative—asks teachers to make a huge leap
of faith regarding its success.
Lack of evidence about the effectiveness of IDS negatively affected teacher and
principal buy-in to the initiative.
A number of principals and teachers, particularly those in Wave 3, told us that they had
never been provided with proof that IDS actually works. A Wave 3 principal said:
We asked pertinent questions—we wanted to see evidence that this magic bullet
they were selling… actually works. It’s just mastery learning—redundant.
They’re not fooling the old timers—just the new people downtown. These people
they have selected as vendors-coaches, 20-year olds telling our teachers what to
do.
In most cases, teachers were asked to guide students through curriculum when students
lacked mastery of the underlying skills needed to participate. Even though students were
underperforming in their previous curriculum, schools gambled on improving student
performance through using IDS; they did not know whether it would result in students falling
even farther behind than with current methods. As a Wave 2 English teacher said:
[IDS] was developed for diverse population of students, but our population falls
below grade level on almost every school. So it’s really difficult when your
materials are above and beyond eighth- and ninth-grade reading level and students
are well below.

33
Summary and Implications
IDS is an ambitious initiative that, at the end of data collection in fall 2008, had not yet
been able to transform instruction and student engagement to the degree necessary to make large-
scale improvements in student outcomes. Practitioners in the first 2 waves and in the Wave 3
schools that joined IDS voluntarily were generally positive about the curriculum and the support
they received, and having a common curriculum changed the way teachers planned and worked
together in positive ways. However, our classroom observers gave more “unsatisfactory” or
“basic” ratings than “proficient” or “distinguished” ratings. Student course performance was only
slightly improved, and test score gains were somewhat limited in scope. Here we indicate some
implications for these broad findings.
To help students succeed academically, schools must address the full spectrum of
student needs and curb absences and tardiness.
Many students enter IDS high schools with below-grade level academic skills, as measured
by their prior achievement. Such students need to reach grade level and simultaneously build
college readiness skills, tasks that require concentrated effort on their part and significant school
support. IDS focuses its support on teachers, which is necessary to change instructional practice
and increase academic challenge, expectations, and student engagement. The need for paying
additional attention to student academic and behavioral support may, however, be
overshadowing the programmatic changes IDS brings. Although the schools we visited offered a
wide array of student support (e.g., tutoring, after-school activities, other programs such as
AVID, on-track labs), that support was not integrated with the IDS instructional program.
Student attendance is another contextual factor that was not an explicit part of the initiative.
Many of the schools we visited were attempting to increase student attendance; for example, by
actively reaching out to parents or offering incentives to students. Judging from the data and
from the empty seats during our classroom observations, more needs to be done in this area.
Again, finding ways to actively engage underperforming students is a nationwide challenge.
Likewise, some of the schools we visited had school policies aimed at reducing the impact
of student tardiness on classrooms; for example, we heard about hall sweeps and holding
latecomers in detention until the next class period. In other schools we saw evidence that
teachers had developed techniques to admit latecomers without interrupting instructional
activities. But in our classroom observations we also saw how tardiness can have a negative
impact on students in the class and on the delivery of an instructional program.
The IDS initiative assumed that improving the curriculum would increase student
engagement, which would result in better attendance. However, engagement remains low and
attendance has not improved. Whether improving instruction can significantly affect attendance
remains an open question, and one that merits further study.
Teachers need support in basic classroom management strategies so that they can
implement the IDS curriculum.
We found that teachers in the sampled schools often did not have strong skills in
responding appropriately to student misbehavior and in managing transitions between classroom
activities. In a companion brief A Snapshot of High School Instruction in CPS, describing a
larger sample of teachers of whom IDS is a representative subset, we found that classroom
management appears to be necessary for strong instructional practice, but it is not sufficient.

34
Virtually none of the classrooms that were rated low in classroom management were rated highly
for instructional practice, while a large minority who rated high on classroom management still
rated low on instructional practice. Although teachers do need to be able to understand and teach
the curriculum, they also must be able to manage student behavior and materials, and make
efficient use of time as they transition from one activity to another.
Conclusion
The rhetoric surrounding the IDS initiative may have fallen into the trap of heralding this
reform as the “silver bullet” to improving student outcomes. Our research indicated that even
with all of the good work, careful planning, and extra effort that many have invested in this
initiative, it has produced only incremental change rather than transformation. It is still relatively
early in the process, with only Wave 1 schools experiencing all three grades of the IDS
curriculum. More time may show that the schools’ generally positive reactions to the initiative
translate into better instruction and improved student outcomes. More time will also provide
enough data points to perform a much better-defined counterfactual evaluation to determine if
the modest increases are in fact not so modest when compared with what might have occurred in
the absence of the initiative. At this point, however, it appears that some limitations apply both to
the underlying theory about the totality of what may be required to improve student outcomes in
urban classrooms and to the degree to which the initiative can be implemented successfully in
high school classrooms.

35
References
ACT, Inc (2008). The relative predictive validity of ACT scores and high school grades in
making college decisions. Iowa City IA: ACT.
Allensworth, E. A. and Easton, J. Q. (2007). What matters for staying on-track and graduating
from Chicago public high schools. Chicago: Consortium on Chicago School Research.
Allensworth, E. A. (2004). Ending social promotion: Dropout rates in Chicago after
implementation of the eighth grade promotion gate. Chicago: Consortium on Chicago School
Research.
Danielson, C. (2007). Enhancing professional practice: A framework for teaching. 2nd
ed.
Alexandria, VA: ASCD.
Geiser, S. & Santalieces, M. V. (2007). Validity of high school grades in predicting student
success beyond freshman year: High school record vs. standardized tests as indicators of
four-year college outcomes. Berkeley, CA: University of California, Center for Studies in
Higher Education Research.
Noble, J. & Sawyer, R. (2002). Predicting different levels of academic success in college using
high school grades and ACT composite Scores. Iowa City, IA: ACT.
Roderick, M., Nagaoka, J, and Allensworth, E.(2006) From high school to the future. Chicago:
Consortium on Chicago School Research.

36
Appendix A
Interview Protocols

37
Instructional Development System – Fall 2008 School Leader Protocol
I .I . SSCHOOL CHOOL CCONTEXTONTEXT A. Professional Background
1. How long have you been principal at this school?
2. How long have you been in the district and in what capacities?
I I .I I . PPARTICIPATION ARTICIPATION IIN N IDSIDS AND AND AASSOCISSOCIATED ATED SSUPPORTSUPPORTS A. Joining the initiative
1. Why is the school participating in the IDS program?
2. How was the decision made to participate? Who was involved in the decision-making?
3. What was the process for choosing each IDS provider (confirm IDS providers)? Who was
involved in making those decisions? What factors influenced your decisions?
B. District Support
1. What supports do you and your school receive from the central office?
a. Who at the central office do you talk with most regularly? What do you discuss?
2. Do you participate in any leadership development? (Probe on IDS principal training, AIO
support)
a. How often and what is the content?
b. Is this different than before IDS?
c. Has leadership PD been helpful? In what ways could it be improved? (listen for
comments regarding the role of the AIO and AIO coaches)
d. Has your practice changed as a result of this interaction? How? (be specific)
3. What fiscal support does the district provide? Does the district provide budgeting
guidance?
a. Does the district provide guidance on long-term planning to fund IDS?
4. What data does the district provide? (Probe on IDS assessments.)
a. How readily available are the IDS assessments (probe for whether they use the
online tools)? Other data?
b. How are data used at this campus, and by whom? (get examples of each)
1. To make instructional decisions?
2. To make curricular decisions?
3. To make programmatic decisions?
4. To make decisions about professional development or student supports?
5. What data do you collect on teacher practice? How often are data collected (e.g. how
often is the principal in classrooms)? How is this information used?
6. Has the district upgraded any facilities for the IDSs (science labs, computer labs)?
7. What role did the district play in ordering and distributing materials?
a. Did materials arrive on time?
b. Are your school’s facilities sufficient to implement IDS?
c. Was this different than before IDS?

38
8. How is the school day structured?
a. Extended day/extended learning opportunities available?
b. Block scheduling?
I I I .I I I . TTEACHERS AND EACHERS AND SSTUDENTSTUDENTS
A. Human Capital Support
1. Tell me about the teachers in IDS classrooms.
a. What is the average years of experience for IDS teachers?
b. How were IDS teachers assigned or selected?
2. How has IDS been received among IDS teachers? Among non-IDS teachers?
3. What professional development is provided to your teachers through the IDS? (Probe on
PD workshops, coaching, and networking).
a. What proportion of IDS teachers participated in the IDS PD?
b. Describe the role of the IDS coaches.
c. How well are they supporting teachers? How do you know?
d. Have you seen change in instructional practice as a result of professional
development? Can you share an example?
4. How are IDS training and meeting times facilitated? (Release time, substitute teachers,
common planning time, team meetings)
5. What is the role of lead teachers? How were lead teachers selected? What support do they
receive? What support do they provide other teachers?
6. How have special education teachers been integrated into the IDS?
7. What other PD is available to your teachers? Is it congruent with the IDS professional
development?
B. Curriculum and Pedagogy
1. To what degree are the IDS curricula different from the ones you used before?
2. What instructional resources are available to students and teachers? Are these new since
IDS?
3. What pedagogical approaches are teachers using? Have you noticed any change in
teachers’ instructional practice since beginning IDS? Can you share an example of
changed instructional practice?
4. Is IDS meeting the academic needs of all students (students with IEPs, English language
learners, students needing remedial assistance, academically advanced students)?
5. Do you feel that the IDS curriculum is an improvement? Why or why not? Are teachers
supportive?
C. Student Support and Development
1. Has your school identified specific goals for students?
2. What strategies are in place in this school to meet those goals? What are the strategies
for encouraging:
a. Attendance
b. Engagement
c. Achievement
d. College

39
3. What student support programs are available at this school (career academy, JROTC,
SLCs, AVID)? How does the school support students’ transition to 9th
grade (Freshman
Academy, On-track labs, Freshman Connection)? How, if at all, do these relate to IDS?
4. How was the beginning of the year for 9th
graders? Were most students enrolled before
the first day? Were school and classroom assignments ready at the beginning of the year?
5. Is safety an issue at this school? How does it impact your students? How does it impact
instruction?
D. Student Outcomes
1. What kind of student outcomes have you begun to see as a result of your participation in
IDS (or are expected for cohort 3 schools)?
2. Have there been any changes in:
a. Student engagement
b. Attendance
c. Achievement
3. How do you know?
IV.IV. CCLOSINGLOSING
A. Overall Impressions
1. In general, how has your participation in the IDS program impacted your school, either
positively or negatively?
2. Do you anticipate any changes to the program or its implementation?
3. What are the enablers and barriers to implementing IDS at the school level?
4. Are there any supports you wish you had, from either the district or IDS providers?
5. What suggestions do you have to improve any aspect of the IDS program?
6. Is there anything else about your school, staff, or students that you think we should
know?

40
Instructional Development System – Fall 2008 Teacher Protocol
I .I . BBACKGROUNDACKGROUND
A. Professional and Educational Background
1. How many years have you been teaching? In this district? In this school?
2. What subject(s) do you teach? What grade level? What was your teaching assignment
last year?
3. Do you have any leadership roles or special assignments (department chair, coordinator,
lead teacher)? What do you do in this capacity?
I I .I I . IDSIDS PPARTICIPATION ARTICIPATION
A. Program Selection
1. Were you involved in the decision to become an IDS school? Why is the school
participating in the IDS program?
2. What was the process for choosing each IDS provider? What role did you, or other
teachers, play? What factors influenced your decisions?
I I I .I I I . IDSIDS AND AND AASSOCIATED SSOCIATED SSUPPORTSUPPORTS
A. Human Capital Support
1. What professional development have you attended as part of the IDS? Was it required or
voluntary? How often?
2. What is the content of IDS professional development?
a. Content knowledge
b. Instructional practice
c. Curriculum
3. Do you network with IDS teachers in other schools? Where and how often?
4. Describe the role of the IDS coach. How often do you meet with the coach and what do
they do? What is the content of the coaching? How well are they supporting you?
5. Do you have team meetings or participate in common planning periods? If so, how often
and what is the content of these meetings?
6. What support do you receive from the lead teacher?
7. What other PD do you get? Is it congruent with the IDS professional development?
B. Operational Support
1. Do you have the facilities and materials you need for the IDS curriculum?
a. Are these facilities and/or materials new since IDS?
b. Did you receive your IDS materials on time?
2. What data do you receive about your students? (Probe for IDS assessments)
a. How readily available are IDS assessment data? Other data?

41
b. How do you currently use data?
1. To make instructional decisions?
2. To make curricular decisions?
3. To make programmatic decisions?
4. To make decisions about professional development or student supports?
9. How is the school day structured?
a. Extended day/extended learning opportunities available?
b. Block scheduling?
C. Curriculum and Pedagogy
1. What pedagogical approaches do you use? Have these changed since becoming an IDS
school?
2. Do the materials you’ve received through IDS support a change in instructional practice?
3. To what degree is the IDS curriculum different from the one you used before?
4. Is IDS meeting the academic needs of all students (students with IEPs, English language
learners, students needing remedial assistance, academically advanced students)?
5. Do you feel that the IDS curriculum is an improvement? Why or why not? Are other
teachers supportive?
D. Student Support and Development
1. Has your school identified specific goals for students?
2. What strategies do you have for meeting these goals? What are your strategies for
encouraging:
a. Attendance
b. Engagement
c. Achievement
d. College
3. What student support programs are available at this school (career academy, JROTC,
SLCs, AVID)? How does the school support students’ transition to 9th
grade (Freshman
Academy, On-track labs, Freshman Connection)? How, if at all, do these relate to IDS?
4. Is safety and issue at this school? How does it impact your students? How does it impact
instruction?
E. Student outcomes
1. What kind of student outcomes have you begun to see as a result of your participation in
IDS (or are expected for cohort 3 schools)?
2. Have there been any changes in:
a. Student engagement
b. Attendance
c. Achievement
3. How do you know?
IV.IV. CCLOSING LOSING
A. Overall Impressions
1. How has your participation in the IDS program impacted your school and classroom,
either positively or negatively?

42
2. What are the enablers and barriers to implementing IDS at the classroom level?
3. Is there any support you wish you had, from the district, IDS provider, or principal?
4. What suggestions do you have to improve any aspect of the IDS program?
5. Is there anything else about your school, staff, or students that you think we should
know?

43
Fall 2008 School Guidance Counselor
A. Professional Background
1. How long have you been a counselor at this school?
2. How long have you been in the district and in what capacities?
B. Student Support and Development
1. What are the goals and expectations for students in your school?
2. What strategies are in place in this school to meet those goals? What are the strategies
for encouraging:
a. Attendance
b. Engagement
c. Achievement
d. College
3. What student support programs are available at this school (career academy, JROTC,
SLCs, AVID)? How does the school support students’ transition to 9th
grade (Freshman
Academy, On-track labs, Freshman Connection)? How do these programs work together?
4. Is safety an issue at this school? How does it impact your students? How does it impact
instruction?
C. Student Outcomes
1. What kind of student outcomes have you begun to see as a result of your participation in
[insert initiative]?
2. Have there been any changes in:
a. Student engagement
b. Attendance
c. Achievement
3. How do you know?
D. Overall Impressions
1. In general, how has your participation in [insert initiative] impacted your school, either
positively or negatively?
2. Do you anticipate any changes to the program or its implementation?
3. What are the enablers and barriers to implementing [insert initiative] at the school level?
4. Are there any supports you wish you had?
5. What suggestions do you have to improve any aspect of [insert initiative]?
6. Is there anything else about your school, staff, or students that you think we should
know?

44
Appendix B
Additional Information on Observation Rubrics

45
Appendix B
Elements Selected for the Chicago Comprehensive High School Evaluation8
Domain 2: The Classroom Environment
Component 2a: Creating an Environment of Respect and Rapport. “In a respectful environment, all students feel valued and safe. They know they will be treated with dignity, which encourages them to take intellectual risks…. Characterized by friendliness and openness,…humor, but never by teachers forgetting their role as adults” (p. 64).
Unsatisfactory Basic Proficient Distinguished
Teacher
interaction with
students
Generic teacher
responses such as
“good,” “good
work,” applause go
here, not under
Feedback to
students
Teacher interaction
with at least some
students is negative,
demeaning, sarcastic,
or inappropriate to the
age or culture of the
students. Students
exhibit disrespect for
the teacher.
Teacher-student
interactions are
generally appropriate
but may reflect
occasional
inconsistencies,
favoritism, or
disregard for
students’ cultures.
Students exhibit only
minimal respect for
the teacher.
Teacher-student
interactions are
friendly and
demonstrate
general caring and
respect. Such
interactions are
appropriate to the
age and cultures of
the students.
Students exhibit
respect for the
teacher.
Teacher interactions
with students reflect
genuine respect and
caring for individuals
well as groups of
students. Students
appear to trust the
teacher with sensitive
information.
Rating: Evidence:
Student
interactions with
other students
Student interactions
are characterized by
conflict, sarcasm, or
put-downs.
Students do not
demonstrate
disrespect for one
another.
Student
interactions are
generally polite
and respectful.
Students demonstrate
genuine caring for
one another and
monitor one another’s
treatment of peers,
correcting classmates
respectfully when
needed.
Rating: Evidence:
8 Danielson, C. (2007). Enhancing professional practice: A framework for teaching. 2
nd ed. Alexandria, VA: ASCD.
Domain 2: The Classroom Environment
Component 2b: Establishing a Culture for Learning.
“Rather than an atmosphere of ‘getting by’ or ‘punching the time clock,’ both students and teachers take pride in their work and give it their best effort. In such classrooms, it is ‘cool’ to be smart, and good ideas are valued” (p. 67). “evidence of a culture for learning is found primarily in the classroom itself, …look of
the room…, the nature of the interactions, and the tone of the conversations” (p. 68).
Unsatisfactory Basic Proficient Distinguished
Importance of the
content
Can convey
importance through
explicit statements
about why they are
doing lesson,
connection to life or
next grade, etc.
Teacher or students
convey a negative
attitude toward the
content, suggesting
that is it not important
or has been mandated
by others.
Teacher
communicates
importance of the
work but with little
conviction and only
minimal apparent
buy-in by the
students.
Teacher conveys
genuine enthusiasm
for the content, and
students
demonstrate
consistent
commitment to its
value.
Students demonstrate
through their active
participation,
curiosity, and taking
initiative that they
value the importance
of the content.
Rating: Evidence:
Expectations for
learning
Instructional
outcomes, activities
Instructional
outcomes, activities
Instructional
outcomes, activities
Instructional
outcomes, activities

46
Domain 2: The Classroom Environment
Component 2c: Managing Classroom Procedures.
“In a well-managed classroom, procedures and transitions are seamless, and students assume responsibility for the classroom’s smooth operation. Instructional groups are engaged at all times, and students function well in those groups” (p. 70). “When [transitions are] skillfully done, the direction are clearly explained, students know what to do and where to go, and momentum is maintained. As a
consequence, little time is lost during the lesson” (p. 70). Unsatisfactory Basic Proficient Distinguished
Management of
transitions
Transitions are
chaotic, with much
time lost between
activities or lesson
segments.
Only some
transitions are
efficient, resulting
in some loss of
instructional time.
Transitions occur
smoothly, with
little loss of
instructional time.
Transitions are
seamless, with
students assuming
responsibility in
ensuring their
efficient operation.
Rating: Evidence:
Management of
materials and
supplies
Materials and supplies
are handled
inefficiently, resulting
in significant loss of
instructional time.
Routines for
handling materials
and supplies
function
moderately well,
but with some loss
in instructional
time.
Routines for
handling materials
and supplies occur
smoothly with little
loss of instructional
time.
Routines for handling
materials and supplies
are seamless, with
students assuming
some responsibility
for efficient
operation.
Rating: Evidence:

47
Domain 2: The Classroom Environment
Component 2d: Managing Student Behavior.
“A key to efficient and respectful management of student behavior lies in agreed-upon standards of conduct and clear consequences for overstepping the bounds” (p. 71). “Standards of conduct, however, must frequently be inferred, because in a smoothly running classroom, an observer may not witness explicit attn to those standards. Rather, student behavior indicates that a teacher has established
standards at the beginning of the year and has maintained them consistently” (p. 73). Unsatisfactory Basic Proficient Distinguished
Monitoring of
student behavior
Student behavior is
not monitored, and
teacher is unaware of
what the students are
doing.
Teacher is
generally aware of
student behavior
but may miss the
activities of some
students.
Teacher is alert to
student behavior at
all times.
Monitoring by teacher
is subtle and
preventive. Students
monitor their own and
their peers’ behavior,
correcting one
another respectfully.
Rating: Evidence:
Response to
student
misbehavior
Note “no student
misbehavior” and
leave rubric blank if
that’s the case.
Teacher does not
respond to
misbehavior, or the
response is
inconsistent, is overly
repressive, or does not
respect the student’s
dignity.
Teacher attempts to
respond to student
misbehavior but
with uneven
results, or there are
no major
infractions of the
rules.
Teacher response to
misbehavior is
appropriate and
successful and
respects the
student’s dignity,
or student behavior
is generally
appropriate.
Teacher response to
misbehavior is highly
effective and sensitive
to students’ individual
needs, or student
behavior is entirely
appropriate.
Rating: Evidence:
Domain 2: The Classroom Environment
Component 2e: Organizing Physical Space
Unsatisfactory Basic Proficient Distinguished
Safety and
accessibility
Safety here refers to
physical safety, not
verbal precautions.
Verbal precautions
goes under
“Directions and
Procedures” (3a).
Communicating
with Students
The classroom is
unsafe, or learning is
not accessible to some
students.
The classroom is
safe, and at least
essential learning is
accessible to most
students.
The classroom is
safe, and learning
is equally
accessible to all
students.
The classroom is
safe, and students
themselves ensure
that all learning is
equally accessible to
all students.
Rating: Evidence:
Arrangement of
furniture and use
of physical
resources
The furniture
arrangement hinders
the learning activities,
or the teacher makes
poor use of physical
resources.
Teacher uses
physical resources
adequately. The
furniture may be
adjusted for a
lesson, but with
limited
Teacher uses
physical resources
skillfully, and the
furniture
arrangement is a
resource for
learning activities.
Both teacher and
students use physical
resources easily and
skillfully, and
students adjust the
furniture to advance
their learning.

48
Domain 3: Instruction
Component 3a: Communicating with Students.
“The teacher should convey what the students will be learning, why it is important, and what the students will be doing to achieve the goals” (p. 77). “Skilled teachers select examples and metaphors that illuminate the new ideas or skills, connecting new content to students’ backgrounds, knowledge, and interests and to a school’s culture” (p. 78). “Watching the students’ reactions provides the best indication
of whether the goal has been achieved” (p. 79). Unsatisfactory Basic Proficient Distinguished
Expectations for
learning
Teacher’s purpose in a
lesson or unit is
unclear to students.
Teacher attempts to
explain the
instructional
purpose, with
limited success.
Teacher’s purpose
for the lesson or
unit is clear,
including where it
is situated within
broader learning.
Teacher makes the
purpose of the lesson
or unit clear, including
where it is situated
within broader
learning, linking that
purpose to student
interests.
Rating: Evidence:
Directions and
procedures
Teacher’s directions
and procedures are
confusing to students.
Teacher’s
directions and
procedures are
clarified after
initial student
confusion.
Teacher’s
directions and
procedures are
clear to students.
Teacher’s directions
and procedures are
clear to students and
anticipate possible
student
misunderstanding.
Rating: Evidence:

49
Domain 3: Instruction
Component 3a: Communicating with Students. (CONTINUED) Unsatisfactory Basic Proficient Distinguished
Explanations of
content
Teacher’s explanation
of the content is
unclear or confusing
or uses inappropriate
language.
Teacher’s
explanation of the
content is uneven;
some is done
skillfully, but other
portions are
difficult to follow.
Teacher’s
explanation of
content is
appropriate and
connects with
students’
knowledge and
experience.
Teacher’s explanation
of content is
imaginative and
connects with
students’ knowledge
and experience.
Students contribute to
explaining concepts
to their peers.
Rating: Evidence:
Use of oral and
written language
Teacher’s spoken
language is inaudible,
or written language is
illegible. Spoken or
written language
contains errors of
grammar or syntax.
Vocabulary may be
inappropriate, vague,
or used incorrectly,
leaving students
confused.
Teacher’s spoken
language is audible,
and written
language is legible.
Both are used
correctly and
conform to standard
English.
Vocabulary is
correct but limited
or is not appropriate
to the students’ ages
or backgrounds.
Teacher’s spoken
and written
language is clear
and correct and
conforms to
standard English.
Vocabulary is
appropriate to the
students’ ages and
interests.
Teacher’s spoken and
written language is
correct and conforms
to standard English. It
is also expressive,
with well-chosen
vocabulary that
enriches the lesson.
Teacher finds
opportunities to
extend students’
vocabulary.
Rating:
Evidence:
Domain 3: Instruction
Component 3b: Using Questioning and Discussion Techniques.
“Before teachers have acquired skill in questioning and discussion, they tend to pose primarily rapid-fire, short-answer, low-level questions to their students, using the questions as a Vehicle for students to demonstrate their knowledge…. Poor questions may be those that are boring, comprehensible to only a few students, or narrow—the teacher has a single answer in mind even when other options are possible. Good questions…tend to be divergent rather than convergent, framed in such a way that they invite
students to formulate hypotheses, make connections, or challenge previously held views” (p. 79). Unsatisfactory Basic Proficient Distinguished
Quality of
questions
Factual, recall,
procedural,
inferential, open
ended.
Factual and recall
questions might be
appropriate but not
for an entire class
period
Teacher’s questions
are virtually all of
poor quality, with low
cognitive challenge
and single correct
responses, and they
are asked in rapid
succession.
Teacher’s questions
are a combination
of low and high
quality, posed in
rapid succession.
Only some invite a
thoughtful
response.
Most of the
teacher’s questions
are of high quality.
Adequate time is
provided for
students to respond.
Teacher’s questions
are of uniformly high
quality, with adequate
time for students to
respond. Students
formulate many
questions.
Rating: Evidence:
Student
participation
A few students
dominate the
Teacher attempts to
engage all students
Teacher
Successfully
Students themselves
ensure that all voices

50
Domain 3: Instruction
Component 3c: Engaging Students in Learning.
“Student engagement is not the same as ‘busy’ or ‘time on task’.” (p. 83). … Simple participation is not sufficient. The activity should report new learning. What is required for student engagement is intellectual involvement with the content or active construction of understanding” (p. 83). “When students are actively engaged in learning, their activities and assignments challenge them to think broadly and deeply, to solve a problem, or otherwise engage in nonroutine thinking. There is nothing mechanical about what students are asked to do” (p. 83). “The type of instructional group should reflect what a
teacher is trying to accomplish and should serve that purpose” (p. 84). Unsatisfactory Basic Proficient Distinguished
Activities and
assignments
Activities and
assignments are
inappropriate for
students’ age or
background. Students
are not mentally
engaged in them.
Activities and
assignments are
appropriate to some
students and engage
them mentally, but
others are not
engaged.
Most activities and
assignments are
appropriate to
students, and
almost all students
are cognitively
engaged in
exploring content.
All students are
cognitively engaged
in the activities and
assignments in their
exploration of
content. Students
initiate or adapt
activities and projects
to enhance their
understanding.
Rating: Evidence:
Grouping of
students
Instructional groups
are inappropriate to
the students or to the
instructional
outcomes.
Instructional groups
are only partially
appropriate to the
students or only
moderately
successful in
advancing the
instructional
outcomes of the
lesson.
Instructional groups
are productive and
fully appropriate to
the students or to
the instructional
purposes of the
lesson.
Instructional groups
are productive and
fully appropriate to
the students or to the
instructional purposes
of the lesson.
Students take the
initiate to influence
the formation or
adjustment of
instructional groups.
Rating: Evidence: Evidence:
Domain 3: Instruction
Component 3c: Engaging Students in Learning (CONTINUED).
Unsatisfactory Basic Proficient Distinguished
Instructional
materials and
resources
Instructional materials
and resources are
unsuitable to the
instructional purposes
or do not engage
students mentally.
Instructional
materials and
resources are only
partially suitable to
the instructional
purposes, or
students are only
partially mentally
engaged with them.
Instructional
materials and
resources are
suitable to the
instructional
purposes and
engage students
mentally.
Instructional
materials and
resources are suitable
to the instructional
purposes and engage
students mentally.
Students initiate the
choice, adaptation, or
creation of material to
enhance their
learning.
Rating: Evidence:
Structure and
pacing
The lesson has no
clearly defined
structure, or the pace
The lesson has a
recognizable
structure, although
The lesson has a
clearly defined
structure around
The lesson’s structure
in highly coherent,
allowing for

51
Domain 3: Instruction
Component 3d: Using Assessment in Instruction.
“Experienced teachers,…, carefully watch and listen to students, who reveal their level of understanding through the questions to ask, the responses they give, their approaches to projects and assignments, and the work they produce” (p. 86). “The process of feedback individualizes instruction. Even when instructional goals and learning activities are common to an entire class, the experience of individual students is distinct; feedback ensures that each student knows the extent to which her performance meets the required standards…. It is essential that teachers provide feedback equitably, that all students receive feedback on their work…. To be effective, feedback should be accurate, constructive, substantive, specific, and timely. Global comments such as ‘very good’ do not qualify as feedback, nor
do comments to an entire class about the weaknesses of a few students” (p. 87).
Unsatisfactory Basic Proficient Distinguished
Monitoring of
student learning
Teacher does not
monitor student
learning in the
curriculum.
Teacher monitors
the progress of the
class as a whole but
elicits no diagnostic
information.
Teacher monitors
the progress of
groups of students
in the curriculum,
making limited use
of diagnostic
prompts to elicit
information.
Teacher actively and
systematically elicits
diagnostic
information from
individual students
regarding their
understanding and
monitors the progress
of individual students.
Rating: Evidence:
Feedback to
students
Teacher’s feedback to
students is of poor
quality and not
provided in a timely
manner.
Teacher’s feedback
to students in
uneven, and its
timeliness is
inconsistent.
Teacher’s feedback
to student is timely
and of consistently
high quality.
Teacher’s feedback to
students is timely and
of consistently high
quality, and students
make use of the
feedback in their
learning.
Rating: Evidence:
Domain 3: Instruction
Component 3e: Demonstrating Flexibility and Responsiveness.
“In general, flexibility and responsiveness are the mark of experience…. Teachers demonstrate lack of flexibility and responsiveness when they stick to a plan even when the plan is clearly not working, when they brush aside a student’s comment or question…. Or a teacher may stay with an approach even when
it is clearly inappropriate for some students (p. 90). Unsatisfactory Basic Proficient Distinguished
Response to
students
Teacher ignores or
brushes aside
students’ questions or
interests.
Teacher attempts to
accommodate
students’ questions
or interests,
although the pacing
of the lesson is
disrupted.
Teacher successfully
accommodates
students’ questions
or interests.
Teacher seizes a
major opportunity to
enhance learning
building on student
interests or a
spontaneous event.
Rating: Evidence:
Persistence
Only have
When a student has
difficulty learning, the
Teacher accepts
responsibility for
Teacher persists in
seeking approaches
Teacher persists in
seeking effective

52

53
Appendix C
Outcome Data for English, Mathematics, and Science

54
Course Performance
The percent failures in both Wave 1 and Wave 2 schools in English, mathematics, and
science decreased with IDS implementation, but at a rate similar to CPS overall (see Exhibits
C-1, C-2, and C-3). The percent failures in Wave 3 schools were also decreasing slightly prior to
implementation.
Exhibit C-1
Percent Failures for Freshmen in English

55
Exhibit C-2 Percent Failures for Freshmen in Mathematics
Exhibit C-3
Percent Failures for Freshmen in Science

56
GPA
Freshman unweighted GPAs improved slightly in Wave 1 and Wave 2 schools with IDS
implementation in all subjects (see Exhibits C-4, C-5, and C-6). Wave 1 improvement mirrored
that of the CPS overall. Wave 2 schools significantly narrowed the gap with CPS overall in
mathematics between 2006 and 2007 and showed a marginally significant improvement in
science compared to CPS between 2006 and 2007. GPAs in Wave 3 schools have been relatively
flat over time.
Exhibit C-4
Freshmen GPAs in English

57
Exhibit C-5 Freshmen GPAs in Mathematics
Exhibit C-6
Freshmen GPAs in Science

58
Test Score Growth
IDS schools have had lower actual gains relative to expected gains between EXPLORE and
PLAN over time. Wave 1 schools significantly reduced the gap with CPS overall in mathematics
during their first year of implementation; in fact, during that year, Wave 1 schools had slightly
better gains scores than CPS overall. However, the gap widened significantly between 2006 and
2007. Wave 2 schools improved relative to CPS overall in science during their first year of
implementation. Wave 3 schools significantly improved their actual gains relative to expected
gains scores in science and marginally improved their actual relative to expected gains in
mathematics compared to CPS overall in the year before they began IDS implementation.
Exhibit C-7 Test Score Growth in English: Actual Gains Minus Expected Gains

59
Exhibit C-8 Test Score Growth in Mathematics: Actual Gains Minus Expected Gains
Exhibit C-9
Test Score Growth in Science: Actual Gains Minus Expected Gains