Embed Size (px)
Citation preview

High-Resolution Solid-State 13C NMR Spectroscopy of the Paramagnetic
Metal-Organic Frameworks, STAM-1 and HKUST-1
Supporting Information
Daniel M. Dawson, Lauren E. Jamieson, M. Infas H. Mohideen, Alistair C. McKinlay,
Iain A. Smellie, Romain Cadou, Neil S. Keddie, Russell E. Morris and Sharon E. Ashbrook
S1. Synthesis and characterisation of 13C-labelled organic linkers
S2. Synthesis of Cu-based MOFs
S3. Packing of moisture-sensitive samples into NMR rotors
S4. Inversion recovery measurement of T1
S5. Solution-state and solid-state NMR spectra for tmbtc and H3btc
S6. Isotropic shifts, T1 and linewidths for 13C resonances of as-made STAM-1 (14.1 T)
S7. 1H NMR of CD3-STAM-1
S8. X-ray diffraction patterns of isotopically-enriched 13C(1,3,4,5)-STAM-1
S9. Extraction of isotopically-enriched mmbtc
S10. 13C NMR spectra of dehydrated 13C(2,6)-STAM-1
S11. 13C shifts and T1 relaxation constants at 9.4, 14.1 and 20.0 T
S12. References
Electronic Supplementary Material (ESI) for Physical Chemistry Chemical PhysicsThis journal is © The Owner Societies 2012

S1. Synthesis and characterisation of 13C-labelled organic linkers
1[13C],3,5-Trimethylbenzene
A mixture of 3,5-dimethylbromobenzene (6.84 g, 37 mmol) and THF (80 ml) was
cooled to –78 °C before n-BuLi (2.5 M in hexane, 14.8 mL) was added. The resulting aryl
lithium solution was stirred for 1 h before [13C]iodomethane (5.00 g; 35 mmol) was added.
The mixture was stirred for 2 h and then warmed to room temperature. THF and any
unreacted [13C]iodomethane were removed under vacuum, venting to a fume hood. The
crude product was washed with brine (100 mL) and extracted into DCM (2 × 30 mL). The
organic layer was dried over magnesium sulphate, filtered and concentrated in vacuo. The
crude product was purified by vacuum distillation and [1’-13C]1,3,5-Trimethylbenzene was
obtained as a clear oil (2.95 g, 70 %).
Solution-state NMR spectra are shown in Figure S1.1. 1H NMR (7.05 T, CDCl3) δ
(ppm): 6.96 (m, 1H CH), 2.43 (t+dt (2H+1H), 4JHH = 0.4 Hz, 1JHC = 126.1 Hz, CH3). 13C NMR
138.2 (d+d 2JCC = 43.9 Hz, 4JCC = 4.0 Hz, quat. C), 127.5 (d+d, 3JCC = 3.2 Hz, 5JCC = 0.9 Hz,
CH), 21.7 (s, CH3).
Figure S1.1: (a) 1H and (b) 13C NMR spectra of [1’-13C]1,3,5-Trimethylbenzene (7.05 T,
CDCl3). The 1H resonance arising from residual CHCl3 in the solvent is marked s.
Electronic Supplementary Material (ESI) for Physical Chemistry Chemical PhysicsThis journal is © The Owner Societies 2012
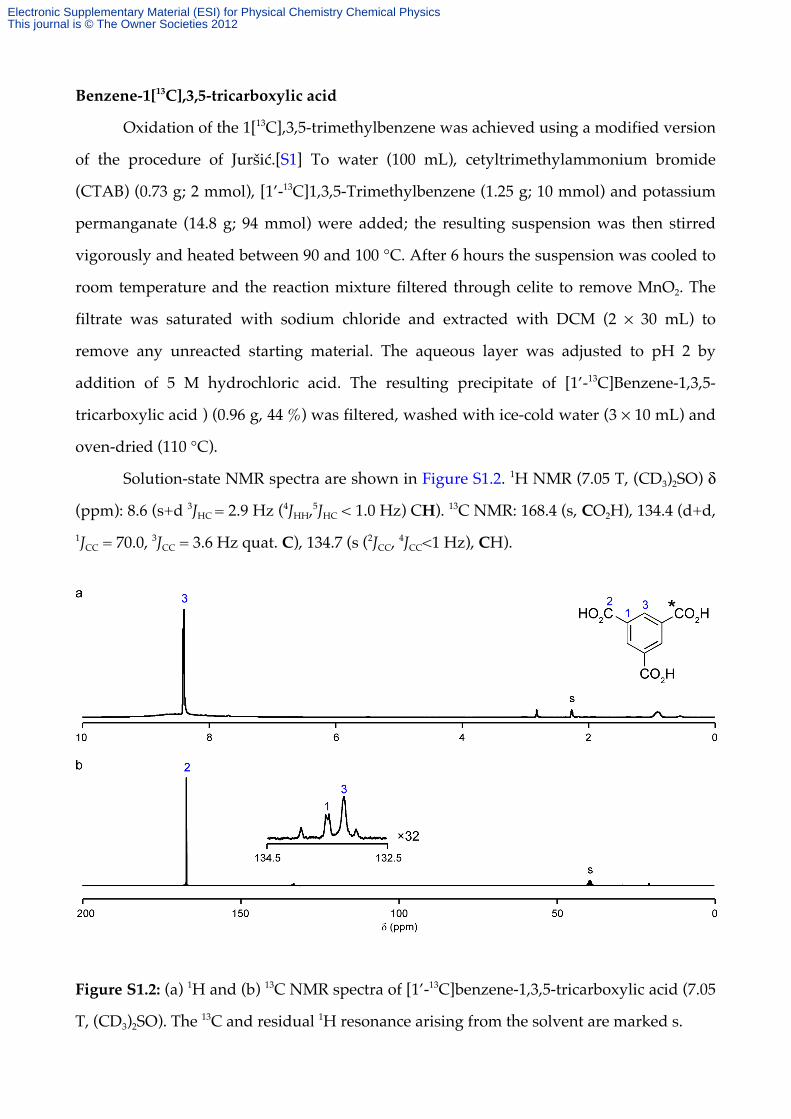
Benzene-1[13C],3,5-tricarboxylic acid
Oxidation of the 1[13C],3,5-trimethylbenzene was achieved using a modified version
of the procedure of Juršić.[S1] To water (100 mL), cetyltrimethylammonium bromide
(CTAB) (0.73 g; 2 mmol), [1’-13C]1,3,5-Trimethylbenzene (1.25 g; 10 mmol) and potassium
permanganate (14.8 g; 94 mmol) were added; the resulting suspension was then stirred
vigorously and heated between 90 and 100 °C. After 6 hours the suspension was cooled to
room temperature and the reaction mixture filtered through celite to remove MnO2. The
filtrate was saturated with sodium chloride and extracted with DCM (2 × 30 mL) to
remove any unreacted starting material. The aqueous layer was adjusted to pH 2 by
addition of 5 M hydrochloric acid. The resulting precipitate of [1’-13C]Benzene-1,3,5-
tricarboxylic acid ) (0.96 g, 44 %) was filtered, washed with ice-cold water (3 × 10 mL) and
oven-dried (110 °C).
Solution-state NMR spectra are shown in Figure S1.2. 1H NMR (7.05 T, (CD3)2SO) δ
(ppm): 8.6 (s+d 3JHC = 2.9 Hz (4JHH,5JHC < 1.0 Hz) CH). 13C NMR: 168.4 (s, CO2H), 134.4 (d+d, 1JCC = 70.0, 3JCC = 3.6 Hz quat. C), 134.7 (s (2JCC, 4JCC<1 Hz), CH).
Figure S1.2: (a) 1H and (b) 13C NMR spectra of [1’-13C]benzene-1,3,5-tricarboxylic acid (7.05
T, (CD3)2SO). The 13C and residual 1H resonance arising from the solvent are marked s.
Electronic Supplementary Material (ESI) for Physical Chemistry Chemical PhysicsThis journal is © The Owner Societies 2012

1,3,5-triethyl-[U-13C]benzene
AlCl3 (4.77 g, 35.8 mmol) was added to a three-necked flask equipped with a reflux
condenser and a dropping funnel. The condenser was fitted with a gas absorption trap
containing saturated aqueous NaHCO3. The flask was cooled to 0 °C and bromoethane
(4.70 mL, 62.5 mmol) was added dropwise over 10 min. A mixture of benzene (2.60 mL,
29.1 mmol) and [U-13C]benzene (420 µL, 4.70 mmol) was added dropwise over 15 min. The
mixture was stirred at 0 °C for 20 min. Bromoethane (3.10 mL, 42.2 mmol) was added
dropwise over 10 min and the mixture was warmed to RT and stirred for 12 h. The
mixture was poured carefully over ice (~50 g) and the aqueous layer extracted with Et2O (2
× 50 mL). The combined organic layers were washed with H2O (50 mL), 1 M NaOH (50
mL), dried over MgSO4, filtered and evaporated under reduced pressure. 1,3,5-Triethyl
benzene and 1,3,5-triethyl 13C6-benzene were obtained as a colourless liquid (5.35 g, 97%)
and used without further purification. From the integrals of the 1H NMR spectrum, some
unreacted bromoethane remained. This was removed during the work-up in the next stage
of the reaction sequence.
Solution-state NMR spectra are shown in Figure S1.3. 1H NMR (7.05 T, CDCl3) δ
(ppm): 6.92 (m 1H CH). 2.66 (q 2JHH = 7.6 Hz 3H CH2). 1.29 (q 2JHH = 7.6 Hz 4H CH3). 13C
NMR: 144.6 (td, 1JCC = 57.2 Hz, 4JCC = 7.5 Hz) quat. C), 125.2 (td, 1JCC = 57.2, 3JCC = 7.5 Hz
CH), 29.3 (s, CH2), 16.1 (s, CH3).
Electronic Supplementary Material (ESI) for Physical Chemistry Chemical PhysicsThis journal is © The Owner Societies 2012

Figure S1.3: (a) 1H and (b) 13C NMR spectra of 1,3,5-triethyl-[13C6]benzene (7.05 T, CDCl3).
The 13C and residual 1H resonance arising from the solvent are marked s.
[U-13C]benzene-1,3,5-tricarboxylic acid
A mixture of benzene-1,3,5-tricarboxylic acid and [13C6]benzene-1,3,5-tricarboxylic
acid was obtained following oxidation of a mixture of 1,3,5-triethylbenzene and 1,3,5-
triethyl-[U-13C]benzene by aqueous KMnO4 using a modified version of the procedure of
Juršić.[S1] A mixture of 1,3,5-triethyl benzene (711 mg, 4.38 mmol) and 1,3,5-triethyl 13C6-
benzene (115 mg, 0.683 mmol) was added to H2O (50 mL). CTAB (370 mg, 1.01 mmol) and
potassium permanganate (8.00 g, 50.6 mmol) were added and the mixture was heated to
95 °C for 6 h. The mixture was cooled to RT, filtered on celite and the filter cake was
washed with H2O. The filtrate was acidified to pH 2 with cold 5M HCl and filtered.
n‑Butanol (10% v/v) was added and the aqueous layer was evaporated under reduced
pressure. Benzene-1,3,5-tricarboxylic acid and 13C6-benzene-1,3,5-tricarboxylic acid were
obtained as a pale yellow solid (0.35 g, 32.4 %).
Solution-state NMR spectra are shown in Figure S1.4. 1H NMR (7.05 T, (CD3)2SO) δ
(ppm): 8.64 (s CH). 13C NMR: 165.8 (s CO2H), 125-135 (m+m CH and quat. C).
Electronic Supplementary Material (ESI) for Physical Chemistry Chemical PhysicsThis journal is © The Owner Societies 2012

Figure S1.4: (a) 1H and (b) 13C NMR spectra of [13C6]benzene-1,3,5-tricarboxylic acid (7.05
T, (CD3)2SO). The 13C and residual 1H resonance arising from the solvent are marked s, and
a series of resonances marked c appear to be batch-dependent contaminants in the DMSO
solvent.
It should be noted that there is a relatively large shift difference for the 13C
resonances of benzene-1,3,5-tricarboxylic acid. This appears to be a concentration-
dependent effect, as smaller masses of the labelled materials were used than for the
natural-abundance material (13C shifts of 166.2, 133.9 and 132.2 ppm). In addition, the
CO2H resonance was observed to have a very concentration-dependent shift, with values
between 8.5 and 13.1 ppm observed in this work. However, the successful synthesis of
both HKUST-1 and STAM-1 using benzene-1[13C],3,5-tricarboxylic acid and [U-13C]-
benzene-1,3,5-tricarboxylic acid confirms that the above reactions produced the expected
labelled benzene-1,3,5-tricarboxylic acids, despite small discrepancies in the solution-state
NMR spectra.
Electronic Supplementary Material (ESI) for Physical Chemistry Chemical PhysicsThis journal is © The Owner Societies 2012

S2. Synthesis of Cu-based MOFs
HKUST-1
The synthesis of HKUST-1 was scaled up from the previously published
procedure.[S2] Copper nitrate trihydrate, Cu(NO3)2.3(H2O), (15.752 g, 66 mmol) and
benzene-1,3,5-tricarboxylic acid (trimesic acid) (9.262 g, 44 mmol) were dissolved in an
H2O/ethanol solution (50:50) (264 ml), homogenised, sealed (600 ml autoclave) and heated
at 110 °C for 1 day before being filtered and washed with H2O and finally air-dried,
yielding 15.66 g of HKUST-1.
13C(2)-HKUST-1 was prepared on a smaller scale than that described above.
Cu(NO3)2.3(H2O) (0.752 g, 3.0 mmol), trimesic acid (0.210 g, 1.0 mmol) and benzene-
1[13C],3,5-tricarboxylic acid (0.210 g, 1.0 mmol) were dissolved in an H2O/ethanol solution
(50:50) (20 ml) and stirred for 15 min before being sealed in a Teflon-lined steel autoclave,
heated at 110 °C for 1 day, cooled to room temperature, filtered, washed with H2O and air-
dried, yielding 0.75 g of 13C(2)-HKUST-1.
13C(1,3)-HKUST-1 was prepared by dissolving Cu(NO3)2.3(H2O) (0.362 g, 1.5 mmol),
trimesic acid (0.118 g, 0.6 mmol) and [U-13C]benzene-1,3,5-tricarboxylic acid (0.092 g, 0.4
mmol) in 10 ml ethanol/H2O (50:50). This solution was stirred for 15 min before being
sealed in a Teflon-lined steel autoclave, heated at 110 °C for 1 day, cooled to room
temperature, filtered, washed with H2O and air-dried, yielding 0.62 g of 13C(1,3)-HKUST-1.
STAM-1
The synthesis of STAM-1 followed the published procedure.[S3] Cu(NO3)2.3(H2O)
(0.991 g, 4.1 mmol) and trimesic acid (0.862 g, 4.1 mmol) were mixed with 20 ml of
MeOH/H2O (50:50) in a Teflon-lined steel autoclave. The mixture was stirred for 15 min at
ambient temperature before heating at 110 °C for 7 days. The autoclave was cooled to
room temperature, and large blue crystals were isolated by suction filtration and dried in
air. CD3-STAM-1 was prepared as above, but with CD3OD in place of CH3OH.
Electronic Supplementary Material (ESI) for Physical Chemistry Chemical PhysicsThis journal is © The Owner Societies 2012

13C(2,6)-STAM-1 was prepared by a modified version of the above procedure.
Cu(NO3)2·3(H2O) (0.496 g, 2.0 mmol), trimesic acid (0.215 g, 1.0 mmol) and benzene-
1[13C],3,5-tricarboxylic acid (0.215 g, 1.0 mmol) was mixed with 10 ml of MeOH/H2O
(50:50) in a Teflon-lined steel autoclave. The mixture was stirred for 15 min at ambient
temperature before heating at 110 °C for 5 days. The autoclave was cooled to room
temperature, and blue crystals of 13C(2,6)-STAM-1 were isolated by Buchner filtration and
dried in air, yielding 0.59 g of 13C(2,6)-STAM-1.
13C(1,3,4,5)-STAM-1 was prepared by dissolving Cu(NO3)2·3(H2O) (0.496 g,
2.1 mmol), trimesic acid (0.243 g, 1.2 mmol) and [U-13C]benzene-1,3,5-tricarboxylic acid
(0.188 g, 0.9 mmol) in 10 ml MeOH/H2O (50:50) in a Teflon-lined steel autoclave. The
mixture was stirred for 15 min at ambient temperature before heating at 110 °C for 6 days.
The autoclave was cooled to room temperature, and blue crystals of 13C(1,3,4,5)-STAM-1
were isolated by Buchner filtration and dried in air, yielding 0.49 g 13C(1,3,4,5)-STAM-1.
Electronic Supplementary Material (ESI) for Physical Chemistry Chemical PhysicsThis journal is © The Owner Societies 2012

S3. Packing of moisture-sensitive samples into NMR rotors
For dehydrated samples, a freshly-prepared sample was used each time a rotor was
packed. Packing of samples was initially carried out under flowing argon, but samples
packed rapidly in ambient conditions did not hydrate appreciably during packing.
Hydration of samples was not observed once packed into rotors but, upon unpacking, the
dark blue samples were observed to turn bright blue very rapidly. Figure S3.1
demonstrates that a sample of dehydrated -HKUST-1 (deh-HKUST-1) was packed under
air, and rotated for 1.5 h without appreciable hydration. Therefore, all samples described
in the text as dehydrated can be assumed to remain dry for the duration of the NMR
experiments.
Figure S3.1 1H (14.1 T, 60 kHz MAS) NMR spectra of deh-HKUST-1 packed under air
immediately after packing (top) and after being subjected to MAS for 1.5 h (middle). For
comparison, the 1H MAS NMR spectrum of fully-hydrated HKUST-1 acquired under the
same conditions is shown (bottom). All observed chemical shifts agree with those
published in Ref. [S4].
Electronic Supplementary Material (ESI) for Physical Chemistry Chemical PhysicsThis journal is © The Owner Societies 2012

S4. Inversion recovery measurement of T1
T1 relaxation constants were measured using the modified version of the inversion
recovery experiment shown in Figure S4.1(a). The additional π pulse at the end of the
sequence was included in order to refocus any broad resonances, and τ was always one
rotor period (16.67 µs). The recovery duration, τrec, was varied as appropriate to the
peak(s) under consideration and pulses were always applied as close as possible to on-
resonance for each peak, in order to ensure complete inversion in all cases. The dataset
shown in Figure S4.1(b), for the resonance at δ = 850 ppm, in HKUST-1 shows the typical
level of noise in the spectra. Using the built-in relaxation analysis module in Topspin 2.1,
data were fitted to the function I! rec = I0 (1" 2Ae
"! recT1 ) , where A and I0 are fitted constants
with ideal values of 1, and I(τrec) is the magnetisation recovered after the duration, τrec. A
typical fit is shown in Figure S4.1(c), with error bars calculated by ΔI = N × n, where N is
the number of data points considered as “signal” and n is the mean absolute noise per
point in a region of the spectrum containing no signal (here, the region between 1000 and
1500 ppm was chosen).
Electronic Supplementary Material (ESI) for Physical Chemistry Chemical PhysicsThis journal is © The Owner Societies 2012

Figure S4.1 (a) Pulse sequence used in inversion recovery measurements. Flip angles are
indicated above pulses, τrec is the recovery duration and τ is the echo duration, set to be
equal to one rotor period (16.67 µs). (b) Experimental dataset used for measuring T1 of C1
(δ = 850 ppm) in as-made HKUST-1. Signal averaging was carried out for 81,920 transients
for each value of τrec, and each row of the dataset corresponds to a point on the graph in
part (c). (c) Plot of experimentally-measured Iτrec against τrec (black points) and curve of
best fit (red) with I0 = 0.8868, A = 0.9098 and T1 = 4.458 ms. The error bars were calculated
as described in the text.
Electronic Supplementary Material (ESI) for Physical Chemistry Chemical PhysicsThis journal is © The Owner Societies 2012
S5. Solution-state and solid-state NMR spectra for tmbtc and H3btc
Diamagnetic analogues to paramagnetic compounds have previously been used to
assist assignment of NMR spectra.[S5] In this work, synthesis of the diamagnetic
analogues to HKUST-1 and STAM-1 (i.e., the corresponding Zn-containing MOFs) was
unsuccessful, yielding instead a phase identified as the recently-reported Zn-BTC
MOF.[S6,S7] As an alternative, solution- and solid-state 13C NMR spectra of the simple
molecular analogues trimesic acid (for HKUST-1) and tmbtc (for STAM-1) were
considered. The C environments in these MOFs can, at least to some extent, be considered
analogous to those in the two molecular species considered (Scheme S5.1). The 13C
solution-state and CP MAS NMR spectra of these compounds are shown in Figure S5.1,
and are assigned as shown. In solution, the aromatic carbons (1, 3, 4 and 5) have isotropic
shifts between 125 and 140 ppm, with CH at marginally lower shift than the quaternary C
in both cases. The solid-state 13C CP MAS NMR spectra are further complicated by the
presence of crystallographic inequivalences, leading to multiple resonances for each
chemically-distinct type of carbon. The presence of four closely-spaced diamagnetic shifts
precludes conclusive assignment of C1, C3, C4 and C5 in the 13C MAS NMR spectra of
HKUST-1 and STAM-1, as almost all combinations of assignments are supported equally
well when deviation from the chemical shift in the diamagnetic compounds is the only
parameter considered in assignment. However, the C7 resonance in STAM-1 (48.6 ppm)
can clearly be identified by analogy to the C7 resonance in tmbtc (52.8 ppm).
Electronic Supplementary Material (ESI) for Physical Chemistry Chemical PhysicsThis journal is © The Owner Societies 2012

Scheme S5.1 Schematic representations of (a) btc in HKUST-1 and (b) mmbtc in STAM-1,
and “model” analogues (c) H3btc and (d) tmbtc.
Figure S5.1 (a) Solution-state (7.05 T, (CD3)2SO) 13C NMR spectra and (b) Solid-state 13C
(14.1 T, 12.5 kHz CP MAS) NMR spectra of H3btc and tmbtc. Peaks marked s arise from
the solvent and asterisks denote spinning sidebands.
Electronic Supplementary Material (ESI) for Physical Chemistry Chemical PhysicsThis journal is © The Owner Societies 2012

S6. Isotropic shifts, T1 and linewidths for 13C resonances of as-made STAM-1 (14.1 T)
Assignment of the 13C NMR spectrum of STAM-1 was attempted using a
combination of isotropic shift, T1 relaxation constant and linewidth for each resonance.
While this suggested clear assignments for C1, C2, C3 and C7, as discussed in the main
text, it can be seen from Table S6.1 that all three of these parameters are too similar to
distinguish between the resonances known to result from C4, C5 and C6.
Table S6.1 13C isotropic shifts (δiso), T1 relaxation constants and linewidths for the
resonances identified as C4, C5 and C6 in as-made STAM-1
δiso (ppm) Τ1 / ms linewidtha / Hz
181 (1) 7.5 (10) 465 (50)
178 (1) 15.1 (10) 420 (50)
174 (1) 13.7 (10) 290 (30)
aLinewidths were measured using the DMFit software.[S8] The error margins indicate the
change in linewidth depending on the relative degree of Gaussian and Lorentzian
character of the peaks used in the decomposition.
Electronic Supplementary Material (ESI) for Physical Chemistry Chemical PhysicsThis journal is © The Owner Societies 2012

S7. 1H NMR of CD3-STAM-1
CD3-STAM-1 was synthesised using a 1:1 CD3OD : H2O solvent in order to
investigate the mechanism of monoesterification in STAM-1. As shown in Figure S7.1(a),
the 1H MAS NMR spectrum of STAM-1 contains a resonance corresponding to H7 at –0.6
ppm, which is absent in the 1H MAS NMR spectrum of CD3-STAM-1. However, the 13C
MAS NMR spectra (Figure S7.1(b)) confirm that the sample was, indeed, STAM-1 in both
cases. As discussed in greater detail in the main text, the 13C resonance resulting from C7
was present in the CP MAS NMR spectrum of STAM-1 when a short (250 µs) contact time
was used, whereas no such resonance is present for CD3-STAM-1 under the same
experimental conditions. The 1H and 13C MAS and 13C CP MAS spectra for these two
samples confirm the assignment of the 1H resonance at –0.6 ppm as H7 and the 13C
resonance at 49 ppm as C7.
The synthesis of CD3-STAM-1 also provides insight into the mechanism of
formation of mmbtc in STAM-1, which has previously been proposed to involve in situ
Cu-catalysed methylation of the btc by methanol, and its subsequent incorporation into
the MOF. Indeed, it is difficult to envisage any alternative mechanism by which the CH3
functionality could be so readily imparted to each linker molecule in the MOF. Howevrem
the fact that such esterification does not occur at all in the presence of ethanol (i.e., yielding
HKUST-1) meant that further confirmation of the esterification mechanism was required.
The use of CD3OD in place of CH3OH in the synthesis of STAM-1 results in incorporation
of CD3 into the ester group of the mmbtc linker, confirming the mechanism previously
proposed for the formation of mmbtc in the STAM-1 synthesis, although the role of Cu2+ in
catalysing the esterification process cannot be confirmed by this experiment alone.
Electronic Supplementary Material (ESI) for Physical Chemistry Chemical PhysicsThis journal is © The Owner Societies 2012

Figure S7.1 (a) 1H and (b) 13C (14.1 T, 60 kHz MAS) NMR spectra of STAM-1 and CD3-
STAM-1. Spectra were acquired with signal averaging of 512 transients (1H) or 131,072
transients (13C) using recycle intervals of 20 or 100 ms, respectively.
Electronic Supplementary Material (ESI) for Physical Chemistry Chemical PhysicsThis journal is © The Owner Societies 2012

S8. XRD of isotopically-enriched 13C(1,3,4,5)-STAM-1
The powder X-ray diffraction (XRD) pattern of 13C(1,3,4,5)-STAM-1 is shown in
Figure S8.1. By comparison to the simulated patterns for STAM-1 and HKUST-1, also
shown in Figure S8.1, it can be seen that the majority of the sample consists of STAM-1,
but some HKUST-1 is clearly present. This is not surprising, as HKUST-1 is known to be
present as a low-level of impurity in many syntheses of STAM-1.[S9] From the relative
intensities of the resonances at 227 ppm and 181 ppm, the molar ratio of HKUST-1 to
STAM-1 in the sample was estimated to be 1 : 8. This value is based on the assumption
that the resonance at 227 ppm corresponds only to C3 in 13C(1,3,4,5)-STAM-1 and C3 in 13C(1,3)-HKUST-1, the resonance at 181 ppm arises only from C4 in 13C(1,3,4,5)-STAM-1
and the labelled linkers are distributed uniformly through both MOFs.
Figure S8.1 (a) Experimental powder XRD pattern of 13C(1,3,4,5)-STAM-1 and simulated
patterns for (b) STAM-1 and (c) HKUST-1. Peaks in the experimental diffraction pattern
arising exclusively from HKUST-1 are marked in blue. The XRD pattern was obtained on a
Stoe STADIP EMPYREAN diffractometer, using Cu Kα1 radiation (λ = 1.5406 Å).
Electronic Supplementary Material (ESI) for Physical Chemistry Chemical PhysicsThis journal is © The Owner Societies 2012
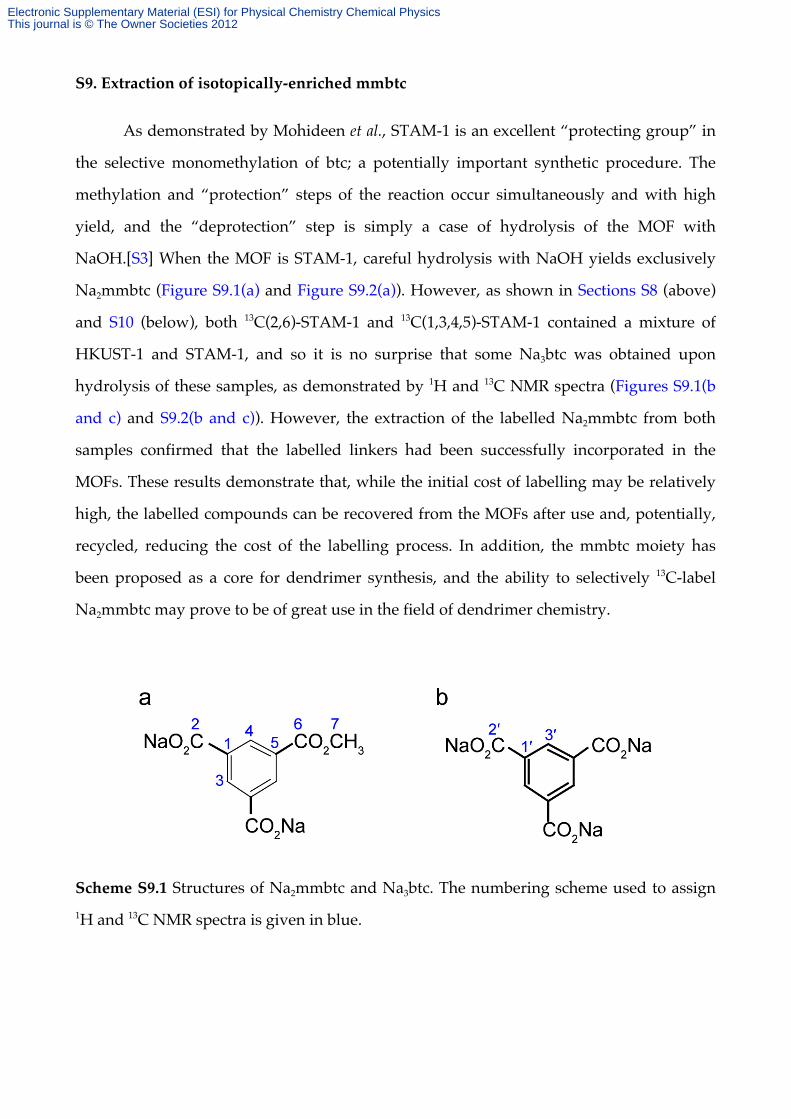
S9. Extraction of isotopically-enriched mmbtc
As demonstrated by Mohideen et al., STAM-1 is an excellent “protecting group” in
the selective monomethylation of btc; a potentially important synthetic procedure. The
methylation and “protection” steps of the reaction occur simultaneously and with high
yield, and the “deprotection” step is simply a case of hydrolysis of the MOF with
NaOH.[S3] When the MOF is STAM-1, careful hydrolysis with NaOH yields exclusively
Na2mmbtc (Figure S9.1(a) and Figure S9.2(a)). However, as shown in Sections S8 (above)
and S10 (below), both 13C(2,6)-STAM-1 and 13C(1,3,4,5)-STAM-1 contained a mixture of
HKUST-1 and STAM-1, and so it is no surprise that some Na3btc was obtained upon
hydrolysis of these samples, as demonstrated by 1H and 13C NMR spectra (Figures S9.1(b
and c) and S9.2(b and c)). However, the extraction of the labelled Na2mmbtc from both
samples confirmed that the labelled linkers had been successfully incorporated in the
MOFs. These results demonstrate that, while the initial cost of labelling may be relatively
high, the labelled compounds can be recovered from the MOFs after use and, potentially,
recycled, reducing the cost of the labelling process. In addition, the mmbtc moiety has
been proposed as a core for dendrimer synthesis, and the ability to selectively 13C-label
Na2mmbtc may prove to be of great use in the field of dendrimer chemistry.
Scheme S9.1 Structures of Na2mmbtc and Na3btc. The numbering scheme used to assign 1H and 13C NMR spectra is given in blue.
Electronic Supplementary Material (ESI) for Physical Chemistry Chemical PhysicsThis journal is © The Owner Societies 2012

Figure S9.1 Solution-state (7.05 T) 1H NMR spectra of (a) Na2mmbtc extracted from
natural-abundance STAM-1 (solvent = (CD3)2SO), (b) a mixture of Na2mmbtc and Na3btc
extracted from 13C(2,6)-STAM-1 (solvent = D2O) and (c) a mixture of Na2mmbtc and Na3btc
extracted from 13C(1,3,4,5)-STAM-1 (solvent = D2O). Spectra are assigned according to
Scheme S9.1. Resonances marked s arise from the solvent and asterisks denote resonances
arising from trace acetone.
Electronic Supplementary Material (ESI) for Physical Chemistry Chemical PhysicsThis journal is © The Owner Societies 2012

Figure S9.2 Solution-state (7.50 T, D2O) 13C NMR spectra of (a) Na2mmbtc extracted from
natural-abundance STAM-1 (solvent = (CD3)2SO), (b) a mixture of Na2mmbtc and Na3btc
extracted from 13C(2,6)-STAM-1 (solvent = D2O) and (c) a mixture of Na2mmbtc and Na3btc
extracted from 13C(1,3,4,5)-STAM-1 (solvent = D2O). Spectra are assigned according to
Scheme S9.1. Asterisks denote resonances arising from trace acetone (used to reference the
spectra, δ = 30.89 ppm[S10]).
Electronic Supplementary Material (ESI) for Physical Chemistry Chemical PhysicsThis journal is © The Owner Societies 2012

S10. 13C NMR spectra of dehydrated 13C(2,6)-STAM-1
Figure S10.1 shows the 13C MAS NMR spectrum of a dehydrated sample of 13C(2,6)-
STAM-1. It is clear from the increased relative intensities of the resonances at –54 and –88
ppm that these both correspond to crystallographically-distinct C2 sites, while the two
resonances at 178 and 182 ppm correspond to crystallographically-distinct C6 sites. The
change in lineshape at –88 ppm between the natural-abundance STAM-1 and 13C(2,6)-
STAM-1 can be explained by the presence of some dehydrated 13C(2)-HKUST-1 (C2
isotropic shift of –87 ppm). This is a common impurity phase found in the synthesis of
STAM-1, with the proportion varying with the exact reaction conditions used.
Figure S10.1 13C (14.1 T, 60 kHz MAS) NMR spectra of (a) deh-STAM-1, (b) deh-13C(2,6)-
STAM-1 and (c) deh-HKUST-1. Spectra were acquired in two steps with signal averaging
of (a) 51200, (b) 24576 and (c) 51200 transients per step. In all cases, a recycle interval of 100
ms was used. Insets show the C2 region (0 to –200 ppm) and the C4, C5 and C6 region (200
to 150 ppm) of the spectra.
Electronic Supplementary Material (ESI) for Physical Chemistry Chemical PhysicsThis journal is © The Owner Societies 2012

S11. 13C shifts and T1 relaxation constants at 9.4, 14.1 and 20.0 T
In order to investigate the effects of changing B0 field strength on the observed
spectra, 13C spin-echo spectra were acquired for STAM-1 and HKUST-1 at 9.4 T (14 kHz
MAS), 14.1 T (60 kHz MAS) and 20.0 T (58 kHz MAS). Table S11.1 present the isotropic
shifts and T1 constants measured at these three fields. Owing to the different MAS rates
employed at these fields, care should be taken in comparing the data directly as the exact
sample temperature is a function of MAS rate and rotor diameter. However, as discussed
in the main text, the magnetic moments of HKUST-1 and STAM-1 above temperatures of
~250 K are essentially constant.[S9,S11] Therefore, the temperature dependence of δiso is
expected to be negligible in the temperature regime studied here. From the field- and zero-
field-cooled magnetic responses of the two MOFs, it appears that, their magnetic
behaviour is field-independent as well as temperature-independent in the regimes
investigated in this work.[S9,S11] The data reported in Table S11.1 appear to indicate a
trend for shorter T1 relaxation time at greater B0 field strength (especially for C1, C2 and
C3). While this observation warrants further investigation, it should be noted that the
differences in measured values of T1 are of the same order of magnitude as the margin of
error on the measured values of T1 (and, indeed, on the same order of magnitude as the
smaller T1 values). Data with reduced errors (i.e., significantly increased signal to noise
ratios) would be required before these observations could be confirmed. However, the
prohibitively long experimental times (on the order of days to weeks per measurement)
meant that such data were not acquired here.
Electronic Supplementary Material (ESI) for Physical Chemistry Chemical PhysicsThis journal is © The Owner Societies 2012

Table S11.1 13C isotropic shifts and T1 relaxation constants for HKUST-1 and STAM-1,
measured at B0 field strengths of 9.4, 14.1 and 20.0 T, with MAS rates of 14, 60 and 58 kHz,
respectively. Measurements for C1 could not be made at 9.4 T owing to the combination of
rapid T2 relaxation and relatively long rotor-synchronised echo delay.
species δiso (ppm) Τ1 / ms
9.4 T 14.1 T 20.0 T 9.4 T 14.1 T 20.0 T
HKUST-1
C1 850 (5) 853 (5) 851 (5) 8.0 (10) 4.4 (10) 5.6 (10)
C2 –51 (2) –50 (1) –51 (2) 4.2 (10) 3.5 (10) 2.6 (10)
C3 228 (1) 228 (1) 228 (1) 14.3 (10) 10.8 (10) 9.5 (10)
STAM-1
C1 853 (5) 850 (10) 3.6 (10) 2.7 (10)
C2 –50 (1) –52 (2) 2.3 (10) 1.4 (10) 1.3 (10)
C3 228 (1) 227 (1) 227 (1) 8.9 (10) 8.5 (10) 5.9 (10)
C4 181 (1) 181 (1) 181 (1) 7.5 (10) 7.7 (10)
C5 174 (1) 174 (1) 174 (1) 15.9 (10) 13.7 (10) 18.3 (10)
C6 178 (1) 178 (1) 178 (1) 17.9 (10) 15.1 (10) 15.2 (10)
C7 49 (1) 49 (1) 49 (1) 22.4 (10) 16.2 (10) 18.4 (10)
Electronic Supplementary Material (ESI) for Physical Chemistry Chemical PhysicsThis journal is © The Owner Societies 2012
S12. References
S1. B. Juršić, Can. J. Chem., 1989, 67, 1381.
S2. B. Xiao, P. S. Wheatley, A. J. Fletcher, S. Fox, A. G. Rossi, I. L. Megson, S. Bordiga, L.
Regli, K. M. Thomas, R. E. Morris, J. Am. Chem. Soc., 2007, 129, 1203.
S3. M. I. H. Mohideen, B. Xiao, P. S. Wheatley, A. C. McKinlay, Y. Li, A. M. Z. Slawin, D.
W. Aldous, N. F. Cessford, T. Düren, X. Zhao, R. Gill, K. M. Thomas, J. M. Griffin, S. E.
Ashbrook, R. E. Morris, Nature Chem., 2011, 3, 304.
S4. F. Gul-E-Noor, B. Jee, A. Pöppl, M. Hartmann, D. Himsl, M. Bertmer, Phys. Chem. Chem.
Phys., 2011, 13, 7783.
S5. G. Kervern, G. Pintacuda, Y. Zhang, E. Oldfield, C. Roukoss, E. Kuntz, E. Herdtweck,
J.-M. Basset, S. Cadars, A. Lesage, C. Copéret, L. Emsley, J. Am. Chem. Soc., 2006, 128,
13545.
S6. T. Cendak, T. B. Čelič, M. Rangus, N. Z. Logar, G. Mali, V. Kaučič, presented at the 7th
Alpine Conference on Solid-State NMR, Chamonix-Mont Blanc, France, 2011.
S7. T. B. Čelič, M. Mazaj, N. Guillou, V. Kaučič, N. Z. Logar, presented at the 3rd Croatian-
Slovenian Symposium on Zeolites, Zagreb, Croatia, 2010.
S8. D. Massiot, F. Fayon, M. Capron, I. King, S. Le Calvé, B. Alonso, J.-O. Durand, B. Bujoli,
Z. Gan, G. Hoatson, Magn. Reson. Chem., 2002, 40, 7.
S9. M. I. H. Mohideen, Ph.D. Thesis, University of St Andrews, 2011.
S10. H. E. Gottlieb, V. Kotlyar, A. Nudelman, J. Org. Chem., 1997, 7512.
S11. X. X. Zhang, S.-Y. Chui, I. D. Williams, J. Appl. Phys., 2000, 87, 6007.
Electronic Supplementary Material (ESI) for Physical Chemistry Chemical PhysicsThis journal is © The Owner Societies 2012


![1H & 13C NMR Spectroscopy answers · 1H and 13C NMR Spectroscopy Answwers 1 (c) Each structure can represent a pair of cis/Z and trans/E isomers OR Optical isomers 1 [5] M7.(a) (i)](https://img.dokumen.tips/doc/110x75/5eda28dab3745412b570dedf/1h-13c-nmr-spectroscopy-answers-1h-and-13c-nmr-spectroscopy-answwers-1-c.jpg)