Embed Size (px)
Citation preview
13C NMR Spectroscopy
2
Introduction
• Nuclear magnetic resonance spectroscopy (NMR) is the most
powerful tool available for structural determination.
• A nucleus with an odd number of protons, an odd number of
neutrons, or both, has a nuclear spin that can be observed by the
NMR spectrometer.
• NMR active nuclei include: 1H, 13C, 19F, and 31P.
• Remember a spinning nucleus generates a magnetic field (magnetic
moment).
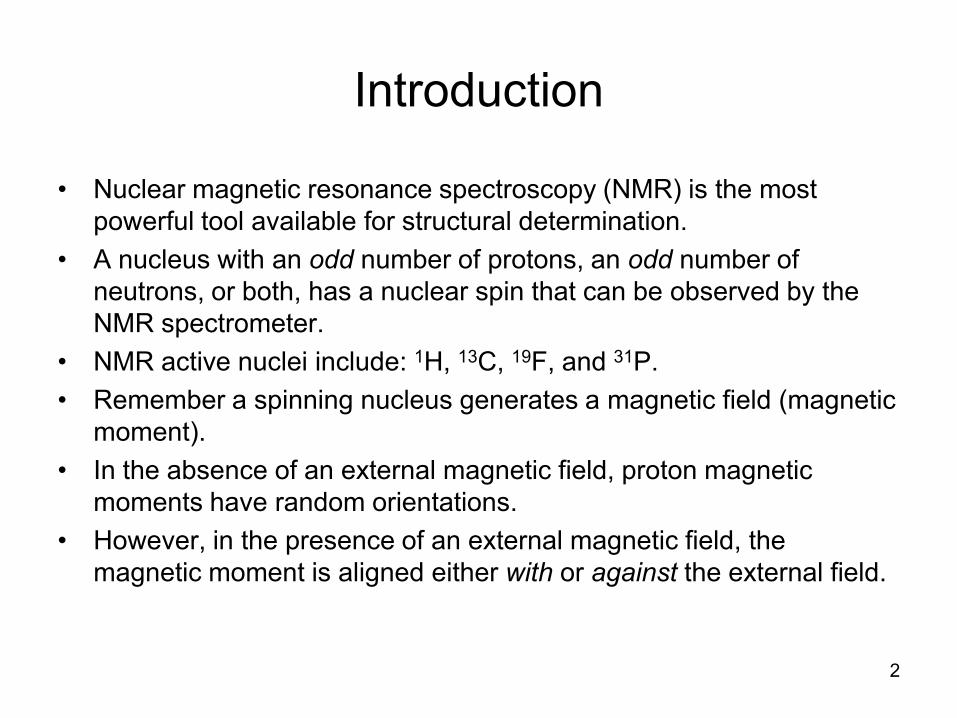
• In the absence of an external magnetic field, proton magnetic
moments have random orientations.
• However, in the presence of an external magnetic field, the
magnetic moment is aligned either with or against the external field.
3
Introduction
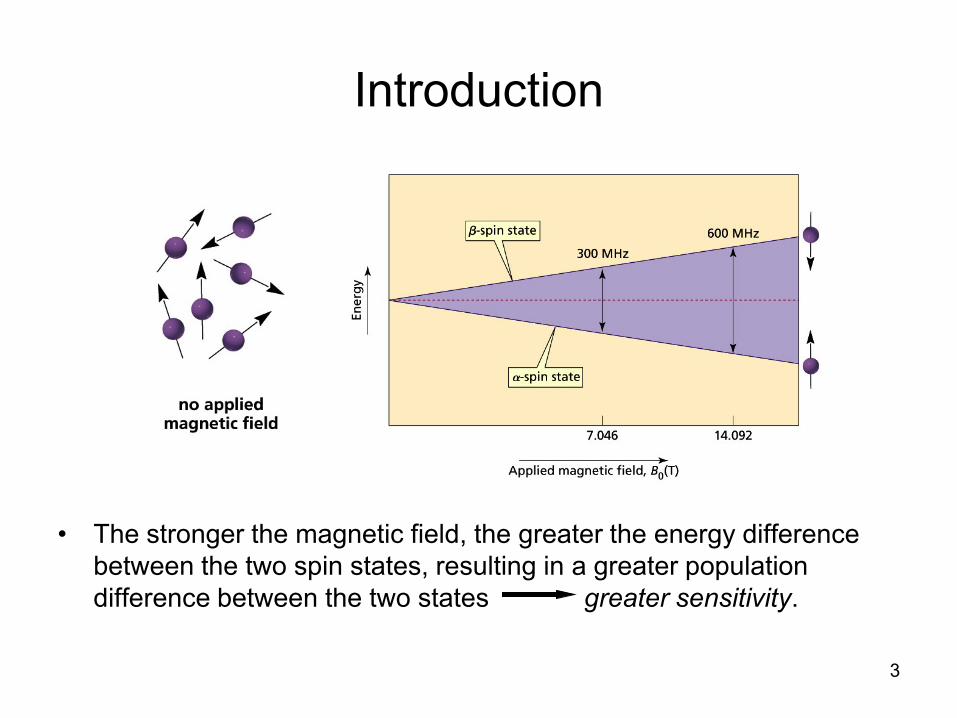
• The stronger the magnetic field, the greater the energy difference
between the two spin states, resulting in a greater population
difference between the two states greater sensitivity.
4
Nuclear Spin Energy Levels
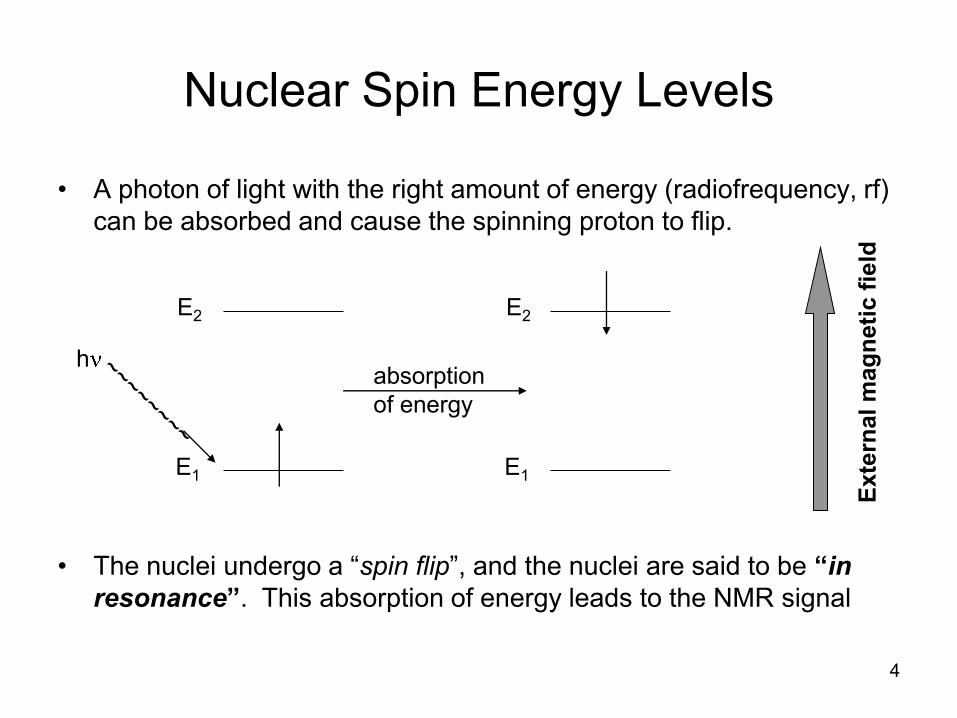
• A photon of light with the right amount of energy (radiofrequency, rf)
can be absorbed and cause the spinning proton to flip.
• The nuclei undergo a “spin flip”, and the nuclei are said to be “in
resonance”. This absorption of energy leads to the NMR signal
Exte
rnal m
ag
neti
c f
ield
E1
E2
E1
E2
habsorption
of energy
5
Nuclear Spin Energy Levels
• If the two states become equally populated, then no net spin transitions occur and no signal is produced. This is called saturation.
• The frequency of EM radiation necessary for resonance depends on the strength of the magnetic field and on the chemical environment of the nucleus.
• Fortunately, protons (in 1H NMR) in molecules usually experience different chemical environments (i.e. are shielded to varying extents).

6
1H NMR Spectroscopy
• Therefore, different frequencies are required to bring
different protons into resonance.
• Consider CH3OH:
O C H
H
H
H
Deshielded, senses higher
effective magnetic field so
comes into resonance at a
higher frequency.
Shielded, senses a smaller
effective magnetic field so
comes into resonance at a
lower frequency.
7
1H NMR Spectroscopy
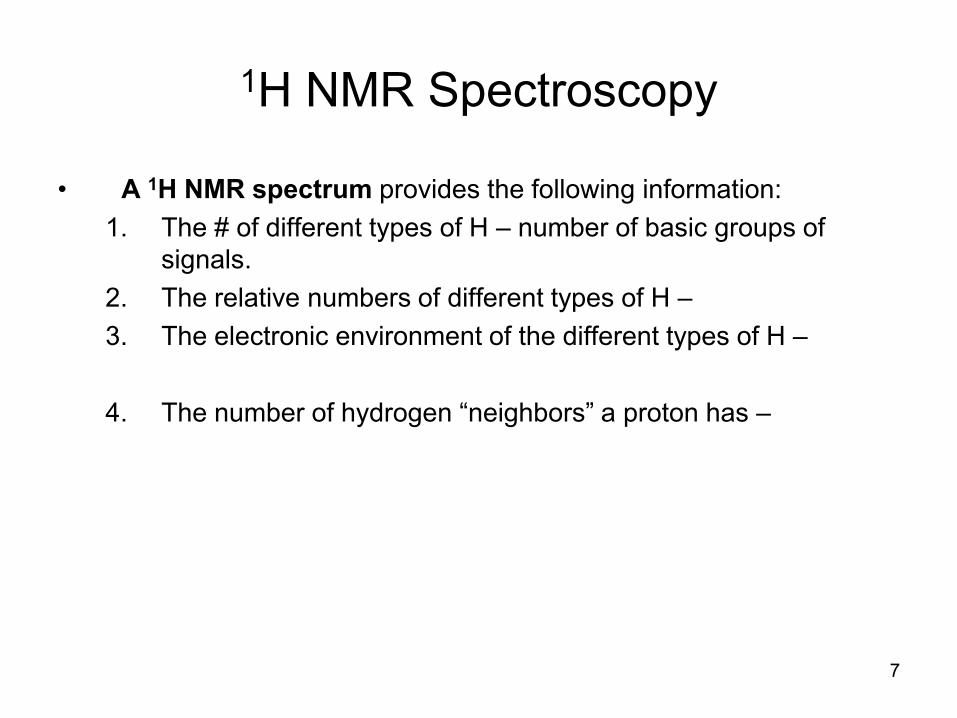
• A 1H NMR spectrum provides the following information:
1. The # of different types of H – number of basic groups of
signals.
2. The relative numbers of different types of H –
3. The electronic environment of the different types of H –
4. The number of hydrogen “neighbors” a proton has –
8
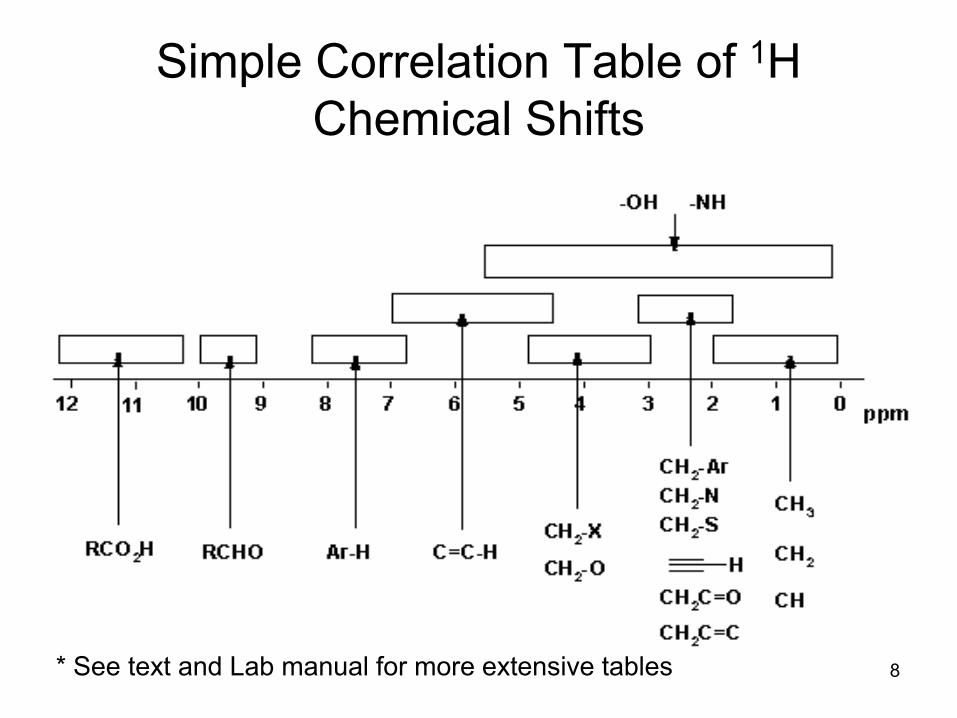
Simple Correlation Table of 1H
Chemical Shifts
* See text and Lab manual for more extensive tables
9
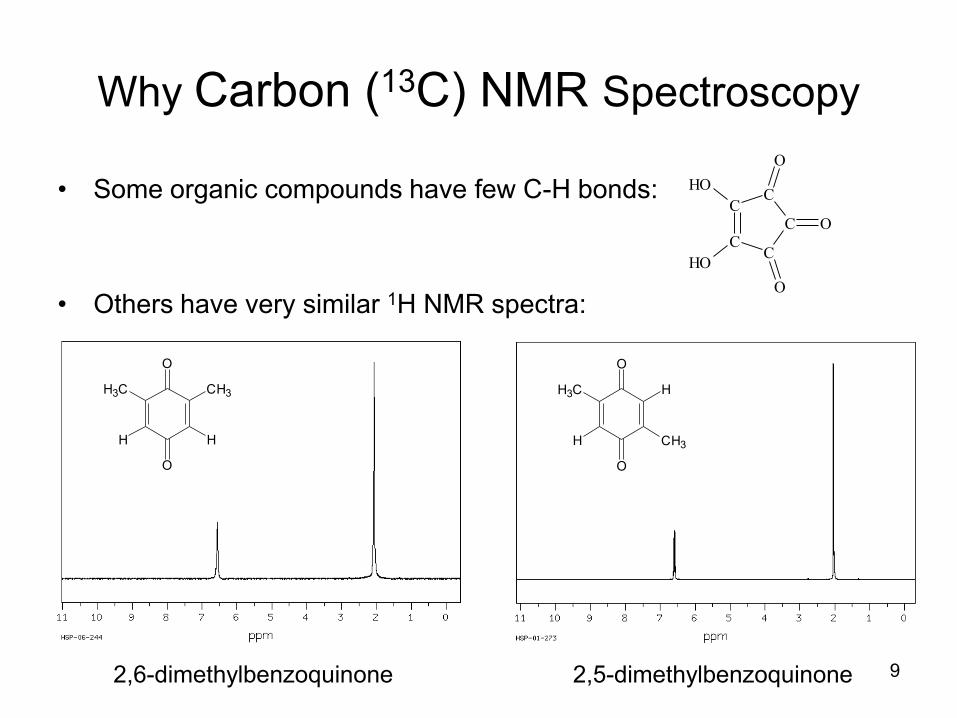
Why Carbon (13C) NMR Spectroscopy
• Some organic compounds have few C-H bonds:
• Others have very similar 1H NMR spectra:
C
CC
C
C
O
O
O
HO
HO
2,6-dimethylbenzoquinone
O
O
CH3H3C
HH
2,5-dimethylbenzoquinone
O
O
HH3C
CH3H
10
Carbon (13C) NMR vs 1H NMR
• The 13C nucleus can also undergo nuclear magnetic resonance.
• 13C NMR vs 1H NMR :
– 12C, the most abundant isotope of carbon, does NOT exhibit NMR behavior. Why?
– 13C, only _____ natural abundance, does exhibit NMR behavior.
– Due to low abundance, 13C-13C coupling is usually not observed.
– Chemical shift ranges are much larger –
– Integration in 13C NMR is NOT reliable due to variable relaxation times from C to C. Also Nuclear Overhauser Effect - the intensity of the C signal increases as the number of attached protons increases. Not uniform however.
11
Fourier Transform (FT) spectroscopy
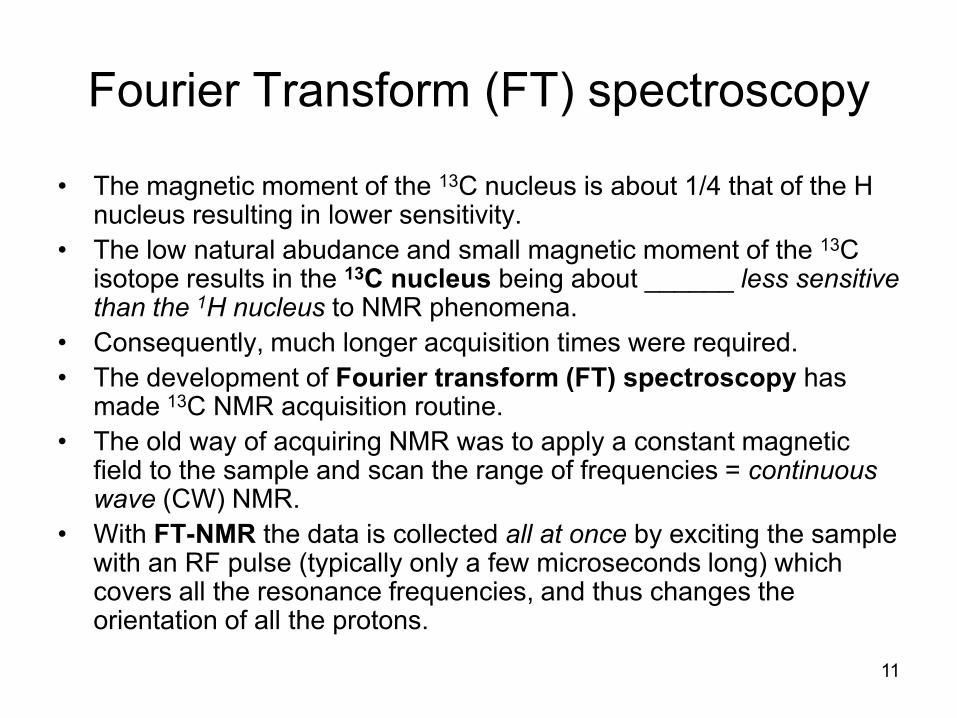
• The magnetic moment of the 13C nucleus is about 1/4 that of the H nucleus resulting in lower sensitivity.
• The low natural abudance and small magnetic moment of the 13C isotope results in the 13C nucleus being about ______ less sensitive than the 1H nucleus to NMR phenomena.
• Consequently, much longer acquisition times were required.
• The development of Fourier transform (FT) spectroscopy has made 13C NMR acquisition routine.
• The old way of acquiring NMR was to apply a constant magnetic field to the sample and scan the range of frequencies = continuous wave (CW) NMR.
• With FT-NMR the data is collected all at once by exciting the sample with an RF pulse (typically only a few microseconds long) which covers all the resonance frequencies, and thus changes the orientation of all the protons.
12
Fourier Transform (FT) spectroscopy
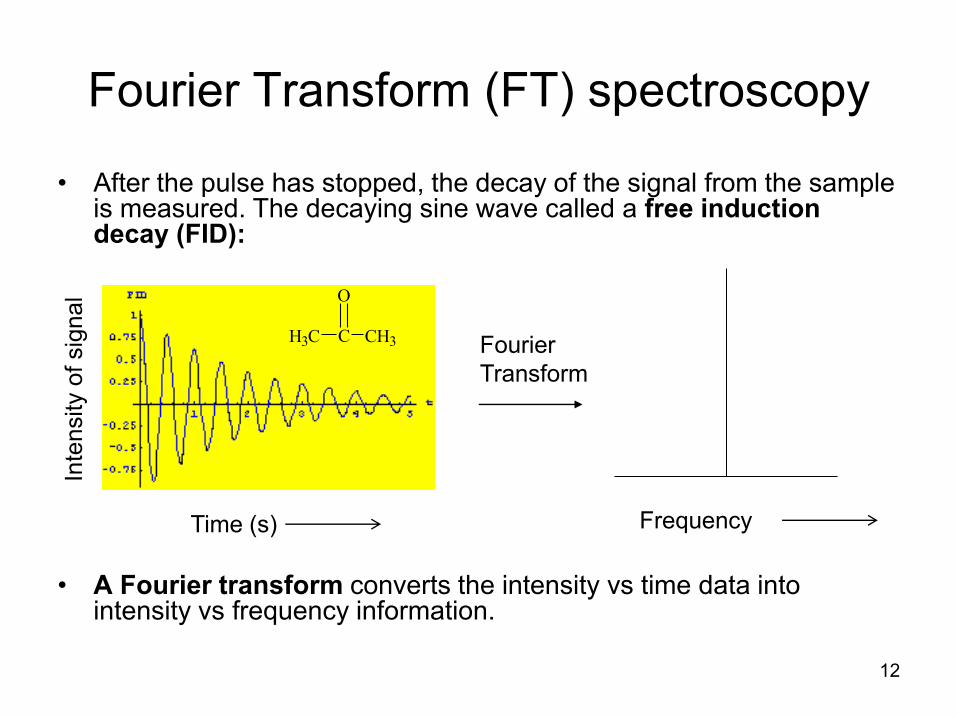
• After the pulse has stopped, the decay of the signal from the sample is measured. The decaying sine wave called a free induction decay (FID):
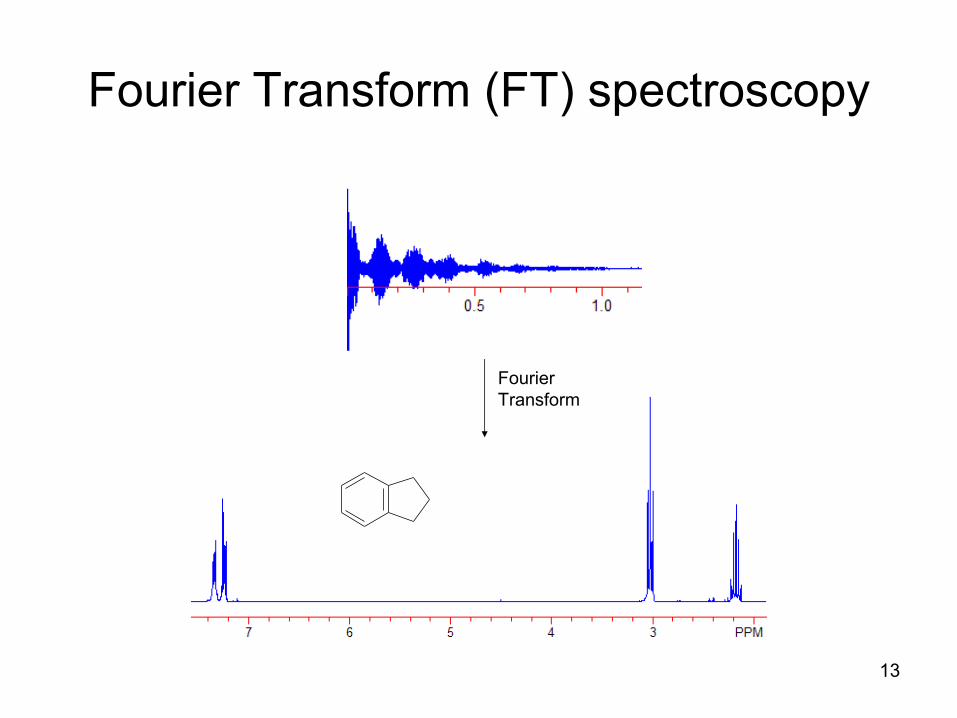
• A Fourier transform converts the intensity vs time data into intensity vs frequency information.
Time (s) Frequency
Fourier
Transform
CH3C CH3
O
Inte
nsity o
f sig
nal
13
Fourier Transform (FT) spectroscopy
Fourier
Transform
14
Chemical Shifts in 13C NMR
• Two simple ideas will make interpretation of 13C
NMR spectra easier:
1. Hybridization of the C atom determines the
chemical shift:
sp3 hybridized carbons have chemical shift
values _________.
sp2 hybridized carbons have chemical shift
values _________.
2. The presence of an EN element near a C atom will
cause its chemical shift to move _____________.
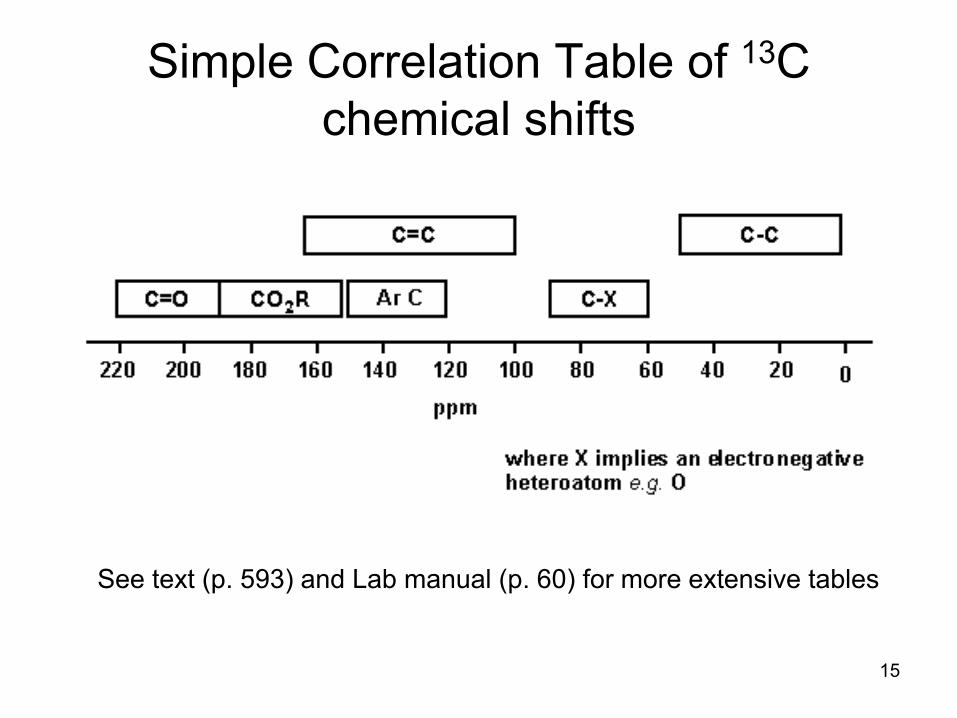
15
Simple Correlation Table of 13C
chemical shifts
See text (p. 593) and Lab manual (p. 60) for more extensive tables
16
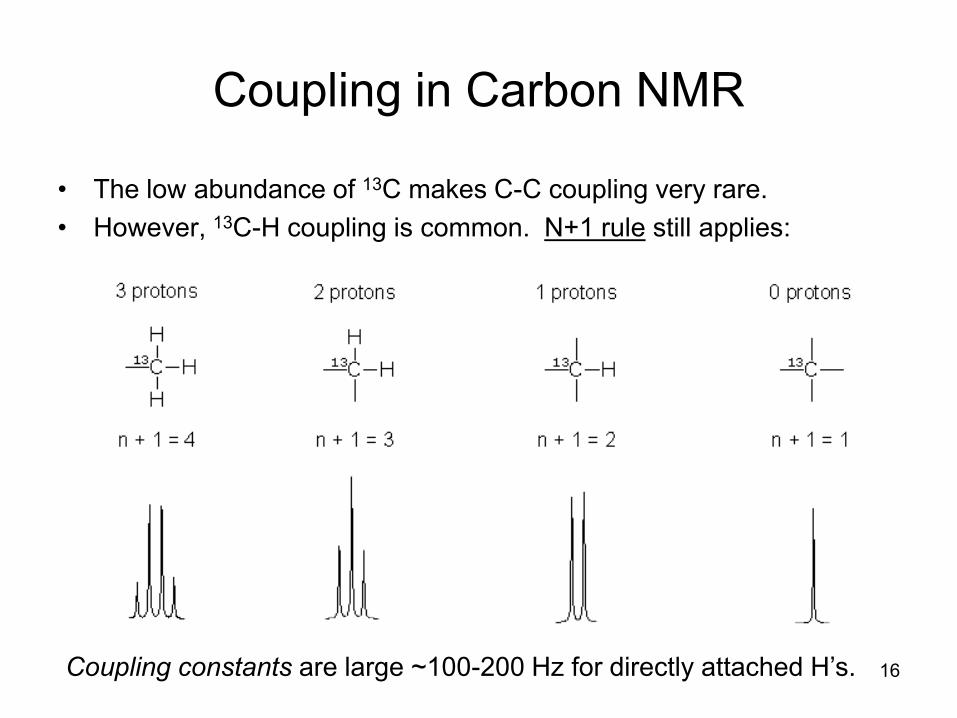
Coupling in Carbon NMR
• The low abundance of 13C makes C-C coupling very rare.
• However, 13C-H coupling is common. N+1 rule still applies:
Coupling constants are large ~100-200 Hz for directly attached H’s.
17
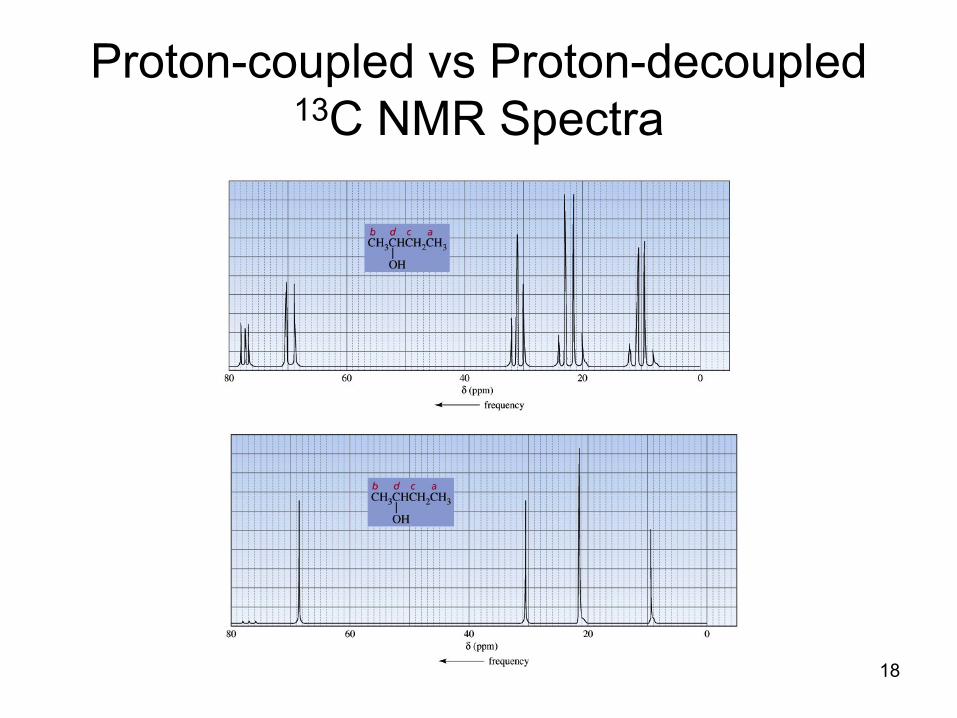
Coupling in Carbon NMR
• Spectra which show 13C-H coupling are called proton-coupled spectra.
• However, extensive 13C-H coupling often produces splitting patterns that are difficult to interpret.
• To simply 13C NMR spectra, often recorded using broad band proton decoupling.
• Therefore each carbon signal appears as a singlet, because C-H splitting has been eliminated.
• Spectra recorded in the broad band proton decoupling mode give the number of unique carbon atoms in a molecule.
18
Proton-coupled vs Proton-decoupled 13C NMR Spectra
19
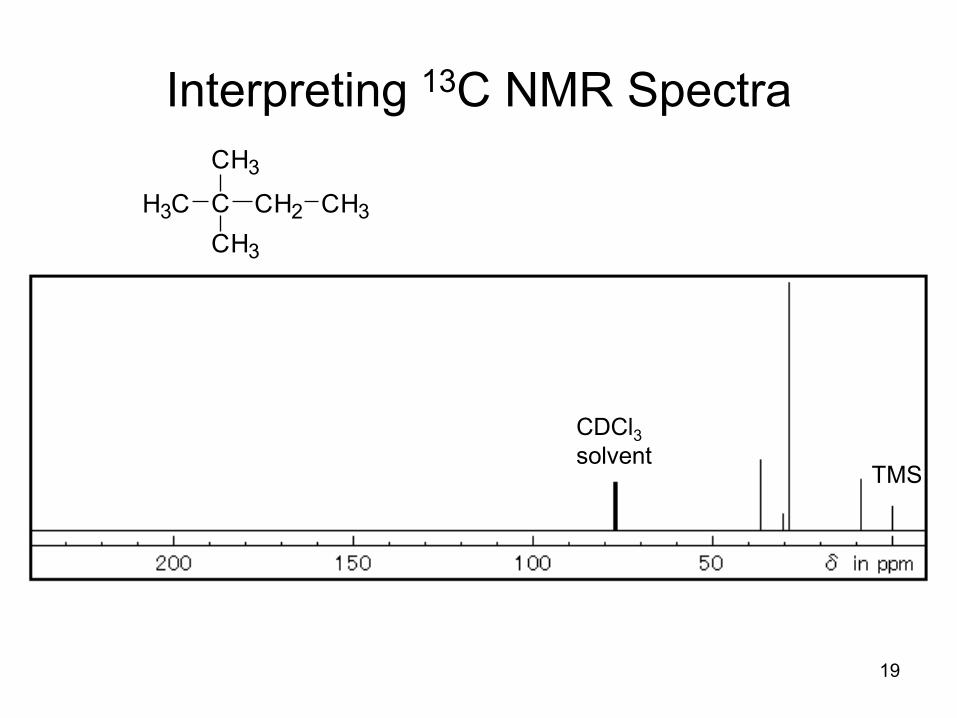
Interpreting 13C NMR Spectra
H3C C CH2 CH3
CH3
CH3
TMS
CDCl3solvent
20
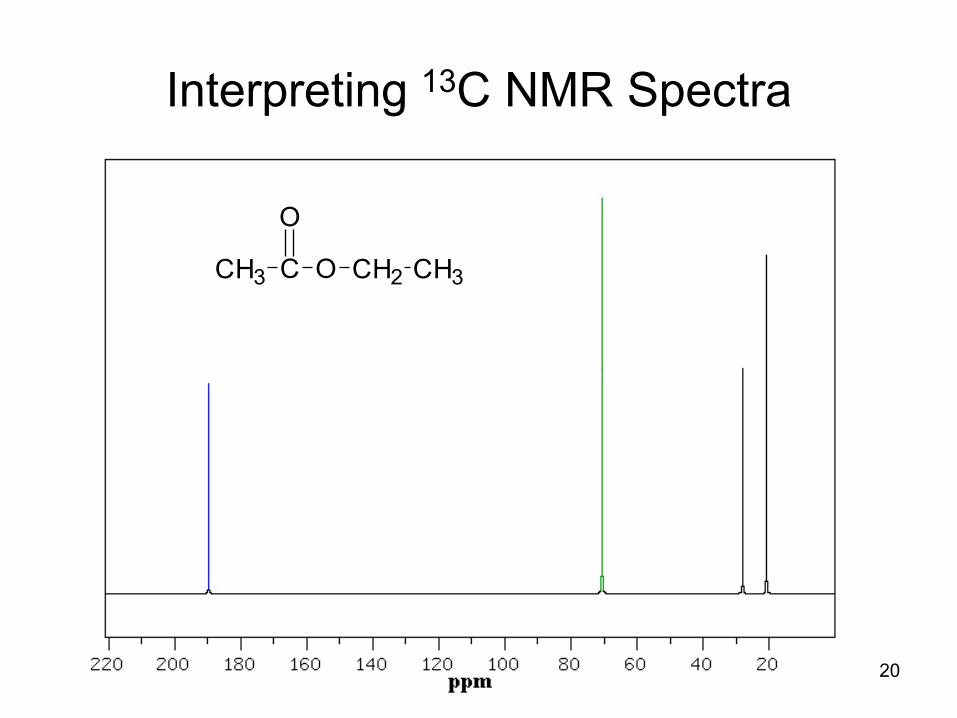
Interpreting 13C NMR Spectra
CCH3 O
O
CH2 CH3
21
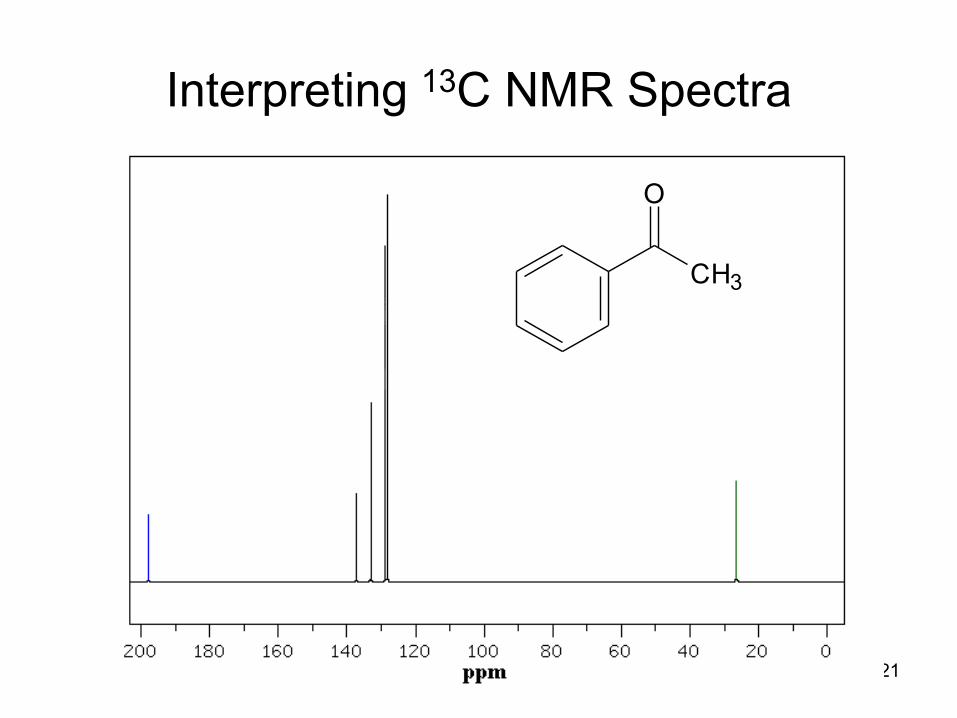
Interpreting 13C NMR Spectra
CH3
O
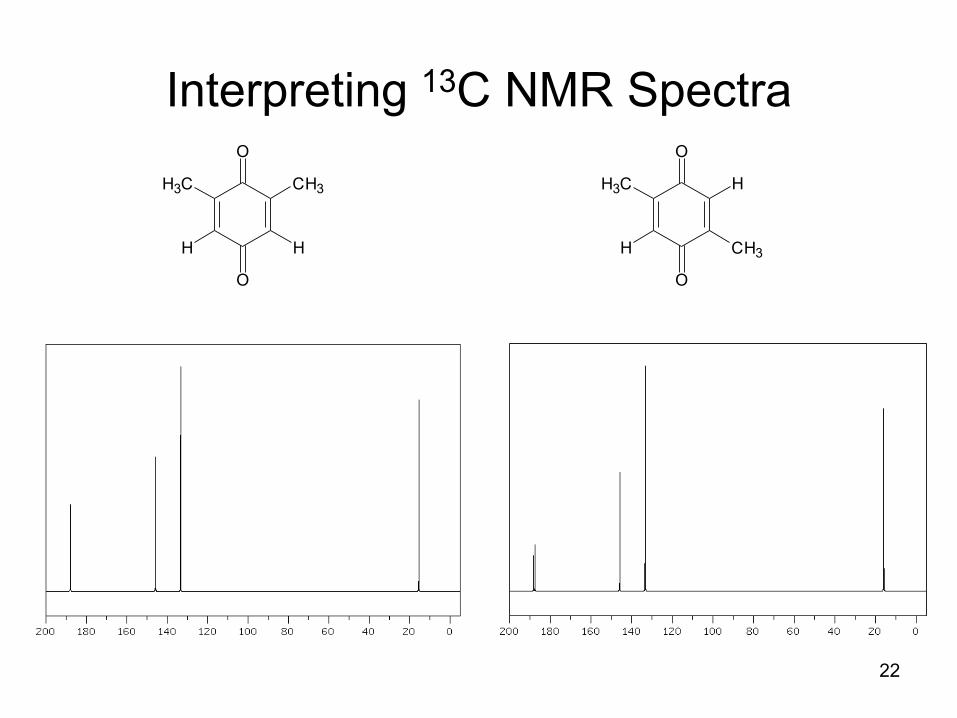
22
Interpreting 13C NMR SpectraO
O
CH3H3C
HH
O
O
HH3C
CH3H
Mass Spectrometry
24
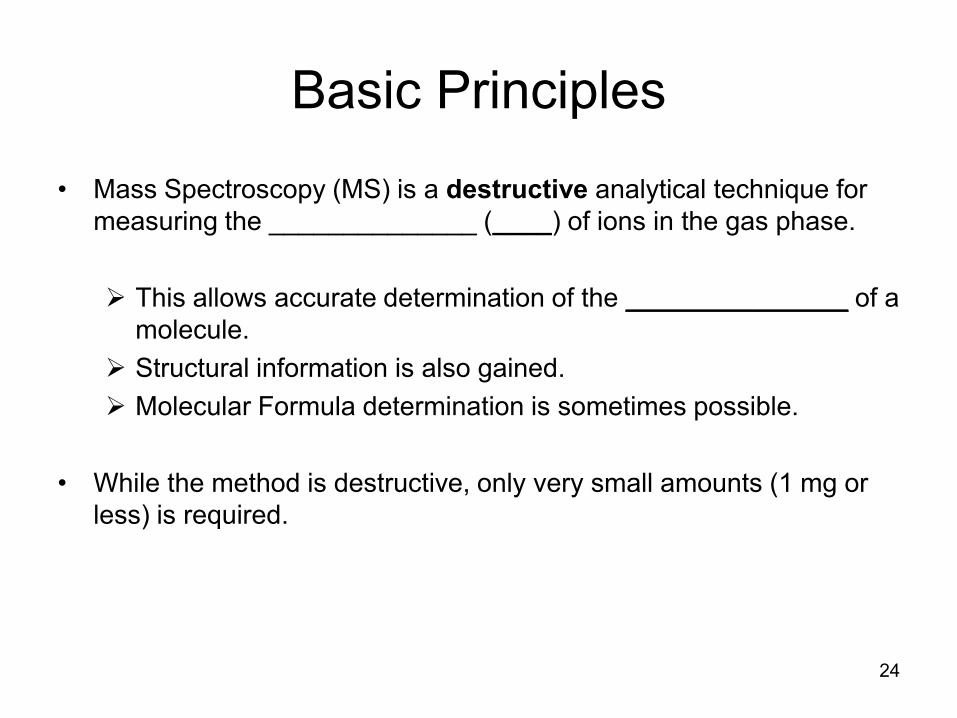
Basic Principles
• Mass Spectroscopy (MS) is a destructive analytical technique for
measuring the ______________ (____) of ions in the gas phase.
This allows accurate determination of the _______________ of a
molecule.
Structural information is also gained.
Molecular Formula determination is sometimes possible.
• While the method is destructive, only very small amounts (1 mg or
less) is required.
25
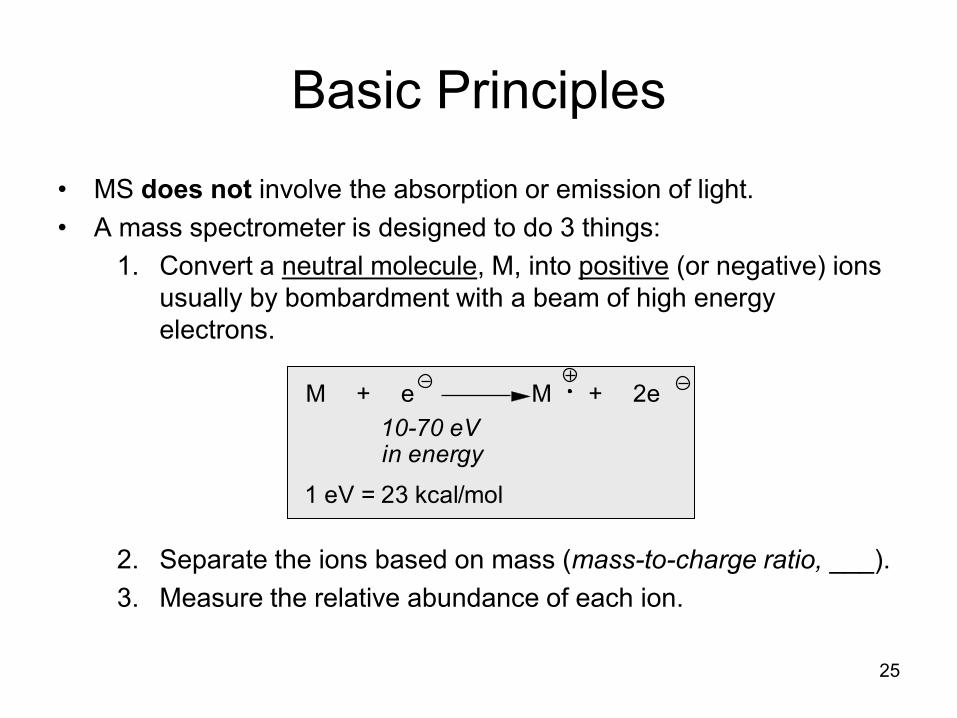
• MS does not involve the absorption or emission of light.
• A mass spectrometer is designed to do 3 things:
1. Convert a neutral molecule, M, into positive (or negative) ions
usually by bombardment with a beam of high energy
electrons.
2. Separate the ions based on mass (mass-to-charge ratio, ___).
3. Measure the relative abundance of each ion.
Basic Principles
M + e M + 2e
10-70 eVin energy
1 eV = 23 kcal/mol
26
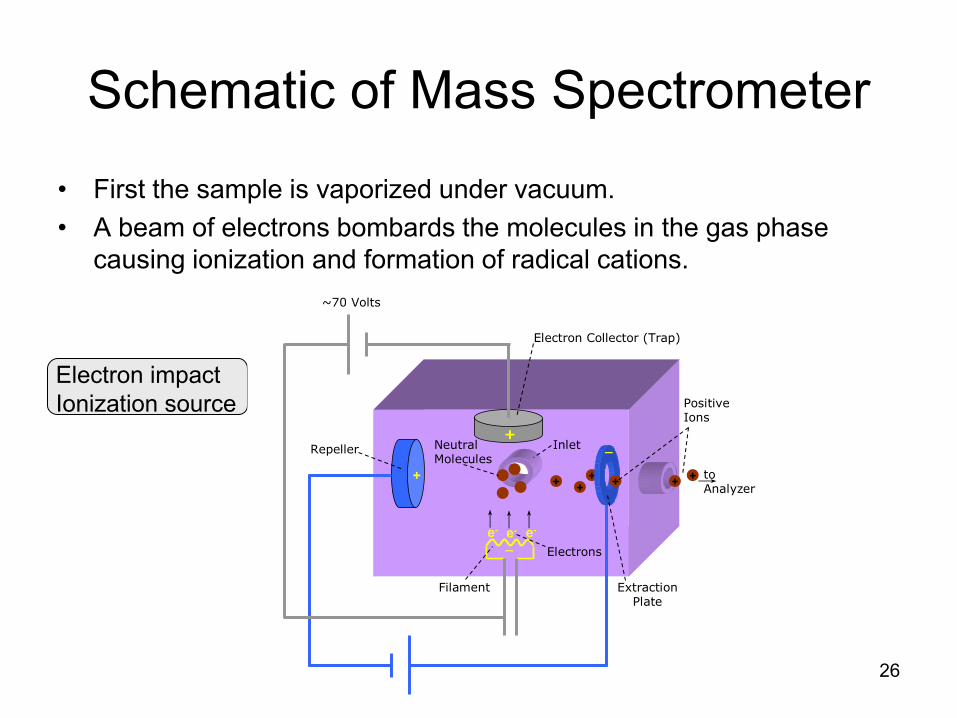
Schematic of Mass Spectrometer
• First the sample is vaporized under vacuum.
• A beam of electrons bombards the molecules in the gas phase
causing ionization and formation of radical cations.
~70 Volts
+
_
+
_
e- e-e-
++ ++
++
_
Electron Collector (Trap)
Repeller
ExtractionPlate
Filament
toAnalyzer
Inlet
Electrons
NeutralMolecules
PositiveIons
Electron ImpactIonization Source
Electron impact
Ionization source
27
Schematic of Mass Spectrometer
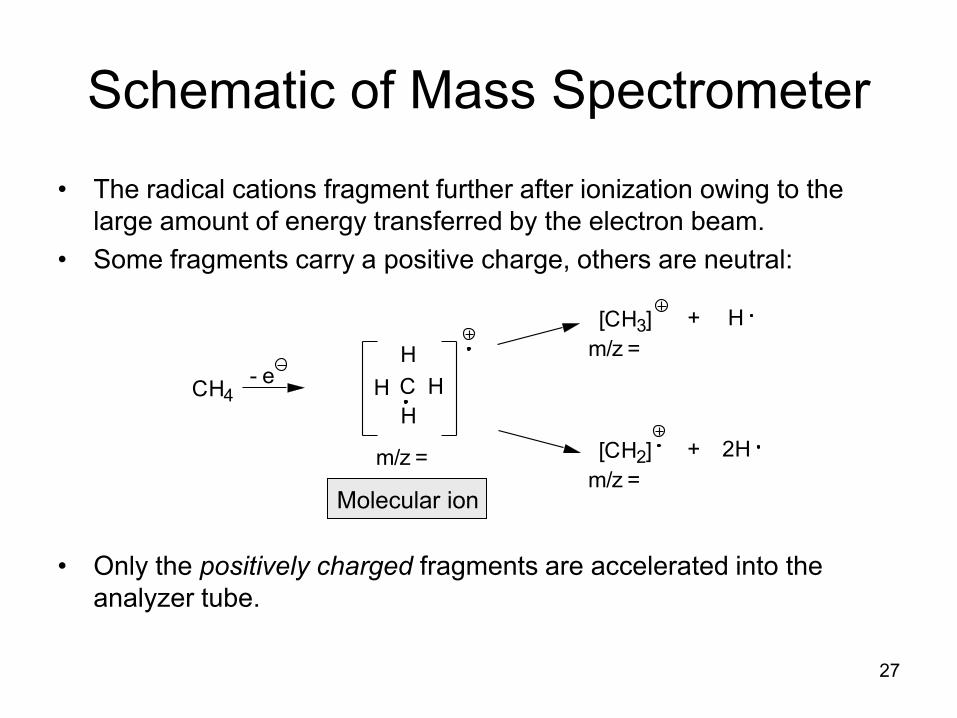
• The radical cations fragment further after ionization owing to the
large amount of energy transferred by the electron beam.
• Some fragments carry a positive charge, others are neutral:
• Only the positively charged fragments are accelerated into the
analyzer tube.
CH4- e
C
H
HH
H
m/z =
[CH3] + H
m/z =
[CH2] + 2H
m/z =Molecular ion
28
Schematic of Mass Spectrometer
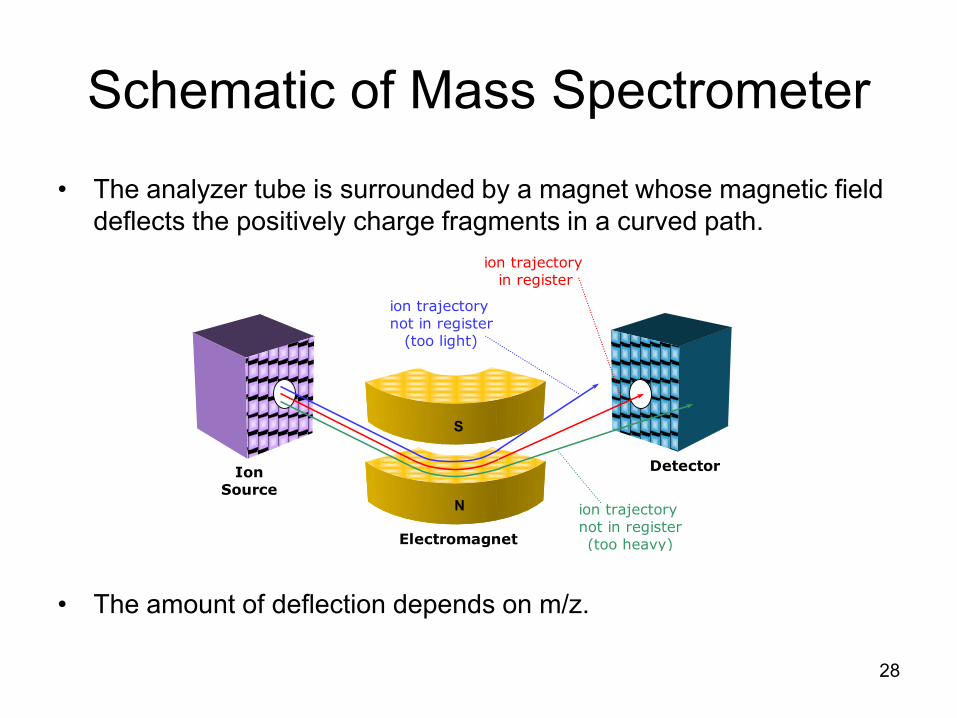
• The analyzer tube is surrounded by a magnet whose magnetic field
deflects the positively charge fragments in a curved path.
• The amount of deflection depends on m/z.
ion trajectory not in register(too heavy)
IonSource
Detector
ion trajectory not in register
(too light)
ion trajectory in register
S
N
Magnetic Sector Mass Analyzer
Electromagnet
29
Basis of Fragment Separation
• Fragments with smaller m/z value are deflected ______ than a
larger m/z value.
• Since z is usually _____, the fragments are sorted by mass.
• By varying the magnetic field, cations of different masses are sorted
and counted by a detector.
• The more stable the fragment the more likely it will make it to the
detector.
• The masses are graphed or tabulated according to their relative
abundance = The Mass Spectrum.
30
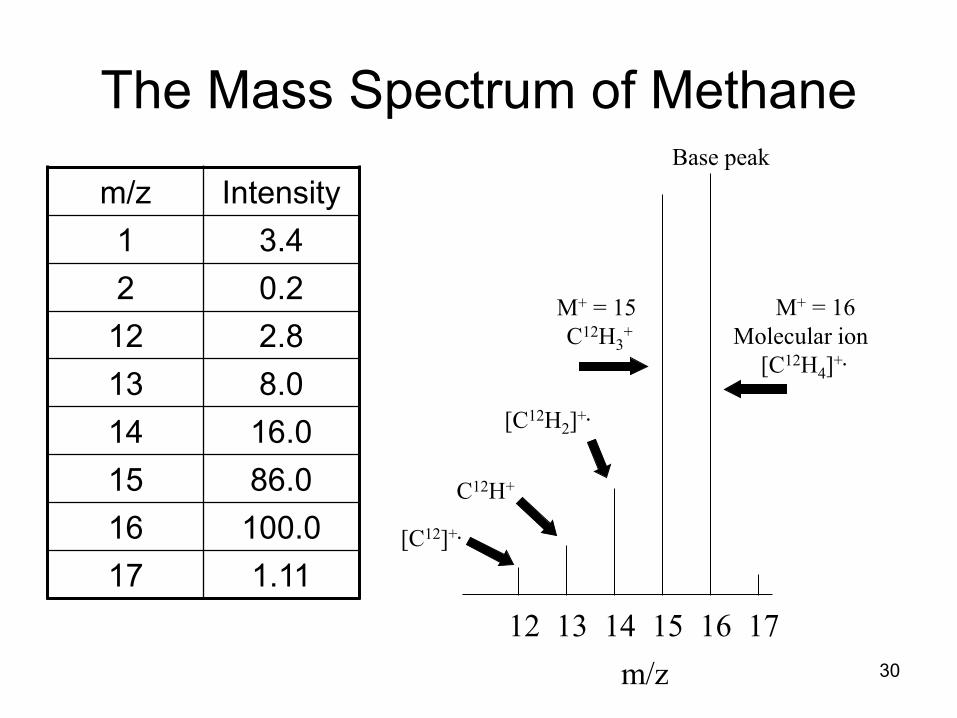
The Mass Spectrum of Methane
m/z
12 13 14 15 16 17
M+ = 15
C12H3+
M+ = 16
Molecular ion
[C12H4]+.
[C12H2]+.
[C12]+.
C12H+
m/z Intensity
1 3.4
2 0.2
12 2.8
13 8.0
14 16.0
15 86.0
16 100.0
17 1.11
Base peak
31
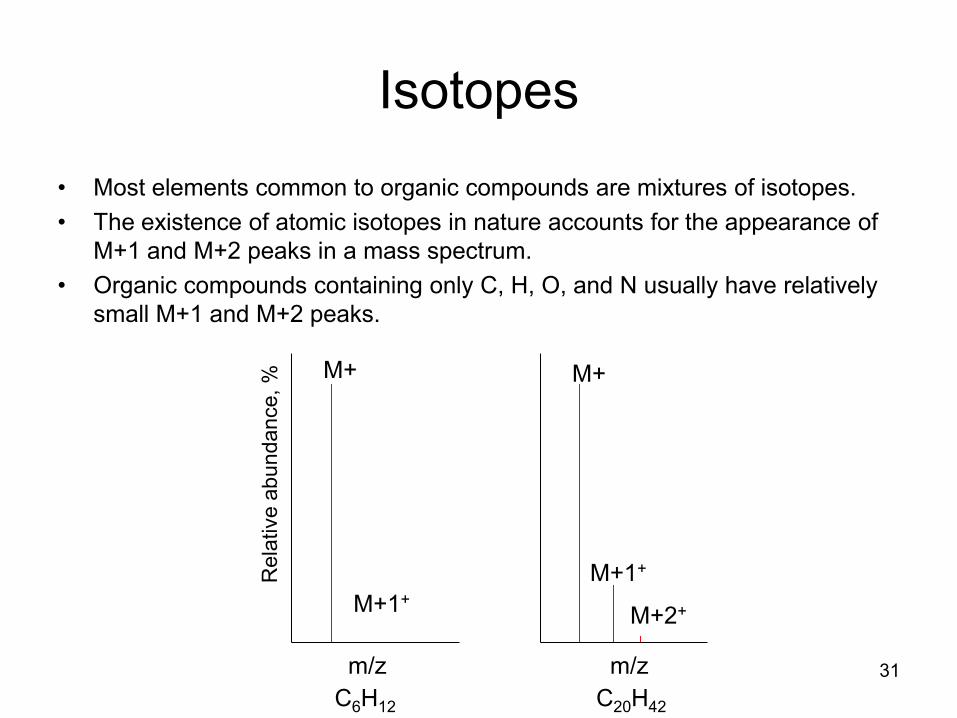
Isotopes
• Most elements common to organic compounds are mixtures of isotopes.
• The existence of atomic isotopes in nature accounts for the appearance of
M+1 and M+2 peaks in a mass spectrum.
• Organic compounds containing only C, H, O, and N usually have relatively
small M+1 and M+2 peaks.
C6H12
Rela
tive a
bundance, % M+
M+1+
m/z
M+
M+1+
M+2+
m/z
C20H42
32
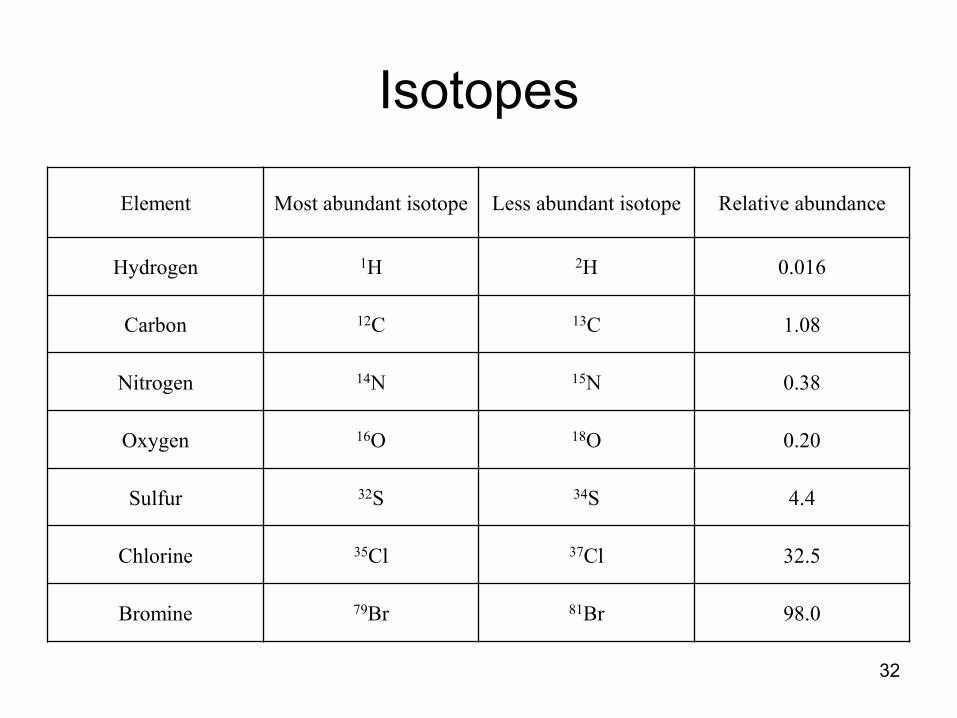
Isotopes
Element Most abundant isotope Less abundant isotope Relative abundance
Hydrogen 1H 2H 0.016
Carbon 12C 13C 1.08
Nitrogen 14N 15N 0.38
Oxygen 16O 18O 0.20
Sulfur 32S 34S 4.4
Chlorine 35Cl 37Cl 32.5
Bromine 79Br 81Br 98.0
33
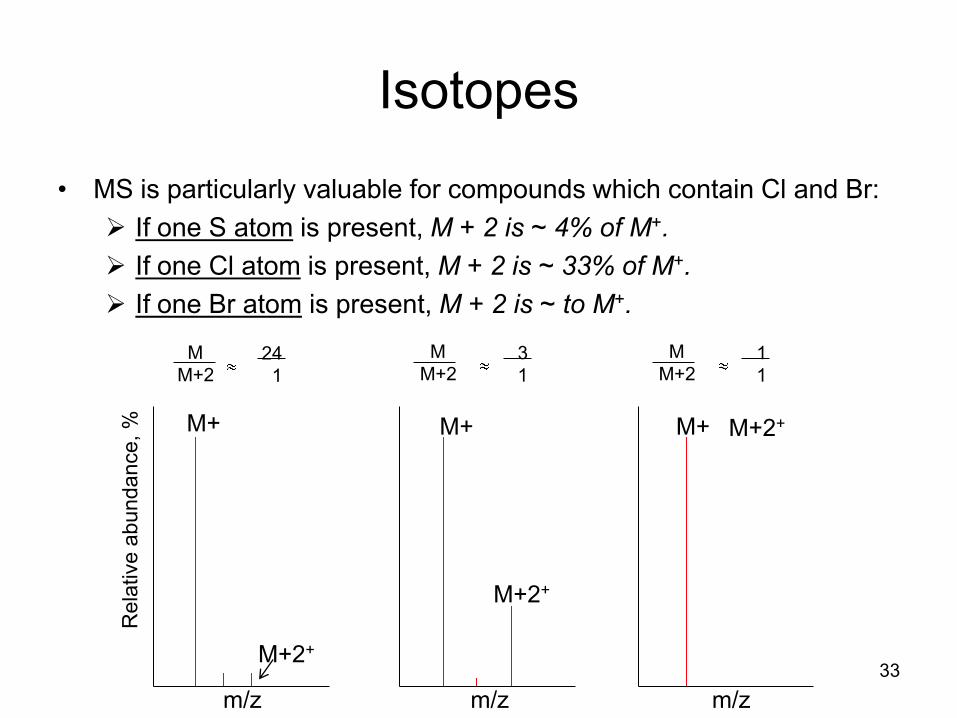
Isotopes
• MS is particularly valuable for compounds which contain Cl and Br:
If one S atom is present, M + 2 is ~ 4% of M+.
If one Cl atom is present, M + 2 is ~ 33% of M+.
If one Br atom is present, M + 2 is ~ to M+.
m/z
Rela
tive a
bundance, % M+
M+2+
M
M+224
1
M
M+23
1
M
M+21
1
M+
M+2+
M+ M+2+
m/z m/z
34
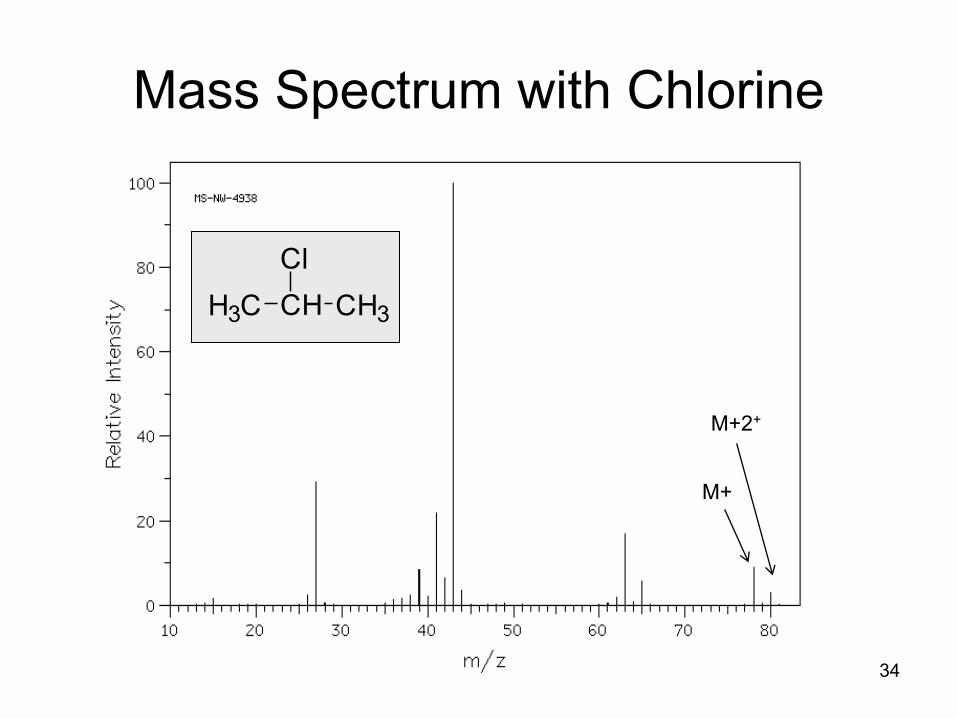
Mass Spectrum with Chlorine
M+
M+2+
CHH3C CH3
Cl
35
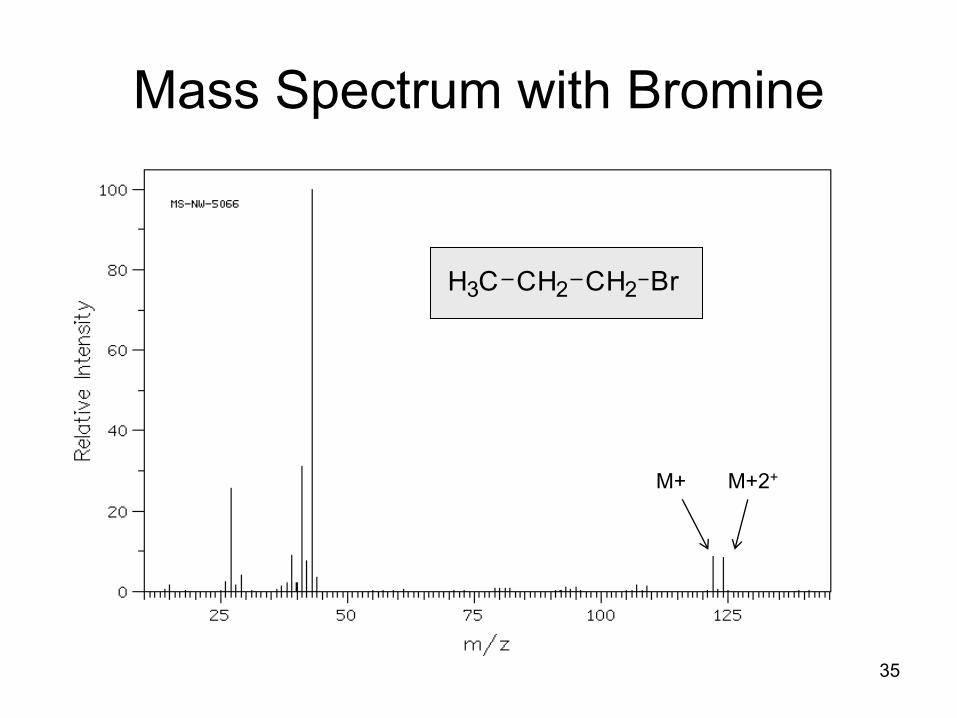
Mass Spectrum with Bromine
M+ M+2+
CH2H3C CH2 Br
36
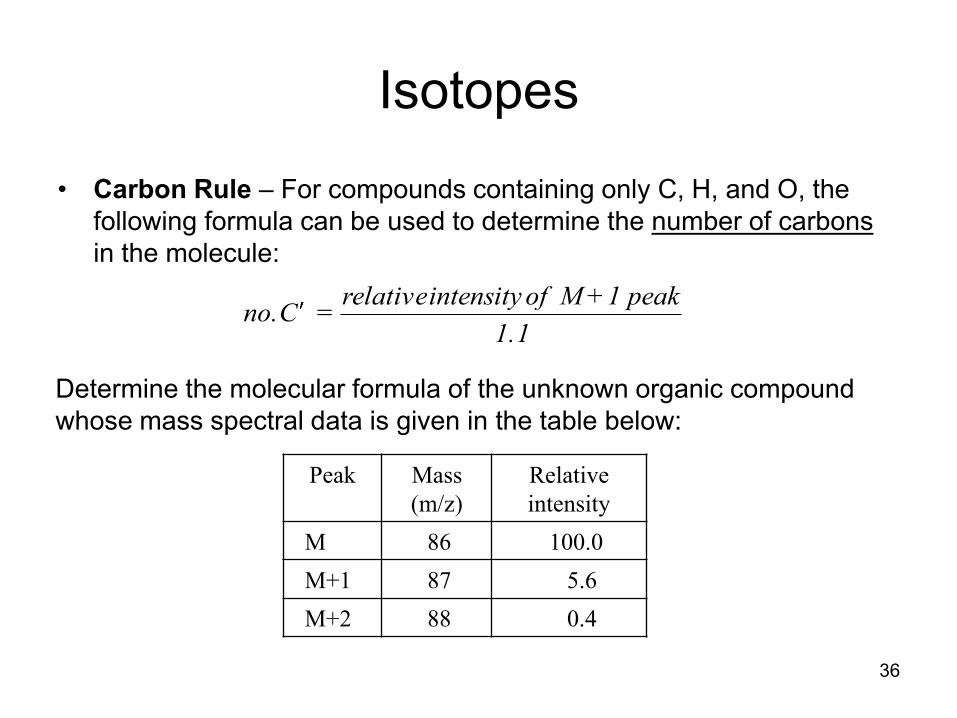
Isotopes
• Carbon Rule – For compounds containing only C, H, and O, the
following formula can be used to determine the number of carbons
in the molecule:
1.1
peak 1+ Mofintensity relative = sC no.
Determine the molecular formula of the unknown organic compound
whose mass spectral data is given in the table below:
Peak Mass
(m/z)
Relative
intensity
M 86 100.0
M+1 87 5.6
M+2 88 0.4
37
Isotopes
• Nitrogen Rule: if a compound has:
– An odd number of nitrogen atoms, its molecular ion, M+, will be
odd.
– Zero or an even number of nitrogen atoms, its molecular ion, M+,
will be even.
38
Resolution
• Resolution: a measure of how well a mass spectrometer separates
ions of different mass.
Low resolution – capable of distinguishing among ions of different
nominal mass, i.e. different by at least one or more amu.
High resolution – capable of distinguishing among ions that differ in
mass by as little as 0.0001 amu.
• For example: CO, N2, and ethene all have a nominal mass of 28
amu. High resolution MS can distinguish these molecules.
CO 27.9949 amu
N2 28.0061 amu
CH2=CH2 28.0314 amu

39
Fragmentation Pathways
• Structural information is available from analysis of fragments formed
by bond cleavages in the molecular ion, M+.
• In general, the molecular ion, M+, will fragment so as to form the
most stable cationic fragment (usually a carbocation).
• In some cases, the M+ peak is very small or absent. Occurs if the
fragments are considerably more stable M+.
40
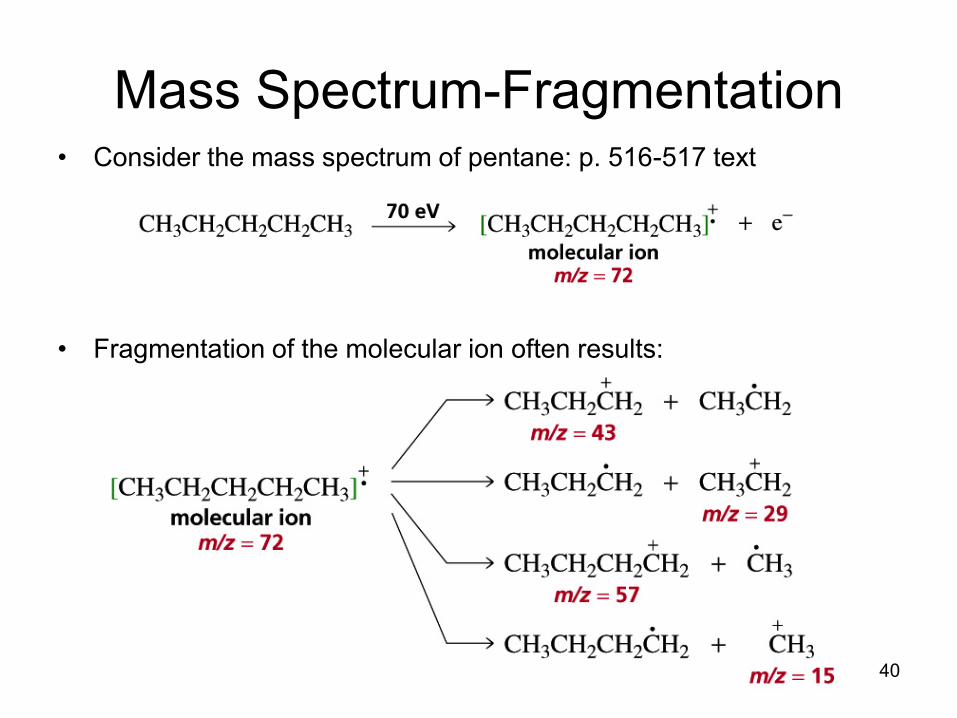
Mass Spectrum-Fragmentation• Consider the mass spectrum of pentane: p. 516-517 text
• Fragmentation of the molecular ion often results:
41
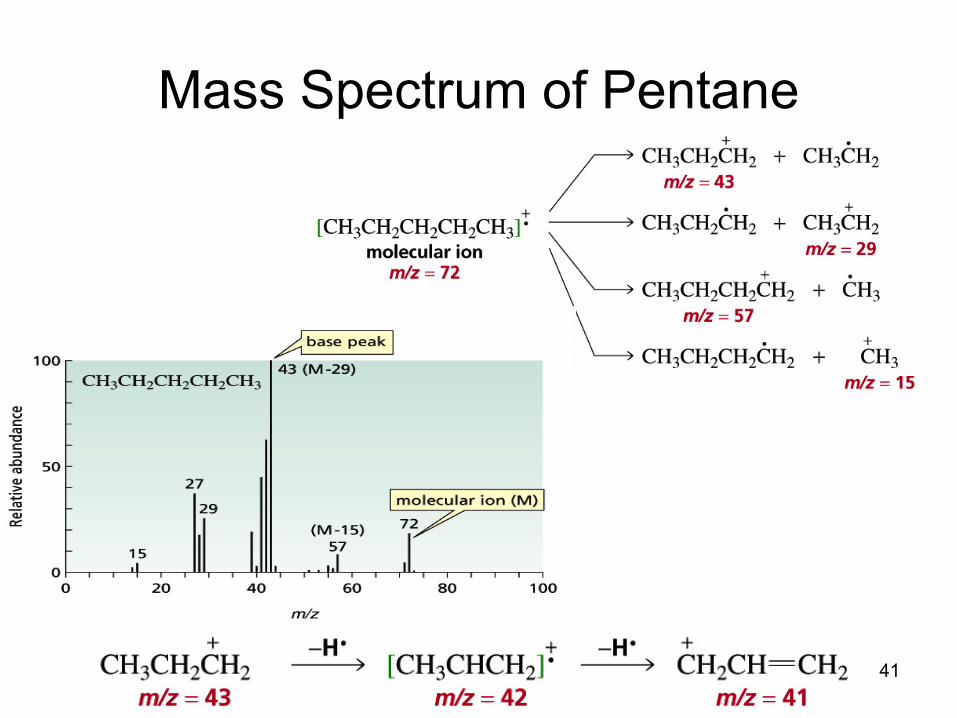
Mass Spectrum of Pentane
42
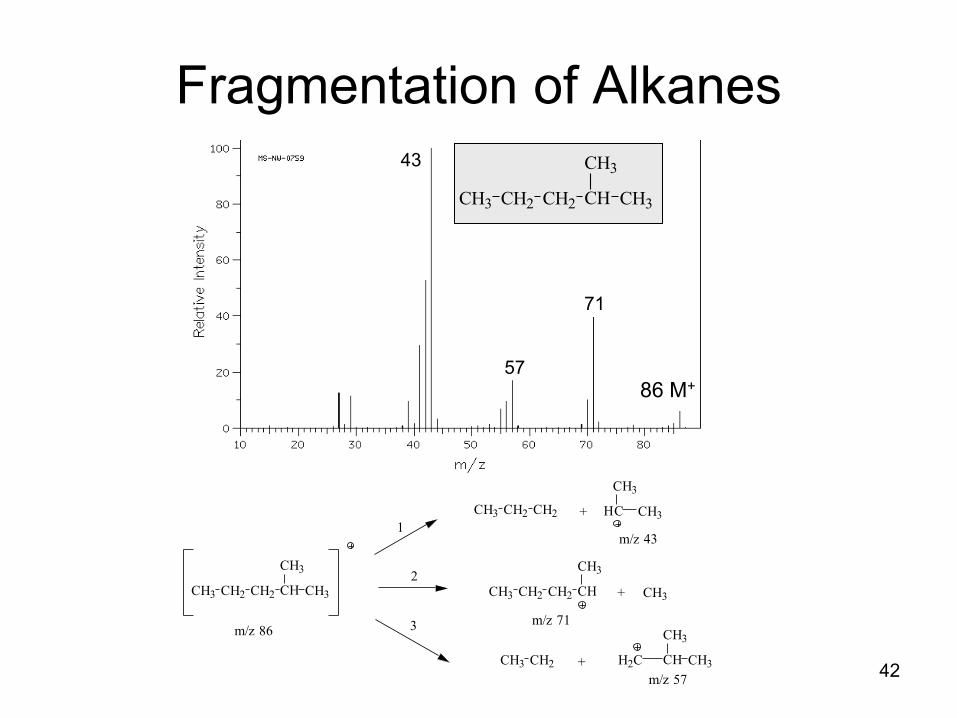
Fragmentation of Alkanes
CH3CHCH2CH2CH3
CH3
CH2CH2CH3 CH3HC
CH3
+
CHCH2CH2CH3
CH3
+ CH3
CH2CH3 + CH3CHH2C
CH3
1
2
3m/z 86
m/z 43
m/z 71
m/z 57
86 M+
71
57
CH3CHCH2CH2CH3
CH343
43
Compounds with Heteroatoms
• Molecules containing O, N, halogens, or other heteroatoms often
undergo ___________ (adjacent to heteroatom).
• Driving force is resonance stabilized cations.
44
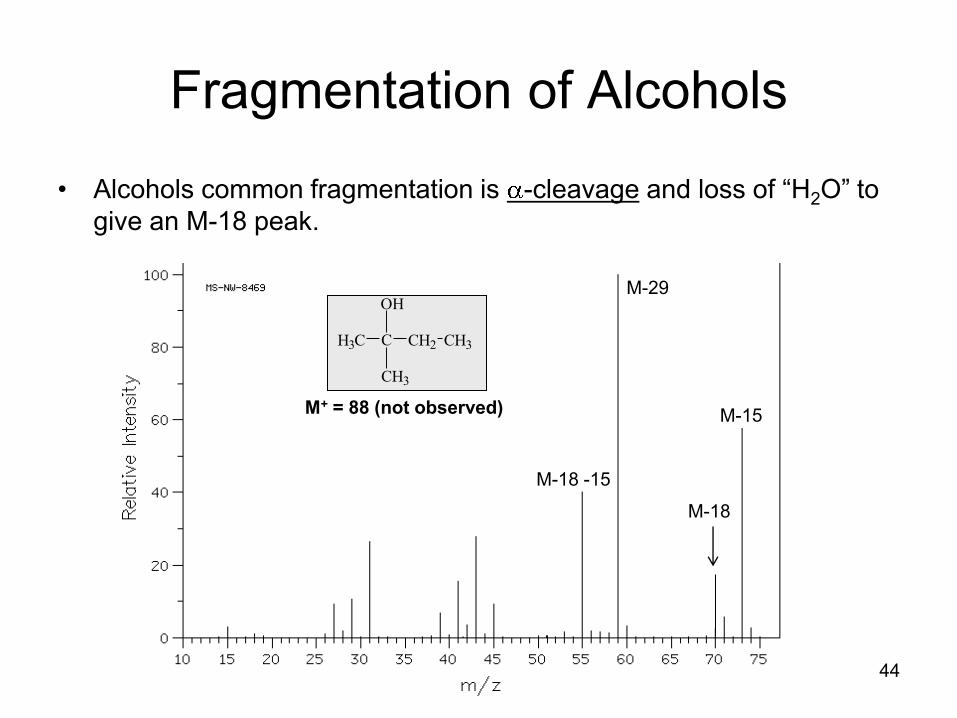
Fragmentation of Alcohols
• Alcohols common fragmentation is -cleavage and loss of “H2O” to
give an M-18 peak.
M+ = 88 (not observed) M-15
M-18
M-29
M-18 -15
C
OH
H3C CH2 CH3
CH3
45
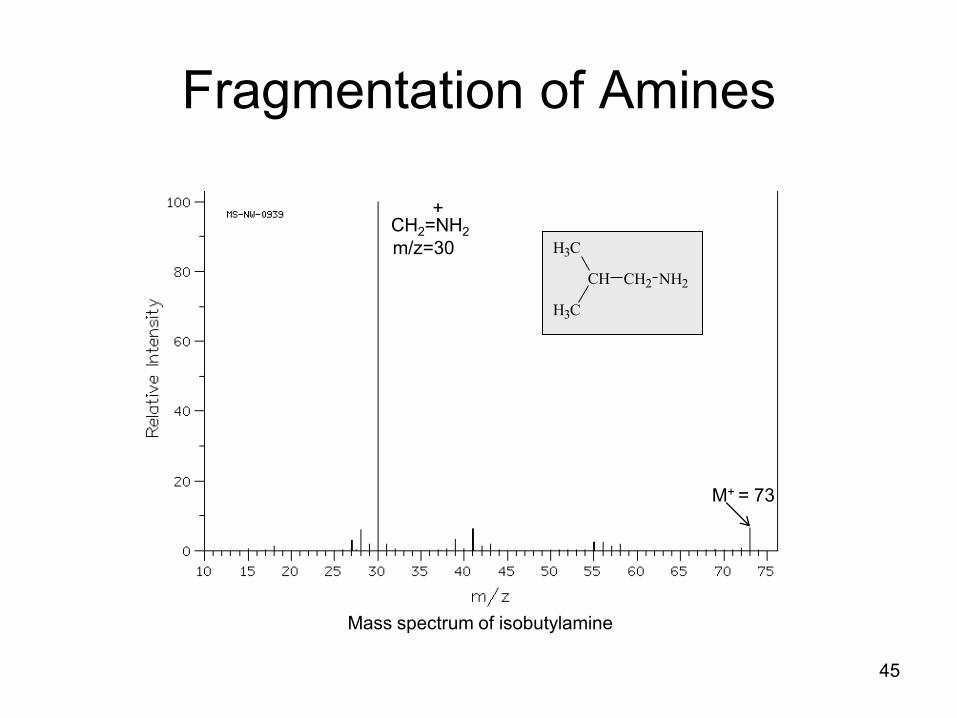
Fragmentation of Amines
Mass spectrum of isobutylamine
M+ = 73
CH2=NH2
+
m/z=30
NH2CH2CH
H3C
H3C
46
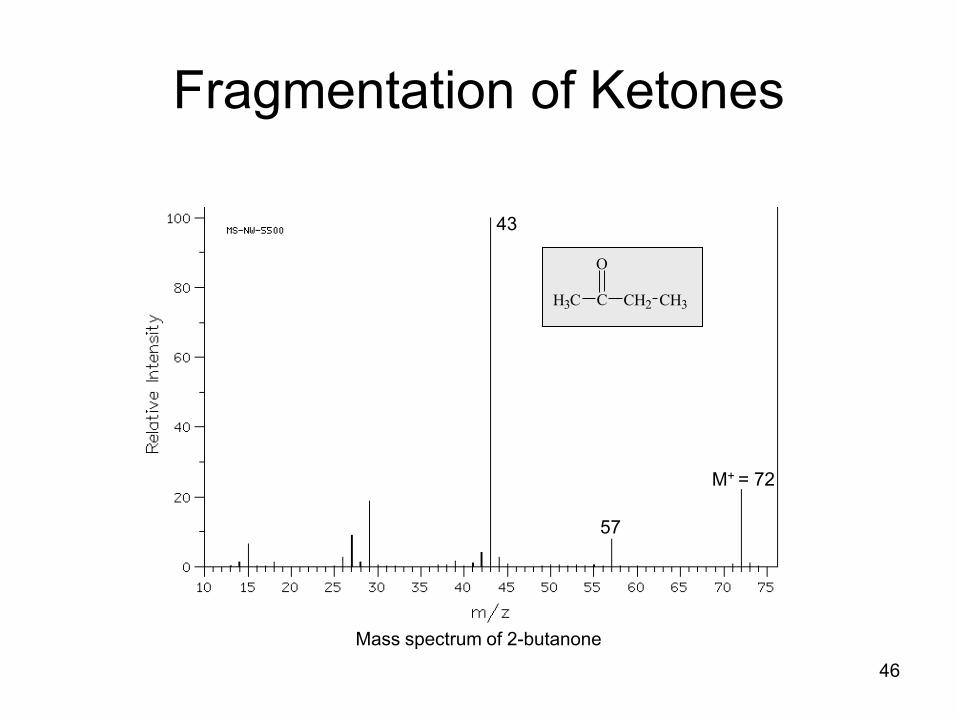
Fragmentation of Ketones
Mass spectrum of 2-butanone
M+ = 72
57
43
C
O
H3C CH2 CH3
47
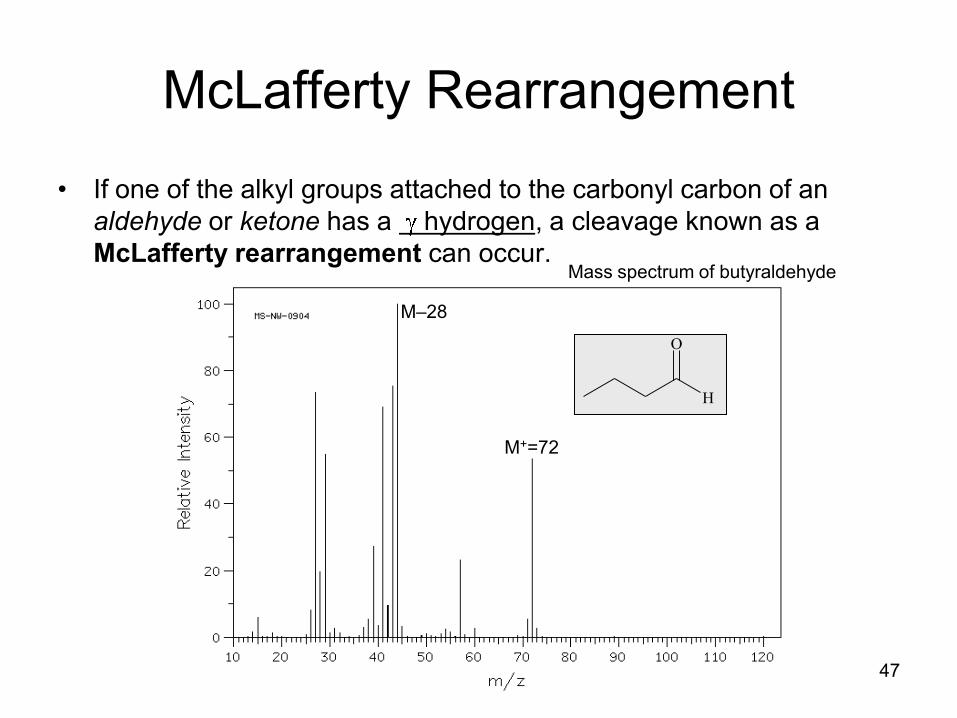
McLafferty Rearrangement
• If one of the alkyl groups attached to the carbonyl carbon of an
aldehyde or ketone has a hydrogen, a cleavage known as a
McLafferty rearrangement can occur.Mass spectrum of butyraldehyde
M+=72
M–28
O
H
48
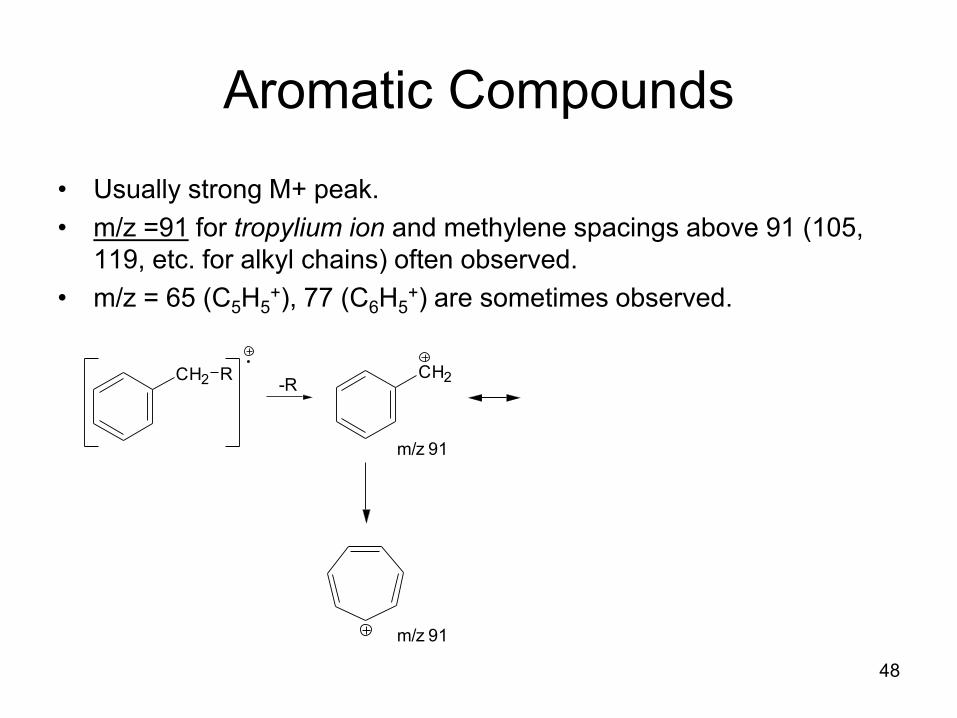
Aromatic Compounds
• Usually strong M+ peak.
• m/z =91 for tropylium ion and methylene spacings above 91 (105,
119, etc. for alkyl chains) often observed.
• m/z = 65 (C5H5+), 77 (C6H5
+) are sometimes observed.
-R
m/z 91
CH2 R CH2
m/z 91
49
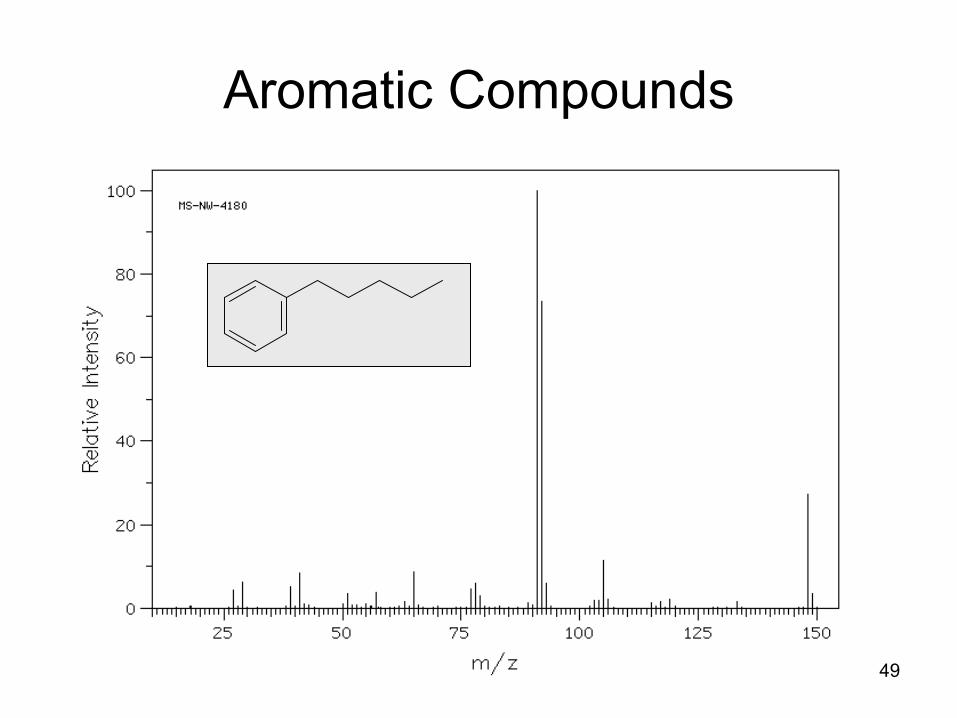
Aromatic Compounds
50
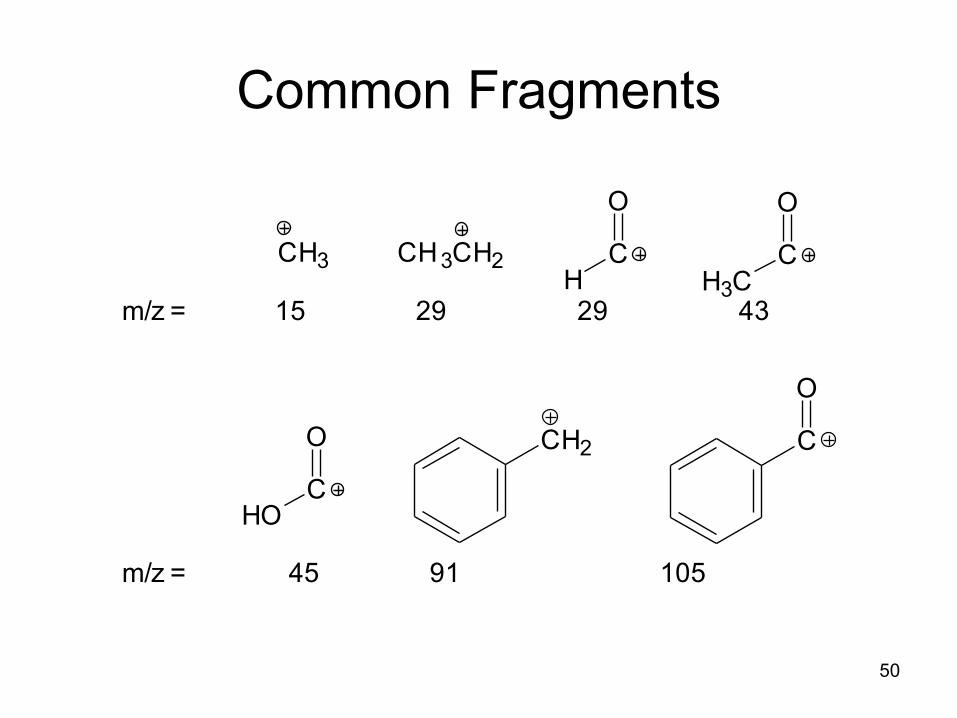
Common Fragments
CH2
CH3 CH3CH2
O
CH
O
CH3C
O
CHO
C
O
m/z = 15 29 29 43
m/z = 45 91 105


![1H & 13C NMR Spectroscopy answers · 1H and 13C NMR Spectroscopy Answwers 1 (c) Each structure can represent a pair of cis/Z and trans/E isomers OR Optical isomers 1 [5] M7.(a) (i)](https://img.dokumen.tips/doc/110x75/5eda28dab3745412b570dedf/1h-13c-nmr-spectroscopy-answers-1h-and-13c-nmr-spectroscopy-answwers-1-c.jpg)