Embed Size (px)
Citation preview

STATUS OF HIGH RESOLUTION SOLAR IRRADIANCE MAPPING FROM SATELLITE DATA
Richard Perez & Marek Kmiecik ASRC, The University at Albany
251 Fuller Rd Albany, NY 12203
Kathleen Moore Integrated Environmental Data
Suite 298, 255 Fuller Rd. Albany, NY 12203 [email protected]
Steve Wilcox, Ray George, & David Renné
NREL, 1617 Cole Blvd. Golden, CO 80841
Frank Vignola Solar Energy Laboratory
University of Oregon Eugene, OR 97403
Pierre Ineichen CUEPE
University of Geneva Geneva, Switzerland
ABSTRACT This paper presents examples of high resolution solar radiation maps generated from satellite data using the semi-empirical model previously developed by the authors. The paper includes a multi-climatic performance validation of the model in its latest operational configuration and discusses its eventual utilization in the preparation of the latest US National Solar Radiation Data Base. 1. RECAP ON MODELING METHODOLOGY This semi-empirical model producing global Irradiance (GHI) and direct irradiance (DNI) from geostationary satellite images (visible channel) has been described in detail in two previous articles [1,2]. This model is an evolution of the Heliosat-1 methodology [3] based upon the observation that earth’s radiance, as seen from space, is ~ proportional to cloud transmissivity, hence to the amount of solar radiation reaching the ground [4]. The model consists of two main parts: (1) the determination of a cloud index from the satellite image; and (2) the use this factor to modulate global and direct clear sky radiation envelopes. The cloud index determination is individualized for each ground (pixel) location. It is determined from the location-specific relative normalized pixel brightness -- i.e., the
brightness of a pixel in relation to its maximum and minimum possible value, the latter representing clear conditions (brightness of ground) and the former representing cloudy conditions (brightness of thick cloud top). Because it is individualized for each pixel, this process accounts for ground reflectivity differences over space and time and does not require an absolute knowledge of satellite sensors calibration. The model also accounts for site-specific ground bi-directional (specular) reflectance characteristics and for snow cover when present [1, 2] The clear sky envelopes [5] represent the upper limit of irradiances generated by the model. These envelopes are a function of ground elevation and of atmospheric turbidity as quantified by atmospheric precipitable water (W) and by atmospheric optical depth (AOD). In its operational version, the model uses monthly site/specific climatological estimates of W and broad-band AOD traceable to [6, 7, 8] The model was recently modified to enhance its performance in complex terrains, via a systematic internal calibration of its output to modeled clear sky profiles [2] 2. VALIDATIONS Extensive validations were previously reported [1]. In this paper we present a summary of a new set of validations for sites in more extreme climatic regions (Table 1) where solar resource assessment projects are currently underway [9,10,11] and where model performance limits may be
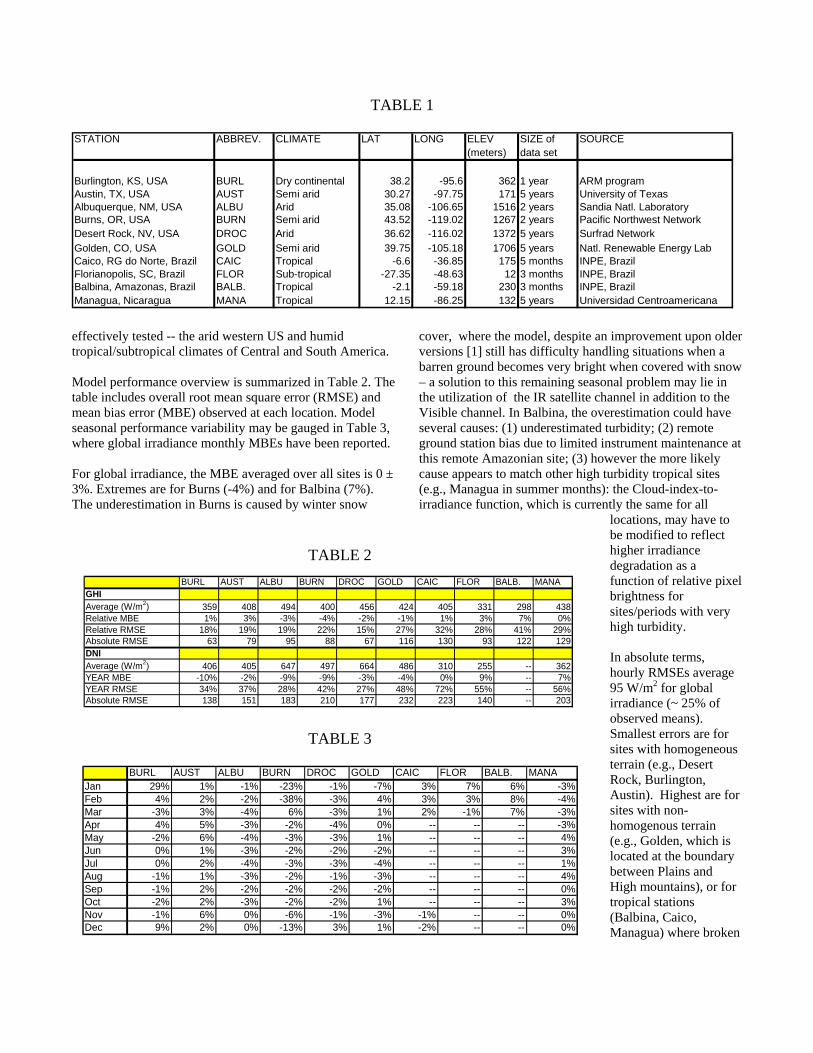
TABLE 1 STATION ABBREV. CLIMATE LAT LONG ELEV SIZE of SOURCE
(meters) data set
Burlington, KS, USA BURL Dry continental 38.2 -95.6 362 1 year ARM programAustin, TX, USA AUST Semi arid 30.27 -97.75 171 5 years University of Texas Albuquerque, NM, USA ALBU Arid 35.08 -106.65 1516 2 years Sandia Natl. LaboratoryBurns, OR, USA BURN Semi arid 43.52 -119.02 1267 2 years Pacific Northwest NetworkDesert Rock, NV, USA DROC Arid 36.62 -116.02 1372 5 years Surfrad NetworkGolden, CO, USA GOLD Semi arid 39.75 -105.18 1706 5 years Natl. Renewable Energy LabCaico, RG do Norte, Brazil CAIC Tropical -6.6 -36.85 175 5 months INPE, BrazilFlorianopolis, SC, Brazil FLOR Sub-tropical -27.35 -48.63 12 3 months INPE, BrazilBalbina, Amazonas, Brazil BALB. Tropical -2.1 -59.18 230 3 months INPE, BrazilManagua, Nicaragua MANA Tropical 12.15 -86.25 132 5 years Universidad Centroamericana
effectively tested -- the arid western US and humid tropical/subtropical climates of Central and South America. Model performance overview is summarized in Table 2. The table includes overall root mean square error (RMSE) and mean bias error (MBE) observed at each location. Model seasonal performance variability may be gauged in Table 3, where global irradiance monthly MBEs have been reported. For global irradiance, the MBE averaged over all sites is 0 ± 3%. Extremes are for Burns (-4%) and for Balbina (7%). The underestimation in Burns is caused by winter snow
cover, where the model, despite an improvement upon older versions [1] still has difficulty handling situations when a barren ground becomes very bright when covered with snow – a solution to this remaining seasonal problem may lie in the utilization of the IR satellite channel in addition to the Visible channel. In Balbina, the overestimation could have several causes: (1) underestimated turbidity; (2) remote ground station bias due to limited instrument maintenance at this remote Amazonian site; (3) however the more likely cause appears to match other high turbidity tropical sites (e.g., Managua in summer months): the Cloud-index-to-irradiance function, which is currently the same for all
locations, may have to be modified to reflect higher irradiance degradation as a function of relative pixel brightness for sites/periods with very high turbidity.
TABLE 2
TABLE 3
BURL AUST ALBU BURN DROC GOLD CAIC FLOR BALB. MANAGHI
verage (W/m2) 359 408 494 400 456 424 405 331 298 438elative MBE 1% 3% -3% -4% -2% -1% 1% 3% 7% 0%
ative RMSE 18% 19% 19% 22% 15% 27% 32% 28% 41% 29%bsolute RMSE 63 79 95 88 67 116 130 93 122 129
verage (W/m2) 406 405 647 497 664 486 310 255 -- 362EAR MBE -10% -2% -9% -9% -3% -4% 0% 9% -- 7%EAR RMSE 34% 37% 28% 42% 27% 48% 72% 55% -- 56%bsolute RMSE 138 151 183 210 177 232 223 140 -- 203
ARRelADNIAYYA
In absolute terms, hourly RMSEs average 95 W/m2 for global irradiance (~ 25% of observed means). Smallest errors are for sites with homogeneous terrain (e.g., Desert Rock, Burlington, Austin). Highest are for sites with non-homogenous terrain (e.g., Golden, which is located at the boundary between Plains and High mountains), or for tropical stations (Balbina, Caico, Managua) where broken
BURL AUST ALBU BURN DROC GOLD CAIC FLOR BALB. MANAJan 29% 1% -1% -23% -1% -7% 3% 7% 6% -3%Feb 4% 2% -2% -38% -3% 4% 3% 3% 8% -4Mar -3% 3% -4% 6% -3% 1% 2% -1% 7% -3%Apr 4% 5% -3% -2% -4% 0% -- -- -- -3%May -2% 6% -4% -3% -3% 1% -- -- -- 4%Jun 0% 1% -3% -2% -2% -2% -- -- -- 3%Jul 0% 2% -4% -3% -3% -4% -- -- -- 1%Aug -1% 1% -3% -2% -1% -3% -- -- -- 4%Sep -1% 2% -2% -2% -2% -2% -- -- -- 0%Oct -2% 2% -3% -2% -2% 1% -- -- -- 3%Nov -1% 6% 0% -6% -1% -3% -1% -- -- 0%Dec 9% 2% 0% -13% 3% 1% -2% -- -- 0
%
%

cloud formations are very common and produce larger apparent short term errors. For direct irradiance, the average MBE for all sites is -2% ± 7%. The bias tendencies are similar to those observed for global but are intensified for this component. Absolute RMSE for direct averages 180 W/m2. These results are consistent with past validations in less extreme climatic environments [1]. As such, they confirm
that the satellite constitutes the most accurate source of site/time specific hourly surface irradiances for all points beyond 20-25 km of a measurement station. In Figure 1, we present a graphical evaluation of model performance for daily total irradiance estimation, focusing on two extreme climatic locations where a large sample of ground data was available – Desert Rock (arid) and Managua (tropical). These graphical summaries include scatter plots between observed and modeled values as well as comparative frequency distributions. This figure reveals modeling limitations and possible modeling improvement opportunities. Whereas overall bias is acceptable
and reflects the capability of the model to account for site-specific climatic conditions, the frequency distribution reveal that the model falls short at the very high end in the tropical case. The parameter that controls model-ground consistency at the upper end of the distribution is AOD. However, increasing turbidity has a price on the overall bias. It would appear that an effective solution would, as mentioned above, lie in adjusting the cloud-index function in relation to prevailing turbidity so as to reflect a more
Fig. 1: Daily GHI and DNI prediction performance summary for Managua and Desert Rock, including scatter plots (left) cumulative probability distributions (center) and frequency distributions (right)
MANAGUA GHI
MANAGUA DNI
DESERT ROCK GHI
DESERT ROCK DNI
o Modeledx Measured o Modeledx Measured
o Modeledx Measured o Modeledx Measured
o Modeledx Measured o Modeledx Measured
o Modeledx Measured o Modeledx Measured

Fig. 2: Sample DNI map for the US Pacific Northwest region
pronounced impact of observed cloud index on overall transmissivity as local AOD increases. 3. APPLICATION EXAMPLES High resolution maps: we provide three mapping application examples that exploit the main strengths of the model: (1) small bias and (2) access to a high resolution (10 km) geostationary satellite archive, hence an ability to account for site-specific average resource and to delineate micro-climatic differences. In Figure 2 we show an example of a direct irradiance map of the Northwestern US. This map is part of a comprehensive solar resource facility developed at the University of Oregon [11]. Note the strong rain shadow effects of, the Cascades and other mountain ranges (e.g., the Olympic Mountains). In Figure 3, we show an example of direct seasonal irradiance maps of the Southwestern US prepared for NREL [10]. Note the effect of the summer monsoon that tends to degrade solar resource in northern Mexico, New Mexico and Arizona, leaving the Mojave desert of California-Nevada as the most consistent year-around region for direct irradiance availability. In Figure 4, we show an example of direct irradiance in Central America, prepared for the UNEP SWERA program [9]. The map shows a very pronounced gradient from the Atlantic to the Pacific side of the region, along with micro-regions of intensified resource (e.g., the rain-shadow enhancement in the high valley of Huehuetenango in Central-west Guatemala).
The data prepared for each of the above programs is or will shortly be available via internet at each of the referenced institutions [9, 10, 11] Application to NSRDB: The process of preparing a new National Solar Resource Data Base for the US is described by some of the authors and colleagues in a separate paper [13]. This process will attempt to take advantage of the strengths of the current satellite model and of its 7 year archive assembled so far for the North American continent. As shown in this paper, the main strength of the approach resides in a capability to delineate microclimatic structures. Some questions remain on other aspects of its accuracy in relation to other methodologies being considered for the update. These issues will be addressed in the first phase of NSRDB preparation which will involve systematic cross-methodology validation at multiple locations [].

Fig. 3: Example of seasonal DNI for the Southwestern USA
10
0
5
10
0
5WINTER SPRING
SUMMER FALL
Dai
ly to
tal (
kWh
/ m2
/ day
)D
aily
tota
l (kW
h / m
2 / d
ay)
10
0
5
10
0
5WINTER SPRING
SUMMER FALL
Dai
ly to
tal (
kWh
/ m2
/ day
)D
aily
tota
l (kW
h / m
2 / d
ay)
4. ACKNOWLEDGEMENT This paper is a by-product of research and development efforts funded by the USDOE via University of Oregon (280111A), NREL (DE-AC36-99GO10337) and UNEP (SWERA GF/2721-01-4378). Many thanks to Dr. J. Lopez de la Fuente s.j., for making the Managua data recorded at the University of Central America available to this analysis. Many thanks to Ing. Marta Rivera for facilitating validations in Central America. Many thanks to Dr. Enio Pereira and the SWEA team at INPE for producing the ground truth data in Brazil. 5. REFERENCE (1) Perez R., P. Ineichen, K. Moore, M. Kmiecik, C. Chain, R. George and F. Vignola, (2002): A New Operational
Satellite-to-Irradiance Model. Solar Energy 73, 5, pp. 307-317 (2) Perez R., P. Ineichen, M. Kmiecik, K. Moore, R. George and D. Renné, (2003): Producing satellite-derived irradiances in complex arid terrain. Proc. ASES Annual Meeting, Austin, TX (solar energy – in press) (3) Cano, D., J.M. Monget, M. Aubuisson, H. Guillard, N. Regas and L. Wald, (1986): A Method for the Determination of Global Solar Radiation from Meteorological Satellite Data. Solar Energy 37, pp. 31-39 (4) Schmetz J. (1989): Towards a Surface Radiation Climatology: Retrieval of Downward Irradiances from Satellites, Atmospheric Research, 23, 287-321
(5) Bird Clear sky model as adapted by Maxwell E. L. (1998): METSTAT – The solar radiation model used in the production of the National Solar Radiation Data Base (NSRDB) Solar Energy 62, 263-279

(6) Randal D. L, T. Vonder Haar, M. Ringerud, G. Stephens, T. Greenwald and C. Combs, (1996): A new global water vapor dataset. Bulletin of the AMS (BAMS) - June, 1996 Vol. 77, No 6 (7) Mishchenko M. et al., Aerosol retrievals over ocean using channel 1 and 2 AVHRR data. Appl. Opt., 38, 7325-7341, 1999 (8) Yu H., et al., Annual cycle of global distributions of aerosol optical depth from integration of MODIS retrievals and GOCART model simulations. J. Geophysics. Res., 108D, 4128
Fig. 4: Example of high resolution yearly DNI map for Central America
7.5
6.0
4.5
7.5
6.0
4.5
Dai
ly to
tal (
kWh
/ m2
/ day
)D
aily
tota
l (kW
h / m
2 / d
ay)
(9) Solar and Wind Energy Resource Assessment Program (2000-2005): http://swera.unep.net/ The SWERA Project is cofinanced by a grant from the Global Environment Facility 6.8 M$ and is being managed by Tom Hamlin, Division of Technology Industry and Economics, United Nations Environment Programme, Paris, France. (10) George R. and Wilcox S. (2004): Personal Communication -- National Renewable Energy Laboratory (2004): http://www.nrel.gov/
(11) University of Oregon Solar Monitoring Lab (2004): http://solardata.uoregon.edu (12) E. Maxwell, W. Marion, D. R. Myers, M. Rymes and S. Wilcox, (1995): The National Solar Radiation Data base, NREL/TP-463-5784 (1994), NREL, Golden, CO http://www.rredc.nrel.gov/solar/old_data/nsrdb (13) Wilcox, S. M., Anderberg, M., Beckman, W., DeGaetano, A., George, R., Gueymard, C., Marion, W., Myers, D., Perez, R., Plantico, M., Renné, D., Stackhouse, P., Vignola, F. (2004): Progress on an Updated National Solar Radiation Data Base. Proc. ASES Annual Conference, Portland Oregon.