Embed Size (px)
Citation preview

FINAL REPORT
FOR cCORY
HIGH RESOLUTION FOURIER TRANSFORM SPECTROMETER
MODEL 296
SERIAL NO. 091002
PREPARED FOR
NASA Manned Spacecraft CenterSpace Sciences Procurement Branch
Houston, Texas 77058
Under
Contract No. NAS-9-9807
September 1971
Block. Engineering, Inc.CAMBRIDGE 39, MASSACHUSETTS
FINAL REPORT
INSTRUCTION MANUAL
OPERATION AND MAINTENANCE PROCEDURES
ELECTRONIC SCHEMATICS
MODEL 296
CRYOGENIC INTERFEROMETER SPECTROMETER
SERIAL NO. 091002
Prepared for
NASA Manned Spacecraft CenterSpace Sciences Procurement Branch
Houston, Texas 77058
Under
Contract No. NAS-9-9807
September 1971
Block Engineering, Inc.CAMBRIDGE 39, MASSACHUSETTS

INTRODUCTION
This manual describes a Michelson interferometer
spectrometer which has been fabricated by Block Engineering,
Inc.; Cambridge, Mass., for NASA Manned Spacecraft Center,
Space Sciences Procurement Branch, Houston, Texas under
contract No. NAS9-9807. The interferometer spectrometer is
a modified Block Engineering Model 296 capable of 0.5 cm
resolution over the spectral region of 5-15 microns con-
figured for operation with the optical head at a temperature
of approximately 80°K. The spectrometer consists of two
separable units: the electronic controller and the optical
head. The electronics controller contains the main electronic
components: low voltage power supplies and regulators for the
amplifiers and logic circuitry, high voltage power supplies
for the reference laser and piezo-electric crystal adjust-
able mirror mount, constant velocity servo system for the
mechanical transducer, associated electronic components for
signal processing and conditioning, and various pressure
monitoring and regulating subsystems. The optical head
which is cooled to~80°K contains the Michelson interferometer
and integral transducer and referencing system,, the optical
system, detector, cryogen storage compartments and pressure
sense and regulation devices. The detector used is mercury
doped germanium (Ge:Hg) at a temperature of~4°K by means of
liquid helium. Unique features of this instrument are the
optical head operating temperature of.80°K, use of antireflection
coated germanium as the beamsplitter and the use of the cry-
ogen boiloff as the source of gas for the pneumatic transducer
bearing.

TABLE OF CONTENTS
Section . Page
Section I - General
1.1 Equipment Supplied 1
1.2 Inspection 1
1.3 Claim for Damage in Shipping 1
1.4 Return for Repair Instructions 2
Section II - Theory of Operation
2.1 Ideal Interferometer 3
2.2 Non-Ideal Interferometer 8
2.3 Complimentarity of Outputs/IdealInterferometer 8
2.4 Complimentarity: Consequences andApplications 14
2.5 Resolution and Obliquity Limit 18
Section III - Instrument Description
3.1 Basic Interferometer 20
3.1.1 Signal or Main Interferometer 20
3.1.2 Bearing and Transducer Assembly 22
3.1.3 Reference Interferometer Assembly 22
3.1.4 Typical Waveforms . 23
3.1.5 Bearing Feed and Regulator System 23
3.1.6 Window Assembly 26
3.1.7 Dewar Modification 26
3.2 Optical System . . . . . . 28
3.3 Electronic Circuits . 31
3.3.1 Reference and Synchronization Circuits ... 31
3.3.2 Constant Velocity Servo and Drive 33
3.3.3 Signal Channel 35

Section Page
3.3.4 Power Supplies 36
3.3.4.1 Bias Supply 36
3.3.5 Auxiliary Circuits 36
3.3.5.1 Level Sense 36
3.3.5.2 Heater Control 37
3.3.5.3 Temperature Monitors 38
3.3.5.4 Peak Reading Meter & Monitor Switch ... 38
3.3.6 Remote Control 41
Section IV - Control Functions and SpectrometerOutputs
4.0 General . 42
4.1 Front Panel Controls/Outputs 42
4.2 Rear Apron Controls/Outputs 45
4.3 Junction Box Controls/Outputs 46
Section V - Alignments and Adjustments
5.0 General 48
5.1 Reference Interferometer Alignment 48
5.2 Signal Interferometer Alignment 49
5.3 White Light Sheer 49
5.4 Monochromatic Preamplifier Offset 50
5.5 Monochromatic Preamplifier Gain 50
5.6 White Light Preamplifier Gain 51
5.7 Velocity Adjustment 51
Section VI - Operating and Maintenance Procedures
6.0 Preliminary Precautions » 52
6.1 General Comments 52
6.2 Controls and Their Functions 53

Section ,' Page
6.3 Purge Procedure . . ..X56
6.4 Fill Procedure . 56
6.5 Pressure Build-Up Procedure 57
6.6 Automatic Operation Procedure . . 57
6.7 Top-Off Procedure ..... .... 58
6.8 Dump Procedure 58
6.9 Warm-Up Procedure ... 59
6.10 Maintenance Procedures 60
6.10.1 Removal of Optical Head . . . . . . . . . . 60
6.10.2 Replacement of Nitrogen Line Filter .... 63
6.10.3 General Maintenance 64
Section VII - Electronic Schematics 6'5
Appendix A Detector Instruction Manual Al
Appendix B Tape Recording of Analog Outputs .... Bl
Appendix C Model DT-512 Playback Console Cl

LIST OF FIGURES
Figure Number Page
1 - Simplified Optical Diagram 4
2 - Typical White Light Interferogram 7
3 - White Light Interferogram withWavelength Dependent Zero Phase 10
4 - Phase Shifts Due to Reflectionfrom A Dielectric 13
5 - Optical Subtract Implementation 17
6 - Signal and Reference Interferometer 21
7 - Typical Waveforms 24
8 - Bearing Feed and Pressure RegulatorSystem 25
9 - Window Assembly 27
10 - Optical System Layout 29
11 - Optical System Parameters 30
12 - Cryogenic Interferometer Block Diagram 32
13 - Time Relationship of Sampling Signals 34
14 - Temperature Sensor Conversions 39
15 - Nominal Waveforms and Values 40

SPECIFICATIONS
Model 296/Cryogenic
Spectral Range
Beamsplitter Construction
Detector
Resolution
Wavelength Precision
Optical Retardation
Scan Velocity
Velocity Precision
Scan Time
Duty Cycle
Available Sampling Interval
Limiting Aperture (Interferometer)
Field of'View (Interferometer)
Limiting Aperture (Entrance)
Field of View (Entrance)
Optical Head Temperature
Cryogen Hold Time
Optical Head Size
Optical Head Weight
Control Unit Size
Control Unit Weight
Power Consumption
System Fusing
Detector Sensitivity Levels
Detector Output Levels
5-15 microns
Germanium with multi-layerantireflection coatings
Ge:Hg @~4°K
4, 2, 1, 0.5 cm
0.1 cm"
0.25, 0.5, 1.0, 2.0 cm
1.26 cm/sec (Nominal)
Better than 10%
2 sec/scan for 2 cm scan
> 80% for 2 cm scan
0.6328 microns x 1/2, 1,2, 4, 8, 16
Two inch diameter
2.56° full angle
0.72 inch diameter
7.2° full angle
~ 80°K
~ 8 hours
16 x 24 x 35
- 150 Ibs.
9 x 16 x 19
~ 20 Ibs.
200VA, 115V, 60Hz
3 AG, 3 amp
1, 3, 10, 30, 100
20 volts P-P
SECTION I
GENERAL
1.1 Equipment Supplied
The following equipment should be included in your shipment
1. Interferometer Controller
2. Optical Head
3. Detector
4. Interconnecting cables and accessories
1.2 Inspection
Carefully examine the shipment for possible damage in
transit. If any damage is observed/ refer to the instructions
below.
1.3 Claim for Damage in Shipping .
The instrument should be visually inspected and tested for
proper operation as soon as it is received. If it fails to op-
erate properly, or is damaged in any way, a claim should be
filed with the carrier. A full report of the damage should be
made out and forwarded to. Block Engineering, Inc. who will
then advise you of the disposition of the equipment and arrange
for repair or replacement. Include the model and serial
numbers in any correspondence regarding this instrument.
-1-

1.4 Return for Repair Instructions
If any fault develops, the following steps should be taken:
1. Notify Block Engineering, Inc., giving full details of
the difficulty; include model and serial numbers. Upon receipt
of this information, Block Engineering, Inc., will reply with
either service or shipping instructions. DO NOT return any
equipment without prior acknowledged notification.
2. If the instrument is to be returned to Block Engin-
eering, Inc., pack it in its original container or according to
the shipping instructions, and forward it prepaid to the address
given below. Unless otherwise instructed, arrange shipment via
air freight. If the original shipping container has been dis-
carded, the instrument should be packed in a strong exterior
container (preferably wood) and surrounded by at least two
inches of foam rubber or similar shock absorbing material.
3. Address shipping container as follows:
.Block Engineering, Inc.19 Blackstone StreetCambridge, Massachusetts 02139
-2-

SECTION II
THEORY OF OPERATION
2.1 Ideal Interferometer
Figure Number One is a simplified optical diagram of a
Michelson interferometer consisting of a fixed mirror (M ) , a
moving mirror (M_) and a beamsplitter (BS). For the purposes
of this discussion, the following assumptions are made.
The beamsplitter is assumed to be ideal, i.e., the beam-
splitter is lossless and divides any incident ray into a
reflected and transmitted ray of equal amplitude. It is assumed
that the beamsplitter is a dielectric material and that all
angles between input/output rays and the normal to the beam-
splitter surface are smaller than the polarizing angle. The
mirrors are assumed to be metallic and lossless. The dis-
cussion will proceed by considering the transmitted beam in
what is considered a normal configuration of the interfero-
meter (i.e., source and detector are on opposite sides of the
interferometer).
Ignoring all phase changes upon reflection consider a
parallel bundle of monochromatic light of intensity I entering
the interferometer at A and arriving at B having been divided
by beamsplitter and traversing the two different arms of the
interferometer.
The wavefront striking the beamsplitter from A can be
characterized by the equation
-3-

B
Figure Number One
Simplified Optical Diagram
Michelson Interferometer
MlM2BS
A
B
Fixed Mirror
Moving Mirror
Beamsplitter
Input
Output
P ,T
x-L/2
x0/2
uIIIV
B
Obliquity Angle
Beam Intensity at A
Beam Intensity at B
Beam Intensity at C
Optical Frequency (cm-1,
Beamsplitter Reflection Coefficient
Beamsplitter Transmission Coefficient
Beamsplitter to Mirror M, Distance (cm)
Beamsplitter to Mirror M« Distance (cm)
-4-

Thus the beams arriving at B from the arms containing M, and
M_ respectively are:
/= - 2IIj (wt-x, v)/I • p • T e J 1
and
The sum at B can be expressed as
/IT e2njwt = /IFF [e2llj (wt-xi^ +B
The action of the detector has the effect of eliminating the
time dependence of the above equation through the intermediate
relationship
o
which reduces to
In = Ipt [ 2 + 2 cos 211 (x0-x, ) v]o Z J.
when multiplied by the complex conjugate.
Under the assumption of an ideal beamsplitter where p=T=0.5
!_, = 0.51 [1 + cos 2II(x0-x,)v]o 2 J.
The quantity X2~xl ^s referred to as the optical retardation
and is defined as B so that
Iu = 0.51 [1 + cos 2HBv] (1)D
If the interferometer mirror is moved at constant velocity
defined by B/T then the quantity I_ becomes
Ifi(t) = 0.51 [1 + cosE2 t] (2)
-5-

Thus for a monochromatic input, the intensity of the output
at B will be the summation of a D.C. level corresponding to
0.51 and a cosinusoidally varying signal of amplitude 0.51 andBvfrequency •?=— . Since the D.C. component contains no spectral
information it is generally ignored. The A.C. portion of the
signal contains both intensity and wavelength information so
that is alone is necessary for recording of the spectrum.
For the case of a monochromatic input the interferometer simply
produces a sinusoidally varying output the amplitude of which
is proportional to the intensity of the input and the frequency
of which is inversely proportional to the wavelength. (Example:
For a retardation velocity of 1.26 cm/sec., the output frequency
for a lOy input is simply (1.26 cm/sec.)/10 cm or 1260 Hz.
Similarly a 5 micron input wavelength corresponds to a frequency
of 2520 Hz at the detector.)
The radiation from a blackbody contains energy at all
wavelengths in a large region of the spectrum and thus produces
a signal in the interferometer which is the summation (integral)
of as many sinusoids. This easily recognized signal is called
an interferogram (or white light interferogram) and is shown
in Figure Two, Typical White Light Interferogram.
By examining the equation describing the performance of
an interferometer for a monochromatic source a number of
conclusions can be drawn concerning the interferogram produced
by a source of finite wavelength extent in an ideal case. The
interferogram is symmetric about B equal to zero. The center
peak in the interferogram occurs at zero retardation and is
caused by the fact that at zero retardation all components have
the same phase. The peak amplitude of the interferogram is
proportional to the total energy in the incident radiation that
is modulated by the interferometer.
-6-

Figure Number Two
Typical White Light Interferogram
-7-

2.2 Non-Ideal Interferometer
. The non-ideal interferometer (in this discussion) is
defined simply as one which introduces wavelength dependent
phase differences into the transmitted signals. This can
be described mathematically by slightly modifying equation
number (1) to
IB= 0.51 1 + cos f 211 £J t (3)
where <j>v = the wavelength dependent phase shift. These
phase shifts may be a result of a number of things such as
phase changes at reflection and incomplete compensation in
the beamsplitter and compensation assembly. Figure Number
Three describes such an interferogram. A number of points
should be noted for this case. The interferogram is no
longer symmetric about B equal to zero. Due to the phase
angle each wavelength undergoes zero retardation at slightly
different positions of the moving mirror M2. The peak
amplitude is now only approximately proportional to the total
energy in the incident radiation that is modulated by the
interferometer.
2.3 Complimentarity of Outputs/Ideal Interferometer
In the discussion of an ideal interferometer (Section 2.1)
only the case of the transmitted output (energy arriving at B
from A) was considered. Clearly, energy is also reflected
by the interferometer and arrives at C from A. The analysis in
Section 2.1 ignored all phase shifts caused by the system so
that in this regard both the output at B and the output at C aan
be described by equation ^ . However, for the lossless system
as outlined a contradiction quickly becomes apparent, i.e. for
B = 0,
-8-

and
IB + Ic = 21.
This clearly violates the conservation of energy and the obvious
conclusion is that for the system described phase shifts cannot
be ignored.
Figure Number Four describes the phase shift caused by re-
flection from a dielectric (S polarized light being perpendicular
to the plane of incidence and P polarized light being parallel
to the plane of incidence). Since the.interferometer works the
metal mirrors (M, and M») at or near normal incidence the phaseJ_ £
change for any polarization direction is II. However, with a
dielectric beamsplitter the phase change will not be the same for
the two polarizations. Energy which is S polarized will undergo
a phase change of TT at the beamsplitter while energy which is p
polarized will undergo no phase change for angles of incidence
less than the polarizing angle. (Two typical examples of dielectric
beamsplitters are those which are deposited on a substrate such as
Fe-CU on CaF2, and those which use the Fresnel reflection character-
istic of the material to split the beam such as Ge.) The polar-
ization angle ^ is related to the index n of a material by the
relation tan <J> = n. For Fe~0-, the index is approximately 3 and
the polarization angle is approximately 72°. For germanium the
index is approximately 4 and the polarization angle is approximately
76°. Since the interferometer generally works within a few
dgrees of the optical axis, say at 45° + 10° to the plane of the
beamsplitter, the angle of incidence will always be less than the
polarizing angle and the phase change for the above mentioned
materials will in all cases be zero for p polarized light.
-9-

Figure Number Three
White Light Interferogram With
Wavelength Dependent Zero Phase
-10-

Therefore, for the case of the two materials mentioned
above, the relative phase of the polarizations are easily
determined and are summarized below by tracing rays through the
interferometer in Figure Number One and referring to Figure Number
Four for the phase changes at the beamsplitter.
Energy which is polarized S P
and arrives at B from A via arm
containing will M, M_
undergo a phase change (by reflection)
of at the beamsplitter IT o
of _at tne mirror H IIand of at the beamsplitter o o
for a total phase change of 211 II
Energy which is polarized S P
and arrives at C from A
via arm containing will M, M2undergo a phase change (by
reflection)
of at the beamsplitter H o
of at the minor and H • II
of at the beamsplitter II o
.for a total phase change of 311 n
Note that the S and P polarization at B are out of phase
by II and that the S and P polarization at C are in phase. Thus,
the interferograms at B and C respectively are given by
Ifi = 051 1 + cos. (2irL
and
r t + .j.51 1 + COS. (2TT |^- t)
With the above equations conservation of energy is no longer
violated for case B = 0 which yields !_. = 0 and I_ = 1.O V-
-11-

's
TT
<j) Angle of Incidence
4> Polarizing Angle
5 Phase Shift for S Polarized Light5
6 Phase Shift for P Polarized Light
Figure Number Four
Phase Shifts Due to Reflection From A Dielectric
-13-

Thus for an interferometer with a dielectric beamsplitter
the white light signal in transmission is 180° out of phase
with the white light in reflection (or alternately a black
fringe by transmission and a white fringe by reflection).
These complementary outputs form the basis of optical subtract
and also give rise to such phenomena as "negative" spectral
features.
2.4 Complimentarity; Consequences and Applications
Section 2.3 has discussed the complimentarity of outputs as
to their origin. However, it remains to be discussed the con-
sequences of this phenomenon as it may appear operationally and
the possible applications of this phenomenon.
The most common manifestation of the complimentarity of
outputs is the production of "negative" outputs from the
spectrometer. ("Negative" is meant to imply that the modulated
signal is 180° out of phase from what one would normally expect.)
Although perfectly logical for a situation in which a detector
at a given temperature views a target at a lower temperature (i.e.
the net transfer of energy is to the lower temperature source)
negative outputs from a detector operating at 5°K are not easily
explained except in the rare case of a target being at a tempera-
ture less than 5°K.
In general, there are three sources of modulated energy
viewed by the detector in a given measurement situation: the
target, the target background, and the spectrometer itself. The
modulated power on the detector is thus expressed by the sum
P = P + P + P (4)p T B S v '
where
PD = modulated power on the detector (watts),
P_ = modulated power on the detector from the target(watts)
P = modulated power on the detector from the targetbackground (watts), and
P = modulated power on the detector from thespectrometer (watts).
-14-
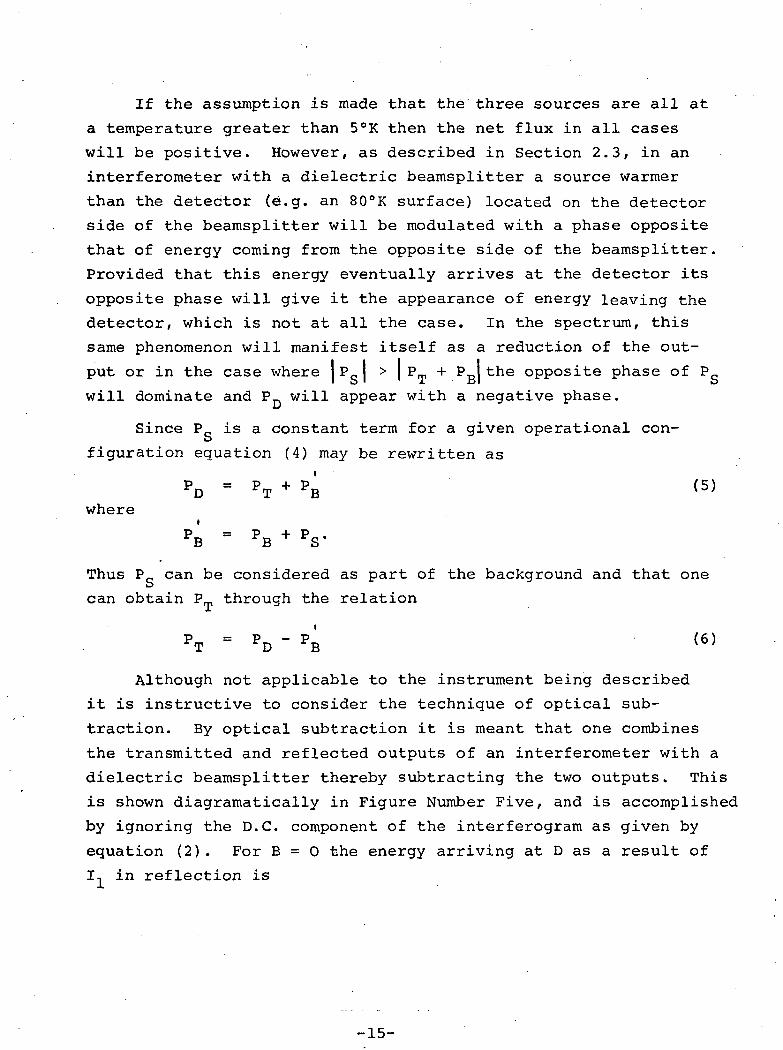
If the assumption is made that the three sources are all at
a temperature greater than 5°K then the net flux in all cases
will be positive. However, as described in Section 2.3, in an
interferometer with a dielectric beamsplitter a source warmer
than the detector (e.g. an 80°K surface) located on the detector
side of the beamsplitter will be modulated with a phase opposite
that of energy coming from the opposite side of the beamsplitter.
Provided that this energy eventually arrives at the detector its
opposite phase will give it the appearance of energy leaving the
detector, which is not at all the case. In the spectrum, this
same phenomenon will manifest itself as a reduction of the out-
put or in the case where P~ > I P_ + P_, the opposite phase of P0ID' 1 rJI owill dominate and P will appear with a negative phase.
Since Pc is a constant term for a given operational con-ofiguration equation (4) may be rewritten as
P = p 4- p C^}*D FT + *B (:3)
wherei
p = P -i- PPB PB + PS*
Thus Pq can be considered as part of the background and that one
can obtain P through the relation
Although not applicable to the instrument being described
it is instructive to consider the technique of optical sub-
traction. By optical subtraction it is meant that one combines
the transmitted and reflected outputs of an interferometer with a
dielectric beamsplitter thereby subtracting the two outputs. This
is shown diagramatically in Figure Number Five, and is accomplished
by ignoring the D.C. component of the interferogram as given by
equation (2). For B = 0 the energy arriving at D as a result of
I, in reflection is
-15-
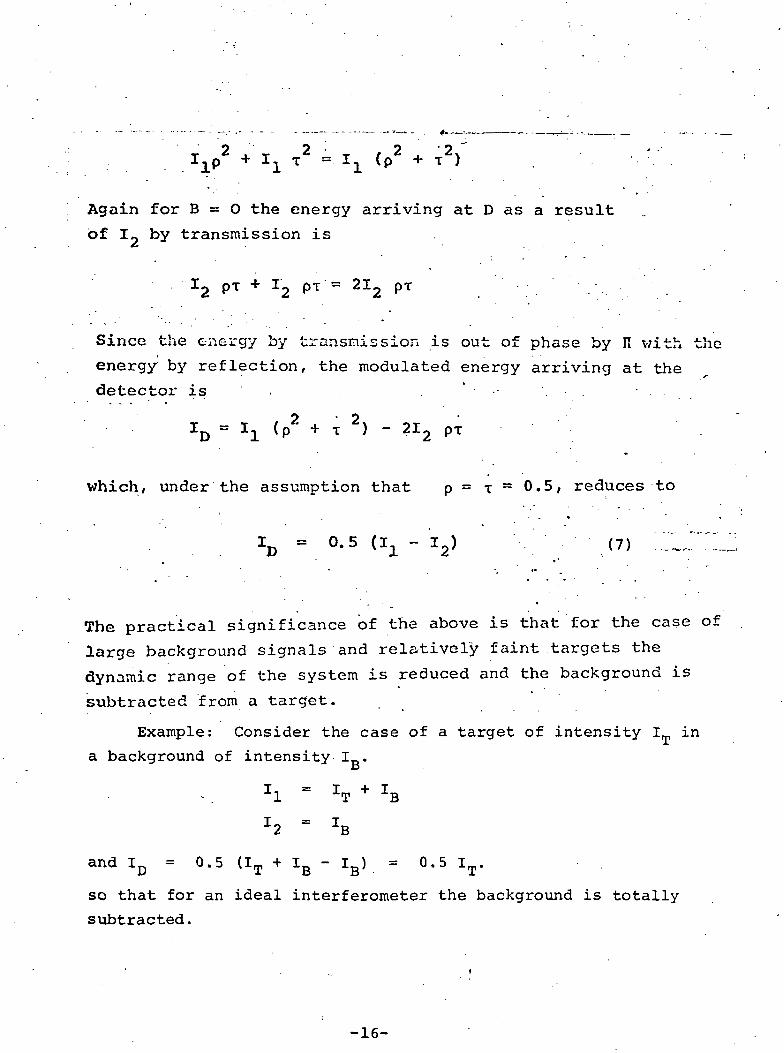
2 O . O • OI , —. £ — / 4S . ^«, p + I - i T = I , ( p + T )J L r X X
Again for B = O the energy arriving at D as a result
of I0 by transmission is& • • . - -
1*2 PT + T2 pT = 2I2 pT
Since the energy by transmission is out of phase by n with the
energy by reflection, the modulated energy arriving at thedetector is
ID = II (p2 + T 2) - 2I2 pT
which, under the assumption that p = T = 0.5, reduces to
• • - ' *
!„ = 0.5 (I, - Ij
The practical significance of the above is that for the case of
large background signals and relatively faint targets the
dynamic range of the system is reduced and the background is
subtracted from a target.
Example: Consider the case of a target of intensity I in
a background of intensity !_,.o
Z2 - JB
and ID = 0.5 (IT + IB - IB) = 0.5 IT>
so that for an ideal interferometer the background is totally
subtracted.
-16-
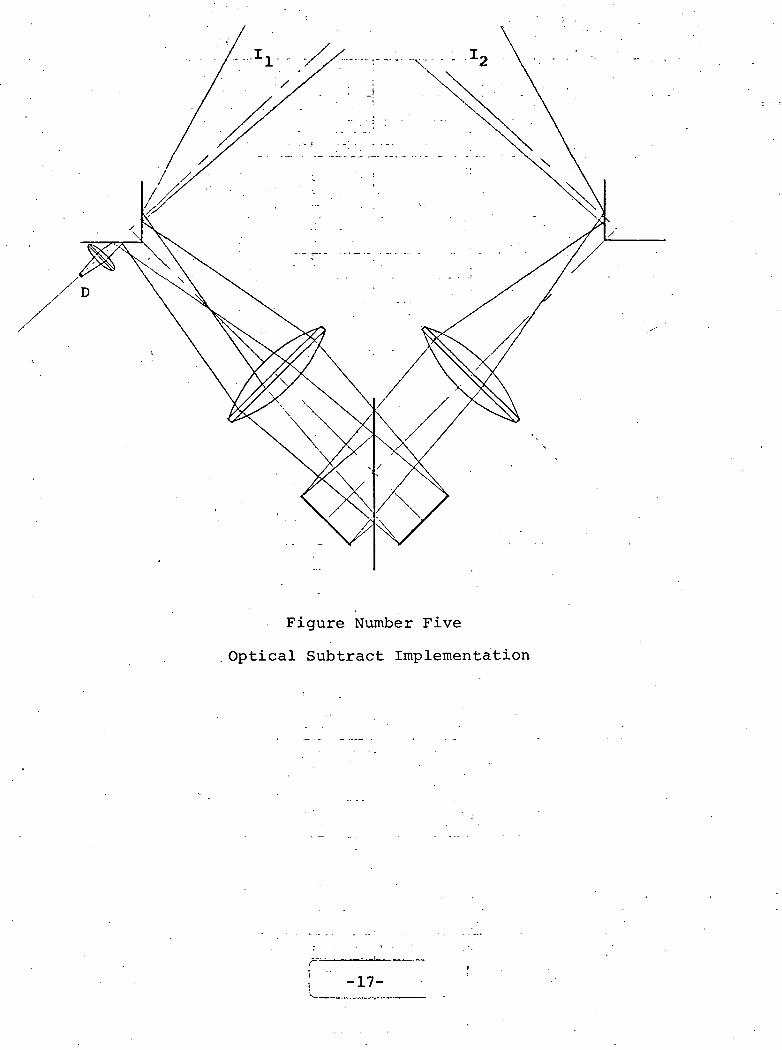
Figure Number Five
.Optical Subtract Implementation
-17-
2.5 Resolution and Obliquity Limit
As previously noted the argument of the cosine in
equation (1) expresses the output frequency f as a function
of wavenumber according to the relation
f = -V T
where
This statement expresses the fact that the interferometer
translates the frequencies of the electromagnetic radiation
into an electrical signal at audio frequencies by a constant
factor preserving the relative frequencies. The recovery of
the spectral information is obtained by performing a Fourier
transform on the interferogram which may be thought of as a
simple harmonic analysis of the interferogram. For a mono-
chromatic source the output of the interferometer with a
finite optical retardation B will be a sine wave of a finite
number of cycles. The Fourier transform of this function
yields the familiar sync function line profile whose half
width is determined by the total length of the sine wave.
In lieu of a complicated mathematical determination of the
width of the line profile as a function of B, it is in-
structive to consider the following case. Let us say that
two monochromatic sources of slightly different frequency
(v and v + Av) would be resolved if over the length of the
interferogram (B) there is a difference of one cycle in the
total number of cycles N produced by the two lines, i.e.
-18-

Bv = JJfbf i 'and B(v •*• Av) = N
Equating the -above /x"^• ' ~ , -x^ '
B v + 1 = B v + B A v . ' . > - -
or
Av = | . (8)
which simply states that the resolution of the interferometer
spectrometer is constant in wavenumbers throughout the spectrum
and is inversely proportional to the retardation B.
It must be noted, however, that the above equation is
valid only for the axial case, i.e. the obliquity angle u = 0.
For the case of a finite obliquity angle (u > 0) the resolution
will be somewhat reduced. This results since retardation
produced by the interferometer is a function of the angle at
which a ray traverses the system. The retardation produced
by a finite angle is given by the relation
B(u) = B(o)cos u
where B(o) is the on axis retardation. .
The maximum allowable obliquity in a system is a function
of both the shortest wavelength of interest (\) as well as the
retardation (B) and is described by the equation
,,2 1 Xu = BV = B (9)
When the field-of-view is restricted to the half-angle described
by equation (Q) the effect on the interferooram at the
shorter wavelengths is that of a cosinusoidal apodization which
increases slightly the instrument profile and reduces its
sidelobes.
-19-

SECTION III
INSTRUMENT DESCRIPTION /"x
*/
3.1 Basic Interferometer
Figure Number Six is a pictorial representation of the
interferometer optical head showing the major optical com-
ponents thereof. Basically it can be divided into three main
sub-assemblies: the signal (or main) interferometer, the
bearing and transducer assembly, and the reference interfero-
meter; and three secondary areas: pressure regulation and
bearing feed, window assembly and dewar modifications.
3.1.1 Signal or Main Interferometer
The signal interferometer is of conventional Michelson
design. The beamsplitter/compensator substrates are ger-
manium flats manufactured to the appropriate tolerances. The
beamspli.tting capability utilizes the Fresnel reflection from
this high index (n=4) material. Secondary .reflections from
the additional surfaces are suppressed using a multi-layer
anti-reflection coating on three of the four surfaces. The
moving mirror has been fabricated from 6061-T6 aluminum and
is provided with integral mounting points for attachment to
the transducer. The adjustable mirror is a first surface
aluminized quartz flat. The mirrors have been provided with
a clear aperture of 2.25 inches. The adjustment mechanism
for the adjustable mirror is a combination of a mechanical
system for rough aligning coupled with a piezo-electric
support for remote and fine adjustment.
-20-

SignalDetector
Piezoelectric] Crystals
Fixed Mirror
Beamsplitter/Compensator
Moving Corner Cube
Beamsplitting Prism
SI Detector (Mono) » -* -— - - - ~~
GE Detector (White)
White Light
Moving Mirror
Fixed Corner Cube
Laser
C
Air Bearing
Transducer
Figure Number Six
Signal and Reference Interferometer
-21-

3.1.2 Bearing and Transducer Assembly
Scanning, of the interferometer is accomplished by movingL • " '*" \
the signal interferometer mirror with a permanent magnet and
coil assembly similar to that commonly found in a loudspeaker.
This moving assembly is supported by a cylindrical air bearing
manufactured to tolerances such that the tilt of the moving
mirror is held to within predetermined specifications com-
mensurate with the wavelengths and resolution at which the
system is operated. The air supply for the bearing is GN2
which is produced by the boiloff of the LN2 cryogen.
3.1.3 Reference Interferometer Assembly . .. .
The most complex of the three major sub-assemblies within
the optical head is the reference interferometer. This system
serves two functions: first, it provides a reference signal
for the constant velocity servo and the sampling channel and
second, it provides an absolute position reference or fiducial
to enable coherent addition of successive interferograms. This
assembly is a corner cube interferometer which has been imple-
mented to eliminate the need for remote adjustment of the ref-
erence interferometer. This capability is provided by the tilt
compensation which is an inherent quality of the corner cube
interferometer. One corner cube is mounted on the back side of
the moving mirror, the second corner cube is mounted on a fixed
support assembly which also holds a beamsplitting prism to
complete the interferometer. A monochromatic source (i.e. a
He-Ne laser at 0.6328 microns) is used to generate a sinusoidal
output from a Si cell as the moving mirror scans. The fre-
quency of this signal is directly proportional to the velocity
of the transducer and each cycle indicates a change in the
-22- •

retardation of 0.6328 microns. The white^ light interferogram
generated by the tungsten lamp and the Ge detector gives ab-/'
solute positional information and serves as a starting point
for the determination of the scan length.
3.1.4 Typical Waveforms
Figure Number Seven indicates the typical waveforms which
are generated by this instrument. The reference white light
and monochromatic signals are combined to form the sync signal.
3.1.5 Bearing Feed and Regulator System
Figure Number Eight describes the bearing, feed and pressure
regulator system. This system has a number of functions the
most fundamental of which is to supply gaseous N^ to the air
bearing. Secondary functions include: providing gaseous N2to eliminate frost buildup on the window assembly, control of
the internal gas pressure by means of controlled applications
of heat, and various safety overrides, reliefs as well as filling
and quick dump valves.
The flow of nitrogen (both liquid and gas) is rather
straightforward. The LN2 is loaded in the outer tank with
the boiloff being collected and passed through an in-line
filter. The pressure at this point is monitored by a gauge
and regulated by the action of a pressure switch which controls
the on-off cycling of a cartridge type immersion heater through
the faceplate. The GN2 is then recooled by immersing the
tubing in the LN2 and then used to cool the faceplate area of
the detector dewar. It then proceeds to the bearing and vents
-23-

lite Light
leference)
Mono
(Laser Reference)
Syncr/
A
White Lighi
(Signal)
Figure Number Seven
Typical Waveforms
-24-

0)
fl) rHrt
W
-H0) WH CU3•P 0CUO
(03C
Dete
cto
r F
ace
Pla
te
O C )usMOT;
(Tsd G O T )
(TSd
(8)--
c'
CQ
43
W
-rH•H(I)
>i-Hto
W-PMOa*
tnr- 0)
-P(TJQ)K
w
0)
3tow OQ) -PIM 3LP< O
OJ
(0Q)
CQ
Inn
er
Tan
k
fa
CN
O
CM
(0
rl0)-p
t .
'••
ula
tor
Sy
st
ig egE R
n0)ja
a.0)M^jCr>•Hfa
Q)MdU)wQ)Mft
•dd(0
. t)Q)0)fa
tPd•HV<(00)
CQ
-25-

\to the inner tank. A low pressure switch at the input of the
bearing is used to shut down the entire instrument if the
pressure is not at a preset value. The GN2 exits from the
system through either the window ports or the manual relief
valve. An auxiliary input to the air bearing is provided
through the faceplate of the instrument. By pressuring the
bearing from this point a check valve is closed'so that the
bearing is supplied via an external nitrogen source. The front
plate of the instrument also contains a rupture disk, safety
relief valve and manual relief valve for the inner chamber as
well as a quick dump valve for the outer chamber.
3.1.6 Window Assembly
The window of the instrument is a germanium lens, the
first element of the optical system. The assembly surrounding
this element has been specifically designed for two modes of
operation: in conjunction with an evacuated simulation chamber
and in an "open window" configuration. This assembly is shown
in Figure Number Nine
For operation in conjunction with the gas simulation
chamber the four valves shown in Figure Nine are closed, the
manual relief valve (to the inner chamber) is opened and the
flanged end of the assembly is mated to the simulation cell.
For operation in an "open-window" configuration the
manual relief valve is closed, the window valves are opened
and a heated snout is attached to the window flange. Blowing
GN2 on the window keeps it cold and frost free and the heated
snout brings the GN2 to room temperature as it exits to
ambient.
3.1.7 Dewar Modification
The detector dewar is a Santa Barbara Research Center
Model 9145-STD dewar which has been modified for this appli-
cation. The modifications include replacement of the standard
-26-

-27-

window with ,the germanium field lens, placement of the preamp
load resistor-on the cold finger, placement of the FET (which
is the first stage of the preamplifier) on the radiation .shield,
and placement of a Ga:As LED on the detector cold shield.
3.2 Optical System
Figure Number Ten depicts the optical system used inthe subject instrument. The objective lens focuses the field
on the field stop which is coincident with the focus of the
input Cassegrain which renders the radiation parallel upon
entering the interferometer. The exit Cassegrain again
focuses the field whereupon the energy proceeds to the field
lens and the detector.
Figure Number Eleven depicts the optical system in a "lineof sight" configuration and contains a table listing pertinent
system design numbers and dimensional relationship. The
entrance pupil of the system is the entrance lens clear
aperture, the exit pupil is the detector and the fixed mirror
of the interferometer is an intermediate pupil. The full
field angle on the entrance aperture is 7.2°, in the inter-
ferometer 2.56° and at the detector 30°. The f/No. at the
aperture of the instrument is f/8, of the entrance and exit
Cassegrains f/4, in the interferometer f/22, and at the
detector f/2. The throughput.match for the system is 1 cm
resolution at 5 microns.
-28-

Detectorfl\ Field*Lens
\l
N / V
EntranceCassegrain
\l \l
ExitCassegrain
I Interferometer
Figure Number Ten
Optical System Layout
-29-

_L," '>•
\
in
_i_ co
;
t Q)
. (jj %y\'• 0 d
__J kJ m—J™ ^j^ rnrH 0 £D-< O fBCXirH M
. < W Q
rH(B•HViO-PIB
i ^<
(1)0 -P <Ud X O
w IB 0) (BLJ -P Z MH0) W M4J -H O 30) Q -P CO
i04 0). -pg M -P 0)0) nJ M 64J 0) 0 fB._ . t Oi-rHm •» »-M ~
>, 0 < Q
rrj <W 0>0 O JH
-H 34] W -Pa 3 15o •H >1 nJ 3
P4 ud<1) •
® • ?} t__j O MH (B0>*^ U 1 /^
t , M Sa> • ^ 5•i&Q)
3
•H[LI
i
i-Pfi0)e<urH
M
1
i
/e
rHCMCMCMVD
M 1C5 1
O CO VDo m oCM r-" ro
• • •O CN CO
o o oc^ c^ oor r~ rH
0 O 0
^^00 iH
00 O. 4-1• . * r"{
CM ^ H
rH CM CO
COcQ)
O<1) -PO COc(B t3M rH-P 0)d -HW p4
-30-
OO CO O CO O*\rH CO CO rH rH
CM CO CO CM CMCM rH rH CM CMCM CO CO -CM CMVO VO VO VO VD
VO VD VD VO VDEH EH EH N EH EHi i i - P i i t r >
rH rH rH V» rH rH K
VD VO VD (B VO VD ••O O W 0 3 W O O W HV«O VO C ) VD Ql C.5 VO VO CD CD
VO i~H i™ H VD LO ^D f**JCM VD VD CM O O rHCM in in CM co CM o
• • • t • • •CM VO VO CM ^ O rH
1 1
O O I O O I O O OO Ooo o i m m i o oo oo o<Ti VD I C M C M I VD C\ ^ ^ CM
O CM I C M C M I CM O rH rH O
rH r*» r rH oo inVD OO • • • • 00 VD ^3* CO •cr> in inm4-i4-i in <y\ cnco m
d c c c • • • • cin r~ H H H H r^ in O-H H
i i
"si* in vor^oocy^ o rH CMCO ^3*rH lH rH rH rH
O O-p -pflj 03w tod dQ) Q)a* ae e
>i O O >irH 0 U H<B t>i \ M ^" — t>i iB
fQ V-l M O V - i M M T3d n^ < u > - j O a j fl dO -H 4J -H r-l -P -H U dQ) M -H S -H -H ^1 0) Q) V(C O f l | r H S I r ~ ' & l C O ) - J O
(i tr> si -p• . c O d T S t f l • * T 3 O
10 CO g - H ( U E CO C O r H OCO CO ( B > X ( B CO tO 0) -PIB (0 Q) O -H Q) (B (B -H 0)CJ U p q S f o C Q O CJ fa Q
i
•to
u•H
d•H
todo•HtoQ)£
•H•drH•H
..
pq
EHO

3.3 Electronic Circuits
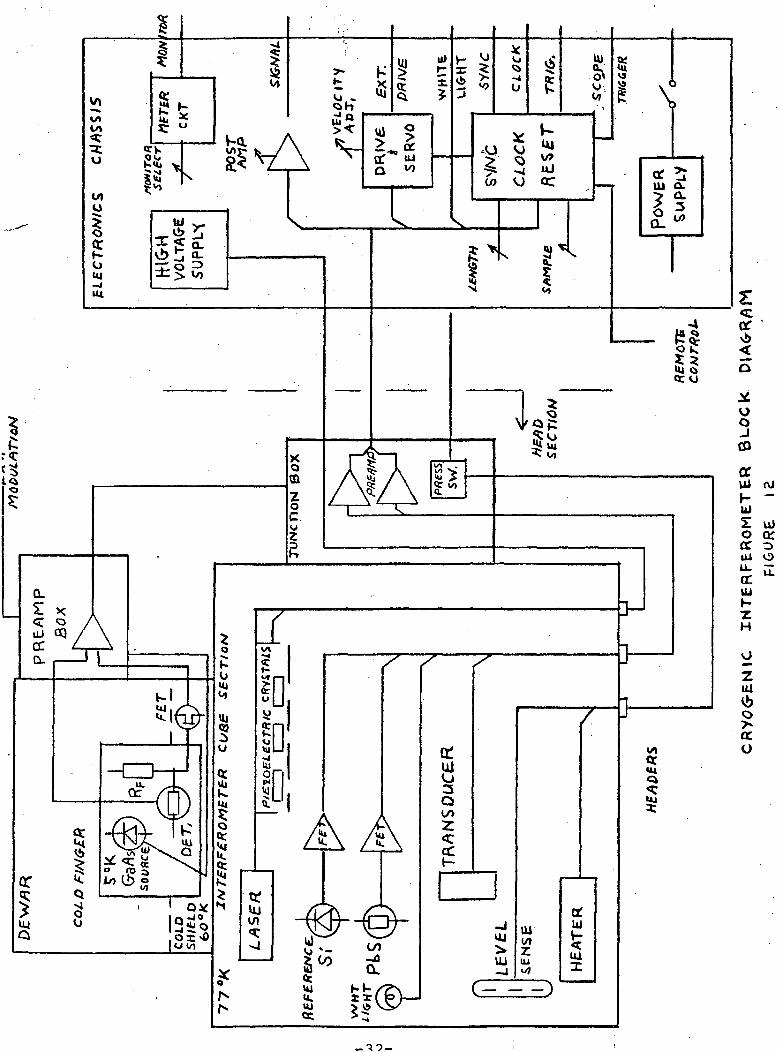
Figure Number Twelve is a reduced version of Block Engin-
eering, Inc. schematic drawing number E-920-22. Its purpose
is to give the first time reader of the electronics des-
cription a sound footing before attempting to master all the
specific details. The electronic circuits can be divided
into five groups: the reference and synchronization circuits,
the constant velocity servo and drive, the signal channel,
power supplies, and the auxiliary circuits.
3.3.1 Reference and Synchronization Circuits
The reference section has silicon (mono) and germanium
(white) photo-diode detectors. The silicon detector collects
the He-Ne laser energy transmitted through the reference side
of the cube. The monochromatic phase coherent laser energy
serves two purposes. First, it gives an. absolute velocity
error signal that is used to maintain constant scan velocity.
Second, any error in the scan velocity is phase coherent with
the signal side of the cube, therefore, self correcting. The
output of. the monochromatic reference pre-amplifier goes
through a Schmitt trigger which detects the zero crossings and
generates a square wave. A digital frequency doubler gen-
erates a train of pulses whose average area is proportional
to the frequency of the monochromatic interferogram and
provides the velocity information to the servo loop.
The germanium detector collects all the energy radiated
from a miniature filament type lamp. Since there is only one
position in the scan where all the energy is phase coherent,
it gives absolute positional information. The white light
positional information serves the following purpose. It
resets all the digital counters enabling data collection to
-31- .
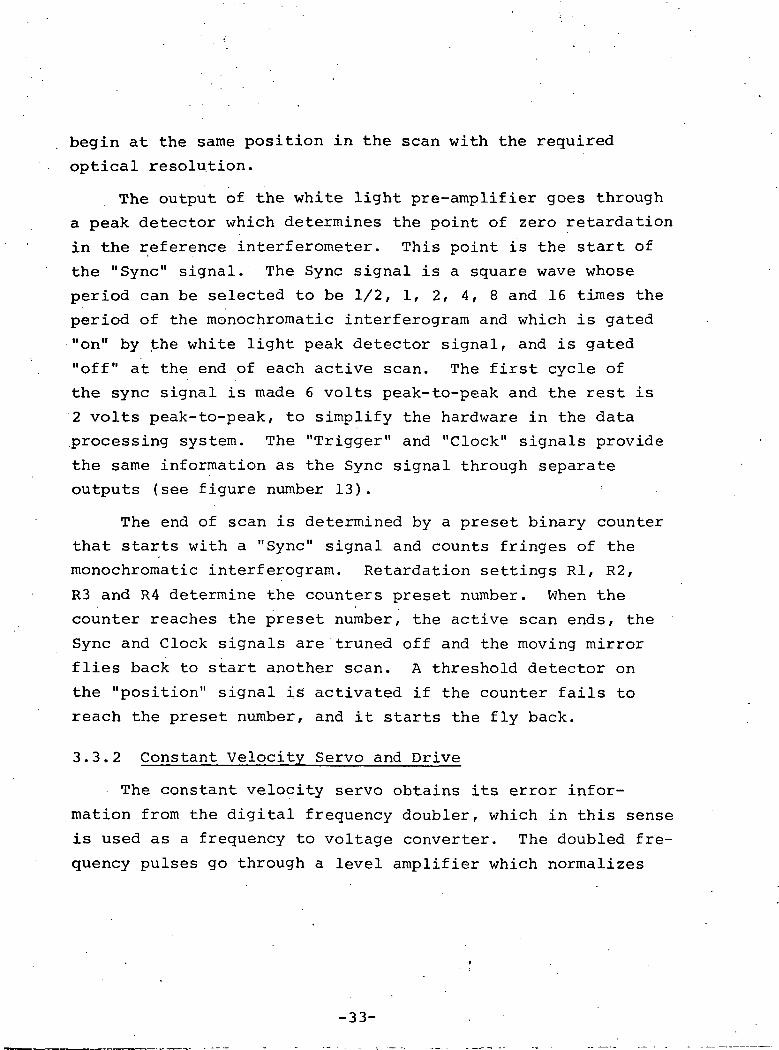
begin at the same position in the scan with the required
optical resolution.
The output of the white light pre-amplifier goes through
a peak detector which determines the point of zero retardation
in the reference interferometer. This point is the start of
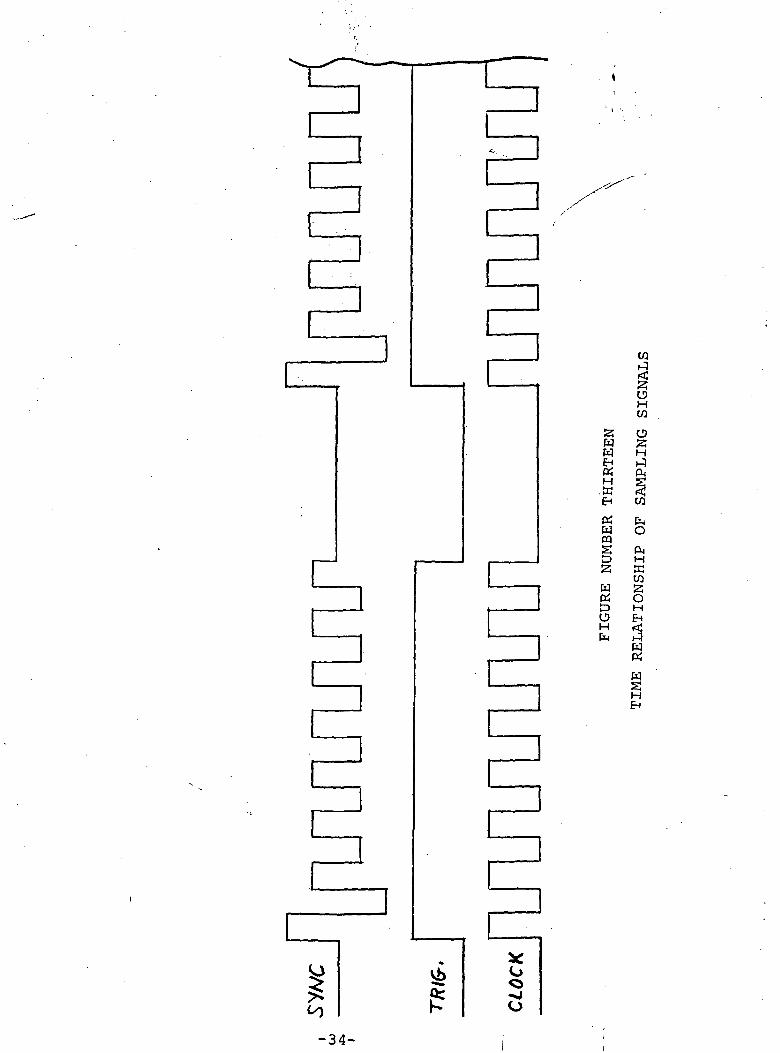
the "Sync" signal. The Sync signal is a square wave whose
period can be selected to be 1/2, 1, 2, 4, 8 and 16 times the
period of the monochromatic interferogram and which is gated
"on" by the white light peak detector signal, and is gated
"off" at the end of each active scan. The first cycle of
the sync signal is made 6 volts peak-to-peak and the rest is
2 volts peak-to-peak, to simplify the hardware in the data
.processing system. The "Trigger" and "Clock" signals provide
the same information as the Sync signal through separate
outputs (see figure number 13). :
The end of scan is determined by a preset binary counter
that starts with a "Sync" signal and counts fringes of the
monochromatic interferogram. Retardation settings Rl, R2,
R3 and R4 determine the counters preset number. When the
counter reaches the preset number, the active scan ends, the
Sync and Clock signals are truned off and the moving mirror
flies back to start another scan. A threshold detector on
the "position" signal is activated if the counter fails to
reach the preset number, and it starts the fly back.
3.3.2 Constant Velocity Servo and Drive
The constant velocity servo obtains its error infor-
mation from the digital frequency doubler, which in this sense
is. used as a frequency to voltage converter. The doubled fre-
quency pulses go through a level amplifier which normalizes
-33-
w
H.ffi
CO
e>Hwo&Ht-3fr
wm&Dsw
OiHX
oH
vb
H«
HSH
-34-

the pulse amplitude and refers the error to 0 volts. This
signal goes through a low pass filter and becomes the
velocity feedback. The error signal is integrated with an
operational amplifier to provide positional feedback.
The drive amplifier sums these error signals and provides
a voltage to the transducer proportional to their sum.
During the flyback, a "Reset" signal removes the velocity
and position error signals and applies a voltage which pro-
duces the flyback. A laser monitor circuit is activated when
the laser beam does not reach the monochromatic detector and
it turns the "Reset" signal on and disconnects the transducer
drive.
A switch in the drive amplifier circuit card disconnects
the constant velocity servo and allows manual and external
control of the transducer drive. This feature is used to
align both the reference and the signal interferometers.
3.3.3 Signal Channel
The signal channel consists of a pre-amplifier and post-
amplifier mounted respectively at the detector dewar and
electronic console. The preamplifier is an FET input oper-
ational amplifier specifically designed for low noise cry-
ogenic front end operation. Hence, the dewar cold finger
supports the detector, feedback resistor and GaAs source.
The field effect transistor is mounted on the dewar's radi-
ation shield to minimize operational amplifier input noise
voltage.
The GaAs source serves the following two purposes.
First, it enables the operator to check the pre-amplifiers
-35-

frequency response by modulating the GaAs source via a BNC
connector. 'Second/ optimization of detector response time
is achieved by adjusting a small d.c. bias on the GaAs'
source.
. . The pre-amplifier output signal is presented to the
rear panel of the console and to the input of the post
amplifier. The rear panel DNC enables the operator to examine
the d.c. value, thus, the detectors operating point.
The post-amplifier amplifies the main interferometer
signal by the following factors: 1, 3, 10, 30, 100 (corre-.
spending to absolute values of 2 through 200 respectively).
3.3.4 Power Supplies
The power supplies generate + 12 volts for the operational
amplifiers, + 7 volts for the transducer drive, + 5 volts for
the micrologic circuits, + 30 volts for the detector bias,
+ 1500 volts for the laser, and + 1000 volts- for the piezo-
electric crystals. An external + 15 volt supply (at 1 amp) is
necessary to power the level sense circuitry found in the
junction box. The three G.R. jacks on the rear of the console
accept the external + 15 volts.
3.3.4.1 Bias Supply
The signal detector bias supply is essentially a 500 kHz
square wave oscillator driving a voltage doubler ladder
network. The output voltage is connected to a 10 turn poten-
tionemeter with the center tap going to the detector.
3.3.5 Auxiliary Circuits
3. 3 ..5.1 Level Sense
The level sense circuit detects the change in resistance
-36-

of three resistors in series. The three resistors are strung
vertically up from the bottom of the cryogenic tank. With no
LNp present in the tank, the total resistance is approximately
86ft. As the level encompasses each resistor, an increase in
resistance of 7fi per resistor occurs. The change in resistance
is converted to a voltage change via one operational amplifier.
This operational amplifier drives a meter mounted on the
junction box. Offset and gain controls are mounted in the
junction box for setting the empty and full level readings.
3.3.5.2 Heater Control
The bearing pressure is maintained by pressure switch
P2 turning on and off the tank heater. This can be monitored
by the Heater On Lamp mounted on the junction box. If the
pressure falls below a nominal value, two commands are
executed. First, the transducer drive coil is removed from
the drive amplifier. Second, line power is removed from
pressure 'switch P2, thus, shutting off the tank heater.
During the low pressure status, junction box lamp "Pressure"
is turned off and front panel lamp "Low Air Pressure" is
turned on. Caution must be employed when going from a low
pressure status to normal operating status! (See Section 6.5
for this procedure.)
The pressure overide button overides only the pressure
switch command to enable pressure switch P2 (tank heater
power). During the time the button is depressed, a false
"Pressure" lamp status occurs. The reason for the momentary
overide is simply to get the pressure above the nominal value
so that the pressure switch P2 can operate.
-37-

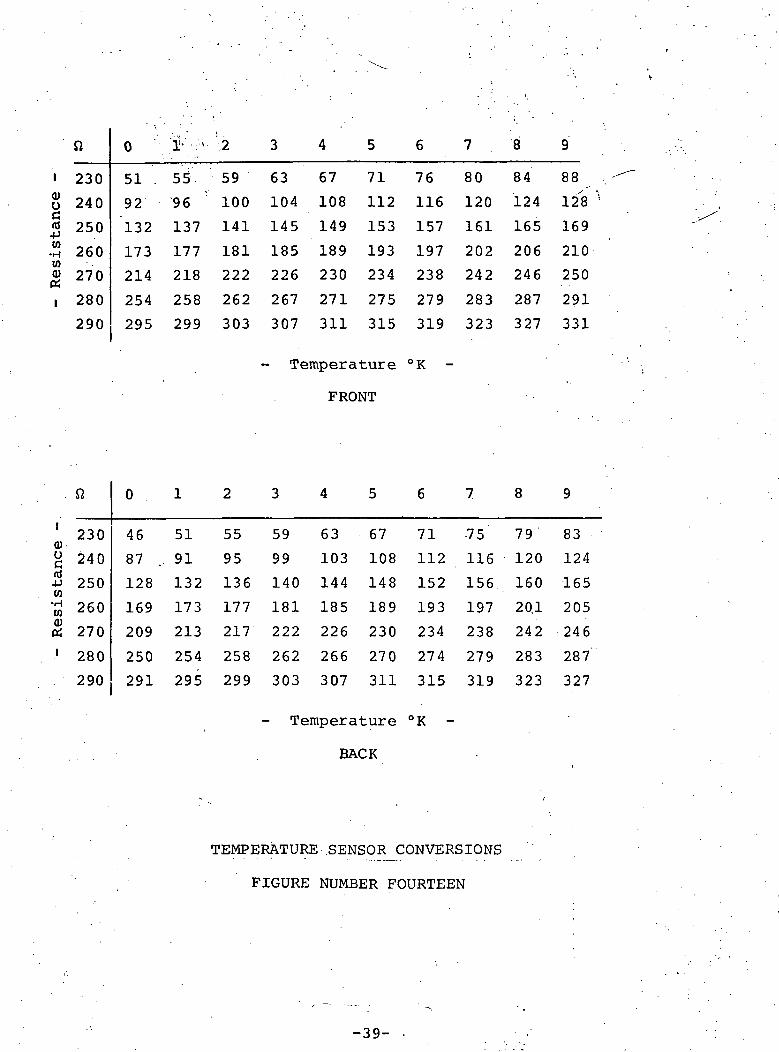
3.3.5.3 Temperature Monitors
Two low temperature sensors are located on the front
and rear of the interferometer cube. These resistances are
brought out on rear panel BNC connectors. Figure number Fourteen
is a chart for determining the temperature given the resistance
readings.
A thermistor located in the signal pre-amplifier is
brought through the cables to a network located in the post
amplifier card. The network provides a bias for the ther-
mistor and generates a voltage dependent on the temperature.
This voltage is available at the "monitor" output and is also
fed to the front panel meter which has a scale calibrated in
degrees centigrade.
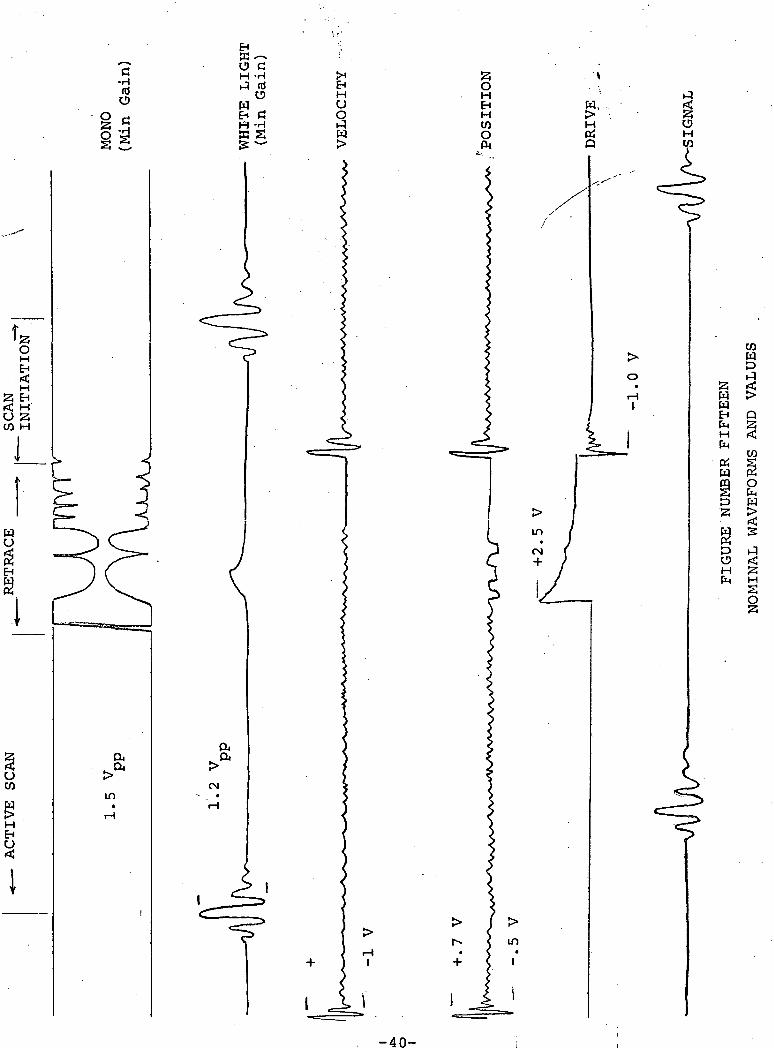
3.3.5.4 Peak Reading Meter & Monitor Switch
The peak reading meter circuit measures the full wave
rectified peak values of the siganl selected by the "monitor"
front panel control. At the same time this signal appears
at the "monitor" output jack.
The monitor switch presents the following signals to
the front panel, connector, signal, mono, white, velocity error,
position error, drive amplifier output and temperature. A
timing diagram (Figure Niamber Fifteen) shows the relative wave
shapes that can be observed and their nominal values.
-38-
10)ocnJto•Hto0)K
I
n
230
240
250
260
270
280
290
0
51 .
92
"l32
173
214
254
295
•*•:?:5S.
96
137
177
218
258
299
2
59
100
141
181
222
262
303
3
63
104
145
185
226
267
307
4
67
108
149
189
230
271
311
5
71
112
153
193
234
275
315
6
76
116
157
197
238
279
319
7
80
120
161
202
242
283
323
8
84
124
165
206
246
287
327
9
88
128
169
210
250
291
331
Temperature °K
FRONT
10)o
-pto-HtoQ)
1
SI
230
240
250
260
270
280
290
0
46
87
128
169
209
250
291
1
51
91
132
173
213
254
295
2
55
95
136
177
217
258
299
3
59
99
140
181
222
262
303
4
63
103
144
185
226
266
307
5
67
108
148
189
230
270
311
6
71
112
152
193
234
274
315
7
-75'.
116
156
197
238
279
319
8
79
120
160
20.1
242
283
323
9
83
124
165
205
246
287
327
Temperature °K
BACK
TEMPERATURE .SENSOR CONVERSIONS
FIGURE NUMBER FOURTEEN
-39- -
c•HfljO
i«la
O C!H -H
WB CH -HK S
U
HEHU
Q,>
CM
WDi-q
S <W >HH QEn SH <PM
WO
O
ao
-40-

3.3.6 Remote Control . .
Three! front panel controls are wired for remote .control
operation. These include the Sensitivity, Retardatibn and
Sampling switches. To change sensitivity in the remote mode
of operation the front panel switch must be placed in "remote"
and +5 volts placed on PINS 1, 2, 3, 4 or 5 of Digital
Connector J72. Wiring diagram E-920-22 shows what each pin
number represents on the front panel controls. To change
retardation in the remote mode of operation, the front panel
switch must be placed in "remote" and +5 volts placed on'PINS
20, 21, 22 or 23 of Digital connector J72. To change Sampling
in the remote mode of operation, the front panel switch must
be placed in "remote" and +5 volts placed on pins 6, 7, 8, 9,
10 or 19 at Digital connector J72.
SENSITIVITY
100X
30X
10X
3X
IX
J72PIN
5
4
3
2
1
RETARDATION
Rl
R2
R3
R4
J72PIN
23
22
21
20
i•SAMPLING
1/2
1
2
4
8
16
J72PIN
6
7
8
9
10
19i
-41-
SECTION IV
CONTROL FUNCTIONS AND SPECTROMETER OUTPUTS
4.0 General
The following paragraphs contain information concerning/"
the location and function of the various controls and outputs
of the interferometer. Before attempting operation of the
interferometer, the reader is advised to become thoroughly
familiar with this section of the manual as well as the
location of the various controls of the spectrometer.
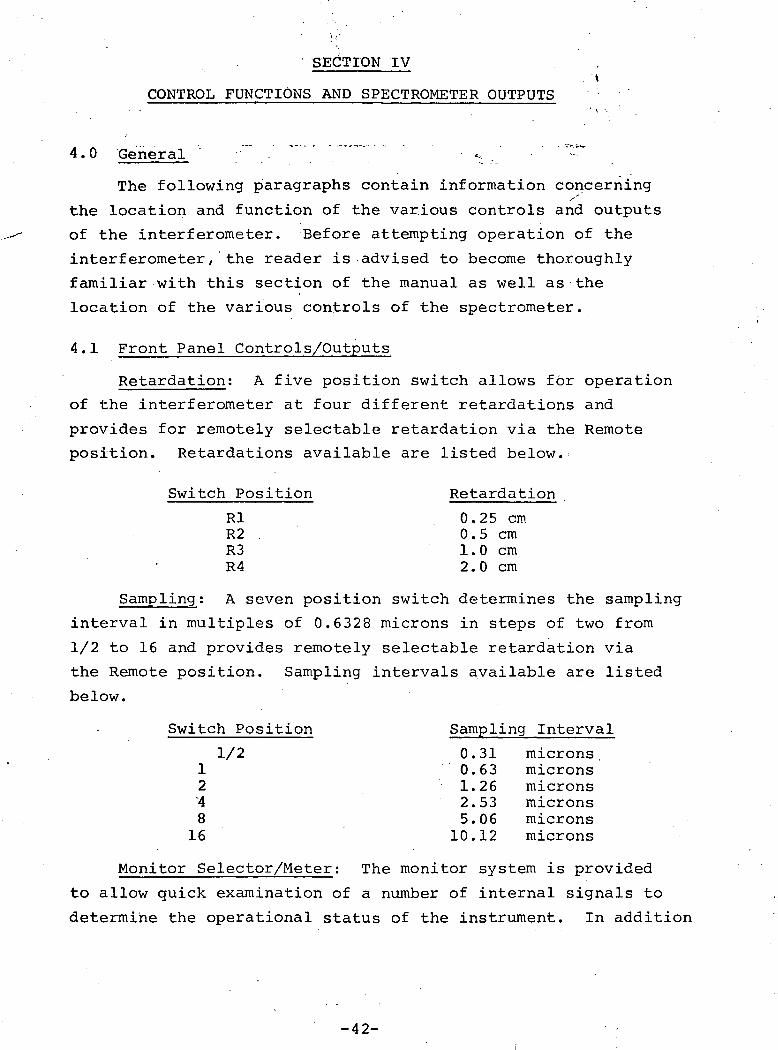
4.1 Front Panel Controls/Outputs
Retardation: A five position switch allows for operation
of the interferometer at four different retardations and
provides for remotely selectable retardation via the Remote
position. Retardations available are listed below.
Switch Position Retardation
Rl 0.25 cmR2 0.5 cmR3 1.0 cmR4 2.0 cm
Sampling: A seven position switch determines the sampling
interval in multiples of 0.6328 microns in steps of two from
1/2 to 16 and provides remotely selectable retardation via
the Remote position. Sampling intervals available are listed
below.
Switch Position Sampling Interval
1/212~4816
Monitor Selector/Meter; The monitor system is provided
to allow quick examination of a number of internal signals to
determine the operational status of the instrument. In addition
0.0.1.2.5.0.
316326530612
micronsmicronsmicronsmicronsmicronsmicrons
-42-

to directing these signals to the meter located directly
above the selector switch, the signal is presented at one of
the BNC connectors available on the front panel. The
various signals presented are:
Signal: This is the detector output following
the post amplifier.
Mono: This is the monochromatic interferogram produced
by the laser in the reference interferometer.
White: This is the white light interferogram produced
by the reference interferometer.
Velocity: This signal is proportional to the velocity
error of the moving mirror (i.e. the deviation from a constant
velocity.)
Position: This signal is the integral of the velocity
error.
Drive: This signal is the actual voltage as applied to
the coil in the electromechanical transducer assembly.
Temp: This signal is the temperature in degrees Centi-
grade as indicated by a thermistor located in the pre-amplifier
enclosure.
Power: The spectrometer is designed to operate on
115V 60Hz through a standard U-ground power cord. The
on-off switch is a two position switch which activates
all power supplies within the instrument. The system is
provided with an indicator light and is fused with a
2 amp fast blow fuse.
Bias/Bias Monitor: A ten turn potentiometer is avail-
able for adjusting the DC bias on the detector to allow
-43-

operation of the detector under varying background conditions.i ' . •
The bias is adjustable from 0 to 28 volts and may be monitored
on the BNC connector located directly below the adjusting
potentiometer.
: Velocity: A ten turn potentiometer is provided to allow
an approximate 10% change in the absolute velocity of the
moving mirror.
Low Air: If the pressure across the bearing drops to .
below 15 psi .the bearing pressure switch will open disabling
the drive. When this occurs, the low air pressure lamp will
turn on.
Mirror Position: Three potentiometers are provided for
varying the applied voltage to the piezo electric crystals on
the fixed mirror assembly. The voltage is varied from -1000
volts to +1000 volts as the pot is rotated .clockwise.
Output Signals: Eight BNC connectors are located on
the front panel of the controller. They are:
MONITOR: As previously mentioned, this connector
allows observation of signals as selected by the monitor
switch.
SIGNAL: This connector presents the detector
output following the post-amplifier.
WHITE: This connector presents the white light
interferogram from the reference interferometer.
SYNC: This signal is shown in Figure Number Seven
and would normally be used for applications involving the use
of a tape recorder.
-44-

TRIG: This signal is low during the •inactive portion of
the scan and high during the active scan. This would normallys-
be used as a necessary logic level for operation of 'the spec-
trometer in conjunction with a Digilab, Inc. data system
without the use of intermediate playback devices.
CLOCK: This a digital square wave which corresponds
to the sampling interval and also would be employed for oper-
ation of a Digilab, Inc. data.system without the use of
intermediate playback devices.
SCOPE TRIG: This signal is provided for the purpose
of providing a trigger for an oscilloscope. This trigger
signal precedes the white light interferogram from the reference
interferometer.
EXT DRIVE: This connector serves as the input
point for waveforms to the drive amplifier when performing
alignments and tests.
4.2 Rear Apron Controls/Outputs
Signal; The BNC connector to the left side of the rear
apron is the D.C. coupled signal from the pre-amplifier.
Remote; The Amphenol connector located in the center
of the apron is the remote control connector.
Temperature, Front and Rear; Two BNC connectors are
provided for monitoring temperature sensors located on the
interferometer cube (front) and the flange which mates to the
main bulkhead (rear).
± 15V DC; Three binding posts are used to deliver + 15V DC
to the liquid level sensing network.
-45-
Transducer Position; A potentionmeter is provided for
moving the transducer manually when the spectrometer is in
the manual position.
Connectors; The connectors provided are used to connect
the control chassis with the junction box on the optical head.
4.3 Junction Box Controls/Outputs
Gain White; A ten turn potentiometer is adjustable
through the front panel and is used to change the gain of
the reference white light pre-amplifier.
Gain Mono; A ten turn potentiometer is adjustable
through the front panel and is used to change the gain of
the monochromatic pre-amplifier.
D.C. Offset; A ten turn potentiometer is adjustable
through the front panel and is used to change the D.C. offset
of the monochromatic pre-amplifier output.
Leve1; A meter is provided to indicate the liquid level
within the spectrometer. Three discrete levels are indicated
corresponding to one-half, three-quarters and completely full.
Heater On;. When the immersion heater is activated, the
indicator lamp is turned on.
Pressure; When the pressure within the cryogen tank is
sufficient to allow operation of the spectrometer this lamp
is turned on.
Low Pressure Override: This switch allows a manual
override of the low pressure cut out switch activating only
the immersion heater but not the transducer.
-46-

Immersion Heater Connector; A Bendix connector locatedt
on the side Of the support connects the immersion heater "to
the control system. - '•
Controller Connectors: The side of the junction box
contains the connectors for the cables from the controller.
-47-

SECTION V . .
ALIGNMENTS AND ADJUSTMENTS
5.0 General /• • x
This section outlines the alignments and adjustments
which from time to time may be required to keep the instru-
ment in good running order. The optical adjustments
necessitate removal of the optical head and the attention of the
reader is directed to Section 6.1, Removal of Optical Head.
Electrical adjustments do not necessarily require removal of
the optical head from the tank assembly.
Test equipment required for the procedures outlined con-
sist of a signal generator capable of 5-10 Hz operation with
amplitude adjustable for 0 to 20 volts and a dual beam oscillo-
scope.
5.1 Reference Interferometer Alignment
Complete reassembly of the reference interferometer should
never be necessary. However, in the interest of completeness, a
brief outline of the complete alignment procedure is presented.
Set the reference frame into its receptacle and replace the
five screws (finger tight). Using a right angle reference de-
vice (e.g. a small square) align the top of the reference frame
to the flange immediately behind the cube. Place the drive am-
plifier in the manual mode and turn the instrument power on.
Using the light from the white light, move the reference frame
parallel to the flange to obtain best alignment of the apex of
the moving corner cube with the fixed corner cube. Tighten the
reference frame screws snugly. Square the reference frame
alignment jig with the reference frame and tighten solidly. Re-
place the laser mirror and align this item to give maximum output
-48-

on the mono (viewed via monitor jack). In a random fashion,
tighten the five screws on the reference frame to give a max-^
imum output. Now place the instrument in the sweep position
and examine the white light channel for a white light inter-
ferogram. If present but not triggering the instrument, increase
gain of white light preamp to maximum gain position. The white
light is maximized by moving the slide rail assembly up and down
in a controlled fashion by placing a screw in the adjustment jig
attached to the bottom of the cube. Iterate to the maximum
white light position using the reference frame and the slide
height adjustment. If the nominal value for white light is not
obtained move the reference frame parallel to the mounting flange
in small increments (4 .001 inch) using the reference frame align-
ment jig as a guide. The nominal value for the white light am^
plitude is given in Figure Number Fourteen.
5.2 Signal Interferometer Alignment
To perform the alignment it is first necessary to provide a
source and detector for the interferometer to produce an
electrical signal on which the alignment may be peaked. Assuming
this has been accomplished, insert the pinion gears into the
fixed minor assembly and with the interferometer scanning, adjust
for maximum interferogram size.
It is recommended that the piezo-electric controls be set
at the 12 o'clock position prior to mechanical alignment so that
full adjustment capability is available during cooldown.
5.3 White Light Sheer
White light sheer is defined as the equivalent physical
separation of the signal white light position and the reference
white light position. (Refer to Figure Number Seven, Typical
Waveforms) To adjust the sheer, the reference frame is simply
moved forward and back as required, using the reference frame
adjustment plate to maintain previous alignment and control the
amount of movement.
-49-

5.4 Monochromatic Preamplifier Offset
The DC coupling of the laser signal allows other sections: ;. : .1 . .
of the electronics console to detect when the laser is com-\ ' . • ^_
pletely off or its output is below a preset threshold. "These
conditions may be caused by a failure of the laser^in' the case
of no output or misalignment of the laser or deterioration of
the laser output/in the case of low output. The monochromatic
preamplifier offset can be observed through the monitor jack
with the selector switch on MONO. When the DC level of this
signal goes below approximately minus five volts, the logic .
circuitry commands the servo to stay in the reset condition.
This is .easily observed. With the instrument running, obstruc-
tion of the laser beam should stop the instrument from scanning
and the transducer should move back against the stops and
remain there until the obstruction is removed. The adjustment
potentiometer is adjusted through the front panel of the junction
box. The adjustment is made as follows: Obstruct the laser
beam and adjust the offset potentiometer for a DC offset of -
approximately minus five volts.
A slight modification of the above procedure is necessary
when the optical head is within the cryogen tanks since the laser
cannot be obscured physically. To simulate the obscured beam
turn the instrument power off, disconnect the high voltage cable,
turn the instrument power on and adjust the DC offset level.
Then turn the instrument off, reconnect the laser cables and
turn the power on.
5.5 Monochromatic Preamplifier Gain
The monochromatic gain potentiometer is available through
the front panel of the junction box. The adjustment is made to
bring the laser to a level of approximately two volts peak-to-peak.
NOTE: The monochromatic preamplifier offset and gain controls
are interactive. Therefore, when one adjustment is made, the
other signal should be noted as being proper before continuingoperation.
-50-

5.6 White Light Preamplifier Gain
The reference white light gain can be changed by adjusting
the potentiometer available through the junction box front
panel. The gain should be adjusted such that the sync is
generated on the peak of the white light interferogram. The
white light threshold is approximately 0.6 volts positive.
5.7 Velocity Adjustment
The velocity of the moving mirror can be adjusted by
approximately 10% via a trimpot available through the front
panel of the controller. The velocity can be determined by ob-
serving the frequency of the monochromatic output.
-51-

SECTION VI1 t •-
' OPERATING AND MAINTENANCE PROCEDURES
*.-_
6• 0 Preliminary Precautions ^" "
The following sections deal with the normal operating and
maintenance procedures. Again, the reader is cautioned to
familiarize himself with the contents of this section in its
entirety before attempting operation of the instrument.
Before running the instrument two cautions are advised:
1. NEVER ACTUATE THE "SWEEP/MANUAL" SWITCH WITH INSTRUMENT
POWER ON. THE TRANSIENT MAY DAMAGE THE INSTRUMENT.
2. THE HEATER CARTRIDGE SHOULD NEVER BE CONNECTED EXCEPT
DURING THE AUTOMATIC OPERATION PORTION OF THE RUN CYCLE.
6.1 General Comments
In order to assure proper cooldown of the cryogenic inter-
ferometer, certain instructions and safety precautions must he
followed. • .
The following instructions should be performed in the steps
indicated to insure proper operation. A purge cycle is initiated
prior to actual cooldown of the instrument. This cycle performs
the task of room temperature check-out of the instrument and
assuring that no moisture or other contaminants are within the
cryo-chamber or associated plumbing. The fill procedure defines
that period of actual liquid nitrogen transfer into the cryo-
chamber. During this time various electronic signals are monitored
as well as the instrument inside temperatures. These temperatures
indicate the rate of cooldown and any temperature gradients
which might exist during this phase of operation. . The pressure
build-up procedure defines that period in which the instrument
has been filled with cryogen and is being prepared for full auto-
matic operation. The top-off procedure is carried out after the
liquid' nitrogen level has dropped below the usable range as in-
dicated by the liquid level sensor. A dump procedure is followed
when the instrument has completed its function and is ready to be
-52-

brought up to room temperature. This is followed by a warm-up
cycle. Instrument warm-up is as important a function as the
proper purge and filling cycle for proper operation of the cry-
ogenic interferometer.
The detector procedures for filling and top-off will be
covered in the section on detector preparation and operation.
6.2 Controls and Their Functions
A. Fill Valve. A 1/2"valve admits cryogen into the cryo-
chamber and can be use to control the flow of cryogen such that
the rate of liquid nitrogen transfer can be controlled.
B. Dump Valve. This valve serves two functions: (1) to
allow thorough purging of the cryo-chamber; (2) provide a method
for dumping of cryogen for the start of a warm-up cycle.
C. Outer Tank Manual Relief Valve. This valve is actuated
during various procedures and serves a main controlling function.
The manual relief is opened for purging the gaseous nitrogen
bearing lines, used to control cryogen pressure and flow rate
into the cryo-chamber, and closed for the pressure build-up cycle.
D. Outer Tank Automatic Safety Relief. The safety relief
valve is set to relieve excessive gaseous nitrogen pressure build-
up in the cryo-chamber. It is this relief coupled with the heater
pressure sensor which make up the automatic pressure regulating
system.
E. Inner Tank Automatic Safety Relief. This relief has
been preset to discharge excessive pressure build-up in the inner
.instrument chamber.
F. Rupture Disk Safety Bonnets. Two rupture disks have been
incorporated to provide safety from over pressurization of the
instrument. One bonnet is located on the outer tank and one on
the inner tank. Each disk has been calibrated at liquid nitrogen
temperatures for a rupture pressure of 75 psi.
-53-

G. Instrument Pressure Gauge.. A large, 'easy to read
pressure gauge calibrated from 0-30 psi indicates both liquid';.:.!.. •
and gaseous nitrogen pressure heads, i.e. the pressure in the
outer tank.'.. ^ ~
. H. Heater Pressure Sensor. This device monitors the- - — • ,-"-
x-*'
pressure of the outer tank and actuates a switch when the
pressure in the tank is below the minimum operating pressure.
The switch is in turn connected to a cartridge type immersion
heater which when actuated stimulates nitrogen boil off until
the proper operating pressure is attained. Heater operation is
monitored by a panel light on the electronic junction box. When
power is applied to the heater, the lamp is turned on. The
sensor itself is located on the left hand pedestal of the forward
bracket.
I. Low Pressure Cut-Qut. To provide maximum safety and
reliability in operation a second pressure sensing control is
incorporated into the system. Its purpose is to continually
monitor the bearing line pressure just prior to the bearing. If
this pressure drops below a minimum value two precautions are
taken: (1) the drive coil is disconnected; (2) the heater
circuit is disrupted so that the element will not function.
This pressure is set below that of the heater cycle. The sensor
is located on the right hand pedestal of the forward support
bracket.
J. External Nitrogen Bearing Feed. A valve has been pro-
vided on the low pressure cut-out control so that external
gaseous nitrogen may be applied during cooldown. This has been
done because the normal external liquid nitrogen supply may not
be capable of maintaining sufficient pressure to insure running
of the instrument while cooling. Additionally, if sufficient
LN2 feed pressure is available line surges may preclude smooth
operation during a cooldown. A check valve located inside the
instrument prevents this external nitrogen from interfering with
the incoming LN» supply. This nitrogen feed is also used in
the purge cycle.
-54--

I
K. Window Jets. Four valve steins are located around the
interstage flange and control the flow of cold nitrogen gas
from the inner chamber to the outside of <the entrance lens.
Its purpose is to keep the lens from frosting. These valves
are closed for operation into an evacuated chamber,' and open
for room temperature operation.
-55-

6.3 Purge Procedure
A. Connect liquid nitrogen supply to fill valve.
B. Connect gaseous nitrogen supply to external nitrogen
bearing feed.
C. Open the following valves:
1. .Dump valve
2. Manual relief valve (both inner and outer tanks)
3. Fill valve
4. External nitrogen bearing feed
D. Apply 20 psig pressure to the external nitrogen bearing
feed. This applies sufficient bearing pressure to operate the
instrument.
E. Begin to apply liquid nitrogen gas pressure to the
cryo-chamber. This should be done slowly and with caution not
to allow liquid nitrogen to enter the cryo-chamber.
F. Allow this operation to continue for 15 minutes. This
will thoroughly purge the cryo-chamber and lines.
G. Close the dump valve and the external nitrogen bearing
feed valve. This will divert more of the purging nitrogen gas
to reach the inner tank plumbing and gas collector block.
Monitor the tank pressure gauge so that a pressure of not greater
than 5 psig is applied during this procedure.
H. Continue this procedure for 15 minutes at which time
the filling procedure may be followed.
6.4 Fill Procedure
Reapply pressure via the external nitrogen feed valve
and establish an operational condition of the instrument. With
the instrument in operation and all signals normal, increase
the liquid nitrogen flow so that the liquid phase is transferred.
Monitor both the front and rear temperature sensors using a
suitable resistance bridge. Care should be taken not to allow
-56-

a temperature differential of greater than 10°K to exist between
the front and>rear monitoring points. If such a differential
does exist th'en stop transferring LN2 and allow for equilibrium of
these temperatures. The cryo-chamber tank pressure can be allowed.
to exceed 10 psig if desired. -^
While filling, monitor all signal outputs from the reference
amplifier. As cooling continues adjustments will need to be
made in the white light and monochromatic preamplifier gains
and the D.C. offset. These should be accomplished at the
appropriate times as determined by the levels of the signals.
(Refer to Sections 5.4, 5.5, and 5.6.)
6.5 Pressure Build-Up Procedure .
When the liquid level sensor indicates the last resistor
has been immersed, liquid transfer should continue until the
liquid phase begins to come out the outer tank manual relief
valve. At this point the instrument cryo-chamber is full.
Close off the manual relief valve and fill valve. Close off
the liquid nitrogen tank supply. Caution should be exercised
not to trap liquid nitrogen between the fill valve and tank
supply. Disconnect the supply line from the tank if not fitted
with the proper safety relief devices.
Remove the instrument line cord, connect the heater cartridge,
and replace the instrument line cord. At this point pressure in
the main tank should begin to build-up. If the pressure does not
build-up to an operating condition by itself, depress the pressure
override switch until the system latches as indicated by the heater
lamp going off. Allow the pressure to build-up to 20 psig before
starting the automatic operation procedure.
6.6 Automatic Operation Procedure
Place the instrument into manual operation. With 20 psig
indicated on the tank pressure gauge,close the external bearing
feed valve. This allows the check valve to open and allow the
-57-

boil off nitrogen to flow to the bearing. Allow 15 minutes for
stability of the bearing to take place. Place the instrument in
automatic sweep operation. This completes the procedure.
When going to any other condition other than a-top-off
procedure, the heater cartridge must be deactivated.
6.7 Top-Off Procedure
Once the level indicator has dropped below the level
indicated for proper operation a top-off procedure should be
initiated as follows:
1. Place the instrument into manual mode.
2. Open fill valve.
3. Open manual relief valve.
4. Start liquid nitrogen flowing into system.
5. Continue until the liquid phase appears at the manual
relief valve.
6. This procedure assumes that the instrument remains in
manual mode during the top-off procedure.
7. Follow the procedures for pressure build-up and
automatic operation.
6.8 Dump Procedure
This procedure is given in the event the instrument has
completed its function and is required to be left unattended
for a long period of time. Given are the following instructions
to complete the dump phase.
1. Place the instrument in manual operation.
2. Close the fill valve if not already closed.
3. Connect a suitable line to the dump valve and direct
to a storage vessel for LN~.
4. Open the dump valve and discharge the liquid nitrogen.
NOTE; Assure that the window jets are closed tight.
-58-

5. When the liquid ceases to flow there will be
approximately 1/2" of LN2 left in the cryo-chamber.
6. Close the dump valve. Tank pressure may begin to
rise but will not be harmful to the instrument since
the safety reliefs provided will discharge this
pressure.
6.9 Warm-Up Procedure
In the event the instrument detector must be removed for
changes in the cold filters, a fast warm-up may be desired.
A simple procedure outlined below will hasten the warm-up
period to 12 hours rather than the normal 24 to 36 hours warm-up.
1. Follow the normal "Dump Procedures".
2. Connect a high volume pump, heat exchanger and
plumbing per diagram.
FILL VALVE HEATEXCHANGER
S PECTROMETEROPTICAL HEAD DIRECTION OF
RECIRCULATING FLOW
DUMP VALVE
AIRPUMP
3. With the fill valve, dump valve and manual relief valve
closed, turn on pump. Immediately open the dump and
fill valves. This procedure minimizes the amount of
warm air admitted into the cryo-chamber and the re-
circulation of nitrogen gas from the tank in closed
cycle fashion is very efficient.
-59-

4. In the event that pressure in the tank builds-up, the
manual relief valve may be actuated to relieve this
pressure. Extreme caution should be exercised not
to allow outside air from being admitted into, the
tank. A simple balloon tied to the relief valve and
purged with dry nitrogen will prevent outside air
contamination.
5. As a further aid to warming, the external nitrogen
bearing feed may be started once more.
6. Monitor the inside temperatures before attempting to
admit outside air to any part of the interferometer.
The inside temperature must be above the dew point
temperature for absolute safety.
.6.10 Maintenance Procedures
The three sections which follow present the three items
which will require either appropriate cautions or an explanation
as to procedure. These are: a description of the procedure
to be followed in the event the optical head is to be removed
from the main tank, replacement of the bearing feed line filter,
and general maintenance requirements.
6.10.1 Removal of Optical Head
As a general word of caution, at no time should the
spectrometer optical head be opened (this includes removal of
the detector) when there is danger that the inside temperature
is below the dew point. The following is a list of items which
must be removed from the instrument optical head to allow
removal of the interferometer.
1. The detector is removed by first disconnecting the
preamplifier to junction box cable and then removing six #6
cap screws from the bottom flange of the detector dewar.
-60-

2. Remove the stainless steel tube from the collector
block to the left hand pressure switch.•c.-,
3. Remove the stainless steel tube from the bulkhead to
the right hand pressure switch. //
4. Disconnect the heater cartridge connector and remove
the heater cartridge.
5. Remove the interstage flange assembly.
6. Remove the pressure gauge, street elbow, tee and 1/8 to
1/4 inch tubing fitting as an assembly.
7. To the side of the collector block remove the safety
relief; remove valve and nipple; remove elbow,tee and nipple as
an assembly.
8. Remove the handle on the inner tank relief valve;
remove valve and nipple; remove rupture disk and tee into
bulkhead as an assembly.
9. Remove the fill valve and nipple; remove the rupture disk
and tee into bulkhead as an assembly.
10. Remove inner tank safety relief.
11. Loosen the swagelock fitting then remove the four screws
on top of collector block; and remove and unscrew inner stem
assembly; unscrew collector block. (Note: Inner stem assembly
does not and should not use teflon tape pipe dope).
12. Remove handle on dump valve; remove valve and nipple;
remove elbow from bulkhead.
13. Set the entire instrument tail down on the floor
(entrance of spectrometer looking up).
14. Remove backing nuts on dump and fill outlets.
15. Remove five Allen cap screws on outer bolt circle;
remove four Allen cap screws on inner bolt circle. (Note;
The inner four bolts are backed with indium seals and should
be reassembled in the same manner.)
-61-

16. Remove the four screws which hold the junction box
into the support bracket, remove the seven spade lugs from the
terminal strip and swing the junction box clear of its
normal position.
17. Separate the faceplate from the main tank by approximately
two inches and rest the plate on suitable blocks between the
tank and the faceplate.
18. Remove the tubing connection immediately behind the
single stainless steel bulkhead fitting. At this point the
faceplate is ready to be removed.
19. Prepare a suitable resting place to the right side of
the instrument and approximately the same height, then carefully
remove the faceplate and place on this surface.
20. Disconnect the level sense lead connection (yellow and
orange twisted pair.)
21. Loosen the hose clamps which hold the check valve on
the upper left hand stay rod and slide the item off the end of
same.
22. Break the bearing feed connection on the upper right
hand corner of the cube.
23. Carefully remove the four stay rods.
24. Using spacers provided (two per rod) in the handle kit,
reinsert two of the stay rods into the threaded holes located
counterclockwise from the upper left hand and lower right hand stay
rod positions.
25. Install the handle provided between the two reinserted stay
rods.
26. Verify that the platform provided is prepared to receive
the optical head.
27. Carefully withdraw the optical head from the tank and
mount securely in the test platform.
-62-

28. Connect an appropriate air supply (filtered and
regulated to r*18 psi) to the bearing inlet.
29. Connect the two blue leads on the junction box to
simulate closed pressure switch and carefully shield the others.
(Note; These extra wires have line voltage on them.) ,>-""
30. Reconnect the chassis and junction box cables.
At this point the instrument is ready to be operated.
For reassembly, repeat the above steps in reverse order
with the following additions: .
a) Prior to reassembly, all fittings should be thoroughly
cleaned of old teflon tape and retaped with exceptions as .noted
above. (Step 11)
b) When reinstalling stay rods (Step 23) leave stay rods
fairly loose. The four Allen cap screws (Step 15) are started
in the stay rods through the faceplate and only then are the stay
rods tightened with access through the entrance port of the inter-
ferometer.
6..10.2 Replacement of Nitrogen Line Filter
An item requiring maintenance is a replaceable element in
the line filter located in the gas collection block below the
pressure gauge. It is quite simple to remove and replace the filter
element following these instructions:
1. Remove the stainless steel line to the heater control
unit (left side of instrument).
2. Remove four 8-32 Allen cap screws.
3. Loosen the swagelock fitting around the neck of the shaft
going into the collector box.
4. Remove the center rod by unscrewing the gauge and shaft
assembly. This removes the whole filter mechanism.
-63--

5. Remove the gauge and fittings to extract the
filter cartridge.
6. Clean all the stainless steel tubing and top
cap.
7. 'Clean and replace the "0" ring on the collector
block if necessary.
8. Reassemble the filter in the reverse order,
observe that the stainless steel square cap com-
presses the filter cartridge to insure a tight
fit. A light film of vacuum grease on the "0"
ring will insure a good seal.
6.10.3 General Maintenance
No other special instructions are necessary for any
part of the instrument, however, several general comments
should be mentioned with regards to maintenance. An "O" ring
seal under the detector must be inspected and cleaned after
every detector removal. If cracked or chipped it should be
replaced. The front entrance- lens should be inspected for
moisture and cleaned with alcohol if necessary. Since
moisture does collect during cold operation, a thorough
drying of the exterior should be accomplished after each run.
-64-

SECTION VII
ELECTRONIC SCHEMATICS
-65-

I +IZV
Sfi «V
tiCI '330pf) C* ' 310tf
2)
t-B'AS
O IZR
NtKT ASSY
oe*J6£/lKUSIO ON
APf'l ICAHON
4^0 DESCRIPTION V • ' PART. OR IDE^^• NO. 'J^**
UST OF MATERIALS . .UNLESS OTHERWISE SPECIFIED
DIMENSIONS ARE IN INCHES
FRACTIONS OLCIMALS-'; 1/M .X 3; J02OANCLES -XX :*: .010-x o* • is- .in •ar sxr>
FIHISH MAXIMUM
DO NOT SCALE THIS DRAWING
K/.UR1AL
M>1(3H
ORAVtN
APJ'I'OVFD /-^ /
'y/W
DATE
*Vr
Block. ELn^izucttn^^ff Lac.
/?M5
SUC COOt IDUT NO.
c'XAI.f
SUPPLY
DMAWING NO.
i If] LJ&/ ' (-'. / O
wtt l I
t
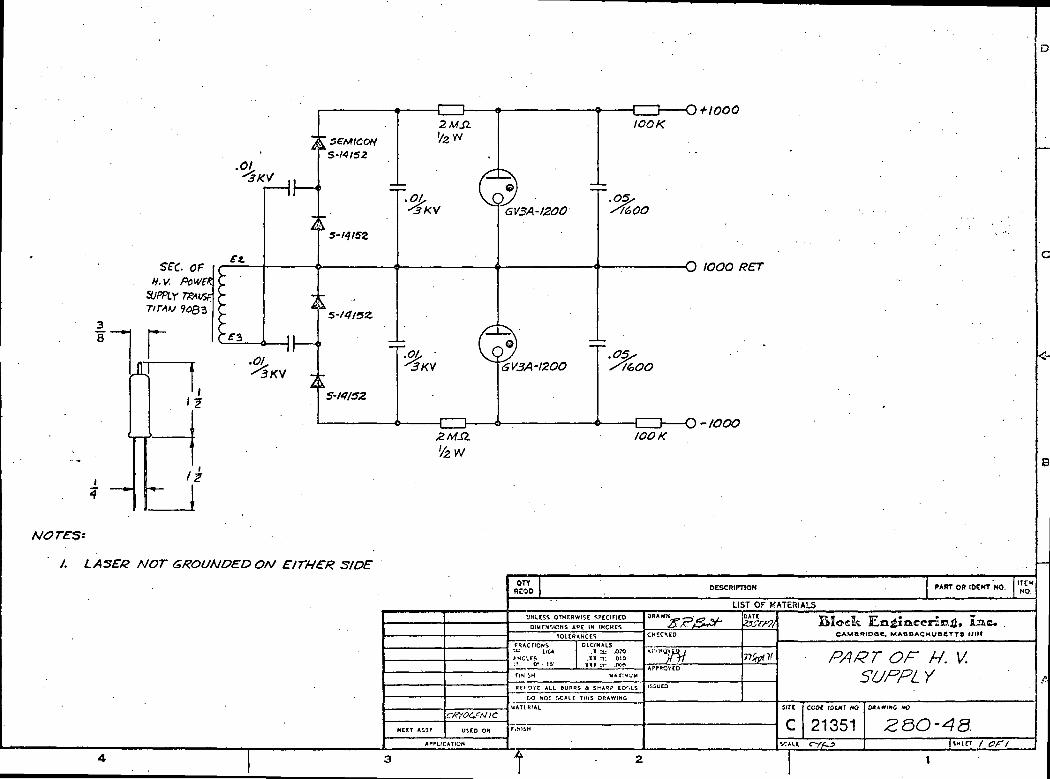
.01
SEC OfH.V. POWER
SUPPLY
et
r
•ttA
A
[ SEMICOH'S-/4/S2
S-W5Z
S-/4I5Z.
S-I4I3Z
2MSi.l/2 W
NOTES:
I. LASEG NOT GROUNDED ON EITHER 3IDE
-CD-
6V3A-I2OO
IOOK
/&OO
.OS,
IOOK
-O IOOO RET
\~IOOO
APPLICATION
OTTREOD
DESCRIPTION PART Oft IOCKT NO.
LIST OF MATERIALSUNLCSS OTMTRWISE SPECIFIED
rRACTIONS" 1/M
.:'- O- . IV
DECIMALS.X a; X>?0
.XX ^t .010
DO -SOI .OCALE THIS DRAWING
T
Block , ae.CAMBR1OOC. MAOSACHUaCTTS Itllt
PART OF H. V.SUFPL Y
sat coot icurr no
21351

AfPtlCATtCH
DESCRIPTION PART OR IOENT NO. *J£M
U5T.OF MATERIALSUNLC5S OTHCRWISt
'.:V!:»;i!0:'S ARE IN INCHES
DECIMALS.X a: .020
.XX.rf: 010. X X X :fc ,005
CO•HOT SCALE TKl^^BA WING
UATtRIAL*"1
DATE
APfROVEO
I%5UU)
Block n^,' Lnc.CAMBRIOOe, MA9BACHUOCTT3 Illll
WHITE LIGHT PREAMP.
COM ICUft HO.
o --•4
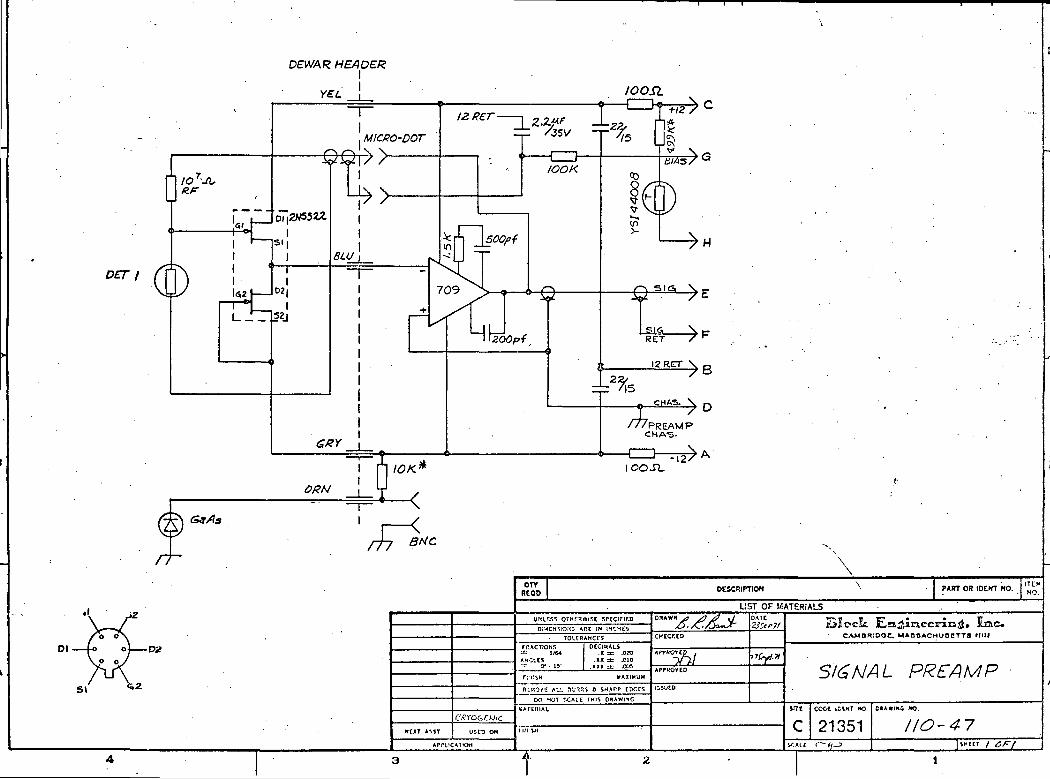
OeWAR HEADERI
YCL ' IOOSL
D£T /
/ 7
OTYREOD
DESCRIPTION PART. OR IOEHT NO.
UST OF MATERIALS
DIMLN'-.-OHS ARE tN INCHES
OCCIUALS.X = .OJO
.XX 3= JJ10. X X X ar ^»»
DO MOT r-CALC TMI5 DRAWI>C
BSccEtC AM B R: DOC. MABOACHUBCTTS «!lll
SIGNAL PREAMP
COOt iCtKT HO.
21351 110-47
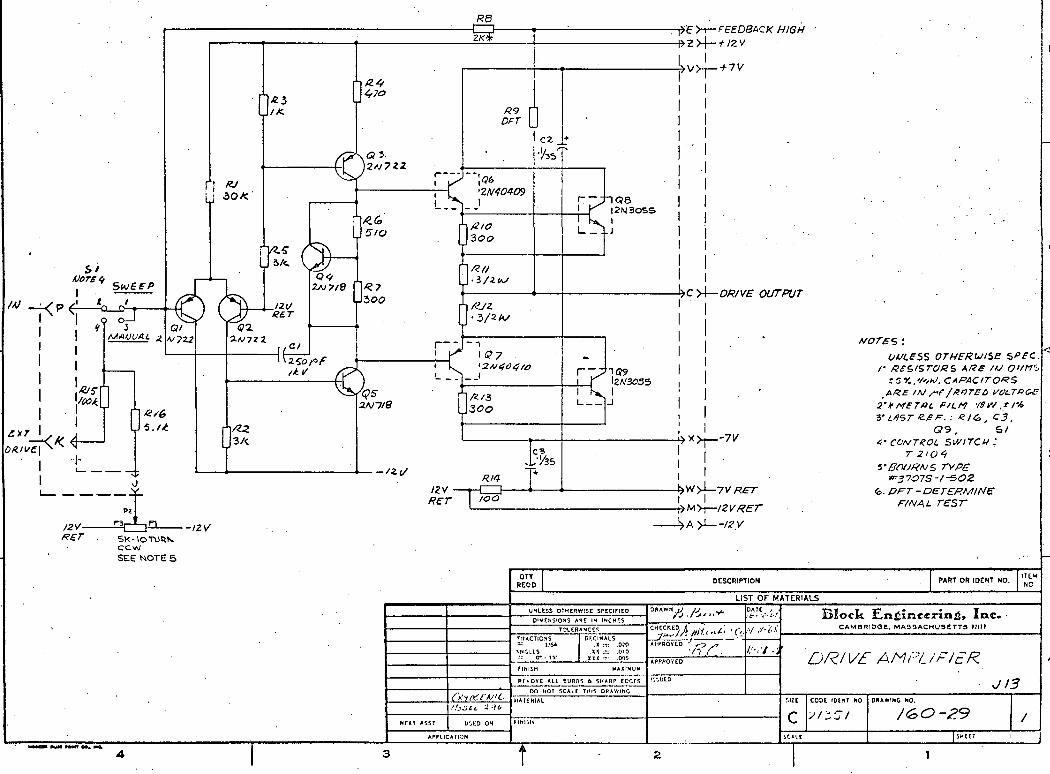
T^F >-r— FEEDBACK HIGHf>2>4- i-IZV
1»C >4—DWV£ OUTPUTM
SK-IOTUSSccwsee MOTE 5
&
'''•7'D"' "'
DESCRIPTION
LIST OF MATERIALS
uvt.ess OTHERWISE
AKE IU /"f /KUTEb 1/OL.TQU;
•*• cOHTK.OL SWITCH:< *TVPE
PART OR IDENT NO.
FfTACTIONS DtCIMALS.K m .0?0
BJocIi E,n££nitcrizi<5, Inc.CAMORIOOC, MA33ACHU8CTT3 IIDI
/\ A7/::Z //
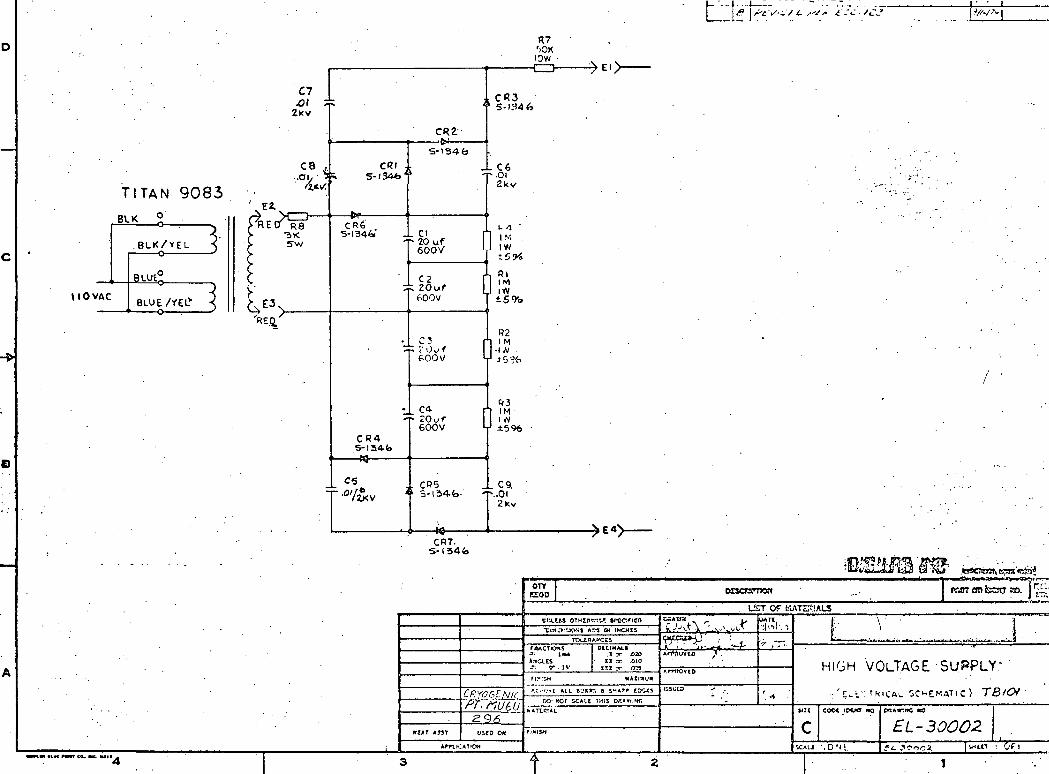
T I T A N 9083
BV.K
AC
. B L K / Y E L "
BLUE°
BLUE/Y£LV -
R7r)OKIOW
C7
cs ,.01, • >
H iR8
-
; . i
S-ISM,3
CR6•5-1346. -
C R 4
""* ,Ol f i/*?K V
CRZ
- 20 uf f600V '
»C ZOuf 1fOOV
C? fS i ' O o f
f-00 V ^
C* r: 20uf
600V L
CR5 _• S-134-fe- "
i tS3 1
• — : 1 1 ?
' 5-1346
- C6^.01
2kv
1 lS '1 IW
t5>4
1 ?MJ !YV
R2]l M
"oro
S IM1 W
1 ±596
; ca
2kv
V
CR7.S-1
296
OTT
>E«^
L ..I. ...\ f f
OESCT3PDOW rwrr era fcstr acx j r£?
OF t'
DECIMAL*.X 3- -020
XX :£ .010IK1 rr JT»
CJUU7I
ii \
HIGH VOLTAGE SUPPLY'
• 'E-i-: T'MCAL SCHEMATIC ) TBiOtC00< IDtKT M
•-CALI r . O ' t L
EL-300O2lt«U1 ! Of I
••MM «.WC MMM CO. MK. Mil

SL
77*K 300'K
OSIG
O SIS RET
OlERET
I - OCHASSISm
IO
o-v
OTYUEOO
DESCRIPTION
LIST CF MATERIALSUHI.F.OS OTHtRWlse
DIMCNStONS AftC IN INCHES
DECIMALS.1 =n *
.XI re ^1
[V> MOT SCALC THIS Lfl
T
fPBOVID
-VTT
Qlock,
PART CR IOEKT NO.
p Inc*CAMOR1OOC, MAROACHUaCTTO Illlf
St D^T P/^EAMP
COOI IDSMT »O
21351

SENSOR
O-I5
OTYreoo PART OK IOCKT NO.
UST OF MATERIALSuratss OTHCR-WISC
1
Block Effl^ineejrlra^, Is8.e.HC. MAHQACHUOCTTO Itlll
LEVEL SENSOR AMPLIFIER
COOt IDUT NO.
21351 183-07I OP I

_1 ? ___ ? -"-

A ^ o" ^
J
J7
1 1 ^11 ul_
V *
—
- C4
'«/«
»>\ 1
MOTES >i. Uk«.t55 oTMinwise SPtciFico RCSISTOIW ARI iu OHMS 1& w, ;sH
CAPACITORS Aur IW ^w*"». LA3T «LTRt>4Ct O»«NATiON?i P.23,C8,CR« ,QT
| 7 C
1 i-I i
4r ^-T-$ ^ -Jv^-t MV,-; ^X>»C. ^
i,L"iV^ XltTUwJ"'"''*"'*''"1!>n
• ID «rti
-:.— V1"'--^
«*«• •*,y., .,.,„„
BTT I
«-.«) 1
P4*T OH mijT « ^ *
LT1T CC K/UOAiS
I ^'" ofV"r^_.T=i'?^ .
'i*C-»>n
' UM
„__ .
--,"•' ~, 'P> I 1.7
•£"«- •«•"'« '»••••«' ""
-"»•—
'*"**
T 1
^f^-^J' K1:,
,- .u r ' —
«**Mt*
HMM
BIo«V E«£l«L«-r!n.S. Jtc.
D CoOI-CX, -/
^«. -M .. i W'i ' , i 1 4
a i

t tZVRS6ULATOH
o*
-CD-
&
Js
/f/f
•w-
IM») 1
II
w
_J
M0rra\
4. L*S7 fCFCXCKCf CXT^WATlOtSSt .
5. *?'uofl/£YW&*t. •• •*'< ' r 5 £/£ ""^ r*
"^ 1 ». 1 « 1 a t " ' *
•err A*T
*.«*-
i
"l/H '.'
er-'jTTiw"»w>«
>nn>
£Z>j
W«/H OV-f.Pw* V-W«0
' *V\,"""~'"'" '
^^ |"|T^n .M .-.-.-
_.. ; . ..:..-,.-. — ._ ._
•""•*'*•
f--tl />7 ''A
«ncim
LB
••'•"Vy/X --
T^TvrfCj^7
***j
•CM
rr or H
"" •..**»
<w
a
1 purr M of or n ' ,"
^TUHALJ
do<K £m/ij3r*rJjt In<ou.~««. —«„.,...„ —
POWER SUPPLIES
'
r> 2SO- If^ •
•«*u ..- '/ _» J*-t«- / ,;/.- f
\

I, ., ,:,"••1-- - t v f «,» tt,mo, o>
l""i"~
UNREOULMIO
I I I_ * i _ . x~ n
|7-»SOM|
( W I S H )
I
^M_V3"t VHC_X_T> PKV.V V\* O**.VV«>, V^^^iV.; <^'\ POVX^N-*- ~
. 10^ V.S^
*OT Ult
77-'777 ;7moe.
«"o oesctinoi .T[ *«T «" "^ « ! 'H.
l.'t
.. ,-.,...M >,-.,..„ —
• r -ri;:; ^ -
~v .......
_mi_'-'i,.!-v. • i -vi-'i-"•" . . •
"••*'
"~"V | • 1 \ « | B t A | 3
Lrt: of *
"'?•/•-. ..'; R"-1-.-.-' * '"
CV.OC.N6.
D SOI-03 . \2
1 • ' • '

NOTES: UNLMS OTWIBWIi. R«I«TOM APC u.7. CAPMrroRi ARC
a
B8 SPecir.eo1 Ouvt« »S7.,'/4MN^f/RATED VOVTAACTA.». FILM RCfttfiTOI^^ l».,Vaw
7 a T
•Hit .*.
.«.
£«^*£i-
U..n ,-
...-
OtT
«
» c
.".-".'••"—
.«.»
'"
.,!_»,..
)
«'- -••-•
,;: : s .
T-.~l— •"-'• .
O.K .
\.s
3^ -~- - — 1•IUAB
no*
: O* »
2ii£
i!M
a
1 ~<IO.««»t« ""
Block ELjaft£n£«Tifx&* La«-
POST AMPTHERM NETWORK;
METER DKiv£
"" ;-~-- -D /.I ->r>\ j/. l QO- I
V in ,—*«•
1

s&o
- «•»*«-
•07 O/A/7C
<m r.-.*M^MVo
STrun;y
W3^»1
* *O i
MX
«.-»«.
_n^T>"i>"
n
TJ" iVTiTrt t t»rt rr. I't-.'U '
..-.!« MIMJ
n>M^M j *~>i^vT
— tVf • >^~H;''£ .ii 5 —C*. >-» »L. I ;J KIWI
l"»
—.-3357/5-
Kouurttgmyv
Auno-ra* —k J
aNvsf, too at —k r *
HOlMCOd k O *

SlbNAL Pf.1 flMP BOA
SlbNAL mil-*- «JCABLE •"
' ^ > >v>—
~4^•- . .^i/y^r
>£.>->£> -
CABLE 3«M-cc
Y X^ Y
sll '11 £•
-W>on~ * ~
S C 0 F
1 1.
«=-ri . • - : • •mwl- i :0 I , i. siAf r -
1 I !
^ ^A ; - - ' ^•J'^liiiHlHlIITT | <L
T n S TT T ' TYYTTTTTTTTTTTTTA- K
S ?
a a
•
S* 8«

APPENDIX A
DETECTOR INSTRUCTION MANUAL

CENTERA Subsidiary of Hughes Aircraft Company .
75 COROMAR DRIVE. GOLETA, CALIFORNIA
INSTRUCTION MANUAL
MODELS 9144 AND 9145
June 1970

• • ' . ' ; . - . - " - • - • • ' • . - , . • ' . . ' . ' - . iSBRC I -»._ .j
• . ' C:ON T E N T S '-. • ' . , "
• - , • - / : \ '. : ' - • " ' :- ' ' '• Page
GENERAL DESCRIPTION 1
INSTALLATION' ' . . . . • x^C- • 2
OPERATION . 3 "
GENERAL OPERATION NOTES 7
MAINTENANCE 8 .
SAFETY PRECAUTIONS • 8
INTERCHANGING DETECTOR PACKAGES ' 10
APPENDIX
INSTALLATION AND PARTS DRAWINGSDETECTOR DATA SHEET
SANTA B A R B A R A R E S E A R C H CENTER A i i

SBRC
L I Q U I D H E L I U M D E W A R .
SBRC MODELS 9144 and 9145
GENERAL DESCRIPTION . /\
Santa Barbara Research Center Liquid Helium Dewars, Models 9144 and
9145, are designed for airborne low-vibration environment. Pertinent instal-
lation details are shown in Drawing 9592 for Model 9145 and Drawing 9598 for
Model 9144. s
The liquid helium (LHe) is shielded from radiation heat loading by a
helium exhaust gas cooled shield. This dewar does not use liquid nitrogen
(LN^) for radiation shielding although LN£ may be used to precool the reser-
voir, and thus conserve LHe.
Models 9144 and 9145 have a LHe capacity ranging from 0. 4 to 1.5
liters. Helium consumption, after the dewar and shield temperatures stabi-
lize, is typically 0. 1 liquid liter per hour. From 0. 1 - to 0. 2 liter of LHe is
typically expended in initially stabilizing the temperature of the shield.
Cell data for the detector is recorded on the accompanying data sheets
in the Appendix. • • .
SANTA B A R B A R A R E S E A R C H . C E N T E R A l

SBRC i
mSTALLATION
F o r installations o f dewar proceed a s follows: ' « • • _ ' .
1. Unpack the dewar and examine it for evidence of any physicaldamage. If the detector window is transparent, the detector andcold shield should be seen to be concentric with the window.This is true except for a side looking dewar where they, will beseen low and off center. This is to compensate for shrinkagewhen the dewar is cooled.
2. Shake the dewar carefully to determine that no internal parts areloose. The assembly should have a "solid" feel. The dewar willwithstand up to lOOg shocks and although carefully packed, it canbe damaged by careless handling.
3. If any damage is detected, enter a claim with the carrier andadvise SBRC of the damage.
, The dewar is shipped with a partial vacuum. Maintain a vacuum of 10"^
mm Hg or better at all times to avoid oxidation of highly polished internal sur-
faces and contamination of the detector surface.
The dewar is designed for mounting on the front flange. The mounting
hole pattern is shown in the outline and mounting drawing. (See Appendix)
Note that the window is recessed in its mounting plate to prevent damage when
the dewar is 'placed on a flat surface.
Detector leads terminate in a Microdot 51 -232 coaxial receptacle mounted
on the case. Low-noise cable, Part No. 250-3804, and connector, Part No.
32-21, may be purchased from Microdot Incorporated, 220 Pasadena Avenue,
South Pasadena, California, 91030. These parts are used to connect the detec-
tor to a preamplifier. The optimum bias power for each detector is shown in
the data sheet in the appendix. Detectors over 3mm in size will generally have
one detector lead grounded to the dewar unless otherwise ordered.
S A N T A B A R B A R A R E S E A R C H C E N T E R A 2

OPERATION .
Preparation for Filling
Several filling methods are available depending on 1) the method of
operation, 2) the quantity of LHe available, and 3) the vacuum attainable.
If the dewar is easily removable from its associated equipment it is preferable
to remove it during filling. Repumping of the dewar before each use is not
necessary, but may be desirable as will be discussed later.
A combination mechanical forepump and diffusion pump system are gen-
erally required to obtain a good insulating vacuum. Connection to the vacuum
pump may be made with a rubber vacuum hose.
Do not attempt to lift the evacuation stopper until the vacuum pump has
equalized the pressure, then life carefully to prevent loss of the O-ring on the
stopper. A permanent type of evacuation fitting is standard. The dewar is
fitted with a No. 40081 permanent fitting. To open it, extend the rod past the
guide pin and rotate to hold the evacuation fitting open.
To obtain a recommended starting vacuum of 1 X 10" 5 Torr (mrn Hg) or
better, proceed as follows:
1. Pump the flask with the diffusion pump system for 1 hour ormore.
2. Use an LN^ or CO^ cooled trap in the vacuum line to protect thedewar from contamination from the pump back streaming.
3. Close the evacuation stopper very slowly; hold the stopper inplace until the pressure is returned to atmospheric above thestopper. '
The dewar may be operated with starting pressures higher than 10
Torr if required. At least 10~4 Torr is required if the flask is to be pre-
cooled with LN^. .Pressures higher than 10"1* Torr do not provide sufficient
insulating vacuum for LN2 pre -cooling. If a mechanical forepump is the only
pump available, use an LN2 or CO? cooled trap in the vacuum line to protect
the dewar from contamination from the pump back streaming.
S A N T A B A R B A R A R E S E A R C H C E N T E R ' A 3

Successful operation is possible without initial vacuum in the dewar;
however, gasses may condense on the detector and blind it. Contamination
of the detector .and'dewar can also.be caused by operating without initial
vacuum; therefore, it is riot normally recommended.
Pre-Cooling the Ejewar " ,- T
To pre-cool the dewar, proceed as follows: . J^-
1. Remove the entire teflon neck plug assembly while filling.
• 2. Pre-chill the dewar by filling with LN?- This conserves LHebecause about 95% of the heat is removed from the inner dewarby pre-cooling to LN? temperature.
3. Pour out the LN2 immediately and fill the dewar with LHe. ';
NOTE • .
Maximum partial shield pre-cooling is achieved in about 1 hour.Additional pre-cooling (keeping the flask filled to the neck) orpre-cooling for up to 2 hours will produce a slight additionalrunning time. Pre-cooling the shield lowers the initial heliumboil-off rate, saving from 0. 1 to 0. 2 liter of helium and extend-ing the running time by 1 to 2 hours.
4. If it is-inconvenient to pour or pump the LN-, out of the dewar,pre-chill the inner dewar before filling with LHe, or pour 50
• grams (63 cc) of LN£ into the dewar, using a paper funnel. Ifa glass or metal funnel is used, the funnel must be pre-chilledor allowance made for the LN^ evaporated by the funnel. Thisamount will boil off in approximately 5 minutes, at which timethe LHe may be added.
Filling the Dewar
A suitable vacuum insulated transfer line must be used when transferring
liquid helium. A helium transfer line is recommended with an extension 1/8
to 1/4 inch in diameter and at least 6 inches in length to enter the dewar neck.
In long dewars or dewars with extended snouts, the fill line should extend to
within a few inches of the dewar bottom. Transfer lines are manufactured by
the Linde Company, 270 Park Avenue, New York, New York; Sulfrian
Cryogenics, Inc., 391 East Inman Avenue, Rahway, New Jersey; and Hofman
Laboratories, Inc., 225 Parkhurst Street, Newark, New Jersey. The Sulfrian
SANTA B A R B A R A R E S E A R C H CENTER A 4

Drawing No. A-6222-1 Hofman Bulletin 3007 are suitable types. The manu-
facturer will need to know the dimensions of the supply dewar. The LHe fill1 » •-
line is usually available through the supplier of LHe. A supply of gaseous
helium at about 1 to 2 psi, which may be provided by a cylinder of helium
fitted with a pressure regulator is usually required to transfer from the
supply dewar. Slow rates of transfer of liquid helium are most economical
when filling.
To fill the dewar proceed as follows:
1. Pre-cool the transfer line by slowly increasing the pressure onthe supply dewar. To prevent the warm helium gas from re-warming the pre-chilled dewar do not insert the fill line untilthe issuing gas is near LN^ temperature.
2. Insert the fill line so that only 1/2 inch of uninsulated line is out-side the dewar neck. Detector resistance may be measured asan indication of the moment that LHe is entering the dewar. Apronounced increase in the vapor effluent indicates that thereservoir if filled with liquid helium.
3. Quickly lower the pressure on the supply dewar and remove thefill line from the detector dewar neck when the dewar is full.
4. Install the teflon plug and stopper to provide proper shieldcooling.
Transfer losses will be about 1 or 2 liters and may be as high as 5 liters
or more depending on the filling techniques. With low filling pressure (1/2 to
1 psi) the amount of LHe required to fill the dewar with no initial vacuum and a
5-minute LN? pre-chill is the same as with a good vacuum and a 2-hour pre-
chill. Pre-cooling of the radiation shield will lower the initial boil-off rate and
provide 1 to 2 hours of additional running time.
SANTA B A R B A R A R E S E A R C H C E N T E R A 5

To further extend the running time, top off the L,He 1. hour after filling.
Pre-cooling of the transfer line, and slow topping off, is essential to avoid
blowing out the LHe in the flask. The maximum operating time is attained
when the shield is cooled to equilibrium and the boil-off rate is stabilized,
which occurs from 1 to 2 hours after filling with LHe regardless of the pre-
vious dewar and shield precooling by L,^. The initial helium gas boil-off
rate may be as high as 20 liters per minute or as low as 3 liters per minute,
depending on the pre-cooling. The equilibrium boil-off rate is typically less
than 1 gaseous liter per minute.
SANTA B A R B A R A R E S E A R C H C E N T E R

GENERAL OPERATIONS NOTES ^ ... \
The plastic neck plug and its stopper are designed to assist in the heat
transfer from.the flask inner neck and radiation shield to the exhaust helium
gas. The plug snust be in place in the neck for efficient operation. It is\ ' • . - - - - .
desirable to pre-cool the plug in LN-, before emplacement. The plug should
be loose in the neck when helium is in the flask. Additional protection against
helium pressure build up is afforded by the silicone rubber stopper in the plug.
Push in only tight enough to prevent leakage of exhaust helium. Do not force.
If relief valve, Part No. 9773, is used, the metal and plastic central plug
must be in place if proper heat transfer is to take place.
The cryopumping action of the LHe will produce a vacuum of 10~. Torr
or better in the flask. The pressure is principally due to hydrogen which has
a vapor pressure of 10-6 Torr at 4. 2°K. The hydrogen outgasses from theo n
metal parts of the dewar. (Nitrogen is pumped to below 10 Torr). The low
pressure promotes outgassing of warm portions of the dewar. When the helium
is exhausted, the pressure in the vacuum space will rise to a pressure depen-
dent on the previous vacuum history and cleanliness of the dewar. With a
relatively new dewar, this vacuum is often not sufficient to provide the insula-
tion required for the flask to hold LN,. The residual.vacuum will improve
with use and repumping. ' '
SANTA B A R B A R A R E S E A R C H CENTER

SBRC
MAINTENANCE
Periodic vacuum pumping is required to protect the detector and remove
residual helium gas. Since the LHe freezes out all other gasses, it is the only
gas which can spoil the insulating vacuum. An air leak of 10"^ std cc per
second will reduce the running time by 1%. A helium leak of lO-~ std cc per
second will spoil the insulating vacuum in 1 hour. Thus, it is apparent that
a relatively large air leak is tolerable provided no helium enters with the air.
Vacuum Leak . :
If a vacuum leak is suspected, proceed as follows:
1. Use a helium leak detector to locate the leak.
2. If O-rings are faulty, replace with new O-rings of butyl rubberhaving a hardness of 70 durometer.
3. Lubricate all O-rings with a very light film of Apiezon grease,preferably or Dow Corning silicone vacuum grease.
4. Use all care to prevent the accumulation of water in the innerdewar. Water freezing in the inner dewar joints can expandthe joints and cause a leak.
SAFETY PRECAUTIONS
WARNING
Exercise caution when using any liquefied gas. The extremely low-temperature liquids can cause injury to the skin and eyes. Use glovesand face shield during liquid transfer operation.
During the time that the dewar contains liquid helium, the plastic plug
in the neck must be loose and free to move. Take proper care to see that
water does not collect in such a manner that the plug becomes frozen in place.
Upon changes in altitude, use caution to see that air is not drawn into the
dewar neck. The low temperature will solidify the air, thus plugging the neck
a potentially harzardous situation. A rate of increase of ambient pressure in
excess of 0. 2 psi per minute (or 1, 000 feet-per-minute altitude loss) is suf-
ficient to draw air into the dewar. The plastic neck plug with its silicone
rubber stopper provides a measure of protection against this hazard. If,
however, the neck becomes plugged, the frozen air plug must be removed
S A N T A B A R B A R A R E S E A R C H C E N T E R A 8
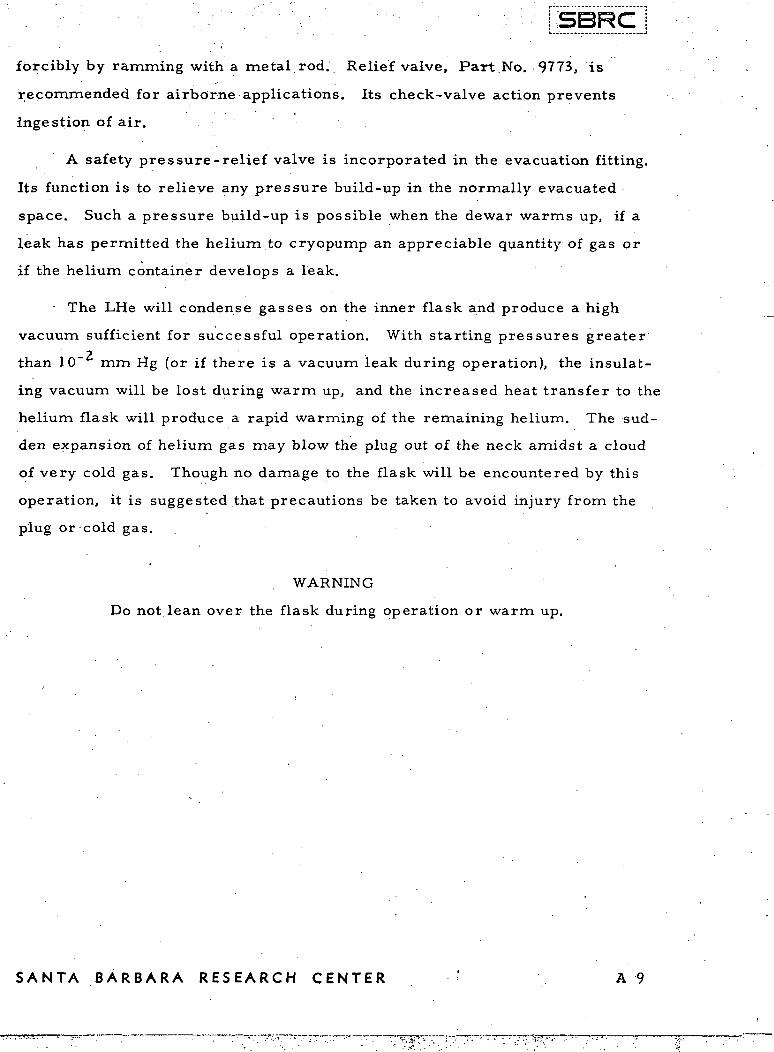
. . - • • ; • • ' v • • • • ' ; . : - . - • [SBRCj
forcibly by ramming with a metal rod. Relief valve, Part.No. 9773, is
recommended for airborne applications. Its check-valve action prevents
ingestion of air.
A safety pressure-relief valve is incorporated in the evacuation fitting.
Its function is to relieve any pressure build-up in the normally evacuated
space. Such a pressure build-up is possible when the dewar warms up, if a
leak has permitted the helium to cryopump an appreciable quantity of gas or
if the helium container develops a leak.
• The LHe will condense gasses on the inner flask and produce a high
vacuum sufficient for successful operation. With starting pressures greater
than 10" mm Hg (or if there is a vacuum leak during operation), the insulat-
ing vacuum will be lost during warm up, and the increased heat transfer to the
helium flask will produce a rapid warming of the remaining helium. The sud-
den expansion of helium gas may blow the plug out of the neck amidst a cloud
of very cold gas. Though no damage to the flask will be encountered by this
operation, it is suggested that precautions be taken to avoid injury from the
plug or cold gas.
WARNING
Do not lean over the flask during operation or warm up.
S A N T A B A R B A R A R E S E A R C H C E N T E R ' A 9

APPENDIX
INSTALLATION AND PARTS DRAWINGS
DETECTOR DATA SHEETS
S A N T A B A R B A R A R E S E A R C H C E N T E R

All

A12

f
^i«UJ • =
OC I £
^8
alo:
r-r-
u
IT <P
A13

r~ (3
j
oocro
:U
IS
I
35 s z;S §«<& ^ s
is ^: d w w
J u» -.: a . & 2
S5u
Z UJ I
A14

SB
Sits
«•«£
IDa
3 aS 2
•* i/
"J S
§3
.;
isI "
<D iiS ^0- • «
01 ? u. 221° Z3 rf ill 3
A15

I
SK
Iu.
8
,1!S"° 2Is-
o <?>
I!. 5 i
IP
5
j u
<flSO1 I
ir z »•? z g
s § S? a 3? aill* :
W3 C 5-is a
Si*S 8 ** si8*3
A16

APPENDIX B
TAPE RECORDING OF ANALOG OUTPUTS
Section 1
1.0 Instrumentation~
The recording of the analog outputs from the spectro-
meter requires the use of the interferometer optical head,
the interferometer spectrometer controller chassis and an
analog tape recorder of sufficient bandwidth as dictated by
Tables 1 and 2.
1.1 Data to Be Recorded
Two outputs from the spectrometer are to be recorded;
namely the signal (or interferogram and the composite sync
(the combined trigger and clock). These waveforms may be
obtained at the labeled test points on the controller front
panel.
1.2 Required Bandwidth
The bandwidth requirements for the analog tape recorder
are determined by the particular instrument being used. The
table below lists high frequency requirements for both signal
and sync assuming that the spectrometer is running with a re-
tardation rate which produces a 10 kHz mono-frequency. (This
can be examined via the monitor output on the controller
chassis front panel.) Mono-frequencies other than 10 kHz are
reflected in a proportional change in the frequencies listed,
e.g. a 5 kHz mono-frequency would produce a 10 kHz sync
frequency for sampling interval, 1/2.
Bl

Sync
20 kHz
10 kHz
5 kHz
2500 Hz
1250 Hz
625 Hz
Signal
10 kHz
5 kHz
2500 Hz
1250 Hz
625 Hz
312 Hz
•Table No. 1
Highest Frequency
Sampling Interval
1/2
1
2
4
8
16
NOTE: The above table is valid only for a 10 kHz monosignal.
The low frequency response is not as easily determined
.since it is related to both the mono-frequency and to the
longest wavelength (i.e. lowest optical frequency) of
interest. Again, for the case of a 10 kHz mono-frequency,
the following table is presented.
Table No. 2
Longest Wavelength (y) Lowest Signal Frequency
1.25 5000 Hz
2.5 2500 Hz
5 1250 Hz
10 ' ' .. 625 Hz
20 '312 Hz
30 . 200 Hz
40 150 Hz
By using the above tables one can determine the necessary
frequency response for the analog tape recorder.
B2

Example X: ;A typical InSb application -• ;» I. -i.
Honb-frequency = 10 kHz
Shortest wavelength of interest = 2 microns. ""^
Longest wavelength of interest = 6 microns'
Since the shortest wavelength of interest is two
microns, the required sampling interval is 0.6328y or sample
1, i.e.
' H. N(0.6328y) .«
for N. = 1.where N is the sampling interval. From Table 1, •
it is seen that the sync channel must have a 10 kHz response
and the signal channel a high frequency response of 5 kHz.
The longest wavelength of six microns requires response to
approximately 1 kHz (from Table No. 2). .
Example 2: A typical TGS application -
Mono-frequency = 10 kHz
Shortest wavelength of interest - 2.6 microns
Longest wavelength of interest =, 25 microns
By the same reasoning as in Example 1, the sync channel
requires a 5 kHz response while the signal requires a band-
width of approximately 200 to 2500 Hz.
Section 2
2.0 Use of the Analog Tape Recorder :
When using a multiple track recorder, only one pre-
caution is urged. The two channels allocated to the inter-
ferometer should be chosen so as to lie on the same head
B3

stack and as near to each other as possible. In an IRIG
standard configuration machine with dual record head stacks,
the odd numbered channels are on one stack and the even
numbered channels are on the second stack. The tracks
chosen on an IRIG machine would thus be two even or odd
numbered tracks* The effect of this selection is to minimize
the phase error between the recorded sync and signal. The
tracks may be either FM or direct provided they have the
necessary bandwidth.
The tape recorder channels should be aligned as out-
lined in the instruction manual for the particular machine
being used. The channels should be aligned for a normal full
scale input of 6 volts peak to peak for the sync (at the
frequency of the sync to be recorded) and for a 20 volt peak
to peak signal level input (at a frequency approximately in
the center of the frequency response region) for the signal
channel. . .
NOTE: If the targets being observed are of such a low
intensity that the spectrometer signal output is always less
than a 20 volt peak to peak value in the highest gain position,
it is advisable to set the signal channel on the recorder for
a smaller peak to peak value (as determined from observation
of the target) in order to minimize the effect of the tape
recorder noise*. A word of caution in this regard is appro-
priate. Since the signal waveform (interferogram) is likely
to be unsymmetric about zero volts, the peak to peak value for
which the tape recorder is adjusted should be twice the largest
zero to peak excursion in the interferogram.
* One should establish the residual tape recording amplifierand tape noise in terms of volts equivalent at the input inorder that the full dynamic range of the tape system be ex-ploited at all times.
B4
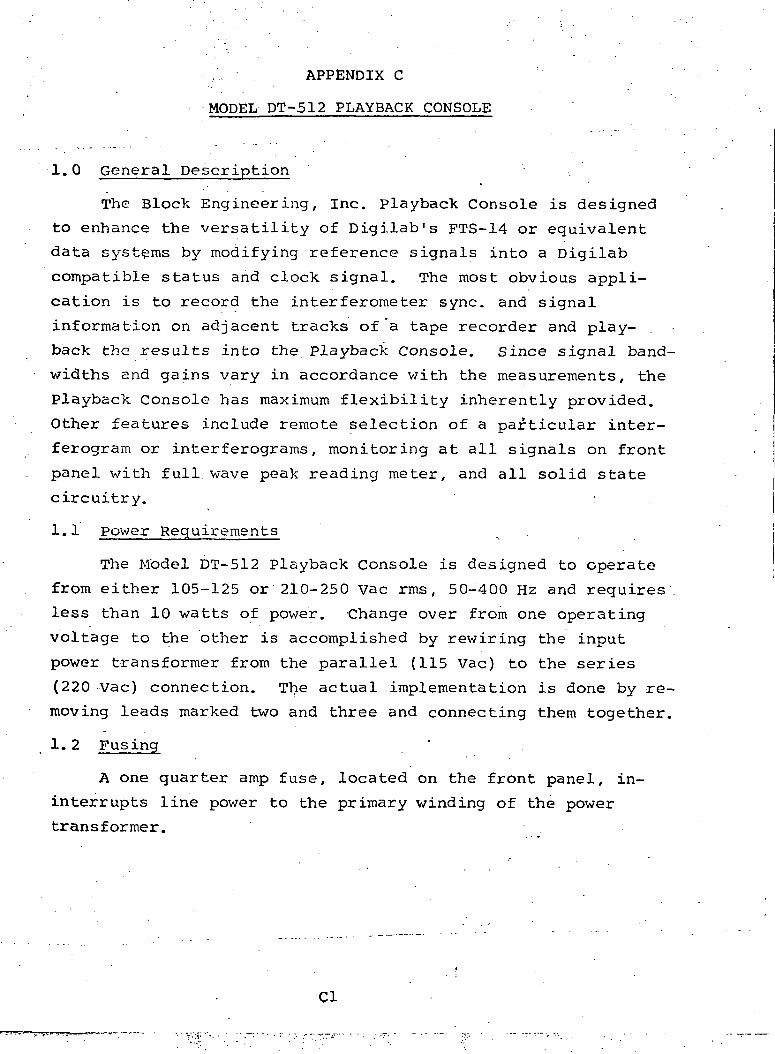
APPENDIX C
MODEL DT-512 PLAYBACK CONSOLE
1.0 General Description
The Block Engineering, Inc. Playback Console is designed
to enhance the versatility of Digilab's FTS-14 or equivalent
data systems by modifying reference signals into a Digilab
compatible status and clock signal. The most obvious appli-
cation is to record the interferometer sync, and signal
information on adjacent tracks of a tape recorder and play-
back the results into the Playback Console. Since signal band-
widths and gains vary in accordance with the measurements, the
Playback Console has maximum flexibility inherently provided.
Other features include remote selection of a particular inter-
ferogram or interferograms, monitoring at all signals on front
panel with full wave peak reading meter, and all solid state
circuitry. :
1.1 power Requirements
The Model DT-512 Playback Console is designed to operate
from either 105-125 or 210-250 Vac rms, 50-400 Hz and requires
less than 10 watts of power. Change over from one operating
voltage to the other is accomplished by rewiring the input
power transformer from the parallel (115 Vac) to the series
(220 Vac) connection. The actual implementation is done by re-
moving leads marked two and three and connecting them together.
1.2 Fusing
A one quarter amp fuse, located on the front panel, in-
interrupts line power to the primary winding of the power
transformer.
Cl

1.3 Warm Up Period . "•- • - /: ;
Approximately one second assures all circuitry operating
in their/quiescent condition. .' .
1.4 Temperature Range •
The instrument can be operated over an environmental
temperature range of 10° to 50°C without any change in per- --^
formance. . '
1.5 Operating Procedure
Data recorded on a tape recorder is transferred to the
Digilab data system via the playback Console as follows. :
Connect the playback Console input cable (drawing number C-920-42)
to both the playback Console and magnetic tape recorder. Note
the input BNC's are marked signal and reference respectively.
Be sure to connect these inputs to the correct outputs of the
tape recorder. Connect the Playback Console Input/Output
Interface cable (drawing number C-920-41) to both the Playback
Console and Digilab data system. ,
All that remains is turning on all instrument power and
using the Digilab data system exactly as it was utilized with a
standard interferometer chassis and optical head.
NOTE; • ' • ; - . - •
The Model DT-512 Playback Console has a start and stop
switch on the front panel. These commands are carried to a
rear panel connector (Bendix PT07C-14-85) for remote usage. If
the stop button is pushed the trigger and clock signals will be
inhibited and not be carried to the front panel output connectors
or to the Digilab data system. The first scan after pushing, the
start button (or remote level change at the rear connector) is
C2

transferred to both the Digilab data system and the front
panel output jacks. This is necessary when the operator
desires to select exactly a particular scan or scans at high
scan rates.*.-.
The sensitivity switch should be set for maximum signal
on the meter but less than 100% deflection. Note: /The monitor
switch must be in the signal out position for this measure-
ment. The sensitivity switch is explained in more detail in
the electronic description section. -
To accurately monitor the signal level, an oscilloscope
may be connected to the signal tack on the front panel.
The monitor jack on the front panel allows the operator
to measure externally the signals presented to the meter.
These signals are (going in a clockwise rotation of the knob)
signal in, reference, signal out, trigger, and clock.
C3

2.0 Electronic Circuits
Figure number 1 is a simplified Block Diagram of Block
Engineering, Inc.'s "Playback Console". Its purpose is to
give the first time user more sure footing before looking at
the .Block Engineering, Inc.'s schematic drawing number £920-39,40
The electronics circuits can be divided into seven groups:
the signal channel, low pass filter, Schmitt trigger, absence
detector, gates, meter circuit arid power supplies.
2.1 Signal Channel .s
The signal channel consists of one low pas^ filter and
one adjustable gain post amplifier. The frequency response
must be consistent with the signal information. Generally, a
3 pole Bessel lowpass filter is employed with roll off beginning
at 10 KHz. A five position switch adjusts the gain as follows:
2, 6.67, 20, 66.7, 200. On the concentric shaft an additional
continuous 3x change in gain is provided.
2.2 Reference Low Pass Filter
• A Bessel 3 pole linear phase low pass filter is employed
with rolloff beginning at 10KHz. An operational amplifier is
used for enhancing the performance.
2.3 Schmitt Trigger ••
A standard operational amplifier•Schmitt trigger is used
with the hysteresis centered around zero volts. The hysteresis
is set for approximately .2V at 5 KHz. This now allows a sine
wave input to correctly trigger T^L logic gates.
C4

P/.AVB/J6K CONSOLE BLOCK
POST. AMPa
Npass
TRIG-.
~>
STOP
C5

2.4 Absence',.-.,, :.
The absence detector is simply a nonretriggerable multi-
vibrator such 'as the Fairchild ylogic 9601. If a second input
transition occurs before the RC holdoff of the absence detector ••-'
the output stays high. This allows a level to exist for a
given input clock frequency, hence the trigger signal.• • * •
2.5 Gates ' ..
The gates are used to logically allow nondestructive scans
by always letting a remote start or stop command to be initiated
on a trigger transition. Consequently, two three input gates
act as an RS flip flop to store the start or stop command. This
in turn is presented to the gates through a D type edge triggered
.flip flop on the trigger transition. This circuitry enables you
to pick a particular interferogram, especially practicle if high
scan rates exist.
2.6 Meter Circuit
The meter circuit is simply a full wave peak reading am-
plifier. This is useful when dealing with interferograms.
2.7 Power Supplies
Input supply voltage is 115V ac rms + 10%. The internal
voltages are regulated at + 12 volts, - 12 volts and + 5 volts
approximately. , '
C6


![Fourier transform spectrometer in the visible on ... · Scanning Fourier transform spectrometer in the visible ... , such as a photodiode array or a CCD. In the time‐ ... [25],](https://img.dokumen.tips/doc/110x75/60746766c412702fe226f289/fourier-transform-spectrometer-in-the-visible-on-scanning-fourier-transform.jpg)


![FOURIER -TRANSFORM INFRARED SPECTROMETER [FTIR]](https://img.dokumen.tips/doc/110x75/587539961a28abe7728b6867/fourier-transform-infrared-spectrometer-ftir.jpg)