Embed Size (px)
Citation preview
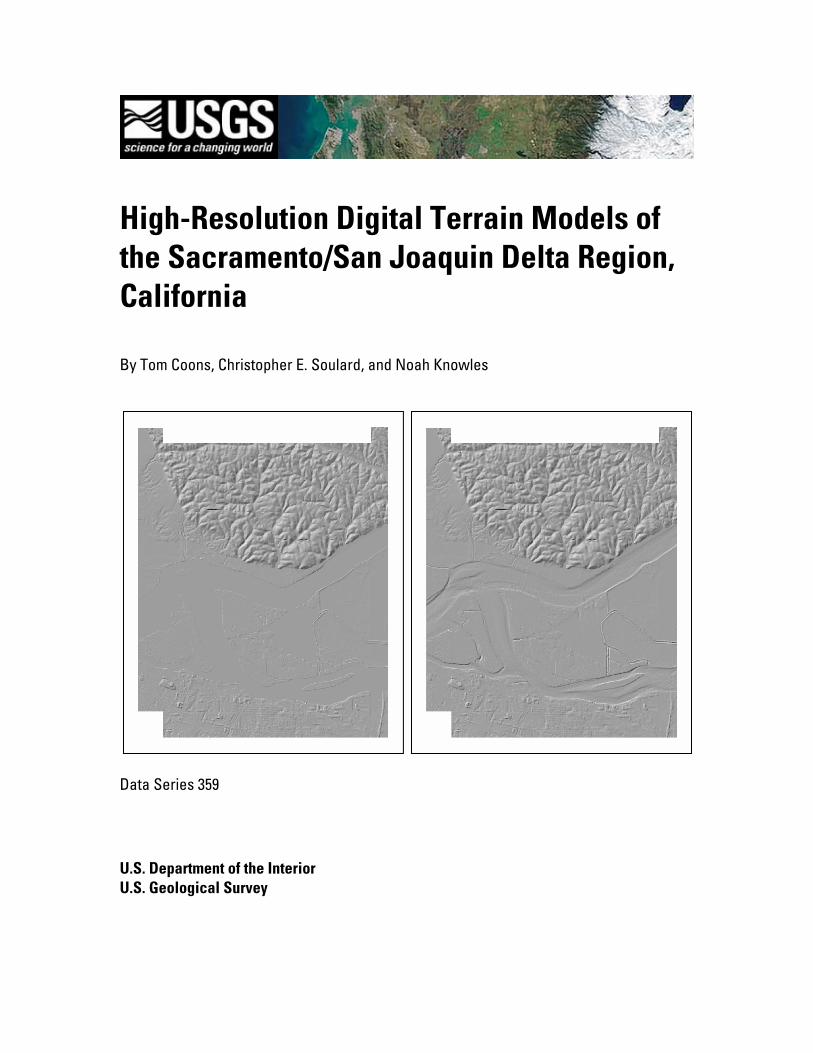
High-Resolution Digital Terrain Models of the Sacramento/San Joaquin Delta Region, California By Tom Coons, Christopher E. Soulard, and Noah Knowles
Data Series 359
U.S. Department of the Interior U.S. Geological Survey
U.S. Department of the Interior DIRK KEMPTHORNE, Secretary
U.S. Geological Survey Mark D. Myers, Director
U.S. Geological Survey, Reston, Virginia: 2008
For product and ordering information: World Wide Web: http://www.usgs.gov/pubprod Telephone: 1-888-ASK-USGS
For more information on the USGS—the Federal source for science about the Earth, its natural and living resources, natural hazards, and the environment: World Wide Web: http://www.usgs.gov Telephone: 1-888-ASK-USGS Suggested citation: Coons, Tom, Soulard, Christopher E., and Knowles, Noah, 2008, High-resolution digital terrain models of the Sacramento/San Joaquin Delta Region, California: U.S. Geological Survey, Data Series 359 [http://pubs.usgs.gov/ds/359/].
Any use of trade, product, or firm names is for descriptive purposes only and does not imply endorsement by the U.S. Government.
Although this report is in the public domain, permission must be secured from the individual copyright owners to reproduce any copyrighted material contained within this report.
FRONT COVER: An example of the two elevation datasets available—the first dataset has all water coded as zero, whereas the second dataset has bathymetry data merged with the elevation data. This example shows two shaded relief maps derived from the raw elevation data for the Antioch North 7.5-minute USGS quadrangle.
ii
Contents
Abstract................................................................................................................................................. 1 Introduction .......................................................................................................................................... 1 Methods ................................................................................................................................................ 2 Accuracy............................................................................................................................................... 3 Data Download .................................................................................................................................... 3 Acknowledgments............................................................................................................................... 4 References ........................................................................................................................................... 4 Figures ................................................................................................................................................... 2
Figures
Figure 1. Location map of the Sacramento/San Joaquin Delta region........................................ 5 Figure 2. Field Photo of a levee in the Sacramento/San Joaquin Delta region.......................... 6 Figure 3. Comparison of the two datasets available for download ............................................. 7 Figure 4. Footprint of elevation data available and the grid that data has been clipped to..... 8 Figure 5. Example of elevation spike editing .................................................................................... 9
iii
High-Resolution Digital Terrain Models of the Sacramento/San Joaquin Delta Region, California By Tom Coons, Christopher E. Soulard, and Noah Knowles
Abstract The U.S. Geological Survey (USGS) Western Region Geographic Science Center,
in conjunction with the USGS Water Resources Western Branch of Regional Research, has developed a high-resolution elevation dataset covering the Sacramento/San Joaquin Delta region of California. The elevation data were compiled photogrammically from aerial photography (May 2002) with a scale of 1:15,000. The resulting dataset has a 10-meter horizontal resolution grid of elevation values. The vertical accuracy was determined to be 1 meter. Two versions of the elevation data are available: the first dataset has all water coded as zero, whereas the second dataset has bathymetry data merged with the elevation data. The projection of both datasets is set to UTM Zone 10, NAD 1983. The elevation data are clipped into files that spatially approximate 7.5-minute USGS quadrangles, with about 100 meters of overlap to facilitate combining the files into larger regions without data gaps. The files are named after the 7.5-minute USGS quadrangles that cover the same general spatial extent. File names that include a suffix (_b) indicate that the bathymetry data are included (for example, sac_east versus sac_east_b). These files are provided in ESRI Grid format.
Introduction The United States Geological Survey (USGS) Western Region Geographic
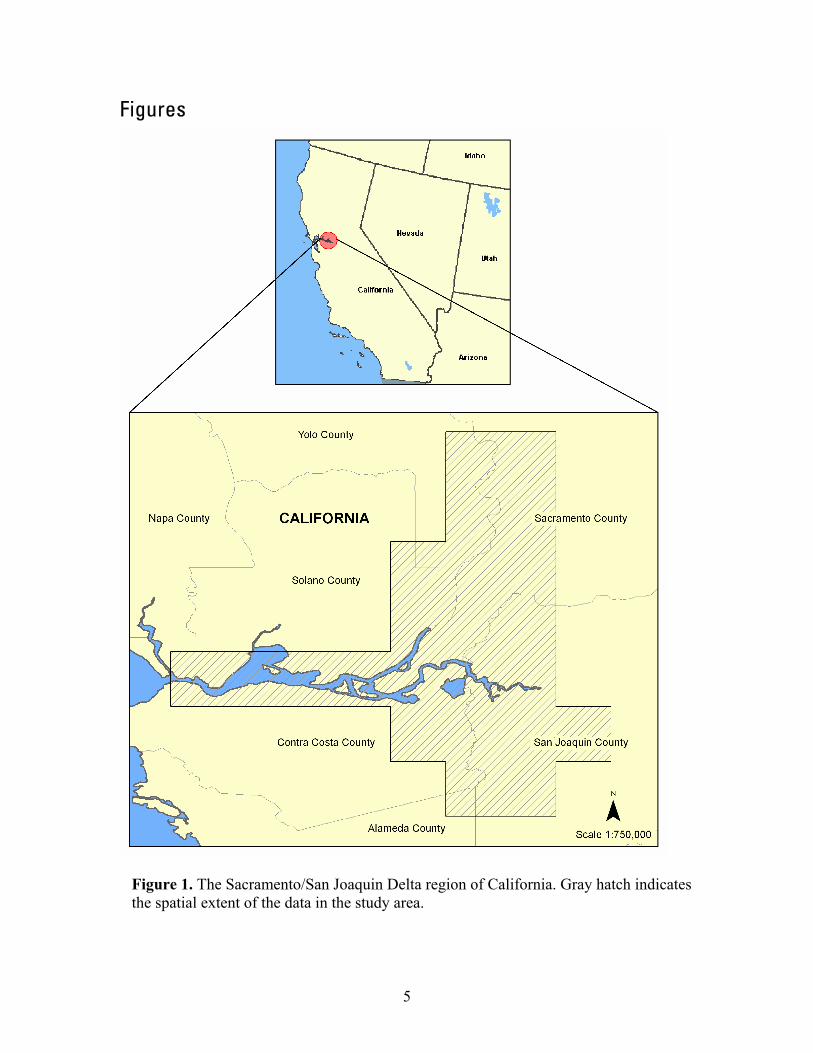
Science Center and USGS Water Resources Western Branch of Regional Research have developed a high-resolution digital elevation dataset in an effort to assess the implications of climate change and potential levee failure in the Sacramento/San Joaquin Delta region of California (fig. 1). The data are being used to (1) investigate the influence of potential levee failures on the physical and biochemical systems of the Delta, (2) characterize events that may follow breaching of one or more major levees, and (3) assess the risk of such levee failures and other areas at risk of inundation as a result of rising sea levels (fig. 2). These applications are being carried out by researchers associated with the USGS CASCaDE (Computational Assessments of Scenarios of Change for the Delta Ecosystem) project and with the Scripps Institution of Oceanography.
The elevation information was derived from low-altitude aerial photography flown along much of the Sacramento/San Joaquin Delta by Hammon, Jensen, Wallen, and Associates in May 2002. We have developed two datasets for download. The first dataset has all water coded as zero, whereas the second dataset has bathymetry data from the Suisun Bay and Delta Bathymetry project merged with the elevation data (Foxgrover and others, 2007; fig. 3).
Methods Elevation data were derived from natural color aerial photography flown at an
altitude of 7,500 feet with a 6-inch lens. Photography was flown in May 2002 by Hammon, Jensen, Wallen, and Associates. The aerial photography, which has a scale of 1:15,000, was scanned to produce a ground pixel size of approximately 1 foot. Photogrammetric methods were applied to the scanned photography to derive the elevation data. The processing steps for the dataset varied across the study area and required the use of four software systems (Zeiss ZI, BAE Systems SocetSet 5.2, Global Mapper 7, and ESRI ArcCatalog 9.2). In this report, these processing techniques are summarized for the entire dataset rather than detailing the methods involved in creating each file. The resulting dataset has a 10-meter horizontal-resolution grid of elevation values. Airborne Global Positioning System (GPS) points, Field control points (XYZ), ancillary geospatial control points, and manual editing were used to ensure that all horizontal locations (XY) were accurate and that all vertical-elevation values (Z) represent deviations from local mean sea level as accurately as possible.
Three different software methods were used to create digital terrain models (DTMs) for the Sacramento/San Joaquin Delta region. An autotriangulation technique was applied to nearly 70 percent of the study area by using Zeiss ZI Imaging Station Image Station Automated Triangulation (ISAT). DTMs were collected at 4-meter postings for all individual models by using Image Station Automated Elevations (ISAE) point matching. All files were saved as grid files by using the Zeiss ZI que file option. The individual model files were imported into BAE Systems SocetSet 5.2 in groups of about 50 models before any editing was done. A secondary software method involved performing the autotriangulation by using BAE Systems SocetSet 5.2 Multi Sensor Triangulation (MST). DTMs were collected at 2-meter postings by using BAE Systems SocetSet 5.2 point-matching techniques. Initial editing was performed by using project photography stereo models as ground truth, and this method was applied to about 20 percent of the study area. The third method used to create DTMs involved soft-copy techniques employed by Hammon, Jensen, Wallen, and Associates. Terrain models were collected by Hammon, Jensen, Wallen, and Associates (for about 10 percent of the study area) at about 20-meter postings by using point-matching techniques.
All files created through the processes above were imported into BAE Systems SocetSet 5.2 and resampled to 10-meter postings. USGS digital orthophoto quadrangles (DOQs), USGS quadrangle maps (DRGs), and other ancillary data were used as ground truth in checking spikes in the elevation data (USGS National Geospatial Program, 1997).
A large part of creating these data involved masking out water bodies from the land elevations. The water mask was developed from DRGs (65 percent), with the remaining areas determined by project photography and DOQs. Water bodies were set to zero for the first dataset, or null as an intermediate step in creating a second dataset that included bathymetry values for water bodies. The combined dataset, or second dataset, was made with the DTM null tagged value file merged over the GS bathymetry file. The bathymetry data are input only where there is a null DTM value. Areas of overlap (null in both the DTM and bathymetry files) were set to 0 and stripped of the null tag. Areas outside of the study area were coded as null values.
2
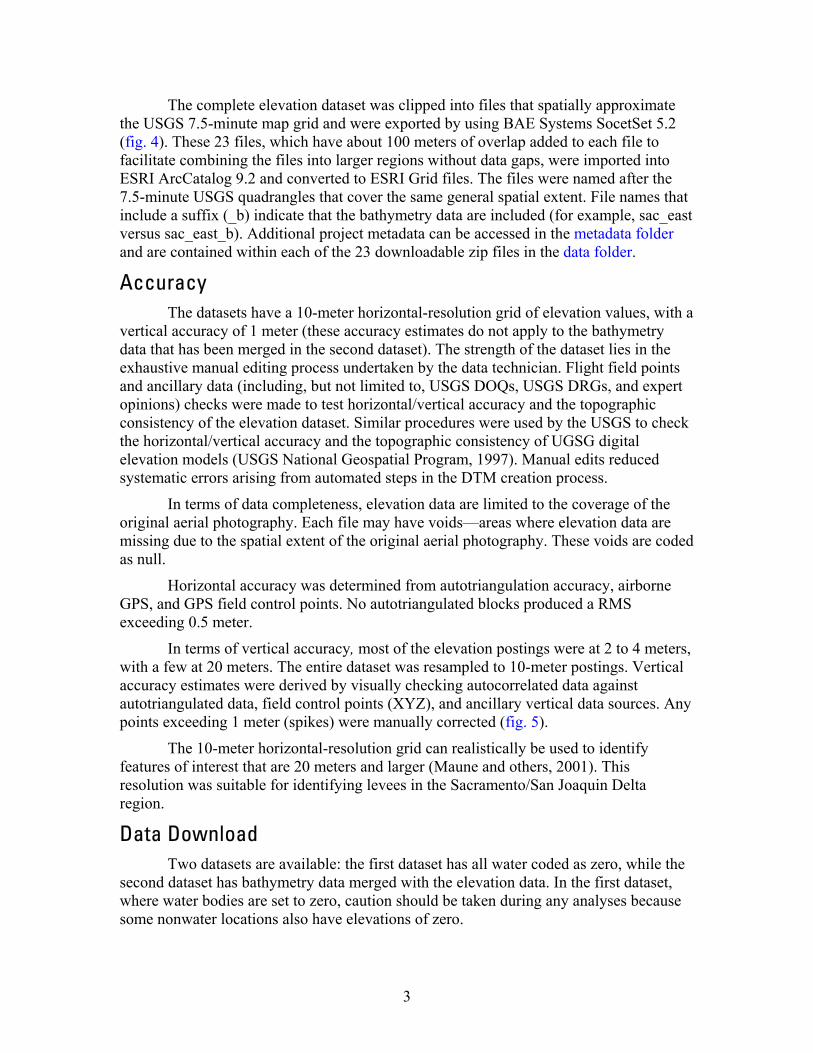
The complete elevation dataset was clipped into files that spatially approximate the USGS 7.5-minute map grid and were exported by using BAE Systems SocetSet 5.2 (fig. 4). These 23 files, which have about 100 meters of overlap added to each file to facilitate combining the files into larger regions without data gaps, were imported into ESRI ArcCatalog 9.2 and converted to ESRI Grid files. The files were named after the 7.5-minute USGS quadrangles that cover the same general spatial extent. File names that include a suffix (_b) indicate that the bathymetry data are included (for example, sac_east versus sac_east_b). Additional project metadata can be accessed in the metadata folder and are contained within each of the 23 downloadable zip files in the data folder.
Accuracy The datasets have a 10-meter horizontal-resolution grid of elevation values, with a
vertical accuracy of 1 meter (these accuracy estimates do not apply to the bathymetry data that has been merged in the second dataset). The strength of the dataset lies in the exhaustive manual editing process undertaken by the data technician. Flight field points and ancillary data (including, but not limited to, USGS DOQs, USGS DRGs, and expert opinions) checks were made to test horizontal/vertical accuracy and the topographic consistency of the elevation dataset. Similar procedures were used by the USGS to check the horizontal/vertical accuracy and the topographic consistency of UGSG digital elevation models (USGS National Geospatial Program, 1997). Manual edits reduced systematic errors arising from automated steps in the DTM creation process.
In terms of data completeness, elevation data are limited to the coverage of the original aerial photography. Each file may have voids—areas where elevation data are missing due to the spatial extent of the original aerial photography. These voids are coded as null.
Horizontal accuracy was determined from autotriangulation accuracy, airborne GPS, and GPS field control points. No autotriangulated blocks produced a RMS exceeding 0.5 meter.
In terms of vertical accuracy, most of the elevation postings were at 2 to 4 meters, with a few at 20 meters. The entire dataset was resampled to 10-meter postings. Vertical accuracy estimates were derived by visually checking autocorrelated data against autotriangulated data, field control points (XYZ), and ancillary vertical data sources. Any points exceeding 1 meter (spikes) were manually corrected (fig. 5).
The 10-meter horizontal-resolution grid can realistically be used to identify features of interest that are 20 meters and larger (Maune and others, 2001). This resolution was suitable for identifying levees in the Sacramento/San Joaquin Delta region.
Data Download Two datasets are available: the first dataset has all water coded as zero, while the
second dataset has bathymetry data merged with the elevation data. In the first dataset, where water bodies are set to zero, caution should be taken during any analyses because some nonwater locations also have elevations of zero.
3
4
The elevation data have been clipped into 23 files that spatially approximate the 7.5-minute USGS quadrangles (fig. 4), and have about 100 meters of overlap to facilitate combining the files into larger regions without data gaps. The files are named after 7.5-minute USGS quadrangles that cover the same general spatial extent, and file names that include a suffix (_b) indicate that the bathymetry data are included (for example, sac_east versus sac_east_b). These files are available in ESRI Grid format and each file is about 8 megabytes. These files (along with metadata) can be downloaded either by clicking on the map on figure 4 (lower box is the _b file) or by clicking on the quadrangle name in the list below. antioch_n.zip antioch_n_b.zip benicia.zip benicia_b.zip boudin_isla.zip boudin_isla_b.zip brentwood.zip brentwood_b.zip bruceville.zip bruceville_b.zip clarksburg.zip clarksburg_b.zip clifton_crt.zip clifton_crt_b.zip courtland.zip courtland_b.zip
florin.zip florin_b.zip holt.zip holt_b.zip honker_bay.zip honker_bay_b.zip isleton.zip isleton_b.zip jersey_isla.zip jersey_isla_b.zip liberty_isl.zip liberty_isl_b.zip rio_vista.zip rio_vista_b.zip sac_east.zip sac_east_b.zip
sac_west.zip sac_west_b.zip stockton.zip stockton_b.zip terminous.zip terminous_b.zip thornton.zip thornton_b.zip union_isla.zip union_isla_b.zip vine_hill.zip vine_hill_b.zip woodward_is.zip woodward_is_b.zip
Acknowledgments Funding for developing these datasets was provided by the CALFED Bay-Delta
Program (http://calwater.ca.gov). Applications of these datasets to the study of the risk of levee failures and associated impacts and to the assessment of areas at risk of inundation from sea-level rise are conducted under the auspices of the CALFED-funded USGS CASCaDE Project (http://sfbay.wr.usgs.gov/cascade/) and the California Energy Commission’s Public Interest Energy Research (PIER) Program (http://www.energy.ca.gov/pier/) through the Scripps Institution of Oceanography at the University of California, San Diego.
References Foxgrover, A., Smith, R.E., and Jaffe, B.E., 2007, Suisun Bay and Delta bathymetry:
U.S. Geological Survey [http://sfbay.wr.usgs.gov/sediment/delta/, last accessed February 15, 2008]
Maune, D.F., Kopp, S.M., Crawford, C.A., and Zarvas, C.E., 2001, Introduction, in Maune, D.F., ed., Digital elevation model technologies and applications: The DEM users manual: Bethesda, Maryland, The American Society for Photography and Remote Sensing, 539 p.
U.S. Geological Survey National Geospatial Program, 1997, Metadata standards: Standards for the preparation of digital geospatial metadata: U.S. Geological Survey [http://rockyweb.cr.usgs.gov/nmpstds/metastds.html, last accessed March 17, 2008]
Figures
Figure 1. The Sacramento/San Joaquin Delta region of California. Gray hatch indicates the spatial extent of the data in the study area.
5

Figure 2. Field photo of a levee by Rio Vista, California. Research involving potential levee failure was one of the core reasons high-resolution elevation data were developed for the Sacramento/San Joaquin Delta region.
6
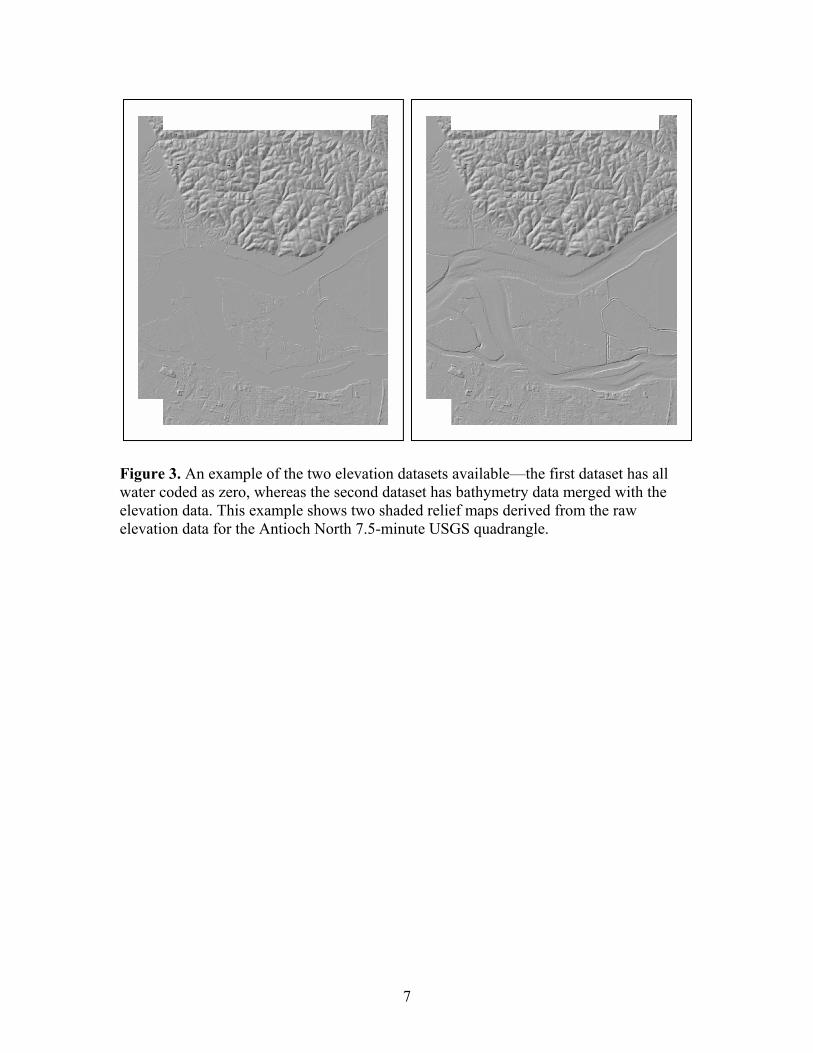
Figure 3. An example of the two elevation datasets available—the first dataset has all water coded as zero, whereas the second dataset has bathymetry data merged with the elevation data. This example shows two shaded relief maps derived from the raw elevation data for the Antioch North 7.5-minute USGS quadrangle.
7
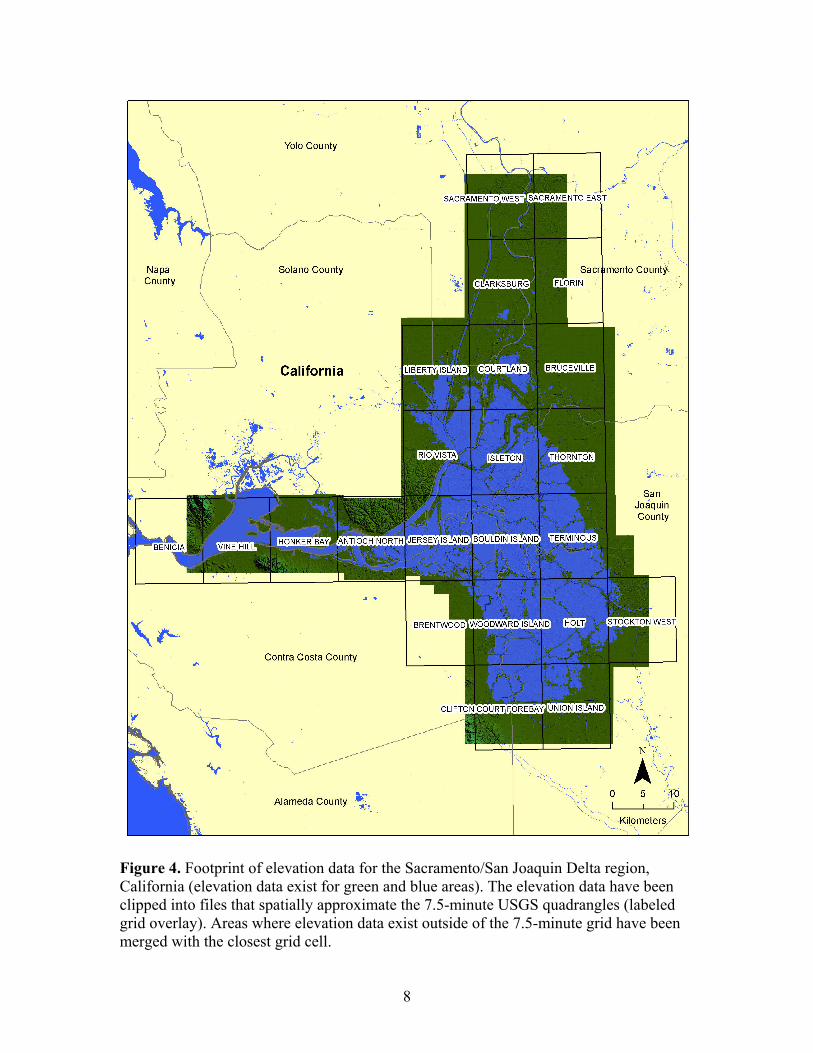
Figure 4. Footprint of elevation data for the Sacramento/San Joaquin Delta region, California (elevation data exist for green and blue areas). The elevation data have been clipped into files that spatially approximate the 7.5-minute USGS quadrangles (labeled grid overlay). Areas where elevation data exist outside of the 7.5-minute grid have been merged with the closest grid cell.
8
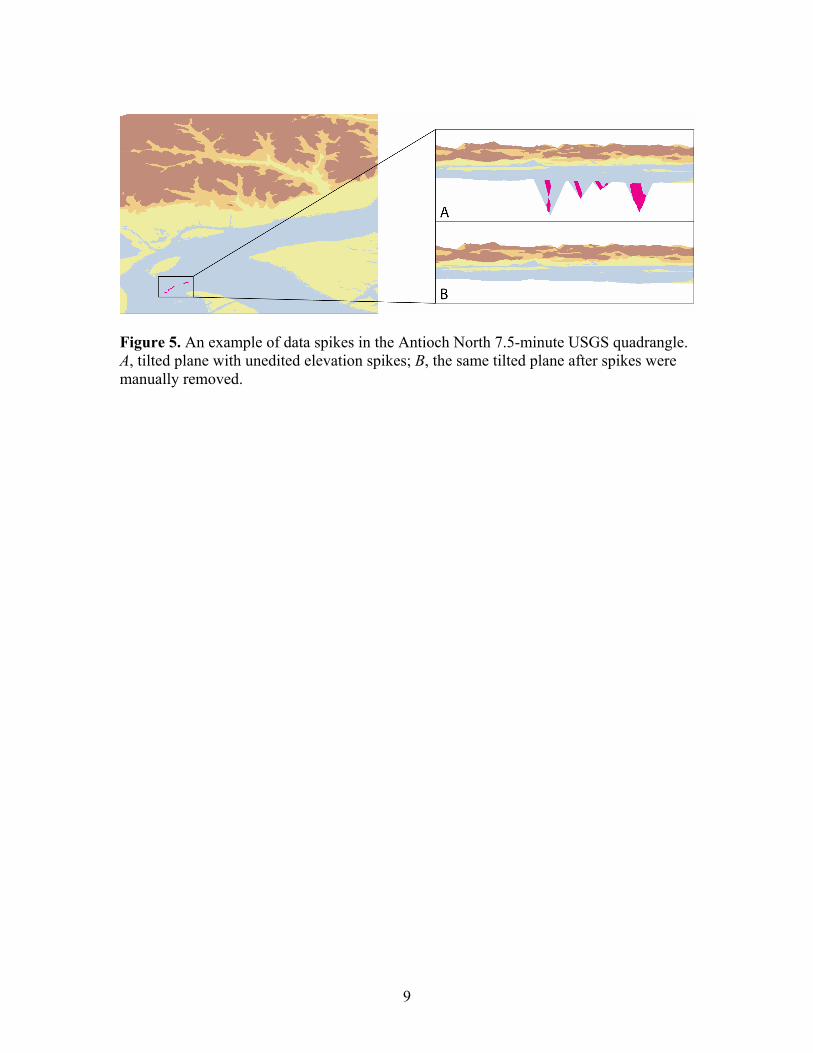
Figure 5. An example of data spikes in the Antioch North 7.5-minute USGS quadrangle. A, tilted plane with unedited elevation spikes; B, the same tilted plane after spikes were manually removed.
9