Embed Size (px)
Citation preview

High Performance Government in Action
The Ohio Shared Services Story
J. Pari SabetyRonn Kolbash
July 15, 2010

Looking Back: A Brief History of Ohio Shared Services
Nov ‘07 Jan ‘08 Feb ‘08 Apr ‘08May ‘08
OAKS Financials Go-Live
Assessment Results
Shared Services Project Start-up
Governor’s ExecutiveOrder 2008-01S
RFP AwardImplementation & Quality Assurance
BusinessCasePublished
Aug ‘09
Go Live
2

Facing the Facts
It’s the best of times to launch shared services for enterprises…– 12% reduction in revenue as a result of recession– Reduction of 5000 positions in state government, or 8%– Ready to retire: 14% of workforce in 2011; 33% of workforce in 2014
But it’s the worst of times for agencies…– Repeated operating budget reductions– Loss of key fiscal staff– Climate of fear
3
The Play: Use capital dollars to reduce and redeploy operating resourcesThe Play: Use capital dollars to reduce and redeploy operating resources

Business Case
4
Processing Low Processing Medium Processing High
ROI 6.6 years ROI 4.5 years ROI 3.8 years
IRR 22% IRR 44% IRR 65%
Functions & SpeedNPV
(20Years)Functions & Speed
NPV(20Years)
Functions & SpeedNPV
(20Years)
AP, T&E Only 33 Months
$180 MillionAP, T&E, Payroll, Time
Reporting 30 Months
$541 MillionAll Targeted HR/ FIN
Functions 27 months
$1.17 Billion
Key Assumptions Scope: AP, T&E, Payroll, Time Reporting,
ISTV, COA Maintenance, and Vendor Master 25,382 AP vouchers / FTE / yr. (13 / hr.) 14,946 Travel vouchers / FTE / yr. (8 / hr.) 20,401 Change Requests / FTE / yr. (11 /
hr.) 15 to 1 Span of Control Current Agency FTE: 660 Shared Services FTE: 255
Key Assumptions Scope: AP, T&E, ISTV, COA Maintenance,
and Vendor Master 9,077 AP vouchers / FTE / yr. (5 / hr.) 10,892 Travel vouchers / FTE / yr. (6 / hr.) 13,486 Change Requests / FTE / yr. (7 / hr.) 10 to 1 Span of Control Current Agency FTE: 378 Shared Services FTE: 219
Key Assumptions Scope: AP, T&E, Payroll, Time Reporting,
ISTV, COA Maintenance, Vendor Master, Staffing, Total Rewards Admin, Data Mgmt, Workforce Dev, Accounting/External Reporting, Compliance Mgmt, and Revenue Cycle
41,688 AP vouchers / FTE / yr. (22 / hr.) 17,246 Travel vouchers / FTE / yr. (9 / hr.) 28,562 Change Requests / FTE / yr. (15 / hr.) 20 to 1 Span of Control Current Agency FTE: 1,699 Shared Services FTE: 862
Aggressive ScenarioModerate ScenarioConservative Scenario

Governance Structure
Agency Partnership Governance
Union Governance
ResponsibilitiesFocus on:1. Performance
Management & Compensation
2. Training and Development
3. Continuous Improvement
ResponsibilitiesFocus on:1. Working with OSS
management2. Resolving escalated
issues
ResponsibilitiesFocus on:1. Resources2. Buy-in3. Strategic direction
ResponsibilitiesFocus on:1. How well?2. What’s next?
ResponsibilitiesFocus on:1. Continuous
improvement2. Operational
performance
GovernanceCouncil
CFOCouncil
ProcessCouncil
PartnershipCommittee
WorkingGroupsWorkingGroupsWorking
Groups
Str
ate
gic
Op
era
tio
na
l
Meet Biannually
Meet Monthly
Meet MonthlyCommunicate
Often
Meet Quarterly
Meet MonthlyTalk Daily
Leadership
Management
Operations
Outside AdvisoryCouncil
5

What is Ohio Shared Services
6
What is Ohio Shared Services?
Ohio Shared Services is the first shared services environment in Ohio government that delivers common transaction processing for state agencies and business vendors with an emphasis on customer service.
At Ohio Shared Services, we deliver Service First by engaging our employees and partnering with our customers.
Mission
Execution, Efficiency, Customer Service
Ohio Shared Services executes administrative transactions for its customers while skillfully balancing efficiency and customer service to add value through lower cost and
improved effectiveness. Our primary key to success is a highly motivated, top-performing, self-directed workforce.
Vision
Best In Class, High Performing Public Service Entity
Ohio Shared Services is nationally recognized as a public sector pioneer that manages multiple business processes
for a variety of public sector entities. It is recognized as best in class in serving its customers, in maintaining a
high- performance workplace and in recognizing employees as
its most critical asset.

Ohio Shared Services Video - Opening
7

Ohio Shared Services Video - Facility
8

Ohio Shared Services Video – Contact Center
9

Ohio Shared Services Video – Travel and Expense
10

Ohio Shared Services Video – Service Management
11

Ohio Shared Services Video – Technology
12

Self-Directed Work Teams Defined
A group of employees who have day-to-day responsibility for managing themselves and the work they do with minimum [of] direct supervision. Members of self-directed teamstypically handle job assignments, plan and schedule work,make production – and/or service-related decisions, and take action on problems.
- the Association for Quality and Participation
13

SDWTs vs. Traditional Teams
Self-Directed Work Teams Traditional Teams
Customer-driven Management-driven
Multi-skilled work force Work-force of isolated specialist
Information shared widely Information limited
Few levels of management Many levels of management
Shared goals Segregated goals
Results achievement emphasis Problem solving emphasis
Continuous improvements Incremental improvements
Self-controlled Management controlled
Values/principles based Primarily policy/procedure
14

L2
L3
L4
L5
L6
L2
L4
L3
`
Span-of-Control Approach
Illustrative Current State Org Chart Illustrative Future State Org Chart
15
Collect Org Charts & Interview Team
Calculate Current Spans of Control
Identify Opportunity areas relative to SOC Benchmarks
Identify Organizational Constraints
Develop Future State Org Charts by Function

What do SDWTs Do?
1. Develop goals and plans
2. Enhance communication among members
3. Solve problems and make decisions
4. Provide development opportunities for team members
5. Clarify roles for team members
These are the main characteristics of self-directed work teams.
16

Associate Selection Process
Selection: The OSS Associate selection process involves four steps.
1. Screen Application: Candidates meet minimum qualifications to continue to proficiency testing.
2. Test Proficiency: Candidates pass proficiency test to continue to interviews.
3. Interview: Candidates complete mock call and critical behavior interviews before being considered for offer.
4. Offer: Candidates are ranked and the number of offers are determined based on hiring need.
Screen Applications
Screen Applications Test
Proficiency
Test Proficiency Interview
InterviewOffer
Offer
17

Self-Directed Work Teams are Supported by Seven Pillars
Customer Inquiries
Travel & Expense Voucher Processing
Vendor Maintenance
Performance Management
Decision Rights
Coaches
Technology Workflow
Continuous Improvement
OCSEA Partnership Governance
Compensation
18
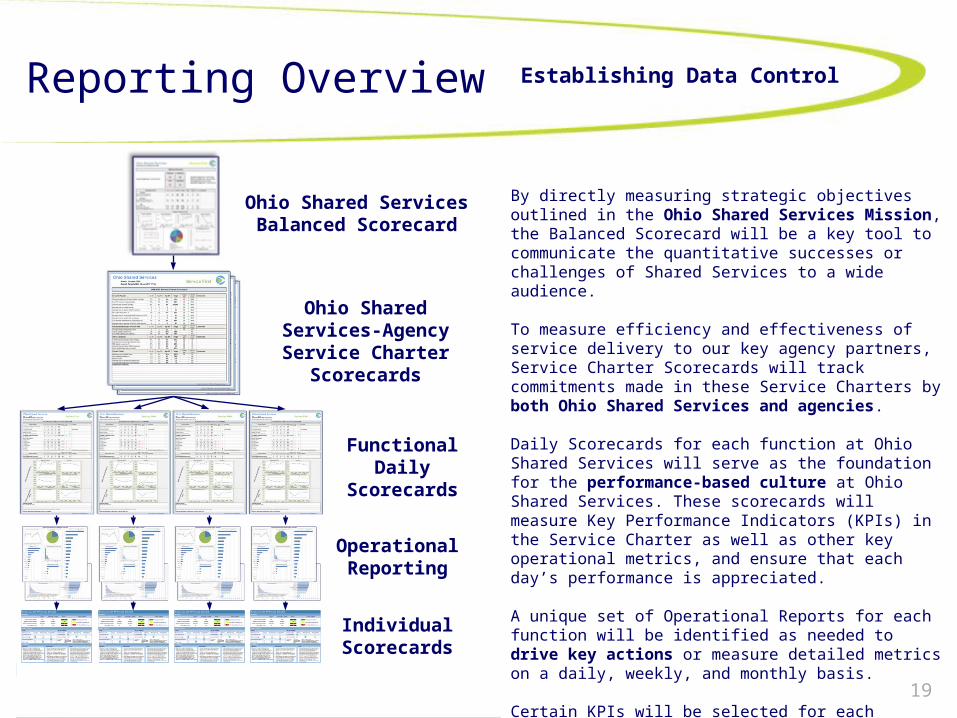
Reporting Overview
By directly measuring strategic objectives outlined in the Ohio Shared Services Mission, the Balanced Scorecard will be a key tool to communicate the quantitative successes or challenges of Shared Services to a wide audience.
To measure efficiency and effectiveness of service delivery to our key agency partners, Service Charter Scorecards will track commitments made in these Service Charters by both Ohio Shared Services and agencies.
Daily Scorecards for each function at Ohio Shared Services will serve as the foundation for the performance-based culture at Ohio Shared Services. These scorecards will measure Key Performance Indicators (KPIs) in the Service Charter as well as other key operational metrics, and ensure that each day’s performance is appreciated.
A unique set of Operational Reports for each function will be identified as needed to drive key actions or measure detailed metrics on a daily, weekly, and monthly basis.
Certain KPIs will be selected for each function to be measured by associate and included in each Individual used in the quarterly Ohio Shared Services Performance Management process.
Ohio Shared Services Balanced Scorecard
Ohio Shared Services-Agency Service Charter
Scorecards
Functional Daily Scorecards
Operational Reporting
Individual Scorecards
Establishing Data Control
19

Contact Information
For more information please visit:
www.ohiosharedservices.ohio.gov
Contact: Pari Sabety, OBM Director Tel: 614.466.4034E-mail: [email protected]
Contact: Ronn Kolbash, OSS LeaderTel: 614.338.4815E-mail: [email protected]
Ohio Shared Services4310 E. Fifth AvenueColumbus, Ohio 43219877-644.6771
20

APPENDIX
21

What We Do Here
The processes currently performed at Ohio Shared Services: Accounts Payable
– Invoice Processing
– Document Retention
Maintain Vendor Information– 1099 Forms
– Vendor Inquiries
– Vendor Maintenance
– eSupplier (vendor self-service)
Travel and Expense Reimbursement Chart of Account Maintenance Statewide Finance and Learning Management End User Support
22

How We Do It
Core Competencies
Together we will: Deliver world-class customer service Strive for excellence in finance processes Empower employees to exceed customer expectations Monitor performance both internally and externally and act on the results Champion change and innovation in government
Core Competencies
Together we will: Deliver world-class customer service Strive for excellence in finance processes Empower employees to exceed customer expectations Monitor performance both internally and externally and act on the results Champion change and innovation in government
Shared Values
Every individual must:Show ResilienceDemonstrate IntegrityCommit to ExcellenceProvide StewardshipExpect Continuous ImprovementFoster PartnershipsNever Stop Learning
Shared Values
Every individual must:Show ResilienceDemonstrate IntegrityCommit to ExcellenceProvide StewardshipExpect Continuous ImprovementFoster PartnershipsNever Stop Learning
Service First
Continuous Improvement
Teamwork
23

Individuals are accountable for their own performanceThe individual… Understands or seeks clarity on what is expected of him or her Seeks timely performance information and feedback Assesses and improves his or her performance
Individuals are accountable for helping others improve their performanceThe individual… Helps others understand expectations Provides data and/or observation-based feedback, as appropriate, to other Ohio Shared
Services employees regardless of level Willingly shares, teaches, and coaches others to improve their performance
Leadership supports a culture of continuous learning and developmentEvery leader… Fosters a safe environment for employees to ask for help Assures clarity of expectations and alignment between individual and center performance Strives for each Ohio Shared Services employee to be successful by providing learning and
development opportunities Reinforces the importance of the performance management process and commits to executing
it well Assures the performance management process supports high performers with development
opportunities
Scorecard for Success
24

Facility Supports Culture
25
Mail/Scanning Room
Transaction Processing
Requirements and Configuration Management
Call Center Team
Huddle/Conference/Training Rooms
Server Room
Break Room
High-performing facilities account for functional requirements of everyday tasks, support flat hierarchical and centralized organizational structures, and promote employee well-being, satisfaction and productivity.
Front Entrance and Reception
3
2
1
You are here

Organizational Structure
Ohio Shared Services is comprised of two segments: contact center and transaction processing with a dedicated team of: Center Leads
– Contact Center– Finance
Coaches Ohio Shared Services Associates
26

Associate Scorecard – Actual Data
12/1/09 - 2/23/10 AP Volume AP Quality
Name TotalAverage per Day
Average per
Month
Exceptions Completed
(included in Totals)
Passed Failed Total
% Passed
Associate 1 1987 41 662 75 155 3 158 98.10%
Associate 2 1920 41 640 81 172 31 203 84.73%
Associate 3 1920 37 640 63 149 57 206 72.33%
Associate 4 1082 24 426 0 92 30 122 75.41%
Associate 5 1236 26 414 188 96 12 108 88.89%
Associate 6 1151 26 412 3 56 13 69 81.16%
Associate 7 1178 23 393 2 111 17 128 86.72%
Associate 8 845 23 384 0 60 29 89 67.42%
Associate 9 1242 24 383 11 89 11 100 89.00%
Associate 10 1278 22 361 109 101 8 109 92.66%
Associate 11 1150 22 348 163 67 4 71 94.37%
Associate 12 1044 22 325 0 64 22 86 74.42%
Associate 13 976 17 282 3 50 8 58 86.21%
Associate 14 686 14 229 130 30 10 40 75.00%
Associate 15 350 9 117 36 14 3 17 82.35%
Average 1203 25 401 58 83.25%
27