Embed Size (px)
Citation preview

1
High Energy Rechargeable Li-S Cells for EV Application.
Status, Challenges and Solutions
Yuriy Mikhaylik, Igor Kovalev, Riley Schock, Karthikeyan Kumaresan, Jason Xu and John Affinito
Sion Power Corporation 2900 E. Elvira Rd. Tucson AZ 85756 USA
www.sionpower.com
2
Outline
• Why lithium-sulfur technology?– Specific energy.– Rate capability.– Low temperature performance.
• Status of lithium-sulfur technology.• Addressing the challenges.• New approach pursued by Sion in
collaboration with BASF for EV applications.• Conclusions.
3
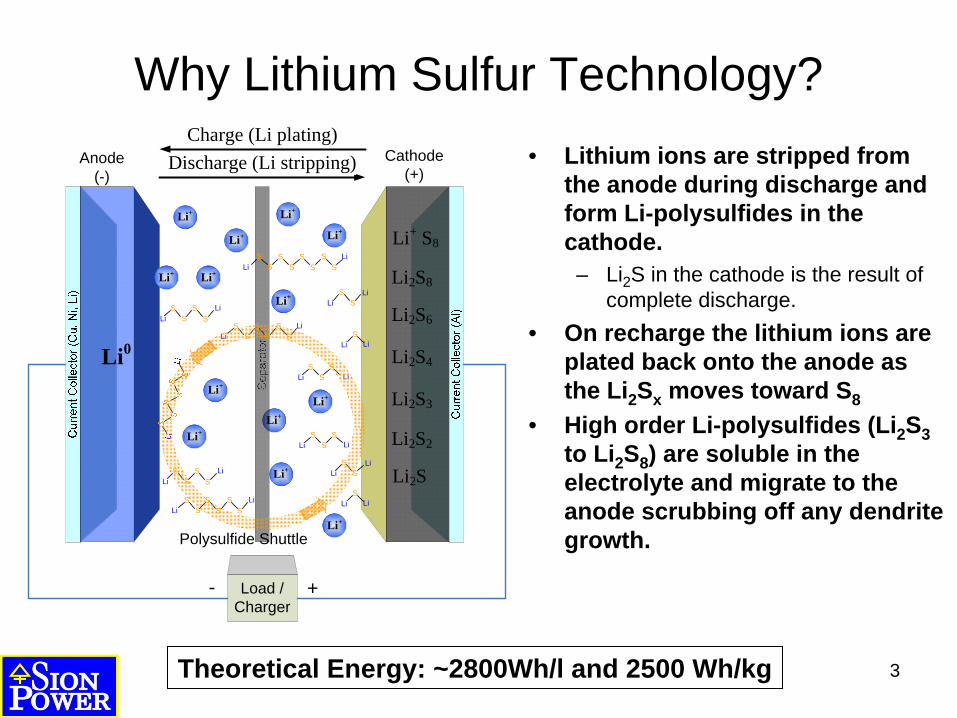
• Lithium ions are stripped from the anode during discharge and form Li-polysulfides in the cathode.
– Li2 S in the cathode is the result of complete discharge.
• On recharge the lithium ions are plated back onto the anode as the Li2 Sx moves toward S8
• High order Li-polysulfides (Li2 S3 to Li2 S8 ) are soluble in the electrolyte and migrate to the anode scrubbing off any dendrite growth.
Li+
Li+ S8
Li2S8
Li2S6
Li2S4
Li2S3
Li2S2
Li2S
Li0
Discharge (Li stripping)Charge (Li plating)
Anode (-)
Cathode (+)
Load / Charger
LiLiS
SS
SS
SSS
LiLiS
SS
SS
S
Li LiS
SS
LiLiS
S
Li LiS
Li LiS
LiLiS
S
LiLiS
SS
S
Li LiS
SS
LiLiS
SS
SS
S
LiLiS
SS
S
Polysulfide Shuttle
Li+
Li+
Li+Li+
Li+
Li+Li+
Li+
Li+
Li+
Li+
Li+
+-
Theoretical Energy: ~2800Wh/l and 2500 Wh/kg
Why Lithium Sulfur Technology?
4
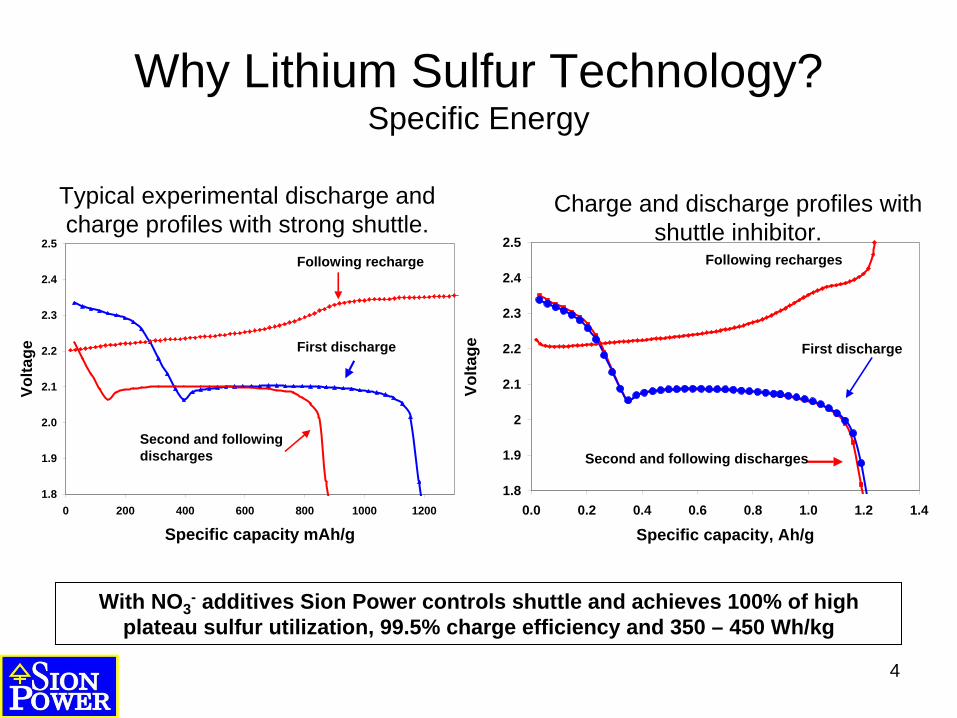
Typical experimental discharge and charge profiles with strong shuttle.
Charge and discharge profiles with shuttle inhibitor.
With NO3- additives Sion Power controls shuttle and achieves 100% of high
plateau sulfur utilization, 99.5% charge efficiency and 350 – 450 Wh/kg
1.8
1.9
2.0
2.1
2.2
2.3
2.4
2.5
0 200 400 600 800 1000 1200
Specific capacity mAh/g
Volta
ge First discharge
Second and following discharges
Following recharge
1.8
1.9
2
2.1
2.2
2.3
2.4
2.5
0.0 0.2 0.4 0.6 0.8 1.0 1.2 1.4
Specific capacity, Ah/g
Volta
ge
Following recharges
First discharge
Second and following discharges
Why Lithium Sulfur Technology? Specific Energy
5
0
50
100
150
200
250
300
350
400
450
0 1000 2000 3000 4000Specific Power, W/kg
Spec
ific
Ener
gy, W
h/kg
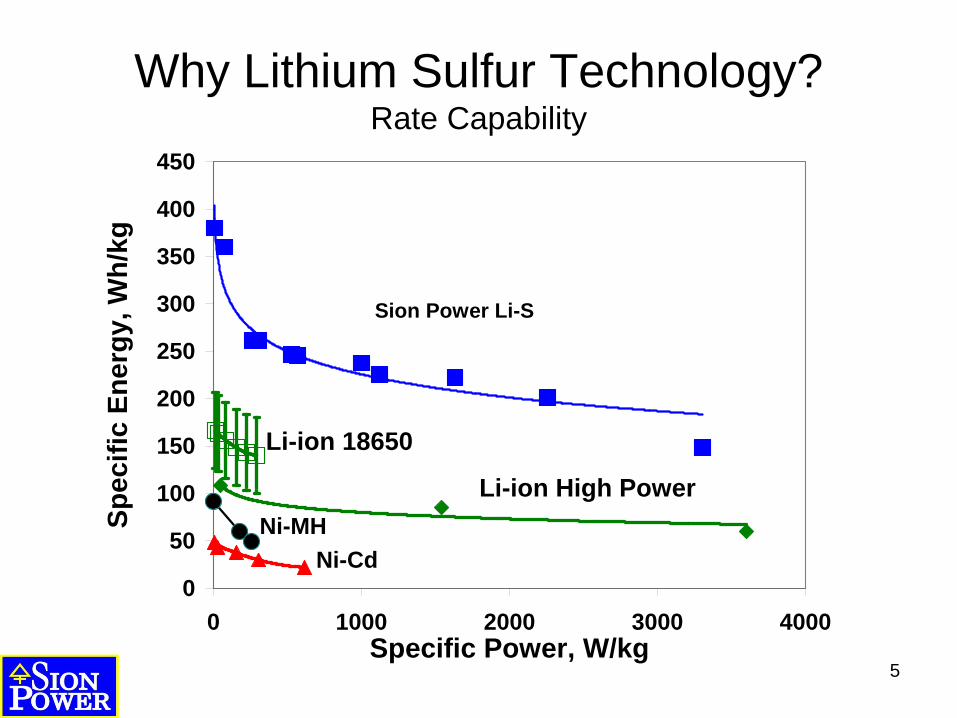
Ni-Cd
Li-ion 18650
Ni-MH
Sion Power Li-S
Li-ion High Power
Why Lithium Sulfur Technology? Rate Capability
6
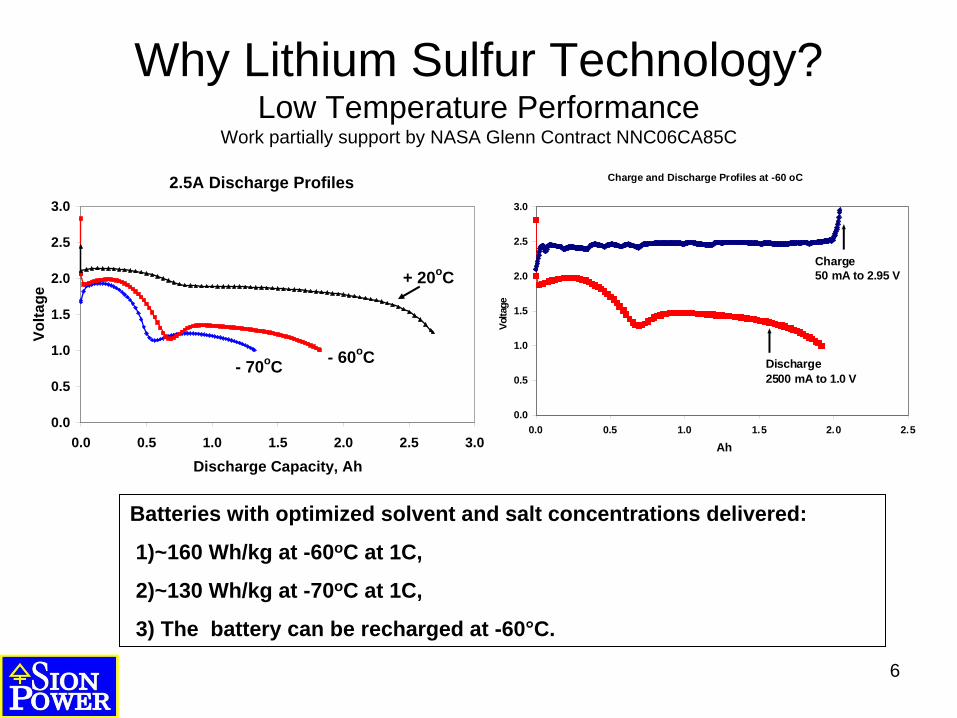
Charge and Discharge Profiles at -60 oC
0.0
0.5
1.0
1.5
2.0
2.5
3.0
0.0 0.5 1.0 1.5 2.0 2.5
Ah
Volta
ge
Charge50 mA to 2.95 V
Discharge2500 mA to 1.0 V
Batteries with optimized solvent and salt concentrations delivered:
1)~160 Wh/kg at -60oC at 1C,
2)~130 Wh/kg at -70oC at 1C,
3) The battery can be recharged at -60°C.
2.5A Discharge Profiles
0.0
0.5
1.0
1.5
2.0
2.5
3.0
0.0 0.5 1.0 1.5 2.0 2.5 3.0
Discharge Capacity, Ah
Volta
ge
- 70oC - 60oC
+ 20oC
Why Lithium Sulfur Technology? Low Temperature Performance
Work partially support by NASA Glenn Contract NNC06CA85C
7
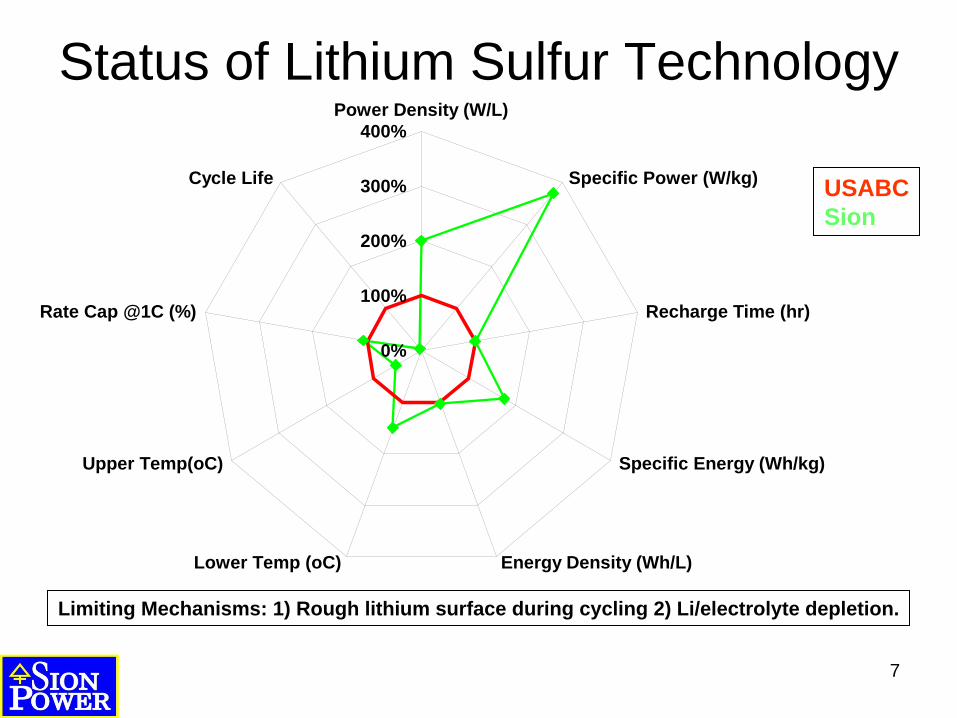
Status of Lithium Sulfur Technology
Limiting Mechanisms: 1) Rough lithium surface during cycling 2) Li/electrolyte depletion.
USABCSion
0%
100%
200%
300%
400%Power Density (W/L)
Specific Power (W/kg)
Recharge Time (hr)
Specific Energy (Wh/kg)
Energy Density (Wh/L)Lower Temp (oC)
Upper Temp(oC)
Rate Cap @1C (%)
Cycle Life
8
Addressing the Challenges Keys to the EV Market for Lithium-Sulfur
• Challenges - cycle life and high temperature stability:– Dynamics of lithium surface roughness and cycling.– Solvent depletion chemistry.

9
Surface Roughness vs Li DoD
0
0.1
0.2
0 0.2 0.4 0.6 0.8 1Li DoD
Surf
ace
Rou
ghne
ss
• Initially, surface roughness increases in direct proportion to Li depth of discharge (DoD).
• Maximal surface roughness can be observed at ~50-70% of Li DoD.
• The typical scenario is cycling at low Li DoD.
• The best scenario is cycling Li anodes at 100% DoD – but only with a current collector.
The Dynamics of Lithium Surface Roughness Monte-Carlo Simulation
10
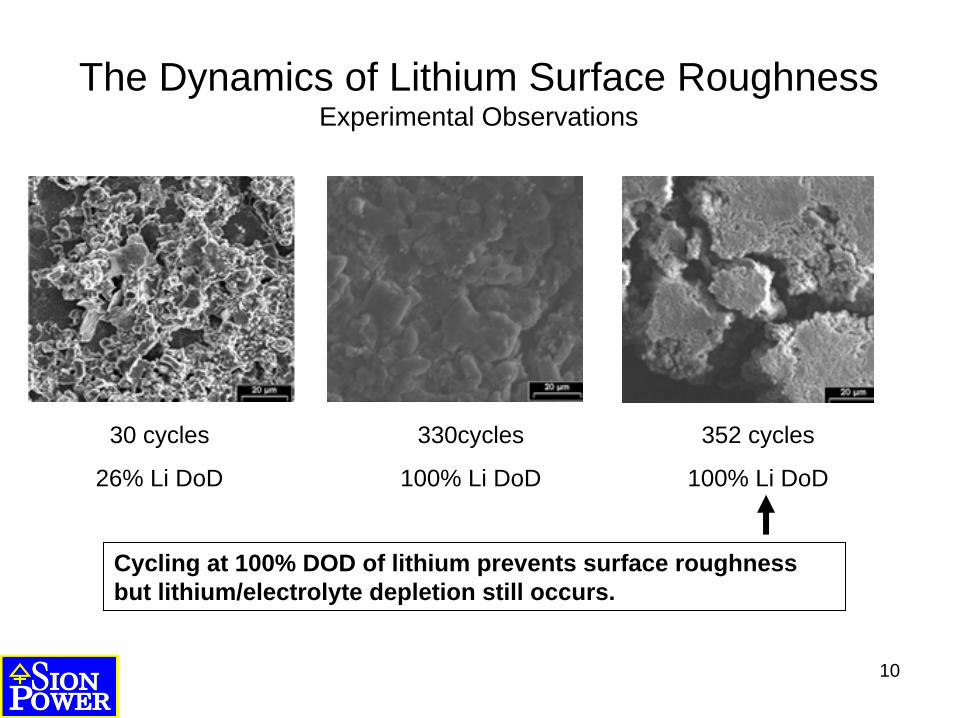
30 cycles
26% Li DoD
330cycles
100% Li DoD
352 cycles
100% Li DoD
Cycling at 100% DOD of lithium prevents surface roughness but lithium/electrolyte depletion still occurs.
The Dynamics of Lithium Surface Roughness Experimental Observations
11
0.0
0.5
1.0
1.5
2.0
2.5
0 20 40 60 80 100Cycle
Wei
ght (
g)
DOL
Lithium
DME
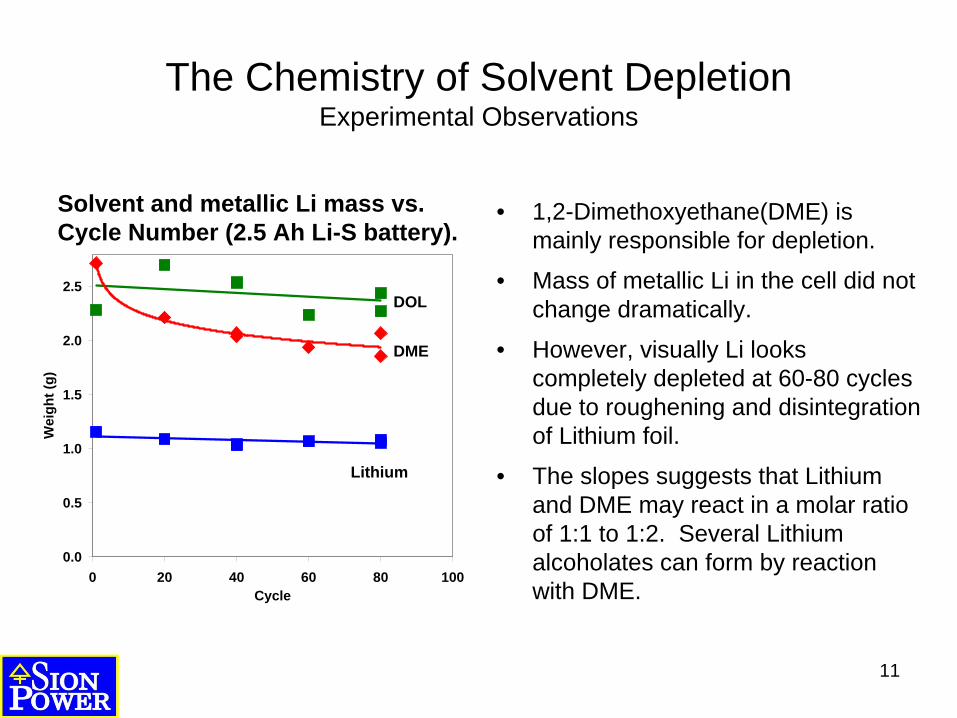
Solvent and metallic Li mass vs. Cycle Number (2.5 Ah Li-S battery).
• 1,2-Dimethoxyethane(DME) is mainly responsible for depletion.
• Mass of metallic Li in the cell did not change dramatically.
• However, visually Li looks completely depleted at 60-80 cycles due to roughening and disintegration of Lithium foil.
• The slopes suggests that Lithium and DME may react in a molar ratio of 1:1 to 1:2. Several Lithium alcoholates can form by reaction with DME.
The Chemistry of Solvent Depletion Experimental Observations
12
O O
O OLi
MeOLi
O
CH4
MeSxLi
Li/Li2Sx
O O
O OLi
Li/Li2Sx
H2
RO
O OLin
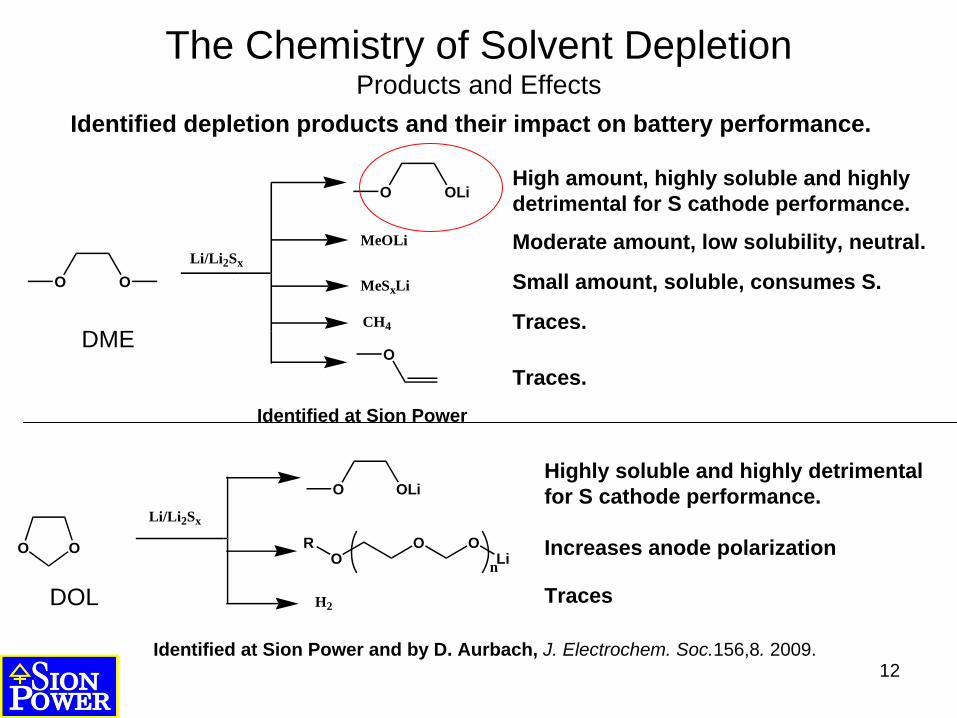
High amount, highly soluble and highly detrimental for S cathode performance.
Moderate amount, low solubility, neutral.
Small amount, soluble, consumes S.
Traces.
Traces.
Increases anode polarization
Traces
Highly soluble and highly detrimental for S cathode performance.
Identified at Sion Power
Identified at Sion Power and by D. Aurbach, J. Electrochem. Soc.156,8. 2009.
DME
DOL
Identified depletion products and their impact on battery performance.
The Chemistry of Solvent Depletion Products and Effects
13
New Approaches Pursued by Sion in Collaboration with BASF for EV Application
• Reduction of lithium roughness.– Proprietary anode design.
• Development of innovative materials– Structurally stable cathodes.
• Materials developed by Sion/BASF– Physical protection of lithium with multi-functional
membrane assemblies.
14
47 um60 um
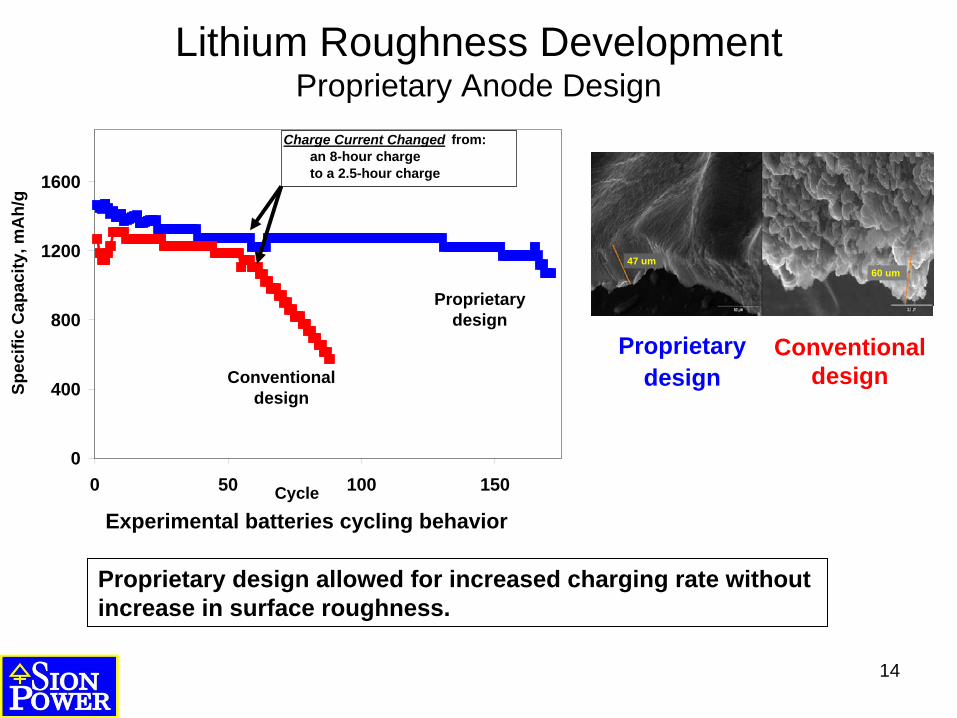
Conventional design
Proprietarydesign
Lithium Roughness Development Proprietary Anode Design
Proprietary design allowed for increased charging rate without increase in surface roughness.
0
400
800
1200
1600
0 50 100 150Cycle
Spec
ific
Cap
acity
, mA
h/g
Conventional design
Proprietary design
Charge Current Changed from: an 8-hour charge to a 2.5-hour charge
Experimental batteries cycling behavior
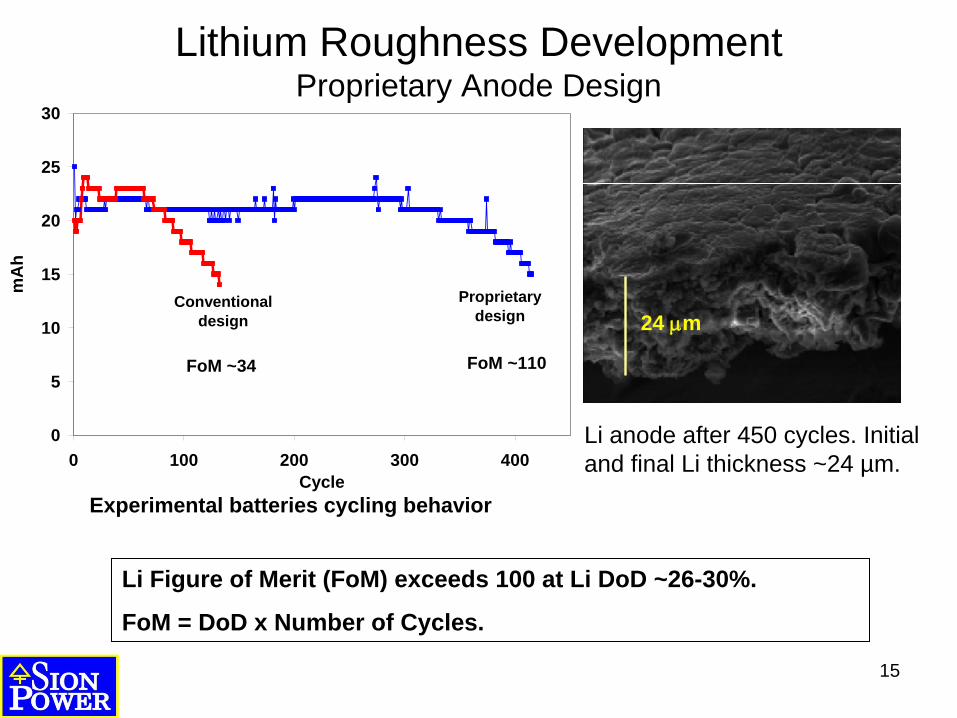
15
24 μm
Li Figure of Merit (FoM) exceeds 100 at Li DoD ~26-30%.
FoM = DoD x Number of Cycles.
Li anode after 450 cycles. Initial and final Li thickness ~24 µm.
Lithium Roughness Development Proprietary Anode Design
0
5
10
15
20
25
30
0 100 200 300 400Cycle
mA
h
Conventional design
Proprietarydesign
FoM ~34 FoM ~110
Experimental batteries cycling behavior
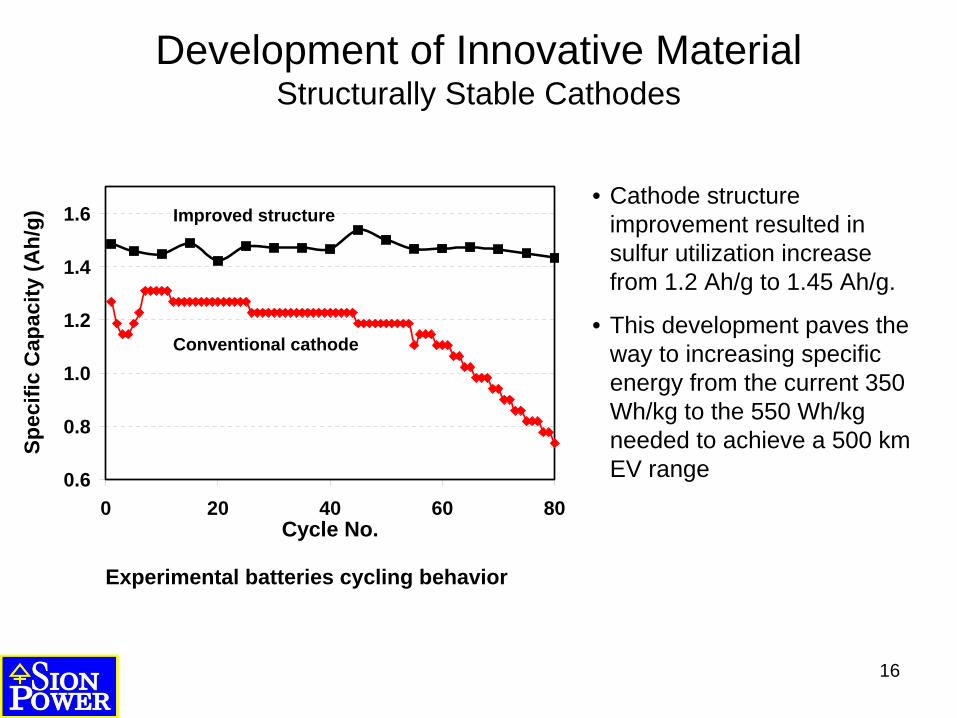
16
• Cathode structure improvement resulted in sulfur utilization increase from 1.2 Ah/g to 1.45 Ah/g.
• This development paves the way to increasing specific energy from the current 350 Wh/kg to the 550 Wh/kg needed to achieve a 500 km EV range
Development of Innovative Material Structurally Stable Cathodes
0.6
0.8
1.0
1.2
1.4
1.6
0 20 40 60 80Cycle No.
Spec
ific
Cap
acity
(Ah/
g) Improved structure
Conventional cathode
Experimental batteries cycling behavior

17
Thermal Ramp Test of Fully charged Li-S batteries after 20 cycles at 5 oC/min.
Development of Innovative Material Multi-functional Membrane Assemblies
With Sion-BASF protective layer on anode, there is no thermal runaway.
-5
15
35
55
75
95
100 120 140 160 180 200 220 240Heater Temperature, oC
T cel
l - T
Hea
ter,
o C
Sulfur melting
Li melting
Conventional design Proprietory
design
Sion-BASFProtective
Layer

18
ConclusionsReduction of lithium surface roughness with new anode design, and better cathode structure, resulted in:
•Recharge time reduced to less than 3 hours.
•Substantial cycle life increase if lithium surface roughness suppressed.
•Sulfur utilization increased to 87%, or 1.45 Ah/g, paving the way to 550 Wh/kg Li-S battery.
Innovative anode design, and Sion Power-BASF protective membranes, increased thermal stability of Li-S cells – eliminating thermal runaway. Batteries passed the melting point of the Li without violent events.
19
Sion Power Corporation, in collaboration with BASF, is very optimistic that the future of all electric EV applications will be dominated by Sion Power’s lithium-sulfur technology.
Takeaway
20