Embed Size (px)
Citation preview

High Abundances of Aerobic Anoxygenic Photosynthetic Bacteria in the 1
South Pacific Ocean 2
3
Raphaël Lami1, Matthew T. Cottrell
2, Joséphine Ras
3, Osvaldo Ulloa
4, Ingrid Obernosterer
1, 4
Hervé Claustre3, David L. Kirchman
2, Philippe Lebaron
1* 5
6
1Université Pierre et Marie Curie-Paris6, UMR7621, F66650 7
Banyuls-sur-Mer, France ; CNRS, UMR7621, F-66650 Banyuls-sur-Mer, France 8
2University of Delaware, College of Marine and Earth Studies, Lewes, Delaware 19958 USA 9
3CNRS-UPMC, Observatoire Océanologique de Villefranche, Laboratoire d’Océanographie 10
de Villefranche, 06230 Villefranche-sur-mer, France. 11
4Departmento de Oceanografia and Centro de Investigación Oceanográfica en el Pacifico 12
Sudoriental. Universidad de Conceptión, PROFC – Cabina 7, Castilla PO 160-C, Concepciόn, 13
Chile. 14
15
Running title : AAP bacteria in the South Pacific Ocean 16
17
* Corresponding author : Mailing address : Observatoire Océanologique de Banyuls, 18
Université Pierre et Marie Curie-Paris6, UMR7621-INSU-CNRS, BP44, 66651 Banyuls-sur-19
Mer, France. Phone: 33 4 68 88 73 00. Fax: 33 4 68 88 16 99. E-mail: lebaron@obs-20
banyuls.fr 21
22
Submitted as an article to Applied and Environmental Microbiology (section: Microbial 23
Ecology) 24
25
Keywords : AAP bacteria, South Pacific Ocean, Biovolume 26
2
ABSTRACT 1
2
Aerobic anoxygenic photosynthetic (AAP) bacteria are bacteriochlorophyll (Bchl a) 3
containing microorganisms. Although these bacteria seem to be widespread in marine 4
environments, little is known about their abundance, distribution and more generally their 5
ecology, particularly in oligotrophic environments which represent 60% of the ocean. We 6
investigated the importance of AAP bacteria across the South Pacific Ocean including the 7
centre of the gyre, the most oligotrophic water body of the world ocean. AAP bacteria, 8
Prochlorococcus and total heterotrophic bacterial abundance, as well as BChl a and Divinyl-9
Chlorophyll a concentrations were measured at several depths in the photic zone along a 10
gradient of oligotrophic conditions. High abundances of AAP bacteria (up to 1.94 × 10⁵ cells 11
ml-1 and up to 24% of the overall bacterioplankonic community) as well as high Bchl a 12
concentrations (up to 3.32 × 10⁻³ µg liter
-1) were found at all stations. Furthermore, the 13
biovolumes of AAP bacteria were larger than those of other bacterioplanktonic cells. This 14
study clearly demonstrates that AAP bacteria are ubiquitous in the marine environment and 15
can be abundant in a wide diversity of trophic conditions including the most oligotrophic 16
environments. 17
18
19
20
21
22
23
24
25

3
INTRODUCTION 1
2
Prokaryotic microbes play a key role in the carbon flow in aquatic ecosystems. 3
Heterotrophic bacteria are central actors of the microbial loop and play an essential role in the 4
transformation of dissolved organic matter (DOM) (2). In contrast, autotrophic bacteria like 5
Prochlorococcus are significant primary producers in a number of oceanic ecoystems (23). 6
Aerobic anoxygenic phototrophic (AAP) bacteria are able to combine both phototrophic and 7
heterotrophic functions (35). Recent studies indicate that this group of bacteria is widely 8
distributed in the oceanic environment. However, the ecological importance of AAP bacteria 9
remains poorly understood. 10
These bacteriochlorophyll (BChl a) containing prokaryotes require oxygen and can 11
use reduced organic compounds as electron donors (17, 35). It is unclear if AAP bacteria are 12
capable of CO2 fixation in the environment (17). The first marine AAP bacterium was 13
isolated thirty years ago (28), but only recently these bacteria were found to be 14
phylogenetically diverse (3). These photoheterotrophs were not expected to be abundant in 15
the open ocean, but novel approaches, such as epifluorescence microscopy, quantitative PCR 16
and new sensitive measurements of BChl a fluorescence and concentrations revealed the 17
presence of AAP bacteria in a wide diversity of marine ecosystems (8, 13, 17, 25, 30). AAP 18
bacteria were also detected by metagenomic studies in various aquatic environments (3, 22, 19
32, 33). These data show that AAP bacteria are widely distributed and may represent a 20
significant fraction of the bacterioplanktonic community. Consequently, AAP bacteria could 21
significantly contribute to the carbon cycle in the oceans (17). 22
It was suggested that AAP bacteria are adapted to oligotrophic waters, as light might 23
supply supplementary energy in low nutrient conditions (17). This hypothesis has not been 24
supported by recent data indicating high abundances of AAP bacteria in mesotrophic coastal 25
and estuarine environments (8, 25). More data on the abundance and distribution of AAP 26

4
bacteria are needed to better understand links between the trophic status of water masses and 1
photoheterotrophy. AAP bacteria remain clearly undersampled in several areas, especially in 2
oligotrophic environments, which represent 60% of the ocean (19). 3
Bchl a data might provide interesting clues about the photophysiology of AAP 4
bacteria (8), but only few studies combine both AAP cell enumeration together with BChl a 5
concentrations. Moreover, little is known about the relative importance of AAP bacteria 6
compared to autotrophic bacteria. Cottrell et al. (8) found that AAP bacteria were two-fold 7
more abundant than Prochlorococcus in the Gulf Stream, while the abundance of AAP 8
bacteria was considerably lower than that of Prochlorococcus in the central North Pacific and 9
in the Sargasso Sea (8, 30). 10
The objective of the present study was to determine the vertical and spatial distribution 11
of AAP bacteria across the South Pacific Ocean and to assess their relative importance in a 12
gradient of oligotrophic conditions. Microscopic counts revealed high abundances of AAP 13
bacteria across the South Pacific Ocean, yielding up to 24% of the overall bacterioplanktonic 14
cell abundance. 15
16
17
18
19
20
21
22
23
24
25

5
MATERIALS AND METHODS 1
2
Study sites. 3
Samples were collected during the BIOSOPE (Biogeochemistry and Optics South 4
Pacific Ocean Experiment) cruise that took place in October-December 2004. The sampling 5
strategy was based on satellite imagery of ocean color with the aim of collecting samples 6
across various trophic conditions. From the West to the East of the cruise transect, five 7
stations, covering a distance of 6000 nautical miles and varying oligotrophic regimes were 8
sampled (Fig.1): stations HNL1 (09°00S, 136°50W), STB2 (13°33S, 132°06N), GYR 9
(26°00S, 114°00W), STB15 (30°041S, 95°25W) and STB17 (32°23S, 86°47W). Seawater 10
samples were collected with General Oceanics 12 liters Niskin bottles mounted on a rosette 11
equipped with a SeaBird SBE19+ CTD. Sea surface temperature (5 m) varied between 27.8°C 12
at station HNL1 to 17.3°C at station STB17. The depth of the euphotic zone varied between 13
160 m at station GYR and 90 m at station HNL1 (Table 1). Integrated Chlorophyll a (Chl a) 14
values (over the euphotic zone) ranged between 11 mg m-2 (station GYR) and 18 mg m
-2 15
(station HNL1). Concentrations of inorganic nitrogen in the mixed layer varied between 16
undetectable levels at stations STB2, GYR, STB15 and 3.35 ± 0.43 µM at station STB15, 17
while phosphate concentrations ranged between 0.17 ± 0.015 µM at station GYR and 0.34 ± 18
0.040 µM at station HNL1 and STB17 (Table 1). Samples for all parameters described here 19
were taken around noon. 20
21
AAP bacterial abundance and cell volume determination 22
For the enumeration of AAP bacteria, seawater samples were fixed with 23
paraformaldehyde 2% (final concentration). Samples were stored in the dark (18h, 4°C), 24
before filtering onto 0.2µm pore size black polycarbonate filters. Filters were stored at -80°C 25

6
before microscopic counts. AAP bacterial abundances were determined following the 1
protocol previously described by Cottrell et al. (8). Briefly, after a DAPI staining step (5 min) 2
in a phosphate-buffered saline (10 g NaCl, 0.25 g KCl, 1.8 g Na2HPO4 and 0.3 g KH2PO4 in 1 3
liter water [pH 7.4]) the sample was mounted on a glass slide. We then added an antifading 4
agent comprised of Citifluor (Ted Pela) and Vectashield (Vector Labs) mixed in a ratio 4:1 5
(vol/vol). AAP bacteria were counted on an Olympus Provis AX70 microscope. An image 6
analysis software (ImagePro Plus, Media Cybernetic) was used to discriminate DAPI stained 7
cells and AAP bacteria by infrared (IR) fluorescence, but not Chl a or Phycoerythrin (PE) 8
fluorescence. For each field, a series of four images were taken: DAPI (excitation: 360 ± 40; 9
emission : 460 ± 50), IR (excitation : 390 ± 100, emission : 750 long pass), Chl a (excitation : 10
480 ± 30, emission : 660 ± 50), and PE (excitation : 545 ± 30, emission : 610 ± 75) (Chroma). 11
Each image was captured with a charged-coupled-device camera (Intensified Retiga Extended 12
Blue; Q Imaging) with specific exposure times : DAPI, 40 ms; IR, 200 ms; Chl 1.500 ms; PE, 13
50 ms. Focus was adjusted by approximately 0.8 µm between the DAPI and IR images using 14
a computer-controlled z-axis controller (Prior Instruments) to correct for chromatic aberration. 15
Cells were identified by detecting edges with Laplacian and Gaussian filters applied in series 16
(21). The filtered images were segmented into binary format and then overlaid to identify 17
cells with DAPI and IR fluorescence but not Chl or PE fluorescence. Cell volumes were 18
measured by image analysis of DAPI-stained cells and measured from solids of revolution 19
constructed by digital integration (29). 20
21
Pigment concentrations 22
Seawater samples were collected from the 12 liters Niskin bottles of the rosette 23
sampler. Volumes between 5.6 and 1 liter (depending on the trophic conditions) were filtered 24
onto 25 mm GF/F filters which were subsequently stored in liquid nitrogen then at –80°C 25

7
until analysis on land. The samples were extracted in 3 ml methanol for one hour minimum, 1
with filter disruption by ultra-sonication. The clarified extracts were injected onto an Agilent 2
Technologies 1100 series High Performance Liquid Chromatography (HPLC) system 3
equipped with a refrigerated auto sampler and a column thermostat, according to a modified 4
version of the method described by Van Heukelem and Thomas (31). Separation was 5
achieved within 28 min during a gradient elution between a Tetrabutylammonium 6
actetate:methanol mixture (30:70) and 100% methanol. The chromatographic column, a 7
Zorbax-C8 XDB (3 ×150 mm) was maintained at 60°C. Chl a and Divinyl-Chlorophyll a 8
(Dv-Chl a) were detected at 667 nm and BChl a at 770 nm using a diode array detector. The 9
detection limit was 0.0001 µg liter-1, the injection precision was 0.4%. The different pigments 10
were identified by both their retention times and absorption spectra. Quantification involved 11
an internal standard correction (Vitamin E actetate) and a calibration with external standards 12
provided by DHI Water and Environment (Denmark) for Chl a and Dv-Chl a and by Sigma 13
for BChl a. 14
15
Prochlorococcus and bacterioplankton abundances. 16
The abundance of Prochlorococcus and heterotrophic prokaryotes (Bacteria and 17
Archaea, including AAP bacteria) were measured by flow cytometry (FACSCalibur, Becton 18
Dickinson) following the proceedure outlined by Marie et al. (20) Prochlorococcus 19
enumeration was done on board on fresh samples, while samples for the enumeration of 20
heterotrophic prokaryotic cells were fixed with paraformaldehyde (1% final concentration), 21
quick-frozen in liquid nitrogen and stored at –80°C until analysis back in the lab. For 22
heterotrophic prokaryotic counts, samples were stained with SYBR-Green I (Molecular 23
Probes). Picoplanktonic populations were differentiated based on their scattering and 24
fluorescence signals. When surface Prochlorococcus populations were not well defined 25

8
because of their weak fluorescence, their abundance was determined by fitting a Gaussian 1
curve to the data. To estimate bacterial carbon biomass, we considered 12.4 fg of carbon per 2
bacterial cell as in Fukuda et al. (11). 3
4
RESULTS 5
6
Abundance of AAP bacteria, Prochlorococcus and heterotrophic prokaryotes. 7
AAP bacteria were present at all stations, with the highest abundances (1.94 × 10⁵ 8
cells.ml-1 in surface waters of station STB2 (Fig 2,3). All along the transect, AAP bacterial 9
abundances were lower than those of Prochlorococcus which ranged between less than 100 10
cells.ml-1 and 3.16 × 10
5 cells.ml
-1 (station STB2, 70m). Heterotrophic bacterial abundance 11
ranged from 1.57 × 10⁵ cells.ml
-1 at station GYR (270 m) and 1.07 × 10
6 cells.ml
-1 (station 12
HNL1, 5m) (Fig. 2a, Fig 3a). The relative contribution of AAP bacteria to the overall 13
bacterioplanktonic abundance varied between 1% (STB2, 250 m) and 24% (STB2, 100 m) 14
and Prochlorococus accounted up to 44% (STB15, 70 m) of prokaryotic abundance (Table 2). 15
At stations HNL1 and STB2, AAP bacteria were abundant from the surface to the deep 16
chlorophyll maximum (DCM) (respectively mean 13.6 ± 3.3% and 20.1 ± 4.4% of 17
bacterioplanktonic abundance) and rapidly decreased with depth below the DCM. At stations 18
GYR, STB15 and STB17 AAP bacterial abundance was lowest in surface waters and highest 19
just above the DCM, with relative contributions of 20%, 13% and 10% of the total 20
prokaryotic abundance, respectively. The vertical distribution of AAP bacteria was similar to 21
that of Prochlorococcus, but clearly different from that of non-photosynthetic prokaryotes 22
(Table 2, Fig. 2a, Fig. 3a). 23
24
25

9
Bacteriochlorophyll a and Divinyl-Chlorophyll a (Dv-Chl a) 1
Concentrations of Bchl a ranged between undetectable levels and 3.32 × 10⁻³ µg.liter
-1 2
(HNL1, 80 m) in the euphotic zone across the transect. In contrast, concentrations of DvChl a 3
were roughly fifty times higher and reached values of 0.135 µg.liter-1 (HNL1, 80 m) (Fig. 2b, 4
Fig 3b). The concentration of BChl a per AAP bacterial cell was up to 0.184 fg while 5
Prochlorococcus yielded cell-specific Dv-Chl a concentrations of up to 2.91 fg (Table 3). 6
BChl a concentrations were high from the surface to the DCM, and then decreased with depth 7
to low concentrations at 200 m. At Station GYR, BChl a peaked at 120 m, just above the 8
DCM. These patterns were quite different from those of Dv-Chl a, as this pigment was 9
abundant in the DCM (0.101 – 0.135 µg.liter-1), while low or undetectable concentrations 10
were present at the surface and below the DCM (Fig. 2a., Fig. 3a). The BChl a/Chl a ratio 11
decreased with depth, from 0.6 - 2.3% to 0% (Table 3). BChl a cell concentrations decreased 12
with depth at Stations GYR, STB15 and STB17, but peaked at 80 m and 30 m at stations 13
HNL1 and STB2. In contrast, Dv-Chl a per cell increased with depth at all stations, from 14
0.19-0.23 fg cell-1 in the upper layers of the euphotic zone to values greater than 2.00 fg cell
-1 15
above 200 m (HNL1 and GYR) (Table 3). 16
17
Biovolumes of AAP bacteria and heterotrophic prokaryotes. 18
AAP bacteria were on average twice as large as other prokaryotic cells (Fig. 4), but 19
this difference varied greatly. AAP bacterial cell volumes ranged from 0.115 to 1.296 µm3
20
while that of other cells varied between 0.093 and 0.164 µm3 (Fig. 4). Considering all data, 21
the difference in biovolumes between AAP cells and all DAPI-stained cells was statistically 22
significant (paired t-test, p < 0.01, n=27). AAP bacteria were significantly larger than other 23
cells for 16 out of 25 samples, including 12 samples collected at stations HNL1, STB2 and 24
GYR. 25

10
Prokaryotic cell abundances, biomass and pigment distribution along the horizontal 1
gradient. 2
There was no clear relationship between AAP bacterial biomass or BChl a 3
concentration and Chl a (Fig. 5). AAP bacterial biomass integrated over the euphotic zone 4
was highest at stations HNL1 (13.2 mmolC m-2) and STB2 (18.9 mmolC m
-2) and lower at 5
stations GYR (6.7 mmolC m-2), STB15 (5.2 mmolC m
-2) and STB17 (4.3 mmolC m
-2), while 6
integrated Chl a concentrations were highest at the most eastern and the most western 7
stations. There was also no relationship between Chl a and BChl a. Like AAP bacterial 8
stocks, the highest integrated concentrations of BChl a were found only at the most eastern 9
stations (HNL1 and STB2) and decreased from the east to the west of the transect, from 0.19 10
mg m-2 at station HNL1 to 0.058 mg m
-2 at station STB17 (Fig. 5). 11
12
DISCUSSION 13
14
Biogeochemical processes in the South Pacific Ocean remain poorly documented, 15
even though the importance of this oceanic area in global biogeochemical cycles is well 16
recognized (7, 10). In this study, we determined the abundance and distribution of AAP 17
bacteria in the photic zone of the South Pacific Ocean along a transect with varying trophic 18
conditions. Our sampling included the center of the gyre, the most oligotrophic water body of 19
the world ocean. We found at all stations high abundances and important biomasses of AAP 20
bacteria, along with high concentrations of Bchl a. 21
One problem in enumerating AAP bacteria by IR autofluorescence is that 22
cyanobacteria are also potentially included in these estimates due to a emission of Chl a in IR 23
(25, 36). In the present study, problems counting AAP bacteria in the presence of Chl a-24
containing cyanobacteria such as Prochlorococcus were avoided by removing cells having 25

11
Chl a fluorescence from IR images (8). Using this approach, only a low background of cells 1
in a Prochlorococcus culture were identified as AAP bacteria (0.3% ± 0.3%). In previous 2
work this approach detected low abundances of AAP bacteria in the North Pacific Gyre where 3
Prochorococcus were highly abundant. These data indicate that our estimates of AAP 4
bacterial abundance were not affected by Prochlorococcus. 5
We detected high abundances (up to 1.94 × 10⁵ cells ml
-1) of AAP bacteria at each 6
station along the transect and at several depths in the photic zone of the South Pacific Ocean. 7
The high standing stocks of AAP bacteria were found above the DCM at stations HNL1 and 8
STB2, and closer to the DCM at stations GYR, STB15 and STB17. AAP bacteria were also a 9
large fraction of the overall South Pacific prokaryotic community (up to 24%) and constituted 10
together with Prochlorococcus up to 58% of the overall prokaryotic community in these 11
oceanic regimes. These abundances of AAP bacteria are the highest ever reported for 12
oligotrophic waters. High relative abundances (11%) in the oligotrophic North Pacific Ocean 13
were also reported by Kolber et al. (17). However, that study did not correct for possible 14
inclusion of cyanobacteria in the AAP bacterial estimate. Cottrell et al. (8) did this correction 15
and still found that AAP bacteria made up nearly 18% of the prokaryotic community in Gulf 16
Stream waters and more than 10% in the shelf break waters of the Mid-Atlantic Bight. In 17
contrast, Schwalbach and Fuhrman (25) report that AAP bacterial abundance was low in 18
oligotrophic waters of Southern California. 19
Concomittant with high abundances of AAP bacteria, we also determined high 20
concentrations of Bchl a for oligotrophic waters, close to those reported in Kolber et al. (17). 21
The BChl a/Chl a ratio (up to 2.3%) was lower than the 5-10% estimated by Kolber et al. (17) 22
in the oligotrophic North Pacific Ocean but was close to ratios reported off the Californian 23
coast (13), for the Baltic Sea (15), the Mid-Atlantic Bight and the Gulf Stream (8). 24
It was previously suggested that photoheterotrophy may be an adaptation to 25
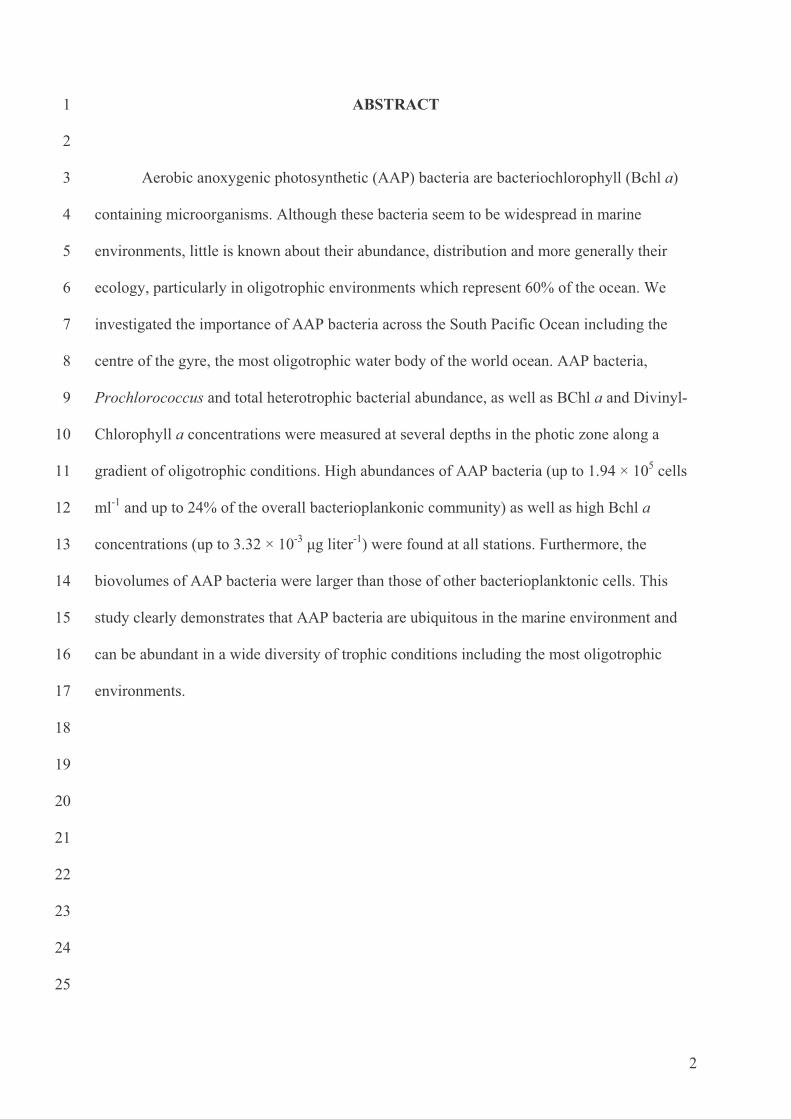
12
oligotrophic environments, as light might supply energy under low nutrient concentrations 1
conditions (17). The relationship between AAP bacteria and the nutrient status of water 2
masses is still being debated in the literature, since several studies report high abundances of 3
these bacteria in estuarine environments (25) and in coastal waters (8). To our knowledge, this 4
is the first study reporting such high AAP bacterial abundances in the oligotrophic 5
environment. Our results clearly indicate that AAP bacteria are not adapted to a narrow range 6
of trophic conditions and that these bacteria may represent an important fraction of the 7
prokaryotic community whatever the trophic status of the water masses. 8
AAP bacteria were detected in the upper layers of the photic zone, between the DCM 9
and the sea surface. Several authors also report the presence of AAP bacteria in the photic 10
zone, in agreement with their phototrophic abilities (8, 17). Clues of an in situ photosynthetic 11
activity in the photic zone were previously described, as fluorescence data indicate that AAP 12
bacteria account for 2-5% of the photosynthetic electron transport (16). Although cultured 13
AAP bacterial isolates can survive under dark conditions, it was reported that light enhances 14
their growth capacities (34). All these observations suggest that AAP bacteria are able to use 15
their phototrophic potential. However, the measured low amounts of BChl a per cell - 16
consistent with previous published observations (8, 29) - reinforce the hypothesis that AAP 17
bacterial phototrophy is probably low in the ocean and that these organisms essentially use 18
energy from dissolved organic matter, in contrast to Prochlorococcus cells which are strictly 19
phototrophs. 20
All these data suggest that phototrophy is one possible adaptation making AAP 21
bacteria extremely competitive and therefore widespread in oceanic waters. However, this 22
wide distribution of AAP bacteria is probably due to the fact that phototrophy in most AAP 23
bacteria is combined with a wide range of other metabolic capacities. Roseobacter littoralis, 24
the first AAP bacteria strain isolated in the marine environment (27), was previously found in 25

13
natural bacterial communities using organic material produced by phytoplankton in the 1
Adriatic Sea (9) and was also described as a lithotroph that uses dissolved CO (for review, see 2
(5)). This high metabolic plasticity has been reported among other cultured AAP bacterial 3
strains. In the Roseobacter clade, several AAP bacteria can combine phototrophy with other 4
specific metabolisms (5). Among isolated Erythrobacter strains, previous studies reported 5
that Erythrobacter sp. NAP1 and Erythrtobacter sp. OCh114 isolates are capable of CO2 6
fixation (17, 28). Several studies demonstrate that this photoheterotrophic strategy is not 7
limited to a few AAP bacterial species. Although cultured AAP bacteria are restricted to some 8
Erythrobacter, Roseobacter and Gammaproteobacterial strains (6, 24), recent metagenomic 9
approaches conducted in the Sargasso Sea (32), in the Delaware estuary (33), and offshore 10
California (3) revealed a high diversity of specific AAP bacterial sequences, demonstrating 11
that AAP bacteria are distributed within several alpha- and gammaproteobacterial 12
phylogenetic groups. 13
Our estimations of AAP bacterial biomass revealed that these organisms can represent 14
an important stock of carbon in the euphotic zone, thus suggesting that AAP bacteria may 15
play an important ecological role in the oceans. Our biovolume measurements reinforce this 16
assertion. These bacteria were larger than other prokaryotic cells. Sieracki et al. (30) found a 17
similar trend across a transect in the North Atlantic Ocean. The larger size of AAP bacteria 18
also suggest that these bacteria may be more active than other fractions of the bacterial 19
community, if we assume that there is a positive relationship between cell size and activity, as 20
previously shown (4, 12, 18). Furthermore, AAP bacteria might be under intense grazing 21
pressure, since larger cells are preferentially grazed on by bacterial predators (1, 14, 26). 22
Althrough further investigations are needed to better understand the ecological role of AAP 23
bacteria, these observations reinforce their potential role in marine carbon cycling. 24
25

14
Conclusions 1
Our results clearly demonstrate that marine AAP bacteria can be abundant in 2
oligotrophic and ultra-oligotrophic conditions. The importance of AAP bacteria in the world 3
ocean might be explained by their high metabolic plasticity, combining autotrophy with a 4
wide range of specific heterotrophic abilities. Previous studies revealed an important 5
phylogenetic diversity among AAP bacterial populations, but little is still known on the 6
diversity of photoheterotrophic bacteria in the water column and on the ecology of AAP 7
bacterial populations. Further work is needed to isolate and to characterize AAP species and 8
to determine their in situ activity as well as how environmental conditions affect their activity. 9
Based on available data, AAP bacteria appear to be an essential link in the control of carbon 10
fluxes, and should be considered when modeling biogeochemical processes in general and the 11
carbon cycle in particular. 12
13
ACKNOWLEDGMENTS 14
15
We thank the captain and the crew of the R/V L’Atalante and the chief scientists for 16
their excellent cooperation. This work was supported by the Institut National des Sciences de 17
L’Univers (INSU) and the program PROOF (PROcessus biogeochimique Oceaniques et 18
Flux). Raphaël Lami’s work in the Lebaron lab was supported by a doctoral fellowship from 19
the French Research and Education Ministry. Work in the Kirchman lab was supported by the 20
U.S. Department of Energy (BIOMP 20 DFFG02-97 ER 62479) and the NSF Microbial 21
Observatory Program (MCB 0453993). Work in the Ulloa lab was supported by the Chilean 22
National Commission for Scientific and Technological Research (CONICYT) through the 23
Funds for Advanced Research in Priority Areas (FONDAP) Programme and by the Fundación 24
Andes. We thank Philippe Catala in the Lebaron lab for sample collection, Liying Yu in the 25

15
Kirchman lab, Gadiel Alarcón and Carolina Grob in the Ulloa lab for technical help. P. 1
Raimbault kindly provided inorganic nutrient data. We would also like to thank Sandrine 2
Maria in the Banyuls lab library for her assistance in bibliographical data search. 3
4
REFERENCES 5
6
1. Andersson, A., U. Larsson, and Å. Hagström. 1986. Size-selective grazing by a 7
microflagellate on pelagic bacteria. Mar. Ecol. Prog. Ser. 33:51-57. 8
2. Azam, F., T. Fenchel, J. G. Gray, L. A. Meyer-Reil, and F. Thingstad. 1983. The 9
ecological role of water-column microbes in the sea. Mar. Ecol. Prog. Ser. 10:257-10
263. 11
3. Béjà, O., M. T. Suzuki, J. F. Heidelberg, W. C. Nelson, C. M. Preston, T. 12
Hamada, J. A. Eisen, C. M. Fraser, and E. F. DeLong. 2002. Unsuspected 13
diversity among marine aerobic anoxygenic phototrophs. Nature 415:630-633. 14
4. Bird, D. F., and J. Kalff. 1993. Protozoan grazing and size-activity structure in 15
limnetic bacterial communities. Can. J. Fish. Aquat. Sci. 50:370-380. 16
5. Buchan, A., J. M. González, and M. A. Moran. 2005. Overview of the marine 17
Roseobacter lineage. Appl. Environ. Microbiol. 7110:5665-5677. 18
6. Cho, J. C., and S. J. Giovanonni. 2004. Cultivation and growth characteristics of a 19
diverse group of oligotrophic marine gammaproteobacteria. Appl. Environ. 20
Microbiol. 70:432-440. 21
7. Claustre, H. and S. Maritonera. 2003. The many shades of ocean blue. Science 22
302:1514-1515. 23

16
8. Cottrell, M. T., A. Mannino, and D. L. Kirchman. 2006. Aerobic anoxygenic 1
phototrophic bacteria in the Mid Atlantic Bight and the North Pacific Gyre. Appl. 2
Environ. Microbiol. 721:557-564. 3
9. Fajon, C. 1998. Ph.D. thesis. Université Pierre et Marie Curie-Paris6, Paris. Etude 4
de la production et de la dégradation de composés organiques extracellulaires en 5
Mer Adriatique du Nord. 6
10. Falkowski, P. G., R. T. Barber, and V. Smetacek. 1998. Biogeochemical controls 7
and feedbacks on ocean primary production. Science 281:200-206. 8
11. Fukuda, R., H. Ogawa, T. Nagata, and I. Koike. 1998. Direct determination of 9
carbon and nitrogen contents of natural bacterial assemblages in marine 10
environments. Appl. Environ. Microbiol. 64:3352-3358. 11
12. Gasol, J. M., P. A. del Giorgio, R. Massana, and C. M. Duarte. 1995. Active 12
versus inactive bacteria : size-dependence in a coastal marine plankton community. 13
Mar. Ecol. Prog. Ser. 128:91-97. 14
13. Goericke, R. 2002. Bacteriochlorophyll a in the ocean: Is anoxygenic bacterial 15
photosynthesis important ? Limnol. Oceanogr. 471:290-295. 16
14. Gonzalez, J. M., E. B. Sherr, and B. F. Sherr. 1990. Size-selective grazing on 17
bacteria by natural assemblages of estuarine flagellates and ciliates. Appl. Environ. 18
Microbiol. 56:583-589. 19
15. Koblížek, M., J. Ston-Egiert, S. Sagan, and Z. S. Kolber. 2005. Diel changes in 20
bacteriochlorophyll a concentration suggest rapid bacterioplankton cycling in the 21
Baltic Sea. FEMS Microbiol. Ecol. 51:353-361. 22
16. Kolber, Z. S., C. L. Van Dover, R. A. Niederman, and P. G. Falkowski. 2000. 23
Bacterial photosynthesis in surface waters of the open ocean. Nature 407:177-179. 24
17
17. Kolber, Z. S., F. G. Plumley, A. S. Lang, J. T. Beatty, R. E. Blankenship, C. L. 1
VanDover, C. Vetriani, M. Koblížek, C. Rathgeber, and P. G. Falkowski. 2001. 2
Contribution of aerobic photoheterotrophic bacteria to the carbon cycle in the ocean. 3
Science 292:2492-2495. 4
18. Lebaron, P., P. Servais, M. Troussellier, C. Courties, Vives-Rego, J., G. 5
Muyzer, L. Bernard, T. Guindulain, H. Schäfer, and E. Stackebrandt. 1999. 6
Changes in bacterial community structure in seawater mesocosms differing in their 7
nutrient status. Aquat. Microb. Ecol. 19:255-267. 8
19. Longhurst, A., S. Sathyendranath, T. Platt, and C. Caverhill. 1995. An estimate 9
of global primary production in the ocean from satellite radiometer data. J. Plankton 10
Res. 17:1245-1271. 11
20.Marie, D., F. Partensky, N. Simon, L. Guillou and D. Vaulot. 2000. Flow 12
cytometry analysis of marine picoplankton, , p 421-454. In: R. A. Diamond, S. 13
DeMaggio (eds.), In living colors: protocols in flow cytometry and cell sorting. 14
Springer-Verlag, NewYork. 15
21.Massana, R., J. M. Gasol, P. K. Bjørnsen, N. Blackburn, Å. Hagström, S. 16
Hietanen, B. H. Hygum, J. Kuparinen, and C. PedrόsAliό. 1997. Measurements 17
of bacterial size via image analysis of epifluoresence preparations: description of an 18
inexpensive system and solutions to some of the most common problems. Sci. Mar. 19
61:397-407. 20
22. Oz, A., G. Sabehi, M. Koblížek, R. Massana, and O. Béjà. 2005. Roseobacter-21
like bacteria in Red and Mediterrabean Sea aerobic anoxygenic photosynthetic 22
populations. Appl. Environ. Microbiol. 71:344-353. 23

18
23. Partensky, F., W. R. Hess, and D. Vaulot. 1999. Prochlorococcus, a marine 1
photosynthetic prokaryote of global significance. Microbiol. Mol. Biol. Rev. 2
631:106-127. 3
24. Rathgeber, C. J., J. T. Beatty, and V. Yurkov. 2004. Aerobic phototrophic 4
bacteria: a new evidence for the diversity, ecological importance and applied 5
potential of this previously overlooked group. Photosynth. Res. 81:113-128. 6
25. Schwalbach, M. S., and J. A. Fuhrman. 2005. Wide ranging abundances of 7
aerobic anoxygenic phototrophic bacteria in the world ocean revealed by 8
epifluoresence microscopy and quantitative PCR. Limnol. Oceanogr. 50:620-628 9
26. Sherr, B. F., E. B. Sherr and J. McDaniel. 1992. Effect of protistan grazing on the 10
frequency of dividing cells in bacterioplankton assemblages. Appl. Environ. 11
Microbiol. 58:2381-2385. 12
27. Shiba, T., U. Simidu, and N. Taga. 1979. Distribution of Aerobic Bacteria which 13
contain Bacteriochlorophyll a. Appl. Environ. Microbiol. 381:43-45. 14
28. Shiba, T. 1984. Utilization of light energy by the strictly aerobic bacterium 15
Erythrobacter sp. OCh 114. J. Gen. Appl. Microbiol. 30:239-244. 16
29. Sieracki, M. E., C. L. Viles, and K. L. Webb. 1989. Algorithm to estimate cell 17
biovolume using image analysed microscopy. Cytometry 10:551-557. 18
30. Sieracki, M. E., I. C. Gilg, E. C. Thier, N. J. Poulton, R. and R. Goericke. 2006. 19
Distribution of planktonic aerobic anoxygenic photoheterotrophic bacteria in the 20
Northwest Atlantic. Limnol. Oceanogr. 511:38-46. 21
31. Van Heukelem, L., and C. S. Thomas. 2001. Computer-assisted high-performance 22
liquid chromatography method development with applications to the isolation and 23
analysis of phytoplankton pigments. Journal of Chromatography A 910: 31-49. 24

19
32. Venter, J. C., K. Remington, J. F. Heidelberg, A. L. Halpern, D. Rusch, J. A. 1
Eisen, D. Wu, I. Paulsen, K. E. Nelson, W. Nelson, D. E. Fouts, S. Levy, A. H. 2
Knap, M. W. Lomas, K. Nealson, O. White, J. Peterson, J. Hoffman, R. 3
Parsons, H. Baden-Tillson, C. Pfannkoch, Y. H. Rogers and H. O. Smith. 2004. 4
Environmental genome shotgun sequencing of the Sargasso Sea. Science 304:66-74. 5
33.Waidner, L. A., and D. L. Kirchman. 2005. Aerobic anoxygenic photosynthesis 6
genes and operons in uncultured bacteria in the Delaware River. Environ. Microbiol. 7
7:1896-1908. 8
34. Yurkov, V. V., and H. van Gemerden. 1993. Impact of light dark regimen on 9
growth rate, biomass formation and bacteriochlorophyll synthesis in 10
Erythromicrobium hydrolyticum. Arch. Microbiol. 159:84-89. 11
35. Yurkov, V. V., and J. T. Beatty. 1998. Aerobic Anoxygenic Phototrophic Bacteria. 12
Microb. Mol. Biol. Rev. 623:695-724. 13
36. Zhang, Y., and N. Z. Jiao. 2003. Method for quantification of aerobic anoxygenic 14
phototrophic bacteria. Chin. Sci. Bull. 49:597-600. 15

20
Table 1. General oceanographic parameters: SST - Sea surface temperature, Ze - depth of the 1
euphotic zone, Zm - depth of the wind mixed layer, nitrate and phosphate concentrations are 2
mean values of the wind mixed layer. n.d.- not detectable. 3
Stations HNL1 STB2 GYR STB15 STB17
SST (°C) 27.8 27.4 22.1 18.7 17.3
Ze (m) 90 124 160 108 96
Zm (m) 74 21 18 30 20
Nitrate (µM) 1.59 nd nd nd 3.05
Phosphate (µM) 0.340 0.187 0.130 0.135 0.320

21
Table 2. Percentages of Prochlorococcus and AAP bacterial cell abundances of the overall 1
bacterioplankton community. 2
Station Depth
(m) Prochlorococcus
(%) AAP (%)
SD (%)
HNL1 5 15.9 10.2 3
15 22.5
30 24.5
40 27.0
60 18.2 14.0 2.1
80 19.6 16.8 1.9
100 14.9 11.1 2.7
120 9.6 8.9 2.5
140 8.4
200 0.1 6.5 2.3
STB2 5 20.6 4.2
20 26.9
30 24.7 15.5 7.3
50 34.4
70 39.2
100 34.2 24.2 3.2
130 20.2 19.5 4.4
170 10.9 10.5 2.7
200 2.2
250 1.1 1.7
GYR 5 1.4 2.1
90 9.0 6.8
120 40.6
140 29.8 19.6 4.7
180 15.3 5.2
200 17.9
230 5.7 7.5 3.8
270 0.2 1.7 3.9
STB15 5 9.6 1.9 1.3
30 11.8
50 19.5 5.0 3.7
70 44.2
90 36.1 12.8 2.7
105 35.1 12.6 3
130 26.1 4.7 1.8
150 20.8
175 21.9 0.3 0.2
STB17 5 0.5 0.5
30 11.9
60 21.7 10.0 3.4
100 7.0
150 3.0 0.1 0.3

22
Table 3. BChl a / Chl a ratios, concentrations of Dv-Chl a per Prochlorococcus cell and BChl 1
a per AAP bacterial cell. 2
Station Depth
(m) Bchl a / Chl a
(%) DvChl a / cell
fg cell-1
Bchl a / cell fg cell
-1
HNL1 5 1.36 0.23 0.012
15 1.22 0.23
30 1.07 0.23
40 1.03 0.27
60 1.12 0.51 0.017
80 1.18 0.81 0.023
100 0.58 1.34 0.022
120 0.33 1.76 0.013
140 0.00 1.79
200 0.00 2.60
STB2 5 1.20 0.006
20 1.39
30 1.57 0.19 0.009
50 1.51 0.19
70 1.13 0.28
100 0.55 0.60 0.008
130 0.36 0.85 0.006
170 0.00 1.64
200 0.00 1.58
250 0.00 0.00
GYR 5 2.32 0.086
40 2.28
90 1.86 0.021
120 1.07 0.23
140 0.55 0.47 0.008
180 0.00 0.92
200 0.00 0.72
230 0.00 1.04
270 0.00 2.91
STB15 5 1.31 0.19 0.06
30 1.14 0.37
50 0.77 0.28 0.023
70 0.59 0.25
90 0.35 0.39 0.010
105 0.31 0.50 0.011
130 0.24 0.66 0.021
150 0.00 0.52
175 0.00 0.28
STB17 5 0.60 0.184
14 0.52
30 0.50 0.16
40 0.38 0.23 0.012
60 0.41 0.56
80 0.00 0.62
100 0.00 1.06
150 0.00 1.47
250 0.0

23
FIGURE LEGENDS 1
2
Figure 1. Sampled stations along the transect of the BIOSOPE cruise in the South Pacific 3
Ocean (October - December 2004). 4
5
Figure 2. Abundances of AAP bacteria, Prochlorococcus, total heterotrophic bacteria (a) and 6
concentrations of BChl a, Dv-Chl a and TChl a (b) at stations HNL1 and STB2. For clarity, 7
concentrations of BChl a are magnified by a factor of 30. 8
9
Figure 3. Abundances of AAP bacteria, Prochlorococcus, total heterotrophic bacteria (a) and 10
concentrations of BChl a (×30), Dv-Chl a and TChl a (b) measured at stations GYR, STB15 11
and STB17. 12
13
Figure 4. Cell biovolumes of AAP bacteria and DAPI-stained cells (all stations are pooled). 14
Each point represents the mean value (±SD) of biovolume determinations on each counted 15
cell (a). Ratio of the biovolume of AAP cells to DAPI-stained cells (all stations are pooled) 16
(b). 17
18
Figure 5. Integrated (euphotic zone) Chlorophyll a (IChl a) (a), bacteriochlorophyll a (BChl 19
a) (b) and AAP bacterial biomass (c) along the sampling transect. AAP bacterial cells were 20
converted to C-units using a conversion factor of 12.4 fg cell-1 (Fukuda et al. 1998). 21

HNL1
STB2
GYR
STB15
STB17
Figure 1

BChl a (x30)
Dv-Chl a
TChl aTotal heterotrophic bacteria
Prochlorococcus
AAP bacteria
(b) Pigment concentration (µg liter-1)(a) Cell abundance (×105 ml-1)
Depth (m)
STB2
HNL1
Depth (m)
0 2 4 6 8 10
300
250
200
150
100
50
0
300
250
200
150
100
50
0
0 2 4 6 8 10
0 0.05 0.10 0.15 0.20 0.25 0.30
300
250
200
150
100
50
0
0 0.05 0.10 0.15 0.20 0.25 0.30
300
250
200
150
100
50
0
Figure 2

BChl a (x30)
Dv-Chl a
TChl a
Depth (m)
GYR
STB15
STB17
0 0.05 0.10 0.15 0.20 0.25 0.30
0 0.05 0.10 0.15 0.20 0.25 0.30
0 0.05 0.10 0.15 0.20 0.25 0.30
Total heterotrophic bacteria
Prochlorococcus
AAP bacteria
0 2 4 6 8 10 12 14
0 2 4 6 8 10 12 14
300
250
200
150
100
50
0
300
250
200
150
100
50
0
300
250
200
150
100
50
0
300
250
200
150
100
50
0
0 2 4 6 8 10 12 14
300
250
200
150
100
50
0
300
250
200
150
100
50
0
(b) Pigment concentration (µg liter-1)(a) Cell abundance (×105 ml-1)
Depth (m)
Depth (m)
Figure 3

0 2 4 6 8 10
300
250
200
150
100
50
0
1
Depth (m)
Depth (m)
0 0.2 0.4 0.6 0.8 1.0
300
250
200
150
100
50
0
DAPI stained cells
AAP bacteria
Cell biovolumes (µm3)
AAP bacteria / DAPI stained cell biovolumes
(a)
(b)
Figure 4

0
2
4
6
8
10
12
14
16
18
20
HNL1 STB2 GYR STB15 STB17
0
0.04
0.08
0.12
0.16
0.2
HNL1 STB2 GYR STB15 STB17
IChl a (mg m-2)
IBChl a (mg m-2)
AAP bacterial biomass(mmol C m-2)
(a)
(b)
(c)
0
0
2
4
6
8
10
12
14
16
18
20
HNL1 STB2 GYR STB15 STB17
Figure 5