Embed Size (px)
Citation preview

Heterogeneity of collaboration and its relationshipwith research impact in a biomedical field
Marıa Bordons • Javier Aparicio • Rodrigo Costas
Received: 21 September 2012 / Published online: 7 November 2012� Akademiai Kiado, Budapest, Hungary 2012
Abstract This paper analyses existing trends in the collaborative structure of the Phar-
macology and Pharmacy field in Spain and explores its relationship with research impact.
The evolution in terms of size of the research community, the typology of collaborative
links (national, international) and the scope of the collaboration (size of links, type of
partners) are studied by means of different measures based on co-authorship. Growing
heterogeneity of collaboration and impact of research are observed over the years. Average
journal impact (MNJS) and citation score (MNCS) normalised to world average tend to
grow with the number of authors, the number of institutions and collaboration type. Both
national and international collaboration show MNJS values above the country’s average,
but only internationally co-authored publications attain citation rates above the world’s
average. This holds at country and institutional sector levels, although not all institutional
sectors obtain the same benefit from collaboration. Multilateral collaboration with high-
level R&D countries yields the highest values of research impact, although the impact of
collaboration with low-level R&D countries has been optimised over the years. Although
scientific collaboration is frequently based on individual initiative, policy actions are
required to promote the more heterogeneous types of collaboration.
Keywords Scientific collaboration � Research impact �Bilateral and multilateral collaboration � Spain � Biomedicine � Co-authorship
M. Bordons (&) � J. AparicioInstituto de Estudios Documentales en Ciencia y Tecnologıa (IEDCYT),Center for Human and Social Sciences (CCHS),Spanish National Research Council (CSIC), Albasanz 26-28, 28037 Madrid, Spaine-mail: [email protected]
J. Aparicioe-mail: [email protected]
R. CostasCentre for Science and Technology Studies, Leiden University,Wassenaarseweg 62a, Leiden 2300 AX, The Netherlandse-mail: [email protected]
123
Scientometrics (2013) 96:443–466DOI 10.1007/s11192-012-0890-7

Introduction
Science is increasingly becoming a collaborative endeavour. Collaboration allows scientists
to share knowledge, expertise and techniques, cope with interdisciplinary research topics,
and get involved in sophisticated research projects (Katz and Martin 1997). It is responsible
for the creation of a knowledge flow which interconnects scientists, institutions and
countries, contributes to determine the cognitive and social structure of scientific fields
(Corley et al. 2006), and has a great influence on the output of research (Sonnenwald 2007).
From a bibliometric standpoint, collaboration is usually analysed through co-authorship
in scientific publications. Many bibliometric studies have analysed the effect of collabo-
ration on the productivity and/or impact of publications at the micro level (scientists) (He
2009), the meso level (institutions, disciplines) (Abramo et al. 2009; Francescht and Co-
stantini 2010; Gazni and Didegah 2011) and the macro level (countries) (Narin et al. 1991;
Glanzel 2001). The idea that collaboration is linked to high scientific productivity of
scientists has been pointed out by some authors (Lee and Bozeman 2005), whilst the
positive influence of collaboration—especially international collaboration—on research
impact has been discussed by others (Glanzel 2001).
Collaboration shows a growing trend in intensity, range of aims and heterogeneity (Jha
and Welch 2010). The term ‘‘heterogeneous collaboration’’ is used in the literature to refer
to collaboration which concerns a variety of participants or purposes (Hackett 2005).
Partner diversity contributes to boost the benefits of collaboration since it brings about a
higher variety of points of view leading to higher creativity (Reagans and Zuckerman
2001) and innovation (Talke et al. 2011), and in the long term, to step up the advance of
knowledge. Collaboration amongst different institutions is supposed to involve a higher
degree of heterogeneity when compared to in-house collaboration and has been associated
with higher impact and quality of research (Francescht and Costantini 2010).
The study of collaboration practises and their relationship with research impact is a
matter of great concern for policy makers and scientists themselves. Under the assumption
that collaboration enhances the quality of scientific research and even improves its effi-
ciency and effectiveness (Adams et al. 2005; The Royal Society 2011) national and supra-
national policies have been implemented to foster collaboration. However, the study of
collaboration should be contextualised by country and by field since differences between
countries and fields have been described in collaborative practises as well as in their
tendency to gain from collaboration (Glanzel 2001; Glanzel and Lange 2002). This study is
focused on the Pharmacology and Pharmacy field in Spain which is a biomedical research
area of strategic interest in the country given the existence of a relatively high share of
scientific output by private companies.
Objectives
The main objective of this paper is to study the evolution over time of the collaborative
structure of the Pharmacology field in Spain and to explore its relationship with research
impact. This paper (a) analyses the evolution in terms of size of the research community,
the typology of collaborative links (national, international) and the scope of the collabo-
ration (size of links, type of partners) by means of measures based on co-authorship and
(b) explores the relationship between collaboration and research impact.1
1 A preliminary version of this paper has been presented to the Science and Technology Indicators Con-ference, Montreal, Canada, September 5–8, 2012 (Bordons et al. 2012a).
444 Scientometrics (2013) 96:443–466
123

The following questions are addressed: are there any changes in collaborative practises
over time? Does collaboration contribute to increase the productivity of scientists in the
field? Does the impact of research tend to increase with the heterogeneity of collaboration?
The study of heterogeneity in collaboration is addressed in this paper considering dif-
ferent related measures. Heterogeneity is assumed to increase as we move up the collab-
oration-type ladder (from no collaboration to national collaboration and to international
collaboration) and with the size of links (number of authors, number of institutions, number
of countries). The relationship between heterogeneity of collaboration and research impact
is then explored in this framework. The influence of type of partner (by institutional sector,
by R&D intensity of countries) on the impact of collaborative research is also analysed.
Methodology
The scientific output of Spanish authors in journals included in the Pharmacology and
Pharmacy subfield of the Web of Science database is analysed over two 3-year periods:
1998–2000 and 2006–2008. Only articles and reviews are studied. The analysis focuses on the
size of the research community, collaboration features and research impact. Social network
analysis is used to identify changes over time in the co-authorship networks in the field.
1. Size of the research community It is measured by the number of authors, institutions
and papers in the field. Author names are normalised and linked to their institutional
address according to an algorithm previously described in the literature (Costas and
Bordons 2007). Accordingly, two different measures are used: number of author
occurrences (authorships) and number of different authors. For example, ten author
occurrences may correspond to only two different authors with five publications each.
2. Collaboration Different aspects of collaboration are studied:
(a) Collaboration type. Publications are classified as belonging to one of the
following three groups of papers: non collaborative papers (a single institution),
national collaboration papers (at least two Spanish institutions), and international
collaboration papers (at least one foreign address). Publications including both
national and international collaboration are included in the international type.
(b) Collaboration scope, which refers to the size and the type of partners involved.
The scope of national links is studied using the following indicators:
• Size of links: it considers the number of partners included in the collaboration.
Heterogeneity is assumed to grow as the number of partners involved increases.
• Type of partner by institutional sector. The following institutional sectors are
considered: university (UNIV), health sector (HOSP), companies, the Spanish National
Research Council (CSIC),2 non-profit organizations (NPO) and public research centres
(including public administration) (PRC). We distinguish between single-sector and
cross-sector publications. Cross-sector links may be considered as an indication of a
higher degree of heterogeneity in the collaboration since institutional differences in
missions, organisation and operation may exist.
2 Although the CSIC belongs to the sector of public research centres, it has been considered separatelyunder the assumption that collaboration between different CSIC centres involves less diversity than thatbetween CSIC’s and other public research centres.
.
Scientometrics (2013) 96:443–466 445
123

The scope of international links is analysed using the following indicators:
• Size of links: collaboration between two (bilateral) or more countries (multilateral) is
studied. Higher heterogeneity is assumed for multilateral collaboration.
• Type of partner by R&D intensity: countries are classified in two classes according to
their level of commitment with research and development activities as measured by
their gross domestic expenditures in R&D as a percentage of their gross domestic
product (%GERD/GDP) (source: World Bank 2012). Those with a %GERD/GDP equal
to or higher than the Spanish value are considered as high-level RD countries, whilst
the remaining countries are deemed low-level RD countries. Data on R&D expenditure
by country refer to 1999. The same reference was used throughout the period to make
inter-period comparisons possible. If both a low and a high-level RD country are
included in a given publication, then it is deemed to belong in the high-level RD class.
(c) Co-authorship networks. The structural network properties were analysed through the
study of links between authors by means of PAJEK software (http://pajek.imfm.si/),
which allows us to study the evolution of cohesiveness in networks over time.
3. Research impact. For the study of research impact, two citation-based indicators
normalised to the average world value are used following the methodology described
by the CWTS in Leiden (Waltman et al. 2011). The use of citations as an indicator of
research impact in the scientific community is widespread in the literature, although
we should stay aware of its advantages and limitations (Moed 2005).
The field-normalised average journal impact (MNJS) is the mean citation rate of the
journals in which Spanish scientists have published compared with the mean citation score
of all papers published in the field. If MNJS is above 1, scientists are publishing in journals
with a relatively high impact (high international visibility). The mean normalised citation
score (MNCS) compares the average number of citations to the oeuvre of Spanish scientists
with the field mean citation scores. Self-citations are excluded from these calculations.
These indicators are calculated for two periods: 1998–2000 and 2006–2008. Citations with
a 3-year citation window are used in the analysis. Accordingly, citations received in 1998,
1999 and 2000 are considered for papers published in 1998.
The number of references is included as a proxy for the comprehensiveness of the
research (McVeigh and Mann 2009; Gonzalez-Albo and Bordons 2011; Costas et al. 2012)
which contributes to the quality of publications and may attract a higher number of cita-
tions (Haslam et al. 2008).
For the study of the applied/basic orientation of research we use the research level of
publications, based on a classification of journals in four categories ranging from most-
applied journals (level 1) to the most-basic journals (level 4). This was initially described
by CHI (Noma 1986) and later updated by ipIQ.
Differences in impact by collaborative type are analysed by means of statistical tests for
non-parametric variables (Kruskal–Wallis and Mann-Whitney tests). The influence of
network size and type of collaboration on the impact of research is studied through mul-
tiple regression analysis for categorical variables (SPSS, version 19).
Results
The scientific output of Spanish authors in Pharmacology and Pharmacy journals totalled
1,971 publications for 1998–2000 and 2,858 for 2006–2008. These publications were
446 Scientometrics (2013) 96:443–466
123

studied to analyse changes in the number, diversity and scope of collaborative links and
explore the relationship between collaboration and different aspects of research perfor-
mance (productivity, impact).
Trends in collaboration type and scope
During the period under analysis the size of the scientific community has increased as
measured both by the number of authors (increase of 63 %) and by the number of active
Table 1 Trends in scientific output, research community size and collaboration features in the field
1998–2000 2006–2008 Growth (%)
(a) Scientific output
No. publications (total count) 1,971 2,858 45
No. publications (fractional count) 1,689.59 2,334.95 38
(b) Research community
Individuals
No. author occurrences (authorships) 9,867 16,125 63
No. different authors (AUCENa) 5,896 10,099 71
Institutions
No. total institutions (occurrences) 4,168 7,898 89
No. Spanish institutions 3,116 (75 %) 5,491 (70 %) 76
No. foreign institutions 1,052 (25 %) 2,407 (30 %) 128
Teams
Authors/pub. (average) 5.01 5.64 13
Institutions/pub. (average) 2.11 2.76 31
(c) Collaboration pattern (institutions)
No. non-collab. Pub. (intramural) 847 (43 %) 919 (32 %) 9
No. national collab. Pub. 621 (31 %) 1,027 (36 %) 65
No. international collab. Pub. 503 (25 %) 912 (32 %) 81
(d) National collaboration scopeb
No. pub. by number of partners
Two partners 408 (56 %) 531 (40 %) 23
More than two partners 319 (44 %) 807 (60 %) 134
No. pub. by sectors involved
Single-sector national collab. 338 (46 %) 516 (39 %) 53
Cross-sector national collab. 389 (54 %) 822 (61 %) 111
(e) International collaboration scope
No. pub. by number of partners
Bilateral international collab. 392 (78 %) 622 (68 %) 59
Multilateral international collab. 111 (22 %) 290 (32 %) 161
No. pub. by RD intensity of partnersc
%R&D/GDP \ Spain 87 (17 %) 166 (18 %) 91
%R&D/GDP C Spain 413 (83 %) 734 (82 %) 78
a Unique authors are identified and linked to their institutional address (AUCEN file)b Papers which present national and international collaboration simultaneously are included herec %GERD/GDP not available for a few countries (ten publications excluded from related analyses)
Scientometrics (2013) 96:443–466 447
123

institutions (increase of 89 %), both growing faster than the number of publications (45 %)
(Table 1a, b). Research becomes more collaborative, as shown by the increase in the
average number of authors per publication, which points to larger research teams, as well
as to the upward trend in the number of institutions per publication, an indication of
growing extra-mural and institutional collaboration.
During the whole study period, the average number of authors per publication has
increased from 5 to almost 6 (Table 1b). The greatest changes have been identified in
publications with 4–5 authors, which altogether, include almost 40 % of the total pro-
duction in the first period and account for less than 30 % in the second one, in which the
percentage of publications with more than 6 authors shows un upward trend, especially for
publications with 10 authors or more, up from 5 to 10 %. For the first 3-year period
(Fig. 1a), the most frequent number of authors per publication is 4, whilst 6 authors is the
a b
c
Fig. 1 Changes over time in a the distribution of publications by number of authors per publication; b thedistribution of publications by number of institutions per publication; c number of authors by number ofinstitutions
448 Scientometrics (2013) 96:443–466
123

predominating figure for the second period. Concerning institutions, the share of publi-
cations with 1 institution falls from 43 to 32 %, whilst the percentage of publications with
4 institutions or more is up from 11 % in the first period to 25 % in the second one
(Fig. 1b).
Interestingly, the average number of authors per publication remains stable over time if
we control for the number of institutions (Fig. 1c). This suggests that the intra-mural size
of teams does not change over time whilst the rise observed in the number of authors per
publication is mainly due to an increase in the number of institutions participating in
publications.
The number of internationally co-authored publications grows faster than that of
nationally co-authored papers (65 vs. 81 %, Table 1c). Moreover, the scope of both
national and international collaboration also widens over the period. A rise in hetero-
geneity is observed for national collaboration, since multi-institutional and cross-sector
collaboration increase above average (134 and 111 %, respectively; vs. 45 % for the total
field, Table 1d).3 With respect to international collaboration, it was present in 25 % of
the publications in the first period but rises to 32 % in the second. Moreover, interna-
tional collaboration amongst three or more partners (multilateral) grows faster than that
between two partners (bilateral), which actually shows a decline in percentage (from
78 % in the first period to 68 % in the second period) (Table 1e). Finally, it is interesting
to note that collaboration with high-level RD countries remains quite stable over the
years (around 82 % of internationally co-authored papers) although it includes a growing
share of papers written in collaboration between low and high-level RD countries (from
5 to 12 %) (Table 1e). Overall, these findings suggest that collaborative research has
been conducted in larger and more heterogeneous networks in our second reference
period.
Table 2 Main features of the Pharmacology and Pharmacy network in two 3-year periods
Pharmacology (total authors) 1998–2000 2006–2008
No. publications 1,971 2,858
No. authors (nodes) 5,896 10,099
No. edges (links) 21,292 44,706
No. connected nodes 5,843 (99.10 %) 10,038 (99.40 %)
Density 0.0012252 0.0008768
No. connected components 518 696
No. authors in the main component (%) 2,002 (33.96 %) 5,400 (53.47 %)
Average degree centrality 7.22 8.85
SD degree (standard deviation) 5.63 7.39
Average distance 11.36 8.71
Diameter (longest distance) 28 24
Clustering coefficient (average) 0.88 0.88
Size k-core 27 34
3 Special mention should be made of the rise in the share of co-authored papers between university andhospitals, which increases from 13 to 23 % of university papers over time.
Scientometrics (2013) 96:443–466 449
123

Co-authorship network analysis
The main features of the network of authors in the field are shown in Table 2. During the
period under analysis 99 % of all authors were connected to at least another author in each
of the study periods and the size of the network expanded from 5,843 to 10,038 connected
authors. Interestingly, a rise in network connections over time can be observed by means of
different measures which are explained below.
Density, which represents the percentage of all possible connections amongst individ-
uals, shrank slightly over the years, but this measure is not useful to analyse the evolution
of network cohesiveness because it depends on the size of the network (density tends to
diminish in larger networks because the number of possible links grows with the number of
vertices). The average degree is a better measure of overall cohesion, because it does not
depend on network size. The average degree centrality increases from 7.2 to 8.9. It
measures the total number of authors with which a scientist wrote publications. It reflects
the average compactness of the network of authors. The SD informs us about the variability
of this measure, which is higher in the second period.
The longest distance amongst members in the network shows us the diameter of the
network which falls from 28 to 24. Likewise, the average distance amongst authors falls
from 11.4 to 8.7. This means that, in rough figures, any researcher is connected to any other
researcher in the network through eight other intermediate researchers in the second period.
A decline has been observed from one period to another suggesting that the network is
becoming more densely connected.
With regard to the degree of integration we can analyse the components, which are
groups of actors that are connected within their group but disconnected with other groups.
We observe that the number of components rises from 518 to 696, and the main component
connects 34 % of the authors in the first period vs. 53 % in the second one, reflecting a
more cohesive network in the most recent period.
The k-core is a maximal sub-network in which each vertex has at least a k degree within
the sub-network. We can see that the core of the network increases from 27 in the first
period to 34 in the second, which again suggests a more interconnected network in the
second period under study.
The tendency of authors to form local clusters with other colleagues is measured
through the clustering coefficient, which ranges from 0 to 1. This indicator remains stable
for the two periods (0.8).
Research performance
(a) Does collaboration contribute to increase the productivity of scientists?
The number of publications shows a rate of increase below the one observed for the
number of authorships (45 vs. 63 %) (Table 1a, b), and the average productivity of sci-
entists (defined as the number of authorships per unique researcher) falls from 1.67 to 1.60
articles per author. Therefore, the growth in production observed in the field is not due to
an increase in the productivity of scientists, but to an important surge in the number of
active scientists. The general distribution of authors by productivity level is quite similar
for both periods. Around 70 % of authors appear only once during each period, whilst only
1 % has published 10 or more publications. A striking finding is the higher range of
productivity values observed for the top 5 % of authors with the highest productivity in the
450 Scientometrics (2013) 96:443–466
123

second period (1–65 vs. 1–22 in the first period), which suggest a productivity boost for the
elite of most productive authors.
(b) Does collaboration contribute to increase the impact of research?
The scientific papers of Spanish authors in Pharmacology and Pharmacy tends to be
published in ‘‘better’’ journals (9 % increase in MNJS) and to receive a higher number of
citations (13 % increase in MNCS) in the second period. However, both MNJS and MNCS
values remain slightly below world average (Table 3). The rising trend in the average
number of references per publication is consistent with the publication in higher impact
factor journals, since a higher referencing density (average number of references per
publication) has been described in this respect (Costas et al. 2012). Interestingly, the second
period shows a bias in favour of clinical research when compared to the first period. The
percentage of publications published in basic journals (levels 3 and 4) falls from 79 to 68 %.
The influence of the number of authors, the number of institutions and the type of
collaboration on the impact of publications is analysed. Figure 2 shows that single-
authored publications obtain the lowest impact figures since these papers are published in
journals with the lowest MNJS values and receive the lowest number of citations (lower
MNCS). As the number of authors goes up, MNJS values also tend to do so and the highest
values correspond to papers with at least eight authors. The same trend is observed with
respect to citations, but publications with at least 8 authors present a higher increase in the
rate of citations (almost 25 % above average). In addition, Fig. 3 reveals an upward trend
in impact as the number of involved institutions grows. Comparing the two periods,
publications tend to present higher impact values in the second period irrespective of the
number of authors (Fig. 2) or institutions (Fig. 3). It is interesting to note that this pattern
of impact growth in step with the number of authors and institutions is also observed when
nationally and internationally co-authored papers are analysed separately (Appendix).
Publications where two or more institutions are involved are published in journals with
higher MNJS values than those produced by a single institution, whilst international col-
laboration provides an extra drive compared to national collaboration, although differences
are statistically significant only in the second period. As for the analysis of citations, the
lowest MNCS values also correspond to publications produced by a single institution,
whilst publications in international collaboration show higher MNCS values than those
with only national partners (Table 4). The higher impact of internationally co-authored
publications is strongly determined by multilateral collaboration, since this type of col-
laboration obtains higher MNCS and MNJS values than bilateral collaboration for both
Table 3 Trends in research performance
1998–2000 Av (SD) 2006–2008 Av (SD)
No. citations/publication 3.75 (5.55) 6.15 (8.22)
No. citations/publication (sc) 2.59 (4.60) 4.68 (6.97)
MNJS 0.88 (0.61) 0.96 (0.59)
MNCS 0.80 (1.29) 0.91 (1.21)
No. references/publication 31.75 (28.54) 48.31 (45.25)
Level 2.90 (0.67) 2.74 (0.72)
Average data (SD)
Significant differences between first and second period for all variables (p \ 0.001)
sc self-citations removed
Scientometrics (2013) 96:443–466 451
123
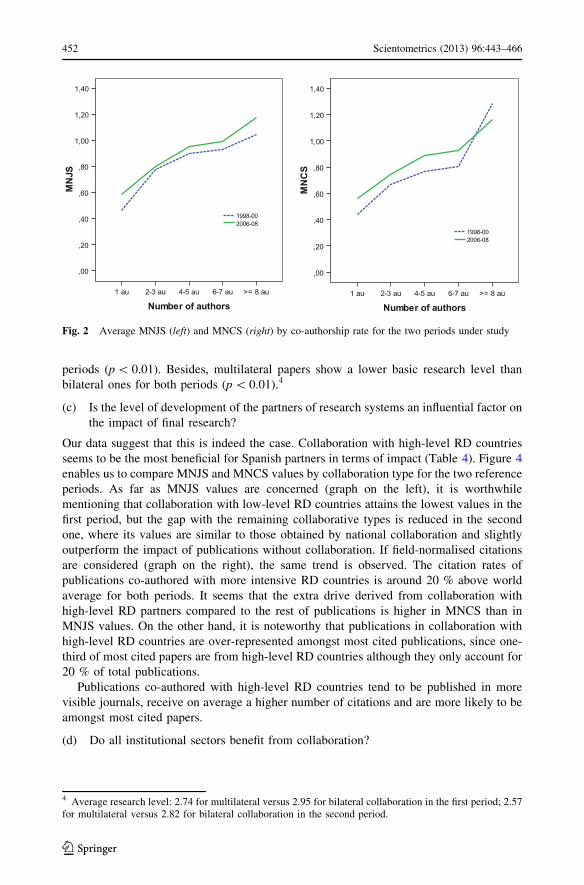
periods (p \ 0.01). Besides, multilateral papers show a lower basic research level than
bilateral ones for both periods (p \ 0.01).4
(c) Is the level of development of the partners of research systems an influential factor on
the impact of final research?
Our data suggest that this is indeed the case. Collaboration with high-level RD countries
seems to be the most beneficial for Spanish partners in terms of impact (Table 4). Figure 4
enables us to compare MNJS and MNCS values by collaboration type for the two reference
periods. As far as MNJS values are concerned (graph on the left), it is worthwhile
mentioning that collaboration with low-level RD countries attains the lowest values in the
first period, but the gap with the remaining collaborative types is reduced in the second
one, where its values are similar to those obtained by national collaboration and slightly
outperform the impact of publications without collaboration. If field-normalised citations
are considered (graph on the right), the same trend is observed. The citation rates of
publications co-authored with more intensive RD countries is around 20 % above world
average for both periods. It seems that the extra drive derived from collaboration with
high-level RD partners compared to the rest of publications is higher in MNCS than in
MNJS values. On the other hand, it is noteworthy that publications in collaboration with
high-level RD countries are over-represented amongst most cited publications, since one-
third of most cited papers are from high-level RD countries although they only account for
20 % of total publications.
Publications co-authored with high-level RD countries tend to be published in more
visible journals, receive on average a higher number of citations and are more likely to be
amongst most cited papers.
(d) Do all institutional sectors benefit from collaboration?
Fig. 2 Average MNJS (left) and MNCS (right) by co-authorship rate for the two periods under study
4 Average research level: 2.74 for multilateral versus 2.95 for bilateral collaboration in the first period; 2.57for multilateral versus 2.82 for bilateral collaboration in the second period.
452 Scientometrics (2013) 96:443–466
123

The analysis by institutional sector shows that the impact of research tends to grow as the
heterogeneity of collaboration rises (from single-institution publications to nationally co-
authored ones and from national to international collaboration) for most sectors. Data for
the 2006–2008 period shown in Fig. 5 reveal that almost all sectors tend to present MNJS
and MNCS values above 1 for internationally co-authored publications. National
collaboration leads to MNJS values above world average in a few sectors, but only
international collaboration is associated with MNCS value above world average.
Which sector benefits most from international collaboration? Focusing on the
2006–2008 period, internationally co-authored publications of companies get impact val-
ues at least 30 % higher than average company publications (both MNJS and MNCS
Fig. 3 Average MNJS (left) and MNCS (right) by number of institutions for the two periods under study
Table 4 Descriptive statistics for MNJS and MNCS by collaborative types and by period
MNJS MNCS
1998–2000Av (SD)
2006–2008Av (SD)
Increase 1998–2000Av (SD)
2006–2008Av (SD)
Increase
1. No collab. 0.80 (0.57) 0.79 (0.54) 0.99 0.65 (1.05) 0.74 (1.04) 1.14
2. National collab. 0.94 (0.62) 0.99 (0.49) 1.05 0.79 (1.27) 0.87 (1.00) 1.10
3. International collab. 0.95 (0.65) 1.10 (0.70) 1.16 1.07 (1.59) 1.12 (1.51) 1.05
3.1. Low RD countries 0.64 (0.47) 0.93 (0.49) 1.50 0.48 (0.62) 0.85 (0.84) 1.83
3.2. High RD countries 1.01 (0.66) 1.14 (0.73) 1.05 1.20 (1.70) 1.19 (1.62) 1.03
Total 0.88 (0.61) 0.96 (0.59) 1.09 0.80 (1.29) 0.91 (1.21) 1.13
3-collaborative types (1, 2, 3): significant differences in MNJS and MNCS by collaborative types(p \ 0.001). Significant differences between all collaborative types except for MNJS of national versusinternational publications in the first period
4-collaborative types (1, 2, 3.1, 3.2): significant differences in MNJS and MNCS by collaborative types.MNJS: significant differences between all collaborative types, except national versus international coll. withhigh-level RD countries (in first period). MNCS: significant differences between all collaborative types,except national versus international coll. with low-level RD countries (both periods)
Scientometrics (2013) 96:443–466 453
123

values); and the same applies to hospital publications (in this case only MNCS values)
(Fig. 5).
Considering the set of nationally co-authored publications, those involving partners
from different institutional sectors show higher MNJS (p \ 0.001) and MNCS values
(p \ 0.05) than those with partners from the same sector. This is observed for the first
period, whilst no differences appear for the second. Since cross-sector collaboration also
involves, on average, a higher number of institutions, the analysis is also conducted
controlling for the last variable. In this case, the differences are reduced to publications
written by two institutions in the first period, where higher impact (MNJS and MNCS) is
observed for cross-sector partnership (p \ 0.01).
(e) Influence of network size and type of collaboration on the impact of publications.
Categorical regression analysis is used to explore the influence of different variables on the
impact of research. This method is preferred to the conventional regression analysis
because of the skewed distribution of the variables and the fact that we have some nominal
variables (collaboration type). Categorical regression may introduce numerical, nominal
and ordinal variables which are effectively transformed into interval variables (using
SPSS). Multiple regression analysis is applied to the transformed variables. The number of
institutions was removed from the analysis due to collinearity problems.
MNJS and MNCS are the dependent variables in two different analyses (Tables 5,6, 7,
8). For each variable, two different models are developed and applied to both reference
periods. Independent variables include the number of authors, the type of collaboration
(four categories, international collaboration is disaggregated by partner RD intensity), and
the number of references.
Analysis I: MNJS as the dependent variable (Table 5, 6). For the two periods the three
variables mentioned above are significant and show a positive influence over MNJS
(positive beta coefficients). In the first period, the most influential variable is the number of
references (highest beta value), followed by the number of authors and the type of col-
laboration. As observed in Table 6, the system quantifies the ‘‘collaboration type’’ cate-
gorical variable into a numerical one, which shows a rising trend from ‘‘International
collaboration with low-level RD countries’’ (lowest value), through ‘‘No collaboration’’
Fig. 4 Average MNJS (left) and MNCS (right) by four collaboration types for the two reference periods
454 Scientometrics (2013) 96:443–466
123

and ‘‘National collaboration’’, to ‘‘International collaboration with higher-level RD
countries’’ (highest value). It is interesting to point out that ‘‘No collaboration’’ and
‘‘National collaboration’’ return very similar values, whilst ‘‘Int. Col. with low-level RD
countries’’ is well below such values and ‘‘Int. Col. with high RD countries’’ largely
exceeds them. Accordingly, the lowest MNJS corresponds to collaboration with low-level
RD partners, whilst the highest is found for high-level RD investing partners. With regard
to the second period, the number of authors is the most influential variable. Here the type of
collaboration is transformed into a numerical variable showing a rising trend from ‘‘No
collaboration’’ (lowest value) to ‘‘International collaboration with high-level RD coun-
tries’’ (highest value) (Table 6). A striking finding is that low-level RD countries are not
associated with lowest MNJS values any longer.
Analysis II: MNCS as the dependent variable (Tables 7, 8). The most influential vari-
able is MNJS, which means that publications in high impact factor journals are more likely
to receive high citation rates. The number of references per publication is the second most
influential variable for both periods. The type of collaboration is more influential than the
number of authors for the first period, whilst both variables show very similar beta coef-
ficients for the second period.
MNJS, 2006-2008
0.00
0.20
0.40
0.60
0.80
1.00
1.20
1.40
1.60
1.80
UNIV HOSP COMPANIES NPO CSIC PRC TOTAL
No coll. Nat.Coll. Int.Coll. Total
MNCS, 2006-2008
.00
.20
.40
.60
.80
1.00
1.20
1.40
1.60
1.80
UNIV HOSP COMPANIES NPO CSIC PRC TOTAL
No coll. Nat.Coll. Int.Coll. Total
Fig. 5 MNJS and MNCS by institutional sector and collaboration type (2006–2008). The number ofpublications by institutional sector is as follows: University = 1,567; Hospitals = 1,060; Compa-nies = 413; Non-profit organizations (NPO) = 340; CSIC = 296; Public research centres (PRC) = 133articles
Scientometrics (2013) 96:443–466 455
123

Both analyses indicate that there is a positive correlation between impact and some
indicators of collaboration such as the number of authors and the type of collaboration. The
number of authors is more influential than the collaboration type for explaining MNJS,
whilst the opposite trend is observed for MNCS. In spite of the existing correlation, we
cannot draw inferences about causality due to the low values of R2.
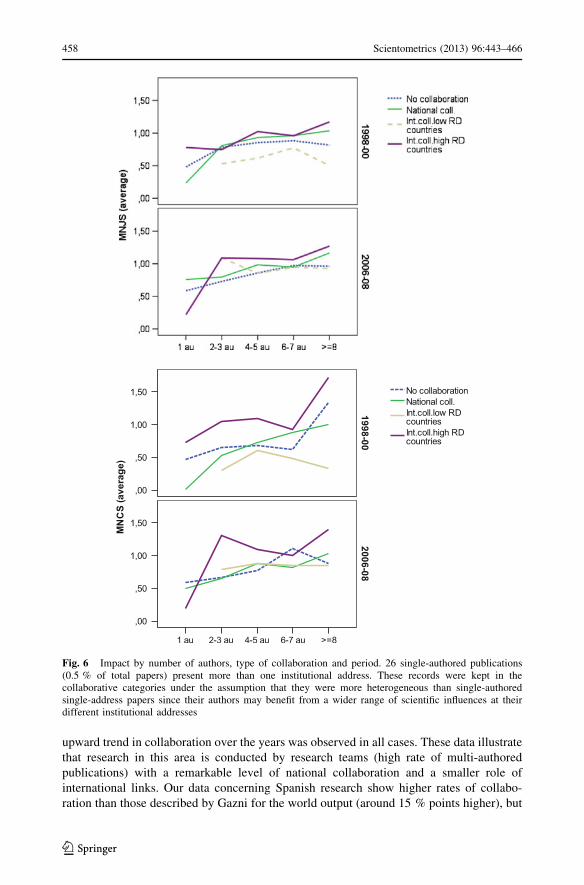
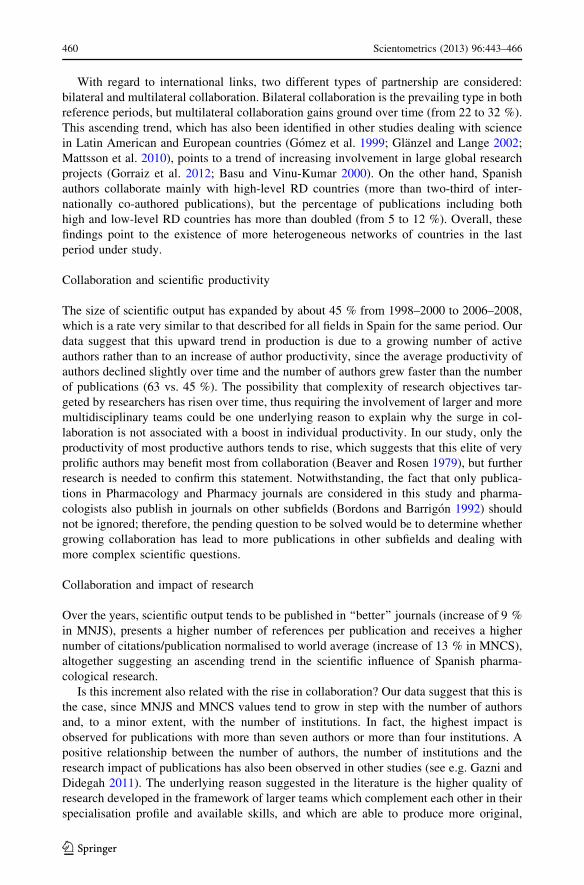
Figure 6 shows the MNJS and MNCS variables by collaboration type and number of
authors for the two periods. The greatest impact corresponds to collaboration with high-
level RD countries in all four graphs. In general terms, we can see a slightly upward trend
of impact as the number of authors grows, especially for publications written by a single
institution or by several domestic ones. Attention should be paid to the fact that the greatest
impact (either for MNJS or MNCS) is obtained for publications with eight or more authors.
In fact, for publications with a single institution or several domestic ones, impact above
world average is only obtained if the number of authors is eight or more. Internationally
co-authored publications tend to show the highest impact values in all cases, but this
impact is similar to that of the other collaborative types in terms of MNJS whilst it is well
above that in the case of MNCS. This is consistent with the stronger influence of the
Table 5 Categorical regression analysis to explain MNJS
MNJS Standardised coefficients F Sig.
Beta Bootstrap (1,000) estimate of std. error
1998–2000
No. references 0.277 0.024 132.137 0.000
No. authors 0.164 0.028 35.250 0.000
Coll_type 0.101 0.027 13.535 0.000
Corrected R2 = 0.132
2006–2008
No. references 0.136 0.023 35.044 0.000
No. authors 0.235 0.022 114.048 0.000
Coll_type 0.143 0.021 47.081 0.000
Corrected R2 = 0.114
Table 6 Transformation of the ‘‘collaboration type’’ variable (coll_type) in the categorical regressionanalysis shown in Table 5
Category Frequency Quantification
1998–2000
Int. collab. high RD countries 413 1.352
National collaboration 620 0.071
No collaboration 842 -0.348
Int. collab. low RD countries 87 -3.559
2006–2008
Int. collab. high RD countries 732 1.192
National collaboration 1,025 0.350
Int. collab. low RD countries 166 -0.014
No collaboration 908 -1.354
456 Scientometrics (2013) 96:443–466
123

collaborative type on MNCS values compared to MNJS values shown in the categorical
regression analysis.
Discussion
Our data show the growing role of collaboration in the Pharmacology and Pharmacy field
in Spain as evidenced by the upward trend in the number of authors, institutions and
countries per paper. This is consistent with the trends described for world science in
general (Gazni et al. 2012) and for Spanish science in particular (Gomez et al. 2010). In
Gazni’s study on world scientific publications in WoS during 2000–2009, Pharmacology
and Toxicology is ranked 6th out of 22 areas according to the multi-authored publication
rate, 12th by its multi-institutional rate and 19th by its international publication rate. An
Table 7 Categorical regression analysis to explain MNCS
MNCS Standardised coefficients F Sig.
Beta Bootstrap (1,000) estimate of std. error
1998–2000
No. references 0.112 0.021 28.708 0.000
No. authors 0.082 0.033 5.994 0.003
Coll_type 0.101 0.022 21.532 0.000
MNJS 0.447 0.021 440.734 0.000
Corrected R2 = 0.261
2006–2008
No. references 0.106 0.016 42.097 0.000
No. authors 0.045 0.021 4.641 0.003
Coll_type 0.051 0.028 3.247 0.011
MNJS 0.422 0.016 676.396 0.000
Corrected R2 = 0.204
Table 8 Transformation of the ‘‘collaboration type’’ variable (coll_type) in the categorical regressionanalysis shown in Table 7
Category Frequency Quantification
1998–2000
Int. collab. high RD countries 413 1.899
No collaboration 842 -0.305
Int. collab. low RD countries 87 -0.718
National collaboration 620 -0.750
2006–2008
Int. collab. high RD countries 732 1.366
Int. collab. low RD countries 166 1.336
No collaboration 908 -0.150
National collaboration 1,025 -1.059
Scientometrics (2013) 96:443–466 457
123
upward trend in collaboration over the years was observed in all cases. These data illustrate
that research in this area is conducted by research teams (high rate of multi-authored
publications) with a remarkable level of national collaboration and a smaller role of
international links. Our data concerning Spanish research show higher rates of collabo-
ration than those described by Gazni for the world output (around 15 % points higher), but
Fig. 6 Impact by number of authors, type of collaboration and period. 26 single-authored publications(0.5 % of total papers) present more than one institutional address. These records were kept in thecollaborative categories under the assumption that they were more heterogeneous than single-authoredsingle-address papers since their authors may benefit from a wider range of scientific influences at theirdifferent institutional addresses
458 Scientometrics (2013) 96:443–466
123

it is well established that inter-country differences do exist due to different factors such as
country size, rate of scientific development, and political or economic reasons (Glanzel and
Schubert 2004). The growth rate of collaborative papers in the Pharmacology and Phar-
macy field in Spain is similar to the growth rate described for Biomedicine in the country
(an increase of 71 vs. 74 % in collaborative publications, respectively), but below the
overall country average (an increase of 91 %) since the highest increase has been described
for traditionally low collaborative fields within the Social Sciences and Humanities (an
increase of around 200 %) (Bordons et al. 2012b).
The description of co-authorship links by means of a social network analysis provides
us with interesting information to analyse changes in the collaborative structure of this
field. Specifically, a larger (longer diameter) and more integrated and cohesive network of
authors (higher average degree centrality, shorter average distance amongst authors and
higher share of authors in the main component) is observed for our second period of
reference. In this paper, the share of authors in the main component is lower than in other
studies (see e.g. Newman 2001, where the discipline with the smallest main component
contained 57 % of authors), but it is probably due to our journal-based delimitation of the
field. In any case, the important issue is the growing rate observed for this indicator over
the years (from 34 to 53 %) suggesting a fairly general increase of collaboration in the
field. Overall, the growing interconnection amongst authors might enhance the transmis-
sion of knowledge in the scientific community as well as contribute to carry out research
more effectively.
Heterogeneity of collaboration
Collaboration practises evolve towards greater heterogeneity. On the one hand, as the
number of contributing authors and institutions grows, so does the likelihood of finding
more diverse partners in research activities. On the other hand, not only collaboration
involves a greater number of institutions in recent years, but also there is a rise in col-
laboration across institutional sectors and countries which grows faster than collaboration
within a given sector or within the same country and constitutes a potential source of
diversity.
The upward trend in the number of authors per publication points to a larger size of
research teams. However, if we control for the number of institutions, very small differ-
ences in the number of authors per publication are found between the first and the second
period under analysis. This means that the rise in extra-mural collaboration is the main
cause responsible for the upward trend in the number of authors per publication.
Researchers tend to be ever more open to establish links with other teams both from their
own country and from abroad, thus probably facilitating access to infrastructures and
complementary knowledge to an extent that would not be reached by merely expanding the
size of in-house.
Our study reveals an important surge in cross-sector publications and, in particular, joint
hospital–university publications. This is especially relevant since, in as far as biomedicine
is concerned, it is deemed to be an indicator of the development of translational research,
i.e. to translate basic research into medical practise, bridging the gap between basic and
clinical research. A bi-directional flow is supposed to exist between basic research settings
and clinical ones and such flow may lead to mutual learning, creation of new knowledge
and transfer of this knowledge into practise (Lander and Atkinson-Grosjean 2011). These
cross-sectoral links may prove crucial in pharmacological research for the development
and trial of new drugs and their introduction in the market.
Scientometrics (2013) 96:443–466 459
123
With regard to international links, two different types of partnership are considered:
bilateral and multilateral collaboration. Bilateral collaboration is the prevailing type in both
reference periods, but multilateral collaboration gains ground over time (from 22 to 32 %).
This ascending trend, which has also been identified in other studies dealing with science
in Latin American and European countries (Gomez et al. 1999; Glanzel and Lange 2002;
Mattsson et al. 2010), points to a trend of increasing involvement in large global research
projects (Gorraiz et al. 2012; Basu and Vinu-Kumar 2000). On the other hand, Spanish
authors collaborate mainly with high-level RD countries (more than two-third of inter-
nationally co-authored publications), but the percentage of publications including both
high and low-level RD countries has more than doubled (from 5 to 12 %). Overall, these
findings point to the existence of more heterogeneous networks of countries in the last
period under study.
Collaboration and scientific productivity
The size of scientific output has expanded by about 45 % from 1998–2000 to 2006–2008,
which is a rate very similar to that described for all fields in Spain for the same period. Our
data suggest that this upward trend in production is due to a growing number of active
authors rather than to an increase of author productivity, since the average productivity of
authors declined slightly over time and the number of authors grew faster than the number
of publications (63 vs. 45 %). The possibility that complexity of research objectives tar-
geted by researchers has risen over time, thus requiring the involvement of larger and more
multidisciplinary teams could be one underlying reason to explain why the surge in col-
laboration is not associated with a boost in individual productivity. In our study, only the
productivity of most productive authors tends to rise, which suggests that this elite of very
prolific authors may benefit most from collaboration (Beaver and Rosen 1979), but further
research is needed to confirm this statement. Notwithstanding, the fact that only publica-
tions in Pharmacology and Pharmacy journals are considered in this study and pharma-
cologists also publish in journals on other subfields (Bordons and Barrigon 1992) should
not be ignored; therefore, the pending question to be solved would be to determine whether
growing collaboration has lead to more publications in other subfields and dealing with
more complex scientific questions.
Collaboration and impact of research
Over the years, scientific output tends to be published in ‘‘better’’ journals (increase of 9 %
in MNJS), presents a higher number of references per publication and receives a higher
number of citations/publication normalised to world average (increase of 13 % in MNCS),
altogether suggesting an ascending trend in the scientific influence of Spanish pharma-
cological research.
Is this increment also related with the rise in collaboration? Our data suggest that this is
the case, since MNJS and MNCS values tend to grow in step with the number of authors
and, to a minor extent, with the number of institutions. In fact, the highest impact is
observed for publications with more than seven authors or more than four institutions. A
positive relationship between the number of authors, the number of institutions and the
research impact of publications has also been observed in other studies (see e.g. Gazni and
Didegah 2011). The underlying reason suggested in the literature is the higher quality of
research developed in the framework of larger teams which complement each other in their
specialisation profile and available skills, and which are able to produce more original,
460 Scientometrics (2013) 96:443–466
123
consistent and comprehensive research (Katz and Martin 1997). The fact that higher
citation rates may be due to a higher number of self-citations has also been suggested
(Glanzel and Thijs 2004). For the purposes of our study, the influence of self-citations is to
be discarded since they were removed from the calculation of citation rates. However, it is
true that, for publications with a higher number of authors and institutions, the dissemi-
nation of research through personal networks may contribute to favour the visibility of
papers and their likelihood to be cited (Goldfinch et al. 2003). However, the fact that multi-
authored publications not only tend to receive more citations but also to be published in
higher impact journals supports the positive influence of collaboration on final research.
If the type of collaboration is taken into account, we observe that publications in
national collaboration tend to be published in better journals and receive a higher number
of citations than those written by a single institution but lower than internationally co-
authored publications. Both national and international collaboration contribute to obtain
MNJS values above country average, but only internationally co-authored publications
attain citation rates above world average. This is consistent with the results of Thijs and
Glanzel (2010) concerning the scientific output of 15 EU countries in 2003, who observed
that extra-mural collaboration boosted citation rates and international collaboration added
to this effect, especially in the medical fields. Moreover, the higher impact of multilateral
papers compared to bilateral ones observed in our study is consistent with the findings of
Glanzel and Lange (2002) in a study on worldwide scientific output during 1995–1996
(SCI) where higher observed and expected citation rates were described for multinational
biomedical papers. Differences in the aims and organisational factors underlying both
types of collaboration may contribute to explain these results. Bilateral collaboration is
supposed to reflect national research portfolios and it is more likely to be based on indi-
vidual initiative (Gorraiz et al. 2012; Basu and Vinu-Kumar 2000), whilst multilateral
collaboration comprises research with a more global orientation and may be the result of
institutional or international initiatives. As far as pharmacological research in Spain is
concerned, bilateral collaboration shows a more basic research level and higher relative
involvement of academic scientists (university and CSIC), whilst multilateral collaboration
shows a more applied orientation and higher relative activity of hospitals and NPOs
(Bordons et al. 2012b). This category of publications probably includes clinical trials,
which frequently involve many institutions and countries in a given paper and tend to
receive more citations than conventional papers in Biomedicine (see e.g. Kostoff 2007;
Garcıa-Romero et al. 2009).
It seems that research impact tends to grow with the type of collaboration and the
number of authors, but which of these variables is more influential? Our study shows that
the number of authors is more influential than the type of collaboration on the MNJS
indicator, whilst a stronger influence of the type of collaboration is observed for MNCS.
This is partly explained by the high MNCS values of papers in collaboration with high-
level RD countries (20 % above world average with small differences by the number of
authors), a long way from the impact of the remaining collaborative categories, especially
for the first period. As a consequence, establishing links with foreign partners is a useful
collaborative strategy to increase the citation rate of publications. However, it is interesting
to note that expanding the size of the teams, even at local or national level, is also
positively associated with the impact of research, especially in terms of MNJS.
The fact that the impact of nationally co-authored papers also tends to grow with the
number of authors and the number of institutions is a relevant finding which partially
contradicts the results of Goldfinch concerning the scientific output of New Zealand Crown
Research Institutes (Goldfinch et al. 2003) where higher levels of co-publications with
Scientometrics (2013) 96:443–466 461
123
domestic institutions not only did not result in an increase of citation rates, but reduced
them. According to Goldfinch, national collaboration in peripheral countries may improve
the quality of research but not its visibility and resulting citation rates due to the limited
size of national social networks. In the case of Spanish pharmacological research,
increasing the number of authors in domestic papers seems to be positive in terms of both
publication journals and citation rates. However, it is interesting to point out that national
collaboration shows a stronger positive effect on MNJS values than on MNCS values,
which could be partly explained by Goldfinch’s thesis on the limited size of national
networks. The higher visibility and dissemination amongst the world scientific community
of internationally co-authored papers and the presumably global interest of a research topic
which is addressed collectively amongst scientists from different countries are factors
that—apart from the intrinsic quality of research—may contribute to explain their higher
citation rates.
An interesting finding of this study is that a positive relationship of collaboration, and
especially of international collaboration, with the impact of publications is observed for all
the different institutional sectors within the country. National collaboration leads to MNJS
values above world average in a few sectors, but only international collaboration is
associated with MNCS values above world average. The greatest benefit of international
collaboration is observed for companies, which increase their MNJS and MNCS values by
33 and 55 %, respectively, compared to the average values of impact in the sector. This
sector shows the lowest overall impact in both periods, which supports the idea that the
‘‘weakest’’ partners (in terms of impact) are the ones who could benefit the most from
collaboration (Bordons et al. 1993; van Leeuwen and Tijssen 2007).
The higher impact of cross-sector collaboration as compared with that developed within
a given sector was observed only for two-institution publications and in the first period.
This finding supports only partially our hypothesis of growing impact for the more het-
erogeneous research developed in the framework of cross-sector publications. A possible
explanation is that for higher co-institutional levels the number of institutions is a stronger
source of diversity than the variety of institutional sectors. However, a more plausible
reason is that the identity of the sectors involved other matters, since there are inter-sector
differences in impact of research and collaboration with the most influential sectors (in
terms of impact) might be especially positive for the less influential ones, as has been
observed for companies. The detailed study of all such interconnections is beyond the
objectives of this paper but it is an interesting issue for future analysis. A limitation of the
cross-sector collaboration indicator is that it does not take into account the activity of a
number of corporations or networks of institutions (for e.g., ‘‘CIBER’’,5 networks of
research centres in biomedicine) which are trans-sectoral according to their composition
but are included in our study in the NPO sector class on the basis of their non-profit aims.
Spanish authors collaborate mainly with high-level RD countries and this type of col-
laboration seems to be advantageous for Spain in terms of scientific impact. However, it is
interesting to observe that the impact of the collaboration with low-level RD countries
tends to grow over time in terms of both impact of publication journals and citation rates,
thus indicating that the collaboration with these low-level RD countries has been optimised
over the years. It may indicate that Spanish scientists have made a more careful choice of
partners during our last reference period, but also that both Spanish and foreign teams are
5 ‘‘Centros de investigacion biomedica en red’’ (CIBER), created by the Spanish government to achieve acritical mass of researchers by fields and beyond institutional boundaries to succeed in obtaining excellencein research.
462 Scientometrics (2013) 96:443–466
123

taking advantage of the learning experience derived from collaboration over the years, thus
suggesting a kind of ‘‘beneficial investment’’ effect of prolonged collaboration. Moreover,
it should be noted that whilst the share of Spanish publications including only low-level
RD countries remains stable throughout the period, the share of multilateral publications
written by both low and high-level RD countries shows an upward trend. This can be
understood in the context of the increasing globalisation of research (Tijssen et al. 2012), in
general terms, and of the growing role of multilateral projects in pharmacological research,
in particular, associated to the development of multi-country clinical trials. Moreover,
deliberate government policies may support international collaboration as a method to
foster regional cohesion and building scientific capacity in the least advanced countries
(Mattsson et al. 2010).
All in all, our results show evidence of changes in the collaborative practises of Spanish
scientists in the pharmacological field during the period under study which lead to the
extended presence and heterogeneity of collaboration and is associated to a rising trend in
research impact. A large number of authors and institutions, and the presence of interna-
tional collaboration, in particular with high-level RD countries, are strategic factors which
contribute to optimise the impact of Spanish publications in the field. Although the
growing citation rates of collaborative papers might be enhanced by their access to larger
social networks and related higher visibility, the fact that they are also published in higher
impact factor journals points to a genuine improvement of research quality for collabo-
rative papers. From a science policy perspective, it should be noted that promoting more
heterogeneous collaboration (e.g. multilateral, cross-sector) probably needs more external
stimulus than just establishing more simple links (e.g. bilateral, intra-sector) which are
more easily developed by scientists on their own. The study of the ‘‘heterogeneity’’ of
collaboration is addressed in this paper considering the collaboration type and the size of
links, and assuming higher heterogeneity as the size of the links expands. The development
of specific indicators to also measure ‘‘diversity’’ between partners remains our next
objective to extend and deepen the study of the role of heterogeneity in research
collaboration.
Acknowledgments This work was supported by research grant CSO2008-06310 from the Spanish Min-istry of Science and Innovation. Special thanks to Isabel Gomez for her comments on a previous draft of thispaper.
Appendix
See Table 9.
Table 9 Descriptive statistics for MNJS and MNCS by collaborative type, number of authors, number ofinstitutions and period
1998–2000 2006–2008
MNJS MNCS MNJS MNCS
National collaboration
1 author 0.23 (0.11) 0.01 (0.03) 0.76 (0.50) 0.50 (0.56)
2–3 authors 0.81 (0.59) 0.52 (0.64) 0.80 (0.55) 0.65 (0.79)
4–5 authors 0.93 (0.60) 0.72 (1.19) 0.98 (0.47) 0.87 (0.99)
6–7 authors 0.96 (0.65) 0.88 (1.34) 0.95 (0.48) 0.83 (1.00)
Scientometrics (2013) 96:443–466 463
123

References
Abramo, G., D’Angelo, C. A., & Di Costa, F. (2009). Research collaboration and productivity: is therecorrelation? Higher Education, 57, 155–171.
Adams, J. D., Black, G. C., Clemmons, J. R., & Stephan, P. (2005). Scientific teams and institutionalcollaboration: evidence from US universities, 1981–1999. Research Policy, 34, 259–285.
Basu, A., & Vinu-Kumar, B. S. (2000). International collaboration in Indian scientific papers. Sciento-metrics, 48 (3), 381–402.
Beaver, D. D., & Rosen, R. (1979). Studies in scientific collaboration. Part 2. Scientific co-authorship,research productivity and visibility in the French scientific elite, 1799–1830. Scientometrics, 1 (2),133–149.
Bordons, M., Gomez, I., Morillo, F., Aparicio, J., Aguillo, I., & Sancho, R. (2012b). Estructura y dinamicade los campos cientıficos en Espana a traves del analisis de las redes de colaboracion entre investi-gadores. Report. Madrid: IEDCYT-CCHS, CSIC.
Bordons, M., & Barrigon, S. (1992). Bibliometric analysis of publications of Spanish pharmacologists in theSCI (1984–89). II. Contribution to subfields other than ‘‘Pharmacology and Pharmacy (ISI)’’.Scientometrics, 25 (3), 425–446.
Bordons, M., Garcıa-Jover, F., & Barrigon, S. (1993). Is collaboration improving research visibility?Spanish scientific output in Pharmacology and Pharmacy. Research Evaluation, 3 (1), 19–24.
Bordons, M., Aparicio, J., & Costas, R. (2012a). Trends in the collaborative structure of the Spanishpharmacological scientific production and its influence over research impact. In: Proceedings of STI2012. 17th international conference on science and technology indicators. (Vol. 1). Quebec: Universitedu Quebec a Montreal.
Corley, E. A., Boardman, P. C., & Bozeman, B. (2006). Design and the management of multi-institutionalresearch collaborations: theoretical implication from two case studies. Research Policy, 35 (7),975–993.
Costas, R., & Bordons, M. (2007). Algoritmos para solventar la falta de normalizacion de nombres de autoren los estudios bibliometricos. Investigacion bibliotecologica: archivonomıa, bibliotecologıa e infor-macion, 21 (42), 13–32.
Table 9 continued
1998–2000 2006–2008
MNJS MNCS MNJS MNCS
[7 authors 1.04 (0.64) 1.00 (1.59) 1.17 (0.45) 1.04 (1.10)
2 institutions 0.89 (0.61) 0.66 (0.89) 0.96 (0.50) 0.83 (1.04)
3 institutions 1.00 (0.63) 0.84 (1.52) 0.98 (0.48) 0.88 (0.94)
[3 institutions 1.08 (0.65) 1.49 (2.16) 1.07 (0.48) 0.93 (0.97)
International collaboration
1 author 0.78 (-) 0.73 (-) 0.22 (0.02) 0.19 (0.32)
2–3 authors 0.72 (0.51) 0.94 (1.53) 1.08 (0.66) 1.18 (1.72)
4–5 authors 0.95 (0.64) 0.99 (1.44) 1.03 (0.49) 1.03 (1.47)
6–7 authors 0.93 (0.63) 0.82 (1.13) 1.04 (0.51) 0.97 (1.06)
[7 authors 1.08 (0.72) 1.53 (2.12) 1.22 (0.92) 1.31 (1.76)
2 institutions 0.94 (0.61) 0.92 (1.22) 1.05 (0.57)ns 1.17 (1.65)ns
3 institutions 0.84 (0.62) 0.94 (1.52) 1.06 (0.52)ns 0.98 (1.23)ns
[3 institutions 1.07 (0.71) 1.40 (2.02) 1.15 (0.83)ns 1.17 (1.56)ns
Average values (SD)
Significant differences in MNJS and MNCS by number of authors and number of institutions in all cases(p \ 0.05) except in those marked with ‘‘ns’’
464 Scientometrics (2013) 96:443–466
123

Costas, R., Van Leeuwen, T. N., & Bordons, M. (2012). Referencing patterns of individual researchers: dotop scientists rely on more extensive information sources? Journal of the American Society forInformation Science and Technology (forthcoming).
Francescht, M., & Costantini, A. (2010). The effect of scholar collaboration on impact and quality ofacademic papers. Journal of Informetrics, 4, 540–553.
Garcıa-Romero, A., Navarrete-Cortes, J., Escudero, C., Fernandez-Lopez, J. A., & Chaichıo-Moreno, J. A.(2009). Measuring the influence of clinical trials citations on several bibliometric indicators.Scientometrics, 80 (3), 749–762.
Gazni, A., & Didegah, F. (2011). Investigating different types of research collaboration and citation impact:a case study of Harvard University’s publications. Scientometrics, 87 (2), 251–265.
Gazni, A., Sugimoto, C. R., & Didegah, F. (2012). Mapping world scientific collaboration: authors, insti-tutions and countries. Journal of the American Society for Information Science and Technology, 63 (2),323–335.
Glanzel, W. (2001). National characteristics in international scientific co-authorship relations. Scientomet-rics, 51 (1), 69–115.
Glanzel, W., & Lange, C. (2002). A distributional approach to multinationality measures of internationalscientific collaboration. Scientometrics, 54 (1), 75–89.
Glanzel, W., & Schubert, A. (2004). Analysing scientific networks trough co-authorship. In H. F. Moed, W.Glanzel, & U. Schmoch (Eds.), Handbook of quantitative S and T research (pp. 257–276). Dordrecht:Kluwer Academic Publisher.
Glanzel, W., & Thijs, B. (2004). Does co-authorship inflate the share of self-citations? Scientometrics, 61(3), 395–404.
Goldfinch, S., Dale, T., & De Rouen, K. (2003). Science from the periphery: collaboration, networks and‘‘periphery effects’’ in the citation of New Zealand Crown Research Institutes articles, 1995–2000.Scientometrics, 57 (3), 321–337.
Gomez, I., Fernandez, M. T., & Sebastian, J. (1999). Analysis of the structure of international scientificcooperation networks through bibliometric indicators. Scientometrics, 44 (3), 441–457.
Gomez, I., Bordons, M., Morillo, F., Moreno, L., & Gonzalez-Albo, B. (2010). La actividad cientıfica delCSIC a traves del Web of Science. In: Estudio bibliometrico del periodo 2004–2009. Madrid: IEDCYT-CCHS, CSIC.
Gonzalez-Albo, B., & Bordons, M. (2011). Articles vs. proceedings papers: do they differ in researchrelevance and impact? A case study in the Library and Information Science field. Journal of Infor-metrics, 5 (3), 369–381.
Gorraiz, J., Reimann, R., & Gumpenberger, C. (2012). The importance of bilateral and multilateral dif-ferentiation in the assessment of international collaboration—a case study for Austria and six countries.Scientometrics, 91 (2), 417–433.
Hackett, E. (2005). Introduction: special gust-edited issue on scientific collaboration. Social Studies ofScience, 35 (5), 667–671.
Haslam, N., Ban, L., Kaufmann, L., Loughnan, S., Peters, K., Whelan, J., et al. (2008). What makes anarticle influential? Predicting impact in social and personality psychology. Scientometrics, 76 (1),169–185.
He, Z. L. (2009). International collaboration does not have greater epistemic authority. Journal of theAmerican Society for Information Science and Technology, 60 (10), 2151–2164.
Jha, Y., & Welch, E. (2010). Relational mechanisms governing multifaceted collaborative behavior ofacademic scientists in six fields of science and engineering. Research Policy, 39 (9), 1174–1184.
Katz, S., & Martin, B. R. (1997). What is research collaboration? Research Policy, 26 (1), 1–18.Kostoff, R. N. (2007). The difference between highly and poorly cited medical articles in the journal Lancet.
Scientometrics, 72 (3), 513–520.Lander, B., & Atkinson-Grosjean, J. (2011). Translational science and the hidden research system in
universities and academic hospitals: a case study. Social Science & Medicine, 72, 537–544.Lee, S., & Bozeman, B. (2005). The impact of research collaboration on scientific productivity. Social
Studies of Science, 35, 673–702.Mattsson, P., Laget, P., NilssonVindefjard, A., & Sundberg, C. J. (2010). What do European research
collaboration networks in life sciences look like? Research Evaluation, 19 (5), 373–384.McVeigh, M. E., & Mann, S. J. (2009). The journal impact factor denominator. Defining citable (counted)
items. JAMA, 302 (10), 1107–1109.Moed, H. F. (2005). Citation analysis in research evaluation. Dordrecht: Springer.Narin, F., Stevens, K., & Whitlow, E. (1991). Scientific cooperation in Europe and the citations of multi-
nationally authored papers. Scientometrics, 21 (3), 313–323.Newman, M. E. J. (2001). The structure of scientific collaboration networks. PNAS, 98 (2), 404–409.
Scientometrics (2013) 96:443–466 465
123

Noma, E. (1986). Subject Classification and influence weights for 3,000 journals. In Research report underCHI and NIH contracts. New Jersey: Computer Horizons Inc. Research.
Reagans, R., & Zuckerman, E. W. (2001). Diversity and productivity: the social capital of corporate R&Dteams. Organization Science, 12 (4), 502–517.
The Word Bank. Science and Technology Indicators. Retrieved, March 15, 2012. http://data.worldbank.org/indicator/GB.XPD.RSDV.GD.ZS.
Sonnenwald, D. H. (2007). Scientific collaboration. Annual Review of Information Science and Technology,41 (1), 643–681.
Talke, K., Salomo, S., & Kock, A. (2011). Top management team diversity and strategic innovationorientation: the relationship and consequences for innovativeness and performance. Journal of ProductInnovation Management, 28 (6), 819–832.
The Royal Society. (2011). Knowledge, networks and nations: global scientific collaboration in the 21stcentury. London: Royal Society.
Thijs, B., & Glanzel, W. A. (2010). Structural analysis of collaboration between European research insti-tutes. Research Evaluation, 19 (1), 55–65.
Tijssen, R. J. W., Waltman, L., & van Eck, L. (2012). Research collaboration and the expanding sciencegrid: measuring globalisation processes worldwide. http://arxiv.org/abs/1203.4194.
Van Leeuwen, T. N., & Tijssen, R. (2007). Strength and weakness of national science systems. A biblio-metric analysis through cooperation patterns. In: D. Torres-Salinas, & H. F. Moed, (Eds.) Proceedingsof the 11th International Conference of the International Society for Scientometrics and Informetrics(pp. 469–479). Madrid: CINDOC-CSIC.
Waltman, L., van Eck, N. J., Van Leeuwen, T. N., Visser, M. S., & Van Raan, A. F. J. (2011). Towards anew crown indicator: some theoretical considerations. Journal of Informetrics, 5 (1), 37–47.
466 Scientometrics (2013) 96:443–466
123