Embed Size (px)
Citation preview

Heritability enrichment of differentially expressed genes
Hilary FinucanePGC Statistical Analysis Call
January 26, 2016
1

Functional genomics + GWAS gives insight into disease‐relevant tissues
See also Maurano et al. 2012 Science, Pickrell 2014 AJHG, Kichaev et al. 2014 PLoS Genet.
Trynka et al. 2013 Nature Genetics Farh et al. 2014 Nature
2

LD score regression uses the whole genome, improving power for polygenic traits.
Finucane*, Bulik‐Sullivan*, et al. 2015 Nature Genetics3

Gene expression + GWAS gives insight into disease‐relevant tissues
5
4
0
1
2
3
Obs
erve
d –l
og10
(p)
10 2 3 4
Expected –log10 (p)
5
4
0
1
2
3
Obs
erve
d –l
og10
(p)
10 2 3 4
Expected –log10 (p)
10 2 3 4
Expected –log10 (p)
5
4
0
1
2
3
120
80
0
40
12
8
0
4
Obs
erve
d –l
og10
(p)
Bipolardisorder
Crohn’sdisease
Type 1diabetes
Type 2diabetes
Rheumatoidarthritis
Hypertension
Coronaryarterydisease
Whole bloodMuscleLungNerve, tibialThyroid
AdiposeArtery, tibialHeartSkin
10 2 3 4
Expected –log10 (p)
5
5
4
0
1
2
3O
bser
ved
–log
10 (p
)
Hu et al. 2011 AJHG
GTEx Consortium, 2015 Science4

Our goal: combine ENCODE/Roadmap data with gene expression data to identify
disease‐relevant tissues
• By combining regulatory marks with gene expression data, we should be able to:– Replicate results in orthogonal data– Increase power
• Using LD score regression will increase power for very polygenic traits.
• First step: how much signal is there in GTEx, and how can we get it out?
5

Outline
• Review of stratified LD score regression.
• Differentially expressed genes in GTEx.
• Validation: Brain v Blood in SCZ and RA.
• Results in 7 Brain‐related traits and RA.
6
Outline
• Review of stratified LD score regression.
• Differentially expressed genes in GTEx.
• Validation: Brain v Blood in SCZ and RA.
• Results in 7 Brain‐related traits and RA.
7

Stratified LD score regression• Our model is
Where • Y is an individual’s phenotype, • Xj is an individual’s genotype at the j‐th SNP(normalized to mean 0 and variance 1),
• βj is the effect of SNP j, and • ε is noise and random environmental effects.
Finucane*, Bulik‐Sullivan* et al. 2015 Nat Genet8

Stratified LD score regression• We model SNP effects as random and mean 0.• For disjoint categories,
where
• Intuition: LD to a category that is enriched for heritability will increase the chi‐square statistic of a SNP more than LD to other categories.
Finucane*, Bulik‐Sullivan* et al. 2015 Nat Genet9

Stratified LD score regression with overlapping categories
• Var(βj) = Expected per‐SNP heritability of SNP j.• With disjoint categories, if SNP j is in category C,
• With overlapping categories,
• i.e., τc is the contribution of category C to per‐SNP heritability of SNPs in category C, after controlling for all other categories in the model.
Finucane*, Bulik‐Sullivan* et al. 2015 Nat Genet10

• With overlapping categories,
Stratified LD score regression:• Estimate LD scores from a reference panel with matching LD.
• Perform (weighted) regression of chi‐square on LD scores to estimate the
• Optional: convert back to heritability.
Stratified LD score regression with overlapping categories
Finucane*, Bulik‐Sullivan* et al. 2015 Nat Genet11

Stratified LD score regression to identify disease‐relevant tissues
• Have a baseline model with many annotations (exon, DHS, H3K27ac, “weak enhancer,” etc.)
• Add tissue‐specific annotation; e.g. H3K27ac in Liver.
• Test for positive for this annotation.
Finucane*, Bulik‐Sullivan* et al. 2015 Nat Genet12

Finucane*, Bulik‐Sullivan* et al. 2015 Nat Genet
Stratified LD score regression identifies disease‐relevant tissues
Results with Roadmap/ENCODE data:
To apply stratified LD score regression to GTEx, have to define new tissue‐specific annotations.
13

Outline
• Review of stratified LD score regression.
• Differentially expressed genes in GTEx.
• Validation: Brain v Blood in SCZ and RA.
• Results in 7 Brain‐related traits and RA.
14

GTEx tissues• Brain ‐ Amygdala• Brain ‐ Anterior cingulate cortex
(BA24)• Brain ‐ Caudate (basal ganglia)• Brain ‐ Cerebellar Hemisphere• Brain ‐ Cerebellum• Brain ‐ Cortex• Brain ‐ Frontal Cortex (BA9)• Brain ‐ Hippocampus• Brain ‐ Hypothalamus• Brain ‐ Nucleus accumbens (basal
ganglia)• Brain ‐ Putamen (basal ganglia)• Brain ‐ Spinal cord (cervical c‐1)• Brain ‐ Substantia nigra
• Adipose ‐ Subcutaneous• Adipose ‐ Visceral (Omentum)• Adrenal Gland• Artery ‐ Aorta• Artery ‐ Coronary• Artery ‐ Tibial• Breast ‐Mammary Tissue• Cells ‐ EBV‐transformed
lymphocytes• Cells ‐ Leukemia cell line (CML)• Cells ‐ Transformed fibroblasts• Colon ‐ Transverse• Esophagus ‐Mucosa• Esophagus ‐Muscularis• Fallopian Tube• Heart ‐ Atrial Appendage• Heart ‐ Left Ventricle
• Kidney ‐ Cortex• Liver• Lung• Muscle ‐ Skeletal• Nerve ‐ Tibial• Ovary• Pancreas• Pituitary• Prostate• Skin ‐ Not Sun Exposed (Suprapubic)• Skin ‐ Sun Exposed (Lower leg)• Stomach• Testis• Thyroid• Uterus• Vagina• Whole Blood
• 46 tissues total– Average of 66 samples per
tissue– min = 1 sample– max = 607 samples
• Of these, 13 are brain tissues– Average of 42 samples per
tissue– min = 28 samples– max = 60 samples
15

Defining the annotation
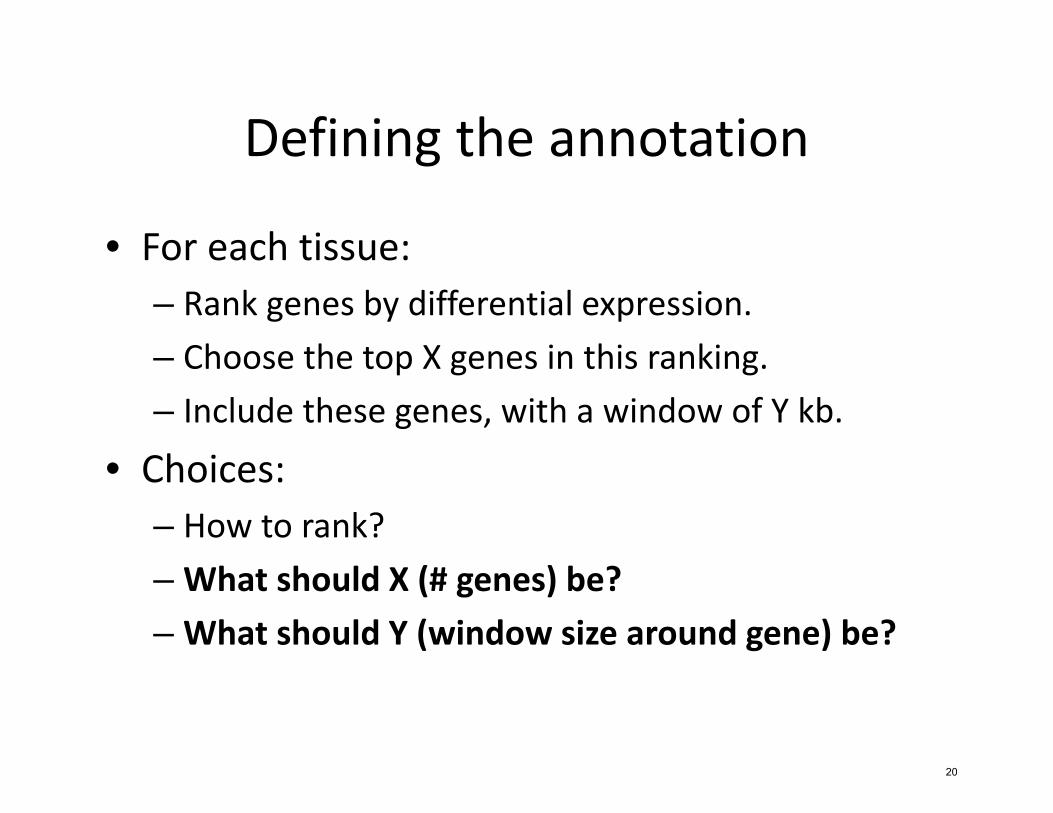
• For each tissue:– Rank genes by differential expression.– Choose the top X genes in this ranking.– Include these genes, with a window of Y kb.
16

Defining the annotation
• For each tissue:– Rank genes by differential expression.– Choose the top X genes in this ranking.– Include these genes, with a window of Y kb.
• Choices:– How to rank?– What should X (# genes) be?– What should Y (window size around gene) be?
17

Defining the annotation
• For each tissue:– Rank genes by differential expression.– Choose the top X genes in this ranking.– Include these genes, with a window of Y kb.
• Choices:– How to rank?– What should X (# genes) be?– What should Y (window size around gene) be?
18

We rank genes using HKNorm and a t‐test for differential expression.
• We normalize RPKM using the HKNorm algorithm [Byrnes et al. in prep].
• For each gene, we compute a t statistic for whether HKNorm expression levels are different for samples in the tissue vs. not in the tissue.
• Rank by the t statistic.
19
Defining the annotation
• For each tissue:– Rank genes by differential expression.– Choose the top X genes in this ranking.– Include these genes, with a window of Y kb.
• Choices:– How to rank?– What should X (# genes) be?– What should Y (window size around gene) be?
20

Choosing #genes and window size.• How many genes to choose?
– We try top 2%, 5%, 10% of all genes.– After QC, this gives us 369, 8921, and 1842 genes, respectively.
• What window size?– We try 20kb and 100kb from transcribed region.– For all genes, this gives us 45% and 58% of the genome, respectively.
• In total, we try 3 x 2 = 6 parameter settings.• Note: For LD score, want an annotation that covers at least roughly 1% of the genome.
21

Outline
• Review of stratified LD score regression.
• Differentially expressed genes in GTEx.
• Validation: Brain v Blood in SCZ and RA.
• Results in 7 Brain‐related traits and RA.
22

Brain annotation• Brain = union of 13 brain tissues
• GO enrichment (10% set):
Blood annotation• Blood = Whole blood and LCLs
• GO enrichment (10% set):
23

Brain v Blood, RA v SCZ: should use 10% of genes with a 100kb window
24
Outline
• Review of stratified LD score regression.
• Differentially expressed genes in GTEx.
• Validation: Brain v Blood in SCZ and RA.
• Results in 7 Brain‐related traits and RA.
25

Brain vs. Blood in many traits also identifies Brain for Bipolar Disorder
26

Schizophrenia
27

Bipolar Disorder
28

BMI
29

Age at menarche
30

Rheumatoid Arthritis
31

Brain vs Blood in many traits also identifies Brain for Bipolar Disorder
32

Previous anlaysis with histone marks has higher power
33

Gene sets derived from histone marks have similar power to gene sets
derived from GTEx.
34

Future directions
• Improve power by combining signal from multiple tissue‐relevant annotations (histone marks, gene sets, etc.).– Still method in progress. – One idea: for a single tissue, add histone marks, gene expression, etc. to the model together. Test for enrichment using the sum of the coefficients. (Or some other linear combination.)
• Difficulty: need data on the same cell types, or to group cell types together.
35

Acknowledgements
• Alkes Price• Ben Neale• Andrea Byrnes• Verneri Anttila• Samuela Pollack• Yakir Reshef• The GTEx Consortium
36