Embed Size (px)
Citation preview

NOTE: This document is submitted to HUD via its online Integrated Disbursement and Information System (IDIS). The format of this document is controlled by IDIS.
2013-14 State of California Consolidated Annual Performance E valuation Report (CAPER)
CR-05 - Goals and OutcomesProgress the jurisdiction has made in carrying out its strategic plan and its action plan. 91.520(a) This could be an overview that includes major initiatives and highlights that were proposed and executed throughout the program year.
This report discusses program outcomes for the 2013-2014 fiscal year utilizing State Community Development Block Grant (CDBG), HOME Investment Partnerships Program (HOME), Emergency Solutions Grants Program (ESG), Housing Opportunities for Persons with AIDS (HOPWA) and Lead-Hazard Control Program (LHCP) funds. The State continues to make progress with these funds in increasing the supply of affordable permanent housing, improving public infrastructure, and increasing public services, public facilities, and Rapid-Rehousing and crisis response services for households in State-eligible nonentitlement CDBG, HOME, ESG, HOPWPA and LHCP Program communities. In addition, the State works toward affirmatively furthering fair housing in the administration of program funds.
In addition to the data provided below, this CAPER discusses affordable housing outcomes, homelessness and special needs activities, and other State actions in furtherance of the State's HUD Annual Plan Goals and Objectives. Program monitoring information and other fiscal data is also provided.
CAPER 1

Comparison of the proposed versus actual outcomes for each outcome measure submitted with the consolidated plan and explain, if applicable, why progress was not made toward meeting goals and objectives. 91.520(g)Categories, priority levels, funding sources and amounts, outcomes/objectives, goal outcome indicators, units of measure, targets, actual outcomes/outputs, and percentage completed for each of the grantee’s program year goals.
The State made progress on all of its 5-year strategic plan goals. Note: 1) In the IDIS table below, the amount shown in the Source/Amount column is the total amount available for all activities or indicators associated with a particular goal. It is not the amount expended for a particular activity or indicator): 2) for Homeless Assistance and Prevention services, no ESG outcome data was available for 2010 and 2011 because this data was not collected through IDIS or the Homeless Management Information System (HMIS) during this period. 3) The Actual Strategic Plan number for Public Facility or Infrastructure Activities for Low/Moderate Income Housing Benefit is significantly higher than the Expected Strategic Plan number for this indicator due to a large number of activities that were closed out in IDIS over the last year, and due to the increase in the number of infrastructure activities over the last several years.
Goal Category Source / Amount
Indicator Unit of Measure
Expected – Strategic Plan
Actual – Strategic Plan
Percent Complete
Expected – Program Year
Actual – Program Year
Percent Complete
Foster local public services
Non-Housing Community Development
CDBG: $4,354,240
Public service activities other than Low/Moderate Income Housing Benefit
Persons Assisted
822,777 2,045,298
249% 91,452 337,898
369%
Foster local public services
Non-Housing Community Development
CDBG: $4354240
Public service activities for Low/Moderate Income Housing Benefit
Households Assisted
27,226 1,933 7% 6,507 0 0%
CAPER 2

Foster local public services
Non-Housing Community Development
CDBG: $4354240
Housing Code Enforcement/Foreclosed Property Care
Household Housing Unit
7,091 3732 53% 0 0 0%
Increase economic development opportunities
Non-Housing Community Development
CDBG: $13,062,719
Jobs created/retained Jobs
3,809 39,141 1028% 552 12,531 2,270%
Increase economic development opportunities
Non-Housing Community Development
CDBG: $13,062,719
Businesses assistedBusinesses Assisted
6,704 12,350 184% 454 482 106%
Meet the housing needs of low-income homeowners
Affordable Housing
CDBG: $6,531,360 / HOME: $15,178,712 / Lead Hazard Control Program: $69,0000
Homeowner Housing Added
Household Housing Unit
150 135 90% 30 13 43%
CAPER 3

Meet the housing needs of low-income homeowners
Affordable Housing
CDBG: $6531360 / HOME: $15178712 / Lead Hazard Control Program: $690000
Homeowner Housing Rehabilitated
Household Housing Unit
4,336 3,937 91% 663 255 38%
Meet the housing needs of low-income homeowners
Affordable Housing
CDBG: $6531360 / HOME: $15178712 / Lead Hazard Control Program: $690000
Direct Financial Assistance to Homebuyers
Households Assisted
1,136 1,359 120% 96 199 207%
Meet the housing needs of low-income renters
Affordable Housing
CDBG: $4354240 / HOME: $20870730 / Lead Hazard Control Program: $1610000
Rental units constructed
Household Housing Unit
1,500 4,352 290% 95 583 614%
CAPER 4

Meet the housing needs of low-income renters
Affordable Housing
CDBG: $4354240 / HOME: $20870730 / Lead Hazard Control Program: $1610000
Rental units rehabilitated
Household Housing Unit
473 1,290 273% 116 237 204%
Provide homeless assistance & prevention services
HomelessNon-Homeless Special Needs
HOPWA: $3874339 / HOME: $1897339 / ESG: $8956662
Tenant-based rental assistance / Rapid Rehousing
Households Assisted
6,386 5,277 83% 2,491 3,313 133%
Provide homeless assistance & prevention services
HomelessNon-Homeless Special Needs
HOPWA: $3874339 / HOME: $1897339 / ESG: $8956662
Homeless Person Overnight Shelter
Persons Assisted
57,642 45,771 79% 11,219 13,291 118%
Provide homeless assistance & prevention services
HomelessNon-Homeless Special Needs
HOPWA: $3874339 / HOME: $1897339 / ESG: $8956662
Homelessness Prevention
Persons Assisted
18,214 5,017 28% 5,361 3,831 71%
CAPER 5
Provide homeless assistance & prevention services
HomelessNon-Homeless Special Needs
HOPWA: $3874339 / HOME: $1897339 / ESG: $8956662
HIV/AIDS Housing Operations
Household Housing Unit
250 191 76% 50 38 76%
Provide homeless assistance & prevention services
HomelessNon-Homeless Special Needs
HOPWA: $3874339 / HOME: $1897339 / ESG: $8956662
Other (HOPWA Supportive Services)
Other
7,000 6,639 95% 1,400 1,660 119%
Support local public facilities and improvements
Non-Housing Community Development
CDBG: $13062719
Public Facility or Infrastructure Activities other than Low/Moderate Income Housing Benefit
Persons Assisted
1,599,906
1,726,082
108% 13,0595
126,934
97%
Support local public facilities and improvements
Non-Housing Community Development
CDBG: $13062719
Public Facility or Infrastructure Activities for Low/Moderate Income Housing Benefit
Households Assisted
1,635 2,301,781
140,782%
229 548,618
239,571%
Table 1 - Accomplishments – Program Year & Strategic Plan to Date
CAPER 6

Assess how the jurisdiction’s use of funds, particularly CDBG, addresses the priorities and specific objectives identified in the plan, giving special attention to the highest priority activities identified
Consistent with the priorities and specific objectives outlined in the 2013-14 Annual Plan, the State allocates the largest share of its HUD funds to rental housing production, (approximately $27 million) and homeownership activities, (approximately $22 million). Nearly $15 million is allocated to homelessness assistance and tenant-based rental assistance, and approximately $10 million to infrastructure improvements. Although each of these activities are important State priorities, the relative share of funds for these activities is consistent with the focus of the HOME, ESG, and HOPWA programs on housing and homelessness assistance.
For Program Year 2013 CDBG’s highest expenditures are for public facilities/public infrastructure projects ($10 million), followed by housing ($6.5 million), and public services (approximately $2.8 million). These estimated expenditures are consistent with CDBG’s funding priorities and meets the state and federal expenditure requirements and limits. Additionally, the program expended $1.85 million for economic development, and $1.7 million for planning-only grants. While all CDBG activities are of great necessity in California, the state has essentially three top priorities for its CDBG funds: Public Infrastructure (for potable water projects), Public Services (for job training), and Homeownership, (pursuant to our Analysis of Impediments to Fair Housing (AI) findings). The CDBG expenditures for program year 2013 are consistent with the program’s goals.
CAPER 7

CR-10 - Racial and Ethnic composition of families assisted
Describe the families assisted (including the racial and ethnic status of families assisted) 91.520(a)
CDBG HOME ESG HOPWAWhite 119,479 991 6,471 1,054Black or African American 2,804 19 1,170 213
Asian 2,859 17 148 12American Indian or American Native
9,566 9 495 28
Native Hawaiian or Other Pacific Islander
283 6 145 57
Hispanic 39,921 592 2,209 399Not Hispanic 95,070 450 5,748 965Total 134,991 1,042 7,957 1,364Table 2 – Table of assistance to racial and ethnic populations by source of funds
Narrative
In FY 13-14 CDBG’s largest racial and ethnic groups served were Whites and Non-Hispanics, although the program served a significant percentage of Hispanics and American Indian or American Natives. HOME’s largest racial and ethnic groups were White and Hispanics. ESG’s and HOPWA’s were White and Non-Hispanics. According to the Department’s 2012 AI, Whites are a greater percentage of the total population of CDBG and HOME-eligible (nonentitlement) jurisdictions than are Minorities, so the above data is somewhat consistent with this trend; however, the programs will continue to work with its grantees to increase service to racial and ethnic minorities.
CAPER 8

CR-15 - Resources and Investments 91.520(a)Identify the resources made available
Source of Funds Source ExpectedAmount Available
ActualAmount Expended
Program Year 2013-14CDBG 43,542,398 27,657,162HOME 35,000,000 43,691,490HOPWA 3,305,068 3,068,986ESG 8,956,662 11,911,494
OtherLead Hazard Control Program 2,300,000 $833,175
Table 3 – Resources Made Available
NarrativeThe expected amount available for the Lead Hazard Control Program is for the period of 2012-2015. Where the Amount Expended exceeds the Expected Amount Available, this is primarily due to completed activities from prior year allocations.
Identify the geographic distribution and location of investments
Target Area Planned Percentage of Allocation
Actual Percentage of Allocation
Narrative Description
Table 4 – Identify the geographic distribution and location of investments
Narrative
The State had no geographic target areas identified for FY 13-14. See the 2012-13 Annual Plan Methods of Distribution (AP 30) at http://www.hcd.ca.gov/hpd/hrc/rep/fed/ for a description of the allocation method for each Annual Plan Program.
Leveraging
Explain how federal funds leveraged additional resources (private, state and local funds), including a description of how matching requirements were satisfied, as well as how any publicly owned land or property located within the jurisdiction that were used to address the needs identified in the plan
CDBG: Proposals to use CDBG funds with other leveraged funds can improve the feasibility of programs and projects since available funds are often insufficient to fully support most Community Development or Economic Development projects and programs. CDBG is generally used as gap financing in conjunction with other federal, State and private funds. CDBG is used in conjunction with USDA funding
CAPER 9

and other grant funding to local governments. Localities are encouraged to provide local resources and obtain private support, and to report State or federal funds used in the proposed activities. Local contributions typically consist of in-kind staff services, grant administration, gas tax funds, public works funds, permit and other fee waivers. Private contributions can include mortgage loans, grants from private agencies, in-kind staff time, sweat equity from rehabilitation projects, and discounts on services from title, pest and appraisal companies.
HOME: The primary forms of leverage for HOME funds are tax credit equity and private bank loans associated with multifamily rental housing new construction or rehabilitation projects. Secondarily, first mortgage financing on homebuyer acquisition activities provides another main source of leverage. Typically, every $1 in HOME funds leverages $3-$4 in private investment. Since HOME generates so much additional leverage, it is able to meet its match requirement from these types of sources, as well as other state and local government financing for HOME-eligible activities. HOME currently has excess match which it has banked to meet its match requirement for the next several years. See table below.
ESG: Funds leverage additional local government and private philanthropic investment from foundations. ESG meets its 100% match requirement by relying on these sources from its funded grantees.
HOPWA: Project Sponsors leverage funds from various state, federal, local and private resources, including Ryan White Part B funding, for housing assistance, supportive services and other non-housing support. DPH/OA integrates HOPWA and Ryan White Part B funding to allow a seamless approach to the delivery of housing and care services. The HIV Care Program (Ryan White Part B), administered by the Department of Public Health Office of AIDS (DPH/OA), provides HIV care services statewide, including the 42 HOPWA-eligible counties. These services, when used in conjunction with HOPWA services, assist in preventing homelessness and addressing emergency housing needs.
LHCP: HUD requires a 10% non-federal match contribution. LHCP’s network of Community-Based Organizations are contracted to meet this requirement. State, local, charitable, non-profit or for-profit entities, private donations, in-kind and owner’s contribution resources are used to meet this requirement. Subgrantees also provide federal leveraging funds through various resources such as the Low-Income Home Energy Assistance Program, and other sources similar to those noted above; however, funds from subgrantees are not counted towards satisfying the non-federal match requirement.
Fiscal Year Summary – HOME Match1. Excess match from prior Federal fiscal year 210,845,8442. Match contributed during current Federal fiscal year 53,492,2593. Total match available for current Federal fiscal year (Line 1 plus Line 2) 264,338,1034. Match liability for current Federal fiscal year 9,509,573
CAPER 10

Fiscal Year Summary – HOME Match5. Excess match carried over to next Federal fiscal year (Line 3 minus Line 4) 254,828,530
Table 5 – Fiscal Year Summary - HOME Match Report
CAPER 11

Match Contribution for the Federal Fiscal YearProject No. or
Other IDDate of
ContributionCash
(non-Federal sources)
Foregone Taxes, Fees,
Charges
Appraised Land/Real Property
Required Infrastructure
Site Preparation, Construction
Materials, Donated labor
Bond Financing
Total Match
Table 6 – Match Contribution for the Federal Fiscal Year
Program Income – Enter the program amounts for the reporting periodBalance on hand at
beginning of reporting period
$
Amount received during reporting period*
$
Total amount expended during reporting period*
$
Amount expended for TBRA
$
Balance on hand at end of reporting period
$
11,932,745 6,183,406 4,481,143 909 13,635,008Table 7 – Program Income
Program Income-only activities are receipted and expended in IDIS concurrently; therefore, the above does not reconcile to IDIS. The Department is currently researching the option of subgranting Program Income in order to facilitate timely reporting. In addition, all of the 4 th quarter Program Income reports have not been entered into IDIS.
CAPER 12

Minority Business Enterprises and Women Business Enterprises – Indicate the number and dollar value of contracts for HOME projects completed during the reporting period
Total Minority Business Enterprises White Non-HispanicAlaskan
Native or American
Indian
Asian or Pacific
Islander
Black Non-Hispanic
Hispanic
ContractsDollar Amount $6,720,476 $0 $3,798 $0 $17,219 $6,699,459Number 22 0 1 0 2 19Sub-ContractsNumber 176 0 4 2 25 145Dollar Amount
$12,708,322 $0 $89,743 $31,799
$1,505,264 $11,081,516
Total Women Business
Enterprises
Male
ContractsDollar Amount $6,720,476 $13,992 $6,706,484Number 22 3 19Sub-ContractsNumber 176 15 161Dollar Amount
$12,708,322 $766,765
$11,941,557
Table 8 – Minority Business and Women Business Enterprises
Minority Owners of Rental Property – Indicate the number of HOME assisted rental property owners and the total amount of HOME funds in these rental properties assisted
Total Minority Property Owners White Non-HispanicAlaskan
Native or American
Indian
Asian or Pacific
Islander
Black Non-Hispanic
Hispanic
NumberDollar Amount
Table 9 – Minority Owners of Rental Property
CAPER 13
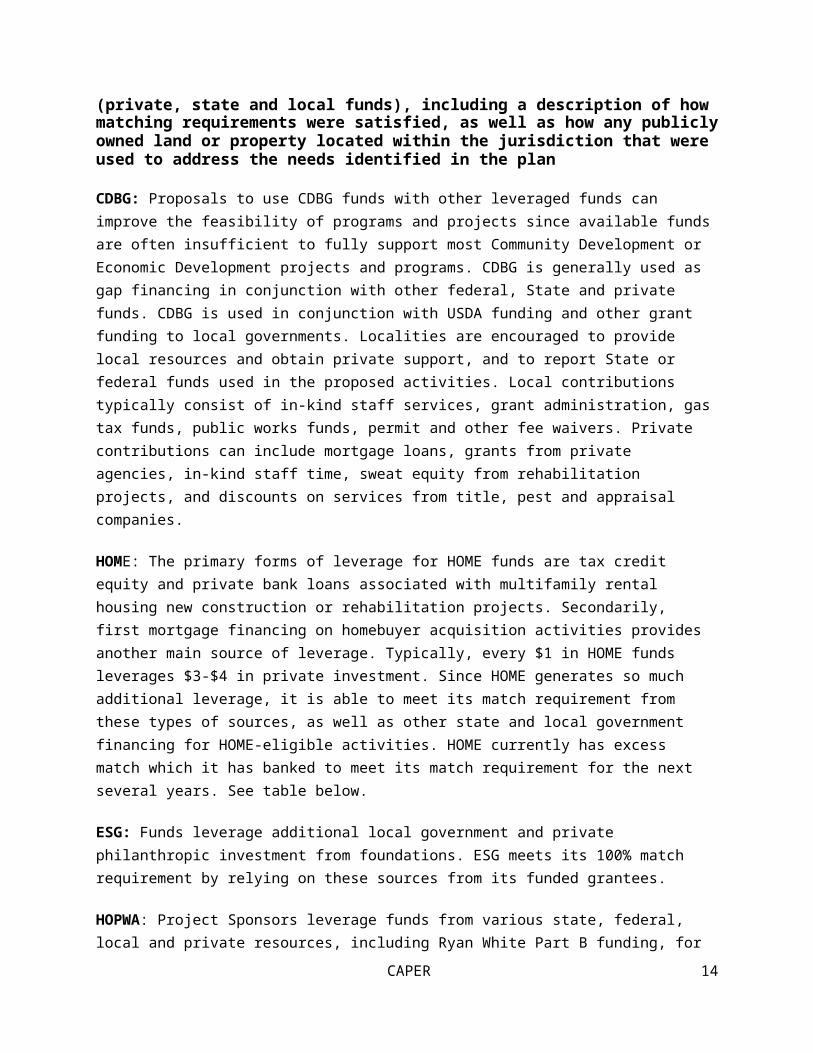
Relocation and Real Property Acquisition – Indicate the number of persons displaced, the cost of relocation payments, the number of parcels acquired, and the cost of acquisitionParcels Acquired 74 $14,632,709Businesses Displaced 0 0Nonprofit Organizations Displaced 0 0Households Temporarily Relocated, not Displaced 12 $43,122
Households Displaced
Total Minority Property Enterprises White Non-HispanicAlaskan
Native or American
Indian
Asian or Pacific
Islander
Black Non-Hispanic
Hispanic
Number 2 0 0 0 1 1Cost $16,671 0 0 0 $5,800 $10,871
Table 10 – Relocation and Real Property Acquisition
CAPER 14

CR-20 - Affordable Housing 91.520(b)Evaluation of the jurisdiction's progress in providing affordable housing, including the number and types of families served, the number of extremely low-income, low-income, moderate-income, and middle-income persons served
One-Year Goal ActualNumber of Homeless households to be provided affordable housing units
2000 3,015
Number of Non-Homeless households to be provided affordable housing units
7000 5416
Number of Special-Needs households to be provided affordable housing units
1050 1,030
Total 10050 9461
Table 11 – Number of Households
One-Year Goal ActualNumber of households supported through Rental Assistance
8000 7144
Number of households supported through The Production of New Units
125 596
Number of households supported through Rehab of Existing Units
779 492
Number of households supported through Acquisition of Existing Units
96 199
Total 9000 8431
Table 12 – Number of Households SupportedDiscuss the difference between goals and outcomes and problems encountered in meeting these goals
Differences between the numbers of households served either by homeless/non-homeless status or by activity-type were marginal, (less than 600 households), given the overall numbers served. The primary reasons for this reduction were declines in homeowner activities, and an overall reduction in the numbers of households receiving homeless prevention assistance over what was projected in the 13-14 Annual Plan. The decline in homeowner activities is expected given market conditions and problems low-income homebuyers continue to have accessing private market resources for this activity. The decline in homeless prevention assistance was expected, given ESG’s increasing focus on providing Rapid-Rehousing assistance, and more targeted use of homeless prevention funds in local communities. Note: The differences in the totals between the two tables above are attributable to the Special Needs Household category being separately counted in Table 11.
CAPER 15

Discuss how these outcomes will impact future annual action plans
No future anticipated impacts at this time.
Include the number of extremely low-income, low-income, and moderate-income persons served by each activity where information on income by family size is required to determine the eligibility of the activity
Number of Persons Served CDBG Actual HOME Actual
Extremely Low-income2,356
7,470
Low-income16,536
1,826
Moderate-income45,352
0
Total64,244
9,296Table 13 – Number of Persons Served
Narrative Information
The numbers above are consistent with the income targeting of each of these program’s primary activities. CDBG’s primary focus is on public facilities/infrastructure, public services, and homeownership, activities which primarily serve low and moderate-income individuals. HOME’s largest share of funds is used for rental housing production, which primarily serves extremely-low and low-income households.
CAPER 16

CR-25 - Homeless and Other Special Needs 91.220(d, e); 91.320(d, e); 91.520(c)Evaluate the jurisdiction’s progress in meeting its specific objectives for reducing and ending homelessness through:
Reaching out to homeless persons (especially unsheltered persons) and assessing their individual needs
The ESG program funds street outreach activities designed to engage unsheltered persons to access housing and basic services. In 2013, 4% of the available State ESG Program funds were awarded to street outreach activities.
Addressing the emergency shelter and transitional housing needs of homeless persons
The ESG program continues to fund a number of emergency shelter and transitional housing programs which provide short and medium-term shelter and supportive services to homeless individuals and families while affordable permanent housing is being sought out. Based on the 2013 ESG funding, emergency shelter and transitional housing programs received 58% of the available funding.
To address homelessness among persons living with HIV/AIDS (PLWHAs), HOPWA funds two transitional housing facilities for homeless PLWHA. In addition, twelve project sponsors provide hotel/motel voucher assistance to clients while they assist them in locating more stable housing. All HOPWA project sponsors work with homeless PLWHA to link them to homeless services within their communities.
Helping homeless persons (especially chronically homeless individuals and families, families with children, veterans and their families, and unaccompanied youth) make the transition to permanent housing and independent living, including shortening the period of time that individuals and families experience homelessness, facilitating access for homeless individuals and families to affordable housing units, and preventing individuals and families who were recently homeless from becoming homeless again
General Population: The ESG program funds rapid re-housing and homelessness prevention programs which provide short and medium-term rental assistance and supportive services to homeless and individuals and families and those at risk of homelessness so that they can access and maintain affordable, suitable housing. In 2013, the State ESG program funded 31% of its awards to various rapid re-housing and homelessness prevention programs. We anticipate increasing demand for Rapid Rehousing; hence the Department will continue to provide a funding set-aside to Rapid Rehousing projects.
Veterans: The State is implementing several different programs designed to assist homeless persons, including chronically homeless individuals and families, families with children, veterans and their
CAPER 17

families, and unaccompanied youth access permanent housing. The proposed design of the new Veterans Housing Bond Program will incentivize developers to partner with Local Continuums of Care, the federal Veterans Administration, and others in developing "low-barrier" housing practices that target supportive housing developed with these funds to persons most in need who are least likely to access and maintain housing on their own.
Families with Children: Recently, the State Department of Social Services was awarded $20 million to provide CalWORKs families with limited-term rental assistance to help them access permanent housing or avoid eviction. See http://www.dss.cahwnet.gov/lettersnotices/EntRes/getinfo/coletters/CalWORKsHousingSupportProgram.pdf.
Helping low-income individuals and families avoid becoming homeless, especially extremely low-income individuals and families and those who are: likely to become homeless after being discharged from publicly funded institutions and systems of care (such as health care facilities, mental health facilities, foster care and other youth facilities, and corrections programs and institutions); and receiving assistance from public or private agencies that address housing, health, social services, employment, education, or youth needs
In addition to the programs discussed above, the following additional programs provide assistance with homelessness prevention activities, particularly for persons leaving publicly-funded institutions and systems of care.
Section 811 Project Rental Assistance (PRA) Program: The PRA program will provide five-year renewable rental assistance to Medicaid beneficiaries ages 18-61 who are exiting Medicaid-funded long-term health care facilities, such as nursing homes and intermediate care facilities, or those who are at risk of returning to these institutions because that lack affordable housing with long-term services and supports. See http://www.calhfa.ca.gov/multifamily/section811/index.htm.
Mental Health Services Act (MHSA) Program: The MHSA Program provides capital financing, including long-term capitalized operating subsidies to develop supportive housing units for persons with severe mental illness. CalHFA administers the capital financing, while local county mental health departments refer tenants to the available housing and coordinate supportive services in partnership with local mental health services organizations. See http://www.calhfa.ca.gov/multifamily/mhsa/index.htm for more information.
HOPWA Program: HOPWA services are restricted to low income PLWHA for the purpose of alleviating or preventing homelessness. Approximately 65% of the clients assisted are at or below 30% of Area Median Income and at risk of homelessness or homeless. Often project sponsors are the first point of contact for PLWHA being discharged from publicly funded institutions and systems of care. HOPWA project sponsors are required to assess the housing and service needs of every eligible HOPWA household as part of the intake process for receiving services. In addition to providing housing services to clients, the project sponsor collaborates with other local HIV/AIDS and mainstream service agencies to link clients to
CAPER 18
other services they need.
CR-30 - Public Housing 91.220(h); 91.320(j)Actions taken to address the needs of public housing
The State does not own or operate public housing. In California, public housing is administered directly through local Public Housing Authorities (PHAs). Pursuant to HUD requirements, public housing authorities are also not eligible to apply for CDBG, HOME, ESG, HOPWA, or LHCP funds directly. However, public housing authorities in eligible jurisdictions can work with eligible applicants to plan for the use of program funds to assist low-income tenants in their communities. PHAs in jurisdictions eligible to apply for federally-funded State programs may seek funds for eligible activities through their city or county application development process.
Actions taken to encourage public housing residents to become more involved in management and participate in homeownership
Since the State does not administer PHA funds, or have any oversight over PHA tenants, it has no actions directed specifically to public housing residents.
Actions taken to provide assistance to troubled PHAs
Since the State does not administer PHA funds, it does not evaluate the status or condition of PHAs.
CR-35 - Other Actions 91.220(j)-(k); 91.320(i)-(j)Actions taken to remove or ameliorate the negative effects of public policies that serve as barriers to affordable housing such as land use controls, tax policies affecting land, zoning ordinances, building codes, fees and charges, growth limitations, and policies affecting the return on residential investment. 91.220 (j); 91.320 (i)
State law requires each city and county to adopt a general plan containing at least seven mandatory elements including housing. Unlike the other general plan elements, the housing element, required to be updated every five to eight years, is subject to detailed statutory requirements and mandatory review by HCD. The housing element has many similar requirements to the federally-mandated ConPlan in that it requires a thorough assessment of housing needs and the adoption of a comprehensive implementation action plan to address those needs.
The housing element contains information about the availability of sites and infrastructure to accommodate new housing needs and requires an analysis of governmental constraints to the production and preservation of housing. Cities and counties are required by housing element law to have land-use plans and regulatory policies which facilitate the development of a range of housing types to meet the needs of all income groups. The housing element which must be developed with public
CAPER 19

input and participation, serves as the basis for land-use and assistance programs to address local, regional and state housing needs.
As of December 31, 2013, for the 4th cycle of housing element updates, 485 of the State's 539 jurisdictions (90 percent) were found to comply with housing element law. Jurisdictions are currently updating the 5th cycle of housing elements. Southern California Association of Governments (SCAG) and Sacramento Area Council of Governments (SACOG) jurisdictions were due October 15, 2013. Currently 78 and 93 percent of jurisdictions within these Councils of Government (COG) are in compliance, respectively. SCAGs compliance is expected to trend significantly higher once zoning amendments are complete to permit emergency shelters pursuant to Chapter 633, Statutes 2007 (SB2). The Department will continue working with jurisdictions including the remaining 295 jurisdictions due in 2014 through early 2016. Due dates by COG for the forthcoming 5th planning period are available on HCDs website at: http://www.hcd.ca.gov/hpd/hrc/plan/he/web_he_duedate.pdf.
Actions taken to address obstacles to meeting underserved needs. 91.220(k); 91.320(j)
In addition to the actions discussed elsewhere in CR 35, the State continues to provide funds to address all of its housing, infrastructure, homelessness, economic development, and public facilities and services goals. In many communities across California, these continue to be underserved needs; hence, the State is also putting additional resources toward meeting these needs. Some special initiatives in FY13-14 included the following.
State and Federally-Funded Drought Assistance: Federal funds awarded for the drought emergency - the Department received four applications for the federal drought NOFAs. The CDBG NOFA for Temporary Subsistence Payments for rent and utilities received two applications, requesting $750,000 (County of San Benito for $500,000 and County of Yolo for $250,000). The HOME Drought Tenant Based Rental Assistance (TBRA) NOFA received two applications (City of Dinuba for $200,000 and County of Yolo for $300,000). All four applications met eligibility thresholds and were awarded on June 30th.
State funds awarded for the drought emergency: La Cooperativa, has begun implementing $9.73 Million of the $10 million state-funded rental assistance program, Drought Housing Rental Subsidies. As of July 3, 2014 (most recent 13-14 year-end report) a total of 191 applicants in 16 counties have been assisted since the program began, with a total of $288,195 committed and $172,450 in funds issued. As of the most recent report for the week of September 18, 2014, 2,614 households have been assisted.
Additionally, State funds we awarded to the HOME Grantees for supplemental administration funding of 4.5% to assist with the costs of running the HOME TBRA program. Of these funds, the City of Dinuba was awarded $9,000.
Veterans Housing Bond: In June voters passed a $600 million bond to provide capital financing for affordable housing projects serving veterans. HCD is currently on a State interagency team to design the program, including providing financing for units targeted to extremely low-income and chronically homeless veterans. Program funds are expected to be awarded over the next several years, with the first Notice of Funding Availability anticipated in January 2015. See www.hcd.ca.gov/fa/vets/ for more information.
CAPER 20

Supportive and Special Needs Housing up to $100 million in State General Funds has been appropriated to HCD's Multifamily housing Program for Supportive Housing and special needs housing.
Migrant Centers: HCD has also received authority to use unallocated Farmworker Housing Program funds to rehabilitate existing Migrant Farmworker Centers.
Manufactured Housing: HCD's CalHOME Program has also made approximately $10 million available on an over-the-counter basis for homeowner purchase or rehabilitation of existing manufactured housing/mobile home units.
Actions taken to reduce lead-based paint hazards. 91.220(k); 91.320(j)
LHCP is designed to work collaboratively with the LHCP network of Community-Based Organizations (CBOs) in the delivery of lead hazard control services to low-income households. Funds are provided to CBOs that statistically have a high number of children with elevated blood/lead levels in their county and the capacity to successfully carry out the goals by meeting and/or exceeding LHCP benchmark goals.
The program’s primary objectives are to: (1) provide lead hazard control services in 2013-2014 to at least 67 pre-1978 housing units occupied by low-income households, targeting households with at least one child under the age of six residing in the residence or visiting frequently; (2) provide lead hazard awareness education; (3) maximize resources by strengthening collaboration with local housing and health departments to increase lead-safe rental opportunities for low-income households, and (4) expand the lead-safe certified workforce in the local communities and develop lasting lead-safe training resources. In FY 13-14, LHCP provided assistance to 26 renter households, and 11 homeowner households, totaling 833,175
Actions taken to reduce the number of poverty-level families. 91.220(k); 91.320(j)
The CDBG program, with its Economic Development activities, has job creation/retention requirements when direct funding is provided to a for-profit business that is not a Microenterprise business. Those jobs must be open to low/moderate-income individuals and at least 51% of the available jobs must be filled by low/moderate-income individuals. To meet this requirement, the Department encourages CDBG jurisdictions to partner with local organizations that are providing job training to provide referrals for job applicants. Jurisdictions may also formally require Business Assistance loan recipients to use job training program referrals. In this way persons on unemployment and / or in job training programs have access to jobs created from CDBG funding.
Actions taken to develop institutional structure. 91.220(k); 91.320(j)
California continues to pursue opportunities in all four goal areas identified by the 2013 SAMHSA-sponsored Policy Academy to Reduce Chronic Homelessness.
Goal 1: Increasing access to mainstream resources, taking full advantage of opportunities under the Affordable Care Act and through the expansion of MediCal. In consultation with external experts and
CAPER 21

practitioners, HCD and the State Department of Health Care Services (DHCS) created and distributed “Let’s Get Everyone Covered!” a comprehensive tool kit to assist counties, supportive housing and service providers in enrolling persons experiencing homelessness in MediCal and managed care plans. http://www.hcd.ca.gov/LetsGetEveryoneCovered.pdf. HCD and DHCS are currently planning a convening for the State’s MediCal Managed Care directors in October on health and housing needs and solutions for persons experiencing long term homelessness with. Finally, a joint application to HUD for Section 811 Round Two Project Rental Assistance (PRA) Demonstration funds was made targeting non-elderly disabled persons leaving long term institutions or experiencing long term homelessness in Los Angeles.
Goal 2: Increasing access to permanent supportive housing (PSH) in the existing inventory for persons experiencing chronic homelessness and Goal 3: Designing new State PSH programs and approaches In FY 13-14, $50 million in new funding was allocated for new PSH through the MHP-SH program and $600 million was reallocated to the new Veterans Housing and Homelessness Prevention Program (VHHP). Proposed new features in VHHP include strengthening targeting to the most vulnerable subset of persons experiencing homelessness and geographically to areas with the highest number of veterans experiencing homelessness and housing instability, providing operating subsidies to reach zero-income households, requiring housing first practices in funded housing, and increased services planning. The NOFA is planned for January 2015. In addition, efforts are underway to change HCD’s Uniform Multifamily Regulations to provide more flexibility in project budgets to allow case management costs as a project operating cost when serving a targeted population, thereby increasing a project’s ability to access additional needed subsidy. The California Tax Credit Allocation Committee (TCAC) has also amended its regulations to enable all projects applying through the Special Needs housing set-aside to access State tax credits, even if they are not located in a Difficult to Develop Area. As a result, TCAC has seen an increase in the number of projects proposing to serve special needs populations.
Goal 4: Supporting the redesign of local crisis response systems. Allocated to the State Department of Social Services (DSS), $20 million in general fund will be administered by County welfare offices for rapid re-housing and prevention of families receiving CalWORKS assistance. To inform with best practices, the California Welfare Directors Association hosted a technical assistance webinar in July with the National Alliance to End Homelessness and HCD. With assistance from HUD’s technical assistance grant, the State ESG program is increasing its focus on HEARTH outcomes, including shortening stays in homeless shelters and facilitating quicker exits to permanent housing through rapid re-housing strategies. Some changes are planned for 2014 with greater shifts planned in 2015. Continuum of Care agencies were surveyed on current capacities and activities, and other state practices were also inventoried. Finally, multiple state agencies are working with the California Child Welfare Council to improve housing strategies and programs for families in reunification, with a housing convening planned for October 6, 2014.
CAPER 22

Actions taken to enhance coordination between public and private housing and social service agencies. 91.220(k); 91.320(j)
The Department continues to implement the Section 811 PRA Program in collaboration with the State Department of Health Care Services (DHCS), California Department of Developmental Services (DDS), California Housing Finance Agency (CalHFA), and TCAC. The program will provide project-based rental assistance to affordable housing projects to serve persons ages 18-61 exiting MediCal funded long-term care facilities, such as nursing homes, as well as persons at-risk of returning to these settings due to loss of housing with long-term services and supports. NOFA was released on August 1. For more information see: http://www.calhfa.ca.gov/multifamily/section811/index.htm. As part of this effort, in FY 13-14 the Department began participating in in DHCS Long Term Services and Supports Advisory Committee to help DHCS housing locators better understand how to access affordable housing resources for their program consumers, and to improve housing options for low-income persons with disabilities
CalHFA's Mental Health Services Act program aims to enhance coordination between housing providers and providers of mental health services through the development of PSH serving persons with mental health disabilities. Although most of the MHSA housing funds have been allocated, the Counties of LA and Alameda transferred additional MHSA funding in FY 2012/2013. The Counties of San Diego, San Bernardino, Riverside, Shasta and LA hope to provide additional MHSA funds for housing through their Proposition 63 funds.
HCD also continues to participate in several interagency committees related to Smart Growth and increasing transit-oriented developments, infill housing, and other housing options to reduce the environmental impacts of commuting.
CAPER 23

DPH/OA continues to collaborate with HCD through its involvement in the State’s Consolidated Plan and reporting processes. In addition, DPH/OA regularly coordinates with the Department of Health Care Services (DHCS) regarding MediCal and the Affordable Care Act, mental health services for persons living with HIV/AIDS, the AIDS MediCal Waiver Program, and the HIV testing component of the Substance Abuse Prevention and Treatment (SAPT) Block Grant. DPH/OA also works with Stanford University as part of the National Medical Monitoring Project.
During FY 13-14 DPH/OA selected new Community Planning Group (CPG) members and convened a two-day member orientation to acquaint CPG members and DPH/OA staff, discuss CPG’s function, the 2014 work plan, the state of the HIV epidemic in California and how DPH/OA efforts address the epidemic, including the prevention of homelessness through the HOPWA program. Members of CPG include both voting and consulting members representing substance abuse, mental health, housing, and other local service provider entities.
Of the 27 HOPWA project sponsors, 93% participate in their local Ryan White Part B HIV/AIDS Advisory or Planning Group, and 81% actively participate in their local Continuum of Care planning group or homeless task force/coalition to ensure the HIV/AIDS community is represented. All project sponsors provide case management services to clients, which include linkages to other agencies, enhancing collaborative relationships with other government and private service agencies.
Identify actions taken to overcome the effects of any impediments identified in the jurisdictions analysis of impediments to fair housing choice. 91.520(a)
HCD continues to take actions to overcome identified impediments to fair housing pursuant to our Analysis of Impediments to Fair Housing (AI) completed in 2012. See the AI Implementation Status Report in the attachments to the CAPER, located at: http://www.hcd.ca.gov/hpd/hrc/rep/fed//
CR-40 - Monitoring 91.220 and 91.230Description of the standards and procedures used to monitor activities carried out in furtherance of the plan and used to ensure long-term compliance with requirements of the programs involved, including minority business outreach and the comprehensive planning requirements
CDBG administers the CDBG program, the Neighborhood Stabilization Program (NSP), the Disaster Recovery Initiative (DRI), and the DRI addendum program Disaster Recovery Enhancement Fund (DREF).The Monitoring Unit procedures cover all levels of federal and programmatic compliance, including federal overlays and program income. CDBG uses a risk assessment tool comprised of various risk factors such as the number of open CDBG contracts each jurisdiction has with the State, the total number of activities within all open CDBG contracts, expenditure of program income, A-133 Single Audit findings or non-submission, program income waiver activities, and assessments from program staff or management. The jurisdictions that rank the highest using the risk assessment tool, are the ones that
CAPER 24

are monitored within that monitoring year, as time and staffing permit. For each jurisdiction to be monitored, the Department determines which contracts the jurisdiction has that will be added to the monitoring. Once a monitoring is completed, for FY 2013/2014, the Department began a pilot program of including a conference call with the jurisdiction to also get their input into the determination of corrective actions to be included in Monitoring Reports and implemented before Monitoring Clearance Letters are sent. In addition, the Monitoring Unit is responsible for working with jurisdictions and program staff to clear State CDBG-related A-133 Audit findings. Each Planning and Technical Assistance (PTA) grant receives a desk monitoring prior to grant closeout. Grantees document citizen participation, equal opportunity and procurement, and submit a final written report or study by the end of the grant term. During FY 2013/2014, the Department completed 11 monitoring reviews representing 20 contracts, based on risk assessment results. Contracts monitored included NSP, Community Development Block Grant – Recovery (CDBG-R), CDBG Community Development and Economic Development activities and program income.
HOME: HOME does four primary types of types of monitoring for its funded activities. (1) Close-out monitoring is done for all-funded activities to assess overall compliance with the requirements of the HOME Regulations and Standard Agreement. In FY 12-13 HOME performed eight (8) close-out monitoring reviews for program activities. Eight monitorings were also was done for our completed rental and FTHB projects (done within 12 months of project completion). (2) CHDO Project Long-Term Monitoring is done by the State on rental and homebuyer projects involving CHDOs. On these projects, HCD holds the Note and Deed of Trust. The purpose of this monitoring is to assess ongoing compliance with HOME rent and occupancy requirements, fair housing requirements, and the ongoing physical and financial condition of the project. As part of this assessment, annual review of project rents, operating budgets, and financial statements is performed to check compliance with project rent and operating requirements pursuant to the Department’s Uniform Multifamily Regulations and 24 CFR 92.252. Annual Affirmative Marketing Reports and 5-year Affirmative Marketing Plans are also reviewed. Site visits to assess compliance with HOME income limits income verification requirements, rent restrictions and federal Housing Quality Standards are also performed. (UPCS standards will be used in 2015 as required.) Site visits are performed pursuant to the requirements set forth in 92.504 (d). In FY 13-14, 78 site visits were performed on CHDO loans. This is 100 % of our required monitoring. (3) State Recipient Long-Term Monitoring is an assessment of performance of the above monitoring activities by local jurisdictions. HOME State Recipients are the lenders for rental and homebuyer new construction and rehabilitation projects where they have applied directly to the State for HOME funds, rather than the CHDO being the recipient of the funds. An office review consists of an Annual Monitoring Report questionnaire and Project Compliance Report, which asks about project financial condition and compliance with other federal HOME requirements, a copy of the project’s utility allowance schedule (form HUD-52667); a copy of the State Recipient’s last long term monitoring Summary Letter and Clearance Letter to the project’s owner/manager, a copy of Physical Conditions report, and a copy of the project’s Annual Affirmative Marketing Analysis Report. In FY 13-14, 192 assessments of State Recipient monitoring activities were performed. Following from these assessments, HCD staff monitors individual projects directly, where risk assessment of individual project compliance with HOME requirements indicates that these projects should receive a site-visit from HCD staff. In FY 13-14 Nine (9) of these site
CAPER 25

visits by HCD staff were done. A total of 169 site visits were performed by State recipients. More information regarding the results of all HOME project site visits, whether done by HCD or State Recipient staff, is discussed in CR 50 and the accompanying attachment. (4) Specific Federal Overlay Compliance Reviews are also done throughout the year. Particular areas of emphasis include Davis-Bacon and Environmental Compliance. In FY 13-14 eight site visits or desk reviews were performed for Davis-Bacon compliance. Eight reviews of State Recipient rental new construction or rehabilitation Environmental Assessments were conducted in conjunction with close-out monitoring. MBE/WBE and Section 3 goals assessment and outreach activities monitored as part of our grantee Annual Performance Reports. See the Annual Performance Report Form at: http://www.hcd.ca.gov/fa/home/fiscalindex.html for more information.
ESG: The ESG program monitors subgrantee performance primarily through desk monitoring of financial expenditures to ensure that requests for ESG funds comply with the HUD ESG expenditure guide. Other federal requirements are also monitored including, but not limited to, Written Standards requirements and participation in HMIS.
LHCP: Monitoring performance standards for LHCP are evaluated on a quarterly basis taking into account the number of inspections, units completed, units referred from local housing/health agencies, and expenditures as proposed by quarter and compared to the actual completed. In addition, the timeliness of fiscal and programmatic reports, quality of programmatic reports, results of on-site monitoring, results of Lead Hazard Control Program inspections, and timeliness to resolve performance deficiencies will be monitored. Continued periodic field visits to supervise work activities, training and technical assistance, on-site visits, and desk reviews are utilized to ensure program contractual compliance. When the Lead Hazard Control Program requires subcontracting activities, we are to follow State procurement procedures, which includes the open and fair competitive bidding process and using minority owned businesses. This is also part of monitoring standards and procedures.
HOPWA Project sponsors are required to submit annual applications to DPH/OA, which include a program implementation plan describing community planning and collaboration efforts and anticipated goals, and a budget detail of activities to be provided. When selecting new project sponsors, DPH/OA will include outreach to minority businesses, faith-based, and grass roots organizations in the Request for Application process.
Monitoring activities include both onsite compliance monitoring visits and desk monitoring through review and analysis of Progress Reports and invoice back-up details, and webinars and telephonic technical assistance with project sponsors. CDPH/OA has developed monitoring procedures and tools based on the HUD Monitoring Handbook for HOPWA. A periodic project sponsor risk analysis is completed, which rates project sponsor performance in descending order, from highest to lowest risk. During FY 2013-13, project sponsors with the highest risk scores were monitored.
Citizen Participation Plan 91.105(d); 91.115(d)
Description of the efforts to provide citizens with reasonable notice and an opportunity to
CAPER 26

comment on performance reports
Pursuant to 24 CFR Part 91, citizen participation requirements for States, the State provides adequate notice at the opening of the 15 day comment period and the public hearing on the CAPER. The notice is provided by wide distribution (including but not limited to county planning departments, depository libraries, distribution through electronic mailing lists of the affected federal programs, and posting on HCD’s website). Copies of the CAPER Public Notices are included with the CAPER at: http://www.hcd.ca.gov/hpd/hrc/rep/fed/.
In addition to comments received through public hearings, the State will accept public comments in any form convenient to the public, including through written responses, facsimile, and e-mail. The State will consider all comments and views received in writing or orally at public hearings in preparing the CAPER. A summary of all comments received on the 2013-14 CAPER and the State's responses are included below.
CAPER Comments Received
Below is a summary of comments received on the Draft CAPER by Self-Help Enterprises, (SHE) along with the Department’s responses. A copy of the full comment letter from SHE has been provided to HUD along with the Department’s CAPER submission.
Summary Comment #1: The Department should discontinue awarding HOME Application rating points to development projects sited outside of areas of minority concentration pursuant to the State’s Analysis of Impediments (AI) Recommendation 8-3. Projects in communities that have a high concentration of minorities compared to the county as a whole will not be able to receive these points. This disadvantages low-income minority populations, such as farmworkers, who often live in these communities.
Response: Pursuant to the State’s obligation to Affirmatively Further Fair Housing as a recipient of HUD funds, Recommendation 8-3 was instituted to provide some incentive to rental and homebuyer project developers to site projects, where possible, outside of areas of minority concentration so that low-income minority households might have a range of affordable housing options both within and outside of areas of minority concentration.
In offering these points, the Department is not excluding projects located in areas of minority concentration from receiving HOME funds. Since the Department began awarding these points in 2012, of the 12 projects that have received HOME funds to date, seven of the funded projects (58%) are located in areas of minority concentration, and as such did not receive these points
Minority concentration data for completed projects published with the FY 13-14 CAPER shows that although HOME’s funded activities are predominately located outside of minority concentration (60%),
CAPER 27

the majority of these activities are homeowner activities. Similarly, 56% of the completed rental projects (9 of 16) were located in areas of minority concentration.
HOME data for both awarded rental and homebuyer projects and completed activities continue to indicate a need to take modest steps to provide incentives to developers to provide housing opportunities outside of areas of minority concentration. Other factors such as HOME’s Community Need rating points and the CHDO and Rural Area set-asides will continue to ensure that projects within areas of minority concentration also receive HOME funds.
Summary Comment #2: AI Recommendation 8-3 (discussed above) is in direct conflict with Impediment #9 of the AI which identifies underserving minorities as an impediment to affirmatively furthering fair housing. Awarding points to projects located outside of areas of minority concentration will decrease the number of minorities served by the HOME Program.
Response: As stated above, HOME continues to fund many activities within areas of minority concentration. Since the projects awarded points for being sited outside of areas of minority concentration have not yet completed construction, (awards made in 2012 and 2013), HOME does not yet have race/ethnicity data for these projects; however, one cannot assume that just because these projects are located outside of areas of minority concentration that no non-Whites or Hispanics will be residing in these properties.
The minority concentration standard used by HOME compares the percentage of minorities, (persons who are non-White or Hispanic) in the project census tract to the percentage of minorities in the project county. If the census tract minority percentage exceeds the county minority percentage by more than 10%, that project census tract is considered to have an overconcentration of minorities. This does not mean, however, that the project county itself does not have a high concentration of minorities.
Our FY 2013-14 completed projects data indicates that among the seven rental projects that were sited in census tracts that were not minority concentrated, the percentages of minorities in these counties as a whole ranged from 21% - 84%, with the majority of these counties having minority percentages above 45%. Race and ethnicity data for these recently completed projects, shows that four of them have high numbers of Hispanics. Hence, one cannot assume that just because a project is in a census tract that is not minority concentrated, that the project will not be serving minorities.
Summary Comment #3
The Department should permit rental projects proposing use of 9% Low-Income Housing Tax Credits to receive HOME funds. Rental projects located in lower-rent/lower-income areas cannot support any debt service. Being restricted to use of 4% tax credits with only HOME funds makes many deals in these areas infeasible, is contrary to the objective of HOME to foster and maintain affordable housing, and is a public policy barrier to the development of affordable housing in these areas.
Response
CAPER 28

Although the Department understands the advantages of using 9% tax credits over 4%, the Department disagrees that its current prohibition on use of 9% credits in HOME deals is preventing projects from being developed in lower-rent/ lower income rural areas. The program is still oversubscribed in these areas, indicating that rural projects can still be feasible with 4% tax credits and $4-4.5 million in HOME funds. Until the State HOME Program can ensure that it can meet its HUD commitment and expenditure deadlines with 9% projects, it will continue to put HOME resources into projects which are nearly certain to secure a 4% tax credit/bond commitment soon after the HOME award, and be completed in a timely manner.
CR-45 - CDBG 91.520(c)Specify the nature of, and reasons for, any changes in the jurisdiction’s program objectives and indications of how the jurisdiction would change its programs as a result of its experiences
The Department continues to improve processes and procedures to bring the program into alignment with its current objectives and CDBG statute and regulation. As is stated in federal statute, the local jurisdictions know best what their greatest needs are and the Department objective is to facilitate CDBG funding to meet those needs in manner consistent and compliant with CDBG statute and regulation. Overall, the State’s local jurisdictions tend to focus on housing, public infrastructure and public services. There are a handful of jurisdictions with robust economic development programs, which are focal in their utilization of CDBG funding.
In FY 2013, the program updated its State Objective points to give additional priority to potable water infrastructure and homeownership assistance. These objectives were set due to the fact that some of the state’s main infrastructure is at least 100 years old, and the Department’s AI showed that it needs to try to encourage more homeownership opportunities for minorities. These changes resulted in 36% of funding for FY 13 being awarded for potable water projects. The homeownership assistance efforts are still challenging since access to first mortgage credit is still very difficult. CDBG continued with these same State Objective issue areas in the 2014 NOFA, given the importance of these two issues.
Does this Jurisdiction have any open Brownfields Economic Development Initiative (BEDI) grants?
No
[BEDI grantees] Describe accomplishments and program outcomes during the last year.
CR-50 - HOME 91.520(d)Include the results of on-site inspections of affordable rental housing assisted under the program to determine compliance with housing codes and other applicable regulations
Please list those projects that should have been inspected on-site this program year based upon the schedule in §92.504(d). Indicate which of these were inspected and a summary of issues that were
CAPER 29

detected during the inspection. For those that were not inspected, please indicate the reason and how you will remedy the situation.
All projects for which an inspection was required were inspected. See CAPER Attachment: “HOME Monitoring Data”, for this information.
Provide an assessment of the jurisdiction's affirmative marketing actions for HOME units. 92.351(b)
New construction and rehabilitation rental project activities: For these activities, the State uses the HUD Affirmative Marketing Form 935.2A to evaluate a project owner’s 5-year affirmative marketing plan. The form is evaluated prior to loan closing. In addition, projects must submit an annual reporting form similar to the 935.2A which requires owners to annually assess the effectiveness of their affirmative marketing efforts. For HOME FTHB, OOR, and TBRA activities, HOME Recipients must complete a Demographic Analysis Form which requires them to examine the racial, ethnic, gender, age, and disability Census characteristics of the HOME jurisdiction compared to the program’s applicants, beneficiaries, rejected and wait-listed heads of household. If under-or-over-representation by more than 10% exists, the jurisdiction must describe and implement actions to correct this imbalance. HOME uses these tools to monitor local activity demographics for imbalances of protected classes, and to engage property managers and local program operators in discussions about ways to address identified imbalances. Over time, these imbalances are corrected or alleviated through targeted marketing in the local community See: http://www.hcd.ca.gov/hpd/hrc/rep/fed/AffirmativeMktgProg.htm for copies of the forms.
Understanding of the importance of affirmative marketing and the barriers to program participation due to race, ethnicity, gender, age, or disability status has increased through the use of these tools, and through information provided identifying particular barriers to accessing assistance such as inconsistent program funding levels, poor consumer credit, hesitancy to take on additional homeownership debt, and higher incomes among certain groups versus others.
Refer to IDIS reports to describe the amount and use of program income for projects, including the number of projects and owner and tenant characteristics
Total Program Income available for 2013-2014 was $18,116,151. This includes a beginning balance of $11,932,745, and $6,183,406 in Program Income and Recaptured funds received ($1,175,222 received by HCD and $5,008,184 received by HOME State Recipients). Out of the $1,175,222 received by HCD, HCD encumbered and disbursed $829,650 through existing contracts during 2013-2014 and retained $117,522 for administration.
HOME State Recipients received $5,008,184 in Program Income as follows: 1) Program Income $3,478,463 and 2) Recaptured Funds $1,529,721. State Recipients expended $3,196,658 to provide affordable housing during 2013-14 and $337,313 was expended for administrative costs.
CAPER 30

Compiled data to date shows that the majority of PI project beneficiaries for FY 13-14 are non-Hispanic White homeowners in elderly or related two-parent households, (OOR and FTHB activities), earning between 30-50% and 61-80% of median. The majority of units funded were 2 and 3-bedrooms, and most household sizes ranged from 1-4 person households. Note that the number of rental projects funded with PI is typically lower due to lower amounts of PI available at any given time, not enough to completely fund a rental project and not often enough to fund the few rental projects underway at any given time.
The information above is the accomplishments for projects funded only from Program Income and no grant funds. We have entered 80% of these household demographics funded by Program Income in IDIS and this is reflected in the data from PR23 for the FY 2013/2014. The remaining 20% of the demographic information derived from Program Income will be reflected in the 2014/2015 CAPER.
Describe other actions taken to foster and maintain affordable housing. 91.220(k) (STATES ONLY: Including the coordination of LIHTC with the development of affordable housing). 91.320(j)
HCD’s rental housing production programs continue to consult with the California Tax Credit Allocation Committee on jointly-funded projects. Other current efforts to foster and maintain affordable housing were previously discussed in CR 35. In addition, given the size and scope of housing and community development needs in California, a review of each program’s obstacles to meeting the State’s affordable housing needs occurs each year after a funding round has been completed and prior to the beginning of the next one. Each program seeks to further refine its method of distribution when necessary to adjust to changing markets and economic conditions in the state.
CR-55 - HOPWA 91.520(e)Identify the number of individuals assisted and the types of assistance provided
Table for report on the one-year goals for the number of households provided housing through the use of HOPWA activities for: short-term rent, mortgage, and utility assistance payments to prevent homelessness of the individual or family; tenant-based rental assistance; and units provided in housing facilities developed, leased, or operated with HOPWA funds.
Number of Households Served Through: One-Year Goal Actual
Short-term rent, mortgage, and utility assistance to prevent homelessness of the individual or family 900 887
CAPER 31

Tenant-based rental assistance 100 79
Units provided in permanent housing facilities developed, leased, or operated with HOPWA funds 0 0
Units provided in transitional short-term housing facilities developed, leased, or operated with HOPWA funds 130 68
Total 1,130 1,037
Table 14 – HOPWA Number of Households Served
Narrative
CAPER 32

CR-60 - ESG 91.520(g) (ESG Recipients only)ESG Supplement to the CAPER in e-snaps
For Paperwork Reduction Act
1. Recipient Information—All Recipients CompleteBasic Grant Information
Recipient Name CALIFORNIAOrganizational DUNS Number 021225490EIN/TIN Number 680303547Identify the Field Office SAN FRANCISCOIdentify CoC(s) in which the recipient or subrecipient(s) will provide ESG assistance
Daly/San Mateo County CoCMarin County CoCOakland/Alameda CoCSanta Rosa/Petaluma/Sonoma County CoCRichmond/Contra Costa CoCSalinas/Monterey CoCWatsonville/Santa Cruz City and County CoCVisalia/Kings/Tulare CoCFresno/Madera CoCNevada/Placer CoCDavis/Woodland/Yolo CoCHumboldt CoCYuba City, Marysville/Sutter, Yuba Counties CoCEl Dorado CoCLos Angeles City and County CoCSan Buenaventura/Ventura County CoCRiverside City and County CoCTuolumne/Calaveras/Amador Counties CoCNapa City and County CoCSanta Maria/ Santa Barbara County CoCSan Diego City And County CoCSanta Ana/Anaheim/Orange County CoCChico/Paradise/Butte County CoCDos Rios CoC
CAPER 33

ESG Contact Name Prefix Mrs.First Name CoralMiddle NameLast Name GainesSuffixTitle Program Manager
ESG Contact AddressStreet Address 1 2020 W. El CaminoStreet Address 2City SacramentoState CAZIP Code 95833Phone Number 916-263-2734ExtensionFax NumberEmail Address [email protected]
ESG Secondary ContactPrefix Mrs.First Name RebeccaLast Name MattSuffixTitle Section ChiefPhone Number 916-263-2736ExtensionEmail Address [email protected]
2. Reporting Period—All Recipients Complete
Program Year Start Date 07/01/2013Program Year End Date 06/30/2014
CAPER 34

3. Subrecipient Form – Complete one form for each subrecipient
Subrecipient or Contractor Name: Davis Community MealsCity: DavisState: CAZip Code: 95617, 2463DUNS Number: 942574690Is subrecipient a victim services provider: NSubrecipient Organization Type: Other Non-Profit OrganizationESG Subgrant or Contract Award Amount: 62750
Subrecipient or Contractor Name: North County Solutions For Change, Inc.City: VistaState: CAZip Code: 92083, 3565DUNS Number: 861222136Is subrecipient a victim services provider: NSubrecipient Organization Type: Other Non-Profit OrganizationESG Subgrant or Contract Award Amount: 344018
Subrecipient or Contractor Name: Building Futures For Women With ChildrenCity: San LeandroState: CAZip Code: 94577, 5103DUNS Number: 788170355Is subrecipient a victim services provider: NSubrecipient Organization Type: Other Non-Profit OrganizationESG Subgrant or Contract Award Amount: 150000
Subrecipient or Contractor Name: Domestic Violence Solutions For Santa Barbara CountyCity: Santa BarbaraState: CAZip Code: 93102, 1536DUNS Number: 131252488Is subrecipient a victim services provider: YSubrecipient Organization Type: Other Non-Profit OrganizationESG Subgrant or Contract Award Amount: 237578
CAPER 35

Subrecipient or Contractor Name: Good Samaritan ShelterCity: LompocState: CAZip Code: 93436, 5830DUNS Number: 023282457Is subrecipient a victim services provider: NSubrecipient Organization Type: Other Non-Profit OrganizationESG Subgrant or Contract Award Amount: 230000
Subrecipient or Contractor Name: Interfaith Shelter Network, Inc.City: Santa RosaState: CAZip Code: 95405, 6959DUNS Number: 040172400Is subrecipient a victim services provider: NSubrecipient Organization Type: Other Non-Profit OrganizationESG Subgrant or Contract Award Amount: 972596
Subrecipient or Contractor Name: Spare-a-DimeCity: SusanvilleState: CAZip Code: 96130, 4708DUNS Number: 001107403Is subrecipient a victim services provider: NSubrecipient Organization Type: Other Non-Profit OrganizationESG Subgrant or Contract Award Amount: 132000
Subrecipient or Contractor Name: Women’s Crisis Shelter in Southern HumboldtCity: GarbervilleState: CAZip Code: 95542, 0642DUNS Number: 932533441Is subrecipient a victim services provider: YSubrecipient Organization Type: Other Non-Profit OrganizationESG Subgrant or Contract Award Amount: 132000
CAPER 36

Subrecipient or Contractor Name: Arcata HouseCity: ArcataState: CAZip Code: 95521, 5502DUNS Number: 011854150Is subrecipient a victim services provider: NSubrecipient Organization Type: Other Non-Profit OrganizationESG Subgrant or Contract Award Amount: 235000
Subrecipient or Contractor Name: Foothill House of HospitalityCity: Grass ValleyState: CAZip Code: 95945, 6704DUNS Number: 006461814Is subrecipient a victim services provider: NSubrecipient Organization Type: Other Non-Profit OrganizationESG Subgrant or Contract Award Amount: 510000
Subrecipient or Contractor Name: United Christian Centers, of the Greater Sacramento AreaCity: West SacramentoState: CAZip Code: 95605, 2748DUNS Number: 098869621Is subrecipient a victim services provider: NSubrecipient Organization Type: Other Non-Profit OrganizationESG Subgrant or Contract Award Amount: 134688
Subrecipient or Contractor Name: Transition HouseCity: Santa BarbaraState: CAZip Code: 93101, 1662DUNS Number: 930390448Is subrecipient a victim services provider: NSubrecipient Organization Type: Other Non-Profit OrganizationESG Subgrant or Contract Award Amount: 436231
CAPER 37

Subrecipient or Contractor Name: Homeward Bound of MarinCity: NovatoState: CAZip Code: 94949, 8276DUNS Number: 949337059Is subrecipient a victim services provider: NSubrecipient Organization Type: Other Non-Profit OrganizationESG Subgrant or Contract Award Amount: 226250
Subrecipient or Contractor Name: Homeless Services CenterCity: Santa CruzState: CAZip Code: 95065, 1201DUNS Number: 879989929Is subrecipient a victim services provider: NSubrecipient Organization Type: Other Non-Profit OrganizationESG Subgrant or Contract Award Amount: 765750
Subrecipient or Contractor Name: Ford Street ProjectCity: UkiahState: CAZip Code: 95482, 4011DUNS Number: 186275194Is subrecipient a victim services provider: NSubrecipient Organization Type: Other Non-Profit OrganizationESG Subgrant or Contract Award Amount: 105000
Subrecipient or Contractor Name: Placer Women’s Center, Inc.City: AuburnState: CAZip Code: 95604, 5462DUNS Number: 165959859Is subrecipient a victim services provider: YSubrecipient Organization Type: Other Non-Profit OrganizationESG Subgrant or Contract Award Amount: 129618
CAPER 38
Subrecipient or Contractor Name: The Lazarus Project, Inc.City: RosevilleState: CAZip Code: 95678, 8241DUNS Number: 066805925Is subrecipient a victim services provider: NSubrecipient Organization Type: Other Non-Profit OrganizationESG Subgrant or Contract Award Amount: 97653
Subrecipient or Contractor Name: Many Mansions, A California Nonprofit CorporationCity: Thousand OaksState: CAZip Code: 91362, 6221DUNS Number: 168672236Is subrecipient a victim services provider: NSubrecipient Organization Type: Other Non-Profit OrganizationESG Subgrant or Contract Award Amount: 125308
Subrecipient or Contractor Name: The Center for Violence-free RelationshipsCity: PlacervilleState: CAZip Code: 95667, 3971DUNS Number: 808730469Is subrecipient a victim services provider: YSubrecipient Organization Type: Other Non-Profit OrganizationESG Subgrant or Contract Award Amount: 35000
Subrecipient or Contractor Name: SHELTER, Inc. of Contra Costa CountyCity: MartinezState: CAZip Code: 94553, 4219DUNS Number: 625691985Is subrecipient a victim services provider: NSubrecipient Organization Type: Other Non-Profit OrganizationESG Subgrant or Contract Award Amount: 434523
CAPER 39

Subrecipient or Contractor Name: Catholic Charities of the Diocese of Santa RosaCity: Santa RosaState: CAZip Code: 95403, 2048DUNS Number: 965907962Is subrecipient a victim services provider: NSubrecipient Organization Type: Other Non-Profit OrganizationESG Subgrant or Contract Award Amount: 954000
Subrecipient or Contractor Name: Whittier Area First Day CoalitionCity: WhittierState: CAZip Code: 90602, 1017DUNS Number: 033691531Is subrecipient a victim services provider: NSubrecipient Organization Type: Other Non-Profit OrganizationESG Subgrant or Contract Award Amount: 132000
Subrecipient or Contractor Name: Catholic Charities, of San DiegoCity: San DiegoState: CAZip Code: 92101, 3112DUNS Number: 056747561Is subrecipient a victim services provider: NSubrecipient Organization Type: Other Non-Profit OrganizationESG Subgrant or Contract Award Amount: 394000
Subrecipient or Contractor Name: Mountain Crisis Services, Inc.City: MariposaState: CAZip Code: 95338, 2075DUNS Number: 942067794Is subrecipient a victim services provider: YSubrecipient Organization Type: Other Non-Profit OrganizationESG Subgrant or Contract Award Amount: 145367
CAPER 40

Subrecipient or Contractor Name: Ocean Park Community CenterCity: Santa MonicaState: CAZip Code: 90404, 2715DUNS Number: 084337922Is subrecipient a victim services provider: NSubrecipient Organization Type: Other Non-Profit OrganizationESG Subgrant or Contract Award Amount: 93850
Subrecipient or Contractor Name: Champions Recovery Alternatives Program, Inc.City: HanfordState: CAZip Code: 93230, 3814DUNS Number: 033707519Is subrecipient a victim services provider: NSubrecipient Organization Type: Other Non-Profit OrganizationESG Subgrant or Contract Award Amount: 130000
Subrecipient or Contractor Name: Amador-Tuolumne Community Action Agency City: JacksonState: CAZip Code: 95642, 2673DUNS Number: 105920748Is subrecipient a victim services provider: NSubrecipient Organization Type: Other Non-Profit OrganizationESG Subgrant or Contract Award Amount: 339394
Subrecipient or Contractor Name: 1736 Family Crisis CenterCity: Los AngelesState: CAZip Code: 90018, 1353DUNS Number: 618216519Is subrecipient a victim services provider: NSubrecipient Organization Type: Other Non-Profit OrganizationESG Subgrant or Contract Award Amount: 284250
CAPER 41

Subrecipient or Contractor Name: The Salvation Army, A California CorporationCity: WatsonvilleState: CAZip Code: 95076, 5027DUNS Number: 074629460Is subrecipient a victim services provider: NSubrecipient Organization Type: Other Non-Profit OrganizationESG Subgrant or Contract Award Amount: 132000
Subrecipient or Contractor Name: Redwood Community Action AgencyCity: EurekaState: CAZip Code: 95501, 1829DUNS Number: 120803853Is subrecipient a victim services provider: NSubrecipient Organization Type: Other Non-Profit OrganizationESG Subgrant or Contract Award Amount: 111782
Subrecipient or Contractor Name: Sierra County Child Abuse CouncilCity: LoyaltonState: CAZip Code: 96118, 1016DUNS Number: 827619073Is subrecipient a victim services provider: NSubrecipient Organization Type: Other Non-Profit OrganizationESG Subgrant or Contract Award Amount: 128000
Subrecipient or Contractor Name: Kings Community Action OrganizationCity: HanfordState: CAZip Code: 93230, 3608DUNS Number: 095635413Is subrecipient a victim services provider: NSubrecipient Organization Type: Other Non-Profit OrganizationESG Subgrant or Contract Award Amount: 132000
CAPER 42

Subrecipient or Contractor Name: Community Action of Napa ValleyCity: NapaState: CAZip Code: 94559, 3155DUNS Number: 119843340Is subrecipient a victim services provider: NSubrecipient Organization Type: Other Non-Profit OrganizationESG Subgrant or Contract Award Amount: 502358
Subrecipient or Contractor Name: High Dessert Homeless Services, Inc.City: VictorvilleState: CAZip Code: 92392, 2493DUNS Number: 938252913Is subrecipient a victim services provider: NSubrecipient Organization Type: Other Non-Profit OrganizationESG Subgrant or Contract Award Amount: 132000
Subrecipient or Contractor Name: Community Overcoming Relationship AbuseCity: BurlingameState: CAZip Code: 94011, 4245DUNS Number: 015862386Is subrecipient a victim services provider: YSubrecipient Organization Type: Other Non-Profit OrganizationESG Subgrant or Contract Award Amount: 432000
Subrecipient or Contractor Name: Glenn County Human Resources AgencyCity: WillowsState: CAZip Code: 95988, 3115DUNS Number: 797375367Is subrecipient a victim services provider: NSubrecipient Organization Type: Unit of GovernmentESG Subgrant or Contract Award Amount: 283786
CAPER 43

Subrecipient or Contractor Name: Community Action Partnership of Sonoma CountyCity: Santa RosaState: CAZip Code: 95401, 7112DUNS Number: 078769312Is subrecipient a victim services provider: NSubrecipient Organization Type: Other Non-Profit OrganizationESG Subgrant or Contract Award Amount: 132000
Subrecipient or Contractor Name: Carrillo Counseling Services, Inc.City: Santa BarbaraState: CAZip Code: 93101, 7439DUNS Number: 071310010Is subrecipient a victim services provider: NSubrecipient Organization Type: Other Non-Profit OrganizationESG Subgrant or Contract Award Amount: 198358
Subrecipient or Contractor Name: Plumas Crisis Intervention and Resource CenterCity: QuincyState: CAZip Code: 95971, 9143DUNS Number: 003377715Is subrecipient a victim services provider: NSubrecipient Organization Type: Other Non-Profit OrganizationESG Subgrant or Contract Award Amount: 380000
Subrecipient or Contractor Name: The Salvation ArmyCity: Grass ValleyState: CAZip Code: 95945, 5509DUNS Number: 074629460Is subrecipient a victim services provider: NSubrecipient Organization Type: Other Non-Profit OrganizationESG Subgrant or Contract Award Amount: 354129
CAPER 44

Subrecipient or Contractor Name: Fullerton Interfaith Emergency ServicesCity: FullertonState: CAZip Code: 92834, 6326DUNS Number: 555890946Is subrecipient a victim services provider: NSubrecipient Organization Type: Other Non-Profit OrganizationESG Subgrant or Contract Award Amount: 371100
Subrecipient or Contractor Name: Samaritan HouseCity: San MateoState: CAZip Code: 94403, 4666DUNS Number: 884486341Is subrecipient a victim services provider: NSubrecipient Organization Type: Other Non-Profit OrganizationESG Subgrant or Contract Award Amount: 407897
Subrecipient or Contractor Name: Shelter Outreach PlusCity: SalinasState: CAZip Code: 93906, 4024DUNS Number: 165368010Is subrecipient a victim services provider: NSubrecipient Organization Type: Other Non-Profit OrganizationESG Subgrant or Contract Award Amount: 50000
Subrecipient or Contractor Name: Antelope Valley Domestic Violence CouncilCity: LancasterState: CAZip Code: 93539, 2980DUNS Number: 849371117Is subrecipient a victim services provider: NSubrecipient Organization Type: Other Non-Profit OrganizationESG Subgrant or Contract Award Amount: 122327
CAPER 45

Subrecipient or Contractor Name: Community Action Board of Santa Cruz County, Inc.City: WatsonvilleState: CAZip Code: 95076, 4639DUNS Number: 039080585Is subrecipient a victim services provider: NSubrecipient Organization Type: Other Non-Profit OrganizationESG Subgrant or Contract Award Amount: 150000
Subrecipient or Contractor Name: Families in Transition of Santa Cruz County, Inc.City: WatsonvilleState: CAZip Code: 95076, 4623DUNS Number: 883845265Is subrecipient a victim services provider: NSubrecipient Organization Type: Other Non-Profit OrganizationESG Subgrant or Contract Award Amount: 150000
Subrecipient or Contractor Name: Ritter CenterCity: San RafaelState: CAZip Code: 94912, 3517DUNS Number: 052949815Is subrecipient a victim services provider: NSubrecipient Organization Type: Other Non-Profit OrganizationESG Subgrant or Contract Award Amount: 380000
Subrecipient or Contractor Name: The Gathering InnCity: RosevilleState: CAZip Code: 95678, 0297DUNS Number: 189981918Is subrecipient a victim services provider: NSubrecipient Organization Type: Other Non-Profit OrganizationESG Subgrant or Contract Award Amount: 330325
CAPER 46

Subrecipient or Contractor Name: Family Emergency Shelter CoalitionCity: HaywardState: CAZip Code: 94541, 2166DUNS Number: 800768269Is subrecipient a victim services provider: NSubrecipient Organization Type: Other Non-Profit OrganizationESG Subgrant or Contract Award Amount: 227250
Subrecipient or Contractor Name: Live Violence FreeCity: South Lake TahoeState: CAZip Code: 96150, 7804DUNS Number: 123543811Is subrecipient a victim services provider: NSubrecipient Organization Type: Other Non-Profit OrganizationESG Subgrant or Contract Award Amount: 224545
Subrecipient or Contractor Name: The Salvation Army, a California CorporationCity: MarysvilleState: CAZip Code: 95901, 5629DUNS Number: 074629460Is subrecipient a victim services provider: NSubrecipient Organization Type: Other Non-Profit OrganizationESG Subgrant or Contract Award Amount: 677915
Subrecipient or Contractor Name: Roseville Home Start, Inc.City: RosevilleState: CAZip Code: 95678, 3124DUNS Number: 801955261Is subrecipient a victim services provider: NSubrecipient Organization Type: Other Non-Profit OrganizationESG Subgrant or Contract Award Amount: 230000
CAPER 47
Subrecipient or Contractor Name: Upward Bound HouseCity: Santa MonicaState: CAZip Code: 90403, 4119DUNS Number: 969224260Is subrecipient a victim services provider: NSubrecipient Organization Type: Other Non-Profit OrganizationESG Subgrant or Contract Award Amount: 230000
Subrecipient or Contractor Name: Alternatives to ViolenceCity: Red BluffState: CAZip Code: 96080, 0135DUNS Number: 932055726Is subrecipient a victim services provider: YSubrecipient Organization Type: Other Non-Profit OrganizationESG Subgrant or Contract Award Amount: 167250
Subrecipient or Contractor Name: Westside Domestic Violence ShelterCity: OrlandState: CAZip Code: 95963, 0642DUNS Number: 830358144Is subrecipient a victim services provider: NSubrecipient Organization Type: Other Non-Profit OrganizationESG Subgrant or Contract Award Amount: 150000
Subrecipient or Contractor Name: Family Resource Center of TruckeeCity: TruckeeState: CAZip Code: 96161, 4953DUNS Number: 122591253Is subrecipient a victim services provider: NSubrecipient Organization Type: Other Non-Profit OrganizationESG Subgrant or Contract Award Amount: 198500
CAPER 48

Subrecipient or Contractor Name: Committee in the ShelterlessCity: PetalumaState: CAZip Code: 94953, 2744DUNS Number: 960253235Is subrecipient a victim services provider: NSubrecipient Organization Type: Other Non-Profit OrganizationESG Subgrant or Contract Award Amount: 397250
Subrecipient or Contractor Name: Yolo Wayfarer Center (Christian Mission)City: WoodlandState: CAZip Code: 95776, 1248DUNS Number: 184667079Is subrecipient a victim services provider: NSubrecipient Organization Type: Other Non-Profit OrganizationESG Subgrant or Contract Award Amount: 334500
Subrecipient or Contractor Name: Yolo Family Resource CenterCity: WoodlandState: CAZip Code: 95695, 3517DUNS Number: 131047263Is subrecipient a victim services provider: NSubrecipient Organization Type: Other Non-Profit OrganizationESG Subgrant or Contract Award Amount: 230000
Subrecipient or Contractor Name: Center for Domestic PeaceCity: San RafaelState: CAZip Code: 94901, 3923DUNS Number: 057382079Is subrecipient a victim services provider: NSubrecipient Organization Type: Other Non-Profit OrganizationESG Subgrant or Contract Award Amount: 167250
CAPER 49

Subrecipient or Contractor Name: The Salvation ArmyCity: HanfordState: CAZip Code: 93230, 4010DUNS Number: 074629460Is subrecipient a victim services provider: NSubrecipient Organization Type: Other Non-Profit OrganizationESG Subgrant or Contract Award Amount: 230000
Subrecipient or Contractor Name: Central California Family Crisis CenterCity: PortervilleState: CAZip Code: 93257, 2355DUNS Number: 173267618Is subrecipient a victim services provider: NSubrecipient Organization Type: Other Non-Profit OrganizationESG Subgrant or Contract Award Amount: 150000
Subrecipient or Contractor Name: InnVision Shelter NetworkCity: BurlingameState: CAZip Code: 94010, 4044DUNS Number: 792738726Is subrecipient a victim services provider: NSubrecipient Organization Type: Other Non-Profit OrganizationESG Subgrant or Contract Award Amount: 796784
Subrecipient or Contractor Name: The Salvation ArmyCity: VenturaState: CAZip Code: 93001, 2703DUNS Number: 074629460Is subrecipient a victim services provider: NSubrecipient Organization Type: Other Non-Profit OrganizationESG Subgrant or Contract Award Amount: 362000
CAPER 50

Subrecipient or Contractor Name: Turning Point of Central CaliforniaCity: VisaliaState: CAZip Code: 93290, 7447DUNS Number: 151096419Is subrecipient a victim services provider: NSubrecipient Organization Type: Other Non-Profit OrganizationESG Subgrant or Contract Award Amount: 79875
Subrecipient or Contractor Name: Chico Community Shelter PartnershipCity: ChicoState: CAZip Code: 95928, 4402DUNS Number: 104645630Is subrecipient a victim services provider: NSubrecipient Organization Type: Other Non-Profit OrganizationESG Subgrant or Contract Award Amount: 299250
Subrecipient or Contractor Name: Ruby’s PlaceCity: HaywardState: CAZip Code: 94541, 4202DUNS Number: 114432776Is subrecipient a victim services provider: NSubrecipient Organization Type: Other Non-Profit OrganizationESG Subgrant or Contract Award Amount: 165000
Subrecipient or Contractor Name: Stand Up Placer, Inc.City: AuburnState: CAZip Code: 95604, 5462DUNS Number: 165959859Is subrecipient a victim services provider: YSubrecipient Organization Type: Other Non-Profit OrganizationESG Subgrant or Contract Award Amount: 167250
CAPER 51

Subrecipient or Contractor Name: Community Action Agency of Butte County, Inc.City: ChicoState: CAZip Code: 95973, 9530DUNS Number: 147541270Is subrecipient a victim services provider: NSubrecipient Organization Type: Other Non-Profit OrganizationESG Subgrant or Contract Award Amount: 300000
Subrecipient or Contractor Name: Community Resource CenterCity: Encinitas State: CAZip Code: 92024DUNS Number: 193789690Is subrecipient a victim services provider: NoSubrecipient Organization Type: Other Non-Profit OrganizationESG Subgrant or Contract Award Amount: 520500
Subrecipient or Contractor Name: Cornerstone Community Development CorporationCity: San LeandroState: CAZip Code: 94577DUNS Number: 788170355Is subrecipient a victim services provider: NoSubrecipient Organization Type: Other Non-Profit OrganizationESG Subgrant or Contract Award Amount: 447478
Subrecipient or Contractor Name: Foothill Family Shelter, Inc.City: UplandState: CAZip Code: 91786DUNS Number: 838582179Is subrecipient a victim services provider: NoSubrecipient Organization Type: Other Non-Profit OrganizationESG Subgrant or Contract Award Amount: 100000
CAPER 52

Subrecipient or Contractor Name: Interval HouseCity: Huntington Beach & WestminsterState: CAZip Code: 92647 & 92683DUNS Number: 113510176Is subrecipient a victim services provider: NoSubrecipient Organization Type: Other Non-Profit OrganizationESG Subgrant or Contract Award Amount: 512000
Subrecipient or Contractor Name: Martha’s Village & Kitchen, Inc.City: IndioState: CAZip Code: 113510176DUNS Number: 123443157 Is subrecipient a victim services provider: NoSubrecipient Organization Type: Other Non-Profit OrganizationESG Subgrant or Contract Award Amount: 362000
Subrecipient or Contractor Name: The Homeless Coalition of San Benito CountyCity: HollisterState: CAZip Code: 95024DUNS Number: 933317591Is subrecipient a victim services provider: NoSubrecipient Organization Type: Other Non-Profit OrganizationESG Subgrant or Contract Award Amount: 219000
Subrecipient or Contractor Name: The Salvation ArmyCity: Santa BarbaraState: CAZip Code: 93101DUNS Number: 074629460Is subrecipient a victim services provider: NoSubrecipient Organization Type: Other Non-Profit OrganizationESG Subgrant or Contract Award Amount: 152250
CAPER 53
Subrecipient or Contractor Name: Turning Point FoundationCity: VenturaState: CAZip Code: 93001DUNS Number: 608847216Is subrecipient a victim services provider: NoSubrecipient Organization Type: Other Non-Profit OrganizationESG Subgrant or Contract Award Amount: 197760
CAPER 54

CR-65 - Persons Assisted4. Persons Served
4a. Complete for Homelessness Prevention Activities
Number of Persons in Households
Total
Adults 1,583
Children1,296
Don't Know/Refused/Other1
Missing Information0
Total2,880
Table 15 – Household Information for Homeless Prevention Activities
4b. Complete for Rapid Re-Housing Activities
Number of Persons in Households
Total
Adults1,932
Children1,004
Don't Know/Refused/Other0
Missing Information0
Total2,936
Table 16 – Household Information for Rapid Re-Housing Activities
CAPER 55

4c. Complete for Shelter
Number of Persons in Households
Total
Adults9,728
Children3,515
Don't Know/Refused/Other6
Missing Information4
Total13,253
Table 17 – Shelter Information
4d. Street Outreach
Number of Persons in Households
Total
Adults2,912
Children48
Don't Know/Refused/Other484
Missing Information1
Total3,445
Table 18 – Household Information for Street Outreach
4e. Totals for all Persons Served with ESG
Number of Persons in Households
Total
Adults16,155
Children5,863
Don't Know/Refused/Other491
Missing Information5
Total22,514
Table 19 – Household Information for Persons Served with ESG
CAPER 56

5. Gender—Complete for All Activities
Total
Male10,992
Female10,968
Transgender22
Don't Know/Refused/Other426
Missing Information0
Total22,408
Table 20 - Gender Information
CAPER 57

6. Age—Complete for All Activities
Total
Under 185,873
18-242,527
25 and over13,124
Don't Know/Refused/Other718
Missing Information242
Total22,484
Table 21 – Age Information
7. Special Populations Served—Complete for All Activities
Number of Persons in HouseholdsSubpopulation Total
Persons Served –
Prevention
Total Persons Served –
RRH
Total Persons
Served in Emergency
Shelters
Total
Veterans 822 68 183 1179Victims of Domestic Violence 3810 322 499 6,441Elderly 555 119 213 1,008HIV/AIDS 118 9 13 140Chronically Homeless 2,793 0 588 4,735Persons with Disabilities:Severely Mentally Ill 2,727 215 396 3,475Chronic Substance Abuse 3,588 123 459 4,311Other Disability 4,307 443 658 5,568Total (Unduplicated if possible) 7,411 761 1,907 11,765
Table 22 – Special Population Served
CAPER 58

7. Special Populations Served Cont.
Subpopulation Total Persons Served –Street Outreach
Veterans 106Victims of Domestic Violence 1810Elderly 121HIV/AIDS 0Chronically Homeless 1354Severely Mentally Ill 137Chronic Substance Abuse 141Other Disability 160Total (unduplicated if possible) 1686
*Street Outreach data is included in total above.
CAPER 59

CR-70 – ESG 91.520(g) - Assistance Provided and Outcomes10. Shelter Utilization
Number of New Units - Rehabbed0
Number of New Units - Conversion0
Total Number of bed-nights available998,182
Total Number of bed-nights provided770,795
Capacity Utilization77.22%
Table 23 – Shelter Capacity
11. Project Outcomes Data measured under the performance standards developed in consultation with the CoC(s)
Outcomes for Homelessness Prevention Activities
# of At-Risk Individuals
# of At-Risk Households
At-Risk who obtain/retain employment: 681 416At-Risk who obtain/retain other income (e.g. SSI, TANF, or General Assistance): 759 531
Outcomes for Rapid Re-housing Activities
# of Homeless Individuals
# of Homeless Households
Homeless who will exit and obtain Permanent Housing: 1854 851
Homeless who will exit and obtain/retain employment: 778 532
Homeless who will exit and obtain/retain other income (e.g. SSI, TANF, or General Assistance): 944 561
CAPER 60

Outcomes for Emergency Shelter Activities (NOT including Transitional Housing and Day Centers)
Homeless Individuals who have exited this Emergency Shelter and moved into Permanent Housing: 2790
Homeless Individuals who have exited this Emergency Shelter and moved into Transitional Housing: 1423
Homeless Adults who exited and obtained/retained employment: 1319Homeless Adults who exited and obtained/retained other income (e.g. SSI, TANF, or General Assistance): 2816
Homeless Adults who exited and stabilized a mental illness or chemical addiction for a minimum of 30 days: 2152
Outcomes for Transitional Housing Activities
Homeless Individuals who have exited this Transitional Housing and moved into Permanent Housing: 1082
Homeless Individuals who have exited this Transitional Housing and moved into Emergency Shelter: 117
Homeless Adults who exited and obtained/retained employment: 311Homeless Adults who exited and obtained/retained other income (e.g. SSI, TANF, or General Assistance): 456
Homeless Adults who exited and stabilized a mental illness or chemical addiction for a minimum of 90 days: 337
Outcomes for Day Center Activities
Homeless Individuals who have exited this Day Center and moved into Permanent Housing: 200
Homeless Individuals who have exited this Day Center and moved into Emergency Shelter: 1856
Homeless Individuals who have exited this Day Center and moved into Transitional Housing: 53
Homeless Adults who exited and obtained/retained employment: 161Homeless Adults who exited and obtained/retained other income (e.g. SSI, TANF, or General Assistance): 89
Homeless Adults who exited and stabilized a mental illness or chemical addiction for a minimum of 30 days: 170
CAPER 61

Outcomes for Street Outreach Activities
Homeless Individuals who will move into Permanent Housing: 95Homeless Individuals who will move into Emergency Shelter: 213Homeless Individuals who will move into Transitional Housing: 43Homeless Adults who will obtain/retain employment: 73Homeless Adults who will obtain/retain other income (e.g. SSI, TANF, or General Assistance): 87
Homeless Adults who have stabilized a mental illness or chemical addiction for a minimum of 30 days: 23
CAPER 62

CR-75 – Expenditures11. Expenditures
11a. ESG Expenditures for Homelessness Prevention
Dollar Amount of Expenditures in Program YearFY 2011 FY 2012 FY 2013
Expenditures for Rental Assistance 0 236,240 952,072Expenditures for Housing Relocation and Stabilization Services - Financial Assistance 0 74,344 230,234Expenditures for Housing Relocation & Stabilization Services - Services 0 198,741 717,092Expenditures for Homeless Prevention under Emergency Shelter Grants Program 83,071 335,360 0Subtotal Homelessness Prevention 83,071 844,685 1,899,398
Table 24 – ESG Expenditures for Homelessness Prevention
11b. ESG Expenditures for Rapid Re-Housing
Dollar Amount of Expenditures in Program YearFY 2011 FY 2012 FY 2013
Expenditures for Rental Assistance 0 235,290 905,736Expenditures for Housing Relocation and Stabilization Services - Financial Assistance 0 202,145 769,193Expenditures for Housing Relocation & Stabilization Services - Services 0 384,550 809,727Expenditures for Homeless Assistance under Emergency Shelter Grants Program 1,840,106 3,282,718 0Subtotal Rapid Re-Housing 1,840,106 4,104,703 2,484,656
Table 25 – ESG Expenditures for Rapid Re-Housing
11c. ESG Expenditures for Emergency Shelter
Dollar Amount of Expenditures in Program YearFY 2011 FY 2012 FY 2013
Essential Services 0 65,648 3,461,711Operations 0 136,434 3,105,313Renovation 0 0 0Major Rehab 0 0 0Conversion 0 0 0Subtotal 0 202,082 6,567,024
Table 26 – ESG Expenditures for Emergency Shelter
CAPER 63

11d. Other Grant Expenditures
Dollar Amount of Expenditures in Program YearFY 2011 FY 2012 FY 2013
Street Outreach 0 110,955 583,416HMIS 0 41,269 193,187Administration 0 73,803 183,813
Table 27 - Other Grant Expenditures
11e. Total ESG Grant FundsTotal ESG Funds
ExpendedFY 2011 FY 2012 FY 2013
19,212,168 1,923,177 5,377,497 11,911,494
Table 28 - Total ESG Funds Expended
11f. Match Source
FY 2011 FY 2012 FY 2013Other Non-ESG HUD Funds 1,371,763 3,055,888 1,638,863Other Federal Funds 896,883 2,468,747 3,983,579State Government 1,115,905 2,026,875 3,441,048Local Government 1,812,857 3,924,688 5,267,474Private Funds 5,346,264 7,856,170 6,705,713Other 733,202 3,310,853 3,691,887Fees 80,360 213,084 922,235Program Income 403,772 428,732 233,943Total Match Amount 11,761,006 23,285,037 25,884,742
Table 29 - Other Funds Expended on Eligible ESG Activities
11g. Total
Total Amount of Funds Expended on ESG
Activities
FY 2011 FY 2012 FY 2013
80,142,953 13,684,183 28,662,534 37,796,236
Table 30 - Total Amount of Funds Expended on ESG Activities
CAPER 64