Embed Size (px)
Citation preview
Helsinki-Tallinn Transport Link
Feasibility Study – Final report

Table of Contents1. Executive Summary ................................................................................................6
1.1. Technical concept .........................................................................................................................6
1.2. Cost estimation ............................................................................................................................ 7
1.3. Estimation of demand ................................................................................................................. 7
1.4. Cost-benefit analysis ..................................................................................................................8
1.5. Economic Impacts of FinEst Link ................................................................................................8
1.6. Wider economic impacts .............................................................................................................9
1.7. Planning objectives ......................................................................................................................9
1.8. Strategic positioning ..................................................................................................................10
2. Introduction ...........................................................................................................12
3. Ferry Traffic Solution 0+ ...................................................................................... 143.1. Past Development .......................................................................................................................14
3.2. Recent Traffic Patterns ..............................................................................................................14
3.2.1. Vessel Traffic ...................................................................................................................14
3.3. Other Routes between Finland and Estonia ............................................................................15
3.4. 0+ Option ....................................................................................................................................15
3.4.1. General ...........................................................................................................................15
3.4.2. Traffic Investments in Ports ..........................................................................................16
3.4.3. 0+ Current Facilities ......................................................................................................16
3.4.4. 0+ Cargo to Vuosaari and Muuga ...............................................................................17
3.4.5. 0+ All Ferry Traffic to Vuosaari and Muuga ................................................................17
3.4.6. 0+ Other Ports ...............................................................................................................18
3.4.7. 0+ Modern Technologies ..............................................................................................18
3.5. 0+ Summary and Conclusions ..................................................................................................18
4. Geology ..................................................................................................................194.1. Readings ..................................................................................................................................... 22
5. Fixed Link Tunnel Solution .................................................................................... 235.1. Tunnel Concept........................................................................................................................... 23
5.2. Alignment Study ........................................................................................................................ 27
5.3. Maintenance and operation .....................................................................................................31

6. Tunnel safety management .................................................................................. 33
7. Train operation concept ........................................................................................357.1. Volume Estimations ....................................................................................................................35
7.1.1. Passenger Volume Estimations ......................................................................................35
7.2. Passenger train traffic ..............................................................................................................40
7.3. Car & truck shuttles and conventional freight trains ...............................................................41
7.4. Terminals and depots ...............................................................................................................43
8. Strategic Environmental Assessment ..................................................................44
9. Economic and Financial Feasibility Study ............................................................479.1. Infrastructure investment cost estimation ...............................................................................47
9.2. Operation and maintenance cost ............................................................................................48
10. Cost – benefit analysis .......................................................................................4910.1. Investment and Maintenance .................................................................................................49
10.2. Consumer Surplus, Passenger Transport ..............................................................................50
10.3. Producers Surplus, Passenger Transport ...............................................................................51
10.4. Cargo Transport .......................................................................................................................51
10.5. Externalities..............................................................................................................................52
10.6. Sensitivity Analysis ...................................................................................................................53
11. Wider Impact Analysis .........................................................................................5511.1. Framework and Methods .........................................................................................................55
11.2. Assumptions of Economic and Demographic Developments .............................................57
11.3. Agglomeration Impacts ...........................................................................................................58
11.4. Competition Impacts ................................................................................................................62
11.5. Summary of Wider Impact Analysis .......................................................................................63
11.6. Sensitivity Analysis ....................................................................................................................64
11.7. Economic Land Use Impacts ....................................................................................................64
11.8. Effects of Construction on Employment .................................................................................65
11.9. Visions on the Cross-Border Integration and Structural Changes .....................................66
12. Risk Management ................................................................................................68
13. Benchmarking .....................................................................................................7013.1. Technical benchmarking ..........................................................................................................70
13.2. Economical benchmarking ..................................................................................................... 73
13.3. Benchmarking conclusions and issues to consider ..............................................................75

14. New technologies ................................................................................................7614.1. General ...................................................................................................................................... 76
14.2. Evaluation of the proposals .................................................................................................... 78
14.3. Conclusion ................................................................................................................................82
15. Financing model evaluation ................................................................................8315.1. Alternative Project Contract And Ainancing Models .............................................................83
15.2. Alternative Risk Allocation Models .........................................................................................85
15.3. Issues To Consider Regarding Financial Structure ..............................................................86
16. Financial modelling .............................................................................................8816.1. Financial modelling assumptions ............................................................................................88
16.2. Financial modelling results .....................................................................................................90
16.3. Financial modelling conclusions .............................................................................................95
16.4. Conclusions for Benchmarking and Financial Analysis ........................................................95
17. Conclusions ..........................................................................................................9717.1. Towards the next phase of FinEst Link ....................................................................................97
17.2. Emerging innovations ..............................................................................................................97
17.3. SWOT analysis ..........................................................................................................................98
18. Annex ...................................................................................................................99
Publication of Helsinki-Uusimaa Regional Council C 84 – 2018Helsinki 2018ISBN 978-952-448-494-7ISSN 2342-1363

5
Foreword
Urban agglomeration is a fast growing global phenomenon, which underlines the im-portance of transport and international accessibility of cities and regions. For Helsinki- Uusimaa region, the connection towards south to Tallinn is particularly important for commuting, business, freight transport and tourism. In this development scenario the vision of Helsinki-Tallinn railway tunnel and Rail Baltica enable altogether new growth potential. A railway connection through the Baltic States to Central Europe links the mar-ket areas of Estonia and Southern Finland together and creates regional economic bene-fits to both countries. The railway tunnel would enable mobility of workers and tourists as well as freight, investments and business between the two capitals and in their catchment area reaching the Continental Europe. The fixed link would strengthen the international accessibility of both capitals remarkably.
The concept of an undersea railway tunnel, as studied in the FinEst Link project, con-nects Helsinki-Vantaa airport and Ülemiste airport in Tallinn where it connects to Rail Baltica and onwards to the Central and Eastern European railway network. The railway tunnel decreases the travel time of passengers and freight between Helsinki and Tallinn from two hours to 30 minutes.
The railway tunnel brings the change of gauge between the European (1435 mm) and Finnish (1524 mm) railway networks to Helsinki-Vantaa airport. At the airport’s mul-timodal travel centre and at stations in Pasila and Helsinki city centre, passengers are connected to the local and long distance railway network including the planned Airport Rail Line. The rail freight terminal and depot locate north of the airport and offer inter-modal services and connections to the road and rail networks. In Tallinn, the railway tunnel connects in passenger transport to Rail Baltica at Ülemiste airport which has a tram connection to the city centre. In freight transport the railway tunnel connects to the logistics service areas in Tallinn which include the freight terminal of Rail Baltica, Muuga Harbour and a connection to the road network.
This final report and the forthcoming sub reports of the FinEst Link project summarise the results of the technical and economic feasibility study of Helsinki-Tallinn railway tunnel. Based on various alternatives of a fixed link, the feasibility study presents prelim-inary technical and operation plans, which serve in the following phases of the project including general planning and environmental impact assessment.
The methods used in the impact assessment of transport infrastructure projects are facing new challenges. There is an increasing need to understand how infrastructure in-vestments affect the transport system as a whole and steer land use development in urban areas and how they contribute to economic development and competitiveness of regions.
Merja Vikman-Kanerva Director of Land Use Planning, Helsinki-Uusimaa Regional Council
Chair of the Steering Group, FinEst Link Project

6
1. Executive Summary 1.1. Technical concept
The technical concept of FinEst Link is based on a 1435 mm gauge railway tunnel with two rail tunnels and a service tunnel. The concept includes two artificial islands (Uppolu-oto, Tallinnamadal). The stations are located in Helsinki city centre, Pasila and Helsin-ki-Vantaa airport for passengers, and there is a freight terminal area close to the airport with connection to the Finnish railway network (1524 mm gauge). In Tallinn, there is a passenger station at Ülemiste in Tallinn and a freight terminal near the airport. A connec-tion to Rail Baltica is provided for passengers and freight.
1435 mm ca. 35 m ca. 35 m 1435 mm
Ø 10 mØ 10 m Ø 8 m

7
1.2. Cost estimationThe cost estimation of the railway tunnel between Helsinki and Tallinn including railways (European gauge), terminals and stations is 13–20 billion euros. The wide gap between the minimum and maximum cost estimation is due to the lack of infor-mation of planning details of the fixed link and its technical concept. The cost esti-mation is based on information of costs in Finnish, Estonian and other large interna-tional transport projects. In international benchmarking, FinEst Link appears cheap-er per kilometer which is due to the lower costs of boring in the Finnish conditions.
1.3. Estimation of demandThe demand in passenger transport in different scenarios is as follows:
• 9 million (in 2017)
• 14 million (in 2050 scenario without tunnel)
• 23 million (in 2050 scenario with tunnel) of which 12,5 million passengers in tunnel and 10,5 million on ferries
Maritime transport and daily commuting between Helsinki and Tallinn continue to grow also if the rail tunnel service will be built. This is due to the overall growth of the Helsin-ki-Tallinn twin city daily commuting and transport volumes.
The demand in freight transport in different scenarios is as follows:
• 3,8 million tons (in 2017)
• 7 million (in 2050 scenario without tunnel)
• 8 million (in 2050 scenario with tunnel) of which 4 million tons in tunnel and 4 mil-lion on ferries; freight in the tunnel represents value/ton above the average.
8
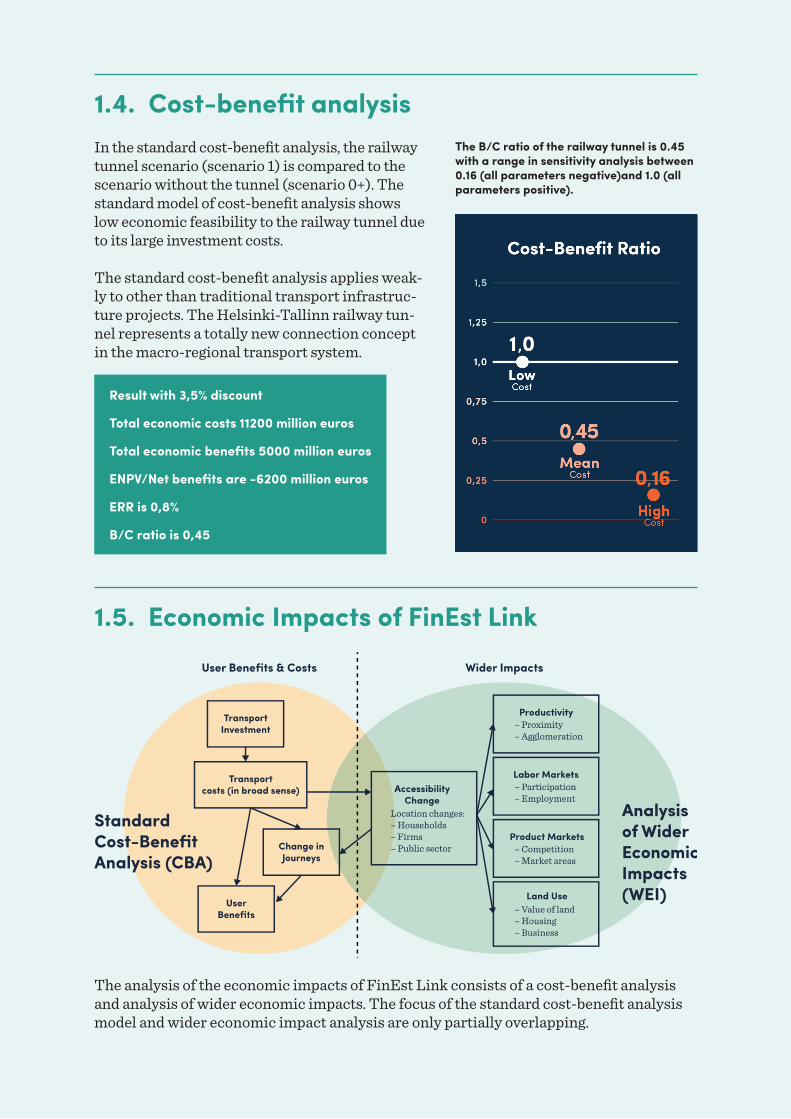
1.4. Cost-benefit analysisIn the standard cost-benefit analysis, the railway tunnel scenario (scenario 1) is compared to the scenario without the tunnel (scenario 0+). The standard model of cost-benefit analysis shows low economic feasibility to the railway tunnel due to its large investment costs.
The standard cost-benefit analysis applies weak-ly to other than traditional transport infrastruc-ture projects. The Helsinki- Tallinn railway tun-nel represents a totally new connection concept in the macro- regional transport system.
1.5. Economic Impacts of FinEst Link
The analysis of the economic impacts of FinEst Link consists of a cost-benefit analysis and analysis of wider economic impacts. The focus of the standard cost-benefit analysis model and wider economic impact analysis are only partially overlapping.
Result with 3,5% discount
Total economic costs 11200 million euros
Total economic benefits 5000 million euros
ENPV/Net benefits are -6200 million euros
ERR is 0,8%
B/C ratio is 0,45
The B/C ratio of the railway tunnel is 0.45 with a range in sensitivity analysis between 0.16 (all parameters negative)and 1.0 (all parameters positive).

9
The analysis of the wider economic impacts focuses on the overall impetus that a new transport connection has on the economy and regional development on agglomeration, la-bour mobility, productivity and land use. The methodology, however, on long-term struc-tural changes in the economy is lacking an internationally acknowledged model, which remains a challenge for further research.
1.6. Wider economic impactsThe study on wider economic impacts focuses on the growth of the national economies of Finland and Estonia and on macro-regional development. The wider economic impacts to GDP in total range between +4000 (low scenario) and +6900 (base scenario). The agglomeration impacts, including price of land, form the most important positive factor. Other factors include labour supply, work relocation and competition. The wider eco-nomic impacts extend widely into both countries.
1.7. Planning objectivesThe FinEst Link was given six planning objectives each with a specific set of Key Per-formance Indicators. The project succeeded in meeting all six planning objectives. The following list states the parameters for each KPI:
1. Improvement of the travel service to facilitate daily commuting between Helsinki and Tallinn.
– travel time ca. 30 min – Passenger trains with frequency of 20 min in peak hours; car and truck shuttle
trains – Ticket price 18 €/single trips, 480 €/30-days ticket, 70 €/car, 450 €/truck
2. Smooth travel chains and integration with transport systems.
– Integration with the Finnish rail network, possibly including the Airport Rail Line and Arctic Rail, and the Estonian rail network including Rail Baltica.
– Integration with airports and with public transport systems in both cities.
3. More effective freight transport chains. KPIs:
– Price, frequency, reliability and delivery time enable multimodal and international travel chains in passenger and freight transport.
4. Improved environmental sustainability. KPIs:
– improved energy efficiency, healthy urban environments and lower emissions of CO2 and NOX due to modal shift to rail with electrified railway and less truck traffic in city centers.

10
5. Improved safety and security. KPIs:
– Lowered risk levels in the transport system. Less truck traffic in city centers and less vessels in Gulf of Finland. High safety standard in tunnel system.
6. Economic viability. KPIs:
– A financial model has been designed in which transport operator’s revenues cov-er all operative costs, and the project implementation model is based on minimal public support for the investment cost.
1.8. Strategic positioning
Helsinki-Tallinn railway tunnel and Rail Baltica together form a European Gateway. For the vision of Helsinki-Tallinn tunnel Rail Baltica is a pre-requisite. Together the two transport connections form European Gateway that connects an intensive cross-border area between two capitals separated by the Gulf of Bothnia. Improved connectivity is a necessity to enable their full metropolitan growth. The European Gateway provides peo-ple and companies with better accessibility between the core of EU’s transport network, High North, Black Sea area and Asia.
On the Helsinki-Tallinn railway tunnel, freight represents approximately 30% in revenue of tunnel operation. In Helsinki node, which is the national multimodal transport hub, the European gauge 1435 mm railway needs to be synchronised with Airport Rail Line and freight terminals to Finland’s 1524 mm gauge rail network.
11
In the FinEst Link project the vision of the Helsinki-Tallinn fixed link has developed into a technically and economically feasible concept of an undersea railway tunnel.
European added value of the vision is highest when seeing the Helsinki-Tallinn railway tunnel as a direct continuation to Rail Baltica. This gateway would connect Europe from High North to Black Sea and could enable also new routes to Asia.
The FinEst Link concept of the railway tunnel combines Finland’s and Estonia’s trans-port networks and the local twin-city commuting systems. The level of interoperability and multimodality in the system is higher than those without the railway tunnel.
The greatest direct beneficiaries of the railway tunnel are citizens, workers, students and tourists as passengers. When considering the wider impacts, the railway tunnel would benefit remarkably businesses, trade, investments and culture related to the Helsinki-Tal-linn twin-city development.
The FinEst Link vision to the future encompasses the Helsinki-Tallinn twin-city of 3 million inhabitants in a society of intensive cross-border cooperation, education and business life. The society is built on high level of digitalisation, which enables fast growth rates in productivity and international competitiveness.
12
2. Introduction
The European strategic map of transport (Trans-European Network of Transport, TEN-T) consists of core and comprehensive networks, which cover all EU countries with an intensive network of roads, railways, ports and airports, and nine core network corridors, which form the main transnational arteries across the continent. Helsinki and Tallinn form the northern points of the North Sea Baltic core network corridor, which runs across Estonia, Latvia, Lithuania, Poland to the big German and Dutch seaports in Hamburg, Rotterdam, Amsterdam and Antwerp. In addition to this, Helsinki is also part of the Scandinavian-Mediterranean core network corridor that reaches from Malta through Central Europe, across Sweden to Turku, Helsinki and ands at the Finnish-Rus-sian border.
The twin cities of Helsinki and Tallinn form a unique cross-border case in the EU. Despite the fact that the two capitals are 85 km away from each other and separated by sea and time distance of approximately two hours, the cities have shared strong growth together. The mobility and transport of people and goods between Helsinki and Tallinn has shown increasing numbers throughout the 2000’s. The passenger volume on ferries between the two capitals has been increasing even when other indicators of economic activities have declined. Approximately 9 million passengers and 1,2 million of them with a car in a year use the maritime connection. About one fifth of them are tourists from outside the two countries, while the big majority are Finns and Estonians travelling between the twin cities and their catchment area. For the Helsinki-Uusimaa metropolitan area Tallinn is today more important a source of commuting workforce than other major Finnish cities, such as Turku and Tampere and cities in south-eastern Finland.
On 5.1.2016 the Finnish and Estonian authorities signed a Memorandum of Under-standing in Tallinn to develop transport connections between Helsinki and Tallinn. The Memorandum of Understanding, much stimulated by the long-term intensive twin city development, was signed by Mr. Kristen Michal, Minister of Economic Affairs and Com-munications of Estonia, Mrs. Anne Berner, Minister of Transport and Communications of Finland, Mr. Taavi Aas, Mayor of City of Tallinn, Mr. Pekka Sauri, Vice-Mayor of City of Helsinki, Mrs. Ülle Rajasalu, Harju County Governor, and Mr. Ossi Savolainen, Re-gional Mayor of Helsinki-Uusimaa. This joint declaration formed the mandate to build a trilateral project partnership of the FinEst Link to study the economic and technical feasibility of a fixed link between Helsinki and Tallinn. The project partnership includes Helsinki-Uusimaa Regional Council as lead partner and Cities of Helsinki and Tallinn, Ministry of Transport and Communications of Finland, Ministry of Economic Affairs and Communications of Estonia, and Harju County Government (later Union of Harju Municipalities). The project was approved by the EU’s Interreg Central Baltic Program in 2014–2020 with a project budget of total 1,3 million euros.

13
The FinEst Link project was given six planning objectives as follows:
1. Improvement of the travel service to facilitate daily commuting between Helsinki and Tallinn. The key performance indicators include travel time between the cities ca. 30 min, frequency and ticket price.
2. Smooth travel chains and integration with transport systems. The key performance indicators include integration with national rail networks, Rail Baltic/Baltica, air-ports and with public transport systems in both cities.
3. More effective freight transport chains. The key performance indicators are price, frequency, reliability and delivery time.
4. Improved environmental sustainability. The key performance indicators include improved energy efficiency, healthy urban environments and lower emissions of CO2 and NOX.
5. Improved safety and security. The key performance indicator is lowering of risk lev-els in the transport system.
6. Economic viability. The key performance indicators include that the transport operator’s revenues cover all operative costs and that the project implementation requires minimal public funding for the investment. Once in operation, the transport service does not require public support.
This report contains all the results of the FinEst Link feasibility study. The project will publish the sub-reports with references and background materials on the project’s web-site www.finestlink.fi during March 2018.
The study has been executed in Work Packages. One of the 6 partners was chosen as the procurement authority. Ten consultant firms have collaborated in the study. The Advisory Group and its members individually contributed to the project with their experience in tunneling technology, railway safety and security issues, implementation of mega-scale infrastructure projects, analyzing the impacts and benefits of the tunnel, and in methods of Comparative Impact Analysis. The organizations, members of The Steering Group, Project Group and Work Packages teams and consultants are listed and introduced in the Annex.

14
3. Ferry Traffic Solution 0+ The purpose of this section is to give an overview of history, current situation and future expectations of ferry traffic between Estonia and Finland.
3.1. Past DevelopmentThe ship traffic between Estonia and Finland ceased in 1939 because of the Second World War. It was re-started in 1965 by Estonian Shipping Company (ESCO) with one passenger vessel. Traffic increased during years and a larger vessel (Georg Ots) was introduced in 1978. Georg Ots was a ferry capable to transport passengers and cargo.
ESCO established a new ferry company Tallink in 1989 together with a Finnish Company Palkkiyhtymä. Tallink started ferry traffic with one vessel (m/s Tallink) in 1990. Traffic has developed, and several ships were introduced over the years. Fast crafts used in sum-mer seasons became popular in the 1990’s.1
3.2. Recent Traffic Patterns
3.2.1. Vessel TrafficCurrently, there are three ferry companies providing services on the Helsinki-Tallinn sea route all year around carrying both cargo and passengers: Eckerö Line, Tallink Silja, Viking Line. St. Peter Line Ltd. visits Tallinn occasionally while the main route is to St- Petersburg, Russia. There are also additional fast ferry services during summer season.
The daily traffic is based on passenger-car ferry concept, where passengers and cargo are transported in the same vessels. Cruises and related entertainment as well as shopping are also a vital part of the business concept.
Schedules of ferries ro-ro (roll-on, roll-off ) ships:
Eckero Line 2-3 departures per day (summer); 1 ferry Tallink Silja 4-7 departures per day (summer); 3 ferries 2 departures per day; one ro-ro ship Viking Line 2 departures per day (summer); 1 ferry
1 http://www.kansanuutiset.fi/artikkeli/2980639-raha-ratkaisi-tallinnan-ja-helsingin-laivayhteyden https://fi.wikipedia.org/wiki/Tallink http://www.hel.fi/www/uutiset/fi/kaupunginkanslia/helsingin-ja-tallinnan-valilla-saannollista-laiva-liikennetta-50-vuotta

15
There are currently two shipping lines providing fast craft services between Helsinki and Tallinn. Linda Line was established in 1997. The company is operating two fast ferries during summer season (typically 30.3–1.10). These fast crafts are transporting passengers only. Viking Line was operating Viking FSTR vessel between 10.4.–22.10.2017. This vessel transported passenger cars and buses.
Schedules of fast crafts:
Linda Line 3-6 departures per day (summer); 2 vessels Viking Line 2-3 departures per day (summer); 1 vessel
3.3. Other Routes between Finland and EstoniaDFDS Seaways is operating a vessel between Hanko (Finland) and Paldiski (Estonia) with a ro-ro passenger Ro-Pax (Ro-Pax – Roll-on, Roll-off and passengers) ferry Sailor. Sailor has 119 cabin beds. This route is mainly for cargo but some passengers are also transported.
Previously there has been a ferry line from Kotka (Finland) to Sillamäe (Estonia) operat-ed by Narva Line during 2006 to 2007. There have been plans to commence ro-pax traffic from Turku to Saarenmaa but this has not been realised.
3.4. 0+ Option
3.4.1. GeneralThe 0+ option is developed to evaluate how ferry traffic between Estonia and Finland is developing, in case the Fixed Link will not be built. This evaluation is based on traffic esti-mates and scenarios made during this project and interviews with stakeholders.
It is likely that ship capacity can be increased if the demand is growing. However, ship traffic is limited by number of vessels in traffic. Traffic congestion in the cities is also an issue to be considered. Current vessel sailing time of two hours is unlikely to shorten in the future. Minimum turnaround time is approx. 40 minutes. Commuting traffic tends to favour certain schedules and this will limit capacity usage.
Train ferry traffic has been ceased generally in the market and therefore is not considered in this study. Train ferry transport is not competitive due to higher costs which relates to inefficient utilisation of ships space and carrying capacity.
The Basic 0+ option is based on current port terminals. However, three other alternatives have been recognised:
0+ Cargo to Vuosaari and Muuga 0+ All Ferry Traffic to Vuosaari and Muuga 0+ Other Ports

16
3.4.2. Traffic Investments in PortsThere are several traffic investments planned in connection with the Helsinki Western Harbour improving the transportation system and thus reducing congestion. These in-vestments will be realised regardless of the possible Fixed Link. There may also be other investments. These investments and their benefits have not been estimated.
Figure 3.1 Overview of traffic investments in Helsinki and Tallinn.
3.4.3. 0+ Current FacilitiesIn scenario 0+ capacity for one-way passenger transport is approx. 8.5 million passengers per year (approx. 17 million passengers per year two-way) while 4.2 million passengers were transported during 2015. There are significant seasonal changes in traffic, concen-trating in summer months. Weekends are more popular than weekdays and there are also daily differences with the popularity of certain departures.
The estimated requirement for scenario 0+ is 14.1 million passengers per year (two-way). For scenario Fixed Link the extimated requirement is 10.6 million passengers per year. It can be concluded that the ferry capacity is adequate to meet future demands. Capacity can be increased by acquiring bigger and/or additional vessels.
Port of Helsinki has built a new passenger terminal to West Harbour with considerable investments to infrastructure and traffic arrangements. This terminal will serve ferry traffic to Tallinn (Eckerö Line and Tallink).
Jätkäsaari area is developing fast from a port area to a residential area. West Harbour (Eckerö Line, Tallink and St. Peter Line) in Jätkäsaari, South Harbour (Linda Line) and

17
Katajanokka (Viking Line) are all located in the city centre.There are some traffic bottle-necks due the location. The ferry terminal in Tallinn is located in the city centre. Increas-ing passenger and cargo traffic is expected to challenge traffic in the city centre. Digital-isation and mobility solutions will enable more efficient traffic management.
3.4.4. 0+ Cargo to Vuosaari and MuugaThere is currently one ferry transporting cargo between Vuosaari, Helsinki to Muuga, Tallinn. Technically it is possible to re-locate all cargo transport activities to Vuosaari or Muuga. It is likely that both Helsinki and Tallinn port terminals will continue to develop as a cargo and ro-pax terminals with even some private car transport as well. Cargo traffic would benefit from better road and rail connection in above mentioned cargo ports.
However, presently passenger and cargo transportation on ferries are interdependent. Ferry companies use pricing to guide cargo transport from weekend to weekdays in order to utilize ferry capacity efficiently.
The possible impact of relocating all cargo traffic to Vuosaari could be that ship types, schedules and frequencies are changed. There might be less traffic during weekdays which could reduce service level. It is possible that competition will be reduced, because there might be less cargo operators than there are ferry operators currently. Both passen-ger ferries and cargo ships could have pressures to raise prices due to the lost ability to adjust capacity utilisation between passengers and cargo.
It is likely that current additional cargo traffic between Vuosaari and Muuga will continue and even increase. Required investments are relatively minor, assuming that the current berth can be utilised.
3.4.5. 0+ All Ferry Traffic to Vuosaari and MuugaMoving all passenger ferry traffic from city centres to Vuosaari or Muuga would require a complete new terminal with some land reclaiming. This option would release current fer-ry terminals for other land use. Building a new terminal requires investments, but the city would also gain major benefits to develop urban waterfront without any ferry related road traffic. There is currently a master planning process in Tallinn to develop the waterfront area. In Helsinki there are already detailed plans for the West Harbor port area.
Functionally the Vuosaari and Muuga option should be advantageous for trucks due to enhanced road and rail connections. A more detailed analysis would be needed to evaluate road, yard and berth capacity at Vuosaari.
The option for re-locating all ferry traffic to Vuosaari is considered challenging at the moment, due to limited space at Vuosaari. Such a re-location operation would need major reclaiming work.

18
3.4.6. 0+ Other PortsThere is currently a ferry operating between Hanko (Finland) and Paldiski (Estonia) with limited passenger capacity. There used to be a ferry line between Kotka (Finland) and Sillamäe (Estonia) but traffic was ceased after one year. There are still possibilities to consider other Finnish and Estonian ports for transporting passengers and cargo if and when volumes increase.
3.4.7. 0+ Modern TechnologiesDevelopment of technology might impact positively on ferry traffic in the future.
Ships are becoming more environmental friendly. Vessels with conventional diesel en-gines are forced to reduce emissions by international conventions. This is also increasing the number of LNG powered vessels. Electric or Hybrid powered ships have been intro-duced for shorter routes. Two ferries operating completely on battery power between Helsingør (Denmark) and Helsingborg (Sweden), approximately 4 km voyage, carry more than 7.4 Million passengers and 1.9 million vehicles annually. There has been some pressure on the limiting of the vessel speeds in the Estonian coast due to environmental reasons. This could increase voyage time.
Autonomous or remote-controlled vessels are expected to be in operation within 10 years. However, it is likely that they are more beneficial on longer routes. Automated mooring is already in use at the Western Harbour for shortening ship turnaround time and enhanc-ing cost efficiency. Modern technologies will be beneficial for ferry operations but will not lead to operational changes.
Developing smart mobility services by utilizing open data for traffic planning and control, such as real-time traffic light control, will improve traffic management related to the ferry traffic. New mobile applications are also developed for improving accessibility and proce-dures related to ferry traffic.
3.5. 0+ Summary and ConclusionsEstimated ferry traffic can be managed using current and new facilities and vessels. Addi-tional vessel capacity can be increased in order to meet the increasing demand. However, vessel departure and sailing times might not be optimal for the demand (especially for commuting traffic). The traffic in the city centres will be impacted as a result of ferry traffic using the present harbours. Mitigation measures are possible but the increasing traffic vol-umes in both Tallinn and Helsinki city areas create a significant problem. Visions of deal-ing with the problem have been presented (e.g. an underground road connection in Helsin-ki). In addition, cargo traffic could be increased by using Vuosaari and Muuga terminals. Planned investments are expected to be implemented in spite of the possible Fixed Link.

19
4. Geology
The FinEst link rail tunnel between Finland and Estonia is planned to mostly go through crystalline Precambrian bedrock of gneisses and granitoids (Figure 4.1). The bedrock is generally of good quality and very hard compared to the younger sedimentary rocks, but it is expected to still contain local weak zones. Approaching the Estonian coast, the crystalline bedrock dives gently under younger, weaker Ediacaran and Cambrian sedimentary rocks.
Figure 4.1 Bedrock geology of the area between Finland and Estonia where the tunnel is planned [2]
The Geological Survey of Finland has performed seismo-acoustic investigations along the potential alignment of the FinEst link under the sea. A number of investigations have been done on the Estonian side (Geological Survey of Estonia et al.) including marine geo-logical mapping, core drilling, wells and geophysical studies. Results from these investiga-tions have been incorporated into a 3D model showing the seabed bathymetry and thick-ness of the geological units (Figure 4.2). A profile along the proposed tunnel alignment of the FinEst Link with interpreted geology is shown in Figure 4.3.

20
Figure 4.2 Data source distribution (Left) and 3D surface of Quaternary sediments (right) on the Estonian side based on 3d model [3]. Red lines – seismo-acoustic profiles, red dots – drillholes and blue dots – wells.
Figure 4.3 Geological profile along the proposed tunnel alignment of the FinEst link based on the investiga-tions shown at the top (vertical exaggeration 1:50).
The planned tunnel is over 100 km long and 85% of the alignment goes through the crystalline basement, with high intact rock strength (UCS 100-250 MPa) and good rock quality. The upper contact of the crystalline basement dives gently to south from level +40 m at Helsinki-Vantaa Airport to level -150 m at the Estonian end. Depressions in the bedrock surface under the sea represent likely weakness zones where extra rock cover for the tunnel may be needed. However, in general the rock cover for the tunnel exceeds 40 m beneath the seabed. On the Estonian side, the contact of the crystalline basement against sedimentary rocks is likely to be a weakness zone, but based on bore hole core drilling results, this zone is not very thick.
On the Estonian side about 5% of the total tunnel length will penetrate a 50 m thick layer of soft Ediacaran sandstone that overlies the crystalline basement. The sandstone is a hydrau-lically conductive aquifer and important groundwater reservoir for Tallinn and its sur-rounds. The tunnel design will need to be optimized to minimize the effects on groundwater in this layer. Overlying the sandstone layer is a 90 m thick layer of blue clay which acts as an aquitard with very low water permeability. The clay is relatively soft (UCS 2-4 MPa) but is well suited for tunnel construction using a tunnel boring machine (TBM). About 8% of the total tunnel length runs through the blue clay. Quaternary deposits of till, loose silt, sand and gravel reach up to 150 m thick in buried valleys. They present special challenges for tunnel

21
construction and need be to taken into account during selection of the TBM. The tunnel surfaces through a 30 m layer of Ordovician limestone, shale and sandstone.
Around Helsinki-Vantaa Airport, a groundwater area called Ruskeasanta should also be taken into consideration in the tunnel planning. Rock fractures close to Helsinki-Vantaa Airport contain Glycol (from ice-protection sprayed on airplanes) which can react with bacteria to produce substances harmful to tunnel structures and air quality. This issue was encountered during construction of the ring rail tunnel and was remedied with the addition of costly tunnel structures.
The following geological, engineering geological and hydrogeological studies are further needed to bolster the next iterative design phases:
• Boreholes to calibrate the seismo-acoustic results.
• Seismo-acoustic sounding along the missing part of the proposed tunnel alignment (chainage 79,000 m – 91,000 m) and local parallel profiles beside the alignment to ascertain the 3D geometry and continuity of possible weakness zones.
• Further studies (possibly involving boreholesin the final phase) to confirm the rock head level and possible weakness zones in valleys under the sea.
• Seismo-acoustic surveys along the alignment at the Viimsi peninsula to the portal of the tunnel.
• More boreholes along the alignment on Estonia side, for example Aegna island, to confirm geological surfaces and rock quality in the crystalline basement
• More geotechnical and geology investigations in location of artificial islands includ-ing borehole logging and hydrological surveys of all new borehole investigations
• A thorough compilation of geophysical and geological data from both land sides of the tunnel to identify potential weakness zones more precisely along the tunnel alignment.
• Hydrological studies of the Helsinki-Vantaa Airport area and Estonian side of the tun-nel to estimate its impact on groundwater reservoirs during and after construction
• More detailed rock mechanical studies including borehole core samples, rock qual-ity estimations from borehole mapping and laboratory tests for TBM relevant rock hardness parameters
• Collection of all existing rock surface data along the alignment and an investigation program for places where more precise rock surface data is needed

22
4.1. Readings
Ikävalko, O., Vähäaho, I and Suuroja S., 2013. Soil and bedrock conditions to be expected in Tallinn-Helsin-ki tunnel. Statens Vegvesens Raportter. Nr. 213,Strait Crossings 2013 16.–19. June 2013 Bergen, Norway p. 790 -799.
Koistinen, T. (ed.). 1994. Explanation to the Map of Precambrian basement of the Gulf of Finland and sur-rounding area map 1:1,000,000. Geological Survey of Finland, Espoo.
Suuroja, S., Suuroja, K., Ploom, K., Kask, A. & Soosalu, H., 2012. Tallinn – Helsinki -tunnel soil- and bed-rock construction conditions. Compilation of a geological database for the possible Tallinn–Helsinki tunnel area (in Estonian EEZ). Geological Survey of Estonia, Department of Geophysics, Marine and Environmen-tal Geology, Department of Geological mapping. Tallinn, pp. 19.
Alvi, K. 2017. Acoustic-seismic survey along the proposed railway tunnel route options, between Helsinki and Tallinn. Merenmittauslupa T- 037-16 22.7.2016 (AM13753). Report: Helsinki –Uusimaa Regional Council, Geological Survey of Finland
Suuroja, K., Niin, M., Suuroja, S., Ploom, K., Kaljuläte, K., Talpas, A., Petersell, V. 2010 a. Suur-Pakri saare ja selle lähiümbruse geoloogilis-geotehnilishüdrogeoloogiliste uuringute aruanne (in Estonian). Eesti Geoloogiakeskus.
Suuroja, K., Shtokalenko, M., Gromov, O. 2010 b. Maardu graniidimassiivi täiendav geoloogilis- hüdro-geoloogiline uuring. Eesti Geoloogiakeskus. (in Estonian).

23
5. Fixed Link Tunnel Solution
5.1. Tunnel ConceptFor the FinEst link, a transversal tunnel scheme consisting of two single-track tun-nels and one service tunnel with cross passages was identified as the most suitable and best-possible tunnel system out of several detailed analysed options. For evaluation, criteria categories such as train operation, tunnel construction, maintenance and tunnel safety management were assessed.
The design of the running tunnels is based on a clearance profile for European standard gauge 1435 mm railways. Thus, the two single-track running tubes have an external diameter of 10 m. The external diameter of the service tunnel is determined to be 8 m in order to allow for space for installations, maintenance incl. crossing of vehicles and safety purposes.
In this feasibility study, the use of Finnish gauge 1524 mm or a dual gauge solution (1435 mm and 1524 mm) was also analysed. As the Finnish clearance profile (based on RATO 18) results in an enlarged tunnel with an additional almost 1 m in diameter, both alterna-tives were rejected. However, in a next stage it would be worth studying whether a Finn-ish clearance profile with fixed overhead catenary instead of the traditional wire sus-pended one could fit into a tunnel profile close to the one designed for 1435 mm European standard gauge.
A horizontal distance of 70 m between the axis of the two running tubes (35 m between the axis of running tunnel and service tunnel) is to be adopted for FinEst link.
Figure 5.1 Tunnel layout for FinEst link – typical cross section
During construction, the service tunnel will be excavated in advance and thus can be used as an exploratory gallery for the main tunnel drives. During operation, this tunnel is an important part of both the maintenance and the safety concept of the tunnel.
1435 mm ca. 35 m ca. 35 m 1435 mm
Ø 10 mØ 10 m Ø 8 m

24
Intermediate attacks and staggered tunnel advances reduce significantly the construction time of long tunnels such as FinEst link. In addition, the provision of intermediate access points is beneficial for logistics, operations, risk mitigation and safety.
Therefore, two artificial islands will be created for the construction of FinEst link. They are located in water depths of approx. 15m and 20m and will be built of material coming from the Finnish onshore tunnel excavation. During tunnel construction, 6 tunnel drives have to be supplied from each island more or less simultaneously. As space is needed for muck handling, muck deposit, material deposit, silos, batching plants, workshops, offices, harbour and logistic infrastructure etc., a total size of approx. 400 x 300m has been de-fined as being adequate.
Once the artificial islands are created, they serve as intermediate access locations for the construction to the tunnel system. Due to different geological conditions two different sorts of access types will be constructed: One the island closer to the Estonian coast (Tal-linnamadal) vertical shafts will be sunk to a depth of approximately 215 m below sea level. At Uppoluoto island close to the Finnish coast an approximately 1’500m long inclined access tunnel with a maximum gradient of 10% will be built.
Since construction time is a key parameter in tunnelling, tunnel boring machines (TBM) will be used for the construction of FinEst link as they offer 2–3 times higher advance rates compared to drill-and-blast excavation. For excavation of the cross passages, rescue stations and intermediate accesses drill-and-blast technique will be used.
FinEst link tunnel sections situated in competent and stable crystalline bedrock will be constructed either with single shield TBMs or double shield TBMs. Figure 5.2 shows an illustration of a typical single-shield TBM. In the Edicara sandstone and the blue clay formations in Estonia an active face support in the TBM is required. There either a Mix-shield or EPB Shield TBM is deployed for tunnel construction.
The tunnel is lined single-shell with a segmental lining. The lining is composed of pre-cast concrete segments. The segmental ring is designed to bear the rock and water pres-sures. Segments are sealed with gaskets to ensure the water tightness of the lining even for water pressure exceeding 20 bar.
25
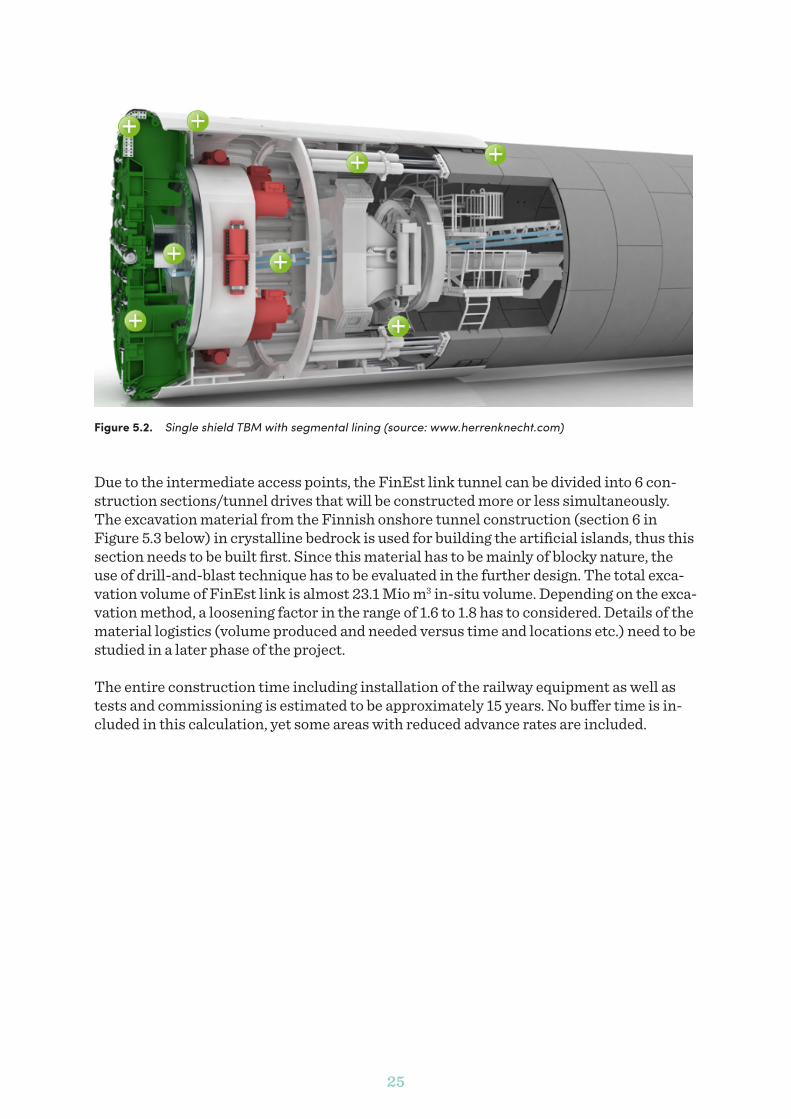
Figure 5.2. Single shield TBM with segmental lining (source: www.herrenknecht.com)
Due to the intermediate access points, the FinEst link tunnel can be divided into 6 con-struction sections/tunnel drives that will be constructed more or less simultaneously. The excavation material from the Finnish onshore tunnel construction (section 6 in Figure 5.3 below) in crystalline bedrock is used for building the artificial islands, thus this section needs to be built first. Since this material has to be mainly of blocky nature, the use of drill-and-blast technique has to be evaluated in the further design. The total exca-vation volume of FinEst link is almost 23.1 Mio m3 in-situ volume. Depending on the exca-vation method, a loosening factor in the range of 1.6 to 1.8 has to considered. Details of the material logistics (volume produced and needed versus time and locations etc.) need to be studied in a later phase of the project.
The entire construction time including installation of the railway equipment as well as tests and commissioning is estimated to be approximately 15 years. No buffer time is in-cluded in this calculation, yet some areas with reduced advance rates are included.

26
Figure 5.3. Construction time schedule for FinEst link
In a next phase, it is crucial to study the material management in detail and to design a logistic concept taking into account all the different aspects, requirements and boundary conditions of FinEst project.
27
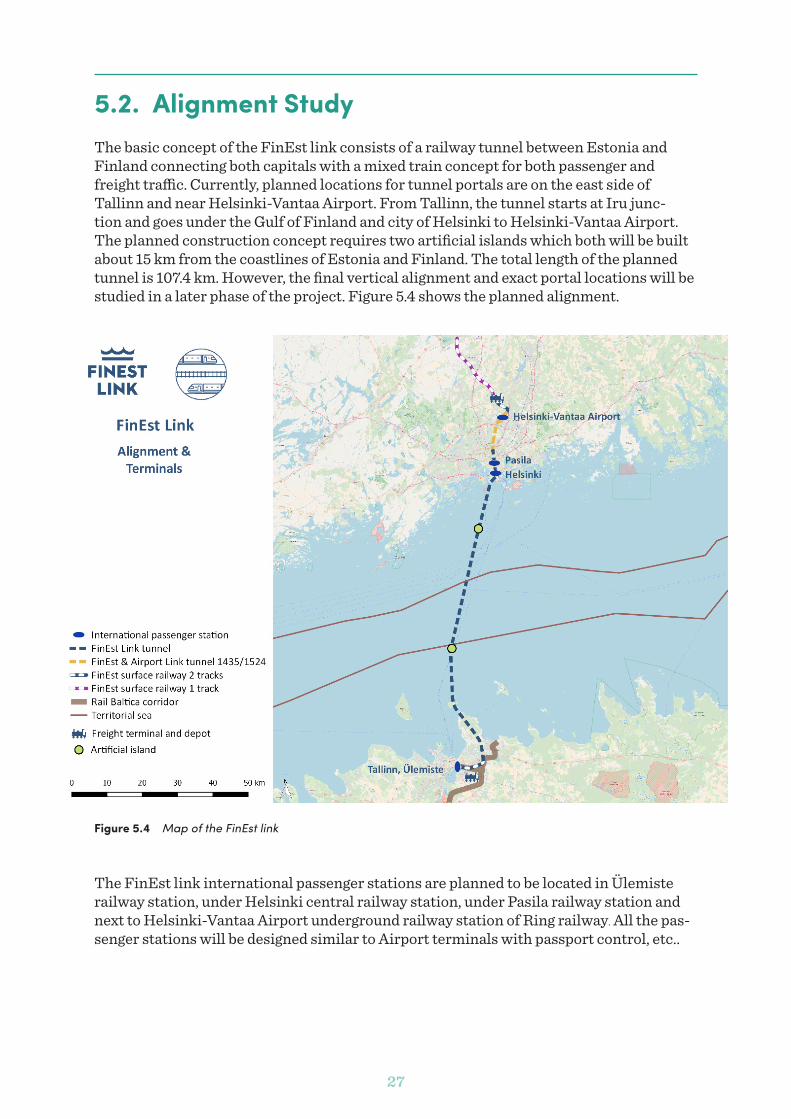
5.2. Alignment StudyThe basic concept of the FinEst link consists of a railway tunnel between Estonia and Finland connecting both capitals with a mixed train concept for both passenger and freight traffic. Currently, planned locations for tunnel portals are on the east side of Tallinn and near Helsinki-Vantaa Airport. From Tallinn, the tunnel starts at Iru junc-tion and goes under the Gulf of Finland and city of Helsinki to Helsinki-Vantaa Airport. The planned construction concept requires two artificial islands which both will be built about 15 km from the coastlines of Estonia and Finland. The total length of the planned tunnel is 107.4 km. However, the final vertical alignment and exact portal locations will be studied in a later phase of the project. Figure 5.4 shows the planned alignment.
Figure 5.4 Map of the FinEst link
The FinEst link international passenger stations are planned to be located in Ülemiste railway station, under Helsinki central railway station, under Pasila railway station and next to Helsinki-Vantaa Airport underground railway station of Ring railway. All the pas-senger stations will be designed similar to Airport terminals with passport control, etc..
28
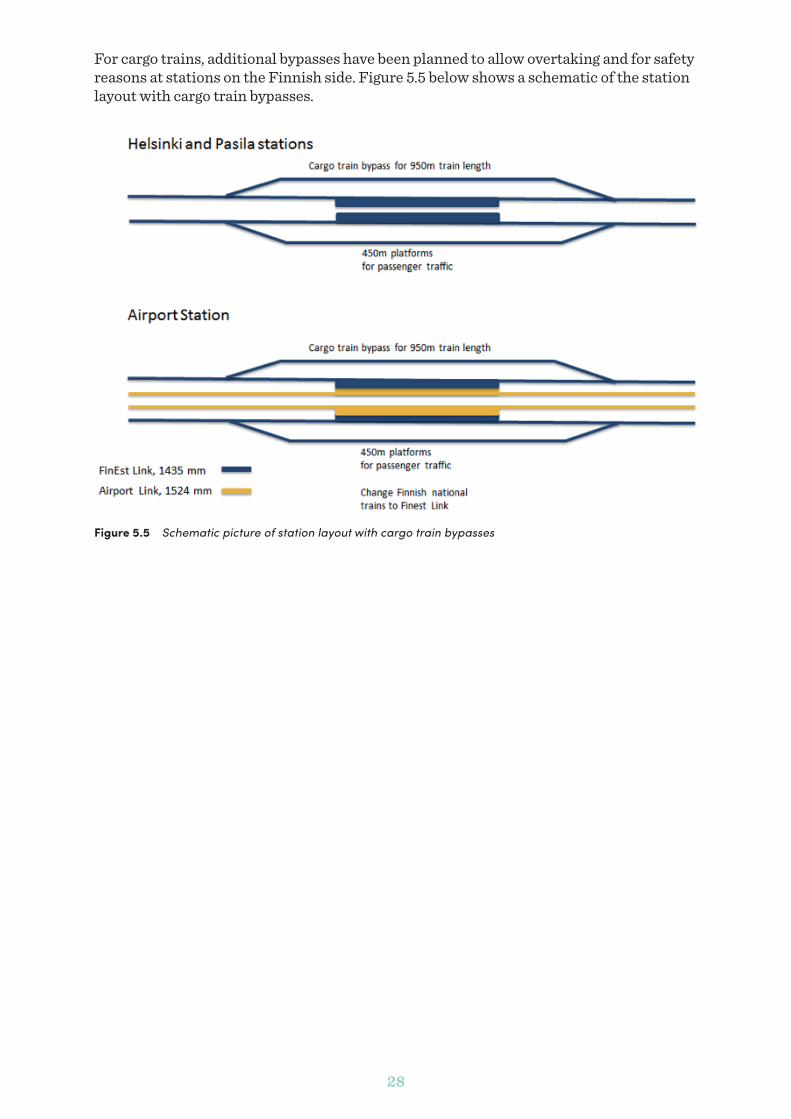
For cargo trains, additional bypasses have been planned to allow overtaking and for safety reasons at stations on the Finnish side. Figure 5.5 below shows a schematic of the station layout with cargo train bypasses.
Figure 5.5 Schematic picture of station layout with cargo train bypasses

29
On the Estonian side, the FinEst link development is directly linked with the Rail Baltica development by shared tracking as well as the potential of sharing facilities on the Esto-nian side. Figure 5.6 shows that freight facilities of the FinEst link are planned in a shared location with Rail Baltica facilities. In addition, Rail Baltica could also connect FinEst link to Muuga harbour.
Figure 5.6 Horizontal alignment and facilities in Estonia
The horizontal alignment plan of FinEst link starts from Ülemiste railway station close to Tallinn airport. The first 8-12 km, depending on the tunnel portal location, from Ülemiste railway station is a surface section following the planned railway corridor in the Harju County Plan. The tunnel portal is located near Iru junction, to the south of road #1. Anoth-er possible location for the tunnel portal is approximately 4.7 km north from Iru junction (refer to Figure 5.6). In following studies, an exact location for the tunnel portal needs to be determined. Irrespective of which tunnel portal is chosen, the horizontal tunnel alignment follows the Harju County Plan beneath the Viimsi peninsula and island of Aegna.
In the sea area, the planned tunnel alignment goes via shallow sea areas in Tallinnamadal (Estonia) and near Uppoluoto (Finland) where artificial islands are planned to be built. At the coast of Helsinki, the alignment is planned to avoid conflicts with an 8 km long deep sewage tunnel. Thus, the alignment is located on west side of this tunnel. The horizontal alignment curves smoothly to the central railway station of Helsinki and continues via

30
Pasila station to the Helsinki-Vantaa airport. North of Pasila the FinEst Link is planned to connect with the Airport link. From that section to north, the FinEst link and the Airport link could run in a same expanded tunnel with both 1435 mm and 1524 mm gauges.
Near Tallinn Airport, the planned alignment underpasses the Ring railway close to the Aviapolis station and continues to the north-west side of the Ring railway. The tunnel alignment ends to the north of the airport area where the railway is planned to continue as a surface section to potential areas for depots, cargo and car/truck terminals. The exact location for the tunnel portal needs to be studied more in detail in following planning phases.
On the Finnish side, freight terminals and depots could be located north of Helsinki-Van-taa Airport mainly under the aircraft flight path. That location is central from a logis-tics perspective. Hence, the terminal area could serve Finland´s entire freight transport network. The planned ring road 4 and the railway from the terminal area to the Han-ko-Hyvinkää railway would provide both good road and rail connections to the existing transport network.
The schematic layout of alignment in Finland is presented in Figure 5.7 and Figure 5.8. Please note that the double-track solution was not studied in detail.
Figure 5.7 A schematic layout of alignment in Finland

31
Figure 5.8 Horizontal alignment and facilities in Finland
During the planning process, three different alternatives in Estonia and five different al-ternatives in Finland have been developed and evaluated. All alternatives and the evalua-tion process are introduced with figures in an Alignment and terminals sub-report.
5.3. Maintenance and operationThe basic design assumption is that all non-direct track related rail equipment such as
• power supply catenary system
• signalling equipment (cabinets)
• utility equipment (fans, power supply)
will be located in the service tunnel. In the sub report maintenance and operation more details can be found. Only direct track related equipment plus lighting c.a will be placed in the running tubes.

32
This makes it possible to perform most maintenance 24/7 in the service tunnel. Only direct rail related equipment plus lighting in the running tunnels will need to be serviced in the 4-hour service window each night. Each night a monitoring train runs through the tunnel to check rail condition, gauge and cant thus reducing a train derailment caused by track failure. Most pollution is brought into the tunnel by the passing trains as well as caused by the track grinding train. A higher reliability and availability can be achieved by good housekeeping, not allowing loose particles to stick to equipment and the tunnel lin-ing over time. Therefore, the monitoring train has a wagon that act as a vacuum cleaner.
These days it is very difficult to do any prediction about maintenance and replacement of installations in the future. Technological developments in the context of the digitalisa-tion, predictive maintenance schemes, IOT (Internet of Things) etc. will have a signifi-cant influence on replacement periods, extend and manners of maintenance procedures etc. In this report it is assumed that the track and catenary systems will be replaced during a month long “out-of-service” period every 10 years. The same will be done every 25 years with electrical (signalling) equipment. Performing replacement activities in the running tunnels during the daily 4-hour window is extremely cost inefficient, because most of the time will be spent travelling to the location were work has to be done. Fur-thermore, it would require additional special rail based rolling stock, such as track re-placement equipment, to be bought instead of being hired every 10 years. This equipment needs additional depot facilities as well as bypass tracks where this rolling stock can be parked during the daytime. However as initially stated all the maintenance activities may be carried differently in the future, at different intervals and with different costs. This needs to be considered in future stages.
In order to reduce the possibility that trains may come to a standstill in the tunnel due to a malfunction of either trains or infrastructure, redundancy is used in the design. Be-fore a train is allowed to enter the tunnel, vibration sensors monitor whether the bogeys (wheels) are performing well. If a (possible) failure is detected the train is redirected to a bypass in one of the depots for further investigation. At the depots and in the Ulemiste railway station an additional locomotive is added to each trainset, this takes about 2 minutes. If the propulsion or the train control system of a train fails during its tunnel passage, this locomotive enables the train to continue to travel to the depot on the other side. Since the inclination of the alignment is steep the additional locomotives also enable trains to reach and maintain nominal speed. The power distribution for the overhead line in the tunnel has built-in redundancy as well as the signalling system. Each depot has a traffic control centre that is able to control whole FinEst section, which is also required to achieve the necessary availability of service.
In the service tunnel only electrical vehicles are allowed, in the design assumes that also in depots vehicles are electrical. Due to the length of the tunnel, all vehicles will be auton-omous in the service tunnel. Special mid-size trucks are fully equipped with restrooms, office facilities, workshops and numerous spare parts enabling maintenance personnel to perform most maintenance activities.

33
6. Tunnel safety management
The safety levels to be reached are defined by relevant regulations like the TSI (Technical Specifications for Interoperability) and national normative documents. The “state of the art” of safety solutions for long rail tunnels, like the Gotthard or the Brenner Base Tunnel have as well a strong influence on the safety level to be reached for the FinEst tunnel.
A tunnel safety concept consists of prevention, mitigation, escape (self-rescue) and res-cue. Generally, the most effective way to reduce the risks is prevention. Preventive mea-sures reduce the occurrence of incidents. Mitigation, evacuation and rescue reduce the consequences of incidents and are less effective.
For prevention of incidents in the tunnel, only trains in a proper operating condition are allowed through the tunnel. Therefore, trains are checked by sensors for indications of overheated brakes, displaced goods, etc. before entering the tunnel.
Since underground stations are connected to infrastructure with high number of people, freight trains need to be separated from passenger trains in these areas. In consequence, in each station bypass tracks for freight trains are built which are separated from the passenger tracks by a dividing wall. As the FinEst has an allowance for the passage of hazardous goods, the separation of freight trains and passenger trains in the underground stations is an important preventive measure.
For mitigation, the priorities in case of emergency are different for passenger and freight trains: Passenger trains should reach the next rescue station (with a maximum distance of 20 km) or the tunnel portal and uncontrolled stops at any location in the tunnel should be prevented. In contrast, freight trains shall exit the tunnel if possible or stop only at suit-able locations (i.e. dedicated freight-train emergency stop points, e.g. sections equipped with fixed firefighting systems).
In case of emergency, the “trains help trains” principle is applied for the FinEst link, which means that both intervention and passenger evacuation is carried out by train.
Infrastructural measures and operational or organizational measures are both import-ant to achieve the safety goals. The most relevant infrastructural measures to achieve an acceptable safety level according to the state of the art requirements are as follows:
Cross passages at intervals of approximately 330 m are the primary measures to facilitate self-rescue in case of a forced train stop in the tunnel. They connect the two tunnel tubes with the service tunnel. The cross passages allow the evacuation of passengers from the incident tube within a short time span to the service tunnel, a temporary safe place. Cross passages are the most important safety measure to mitigate the consequences from fire incidents with a train stop at an undesired position, outside of a rescue station.

34
Rescue stations designed for passenger trains only are required at maximum intervals of approximately 20 km. Hence, four rescue stations are built along the subsea section of the tunnel. These stations are approximately 450 m long and are equipped with a small platform and cross passages between the main tunnels and the service tunnel every 50 m allowing for a very fast train evacuation. Fresh air supply, good lighting and communica-tion facilities (emergency phones and loudspeakers) as well as a smoke-extraction system and/or a fixed firefighting systems (FFFS) support evacuation and intervention.
Freight trains, which are not able to leave the tunnel, shall stop at dedicated emergency stop points. These stop points are designed to withstand a possible freight train fire (e.g. FFFS, higher level of thermal protection, etc.).
6.1. Layout of rescue stations: 450 meters long and cross-passages every 50 meters.
50 m

35
7. Train operation concept
The FinEst link is a prolongation of the planned Rail Baltica line. Therefore it is recom-mended to also build FinEst link according to the 1435 mm gauge. The tunnel traffic is planned to comprise:
• Passenger trains (shuttle traffic) from Helsinki Airport (via Pasila and Helsinki cen-tral) to Ülemiste station. Dedicated rolling stock for FinEst link, in total 23 train sets, adds up to an investment in the range of € 460 M.
• Cargo shuttles, i.e. rolling motorway trains common for both cars & trucks. Dedicat-ed rolling stock for FinEst link, calculated need is totally 15 sets. One train set con-sists of two locomotives and approx. 720 meters of wagon set, whereof three wagons for passengers. This sums up to an investment volume of about € 315 M for the car & truck shuttle fleet.
• Conventional freight trains with covered goods wagons and/or intermodal wagons. Rolling stock not dedicated/tailor made for the FinEst link.
7.1. Volume Estimations7.1.1. Passenger Volume Estimations
Objectives and approach
An important part of the project is to describe transparently the baseline data and meth-odologies to estimate the passenger volumes in all alternatives:
• 0 (zero) scenario: Refers to present situation, which will be described for reference purposes to understand changes in travel patterns.
• 0+ (zero+) alternative: Describes the future situation without the fixed link (the tun-nel) and answers the question how passenger traffic could be developed if the tunnel will not be built. The 0+ -alternative is presented as the alternative in the compara-tive impact analysis.
• FL (Fixed Link) alternative: Refers to situation where the tunnel is built and an-swers the question how passenger traffic and travel behaviour could develop if the tunnel is built and operated as planned.
The main goal has been to assess the probable magnitude and quality of passenger traffic (base scenario) for the CBA (Standard Cost-Benefit Analysis). The base scenario was also applied to estimate the temporal trip distributions for e.g. the train operation concept outlining.
36
Additionally, the focus has been in the formulation of a model that can be used to per-form the sensitivity analysis of the effects of different assumptions or uncertainties in the operating environment or baseline data on travel behaviour in alternative scenario situations. The methodology relies on the relevant references, case studies and research information described in separate Annex.
Current situation
Approximately 9 million trips were made in the Helsinki-Tallinn corridor in 2016. For the moment the share of ferry of all trips is significant (97 %). Only 0.3 million trips are made by air. The growth of passenger traffic over the sea has been very rapid – the number of passengers has grown by over 50 % in the last 10 years.
Significant asymmetries in the present flows can be observed. Currently the Finns make most of the trips (63 %). The share of Estonians of passenger flows is 16 %. Other nation-alities represent 21 % of all traffic.
Travel patterns vary greatly comparing Finns to Estonians. So far leisure and shopping purposes are dominant for Finns. There is no single dominant trip purpose for the Esto-nians, the leisure trips being most frequent at the moment. The monetary flow of tourism is several times larger from Helsinki-Uusimaa to Tallinn-Harju than to the other direc-tion. It has been evaluated that the volume of tourism from Finland to Tallinn is already approaching the saturation level.2
More than 1.3 million private cars are being transported on ferries. This means that the need to transport private cars on ferries is linked to 15 % of all trips at the moment. There is no detailed information about the characteristics of private car transport needs.
Baseline data and references
The assumptions of demographic and economic developments and their growth rates are described in the chapter “Wider economic impacts”. The land use projections for Uusi-maa and Harju regions are based on a positive scenario of the growth potential of the re-gions. The population and the number of jobs in Helsinki and Tallinn regions are expected to grow 40 % from year 2016 to 2050 (+1% p.a.). Based on those growth rates it is assumed there will be 2 million inhabitants and 1.05 million jobs in the Helsinki region and 0.6 mil-lion inhabitants and 0.4 million jobs in the city of Tallinn in 2050.
Derived travel demand has been analysed through different trip types and frequencies of travelling. The most relevant trip types for the passenger traffic forecast are related to travel needs and reasons that occur daily or several times a week: commuting and trips to a place of study. Business and other work-related trips are reviewed as weekly recurring trips. Occasional trips link up to leisure, shopping and visiting. Long distance trips and transit trips (e.g. from Rail Baltica) are considered as intermittent trips as well.
2 Economic flows between Helsinki-Uusimaa and Tallinn-Harju regions, 2013

37
The statistics of commuting via Øresund Bridge between Denmark and Sweden and in the Helsinki Metropolitan Area are the most important references to estimate commut-ing potential in the Fixed Link scenario. Besides, the corresponding fares and available modes regarding to shares of commuting have been evaluated to produce a valid and a credible estimate.
The detailed description of relevant references and assumptions regarding to different trip types are described in the separate Annex.
Passenger volumes in the scenario 0+
The average annual growth of ferry passenger demand has been 4 % in the past 10 years. Port of Helsinki has estimated the annual growth of 2 % in the future. Passenger growth in scenario 0+ is based on the following annual growth rates:
2016–2030 +2 % / year 2030–2050 +1% / year
Based on that it is assumed there will be 14.1 million ferry passengers in total in the sce-nario 0+.
Figure 7.1 The growth of passenger volumes in the scenario 0+

38
Passenger volumes in the Fixed Link scenario
The calculations are based on the assumption that 15,000 people are commuting four times a week across the Gulf of Finland in 2050. In the forecast there are 10,000 commut-ers from Tallinn to Helsinki and 5,000 commuters from Helsinki to Tallinn.
In the base scenario the number of annual new train passengers is 11.6 million trips including 3.5 million trips as a total shift from ferries to trains. Therefore, the number of ferry trips is assumed to decrease to 10.8 million annual trips in 2050 compared to the 0+ situation without the tunnel.
The detailed volumes of train and ferry passengers in the Fixed Link base scenario are presented in the separate Annex.
Figure 7.2 Comparison of passenger volumes
7.1.1.1. Volume Estimations
Objectives and approach
The objective was to produce estimations on cargo potential for year 2050 for maritime and Fixed Link rail transports between Helsinki and Tallinn in alternative scenario situations. Additionally a set of sensitive analyses of the effects of different prices on the transport volumes were performed for illustrating the alternative market situations.
The analyses are performed using FRISBEE freight model, which calculates the theoret-ical potential for the Fixed Link and Rail Baltica. The model is based on system modelling – when making changes the model calculates the whole transportation system based on
39
new data on costs, transport time etc. The model contains information of transport net-works (Finland, Europe, Russia and connections to other continents), transport demand (13 commodities/types of goods SITC2, Eurostat, Comtrade), transport freight by mode (rail, road and maritime transports), by type of goods, terminal and port prices, transport time (taking into account the speed limits, congestions etc. as an average on yearly ba-sis concerning all modes), reliability of transports, risk of damage, loading and handling times in terminals and ports, number and frequency of shipping lines in different ports etc. For different types of goods the factors have different weights affecting the route and mode selection. As an example, for valuable consumer goods the speed and the level of service have more effect than the transport price in route and mode selection.
The data and assumptions
The transport demand 2050 between Finland and all European countries is based on state specific economic forecasts.3
Volume estimations were made in scenario 0+ (existing transport system between Hel-sinki and Tallinn and Rail Baltica in operation, forecast year 2050) and in scenario Fixed Link (Helsinki–Tallinn tunnel in operation and Rail Baltica in operation, forecast year 2050).
Assumptions were: a) Location of the cargo terminal is near Helsinki airport in the city of Vantaa (the possibility of cargo terminal location in Muuga/Ulemiste was also considered), b) the tunnel price 450 euros per truck per one direction, 12–13 tons cargo per truck per trailer, 600–700 tons cargo per train and 8 tons cargo per TEU, c) average speed of cargo train would be 120 km/h, d) average loading/unloading time of cargo trains is 1/2 hour and e) annual growth of GDP due to tunnel in Helsinki region 0.1% and in Tallinn region 0.2% .
The volume estimations in base scenario
In the non-tunnel scenario 0+ the maritime cargo between Helsinki and Tallinn would be appr. 6.9 million tons per year of which the potential for Rail Baltica would be 1.8 mil-lion tons per year. In comparison, in 2016 approximately 3.8 million tons of goods were transported between Helsinki and Tallinn (2 million tons from Helsinki to Tallinn and 1.8 million tons from Tallinn to Helsinki).
In the base scenario Fixed Link the annual transport potential of the Helsinki–Tallinn tunnel including all types of goods would be appr. 4.2 million tons (from Tallinn to Hel-sinki 1.7 million tons and from Helsinki to Tallinn 2.5 million tons) and maritime cargo transport potential 4.2 tons, resulting to 8.4 million annual tons of maritime and tunnel cargo all together between these two cities in 2050. The analysis of cargo volumes is based on the assumption that Rail Baltica, the on-going railway infrastructure project from Tal-linn via Riga and Kaunas towards Poland, becomes fully functional.
According to the study especially long distance transports between Finland and Central and Eastern Europe via Rail Baltica would use the Helsinki-Tallinn tunnel (more than 80
3 ETLA, Research Institute of Finnish Economy, moderate forecast

40
% of the transport potential for the tunnel). Transport potential for the tunnel consists of the predicted growth of transport demand and shifts from the maritime transports be-tween Helsinki and Tallinn and between Finnish ports and Northern German and Polish ports.
The price of the tunnel transport has a significant impact on the transport potential (Figure 7.3).
Figure 7.3 Effects of different tunnel prices to potential cargo volumes 2050
7.2. Passenger train trafficInput from WP2
In total 13,05 million passengers annually in year 2050 (sum of both directions)
Out of the total 13,05 M passengers, approximately 720 000 travel with the car shuttles => approx. 12,3 million passengers travel on board the passenger trains per year.
Assumptions, train proper-ties and train operation
Top speed: 200 km/h
Only seated passengers; fill ratio of trains at peak hour: 90%
Train length: 200 metres for single train set (capacity approx. 500 passengers) or 400 m for two sets.
Train operation between 4 a.m. and 1 a.m. due to low demand and maintenance need.
Table 7.1 Information and assumptions for passenger trains

41
Travel time from Ülemiste to Helsinki C is calculated to be approximately 34 minutes and to Vantaa Airport, circa 45 min. Travel time includes acceleration and deceleration at sta-tions and that train speed is just below 200 km/h in most of the tunnel length apart from four points (rescue stations), where the speed is reduced to 160 km/h. Normal weekday operation is two trains hourly – except morning and afternoon peaks with three trains per hour – until late evening where one train per hour is running. Saturdays and Sundays, two trains per hour run 9.00-18.00 and one train hourly before and after this interval.
Weekdays Time 0 1 2 3 4 5 6 7 8 9 10 11 12 13 14 15 16 17 18 19 20 21 22 23Number of trains per hour 1 2 2 3 2 2 2 2 2 2 2 3 3 2 2 2 2 2 1 1 Table 7.2 Monday to Friday, number of trains per hour and direction
Sat- & Sundays Time 0 1 2 3 4 5 6 7 8 9 10 11 12 13 14 15 16 17 18 19 20 21 22 23Number of trains per hour 1 1 1 1 1 2 2 2 2 2 2 2 2 2 2 1 1 1 1 1 Table 7.3 Saturday- & Sundays, number of trains per hour and direction
7.3. Car & truck shuttles and conventional freight trains
Input from WP2 Annual volume of cars: 554 000; directional distribution: 50/50
Assumptions, travel-ling distribution
Weekly distribution: Evenly distributed over the week
Number of operational weeks per year: 50; operational days per week: 7
Table 7.4 Information and assumptions for car shuttles
Input from WP2 Total transport 2050 (thousands of tonnes): 4 200
Direction Est-Fin: 1 600; direction Fin-Est: 2 600
Assumptions, freight distribution
Tonnage distribution 2050 between truck train (rolling motorway) and conventional: Truck shuttles 70%, freight trains 30%
Number of operational weeks per year: 48; operational days per week: 6
Table 7.5 Information and assumptions for freight trains
42
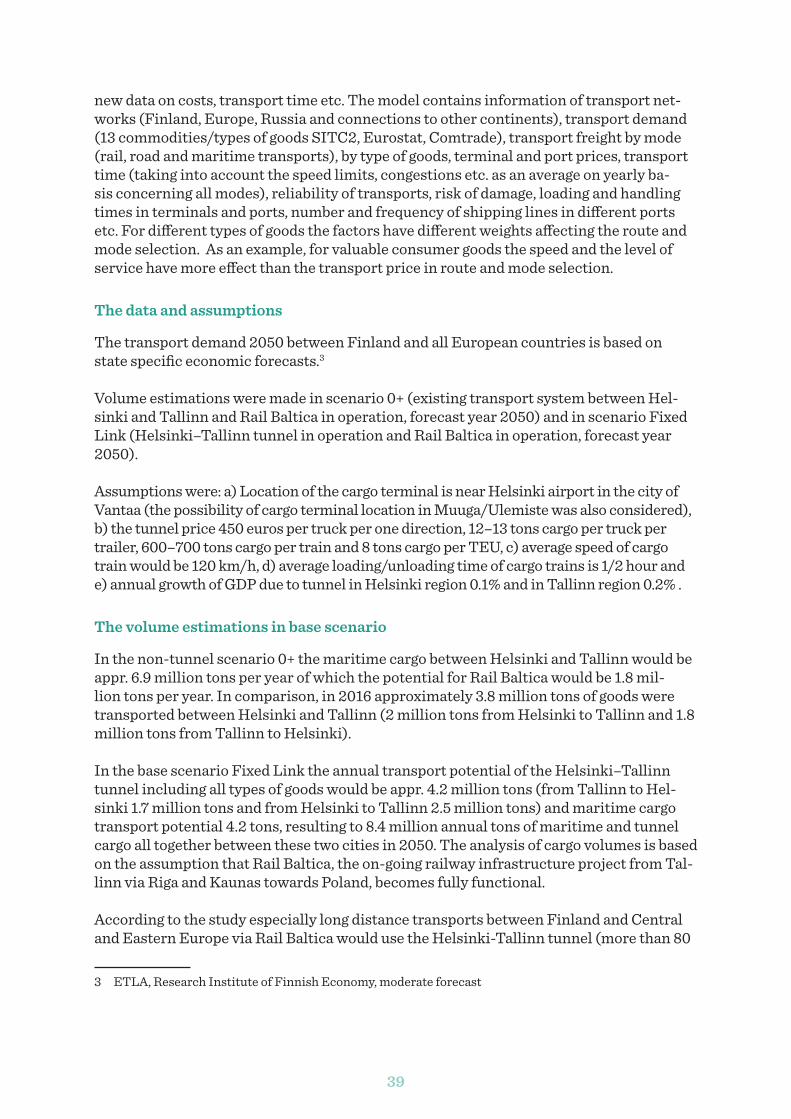
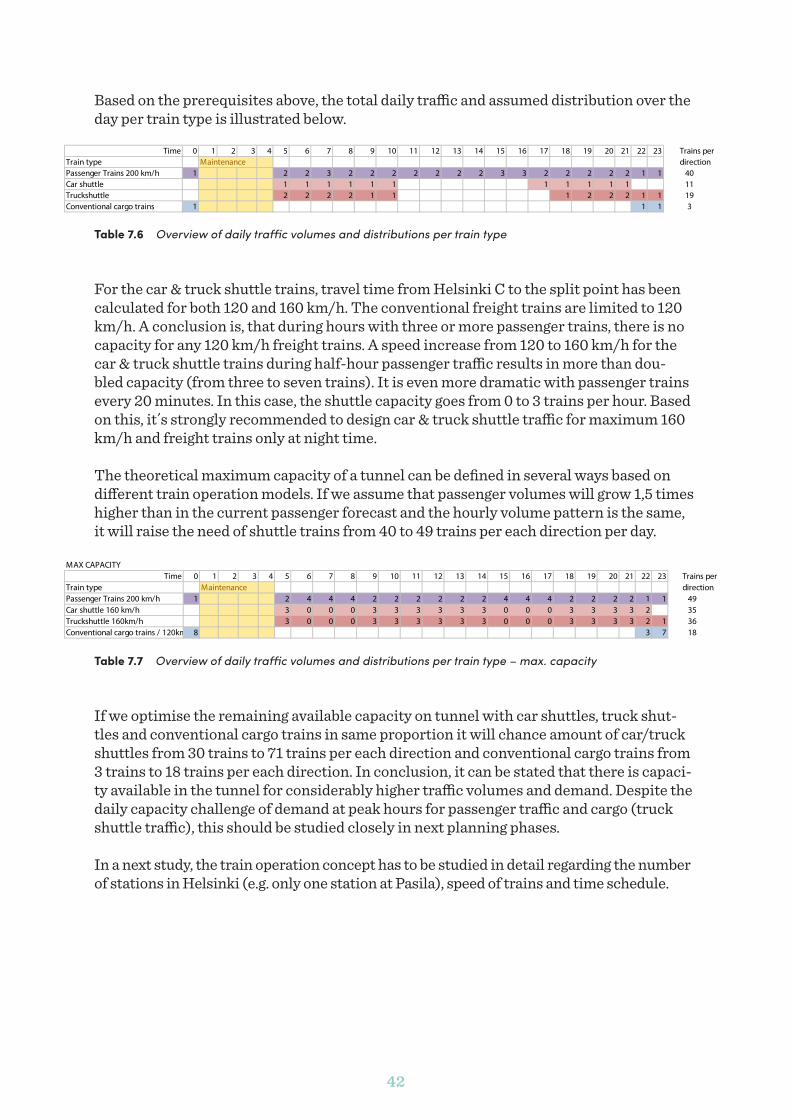
Based on the prerequisites above, the total daily traffic and assumed distribution over the day per train type is illustrated below.
Table 7.6 Overview of daily traffic volumes and distributions per train type
For the car & truck shuttle trains, travel time from Helsinki C to the split point has been calculated for both 120 and 160 km/h. The conventional freight trains are limited to 120 km/h. A conclusion is, that during hours with three or more passenger trains, there is no capacity for any 120 km/h freight trains. A speed increase from 120 to 160 km/h for the car & truck shuttle trains during half-hour passenger traffic results in more than dou-bled capacity (from three to seven trains). It is even more dramatic with passenger trains every 20 minutes. In this case, the shuttle capacity goes from 0 to 3 trains per hour. Based on this, it´s strongly recommended to design car & truck shuttle traffic for maximum 160 km/h and freight trains only at night time.
The theoretical maximum capacity of a tunnel can be defined in several ways based on different train operation models. If we assume that passenger volumes will grow 1,5 times higher than in the current passenger forecast and the hourly volume pattern is the same, it will raise the need of shuttle trains from 40 to 49 trains per each direction per day.
Table 7.7 Overview of daily traffic volumes and distributions per train type – max. capacity
If we optimise the remaining available capacity on tunnel with car shuttles, truck shut-tles and conventional cargo trains in same proportion it will chance amount of car/truck shuttles from 30 trains to 71 trains per each direction and conventional cargo trains from 3 trains to 18 trains per each direction. In conclusion, it can be stated that there is capaci-ty available in the tunnel for considerably higher traffic volumes and demand. Despite the daily capacity challenge of demand at peak hours for passenger traffic and cargo (truck shuttle traffic), this should be studied closely in next planning phases.
In a next study, the train operation concept has to be studied in detail regarding the number of stations in Helsinki (e.g. only one station at Pasila), speed of trains and time schedule.
Time 0 1 2 3 4 5 6 7 8 9 10 11 12 13 14 15 16 17 18 19 20 21 22 23 Trains perTrain type Maintenance directionPassenger Trains 200 km/h 1 2 2 3 2 2 2 2 2 2 2 3 3 2 2 2 2 2 1 1 40Car shuttle 1 1 1 1 1 1 1 1 1 1 1 11Truckshuttle 2 2 2 2 1 1 1 2 2 2 1 1 19Conventional cargo trains 1 1 1 3
MAX CAPACITYTime 0 1 2 3 4 5 6 7 8 9 10 11 12 13 14 15 16 17 18 19 20 21 22 23 Trains per
Train type Maintenance directionPassenger Trains 200 km/h 1 2 4 4 4 2 2 2 2 2 2 4 4 4 2 2 2 2 1 1 49Car shuttle 160 km/h 3 0 0 0 3 3 3 3 3 3 0 0 0 3 3 3 3 2 35Truckshuttle 160km/h 3 0 0 0 3 3 3 3 3 3 0 0 0 3 3 3 3 2 1 36Conventional cargo trains / 120km/ 8 3 7 18

43
7.4. Terminals and depotsThere are three types of terminals/depots essential for the rail operation on the FinEst link. On the Finnish side, all of those functions are planned north of the airport, which is suitable with respect to noise and limitation regarding habitation caused by the air traffic. Below the functions are described and also the planned localization for the each of them on the Estonian side:
Passenger train depot (common with Rail Baltica) on the Estonian side is planned north-east of the Tallinn Airport. The depot has two primary functions: maintenance & repair of trains and parking (short-term and over-night). On the Finnish side, there needs to be a depot capable of handling half of the total passenger train fleet. With respect to skewness and expansion over time, the estimated track need in the depot is tracks for 22 train sets. The assessed investment is ca. €25 M excluding machinery and equipment (lathes, lifts, wash halls etc.).
• Car & Truck rolling motorway terminal on the Estonian side is foreseen south-east of the airport. The necessary number of un-/loading tracks for each of the two termi-nals is estimated to five. Along with passenger train depots, skewness and expansion have been considered regarding the dimensioning of the marshalling track capaci-ty. The recommendation is eight tracks. Investment amount for such a terminal is around €250 M, i.e. approx. €500 M for both.
• Intermodal terminal (road-rail/rail-rail-terminal) in Estonia could either be located close to the car & truck terminal or in the Muuga area, depending on what is most rational. For the two terminals (Finnish and Estonian), the recommendation is to initially build two-three loading tracks and a small arrival/departure yard with three to four tracks, road system, gate and a small depot-area for containers and/or trailer. As the volumes increase, the terminals can be further developed accordingly. It is important to reserve sufficient neighbouring areas from the start for further devel-opment phases of the terminals. An assessment of the investment level of terminals described above is in the range of €25 M each.

44
8. Strategic Environmental Assessment
The Strategic Environmental Assessment (SEA) of the Finnish Estonian Transport link (FinEst link) involves analysis of options of perspective organisation of transportation of passengers and goods over the Finnish Gulf. Realistic 0 and 0+ (ferry connection and im-proved ferry connection) and tunnel options as well as tunnel technological options and location alternatives were considered.
The current SEA has been conducted as an informal procedure not following fully Es-tonian and/or Finnish relevant legal procedures. However, the best practice of SEA of infrastructure developments has been applied. The SEA is based on existing studies; no new inventories or baseline studies have been performed.
The aim of the SEA was to evaluate environmental impacts accompanying the execu-tion of the proposed activity, to describe and evaluate the alternatives, highlight positive impacts (advantages of evaluated alternatives) and planning measures for alleviating and avoiding possible negative impacts and to ensure the integration of environmental con-siderations into the strategic planning document (the Plan).
All significant environmental aspects related to planning of transport connections be-tween Tallinn and Helsinki and their consequences on sea and land are studied taking into account both building phase and operation phase impacts.
The significant impacts were identified as follows:
Aspect Possible impact
Climate Both construction as well as operation of the tunnel and related trans-port causes emissions of greenhouse gases and resulting effects on the climate. Tunnel construction would be responsible for the majority of the CO2 emissions, with 1 948 000 tons using Estonian electricity and 428 000 tons if Finnish electricity is used. Tunnel material transport via large bulk carriers would add 8 400 t of CO2 to the environment. Also building material, e.g. cement production produces considerable amount of CO2. Operation stage emissions are also greatly affected by the origin of the electricity used to power the trains transporting passengers and cargo. Every kWh of electricity produced in Estonia is responsible of 1 160 g of CO2
4 emitted into the atmosphere. This is due to the fact that large share of Estonian electricity is produced from oil shale, which is a fuel with one of the lowest kWh/CO2 ratio.Finnish electricity CO2 emission is 217 g per produced kWh5, which is 5.3 times lower, compared to the Estonian electricity.
4 Tallinna linna ja linnastu 2013. aasta CO2 heitkoguste inventuur. AF-Consulting AS work No. ENV1507, 2015.
5 Yksittäisen kohteen CO2-päästöjen laskentaohjeistus sekä käytettävät CO2-päästökertoimet. Motiva Oy, 2012

45
Aspect Possible impact
Groundwater and soil
Building and operation can cause changes in groundwater quantity and quality, especially on Estonian side. Planning process and construction should take into consideration of water quality and availability of wells in the region of tunnel constructions. On Finnish side in the Vantaa airport area there are challenges related to glycol residue in the groundwa-ter. Tunnel construction can facilitate relocation of glycol residues into groundwater if preventive measures are not considered.
Aquatic habitats Tunnel option will lower risk of accidents (e.g. oil spills) on the sea, if greater amount of logistics goes under the sea. During construction, careful safety management of maritime traffic in necessary to lower the risks. There is a possibility of long term wider impacts (release of toxins, changes in current systems etc), building of tunnel and especially arti-ficial islands will cause disturbance to habitats of underwater flora and fauna due to relocation of sediments. Artificial islands can cause changes in sediment flow by altering the course of existing currents causing thus changes in the conditions of sea habitats.
Terrestrial habitats and valuable objects (including Natura 2000 values)
For the Natura 2000 values the possible impact is with relevance to the wider biodiversity, building can cause habitat loss or disturbance, opera-tion can cause habitat disturbance (Pirita SAC on Estonian side). Natura assessment should be performed guiding careful design of solutions near Pirita SAC.
Community structure and city image
Improved mobility causes structural changes in regional scale in both metropolitan regions. Tunnel with related structures will induce also direct changes in community structure in both physical and social aspect in communities directly related to building and operation of tunnel. With structural changes also physical changes in city scape are expected.
Exploitation of natu-ral resources
Tunnel and related structures will need natural resources (apart from rock material e.g. high-quality sand). On the other hand, potentially suitable material for the building (e.g. roads in Estonia) will be made available as the tunnel exca-vation will produce excess rock material in estimated amount of 10 390 000 m3.
Land use On regional scale building process and tunnel and related train system operation can cause structural changes in land use. For instance, ma-terial storage will require land as well as commercial functions will be expected to replace agricultural land use, at least in Estonia. In Helsinki importance of mainland connections to the city ports will gradually have lesser effect on developing residential areas (e.g. boulevards develop-ment in ongoing Helsinki materplan). Similar tendencies will be expected in Tallinn.
Social aspects (property, wellbeing)
Proposed action may cause positive changes in property value and well-being due to increased mobility, several economic sectors will benefit. The development should be supported by special programs to promote even development of all important sectors.
Table 8.1 Significant impacts
46
A two-phase approach has been used in the SEA process: i) Comparison of the Strategic Choices with the SEA-objectives, and ii) comparative assessment of the strategic choices and technical variants on the basis of baseline criteria.
• On a strategic scale based on an objectives-led assessment a fixed link fulfils better environmental objectives; the exception would be building phase carbon emission that would be considerable. Based on a baseline led approach, the tunnel will have positive impact on sea ecosystems due to less pressure on coastal ecosystems as presumably commuter trains will replace to some extent fast ferries, that cause waves. However, the building and operation of artificial islands will have likely neg-ative impacts on marine habitats. The tunnel option will have less traffic impacts in urban systems (cargo). Indirect and social impacts are still largely positive but need supportive of strategic programs to maximise positive effect. Negative effects will be manifested due to considerable impacts to the climate during the construction phase.
• To continue with the tunnel option several studies have to be executed prior to and during the following development phases such as
• Study of impacts to the marine ecosystems (aquatic plants, invertebrates, fish, sedi-ments, water quality and flow)
• Study on maintenance and rock deposit site selection
• Natura 2000 study (with a focus on Pirita SAC)
• Study of indirect and cumulative impacts of tunnel to the Tallinn and Helsinki met-ropolitan regions
• Study of social and socio-economic impacts of tunnel.
47
9. Economic and Financial Feasibility Study
Estimated costs are presented in the following tables. Calculation and background calcu-lation sheets are attached to the report (excel sheets).
The cost estimation is divided to infrastructure investment costs and operation and maintenance costs. The investment of rolling stock is included in the operation and main-tenance cost section.
In the cost estimation, a tunnel length of 102.7 km is taken into account. The tunnel portal on Estonian side is situated approx. 4.7 km north from Iru junction as indicated in Figure 5.6 (“Alternative tunnel portal location”). However, this alignment is only base for the cost estimation and was not studied in detail. The vertical alignment will be finalised in a later phase of the project.
9.1. Infrastructure investment cost estimationAs state-of-the-art at feasibility study level, the accuracy of the cost estimation is +/-30%. The estimated prices represent mean values and are based on prices from benchmark projects with similar design solutions (tunnel concept, terminals, depots, stations, etc.). For FinEst project, the accuracy was refined by giving a lower and upper value of estimat-ed costs based on experience from each discipline’s expert. In the presented cost esti-mation, no additional costs for risk provision are included. According to Austrian tunnel guidelines, the typical risk reserve at feasibility study level is 24%.
The price base is for the cost estimation is autumn 2017 (Finnish MAKU 111 (2010 = 100)). No VAT is included.

48
Mean value Lower value Upper value
Tunnel Construction, shafts and artificial islands
8 426 300 000 € 7 583 670 000 €(-10%)
10 954 190 000 €(+30%)
Surface rail connections 217 000 000 € 195 300 000 €(-10%)
238 700 000 €(+10%)
Stations, terminals and depots
1 985 000 000 € 1 588 000 000 €(-20%)
2 580 500 000 €(+30%)
Rail technology and utility equipment
2 130 000 000 € 1 917 000 000 €(-10%)
2 449 500 000 €(+15%)
Material management 465 000 000 € 325 500 000 €(-30%)
604 500 000 €(+30%)
Owners costs 15% (plan-ning, administration etc.), environmental cost 3%, investigations 3%
2 776 900 000 € 2 397 000 000 € 3 483 600 000 €
Infrastructure investment TOTAL
16 000 200 000 € 13 811 170 000 € 20 072 290 000 €
Table 9.1 Infrastructure investment costs
9.2. Operation and maintenance costOperation and maintenance cost estimations are based on benchmark cost information from other similar projects (e.g. channel tunnel) and adjusted to FinEst Link solutions, conditions and traffic volumes. Operation and maintenance costs have been estimated for a lifecycle of 100 years, divided and stated in calculations for 1 year period.
OPEX AND MAINTENANCE COST Opex and maintenance cost / 1 year
Train operation and maintenance cost• rolling stock investment and replacement
(passenger shuttles, 22 trainsets, car and cargo shuttles 15 trainsets
• preventive and corrective maintenance of rolling stock
• energy costs• staff costs
67 660 000€ / year
Maintenance of infrastructure• maintenance and replacement of installations• railway• civil structures• energy cost of maintenance• maintenance equipment• staff costs
57 766 280€ / year
OPEX and Maintenance in total 125 426 280€ / year
Table 9.2 Operation and maintenance costs
49
10. Cost – benefit analysis
The elements of cost-benefit analysis are described in this chapter. The analysis includes all effects that can be appraised by means of a valid methodology and clear valuation crite-ria. The wider economic impacts of transport investment are not included in the standard cost-benefit analysis. However, the primary impacts of transport investment estimated in the cost-benefit analysis have been used to determine the wider economic impacts in the overall assessment of the Fixed Link.
The cost-benefit analysis is used to determine the economic feasibility of the investment. The analysis is carried out following and applying the general guidelines presented in the EU Guide to Cost Benefit Analysis of Investment Projects (2014). The national guide-lines are consistent with the EU Guidelines. The cost-benefit analysis is thus based on a well-documented and internationally accepted theoretical approaches and practices of transport cost-benefit analysis.
The cost-benefit analysis studies the difference between the Fixed Link in contrast to the reference scenario (0+ -alternative). The benefits and costs of the investment are dis-counted for the appraisal period to present value. The base year for the cost-benefit calcu-lation is the starting year of construction. Socio-economic discount rate in the calculation is according to Finnish guidelines 3.5 %.
Railway infrastructure project life cycle is 30 years after the operation of the tunnel has started. The increasing number of passengers, freight and benefits during the 30 years’ time is taken into account in the calculation.
10.1. Investment and MaintenanceThe investment cost includes also owner’s costs. Risk analysis and cost margins (low/high) have been examined in the sensitivity analysis. There are assumed to be no signifi-cant investment savings due to the Fixed Link. This means that the investments in the 0+ -alternative would also be made in the case of the Fixed Link alternative.
Construction of the Fixed Link is assumed to start 2025, construction time is assumed to be 15 years and the Fixed Link opened 2040. Project reference period is 30 years after the opening of the tunnel, i.e. 45 years (years 2025–2069). The residual value of the invest-ment at the end of the reference period is 47 % of the original investment cost, if the life cycle of the tunnels is assumed to be 100 years.

50
10.2. Consumer Surplus, Passenger TransportExpected time savings represent the most important element of the cost-benefit analysis and the travel time with the Fixed Link is an important starting point for the evaluation. The average time saving for a passenger changing mode from ferry to Fixed Link train is 2 h 10 min (components of savings are: travel time 120–40=80 min, waiting time 30–10=20 min and access times 50–20=30 min).
The improvement in supply conditions generates new traffic as the generalized travel costs between particular origins and destinations are reduced. The user benefit of new generated traffic can be approximated by a function known as the rule of a half, which uses the traffic volumes and generalized costs in different scenarios. The rule of half is the standard method in estimating the benefits of new and generated traffic. In essence, the rule of a half is a linear approximation to the consumer surplus measure of benefits. When changes are large, the linear approximation becomes inaccurate. However in this case, when we do not know the shape of the demand curve, the rule of half is the best available method for estimating the benefits. It should be noted that it can well be that the rule of half overestimates the benefits in this case.
Passenger volume estimations for the Fixed Link are based on rapid growth land use sce-nario. The rapid growth of land use in Helsinki and Tallinn can be seen as one result of the Fixed Link. According to the rule of half, every new passenger that starts to e.g. commute across the Gulf of Finland using the Fixed Link gets a benefit of 1 h 5 min.
Time savings are monetarized using unit values for different customer segments (com-muters, business travelers and leisure trips). Convenience factors take into account the effects in waiting times and changing from one transport mode to another. The unit val-ues of time for Finnish travelers are from the Finnish guidelines for assessment. The base year for the values is 2013 and the values are assumed to increase 1.125 % / a. The unit values are as follows:
• Business trips 23.7 € / h• Trips to work 10.7 € / h • Other trips 6.8 € / h.
The unit values for Estonian travelers are assumed to be 30 % of the Finnish values in year 2016 due to a difference in income levels. The Estonian values are assumed to in-crease faster than the Finnish ones, following the growth assumptions of the economies. Additionally, the Estonian unit values of time for commuters equal to the Finnish values.
In year 2050 the monetarized time benefits are given as time savings of the existing users, convenience factors of the existing users and benefits of new generated traffic.

51
10.3. Producers Surplus, Passenger TransportProducer surplus of transport operators takes into account the operating costs and revenues from transport services. Both the operators of the Fixed Link and ferries are considered.
The fares of passenger train tickets are: • 18 € / trip for single trips• 15 € / trip for frequent travelers• 12 € / trip for the users of 30-day card (480 €)• 70 € / car for transferring a private car in a shuttle.
In the cost-benefit calculation the tunnel operations have zero percent tax rate VAT. In this way, the assumption for VAT is the same for ferries and tunnel.
The passenger rail fare revenues are a result from number of passengers and the unit cost of passenger train tickets.
The operators of the ferries lose some of their revenues from transport services in the case of Fixed Link. It is assumed that there are 3 daily ferries less between Tallinn and Helsinki due to the tunnel, which has an effect on operating costs. Also the number of passenger is smaller, which affects fare revenues.
It is not possible to estimate all the effects of the Fixed Link to the ferry operators. This is because the ferries are used both by freight transport and passengers and the ferry com-panies also provide other services (restaurants, shopping etc.) on board.
10.4. Cargo TransportThe benefits of cargo transport originate from reduced operating costs between Helsinki and Tallinn. The benefits are not separated to users and producers benefits. The unit costs of cargo transport operation (including terminal costs) across the Gulf of Finland are assumed to be:
• Ferries: 15.6 € / ton, which represents the cost for the operator to transport cargo between Helsinki and Tallinn
• Fixed link truck shuttles: 12.3 € / ton and cargo trains: 5.8 € / ton – The average cost using the fixed link is 10.3 € / ton.
The benefit for the existing demand is 15.6–10.3 = 5.3 € / ton and according to the rule of half for the new demand 2.7 € / ton. Also the fare revenues from the new demand have effect on benefits.

52
10.5. ExternalitiesEmissions
Environmental impacts are external effects of the investment and the operation of trains and ferries. External effects are calculated using selected unit values for CO2, NOX and particles.
The tunnel uses a lot of electricity, which has a negative environmental impact. The im-pact depends on how the electricity is produced. In this calculation, the average proper-ties of Finnish electricity production for the energy of the tunnel are used.
Correspondingly, the number of ferries decreases due to the tunnel. It is assumed that there are about 3 daily ferries less between Tallinn and Helsinki. This has a positive en-vironmental impact. There is also less truck traffic on the streets of Helsinki and Tallinn due to the new location of terminals.
The environmental impact as a whole is small.
Accidents
There are no such accidents on railway traffic or sea traffic that should be taken into account in the cost-benefit analysis. Therefore, it is assumed that the fixed link has no significant effect on traffic safety or the number of accidents.
Calculation
The economic indicators presented as a result of the cost-benefit analysis are Economic Rate of Return ERR), Net Present Value (NPV) and the Benefit/Cost (B/C) Ratio.
• Economic Net Present Value (ENPV): The difference between the discounted total social benefits and costs
• Economic Rate of Return (ERR): The rate that produces a zero value for the ENPV
• Benefit/Cost Ratio: The ratio between discounted economic benefits and costs.
The investment cost used in the cost-benefit analysis is 12 206 M€, which is the discount-ed net present value of the actual investment cost 16 000 M€.
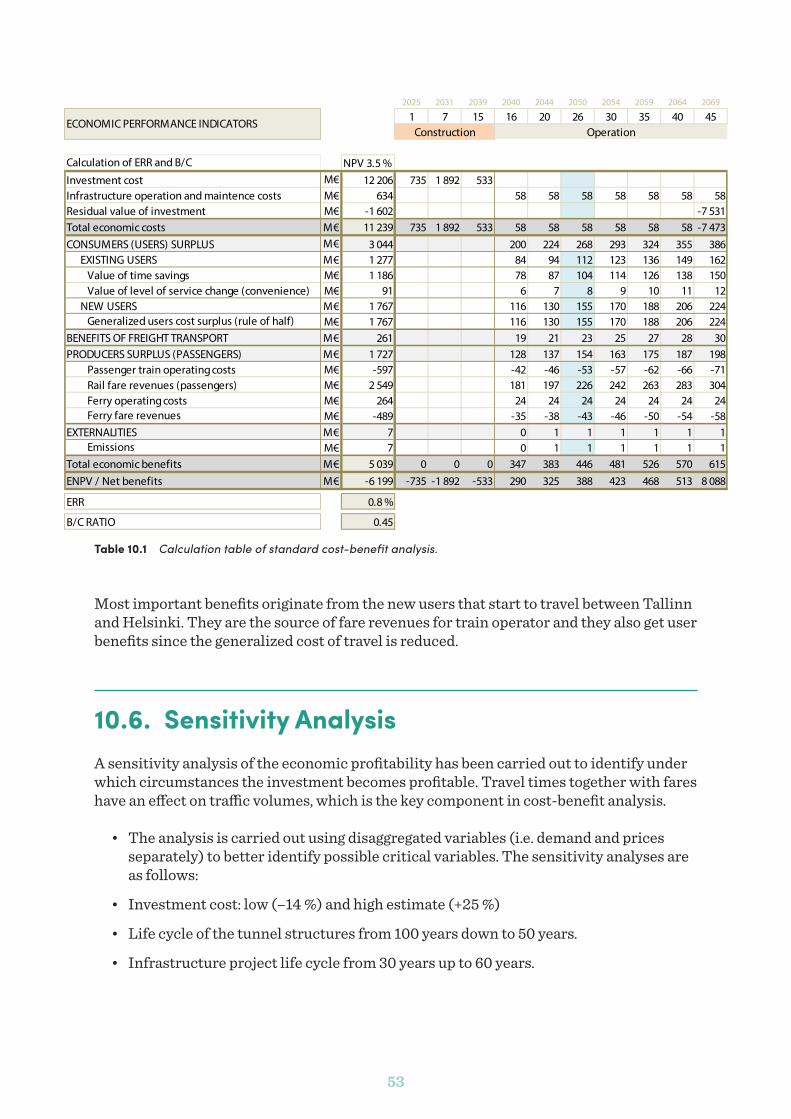
53
Table 10.1 Calculation table of standard cost-benefit analysis.
Most important benefits originate from the new users that start to travel between Tallinn and Helsinki. They are the source of fare revenues for train operator and they also get user benefits since the generalized cost of travel is reduced.
10.6. Sensitivity AnalysisA sensitivity analysis of the economic profitability has been carried out to identify under which circumstances the investment becomes profitable. Travel times together with fares have an effect on traffic volumes, which is the key component in cost-benefit analysis.
• The analysis is carried out using disaggregated variables (i.e. demand and prices separately) to better identify possible critical variables. The sensitivity analyses are as follows:
• Investment cost: low (–14 %) and high estimate (+25 %)
• Life cycle of the tunnel structures from 100 years down to 50 years.
• Infrastructure project life cycle from 30 years up to 60 years.
2025 2031 2039 2040 2044 2050 2054 2059 2064 2069
1 7 15 16 20 26 30 35 40 45
Calculation of ERR and B/C NPV 3.5 %Investment cost M€ 12 206 735 1 892 533Infrastructure operation and maintence costs M€ 634 58 58 58 58 58 58 58Residual value of investment M€ -1 602 -7 531Total economic costs M€ 11 239 735 1 892 533 58 58 58 58 58 58 -7 473CONSUMERS (USERS) SURPLUS M€ 3 044 200 224 268 293 324 355 386
EXISTING USERS M€ 1 277 84 94 112 123 136 149 162Value of time savings M€ 1 186 78 87 104 114 126 138 150Value of level of service change (convenience) M€ 91 6 7 8 9 10 11 12
NEW USERS M€ 1 767 116 130 155 170 188 206 224Generalized users cost surplus (rule of half) M€ 1 767 116 130 155 170 188 206 224
BENEFITS OF FREIGHT TRANSPORT M€ 261 19 21 23 25 27 28 30PRODUCERS SURPLUS (PASSENGERS) M€ 1 727 128 137 154 163 175 187 198
Passenger train operating costs M€ -597 -42 -46 -53 -57 -62 -66 -71Rail fare revenues (passengers) M€ 2 549 181 197 226 242 263 283 304Ferry operating costs M€ 264 24 24 24 24 24 24 24Ferry fare revenues M€ -489 -35 -38 -43 -46 -50 -54 -58
EXTERNALITIES M€ 7 0 1 1 1 1 1 1Emissions M€ 7 0 1 1 1 1 1 1
Total economic benefits M€ 5 039 0 0 0 347 383 446 481 526 570 615ENPV / Net benefits M€ -6 199 -735 -1 892 -533 290 325 388 423 468 513 8 088
ERR 0.8 %
B/C RATIO 0.45
ECONOMIC PERFORMANCE INDICATORSConstruction Operation
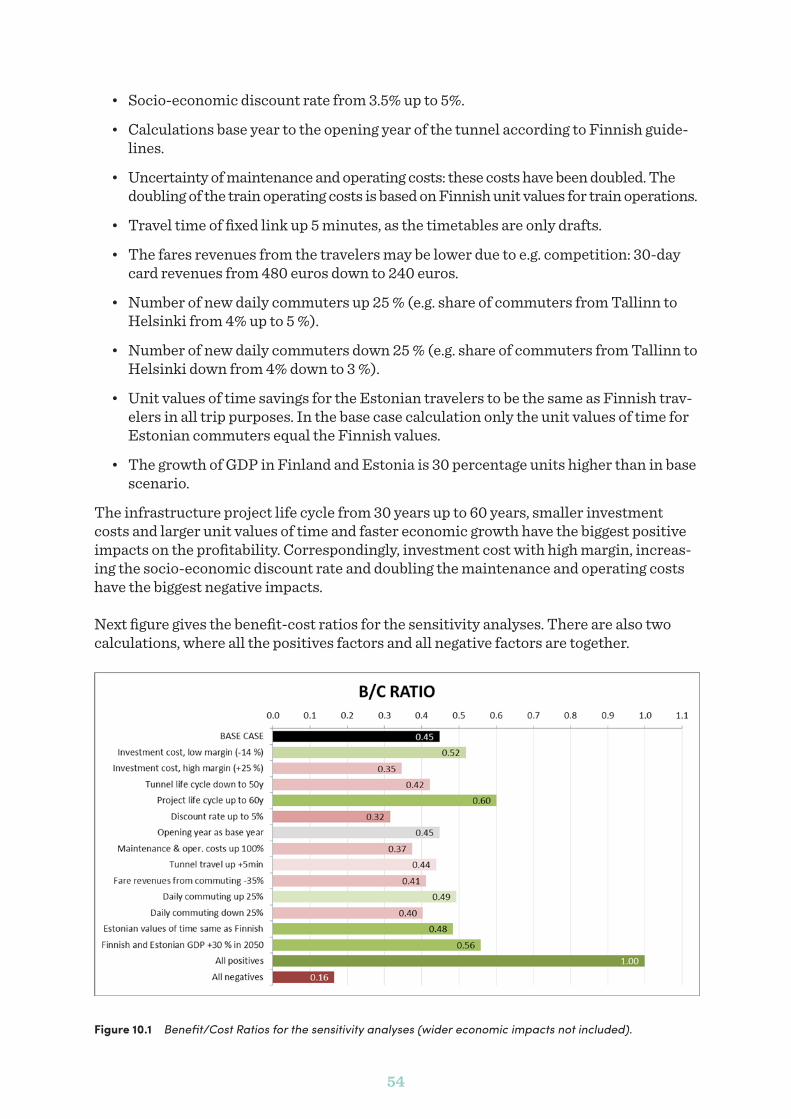
54
• Socio-economic discount rate from 3.5% up to 5%.
• Calculations base year to the opening year of the tunnel according to Finnish guide-lines.
• Uncertainty of maintenance and operating costs: these costs have been doubled. The doubling of the train operating costs is based on Finnish unit values for train operations.
• Travel time of fixed link up 5 minutes, as the timetables are only drafts.
• The fares revenues from the travelers may be lower due to e.g. competition: 30-day card revenues from 480 euros down to 240 euros.
• Number of new daily commuters up 25 % (e.g. share of commuters from Tallinn to Helsinki from 4% up to 5 %).
• Number of new daily commuters down 25 % (e.g. share of commuters from Tallinn to Helsinki down from 4% down to 3 %).
• Unit values of time savings for the Estonian travelers to be the same as Finnish trav-elers in all trip purposes. In the base case calculation only the unit values of time for Estonian commuters equal the Finnish values.
• The growth of GDP in Finland and Estonia is 30 percentage units higher than in base scenario.
The infrastructure project life cycle from 30 years up to 60 years, smaller investment costs and larger unit values of time and faster economic growth have the biggest positive impacts on the profitability. Correspondingly, investment cost with high margin, increas-ing the socio-economic discount rate and doubling the maintenance and operating costs have the biggest negative impacts.
Next figure gives the benefit-cost ratios for the sensitivity analyses. There are also two calculations, where all the positives factors and all negative factors are together.
Figure 10.1 Benefit/Cost Ratios for the sensitivity analyses (wider economic impacts not included).
55
11. Wider Impact Analysis
This section summarizes the analysis of the wider economic impacts. The analysis results estimations of the monetary values of main components of the wider eco-nomic impacts such as agglomeration, labour market and competition impacts. In addition, it includes a description on the effects on land use, and an estimation of the influence of the construction of the tunnel and the railway on the employment in the construction and other sectors. Finally, the section deals with the development potential and future visions of the cross-border integration of the metropolitan regions concerned.
Wider economic impacts6 (WEI) of transport projects refer to impacts beyond the di-rect user and producer benefits. Accessibility improvements due to an investment can affect the productivity of businesses directly or materialise through the labour market, the product market or the land and property market. Lower transport costs lead to lower production costs and better productivity. Productivity increases along with the growth of the size or density of a city or improved transport links between urban centres. Enhanced accessibility leads to larger labour market areas and affects employment rates and the in-comes of the working-age population. Transport investments improve the accessibility of areas and promote land development. These changes are closely related with direct user and producer benefits but they can also generate wider impacts.7
11.1. Framework and MethodsWider economic impacts arise because the benefit of a change in the transport system to society differs from the benefit perceived by an individual transport user. The sum of user benefits therefore does not represent the total gain to society. The mechanisms through which transport investments can create wider impacts and their relationship with user benefits from the perspective of passenger transport are illustrated in the figure below (Figure 11.1)
6 A literature review of the effects of transport investments to the regional economics is in appendix7 Venables 2016; Laakso & Kostiainen & Metsäranta 2016

56
Figure 11.1 Mechanisms through which transport investments create direct and wider impacts. (Venables 2016, Laakso & Kostiainen & Metsäranta 2016)
In the general evaluation instructions of transport projects8 it is noticed that major trans-port investments may cause wider impacts which will not be included in the direct user or producer benefits. The report mentions the productivity gains for firms, concentration gains, competition effects, and enhancement or densifying of labour market areas. Ac-cording to the instructions it is important to analyse wider impacts if they are expected to be significant. It is pointed out that estimated wider impacts must not be included in the standard cost-benefit calculation, but they should be presented separately. If signifi-cant wider impacts can be expected they should be analysed using appropriate methods. While the Finnish or EU’s evaluation instructions do not contain methodological advice for evaluation of the wider impacts, the methods presented in the Transport Analysis Guidance of UK9 have been applied. A more detailed description of the application of the UK guidance is in the appendix. However, the Fixed Link project is rather exceptional, the time horizon is very long, and there are a lot of uncertainties concerning the future economic environment, as well as strategies and policies of regions and cities and the behaviour of the potential users of the link. For this reason, alternative assumptions have been made concerning the key parameters applied in the model.
The framework of the user costs and benefits and wider impacts is based on socio-eco-nomic cost-benefit analysis. The aim is to assess all benefits and costs of a project to all actors in the society. The basic principle in the WEI framework and in the Transport Analysis Guidance is that only those impacts are counted which contribute to value added in the production sector (firms), or to the welfare of households in addition to direct user or producer costs and benefits. Consequently, the shifts of economic activity between regions, between industrial sectors, or between the public sector and households or firms,
8 Finnish Transport Agency 20119 Department for Transport 2014

57
are not included in WEI as benefits or costs. For example, population growth due to in-ternal migration or job growth due to location changes of firms should not be included as benefits, even when this kind of shifts may be interesting from local point of view. In ad-dition, the changes in income transfers from the public sector to households or change in tax income of the state or municipalities cannot be counted as net benefits because they are pure shifts of money between different sectors.
11.2. Assumptions of Economic and Demographic Developments The impact area of the Fixed Link is defined to cover:
• Finland (divided to Helsinki Region, other parts of Southern Finland, and rest of Finland)
• Estonia (divided to Tallinn region, Pärnu region and rest of Estonia)
• Riga region in Latvia.
The inclusion of Riga region and the separation of Pärnu region are based on the expected realization of the Rail Baltica. The study is based on several assumptions concerning the economic and demographic developments in the impact areas from year 2016 to 2050. The assumptions are based on research on the long run economic prospects and projec-tions10 and expert interviews11 in Estonia and Finland. The assumptions are based on a positive scenario of the growth potential of Nordic and Baltic countries and their major urban regions. In addition, in the sensitivity analysis alternative versions of some as-sumptions have been applied.
The growth assumptions are used to create a basic long run scenario for production, jobs and population in the impact area. When the values are used in calculations same val-ues and same assumption on the economic structures are applied in alternatives, 0+ and Fixed Link. The potential impulse effect of Fixed Link to the structural changes of the economies in the impact area has been dealt with in the end of this section.
10 OECD 2014; VATT 2015; Helsinki-Uusimaa Regional Council 201711 A summary of the interviews is in the appendix.

58
Assumptions about the growth rates from 2016 to 2050 at national and regional level:
National level: growth rates 2016-50
• GDP (real) – Estonia: 3 % p.a. – Finland: 2 % p.a.
Regional level (Tallinn region, Helsinki region): growth rates 2016-50
• Population – Tallinn: 1 % p.a. – Helsinki: 1 % p.a. – Riga: 1 % p.a.
• Jobs – Tallinn: 1 % p.a. – Helsinki: 1 % p.a. – Riga: 1 % p.a.
• GDP (real) – Tallinn: 4 % p.a. – Helsinki: 2,5 % p.a. – Riga: 2,5 % p.a.
For the years after 2050 all growth rates have been cut by 50 %, following the weakening growth rates in the OECD’s (2014) scenarios.
11.3. Agglomeration ImpactsChanges in the location of businesses resulting from changes in accessibility can lead to creation of larger and more compact business clusters because better transport links bring urban concentrations and their business centres closer to each other. This enables agglomeration benefits, which are created as trade, communication and other forms of in-teraction between businesses and their employees increase thanks to proximity. Studies show that agglomeration benefits have a positive impact on the productivity of business-es, although the impacts vary widely between sectors.
Productivity impacts are based on better possibilities to exploit scale effects in business, creation of localisation benefits (concentration of firms of the same sector near each other), and urbanisation benefits (diversity and big size of urban areas). Agglomeration benefits can be interpreted as externalities of transport investments, which create wider impacts but are not included in transport user benefits.12
12 Venables 2016

59
The Fixed Link would tie Helsinki and Tallinn regions and whole countries closer to each other. Effective Density is an indicator used to measure accessibility as a function of transport distance and economic size of regions. This study applies the following formula for calculating effective density.13
EDi = ∑j Ai / dijB,
where: i,j = region; Ai = number of jobs in the region; dij = transport distance or generalised transport cost between the regions; B = coefficient that determines the rate at which the impact of distance decays. The larger the B-coefficient, the more sharply the impact is diluted as distance grows.
The study of agglomeration impacts is based on estimated effective densities within the impact area (Finland, Estonia, Riga) at regional level (NUTS 4) for alternatives Alter-native 0+ (ferry connection) and Fixed Link (rail connection). The B-coefficient applied in this study is 2.5. Two alternatives for the productivity elasticity w.r.t effective density are applied in the study: 0.05 (base) and 0.025 (low). Parameter values are based on the research literature presented in the appendix. Annual GDP levels estimates at rough regional level are based on Eurostat statistics for 2014 and assumptions for GDP growth presented above.
The calculation of the agglomeration impact is based on equations of UK Department for Transport (DfT) (2014), Appendix D. The results represent total overall impact of agglom-eration without a division to different factors (scale, localisation and urbanisation effect). It is also supposed to include the indirect multiplicative effects of firm level growth im-pulses caused by the project.
The wider impact benefits have been calculated for 30 years starting from year 2040 when the link is assumed to be ready. According to the results the estimated discounted value for 30 years of the total productivity impact of Fixed Link will be about 1 800–3 600 M€ depending on the assumption concerning the agglomeration elasticity. The most sig-nificant impact will be in Tallinn region, 800–1 700 M€ (44 % of total impact) and slightly smaller in Helsinki region, 500–1 100 M€ (29 %). Significant impacts will also be allocat-ed to rest of Finland, 360–710 M€, rest of Estonia, 80–150 M€ and Riga, 30–50 M€.
Impact Alter-native
Helsinki region
Rest of Finland
Tallinn region
Rest of Estonia
Riga region Total
GDP, M€ p.a. at 2050 level
High 62 41 99 9 3 214
Low 31 20 50 4 2 107
GDP, M€, discounted, 30 years, 3,5%
High 1069 712 1653 153 54 3642
Low 535 356 826 77 27 1821* discounting factor 3,5 %
Table 11.1 Estimated agglomeration impacts in the regions of the impact area.
13 Graham 2007; Venables 2016

60
11.3.1.1. Labour Market Impacts
Transport investments can also create wider economic impacts in the labour market. As travel time and therefore travel costs decrease, the labour force achievable to businesses increases and, on the other hand, the area of potential jobs accessible to the labour force grows wider. The change in achievable labour force leads to an expansion of the labour market. This leads to an increase in labour supply and output, as the travel time saved can be used more on production.
The expansion of the labour market and shorter commuting times also lead to a better alignment between labour demand and supply as well as workers’ competence and em-ployers’ needs in that respect, which increases productivity.
The calculation of the labour market impacts is based on equations of DfT (2014), Appen-dix D.
Labour supply impact: Travel costs affect peoples’ willingness and opportunities to work instead of being unemployment or not active in the labour market. The change in labour supply estimation is based on the change in the generalised cost of commuting relative to expected after tax net earnings. Other factors affecting the number of labour supply increase are the elasticity of labour supply with respect to net wage and the num-ber of commuters between relevant region pairs within the impact area of the Fixed Link. The contribution to the production of a new worker in the labour market is the additional value of the worker measured in gross wage including all taxes and social fees. The lower productivity level of new workers is considered by a productivity level coefficient (com-pared with the average). Only the tax income to the society generated by the increased labour supply is included in the calculation to avoid double counting with direct user benefits.
The assumed parameters for labour supply impact equation are as follows:
• Elasticity of labour supply: 0.314
• Tax / labour cost ratio: 0.615
• Productivity ratio, new workers / average: 0.6916
According to the estimations the discounted value for 30 years of the GDP growth caused by increased participation to labour market will be about 1 000 million euros of which two thirds to the Helsinki region and one third to the Tallinn region.
14 Based on research in Finland, Laakso & Metsäranta 201715 Laakso & Metsäranta 201716 DfT 2014

61
Impact Helsinki region
Rest of Finland
Tallinn region
Rest of Estonia
Riga region Total
GDP, M€ p.a. at 2050 level 33 0 17 0 0 51
GDP, M€, discounted, 30 years, 3,5% 649 0 334 0 0 983
Table 11.2 Estimated labour supply impacts in the regions of the impact area.
Work shifts impact: Impacts of labour force shifts to changed jobs which may be more (or less) productive, are appraised in two steps. In the first step the effect of the transport in-vestment on the location of work is modelled. Then these results are used to estimate the change in productivity multiplying the change of job by the average productivity of each region (GDP/worker). The result is the change in total output resulting from the shift to jobs with location specific productivity for each year. Also in this case only the tax income contribution to the society is included as the benefit.
According to DfT Guidance the location modelling should be based on a Land Use Trans-port Interaction -model. In this study it is expected that the fast link would create new work due to productivity gains especially in Helsinki and Tallinn regions while the role of job shifts between regions would be smaller. In the Helsinki region the location analysis of the new and shifted jobs is based on the land use model developed for the MAL 2019 project17. In the model the change of jobs in the region is projected to year 2050 at detailed geographical level based on two factors: (1) land use restrictions set by municipalities in master level and detailed land use plans, and (2) the accessibility of each location. Ac-cording to the model there will be a shift of service jobs towards the best accessible loca-tions (inner city, major rail node zones and the Aviapolis zone near the Helsinki Airport) at the cost of less accessible locations. In Tallinn it is expected, based on land use plans and expert views, that most of new and shifted jobs will locate in the Ülemiste area and in the inner city (Kesklinn).
According to the estimations the discounted value for 30 years of the total labour market impact will be about 1 100–2 200 million euros, depending on the assumptions. The GDP impact will end up to the employers in the location region of the job. Consequently, while the majority of the existing and new jobs are in Helsinki, most of the of the work shift labour market effect, 800–1 700 M€ (74 %) will end up to the Helsinki region while the impact in the rest of Finland is negative due to the anticipated work shifts. The impact in the Tallinn region are 300–600 M€ (29 %) and in the rest of Estonia slightly negative.
17 See: https://www.hsl.fi/sites/default/files/uploads/2017-06-20_mal_yleiskalvosarja_englanti_pdf_0.pdf

62
Impact Alter-native
Helsinki region
Rest of Finland
Tallinn region
Rest of Estonia
Riga region Total
Work shift, GDP, M€ p.a., at 2050 level
High 9 0 0 3 0 11
Low 4 0 0 2 0 6
Work shift, GDP, M€, discounted, 30 years, 3,5%
High 1 677 -67 602 -20 0 2 192
Low 839 -33 301 -10 0 1 096
Table 11.3 Estimated work shift impacts in the regions of the impact area18.
11.4. Competition ImpactsOne of the potential impacts of transport investments is increasing competition between businesses and the resulting efficiency gains due to improved accessibility. The most significant impacts of transport investments are indirect impacts resulting from the decreased time for work-related travel and lower delivery costs, as lower costs and faster transport enable lower prices and higher output. These factors produce wider impacts both in terms of competition between businesses and the structure of the economy.19
In the Dft Guidance the evaluation of the competition impacts is based on the model where economic benefit is given as a function of savings from work-related travel, re-liability gains resulting from more predictable travel times and an “uprate factor” for imperfect competition. The uprate factor depends on the gap in the marginal cost of the product or service and the elasticity of demand.20
Based on this model, the impact can be assumed to contribute to the user benefits re-sulting from work-related travel. The impact is calculated as a 10% increase on the user benefits derived from work-related travel, based on an earlier study.21
The estimated impact of increased competition is significantly smaller that of agglom-eration or labour markets. Total discounted value for 30 years is estimated as 110 M€ of which 46 % to the Helsinki region, 23 % to rest of Finland, 22 % to Tallinn region, 4 % to rest of Estonia, and 6 % to Riga region.
18 Note: total impact is based on a cumulative sum of annual effects. 19 e.g. DfT 200520 Venables 199921 DfT 2005

63
Impact Helsinki region
Rest of Finland
Tallinn region
Rest of Estonia
Riga region Total
GDP, M€ p.a. at 2050 level 2,6 1,3 1,2 0,2 0,3 5,7
GDP, M€, discounted* 30 years 51 25 24 4 7 110
Table 11.4 Estimated competition impacts in the regions of the impact area.
11.5. Summary of Wider Impact Analysis According to estimations the discounted value of wider impacts measured in monetary value is 4 000–6 900 M€, depending on the assumptions. The biggest component is ag-glomeration effect, 52 % in the base alternative, and second biggest work relocation effect, 32 % in the (base).
Half (50 %) of all the wider impacts is allocated to the Helsinki region while the share of Tallinn region is 38 %. The share of the rest of Finland is 10 % , rest of Estonia 2 %, and Riga region 1 %, respectively.
Impact factor M€ p.a. Year 2050 M€ 30 years discounted
Low Base Low Base
Agglomeration impact 107 214 1 821 3 642
Labour supply 51 51 983 983
Work relocation* 6 11 1 096 2 192
Competition 6 6 110 110
Total 169 281 4 010 6 928
Table 11.5 Summary of the wider economic impacts by impact factor.
Alter-native
Hel-sinki
region
Rest of Finland
Tallinn region
Rest of Estonia
Riga region Total
Total impact, M€, 30 years discounted
Base 3 446 670 2 613 138 61 6 928
Low 2 073 348 1 485 71 34 4 010
Table 11.6 Summary of the wider economic impacts by region.
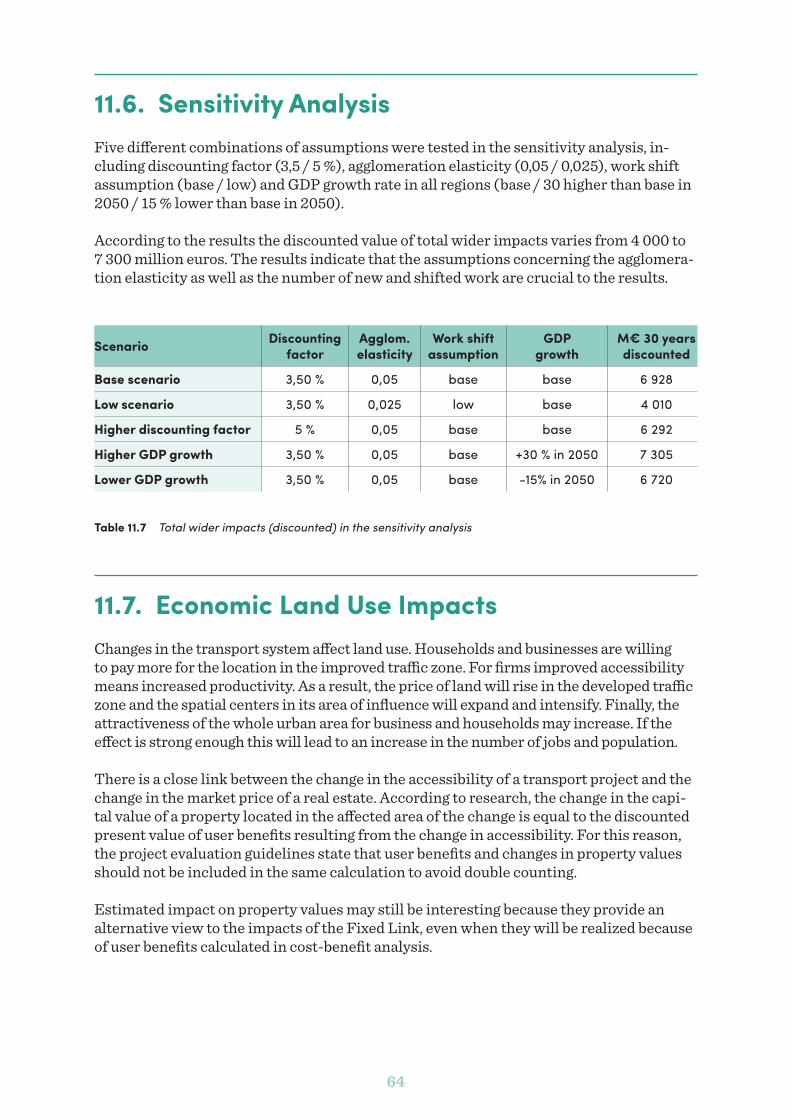
64
11.6. Sensitivity AnalysisFive different combinations of assumptions were tested in the sensitivity analysis, in-cluding discounting factor (3,5 / 5 %), agglomeration elasticity (0,05 / 0,025), work shift assumption (base / low) and GDP growth rate in all regions (base / 30 higher than base in 2050 / 15 % lower than base in 2050).
According to the results the discounted value of total wider impacts varies from 4 000 to 7 300 million euros. The results indicate that the assumptions concerning the agglomera-tion elasticity as well as the number of new and shifted work are crucial to the results.
Scenario Discountingfactor
Agglom.elasticity
Work shiftassumption
GDP growth
M€ 30 years discounted
Base scenario 3,50 % 0,05 base base 6 928
Low scenario 3,50 % 0,025 low base 4 010
Higher discounting factor 5 % 0,05 base base 6 292
Higher GDP growth 3,50 % 0,05 base +30 % in 2050 7 305
Lower GDP growth 3,50 % 0,05 base -15% in 2050 6 720
Table 11.7 Total wider impacts (discounted) in the sensitivity analysis
11.7. Economic Land Use ImpactsChanges in the transport system affect land use. Households and businesses are willing to pay more for the location in the improved traffic zone. For firms improved accessibility means increased productivity. As a result, the price of land will rise in the developed traffic zone and the spatial centers in its area of influence will expand and intensify. Finally, the attractiveness of the whole urban area for business and households may increase. If the effect is strong enough this will lead to an increase in the number of jobs and population.
There is a close link between the change in the accessibility of a transport project and the change in the market price of a real estate. According to research, the change in the capi-tal value of a property located in the affected area of the change is equal to the discounted present value of user benefits resulting from the change in accessibility. For this reason, the project evaluation guidelines state that user benefits and changes in property values should not be included in the same calculation to avoid double counting.
Estimated impact on property values may still be interesting because they provide an alternative view to the impacts of the Fixed Link, even when they will be realized because of user benefits calculated in cost-benefit analysis.

65
An analysis of the accessibility change at detailed geographical level due to FinEstLink has been carried out. In Helsinki the impact is mainly based on commuting from Tallinn region and on business trips to potential business locations. According to the results the accessibility change decreases fast with respect to distance from the stations and after 400 meters the impact is relatively low. Consequently, the price effect will be focused on business property around the stations about within the radius of 400 m.
According to estimations (Fixed Link v.s. Alternative 0+) the impact on the market value (euros/floor space) of built property will be in Helsinki 3–5 % in the station zones of city centre and Pasila and about 10 % in the Airport zone. In Tallinn the impact will be 5–15 % in a wide zone around the Ülemiste station and airport, and in the central city.
11.8. Effects of Construction on EmploymentMajor transport investments generate large production, employment and tax revenue impacts of construction, which are based on both direct effects and significant indirect effects affecting the construction chain of production for industry and services. The con-struction has an influence on the business and employment in the surrounding areas. For this reason, economic impacts are interesting from regional point of view.
However, according to evaluation instructions the economic impacts of the construction must not be included in the cost-benefit analysis or WEI calculation for the following reason:
The socio-economic cost-benefit analysis of a transport project is based on comparing the impact of a project with another option (in this case Alternative 0+). In a comparison option, no investments are made, or they are relatively small, whereby the public resourc-es corresponding to the investment are available for other public or private consumption. From national point of view this result similar kind of direct and indirect effects than the investment in the transport project. It is generally assumed that these alternatives are of the same order of magnitude as the project alternatives, but their allocation to different industries or regions may differ significantly.
The cost estimate22 of planning and construction of the Fixed Link (without rail tech-nology and utility equipment and material management costs) are about 13 400 M€. The estimated23 direct employment impact of the investment during the construction phase (15 years) is 82 000 person-year (5 500 p.a.) and total impact (including indirect and mul-tiplicative effects) is 159 000 person-years (10 600 p.a.).
22 Based on infrastructure investment cost estimation, mean value (Executive summary WP3 01/2018).23 Based on coefficients derived from input-output statistics of Statistics Finland from year 2014:
industries 42 Civil engineering (construction of roads and railways, utility projects and other civil engi-neering projects) and 71 Architectural and engineering activities.

66
11.9. Visions on the Cross-Border Integration and Structural Changes According to research literature24 accessibility – based on functional and efficient trans-port infrastructure and services – has a close link to the location choices of firms and households, and economic growth. Investments in infrastructure have an impact on the integration of functional regions at national and international level. However, the infrastructure is not alone sufficient for deepening integration, especially concerning cross-border integration. The development of economic, socio-cultural and political structures need to become part of the process. At political level an overarching vision for the future of the cross-border region and good governance conditions are needed, too.25
To a certain degree the differences in economic structure, innovation capabilities and cost structure create the foundation for cross-border growth, the potentials to reap ben-efits from unexploited complementarities and synergies. Simultaneously, as some of the differences create the main driving force for cross-border growth, they also form barriers hindering successful integration.26
Numerous studies have been carried out on the economic impact of new high-speed rail connections. Heavy investments in transport often involve political expectations of major developmental impacts. However, based on the literature, these are rarely realized. In de-veloped countries where the transport infrastructure network has already well developed, additional investments do not in automatically lead to economic growth27. In the success-ful cases the investment has been supplemented with supporting measures to exploit the benefits of the investment, like developing the land use of station zones and investing in connecting transport services. Another important success factor is the strategic coopera-tion at several levels between the regions connected.
One of the successful cross border transport investments has been the Oresund bridge be-tween Copenhagen and Malmö, opened in year 2000. The bridge connected the manufac-turing and port city Malmo having severe structural problems in the 1990s and Copenha-gen region with fast growing service sector with shortage of labour. The poor connections between the regions had become a bottleneck for the development of cross-border labour markets, the connections to Kastrup Airport and cooperation between the universities and research institutions of the regions, among others. The investment was linked with a strong vision of the integration with multiregional strategic cooperation, including major urban development in both sides common regional transport system and active cooper-ation between the research and development institutions. Consequently, Malmo region has experienced a deep structural change of the economy and growth of population and production since the year 2000.28
24 See the literature review in the appendix.25 Banister & Berechman 200026 Lundquist & Trippl, 200927 Banister & Berechman 200128 Andersson et al. 2013
67
Selected specialists in Tallinn region and Helsinki region were interviewed during this study concerning the views of the regional developments, cross-border integration, and visions and strategies of the cooperation with the view of the impact of Fixed Link on those themes.
A general view is that economic and social integration between Helsinki and Tallinn re-gions has already proceeded a long way, fuelled by transport connections based on regular ferry service with 2 hours crossing time. Another important factor is the complementari-ty of the economic structures as well as social, cultural and linguistical proximity.
Salary and price level differences are remarkable but in the long run they will diminish and become a less important factor as the driver of economic relations and cross-border work. Economic integration has been supported by direct investments from Finland to Estonia. The growing trend is increasing activity and investments of Estonian firms in Finland. Further integration is expected to take place even with the present transport system: the mobility of people, goods and cargo is growing continuously. However, some of specialists expect the growth to slow down in medium term because of some sort of saturation.
All specialists agree that if Fixed Link will be realised it will speed up the integration as well as the shrinking of the salary and price level gap.
To exhaust maximally the benefits of the fixed link a common development strategy is needed both at regional and national level. A concrete suggestion is a Regional Develop-ment Strategy at national level, followed by TwinCity strategy and action plan on city lev-el. The model of the strategic cooperation in the Öresund region should be accompanied so some extent. Another step required would be concrete measures which benefit citizen, firms, universities and administration in both countries.

68
12. Risk ManagementRisk assessment for FinEst Link has been done according to the existing risk manage-ment guidelines. Also, European guidelines have been followed, where applicable. The risk management process has involved the whole project from preliminary study phase to maintenance phase and has taken into account the different alternatives of the project. The focus of the risk management is in the feasibility study phase and the risks that may be managed in this design phase. During the project, there has been co-operation with the work packages to help to concentrate the work into the significant risks related to the feasibility study. Work packages have been able to update the hazard logs in the project place during the whole project. The risks have been identified and evaluated in the risk workshops and in the project meetings. A total of five separate risk workshops have been held. The risks have been collected for the Alternative 0+ and for the tunnel alternative. Risk management has been helpful to keep the focus of the feasibility study project in the most significant risks.
A total of 100 risks have been identified and evaluated concerning alternative 0+ of the FinEst Link project and a total of 175 concerning the tunnel alternative. Some of the risks are similar or the same to both alternatives, but the magnitudes of the risks in the tun-nel alternative are higher in average than the risks of the Alternative 0+. The reasons for higher risks in the tunnel alternative are that the alternative 0+ relies mostly on existing infrastructure, whereas the tunnel alternative is more likely to have a bigger influence on the transportation system and to require bigger investments, more exceptional structures and more project resources.
The biggest risks in the beginning of the project were related to technical risks and proj-ect risks of the feasibility study.
• Technical risks were related to designing a functional railway system in a tunnel for both passenger and freight traffic Functional solution for the railway system was solved.
• Project risks were related to managing the organization consisting of many work packages and stakeholders and keeping the project entity and decision making under control during the relatively short feasibility study phase. Results were obtained in schedule, but especially document control and management can be improved in future phases.
• Media and social media risks were related giving wrong information or getting people against the tunnel independent of the results. These risks were not real-ized and the feasibility study could concentrate on the study itself, thanks to a com-peting study about the tunnel.
Further questions about the design and implementation of the tunnel option need to be solved in future phases. Considering the further design phases of the project, the biggest risks and the needed measures to keep them under control are the following:
69
• Cost and impact calculations: The details of the calculations need to be reviewed, as the planning proceeds and more detailed technical information is obtained. In addition, the charges for heavy traffic and congestion charges need to be taken into account in further studies.
• Environmental risks: Construction of the tunnel and the implementation of the artificial islands contain environmental risks that requires more detailed investiga-tion. In addition, the ground water quality needs to be ensured during the construc-tion especially in Vimsi Peninsula, Helsinki Vantaa airport site and Päijänne water tunnel. The glycol under the Helsinki Vantaa airport needs to be considered as well.
• Construction risks: Construction in demanding circumstances requires more de-tailed analysis of possible ways to construct the tunnel. Especially material logistics and providing the power supply have been identified to be critical for construction.
• Safety and security demands: Tunnel length and the amount of traffic sets high requirements to the safety and security, which may differ in different countries. Co- operation with the safety authorities from both countries is needed in next phases.
• Project risks: Many risks were related to the project itself, both within the proj-ect and outside of the project. Risks within the project includes the risks about the personnel resources and know-how. Key resources to the project, also the partner re-sources, need to be reserved for the project full time. The organization model needs to be planned so that the project organization includes a small client organization with know-how enough the manage the project. The steering group of the project needs to consider also other aspects related to the tunnel project, such as ticketing system and smart mobility. The financial model is also a critical aspect to the success of the project and needs to be considered in the early phase of the project.

70
13. BenchmarkingThe aim of the benchmarking study has been to provide a point of reference for the proj-ect to which it can measure its performance both from a technical perspective, and from an economical perspective. The benchmarked projects have been defined in co-operation between the WP4 consultants and the FinEst Link project.
13.1. Technical benchmarkingThe selected peer projects and their technical characteristics are presented in the table below:
Channel tunnel Gotthard base tunnel
Brenner base tunnel
Mont d’Ambin base tunnel FinEst Link
Status In operation In operation Under construction
Under construction Planning
Completion (*estimated) 1994 2016 2025* 2029* 2050
Tunnel length 50.5 km 57.1 km 55.0 km 57.5 km 102.3 km
Tunnel layout2 bores with
one track1 service tunnel
2 bores with one track
2 bores with one track
1 service tunnel
2 bores with one track
2 bores with one track
1 service tunnelTunnel diameter 8.8 m 9 m 10.5 m 10.5 m 10 m
Service tunnel Yes, diameter 5.8 m No Yes,
diameter 6 m No Yes, diameter 8 m
Passenger cross-overs between tunnels
Every 375 m, from running
tunnels to ser-vice tunnel
Every 325 m, between run-ning tunnels
Every 333 m, between run-ning tunnels
Every 333 m, between run-ning tunnels
None
Train crossovers Two, with cross-ing tracks (x)
Two, non-crossing
tracks (/\) None
One, non-cross-ing tracks (/\).
Also two passing tracks
between cross-overs.
Three, non-crossing
tracks (/\)
Emergency stations None Two Three One None
Type of geology Chalk marl Crystalline rock
Various, including
tectonic plate boundary.
Complex geology
Mostly crystal-line Precam-
brian bedrock of gneisses and
granitoids
Construction meth-ods 11 TBMs
4 TBMs (= 91 km)
Drill & blast (= 23 km)
3 intermediate access sites
9 TBMs (= 77 km)
Drill & blast (= 33 km)
3 intermediate access sites
8 TBMs + drill & blast
4 intermediate access sites
Proposal to create 2 artificial islands as inter-mediate access.
Spoil material 7,500,000 m³ 13,300,000 m³ 11,100,000 m³ 14,700,000 m³ 21,600,000 m³
Table 13.1 Technical benchmarks summary with tunnel construction cost factors29
29 Sources for data presented in the table can be found in the full FinEst Link report references

71
All of the tunnels in this benchmark are twin-tube tunnels with a single track in each. In terms of length, the tunnels are somewhat comparable to each other, in the range of 51–58 km. The planned FinEst link is significantly longer at over 100 km. The schematic overview of the benchmarked tunnels are shown in Figure 13.1.
Figure 13.1 Schematic overview of the technically benchmarked tunnels projects (black are running tunnels, red is service tunnel, work access points are the places from which the tunnels were constructed)
Both the passenger as well as the freight demand are lower for the FinEst Link tunnel than for its peers as can be seen in Figure 13.2 below:
Figure 13.2 Passenger and freight demand just before opening of operating tunnels and current demands on projects under construction or in the project phase
The FinEst Link tunnel has higher growth perspectives than current projects or the benchmarked tunnels in use. The foreseen increase in demand for FinEst Link is based on the move from current weekly commuting to daily commuting and a market increase between Helsinki (and further) and Tallinn (and further).

72
After normalizing the project capex to 2016 Finland euros, a comparison has been made between the five tunnels shown in Figure 13.3. The lowest capex can be found in the Gotthard base tunnel. The two tunnels still under construc-tion are somewhat comparable in costs, while the Channel tunnel had the highest investment cost (capex):
To facilitate a comparative cost com-parison among the peer tunnels, only the tunneling costs, tunnel systems, rail systems, project management and con-necting track cost are taken into account (for example terminals and rolling stock are not taken into account in the compari-son). The results are shown in Figure 13.4 below.
From the results following can be concluded:
• The FinEst Link estimations come close to the estimations for the Gotthard Base tunnel (with a smaller diameter) and the Mont d’Ambin tunnel (with a bigger diame-ter), however, these are both tunnels without an extra service tunnel.
• The Channel Tunnel has the smallest excavation diameter, but the highest cost per tunnel length (as expressed here in the length between tunnel entrance and exit, not in the total tunnel length excavated)
Figure 13.3 Cost comparison between the bench-marked tunnels in normalized Finnish 2016 Euro’s
Figure 13.4 Cost expressed in normalized EUR(2016) for Finland excluding stations and terminals and rolling stock (2=2 running tunnels; 3=2 running tunnels + 1 service tunnel)

73
• The Mont d’Ambin tunnel is most expensive per km of tunnel for a double-tube tunnel, probably due to the extra excavations necessary for the intermediate stations (including extra tracks)
• The Brenner Base Tunnel and Channel Tunnel, both 3 bore tunnels thus including a service tunnel and comparable to the FinEst project are 35–70% more expensive per tunnel kilometer than the current estimations of the FinEst Link tunnel project.
The low cost for the FinEst can be justified with geological conditions. However, from a logistics point of view the FinEst Link tunnel is more comparable to the Channel Tunnel, than to the other peer tunnels with a higher number of intermediate access points.
13.2. Economical benchmarkingOne major organizational challenge of the FinEst Link tunnel project is that it is a cross-border project between two EU countries and two capital regions. Several projects can be identified which have similar characteristics and will provide a good reference for the FinEst link project. The following were selected for study in the economical bench-marking:
Channel tunnel
Oresund fixed link HSL zuid
Brenner base tun-
nel
Fehmarn Belt fixed
link
Mont dont dl base tunnel
Status In opera-tion
In opera-tion
In opera-tion
Under construc-
tionPlanning
Under construc-
tion
Type Railway tunnel
Combined rail/road bridge/tunnel
High speed rail-
way line
Railway tunnel
Combined rail/road
tunnel
Railway tunnel
Completion (*estimated) 1994 2000 2009 2025* 2028* 2029*
EU-grants No Yes No Yes, 40% of total costs
Yes, 16% of total costs
Yes, 40% of total costs
Public-private financing Private Private
Partly pri-vate, part-
ly public Public Private Public
User financed structures Yes Yes No No Yes No
Table 13.2 Economical benchmarks summary30
30 Sources for data presented in the table can be found in the full FinEst Link report references

74
The economical benchmarking projects can be split into two categories in terms of funding and organization shown in Figure 13.5. The organization responsi-ble for building and operating the Chan-nel Tunnel was a private consortium of construction and engineering firms and banks. This is the only example of a pri-vately organized and financed project in this benchmark.
In the benchmark, five projects are cross-border between two EU countries. The only ex-ception in this benchmark is the HSL-Zuid project in the Netherlands, which is a domes-tic project. Except for the Channel tunnel, all of the cross-border projects have received EU grants.
Figure 13.6 Cost estimations for different projects indexed around the start of construction (when the exact amount is fixed in a contract) and standardized in 2016 Finnish Euros
In Figure 13.6 above, the cost estimation for several projects can be seen in the differ-ent phases. The projects all show a linear increasing trend throughout the projects time frames. The maximum increase can be found in the case of the Channel tunnel. The main reason for the increase in final cost for the Channel tunnel has been identified as prob-
Figure 13.5 Positioning of the different projects for their organization and financing

75
lems with overall project management and interfaces and changes in requirements in safety, environment and security.
13.3. Benchmarking conclusions and issues to consider The main conclusions from the benchmark are the following
1. The FinEst Link has lower projections for the combined freight and passenger de-mands than the compared projects. As a result, the expected revenues are lower.
2. The demand for FinEst is largely based on the commuting market, which does not yet exist at the level of the demand estimates, while the peer projects tap into exist-ing markets.
3. The projected cost for FinEst link is lower than for peers. Given the fact that similar construction technologies are used, it is possible that the cost could be higher/ in the range of peers.
4. Benchmark projects indicate cost increases between feasibility study and project finish of a factor 0.5 to 6 in the compared projects with no experiences of reducing costs after construction start.
5. Several alternative financing and funding options are available which have shown their value and can be of interest for the FinEst project

76
14. New technologies
14.1. GeneralDigitalization is reforming transport services and business models already in short run. In infrastructure projects with a long-time horizon one has to take into account also fun-damental technology developments in transportation.
For these reasons the FinEst Link project in cooperation with FinEst Smart Mobility project launched an open international challenge for technology developers to provide new solutions of two types:
How the fixed link to connect Helsinki and Tallinn could be designed and implemented? What could be the best technology and implementation model in terms of economy, im-pacts and risks?
How the present transport system and services based on fast ferries could be improved in terms of economy, impacts and risks? This was done with Estonian Prototron OÜ
As the FinEst Link project looked at the feasibility of a conventional railway tunnel with existing and commercially existing technologies and possibilities for developing the 0+ alternative (i.e. current ferry system), the project searched for new ideas in terms of innovations and new technologies. FinEst Link project invited ideas of solutions for the tunnel as a whole or for parts of it with explanation on how the solution meets the follow-ing objectives and their indicators:
Facilitate daily commuting: travel time, ticket price
Smooth travel chains: 60 min. door-to-door labour market accessibility, access to global flight connections
Effective freight transport chains: delivery time, frequency, freight safety, price
Improved sustainability: less direct emissions, improved life cycle sustainability
Improved safety and security: implementation risks, risks of incidents and accident
Improved traffic management in city centres: less congestion in city centres
Economic viability: need of public support, effects on market competition
Prototron is tech-ideas prototyping fund which provides financing and consulting for im-plementation ofideas, inventions, devices and solutions that make our everyday life easier, more convenient and comfortable.

77
The aim of Prototron isto encourage smart and enterprising people through a cash injec-tion for carrying out their ideas, turning them into tangible prototypes and into a major business. It is an all-Estonian competition of ideas, the participants of which are men-tored by experts from various fields, in order to prepare the idea and the team for the final pitch before Prototron Expert Committee.
The best ideas will receive start-up funds of up to € 35,000, legal support, corporate mar-keting channels and 6 months of incubation in Tallinn Science Park Tehnopol Startup Incubator to prepare the startups for market entry and investment readiness.
Submitted ideas are evaluated by pre-assessors of Prototron, that is to provide feedback to participants and select 40 best teams that will be offered educational seminar. Next step will be to narrow competition to TOP20, that participates on Mentors’ Day to get personalized mentoring for preparation of their ideas to the final presentation. During the Mentors’ Day TOP10 selected by mentors will get an opportunity to pitch their ideas to Prototron Expert Committee, and the best of those will receive prototyping financing, 6 months of Science park Tehnopol incubator services and Hedman Lift legal aid.
Prototron has a competition of the type 2 innovations. They received 3 applications for FinEst Link challenge. Two of them is then changed to type 1 innovation and it is ex-plained in that part. The reason only few proposals in type 2 might be that FinEst Smart mobility has same time competition of piloting project where is too funding for this.
FinEst Link project get 6 registeration for type 1. Hyperloop and AL Engineering OÜ reg-istered for type 2 competition. The proposals are more as solutions for new technology.
The project send the baseline information includes the following materials:
• the geological data from the survey on the structure of the seabed between Helsinki and Tallinn
• general cost estimations in tunnel construction
• transport statistics and future demand estimations
• technical concept of conventional rail tunnel
• information on spatial planning in Tallinn and in Helsinki
The participation in the FinEst Link new technology challenge is voluntary and there are no award prizes or remuneration provided by the project
78
14.2. Evaluation of the proposalsPrototron evaluated 3 proposals of type 2. Two is after evaluation changed as proposal type 1.
Truck Forward
Truck Forward is a mobile app with geolocation function, a mobile assistant/digital navi-gator for truck drivers. It can help logistic enterprises deliver cargo faster.
Compared to other GPS-navigators, this app has a more detailed description of road pa-rameters, so it can save a driver’s journey time while delivering cargo.
The data is generated thanks to crowdsourcing and is saved into a database for further usage. This database can help with better planning of logistic networks and optimising the transport sector infrastructure.
TruckForward can also simplify the implementation and using of self-piloted vehicles in the near future.
One innovation named “Truck Forward” was lucky to reach to Prototron TOP10 (finals). TOP10 teams (included Truck Forward) have got an opportunity to pitch their ideas be-fore the investors and guests on the sTARTUp Day in Tartu on the 8th of December 2017 (https://startupday.ee/). Project “Truck Forward” have got also opportunity to present their idea to Prototron Expert Committee and get feedback.
The FinEst Link project evaluated six type 1 proposals, and all was approved to be intro-duced in the FinEst Link final conference (February 2018), and in relevant parts in the final report of the project.
Virgin Hyperloop One
Hyperloop is a new mode of transportation designed to move freight and people rapidly, safely, on-demand and direct from origin to destination. Passengers or cargo are loaded into a hyperloop pod and accelerate gradually via electric propulsion through a low-pres-sure tube using magnetic levitation. The presented system is at this stage early stage of development and would integrate with existing railway systems. Virgin Hyperloop One has completed three phases of testing on the first full-scale Hyperloop system in Nevada.
The outcome would be very different from the current concept for FinEst Link. Maximum speed for the system would be about 1,000 km/h enabling short travel times and system capacity would be based on requirements defined in further feasibility studies. Innova-tion potential is significant, but safety and technical standards for the system would need to be created in tandem with local regulators and practical implementation (schedule, cost, feasibility) would need to be determined by future feasibility studies.
79
Ankurtunnel
Underwater concrete anchored tunnel is based on potential technology that exists on design and concept level. The solution could be feasible from a technical viewpoint. The presented solution only includes detailed calculation for the subsea section of the system, so the overall cost for the FinEst Link system is difficult to estimate precisely, but by the proposal it is roughly estimated as 8.5 billion euro. Proposal is directed to achieve short-ening of the tunnel length comparing to the conventional underground tunnel and so to reduce the overall cost of the fixed link, but it makes difficult to estimate the exact cost of the technical solutions needed for landing utility connections.
The alternative Porkkala alignment does not achieve the transport system goals set to the FinEst Link system and the Jätkäsaari surface alignment does not seem feasible. In Tallinn the Viimsi peninsula could be a feasible alignment alternative. The Paljassaare alignment is not available for the system, but as from the Kopli kaubajaam (Kopli cargo station) to the Paljassaare peninsula is located old railroad area (state owned land proper-ty, not reformed), it will be possible to apply for use for fixed link.
One tube could be a challenge from an operations viewpoint (no redundancy and uncer-tainty regarding maintenance, especially over the long term). The technology is feasible, but engineering solution based on tension could be an issue from technical viewpoint. The floating tunnel is unprotected from outside, which could pose substantial need for shipping industry restrictions (like with Nordstream gas pipeline) for avoiding collision and anchoring risk. To tunnel user safety is proposed novel escape technology with escape capsules and it could be useful and, in some cases, offers even higher escape possibilities than conventional underground tunnel escape solutions.
Additional goal of the present solution is to highlight the novel tunnel building solution, which could be used for promoting Estonia and Finland as inventive nations around the world.
AL Engineering OÜ – Linear Motor Tube
The proposal is based on alternative transport solution, using inductive linear motors and magnetic levitation. The presented system is at this stage on idea level. The system would work separate from existing logistics and railway systems. The model is based on cap-sules/modules and offers flexibility to arrange train operation based on demand especially for lower capacity requirement levels. The proposal would be an innovative new transport technology concept.
The proposal includes a solution for part of the FinEst Link system but does not present connections to existing transport systems in both countries. The proposal also does not take into account the traditional railway-based tunnel solution. Realization of technol-ogy, described in proposal, requires special applied research and technology integration investigations.

80
SwissRapide AG
The proposal is based on the proven Swiss/German ultra-highspeed magnetic levitation (Maglev) rail system. The technology is currently in use in China and Japan and has been shown to be technically feasible. Based on 14 years of operation in Shanghai as well as detailed project studies, cost savings of about € 8 billion for the FinEst Link project are estimated for the planning and construction as well for the operation and maintenance in the first 20 years compared to conventional high-speed railway systems. This results pri-marily from smaller tunnel diameters required, 50% less train sets, fewer depots and 80% lower operation and maintenance costs of this fully automated, self-driving system.
The proposal seems to have a high potential from a technical and functional perspective. The system would provide a commuting time of less than 15 minutes between Helsinki and Tallinn. Train-like operations provide the high capacity required from the FinEst Link system for generations to come. The SwissRapide AG freight transport concept is based on the use of air freight containers with hourly 24/7 operations. Heavy freight as well as dangerous or hazardous goods are to be transported via the existing ferry system. This concept saves at least € 1 billion in costs for freight depots, freight trains as well as additional, expensive safety measures required for the transport of dangerous and haz-ardous goods in the tunnel.
FinEst bay area
The FinEst bay area concept is based on a traditional tunnel solution similar to the Fin-Est link feasibility study concept. Compared to the feasibility study concept, there is two tunnels with a much larger diameter, which would allow more technical flexibility. The passenger train speed can be up to 400 km/h and the travelling time about 20 minutes. Based on the presentation, the solution is very cost-efficient. According to the presenta-tion, the best boring techniques can bore even 200 meters per day. That is very challeng-ing compared to what has been seen in the benchmarked projects. The safety system is not described in the presentation.
The technical solution is similar to the current concept for FinEst Link. System passen-ger capacity is similar or larger compared to the FinEst Link feasibility study concept, but freight capacity is smaller due to lack of freight traffic during the daytime. The system should be possible to integrate with current transport and logistics systems. The system includes one additional stop on the artificial island, which makes the connection slower.
The presented OtaKeila station has to be added to the regional and spatial plans before it could be built. The proposed alignments would require significant changes in existing regional and spatial plans in both Finland and Estonia. Land use plans will in any case be required for the artificial island.

81
Alkutieto Oy
The Alkutieto Oy concept’s business case is based on the commuter shuttle service. All other services in the tunnel are extra income based on the availability of the tunnel’s track capacity outside the peak hours. The aim is to create a feasible business concept with minimum investment for a proven and robust technology, but without limiting the future expansion potential of services and business. The concept is based on a similar operation and technology solution compared to the FinEst Link feasibility study concept. The presented concept is based on dense commuter shuttle service and does not include car shuttle trains, but it does include van and truck shuttles. There are big differences in the current plans in Finland and Estonia regarding the new alignment in Tallinn and the to the tunnel coming up on ground level in Pasila. Technical differences to the FinEst Link feasibility study concept are terminals and depots that would be situated in Tallinn due to the double gauge system in tunnel. Passenger traffic is compatible with the current passenger train services in Estonia and Finland and has a stop in a tunnel station in the center of Helsinki (both gauges). Freight continues to Pasila using the existing rails and Finnish gauge. Anyhow the concept is open to be extended later with the items presented in the FinEst Link feasibility study. The passenger station under the city of Helsinki would be difficult to construct under-ground and it may require a minimum of 4 tracks and bypasses for freight trains. There are currently several built and planned tunnels in the planned area and it is questionable whether there is in fact enough space without modifying and prioritasing the space use. The proposal also includes the possibility to use reservations and track alingnemnt made for underground construction (Pisara) for connecting tunnel tracks and services to exist-ing commuter train system. Road vehicle train terminals are situated in places (Ilmala, Balti Jaam, Lilleküla / Tondi), where these types of operations have not been accounted for in current land use plans in long term, which also is a question of re-planning and pri-oritasing of the future land use. System passenger capacity is similar compared to the FinEst Link feasibility study. Freight capacity is allocated outside daytime passenger peak hours. The freight capacity of the tunnel exceeds the estimated demand. The system is planned to be integrated with current passenger transport systems. If freight transport will grow strongly in the future, it may face a challenge with capacity from Pasila to Kerava, where it will join the Vuosaari harbour track used for the current sea freight train transport up to Riihimäki. There is not capacity for this new train traffic between the daytime passenger trains. New two tracks must be constructed. One solution is the Lentorata tunnel and the investment cost is quite the same as in FinEst Link tunnel solution. The freight traffic loading/unloading solution on the Tallinn side seems quite feasible as it is situated on the outside of the city. The proposal presents several ideas that could improve the FinEst Link concept, such as the double gauge, location of freight and passenger terminals and the use of MaaS (Mobil-ity as a Service), which should be considered.

82
14.3. ConclusionThe proposals are very innovative and open-minded and they show an interest in partic-ipating in the common work to achieve a high quality and cost effective solution for the tunnel concept. Most of the proposals are focused on passenger traffic and in some pro-posals, there is no possibility for normal heavy freight traffic with containers. The double track with 1435/1524 gauge, with 4 rails, has been included in 2 proposals.
All material in the proposals are placed in the sub-report ‘New Technologies’. Many proposals include their cost estimation of the technical solution. These estimations are estimations only of the participants.
Some of the solutions are in a development stage and have not yet been tested in a way that could be considered feasible. During next planning faces we are still waiting for fur-ther news from these technologies.

83
15. Financing model evaluationThe preferred financing and procurement model will depend on several factors such as preferences and requirements for risk allocation flexibility, cost of capital and the public and the financial market’s ability to finance and fund the project over time.
15.1. Alternative Project Contract And Ainancing ModelsA general framework for contract models in infrastructure projects can be seen in Figure 15.1 below:
Figure 15.1 General framework for contract models in infrastructure projects. Source: Partnerships: In Pursuit of Risk Sharing and Value for Money, OECD Publishing 2008
The aim with the alternative contract models is, depending on project characteristics to allocate risks in a way resulting in overall maximum cost efficiency. If a project is itself commercially feasible without public sector support, it is usually most efficient for the public sector to allow the private sector to carry out the project (potentially imposing some regulation, if required by public policy goals).

84
In a publicly financed and owned project, the public sector is responsible for procure-ment, construction and operation of the transport link. In the benchmark study, typical examples are the Öresund Bridge and the Fehmarn link –tunnel.
Benefits of the publicly owned and financed project model are:
• The public model can be implemented quickly when political and funding decisions have been made
• If public credit support such as public loans or debt guarantees are used, the project will have the lowest possible cost of capital
• There is flexibility for changes during the investment phase and project life
• Due to the large scale and possible uncertainties regarding the FinEst Link project, some risks e.g. linked to project size and public decisions and processes could be best managed by the public sector
• There is a possibility to split procurements into smaller lots which could increase cost efficiency
Issues to account for in a possible publicly owned contract model for FinEst Link are:
• Public project owners will need to manage project risks (technical and commercial) internally
• Limited integration of design, build, maintenance leading to several procurement processes could increase internal and external interface risk
• Limited due diligence could result in uncertain cost estimates, insufficient risk man-agement activities or changes in project scope
• Requirements on project owners to organize and staff the project
• Limited long-term incentives, risk transfer or certainty about performance
• Maximum project costs are difficult to estimate beforehand and could affect state aid considerations
Privately financed PPPs can be used to ensure life cycle performance of the asset and delivery of the service in accordance with agreed timescales and performance specifica-tions. Some, in particular technical responsibilities of the project are shifted to the pri-vate sector service provider.
Benefits of the private (PPP) financing model are:
• Life cycle approach and long-term responsibility of constructors and owners with fixed prices and on time delivery
• Private financing can reduce investment phase funding requirements of the public partners

85
• Risk transfer should result in functionality and savings from the public stakeholder’s viewpoint
• Internal interface risks of the project are efficiently handled
• Project transfers to public ownership after the project agreement has ended, which can be a benefit compared to other private financing models
Issues to account for in a possible PPP contract model for FinEst Link are:
• Higher financing costs compared to public credit risk
• Risks related to political, zoning, interface with other utilities (e.g. Baltic Connector and other networks) and force majeure events cannot be transferred
• Technical risks that cannot be fully managed until actual construction works could result in large risk reservations in fixed price agreements
• The public sector needs to carry the demand risk (using a suitable availability-based payment or minimum revenue guarantee)
• Contracts are inflexible during the contract term
15.2. Alternative Risk Allocation ModelsFor the FinEst Link project, risk allocation based on standard models can be challenging due to project characteristics such as:
• The large project size makes it difficult for parties to absorb risks that are realized during the investment (affecting cost and time schedule) and operations phase (af-fecting operating revenues and costs)
• The funding requirement will require large commitments from public project stake-holders and financial market participants, which will require financing structures that differ from ones commonly used for projects in Finland and Estonia
• Local technical and financial expertise is not familiar with challenges related to the development of this type of project
• Risks regarding permits and licenses can be especially challenging in a cross-border project such as FinEst Link
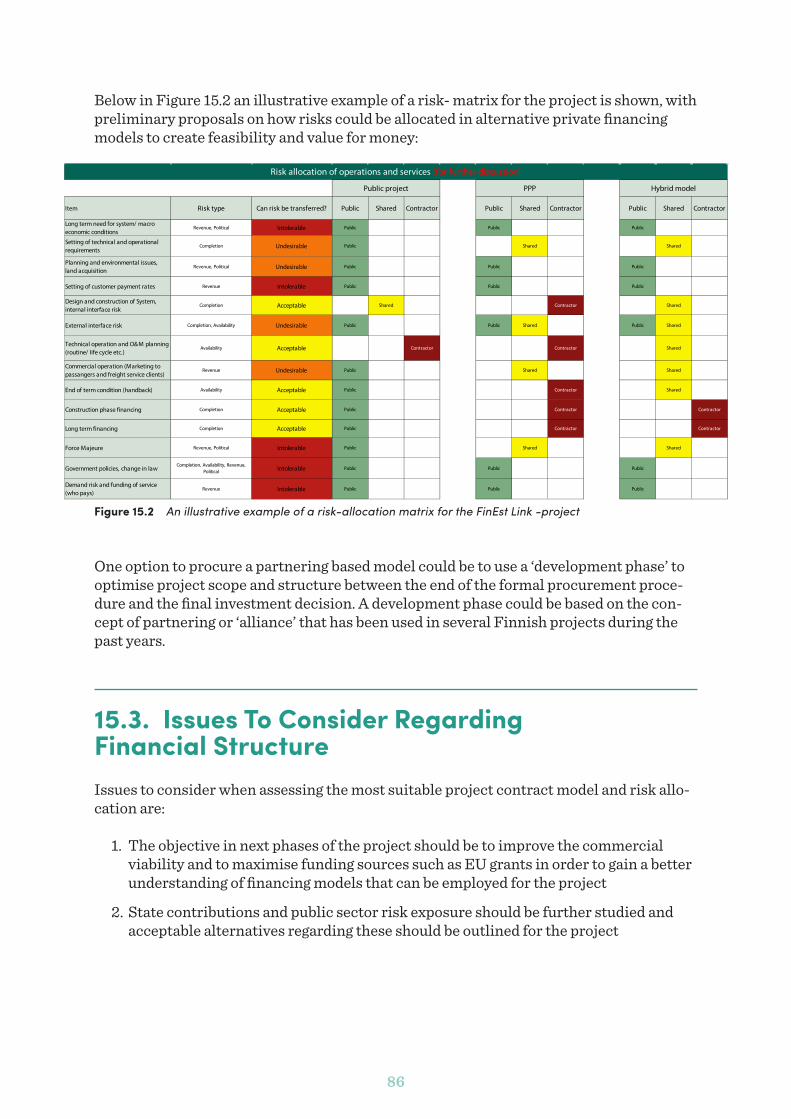
86
Below in Figure 15.2 an illustrative example of a risk- matrix for the project is shown, with preliminary proposals on how risks could be allocated in alternative private financing models to create feasibility and value for money:
Figure 15.2 An illustrative example of a risk-allocation matrix for the FinEst Link -project
One option to procure a partnering based model could be to use a ‘development phase’ to optimise project scope and structure between the end of the formal procurement proce-dure and the final investment decision. A development phase could be based on the con-cept of partnering or ‘alliance’ that has been used in several Finnish projects during the past years.
15.3. Issues To Consider Regarding Financial Structure Issues to consider when assessing the most suitable project contract model and risk allo-cation are:
1. The objective in next phases of the project should be to improve the commercial viability and to maximise funding sources such as EU grants in order to gain a better understanding of financing models that can be employed for the project
2. State contributions and public sector risk exposure should be further studied and acceptable alternatives regarding these should be outlined for the project
Item Risk type Can risk be transferred? Public Shared Contractor Public Shared Contractor Public Shared Contractor
Long term need for system/ macro economic conditions
Revenue, Political Intolerable Public Public Public
Setting of technical and operational requirements
Completion Undesirable Public Shared Shared
Planning and environmental issues, land acquisition
Revenue, Political Undesirable Public Public Public
Setting of customer payment rates Revenue Intolerable Public Public Public
Design and construction of System, internal interface risk
Completion Acceptable Shared Contractor Shared
External interface risk Completion, Availability Undesirable Public Public Shared Public Shared
Technical operation and O&M planning (routine/ life cycle etc.)
Availability Acceptable Contractor Contractor Shared
Commercial operation (Marketing to passangers and freight service clients)
Revenue Undesirable Public Shared Shared
End of term condition (handback) Availability Acceptable Public Contractor Shared
Construction phase financing Completion Acceptable Public Contractor Contractor
Long term financing Completion Acceptable Public Contractor Contractor
Force Majeure Revenue, Political Intolerable Public Shared Shared
Government policies, change in lawCompletion, Availability, Revenue,
Political Intolerable Public Public Public
Demand risk and funding of service (who pays)
Revenue Intolerable Public Public Public
Public project PPP Hybrid model
Risk allocation of operations and services (for further discussion)

87
3. It is improbable that the FinEst Link project could be carried out while placing de-mand risk for the use (passengers, freight) on a private party. Alternative risk alloca-tions such as revenue guarantees or availability mechanisms should be considered.
4. The project will have an effect on the financing burden of the Estonian and Finnish states. The effect can possibly be mitigated using a PPP financing model combined with EU funds in a “blending” financing model.
5. Financial market capacity will be a factor in the project and the project size will re-quire for different types of financiers to co-operate in organizing the project financing.
6. The model (contracting, financing) for the project should be carefully studied before decision making and in all cases market interest and capacity to carry out the proj-ect based to the model should be ensured by entering into sufficient market dialogue (contractors, planners, investors, lenders, etc.). State aid issues should also be ad-dressed by the local ministries in Estonia and Finland.
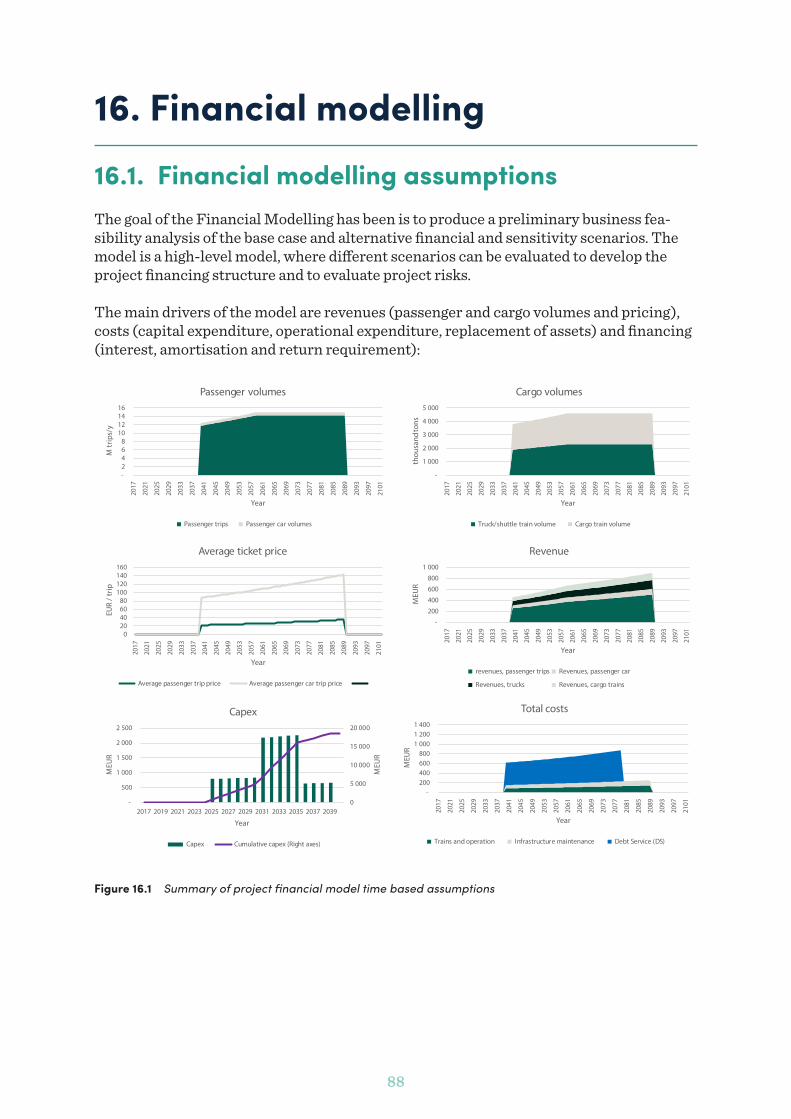
88
16. Financial modelling16.1. Financial modelling assumptionsThe goal of the Financial Modelling has been is to produce a preliminary business fea-sibility analysis of the base case and alternative financial and sensitivity scenarios. The model is a high-level model, where different scenarios can be evaluated to develop the project financing structure and to evaluate project risks.
The main drivers of the model are revenues (passenger and cargo volumes and pricing), costs (capital expenditure, operational expenditure, replacement of assets) and financing (interest, amortisation and return requirement):
-
200
400
600
800
1 000
2017
2021
2025
2029
2033
2037
2041
2045
2049
2053
2057
2061
2065
2069
2073
2077
2081
2085
2089
2093
2097
2101
MEU
R
Year
Revenue
revenues, passenger trips Revenues, passenger car
Revenues, trucks Revenues, cargo trains
-
1 000
2 000
3 000
4 000
5 000
2017
2021
2025
2029
2033
2037
2041
2045
2049
2053
2057
2061
2065
2069
2073
2077
2081
2085
2089
2093
2097
2101
thou
sand
tons
Year
Cargo volumes
Truck/shuttle train volume Cargo train volume
- 2 4 6 8
10 12 14 16
2017
2021
2025
2029
2033
2037
2041
2045
2049
2053
2057
2061
2065
2069
2073
2077
2081
2085
2089
2093
2097
2101
M tr
ips/
y
Year
Passenger volumes
Passenger trips Passenger car volumes
020406080
100120140160
2017
2021
2025
2029
2033
2037
2041
2045
2049
2053
2057
2061
2065
2069
2073
2077
2081
2085
2089
2093
2097
2101
EUR
/ trip
Year
Average ticket price
Average passenger trip price Average passenger car trip price
0
5 000
10 000
15 000
20 000
-
500
1 000
1 500
2 000
2 500
2017 2019 2021 2023 2025 2027 2029 2031 2033 2035 2037 2039
MEU
R
MEU
R
Year
Capex
Capex Cumulative capex (Right axes)
- 200 400 600 800
1 0001 2001 400
2017
2021
2025
2029
2033
2037
2041
2045
2049
2053
2057
2061
2065
2069
2073
2077
2081
2085
2089
2093
2097
2101
MEU
R
Year
Total costs
Trains and operation Infrastructure maintenance Debt Service (DS)
Figure 16.1 Summary of project financial model time based assumptions

89
Key assumptions used in the calculation are:
• All calculations and scenarios assume an inflation rate of 1% p.a. for capital and op-erational expenditure and revenues.
• The scenarios that include debt assume a fixed long term loan
– base interest rate of 1.5 % p.a. (based on long term swap rates)
– Interest margin level depending on scenario and type of financing (1.0 % p.a. for public debt model and 2.0 % p.a. for private debt model).
• The calculations assume 50 years operation period and a 40 years base case debt repayment period in the scenarios that include debt.
• Capital expenditure /CAPEX 16 billion euro based on FinEst Link Work Package 3 estimations (year 2017 price level before inflation and excluding interest during con-struction)
• Operation expenditure /OPEX 123 MEUR / year with year 2050 volumes before inflation
• Revenue estimates based on FinEst Link Work Package 2 estimations
– Ticket prices in 2017 price level – Single trip 18 EUR / trip (2017 price level) – 30 day card 480 EUR / month – Long distance trip (via Rail Baltica) 40 EUR / trip – Passenger car single trip 70 EUR / trip – Truck single trop 450 EUR / trip – Cargo train rate 150 EUR / train km
– 13.05 million total trips per year in the year 2050
– Cargo volumes 4.2 million tons in year 2050
– Annual growth in passenger and cargo volumes 1.0 % p.a. until 2060, after which growth is assumed at 0 %

90
16.2. Financial modelling resultsProject cash flows based only on estimated project costs and project income without ex-ternal funding or financing show a project Net present value (NPV, discounted at 3.5%) of € 8.419 bn negative:
Figure 16.2 Project cash flow for model with no grants or financing structure
If the project would receive 40% EU grants31 (approximately 7.44 bn €) are introduced, with the rest of the project financed with € 11.16 bn of (public) equity capital, the project NPV at 3.5% is still negative (3.048 bn euros).
Figure 16.2 Project cash flow for model with EU grants and no financing structure
A PPP model based on private financing would facilitate some risk technical transfer (e.g. cost and completion time risk transfer but very low demand risk transfer) without an initial capital outlay from Estonia or Finland with a subsidy/availability payment during the operations phase. Calculations are based on a blending structure with 40 % EU grant (approximately 7.44 bn €) with the rest of the project financed privately with a 20/80 equity /debt ratio (approx. 2.2 bn € equity and 1.,3 bn € debt).
31 The level of 40 % is based on the benchmarking study results of other cross –border infrastructure projects. In the calculation, EU grants are estimated to be paid in the same yearly proportions as the in-vestment is made.
Scenario: Project cash flow without grants or financing structure2 025 2 029 2 034 2 039 2 040 2 044 2 049 2 054 2 059 2 064 2 069 2 074 2 079 2 084 2 089
1 5 10 15 16 20 25 30 35 40 45 50 55 60 65 Construction Operation
Investment cost - MEUR 18 602 796 829 2 240 663 - - - - - - - - - - - Grant (EU) - MEUR - - - - - - - - - - - - - - - - Grant (Finland & Estonia) - MEUR - - - - - - - - - - - - - - - - Equity input - MEUR 18 602 796 829 2 240 663 - - - - - - - - - - - Debt withdraw - MEUR - - - - - - - - - - - - - - - - Revenue - MEUR 34 609 - - - - 458 496 548 605 668 702 738 776 815 857 901 Operating costs - MEUR 9 984 - - - - 153 160 168 178 188 197 207 218 229 241 253 Financing costs - MEUR - - - - - - - - - - - - - - - - Taxes - MEUR 2 597 - - - - - - 14 29 45 55 65 74 83 93 102 Total equity cash flow - MEUR 3 426 (796) (829) (2 240) (663) 305 336 365 398 435 450 466 484 503 524 546
WACC 3,5 % Discounted equity cash flow - MEUR (8 419) (769) (698) (1 588) (396) 176 169 155 142 131 114 99 87 76 66 58
FINANCIAL PERFORMANCE INDICATORS
Scenario: EU Grant 40% of investment cost2 025 2 029 2 034 2 039 2 040 2 044 2 049 2 054 2 059 2 064 2 069 2 074 2 079 2 084 2 089
1 5 10 15 16 20 25 30 35 40 45 50 55 60 65 Construction Operation
Investment cost - MEUR 18 602 796 829 2 240 663 - - - - - - - - - - - Grant (EU) - MEUR 7 441 318 331 896 265 - - - - - - - - - - - Grant (Finland & Estonia) - MEUR - - - - - - - - - - - - - - - - Equity input - MEUR 11 161 478 497 1 344 398 - - - - - - - - - - - Debt withdraw - MEUR - - - - - - - - - - - - - - - - Revenue - MEUR 34 609 - - - - 458 496 548 605 668 702 738 776 815 857 901 Operating costs - MEUR 9 984 - - - - 153 160 168 178 188 197 207 218 229 241 253 Financing costs - MEUR - - - - - - - - - - - - - - - - Taxes - MEUR 3 506 - - - - 16 26 39 52 66 74 81 89 97 105 113 Total equity cash flow - MEUR 9 958 (478) (497) (1 344) (398) 288 310 341 375 415 432 450 469 489 511 535
WACC 3,5 % Discounted equity cash flow - MEUR (3 048) (462) (419) (953) (237) 166 156 144 134 124 109 96 84 74 65 57
FINANCIAL PERFORMANCE INDICATORS

91
Figure 16.3 Project cash flow for model with EU grants and PPP financing
The PPP model scenario includes a yearly subsidy payment during the operational phase. A possible development of this subsidy is presented below in Figure 16.4:
-
2 000
4 000
6 000
8 000
10 000
-
50
100
150
200
250
300
2017
2021
2025
2029
2033
2037
2041
2045
2049
2053
2057
2061
2065
2069
2073
2077
2081
2085
2089
2093
2097
2101
MEU
R
MEU
R
Year
Fin / Est grants & additional funding
Need of additional finance/ Fin + Est payment Grant (Finland & Estonia)
Cumulative Fin / Est support (right axes)
Figure 16.4 Finland and Estonia additional funding in a PPP funded model. The subsidy payment ends after the project debt has been fully amortised.
Scenario: Private debt model + sculpted repayment2 025 2 029 2 034 2 039 2 040 2 044 2 049 2 054 2 059 2 064 2 069 2 074 2 079 2 084 2 089
1 5 10 15 16 20 25 30 35 40 45 50 55 60 65 Construction Operation
Investment cost - MEUR 21 037 796 886 2 454 1 036 - - - - - - - - - - - Grant (EU) - MEUR 7 441 318 331 896 265 - - - - - - - - - - - Grant (Finland & Estonia) - MEUR - - - - - - - - - - - - - - - - Equity input - MEUR 2 232 96 99 269 80 - - - - - - - - - - - Debt withdraw - MEUR 11 363 382 455 1 289 692 - - - - - - - - - - - Revenue - MEUR 34 609 - - - - 458 496 548 605 668 702 738 776 815 857 901 Operating costs - MEUR 9 984 - - - - 153 160 168 178 188 197 207 218 229 241 253 Financing costs - MEUR 21 961 - - - - 487 495 507 521 538 558 582 611 644 0 0 Taxes - MEUR 1 854 - - - - - - - - - 17 37 61 88 101 109 Total equity cash flow - MEUR (1 423) (96) (99) (269) (80) (182) (159) (128) (94) (58) (71) (89) (114) (146) 515 538
WACC 3,5 % Discounted equity cash flow - MEUR (2 540) (92) (84) (191) (47) (105) (80) (54) (34) (17) (18) (19) (20) (22) 65 58 Supplement payment - MEUR 8 762 - - - - 280 258 230 199 165 182 205 236 275 - -
FRR including supplement payment 4,0 %
FINANCIAL PERFORMANCE INDICATORS
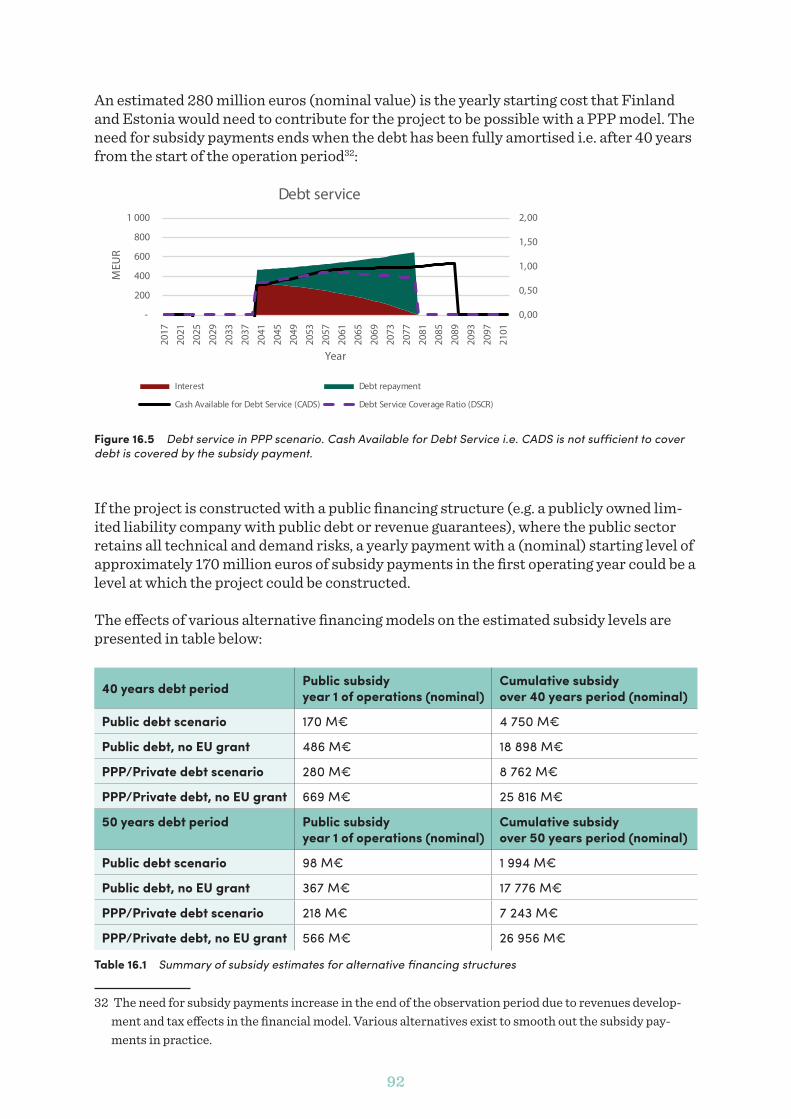
92
An estimated 280 million euros (nominal value) is the yearly starting cost that Finland and Estonia would need to contribute for the project to be possible with a PPP model. The need for subsidy payments ends when the debt has been fully amortised i.e. after 40 years from the start of the operation period32:
0,00
0,50
1,00
1,50
2,00
-
200
400
600
800
1 000
2017
2021
2025
2029
2033
2037
2041
2045
2049
2053
2057
2061
2065
2069
2073
2077
2081
2085
2089
2093
2097
2101
MEU
R
Year
Debt service
Interest Debt repayment
Cash Available for Debt Service (CADS) Debt Service Coverage Ratio (DSCR)
Figure 16.5 Debt service in PPP scenario. Cash Available for Debt Service i.e. CADS is not sufficient to cover debt is covered by the subsidy payment.
If the project is constructed with a public financing structure (e.g. a publicly owned lim-ited liability company with public debt or revenue guarantees), where the public sector retains all technical and demand risks, a yearly payment with a (nominal) starting level of approximately 170 million euros of subsidy payments in the first operating year could be a level at which the project could be constructed.
The effects of various alternative financing models on the estimated subsidy levels are presented in table below:
40 years debt period Public subsidy year 1 of operations (nominal)
Cumulative subsidy over 40 years period (nominal)
Public debt scenario 170 M€ 4 750 M€
Public debt, no EU grant 486 M€ 18 898 M€
PPP/Private debt scenario 280 M€ 8 762 M€
PPP/Private debt, no EU grant 669 M€ 25 816 M€
50 years debt period Public subsidy year 1 of operations (nominal)
Cumulative subsidy over 50 years period (nominal)
Public debt scenario 98 M€ 1 994 M€
Public debt, no EU grant 367 M€ 17 776 M€
PPP/Private debt scenario 218 M€ 7 243 M€
PPP/Private debt, no EU grant 566 M€ 26 956 M€
Table 16.1 Summary of subsidy estimates for alternative financing structures
32 The need for subsidy payments increase in the end of the observation period due to revenues develop-ment and tax effects in the financial model. Various alternatives exist to smooth out the subsidy pay-ments in practice.
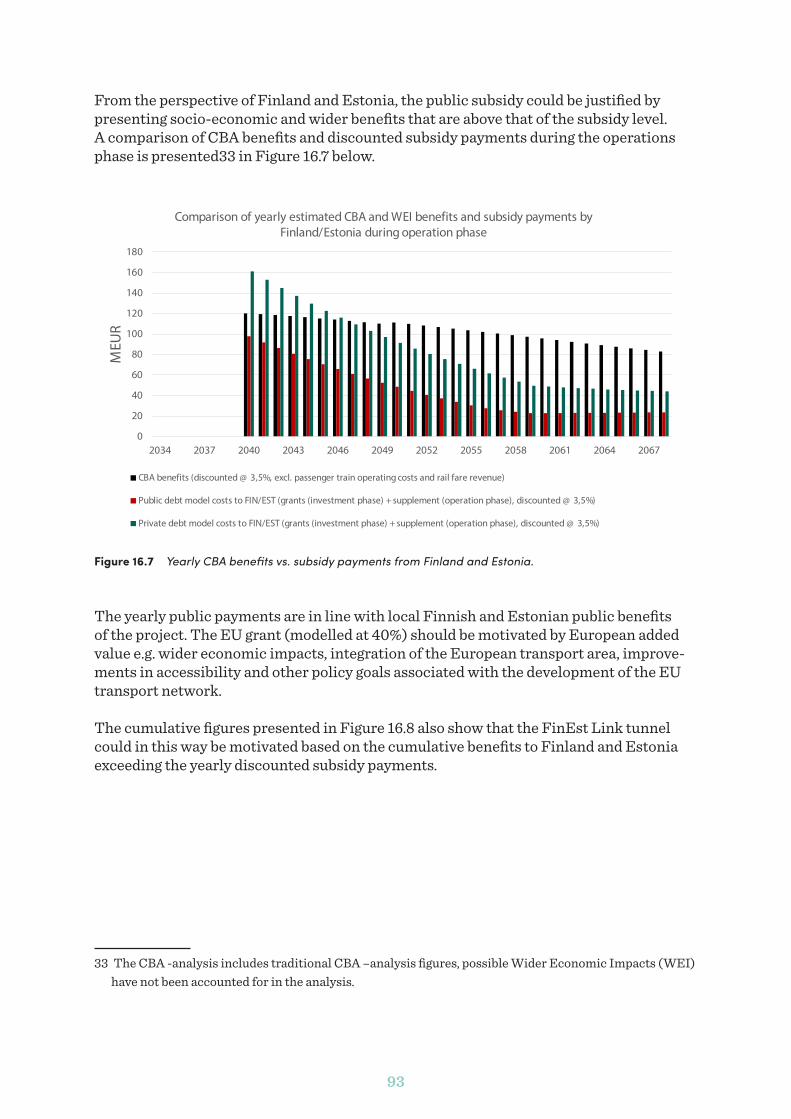
93
From the perspective of Finland and Estonia, the public subsidy could be justified by presenting socio-economic and wider benefits that are above that of the subsidy level. A comparison of CBA benefits and discounted subsidy payments during the operations phase is presented33 in Figure 16.7 below.
0
20
40
60
80
100
120
140
160
180
2034 2037 2040 2043 2046 2049 2052 2055 2058 2061 2064 2067
MEU
R
Comparison of yearly estimated CBA and WEI benefits and subsidy payments by Finland/Estonia during operation phase
CBA benefits (discounted @ 3,5%, excl. passenger train operating costs and rail fare revenue)
Public debt model costs to FIN/EST (grants (investment phase) + supplement (operation phase), discounted @ 3,5%)
Private debt model costs to FIN/EST (grants (investment phase) + supplement (operation phase), discounted @ 3,5%)
Figure 16.7 Yearly CBA benefits vs. subsidy payments from Finland and Estonia.
The yearly public payments are in line with local Finnish and Estonian public benefits of the project. The EU grant (modelled at 40%) should be motivated by European added value e.g. wider economic impacts, integration of the European transport area, improve-ments in accessibility and other policy goals associated with the development of the EU transport network.
The cumulative figures presented in Figure 16.8 also show that the FinEst Link tunnel could in this way be motivated based on the cumulative benefits to Finland and Estonia exceeding the yearly discounted subsidy payments.
33 The CBA -analysis includes traditional CBA –analysis figures, possible Wider Economic Impacts (WEI) have not been accounted for in the analysis.

94
0
2000
4000
2025 2028 2031 2034 2037 2040 2043 2046 2049 2052 2055 2058 2061 2064 2067
MEU
RComparison of cumulative CBA benefits and subsidy payments by Finland/Estonia
Cumulative CBA benefits (discounted @ 3,5 %, excl. passenger train operating costs and rail farerevenues)Public debt model cumulative costs to FIN/EST (discounted @ 3,5 %)
Private debt model cumulative costs to FIN/EST (discounted @ 3,5 %)
Figure 16.8 Cumulative benefits vs. subsidy payments from Finland and Estonia.
The presented model is sensitive to changes e.g. in revenues and costs and changes in discount rates. Some variations are presented in table 16.2 below:
Revenue and Capex scenarios (40 % grant assumption)
Public subsidy year 1 of operations
(nominal)
Cumulative subsidy over 40 years period
(nominal)
Public debt, low revenue 261 M€ 9 354 M€
Public debt, high capex 299 M€ 10 459 M€
Public debt, double opex 323 M€ 11 546 M€
Public debt, 0% inflation 167 M€ 7 515 M€
PPP/Private debt, low reve-nue 371 M€ 13 465 M€
PPP/Private debt, high capex 439 M€ 15 663 M€
PPP/Private debt, double opex 433 M€ 15 694 M€
PPP/Private debt, 0% inflation 262 M€ 11 091 M€
Table 16.2 Summary of revenue and capex sensitivity scenarios

95
16.3. Financial modelling conclusionsA project such as the Helsinki – Tallinn tunnel cannot be easily financed with a fully pri-vate funding model with demand risk based on current project revenue and cost estimates
An availability based private financing model (low level of risk transfer, no payments from Finland & Estonia before operational phase) could be feasible with a yearly service pay-ment/ subsidy starting at approximately 280 million euros per year during the operation-al period.
The project could be financed with a publicly supported debt-financing model with subsi-dy payments of approximately 170 million euros per year from the beginning of the opera-tional period, adding up to 4.8 bn euro subsidy payments.
Without the assumed (EU) grants of 40% the payment would be approximately 507 mil-lion euros in year 1 of the operating period so the grant would have a material effect on the project feasibility and ratio of costs and benefits to the Finnish and Estonian states
Sensitivities show that various risks such as lack of grants or lower than expected reve-nues and higher than expected capital expenditures will have an effect on the cost to the public project owners and to the comparison of public benefits and costs.
Further studies include more detailed analysis of the modelling assumptions and meth-ods used after which the project should enter into market dialogue to fine tune project and financing assumptions.
16.4. Conclusions for Benchmarking and Financial AnalysisThe FinEst Link tunnel project is truly a mega-project with an estimated feasibility study phase investment cost of 16 billion euros (2017 prices). The benchmarking analysis shows that similar infrastructure projects have been and can be realised from a technical and economical perspective. However, projects have often been affected by risks resulting in cost overruns, delays and lower than estimated social or financial returns. Estimated demand levels for the FinEst Link tunnel are lower than in comparable projects, which should be accounted for in the project technical design and financing structure.
96
Various financing alternatives have been compared as part of the study and some general conclusions can be drawn:
• Demand risk will be difficult to absorb by any other party than the public project owners.
• A “blending” financing structure, using a combination of EU funds and private and public long-term financing combined to local public funding support can be achiev-able and feasible.
• The financing and contract structure of the project must be able to account for the large amounts of financing that have to be mobilised.
• The large project size can lead to challenges related to financial market capacity or restrictions in Finnish and Estonian willingness to accept debt liabilities and expo-sure to project risks.
• Project financial and social goals and limits should be set in a transparent manner in advance for the full project and the project should ensure sufficient financial market dialogue during its various phases of development.
The project is most financially feasible when financed with a combination of EU grants and long-term financing backed by a public transportation support payment (subsidy or availability based) over the long term. A privately financed PPP model could be available with a subsidy payment starting at 280 M€ per year, and a public model with lower costs but increased risks for the public sector could be estimated to require a subsidy starting at 170 M€ per year.
With the presented financing structures and an estimated level of 40 % EU grants shows that the project cost to Finland and Estonia could be motivated with the project’s estimat-ed long term socio-economic benefits.
A contract model combining elements from partnering/alliancing contracting models and private financing models could facilitate the management of project costs and incentives. An open-book development and contracting model with target pricing would also provide a shield against financial risks to the project sponsors (Finland and Estonia) and future financiers and investors.
In practice, the next step could be to form a development vehicle, for example in the form of a publicly owned limited liability company. This vehicle would be set up to further advance the project based on the social and financial goals set by the project owners. The work should then proceed to develop the Helsinki – Tallinn tunnel project within set limits, such as the target price, investment and operation cost risk, cash flow, credit rating and ratio of project costs to estimated benefits. Over the long term, this co-operative mod-el should facilitate the joining of additional project partners to form an overall structure with sufficient information and financial resources to implement the project when so-cio-economic and financial boundary values are met with a sufficient level of confidence.

97
17. Conclusions17.1. Towards the next phase of FinEst LinkThe FinEst Link has paved the way towards the next phase of the elaboration of the Hel-sinki-Tallinn railway tunnel by producing a body of knowledge on its economic and tech-nological feasibility. Further studies on the technical and economic feasibility are needed: logistics during the construction phase of an undersea mega-project, construction of artificial islands, environmental impact assessment, dynamic demand forecasts that take into account changes over time as the region repositions through better accessibility.
It has been concluded that a special focus needs to be set on wider economic impacts and to understanding the dynamics and wider impacts of regional development of twin cities.
17.2. Emerging innovations’Emerging innovations’ such as technological development, innovative financial solutions and methodological development can remarkably increase the technical and economic feasibility of the fixed link and shorten its planning schedule. Technological innovations could contribute to, for instance, boring techniques, tunnel materials and machines for undersea conditions, logistics of mega-project construction, construction of large artifi-cial islands and operation solution (e.g. Hyperloop, Maglev and other new paradigms in transport).
Financial innovations can diversify financial markets and instruments and build a next generation of public-private partnerships.
Methodological innovations contribute to the existing models in cost-benefit analysis and wider economic impact analysis, which do not currently provide a sufficient methodolog-ical backbone when large mega projects in transport are concerned. Existing models do not apply to transport mega-projects that reach far into the distant future. CBA and WEI do not currently produce comparable results. Currently WEI studies are available only in limited geographical coverage.

98
17.3. SWOT analysisStrengths:
Finnish and Estonian people are already foreseeing the ’improved accessibility’ provided by Rail Baltica and Helsinki-Tallinn tunnel. There is enthusiasm that can be very produc-tive. Losing the vision could be stagnating.
Weaknesses:
The financial prospect of the tunnel appears challenging because of the small sizes of the Finnish and Estonian economies.
Opportunities:
Helsinki-Tallinn twin city, which is a unique cross-border case in the EU, can be a positive driver and build synergy instead of fragmentation.
Growing markets in Eastern-EU, Black Sea area and Asia may remarkably increase the business case of the tunnel.
Threats:
The loss of strong commitment by the national and EU-level stakeholders would leave the project homeless. This could make the vision vulnerable to investment models that do not prioritise the benefits for local economies and European added-value.
Next phases of the fixed link project should be in full compliance with the TEN-T strategy in order to guarantee full interoperability with Rail Baltica.

99
18. AnnexStructure of the FinEst Link project and team-buidling
The FinEst Link project, consisting of five Work Packages, has been led by Mr. Kari Ruo-honen as Project Director contracted by Helsinki-Uusimaa Regional Council. The com-position of the Work Packages and project partnership is as follows:
• Work Package 1 – Management, leader Helsinki-Uusimaa Regional council repre-sented by Director of Land Use Planning Merja Vikman-Kanerva (Chair of SteeringGroup), Traffic Planning Manager Petri Suominen (Vice-Chair of Steering Group),Chief Adviser Malla Paajanen (Lead Partner Representative and Work Package 1and 4 Leader), Senior Adviser Heli Halla-aho (Budgeting and reporting) and SeniorAdviser Suvi Vähä-Sipilä (Communications) and Chief Adviser Olli Keinänen
• Work Package 2 – Comparative Impact Analysis, leader City of Helsinki repre-sented by Head of Unit Santtu von Bruun (Steering Group Member), Head of OfficeHeikki Hälvä (Substitute Member), Senior Specialist Dr. Ulla Tapaninen (WorkPackage 2 Leader), Traffic Engineer Markku Granholm and Traffic Engineer JariRantsi.
• Work Package 3 – Technical Concept and Economic Assessment, leader FinnishTransport Agency represented by Division Director Rami Metsäpelto/Division Di-rector Mirja Noukka (Steering Group Member), Matti Levomäki (Substitute Mem-ber), Senior Adviser Anni Rimpiläinen (Work Package 3 Leader), Project ManagerHeidi Mäenpää (Work Package 3 Manager) and Taneli Antikainen (project managerin WP2 for FTA).
• Work Package 4 – Benchmarking, Stakeholder Dialogue and Policy Framework,leader Helsinki-Uusimaa Regional Council as described in WP1.
• Work Package 5 – Communication, leader Harju County Government (later Unionof Harju Municipalities) represented by Managing Director Mr. Joel Jesse (SteeringGroup Member), External Co-ordinator Kaarel Kose (Work Package 5 Leader) andDevelopmenmt Advisor Tiina Beldsinsky.
• Ministry of Economic Affairs and Communications of Estonia, participation in allWork Packages, represented by Indrek Gailan (Steering Group Member), Jaan Män-nik (Subsitute Member) and Executive Officer Eva Killar (Project Partner).
• City of Tallinn, participation in all Work Packages, represented by City Council Ad-visor Priit Willbach (Steering Group Member), Development Director Kaarel-MatiHalla (Substitute Member) and Project Manager Liivar Luts (Project Partner).
International Advisory Board of the FinEst Link project included the following invited experts of large transport infrastructure projects: Konrad Bergmeister (CEO, Bren-ner Base Tunnel), Hans-Peter Vetsch (Vetsch Rail Consulting GmbH), Prof. Christian Mathiessen (University of Copenhagen, Department of Geosciences and Natural Re-source Management) and Gustav Malm (Malm&Partners AB, Senior Advisor at MacK-insey, former Director General at Swedish Transport Administration).
The following consulting companies were selected through tendering processes, each communicated and managed by the Work Package Leader organisation: Amberg Engi-neering, Sweco Finland, WSP, Ramboll Finland, Sito, Pöyry, Strafica, Kaupunkitutkimus TA, Inspira, Rebel Group and Kairo Design Agency.

100
WWW.FINESTLINK.FI#FINESTLINK
Kairo
Des
ign
Agen
cy L
td |
ww
w.k
airo
.fi
Project Partners
Consultants
Publ
icat
ion
of H
elsin
ki-U
usim
aa R
egio
nal C
ounc
il C
84
– 20
18H
elsin
ki 2
018
ISBN
978
-952
-448
-494
-7IS
SN 2
342-
1363