Embed Size (px)
Citation preview

Helping Hospitals Understand and Embrace
Bundled Payments
Gloria Kupferman, Vice President, DataGenKelly Price, Director, DataGen Group
A2HAMarch 20, 2013

Key Lessons• Data is king, be ready to deal with large
amounts of it• Know the game and why you’re playing• Fill all positions on the team• Understand variation, risk and opportunity• There’s a difference between reducing costs at
the provider level and reducing costs for the payer (program costs)

Remember the Payer’s POV
Initial Inpatient
Stay
Readmission
Dr. Hospital
Visit
Dr. Hospital
Visit
Dr. Office Visit
Dr. Office Visit
Dr. Office Visit
Dr. Hospital
Visit
Dr. Hospital
Visit
Inpatient Post-Acute
Stay (Rehab, Psych, LTC, SNF, HH)
Other Part B Services(Hospital Outpatient, Labs, Durable Medical
Equipment, Part B Drugs)

Metrics
• Must support decision-making– Focus on decision-making and application– Avoid interesting but useless information
• Must be understandable• Can’t be static
• Here’s how we analyzed the Medicare BPCI data:

Analytic Decision Drivers
• Volume – i.e. critical mass• Payment variation• Discernible, manageable care
patterns• Benchmark comparisons

$-
$1,000,000
$2,000,000
$3,000,000
$4,000,000
$5,000,000
$6,000,000
$7,000,000
$8,000,000
$9,000,000
0 20 40 60 80 100 120 140 160 180
Tota
l Pay
men
ts
Coefficient of Variation
Total Payments vs Coefficient of Variation by Core DRG for 90-Day Episodes
Identify Episodes of Interest
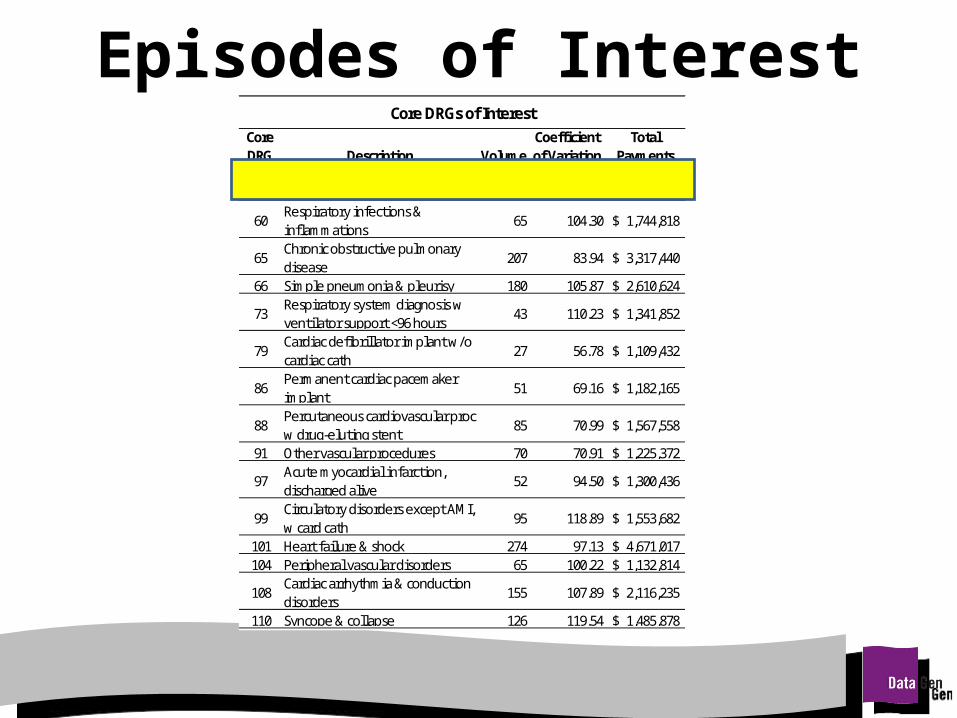
Episodes of InterestCore DRG Description Volume
Coefficient of Variation
Total Payments
23Intracranial hemorrhage or cerebral infarction
136 80.13 3,137,624$
60Respiratory infections & inflammations
65 104.30 1,744,818$
65Chronic obstructive pulmonary disease
207 83.94 3,317,440$
66 Simple pneumonia & pleurisy 180 105.87 2,610,624$
73Respiratory system diagnosis w ventilator support <96 hours
43 110.23 1,341,852$
79Cardiac defibrillator implant w/o cardiac cath
27 56.78 1,109,432$
86Permanent cardiac pacemaker implant
51 69.16 1,182,165$
88Percutaneous cardiovascular proc w drug-eluting stent
85 70.99 1,567,558$
91 Other vascular procedures 70 70.91 1,225,372$
97Acute myocardial infarction, discharged alive
52 94.50 1,300,436$
99Circulatory disorders except AMI, w card cath
95 118.89 1,553,682$
101 Heart failure & shock 274 97.13 4,671,017$ 104 Peripheral vascular disorders 65 100.22 1,132,814$
108Cardiac arrhythmia & conduction disorders
155 107.89 2,116,235$
110 Syncope & collapse 126 119.54 1,485,878$ 111 Chest pain 124 130.33 1,173,151$
114 62 66.01 2,199,797$
Core DRGs of Interest

Evaluate Payment Variation Within Bundles
Where is the variation?Remember the payer’s POV.Start thinking in terms of potentially preventable costs (to the payer).
$0
$5,000
$10,000
$15,000
$20,000
$25,000
$30,000
$35,000
$40,000
Tota
l Pay
men
ts p
er E
piso
de
Target Hospital Total Anchor Payments and Total Post Anchor Payments
Anchor Admission Payments Post Anchor Payments Regional Average Regional Outlier Threshold

Cost Composition and Variation Initial Inpatient Stay
What’s happening within the hospital?
Identify outliers and short stays.
Identify variation in physician care.
Are all these patients the same?
$- $10,000 $20,000 $30,000 $40,000 $50,000 $60,000
1025590813
1807140903
1846199801
1863488471
1870169721
1876573221
1892399573
1895668802
1899623121
1907318131
4810789561
4837664211
4875206431
4914461122
4965769712
Epis
ode
ID
Initial Admission Payments by Care TypeIPPS DRG Pymt Physician Outpatient Dur Med Equip

Cost Composition and Variation 90 Days Post Initial Stay
What happens after the patient leaves the hospital?
Identify readmissions.
See hand-offs to post-acute settings.
Find sources of variation.
What is potentially preventable?
Where is the potential for standardization?
$- $10,000 $20,000 $30,000 $40,000 $50,000 $60,000 $70,000
1025590813
1807140903
1846199801
1863488471
1870169721
1876573221
1892399573
1895668802
1899623121
1907318131
4810789561
4837664211
4875206431
4914461122
4965769712
Epis
ode
ID
Post-Initial Payments by Care TypeReadmission Physician Rehab
Outpatient Outpatient in Readmit Home Health
Dur Med Equip Dur Med Equip in Readmit Skilled Nursing Facility

Physician Claims by Specialty
What physician specialties are predominant?
Who do we need to align with?
How do services vary? Why?
Do the patterns make sense?
Is the variation due to lack of coordination?
$0 $1,000 $2,000 $3,000 $4,000 $5,000
1025590813
1807140903
1846199801
1863488471
1870169721
1876573221
1892399573
1895668802
1899623121
1907318131
4810789561
4837664211
4875206431
4914461122
4965769712

Pricing ComparisonsWhat do my neighbors look like?
Are the volumes in other hospitals high enough to be reliable?
$0
$5,000
$10,000
$15,000
$20,000
$25,000
$30,000
$35,000
$40,000
Aver
age
Paym
ents
per
Epi
sode
Episode Averages for All Hospitals Within Region
Comparison Hospital Volume<10 Comparison Hospital Volume >10 <50 Compraison Hospital Volume>50
Target Hospital Volume = 15 Regional Average Outlier threshold

Pricing ComparisonsWhat components do I need to include in my price?
How does my price compare to benchmark?
Where am I different and why?
# of Episodes
Average Benchmark
Episode Price
Average # Claims Per
Episode
Average Benchmark
Payment per Claim
Average Benchmark
Payment per Episode
# of Episodes
Average Benchmark
Episode Price
Average # Claims Per
Episode
Average Benchmark
Payment per Claim
Average Benchmark
Payment per Episode
Initial Admission 354 $31,480 $12,047 $12,047 9,576 $32,598 $11,586 $11,586
Readmission 0.19 $7,982 $1,488 0.33 $7,481 $2,468
Inpatient Rehab 0.60 $10,110 $6,026 0.34 $11,107 $3,789
Home Health Care 0.87 $3,084 $2,684 0.67 $2,949 $1,978
SNF 0.45 $6,700 $3,047 0.99 $6,654 $6,570
LTCH 0.01 $31,772 $269 0.00 $29,975 $106
Physician Inpatient 20.63 $149 $3,080 25.97 $129 $3,357
Physician Non Inpatient 58.72 $40 $2,349 52.98 $39 $2,049
OPD Inpatient 0.01 $241 $2 0.08 $195 $16
OPD Non Inpatient 1.52 $207 $315 1.73 $288 $500
DME Inpatient 0.29 $45 $13 0.22 $67 $14
DME Non-Inpatient 2.45 $65 $159 2.18 $75 $165
Hospital Referral Region
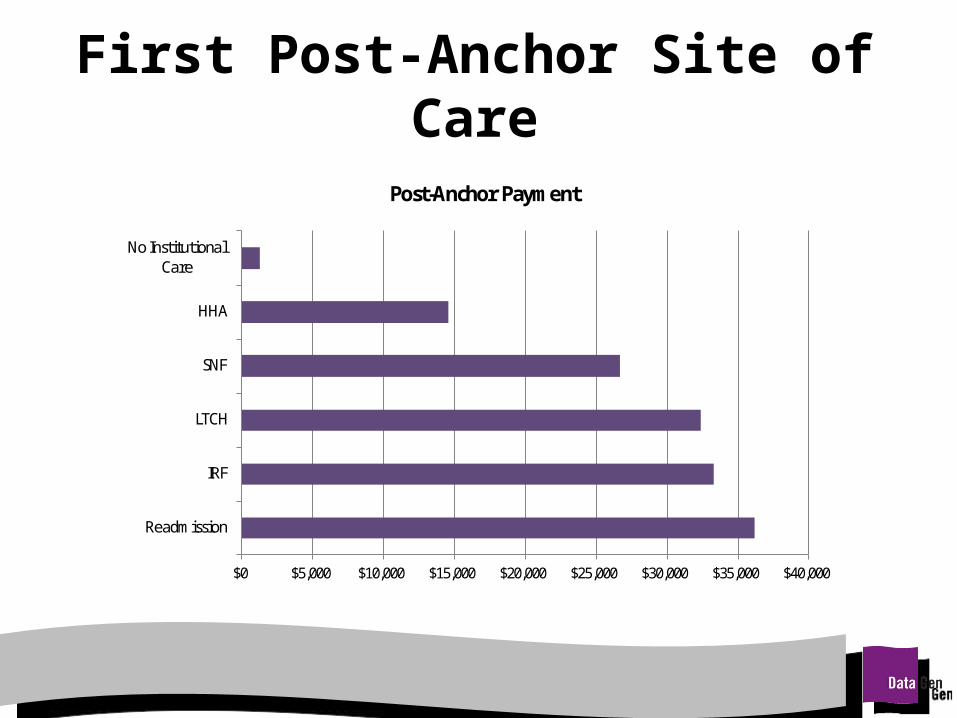
First Post-Anchor Site of Care
$0 $5,000 $10,000 $15,000 $20,000 $25,000 $30,000 $35,000 $40,000
Readmission
IRF
LTCH
SNF
HHA
No Institutional Care
Post-Anchor Payment

Regional Variation
Manhattan Newark-White Plains
Readmission 38% 45%HHA 31% 17%SNF 28% 35%Inpatient Rehab 2% 1%
AMI
Manhattan Newark-White Plains
Readmission 14% 11%HHA 14% 50%SNF 41% 1%Inpatient Rehab 32% 23%
Major Joint – Lower Extremity

Readmissions Drive Costs
# Episodes Total Episode
Price # Episodes Total Episode
Price ACUTE MYOCARDIAL INFARCTION, DISCHARGED ALIVE W MCC 289 $24,637 305 $50,569
Without readmits Episodes with a readmission
# Episodes Total Episode
Price # Episodes Total Episode
Price MAJOR JOINT REPLACEMENT OR REATTACHMENT OF LOWER EXTREMITY W/O MCC 1,531 $32,817 530 $41,943
Without readmits Episodes with a readmission

Readmissions Drive Costs
Readmission DRG
DescriptionDays from Anchor
DischargeReadmission
Dollars
Readmission Dollars % of Total
Episode Price
Total Episode
Price
251PERC CARDIOVASC PROC W/O CORONARY ARTERY STENT W/O MCC
74 $8,917 40.2% $22,157
313 CHEST PAIN 22 $2,954 19.2% $15,400812 RED BLOOD CELL DISORDERS W/O MCC 83 $4,242 17.7% $23,965
287CIRCULATORY DISORDERS EXCEPT AMI, W CARD CATH W/O MCC
25 $5,701 30.2% $18,881
247PERC CARDIOVASC PROC W DRUG-ELUTING STENT W/O MCC
25 $10,635 44.8% $23,756
251PERC CARDIOVASC PROC W/O CORONARY ARTERY STENT W/O MCC
70 $8,917 40.8% $21,835
0%
10%
20%
30%
40%
50%
60%
70%
80%
90%
100%
Hospital Readmissions Regional Readmissions
Distribution of Readmissions: Hospital (n= 6) Region (n=38)
30-90 Days
15-29 Days
8-14 Days
1-7 Days

Total CountSimple pneumonia and respiratory infections 239,157 Major joint replacement of the lower extremity 227,387 Chronic obstructive pulmonary disease, bronchitis, asthma 215,562 Congestive heart failure 168,243 Sepsis 152,902 Cardiac arrhythmia 121,665 Esophagitis, gastroenteritis and other digestive disorders 120,370 Urinary tract infection 119,282 Stroke 104,418 Renal failure 98,276 Gastrointestinal hemorrhage 91,852 Percutaneous coronary intervention 91,463 Other respiratory 86,778 Medical non-infectious orthopedic 82,606 Nutritional and metabolic disorders 80,962 Cellulitis 71,813 Hip & femur procedures except major joint 64,807 Syncope & collapse 62,679 Acute myocardial infarction 57,093 Chest pain 55,116 Major bowel procedure 54,294 Red blood cell disorders 48,290 Gastrointestinal obstruction 46,628 Transient ischemia 39,464 Pacemaker 37,641 Other vascular surgery 36,369 Medical peripheral vascular disorders 36,013 Diabetes 35,842 Spinal fusion (non-cervical) 35,809 Coronary artery bypass graft 28,964 Back & neck except spinal fusion 28,143 Major cardiovascular procedure 23,674 Lower extremity and humerus procedure exept hip, foot, femur 23,617 Cardiac valve 22,906 Cervical spinal fusion 20,220 Fractures of the femur and hip or pelvis 19,852 Revision of the hip or knee 19,163 Major joint replacement of the upper extremity 18,044 Atherosclerosis 16,726 Cardiac defibrillator 14,061 Amputation 12,653 Removal of orthopedic devices 5,769 Double joint replacement of the lower extremity 5,515 Other knee procedures 5,206 Pacemaker device replacement or revision 4,455 Combined anterior posterior spinal fusion 3,990 Complex non-cervical spinal fusion 3,070 AICD generator or lead 1,588
Where is the volume. . .
Episode Category Total count from episode totals fileSimple pneumonia and respiratory infections 239,726 Major joint replacement of the lower extremity 227,555 Chronic obstructive pulmonary disease, bronchitis, asthma 216,070 Congestive heart failure 168,811 Sepsis 153,307 Cardiac arrhythmia 121,934 Esophagitis, gastroenteritis and other digestive disorders 120,570 Urinary tract infection 119,667 Stroke 104,648 Renal failure 98,585
Episode Category Total count from episode totals fileTotal dollars from episode totals file
Major joint replacement of the lower extremity 227,555 6,482,019,352 Simple pneumonia and respiratory infections 239,726 5,593,890,331 Sepsis 153,307 5,133,428,557 Congestive heart failure 168,811 4,272,114,613 Chronic obstructive pulmonary disease, bronchitis, asthma 216,070 4,188,074,871 Stroke 104,648 3,458,555,300 Hip & femur procedures except major joint 64,870 3,019,637,592 Urinary tract infection 119,667 2,886,143,337 Other respiratory 87,062 2,859,854,067 Renal failure 98,585 2,562,273,347

Total CountSimple pneumonia and respiratory infections 239,157 Major joint replacement of the lower extremity 227,387 Chronic obstructive pulmonary disease, bronchitis, asthma 215,562 Congestive heart failure 168,243 Sepsis 152,902 Cardiac arrhythmia 121,665 Esophagitis, gastroenteritis and other digestive disorders 120,370 Urinary tract infection 119,282 Stroke 104,418 Renal failure 98,276 Gastrointestinal hemorrhage 91,852 Percutaneous coronary intervention 91,463 Other respiratory 86,778 Medical non-infectious orthopedic 82,606 Nutritional and metabolic disorders 80,962 Cellulitis 71,813 Hip & femur procedures except major joint 64,807 Syncope & collapse 62,679 Acute myocardial infarction 57,093 Chest pain 55,116 Major bowel procedure 54,294 Red blood cell disorders 48,290 Gastrointestinal obstruction 46,628 Transient ischemia 39,464 Pacemaker 37,641 Other vascular surgery 36,369 Medical peripheral vascular disorders 36,013 Diabetes 35,842 Spinal fusion (non-cervical) 35,809 Coronary artery bypass graft 28,964 Back & neck except spinal fusion 28,143 Major cardiovascular procedure 23,674 Lower extremity and humerus procedure exept hip, foot, femur 23,617 Cardiac valve 22,906 Cervical spinal fusion 20,220 Fractures of the femur and hip or pelvis 19,852 Revision of the hip or knee 19,163 Major joint replacement of the upper extremity 18,044 Atherosclerosis 16,726 Cardiac defibrillator 14,061 Amputation 12,653 Removal of orthopedic devices 5,769 Double joint replacement of the lower extremity 5,515 Other knee procedures 5,206 Pacemaker device replacement or revision 4,455 Combined anterior posterior spinal fusion 3,990 Complex non-cervical spinal fusion 3,070 AICD generator or lead 1,588
Episode Category Total Count% Still in active care at
end of periodAmputation 12,653 47%Hip & femur procedures except major joint 64,807 41%Lower extremity and humerus procedure exept hip, foot, femur 23,617 36%Coronary artery bypass graft 28,964 36%Cardiac valve 22,906 36%Fractures of the femur and hip or pelvis 19,852 33%Medical non-infectious orthopedic 82,606 31%Stroke 104,418 30%Urinary tract infection 119,282 29%Removal of orthopedic devices 5,769 28%
Are we done yet?

Lessons Learned From the Data Analytics
• Payment variation– Medical vs surgical DRGs– Payment variation is due to post-acute care
and readmissions• Episode length selection
– Depends on the diagnosis• Hospital portion of the discount• Quantifying the impact/effect of exclusions
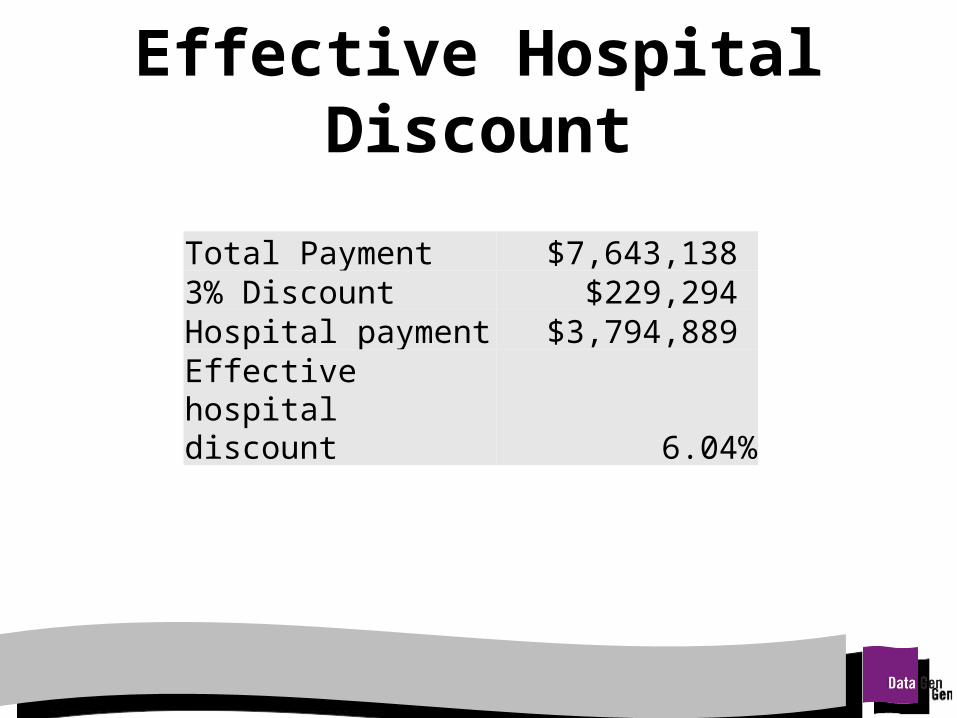
Effective Hospital Discount
Total Payment $7,643,138 3% Discount $229,294 Hospital payment $3,794,889 Effective hospital discount 6.04%

Episode Length Risk
Full Episode 31-90 Day Episode Period

Discounts and Episode LengthJoint Replacement Total Discount3% of 30 days $209,103 2% of 90 days $152,863 Difference $56,241
Chest Pain Total Discount
3% of 30 days $13,087
2% of 90 days $12,606
Difference $481

Additional Lessons Learned• Data may not support intuition• Understand what data matters• Don’t over-analyze (until you have to)• Have a multi-disciplinary team together first
– Physician leadership is a key advantage– Clinical interpretation of the data facilitates decision-
making• Real program savings come from changing utilization
and care patterns both within and outside the facility

Leveraging the Experience• Analytics/metrics can be applied to:
– Commercial contracts– Other innovative payment arrangements
• New payment arrangements are an opportunity to cover costs for lost volume (e.g. readmissions)
• If you are not part of the process, you will be caught downstream of the savings
• Beware of the halo effect

Unanswered Questions
• Who will succeed? • What will drive success?• How will success stories be shared?• How reproducible is success?

Contact InformationGloria Kupferman
Vice President, National Information ProductsDataGen, a HANYS Solutions Company
www.datagen.info
Kelly PriceDirector, DataGen Group
DataGen, a HANYS Solutions [email protected]
518-431-7629www.datagen.info

Total CountSimple pneumonia and respiratory infections 239,157 Major joint replacement of the lower extremity 227,387 Chronic obstructive pulmonary disease, bronchitis, asthma 215,562 Congestive heart failure 168,243 Sepsis 152,902 Cardiac arrhythmia 121,665 Esophagitis, gastroenteritis and other digestive disorders 120,370 Urinary tract infection 119,282 Stroke 104,418 Renal failure 98,276 Gastrointestinal hemorrhage 91,852 Percutaneous coronary intervention 91,463 Other respiratory 86,778 Medical non-infectious orthopedic 82,606 Nutritional and metabolic disorders 80,962 Cellulitis 71,813 Hip & femur procedures except major joint 64,807 Syncope & collapse 62,679 Acute myocardial infarction 57,093 Chest pain 55,116 Major bowel procedure 54,294 Red blood cell disorders 48,290 Gastrointestinal obstruction 46,628 Transient ischemia 39,464 Pacemaker 37,641 Other vascular surgery 36,369 Medical peripheral vascular disorders 36,013 Diabetes 35,842 Spinal fusion (non-cervical) 35,809 Coronary artery bypass graft 28,964 Back & neck except spinal fusion 28,143 Major cardiovascular procedure 23,674 Lower extremity and humerus procedure exept hip, foot, femur 23,617 Cardiac valve 22,906 Cervical spinal fusion 20,220 Fractures of the femur and hip or pelvis 19,852 Revision of the hip or knee 19,163 Major joint replacement of the upper extremity 18,044 Atherosclerosis 16,726 Cardiac defibrillator 14,061 Amputation 12,653 Removal of orthopedic devices 5,769 Double joint replacement of the lower extremity 5,515 Other knee procedures 5,206 Pacemaker device replacement or revision 4,455 Combined anterior posterior spinal fusion 3,990 Complex non-cervical spinal fusion 3,070 AICD generator or lead 1,588
Episode Category Total CountAverage 90 Day Total
Complex non-cervical spinal fusion 3,070 $69,428Combined anterior posterior spinal fusion 3,990 $66,866Cardiac valve 22,906 $59,892Amputation 12,653 $48,445Hip & femur procedures except major joint 64,807 $46,549Coronary artery bypass graft 28,964 $45,276Cardiac defibrillator 14,061 $44,364Major cardiovascular procedure 23,674 $38,983Spinal fusion (non-cervical) 35,809 $38,673Double joint replacement of the lower extremity 5,515 $38,389
Episode Category Total CountAverage 90 Day Total
Chest pain 55,116 $13,580Transient ischemia 39,464 $16,043Syncope & collapse 62,679 $17,211Esophagitis, gastroenteritis and other digestive disorders 120,370 $17,408Atherosclerosis 16,726 $17,573Cardiac arrhythmia 121,665 $18,062Gastrointestinal obstruction 46,628 $18,191Back & neck except spinal fusion 28,143 $18,738Chronic obstructive pulmonary disease, bronchitis, asthma 215,562 $19,383Gastrointestinal hemorrhage 91,852 $20,437
Where are the average dollars. . .