Embed Size (px)
Citation preview

Science and Mechatronics Aided Research for Teachers 2003
The National Science Foundation Division of Engineering Education & Centers
Heat Experiment by
Saul Harari, Sang-Hoon Lee, Hong Wong, and Vikram Kapila
1. Introduction
During winter, shaking hands with someone who just entered the building will leave you feeling chilly. Drinking a cold soda on a hot summer day will make you feel cool and refreshed. Why? If you heat a kettle on the stove, the water inside the kettle boils, but the kettle doesn’t melt. If you boil water in a covered pot, the lid rattles. People usually wear light color clothes during summer and dark colors during winter. Railroad tracks are built with gaps between each rail. Heat is the reason for these phenomena and human behaviors. In this experiment, we will investigate various properties of heat.
2. Background
2.1. Heat
All objects have energy. Although energy is present in various forms, we can broadly categorize it as microscopic and macroscopic. Microscopic energy is often referred to as the internal energy of an object since it deals with energies related to the atomic and subatomic realms, internal to the material. One measurement, or indication, of a material’s internal energy is temperature. See [2, 4, 6, 8, 9] for more details. The Celsius scale references zero degrees and one hundred degrees at the temperatures at which pure water freezes and boils, respectively, at standard atmospheric pressure. The range between these two extremes is uniformly divided. The Fahrenheit scale is based on an alternate unit of temperature. The basic idea is the same as with the Celsius scale, but the reference points are defined at different temperatures. The relation between Celsius and Fahrenheit temperatures is as follows
.3259 += CF
The Celsius and Fahrenheit scales are each a measurement of an object’s relative internal energy. To measure the absolute temperature of an object the Kelvin scale is used. On the Kelvin scale the zero point is the level at which the object is completely at rest, even at the subatomic level. A change of one degree Kelvin corresponds to a change of exactly one degree Celsius. The relation between Celsius and Kelvin temperatures is as follows
.273+= CK
2.2. Thermodynamics and heat transfer
The study of the relationships between heat and work (energy) and the systems in which energy is transferred is known as thermodynamics. Heat transfer is one concentrated subdivision within the field of thermodynamics, where the time rate of transfer is of particular interest. Referring to the heat, or temperature, of an object is merely a way of describing the object’s energy level. Heat transfer, however, refers to the transfer of energy from one location to another due to a difference in temperature. Our bodies are constantly transferring energy in the form of heat so that we may function properly. This is the reason that we run a fever when we are sick, as the body must work overtime to combat the disease. Heat transfer

Science and Mechatronics Aided Research for Teachers 2003
The National Science Foundation Division of Engineering Education & Centers
is also the principle driving force behind most energy sources that are currently available. An important aspect in the study of heat transfer and thermodynamics involves the design of energy efficient systems. There are three means through which heat transfer can take place; convection, conduction, and radiation, which we will discuss in the sequel. See [2, 4, 5, 8, 9] for more details. Thermal equilibrium
Heat flow always occurs in the direction of lower temperatures. That is heat, or energy, flows from a hot object into a cooler one until the temperatures of the two objects become equal. At this stage we say that thermal equilibrium has been achieved. A thermometer is based on this principle. See [2, 6, 8, 9] for more details. Thermal expansion
In our discussion on light, we see how the energy incident upon a material excites the electrons within the material. The average separation between the atoms in a material depends on the oscillation of its electrons. When the material, hence the electrons, are at lower energy levels, the amplitudes of oscillation are correspondingly small. At higher energy levels, however, the electrons oscillate with higher amplitudes. Therefore, the average separation between the atoms within the material increases. This phenomenon is known as thermal expansion. This phenomenon can be expressed in terms of either linear or volumetric expansion. See [2, 6, 8, 9] for more details. Linear expansion
For an object with initial length ,iL we can define ,α the average coefficient of linear expansion as follows
iLTL ∆∆≡ /α
where L∆ is the change in the length of the object due to change in temperature T∆ of the material. For relatively small changes in temperature, α is approximately constant and the expansion is directly proportional to the change in temperature ,T∆ which yields
.TLL i∆=∆ α Table 1 lists the average coefficient of linear expansion for various materials [9].
Table 1: Average coefficients of linear expansion
Material ( )K510−×α Aluminum 2.4
Brass 2.0 Copper 1.7 Glass 0.4~0.9
Invar (nickel-iron alloy) 0.09 Quartz (fused) 0.04
Steel 1.2

Science and Mechatronics Aided Research for Teachers 2003
The National Science Foundation Division of Engineering Education & Centers
Linear expansion of a material is an extremely useful property. By utilizing this property we can design an automated temperature switch with the aid of a bi-metallic strip, where one of the materials reacts more drastically to a change in temperature. This is the principle of thermostat used in typical home heating/cooling controller. Volume expansion
Thermal expansion can also be expressed in terms of volume. The volumetric change of an object, ,V∆ due to change in temperature T∆ of the material is given as follows
TVV i∆=∆ β
where β is the coefficient of volume expansion and iV is the initial volume of the object. As the following table indicates, for most solid materials αβ ×≅ 3 [8]. Table 2 lists the coefficient of volume expansion for various materials.
Table 2: Coefficients of volume expansion ( )K510−×β
A: Solids B: Liquids Aluminum 7.2 Carbon disulfide 115
Brass 6.0 Ethanol 75 Copper 5.1 Glycerin 49 Glass 1.2~2.7 Mercury 18
Invar (nickel-iron alloy) 0.27 Quartz (fused) 0.12
Steel 3.6
Conduction
Conduction is the transfer of heat energy through a solid. For example, if you heat one side of a long copper rod, the other side will also get very hot. How does this happen? The atoms in the rod that are exposed to the heat, gain energy in the form of heat and transfer this energy to their neighbors, which then transfer the heat energy to their neighboring atoms. In this manner, the energy is passed along through the length of the rod. The amount of heat energy that an object will conduct is a property of i) the thermal conductivity of the material, ii) the length and cross sectional area of the rod, and iii) the temperature difference between the two ends of the rod. We define Q and H as the heat transfer and the time rate of change of heat transfer, respectively. For steady state conduction, when a fixed temperature difference exists between the two points of interest, H is given as follows
LTTkA
dtdQH CH −
==
where k is the thermal conductivity of the material, A is the cross-sectional area of the rod, CH TT − is the difference in temperature that exists between two points on the rod, and L is the distance between the two points. See [2, 4, 6, 8, 9] for more details. Figure 1 is a diagram depicting heat conduction.

Science and Mechatronics Aided Research for Teachers 2003
The National Science Foundation Division of Engineering Education & Centers
Figure 1: Heat conduction
Table 3 lists thermal conductivities for various metals, solids, and gases [9].
Table 3: Thermal conductivities ( )KmWk ⋅
A: Metals B: Various Solids C: Gases Aluminum 205.0 Brick, insulating 0.15 Air 0.024
Brass 109.0 Concrete 0.8 Argon 0.016 Copper 385.0 Cork 0.04 Helium 0.14 Lead 34.7 Felt 0.04 Hydrogen 0.14
Mercury 8.3 Fiberglass 0.04 Oxygen 0.023 Silver 406.0 Glass 0.8 Steel 50.2 Rock wool 0.04
Styrofoam 0.01 Wood 0.12~0.04
Convection
Most fluids also undergo expansion when they are heated. Thus, the density of one such fluid decreases with increasing temperature, and the fluid rises. The area vacated by the expanded fluid is occupied by cooler and heavier neighboring molecules. In turn, these molecules, which are now exposed to the heat source, expand and rise. The displaced molecules will eventually cool down and will sink. This process is cyclical and is a mechanism of heat transfer by the movement and circulation of a fluid mass called convection. There are two categories of convection, natural and forced. Natural convection occurs as a result of an induced fluid circulation due to heat transfer. Forced convection is a result of an externally induced fluid circulation. Heat transfer due to natural convection is minimal compared with forced convection. Convection ovens are a good example of using an induced air flow to heat a system. Weather patterns are greatly influenced by convection and are good example of natural convection. Convection is generally used to cool an object rather than to heat it. See [2, 6, 8, 9] for more details. Figure 2 is a diagram depicting convection.
Figure 2: Convection
H
Heat source
Fluid flow

Science and Mechatronics Aided Research for Teachers 2003
The National Science Foundation Division of Engineering Education & Centers
Radiation
Thus far we have discussed two forms of heat transfer where each requires a medium for the energy to travel through. Heat transfer, however, can occur in the absence of a medium as well. This form of heat transfer is known as radiation. Our planet, Earth, receives solar energy in the form of light from the Sun through radiation. Although we are at a distance of approximately 93 million miles from the sun, we gain sufficient energy because the dependency of radiation on temperature differences is quite significant. See [6, 8] for more details.
3. Equipment list
Board of Education (BOE) with Basic Stamp 2 (BS2)
The combination of the BS2 embedded within the BOE will serve as the microcontroller that monitors the experiments that you are about to do. The BS2 is a 24 pin Dual Inline Package (DIP) integrated circuit (IC). It is based on Microchip Inc.’s PIC 16C57 microcontroller. The BS2 is powered by a 6-14V direct current (VDC) power supply. An onboard voltage regulator provides a steady 5VDC output to the BS2. The BS2 comes with ROM, 2KB Electronically Erasable Programmable ROM (EEPROM), and a small amount of RAM. The BS2 is programmed in PBasic language, the instruction set that is stored in the BS2 ROM. The user defined program is downloaded into the EEPROM from a PC to the BOE using a DB-9 serial cable. The excess EEPROM can be used for long term data storage. The BS2 has 16 general purpose digital input/output (I/O) pins that are user defined. The high position on a digital I/O pin refers to a 5VDC and a low position on a digital I/O pin refers to a 0VDC (ground potential). Each pin can source (supply) a maximum current of 20mA and sink (draw) a maximum current of 25mA. The 16 I/O pins on the BS2 at any given time can source/sink a maximum of 40mA/50mA. If using an external 5VDC voltage regulator, these limits apply to each group of 8 pins, P0-P7 and P8-P15. Exceeding these current source/sink limits or establishing a voltage on a pin greater than 5VDC will damage the BS2. See [5, 7] for more details.
A limitation that often arises when using the BS2 is the lack of support for floating point variables. Utilizing floating point operations like division in the absence of floating point variables may lead to mathematical errors due to truncation. The largest variable or constant that can be stored on the BS2 is of word size (16 bits), which has a numerical range of 0-65,535 in decimal notation. The program codes that will be used for the heat experiments have been written to display the temperature in units of
C°−110 to maintain the maximum resolution possible given the limitation of the BS2 with respect to floating point variables.
A BOE and BS2 are depicted in Figure 3 [3]. The BS2 is placed, in the same orientation as shown, in the IC socket in the lower left corner of the BOE.
Figure 3: Parallax Board of Education with a Basic Stamp 2 at right

Science and Mechatronics Aided Research for Teachers 2003
The National Science Foundation Division of Engineering Education & Centers
Heat experiment test bed
The heat experiment test bed will be used for all of the heat experiments that you are about to do. It consists of three DS1620 thermal sensors placed at distances of approximately 7″. The DS1620 is a digital temperature sensor made by Dallas Semiconductor. It is easily interfaced with the BS2 using the shiftin and shiftout PBasic commands to provide temperature readings in Celsius units. The DS1620 has an operating range of C°− 55 to C°125 with half degree resolution. See [5] for more details. The sensors are internally wired to a DB-15 adapter at the head of the test bed for connection to the BS2.
For the conduction experiment rods of aluminum and steel are used. The rods are of same length and diameter. A heating element is also provided for the conduction experiment. A hole has been bored into one end of each rod for the heating element to be inserted. A solid state relay, which is used to supply power to an AC heating element, has also been wired to the DB-15 adapter. Because the heating element is capable of reaching temperatures over ,600 C° a variable transformer is also provided to limit the power delivered to the heating element. The other end of the rod is placed into an ice water bath. A container with a watertight cutout that the rod can be slid into is provided to hold the ice water bath. Piping insulation is provided to minimize heat losses along the rod.
Figure 4 is a picture of the heat experiment test bed. The piping insulation has been removed so that it is possible to see the temperature sensors.
Figure 4: A view of the heat experiment test bed Figure 5 is a close up of a mounting for one of the DS1620 temperature sensors used in the test bed.
Figure 5: One of the DS1620s used in the heat experiment test bed
DS1620 DB-15 adapter
DS1620
Ωk1
Science and Mechatronics Aided Research for Teachers 2003
The National Science Foundation Division of Engineering Education & Centers
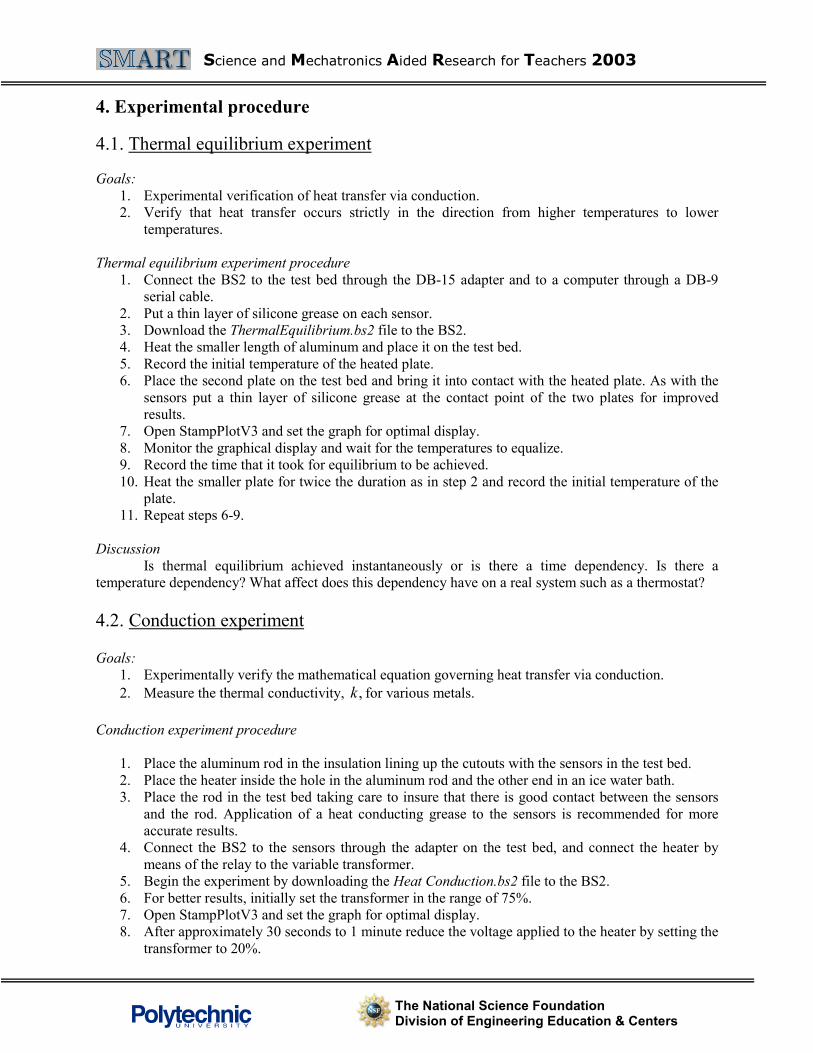
4. Experimental procedure
4.1. Thermal equilibrium experiment
Goals: 1. Experimental verification of heat transfer via conduction. 2. Verify that heat transfer occurs strictly in the direction from higher temperatures to lower
temperatures. Thermal equilibrium experiment procedure
1. Connect the BS2 to the test bed through the DB-15 adapter and to a computer through a DB-9 serial cable.
2. Put a thin layer of silicone grease on each sensor. 3. Download the ThermalEquilibrium.bs2 file to the BS2. 4. Heat the smaller length of aluminum and place it on the test bed. 5. Record the initial temperature of the heated plate. 6. Place the second plate on the test bed and bring it into contact with the heated plate. As with the
sensors put a thin layer of silicone grease at the contact point of the two plates for improved results.
7. Open StampPlotV3 and set the graph for optimal display. 8. Monitor the graphical display and wait for the temperatures to equalize. 9. Record the time that it took for equilibrium to be achieved. 10. Heat the smaller plate for twice the duration as in step 2 and record the initial temperature of the
plate. 11. Repeat steps 6-9.
Discussion
Is thermal equilibrium achieved instantaneously or is there a time dependency. Is there a temperature dependency? What affect does this dependency have on a real system such as a thermostat?
4.2. Conduction experiment
Goals: 1. Experimentally verify the mathematical equation governing heat transfer via conduction. 2. Measure the thermal conductivity, ,k for various metals.
Conduction experiment procedure
1. Place the aluminum rod in the insulation lining up the cutouts with the sensors in the test bed. 2. Place the heater inside the hole in the aluminum rod and the other end in an ice water bath. 3. Place the rod in the test bed taking care to insure that there is good contact between the sensors
and the rod. Application of a heat conducting grease to the sensors is recommended for more accurate results.
4. Connect the BS2 to the sensors through the adapter on the test bed, and connect the heater by means of the relay to the variable transformer.
5. Begin the experiment by downloading the Heat Conduction.bs2 file to the BS2. 6. For better results, initially set the transformer in the range of 75%. 7. Open StampPlotV3 and set the graph for optimal display. 8. After approximately 30 seconds to 1 minute reduce the voltage applied to the heater by setting the
transformer to 20%.

Science and Mechatronics Aided Research for Teachers 2003
The National Science Foundation Division of Engineering Education & Centers
9. Allow the rod to reach steady-state. 10. Once the rod has reached steady-state, disconnect StampPlotV3 and download the
Calculate_K.bs2 file to the BS2. 11. Repeat steps 1-9 for the steel rod.
Discussion
Which metal is the better heat conductor [1]? Is there any correlation between heat conductivity and thermal conductivity? Do these results seem reasonable?
In summer, one would like his/her house to absorb minimal heat from the outside environment without allowing the cooler air inside to escape. The reverse is true for winter, when one wants to retain as much heat as possible. Is it possible to build a wall that satisfies both demands? What material should one use? Should the wall be made from a single material or a composition? Are the walls of your house of optimal design in this consideration?
4.3. Radiation experiment (Temperature difference under colored cloths)
Goal: 1. Study the effect a material has on heat transfer.
Radiation experiment procedure
1. Connect the BS2 to the test bed through the DB-15 adapter and to a computer through a DB-9 serial cable.
2. Place a piece of cloth over each of the sensors on the test bed. 3. Download the Radiation.bs2 file to the BS2. 4. Open StampPlotV3 and set the graph for optimal display. 5. Record the initial temperature for each sensor. 6. Direct a heat source over the test bed experiment near a window so that it is exposed to the
sunlight. 7. The BS2 will monitor the changing temperature for each sensor. 8. Record the effect these mate results had on heat transfer. 9. Replace the clothes on the sensors and repeat steps 3-8.
Discussion
We have just seen that color affects the amount of heat energy that the object absorbs. For this reason it is advisable to wear light colored clothing during summer and dark colored clothing in winter. For certain applications, however, this color scheme is not possible. Jungle camouflage, for instance, has to be earthy tones, dark greens and browns. Similarly, arctic camouflage is predominately white (think of polar bears and arctic foxes). What are some other methods of controlling the heat absorption of clothing?
5. Suggested projects
1) Digital thermostat: Use a microcontroller, temperature sensors, and a heat source to build a user-friendly thermostat that monitors and controls a desired temperature.
2) Thermal expansion experiment: Devise a means of measuring linear and volumetric expansion due to an increase in temperature.
a. Linear expansion: Use a strain gauge to measure the linear expansion of various metals and obtain a value for .α
b. Volumetric expansion: Measure the volumetric expansion of a gas by relating a change in temperature to a corresponding change in volume.

Science and Mechatronics Aided Research for Teachers 2003
The National Science Foundation Division of Engineering Education & Centers
6. References
[1] Online: http://dataharvest.com/Products/easysense/samples/physics/heat.htm, web site for Data Harvest Educational, a company specializing in probe technologies designed for use in the classroom.
[2] Online: http://hyperphysics.phy-astr.gsu.edu/hbase/heacon.html#heacon, educational web site for physics, math, chemistry, mechanics, and other natural sciences, by Carl R. Nave, heat transferbasics.
[3] Online: http://www.parallax.com, web site of Parallax, Inc. manufacturer and distributor of BasicStamp microcontrollers containing technical specifications and user manuals.
[4] Online: http://www.sasked.gov.sk.ca/docs/physics/u4a2phy.html, web site of the Mathematics and Natural Sciences Branch, Curriculum and Instruction Division, Saskatchewan Education.
[5] Online: http://www.stampsinclass.com, web site of Stamps in Class containing educational resourcesfor Basic Stamp microcontrollers.
[6] Y.A. Çengel and R.H. Turner, Fundamentals of Thermal-Fluid Sciences. McGraw-Hill, Boston, MA, (2001).
[7] V. Kapila, Course Notes for Mechatronics ME 3484, Polytechnic University, Brooklyn, NY, (2003). [8] R.A. Serway and R.J. Beichner, Physics for Scientists and Engineers. Saunders College Publishing,
Orlando, FL, 5th Ed., (2000). [9] H.D. Young, University Physics. Addison-Wesley Publishing Co., New York, NY, 8th Ed., (1992).

Science and Mechatronics Aided Research for Teachers 2003
The National Science Foundation Division of Engineering Education & Centers
Appendix A: Circuit schematics
Figure A1: Circuit schematic for the heat experiment test bed