Embed Size (px)
Citation preview

1
Heart Pump and Cardiac Cycle
Faisal I. Mohammed, MD, PhD

2
Objectives
To understand the volume, mechanical, pressure and electrical changes during the cardiac cycle
To understand the inter-relationship between all these changes
To describe the factors that regulate Cardiac output and Stroke volume.
Resources: Textbook of Medical Physiology By Guyton and Hall

3

4

5
Cardiac Cycle
Cardiac cycle refers to all events
associated with blood flow through
the heart
– Systole – contraction of heart
muscle
– Diastole – relaxation of heart
muscle

6
Cardiac Cycle
Atrial systole 0.1 second
Atrial diastole 0.7 second
Ventricular systole 0.3 second
Isovolumic contraction 0.01 seconds
Rapid ejection period
Slow ejection period
Ventricular diastole 0.5 seconds
Isovolumic relaxation 0.02 seconds
Rapid filling
Slow filling (Diastasis)
Atrial contraction

7
Cardiac cycle …cont
End diastolic volume (EDV) – End systolic
volume (ESV) = Stroke volume (SV)
SV X heart rate (HR) = cardiac output (CO)
Ejection fraction = SV/EDV
Inotropic vs. Chronotropic
Autonomic control of cardiac cycle (pump)
8
Ventricular filling – mid-to-late
diastole
– Heart blood pressure is low as blood
enters atria and flows into ventricles
– AV valves are open, then atrial
systole occurs
Phases of the Cardiac Cycle

9
Ventricular systole
– Atria relax
– Rising ventricular pressure results in
closing of AV valves
– Isovolumetric contraction phase
– Ventricular ejection phase opens
semilunar valves
Phases of the Cardiac Cycle

10
Phases of the Cardiac Cycle
Isovolumetric relaxation – early diastole
– Ventricles relax
– Backflow of blood in aorta and pulmonary
trunk closes semilunar valves
Dicrotic notch – brief rise in aortic pressure
caused by backflow of blood rebounding off
semilunar valves


12

13
Changes during Cardiac cycle
Volume changes: End-diastolic volume, End-systolic volume, Stroke volume and Cardiac output.
Aortic pressure: Diastolic pressure 80 mmHg, Systolic pressure 120 mmHg, most of systole ventricular pressure higher than aortic
Ventricular pressure: Diastolic 0, systolic Lt. 120 Rt. 25 mmHg.
Atrial pressure: A wave =atrial systole, C wave= ventricular contraction (AV closure), V wave= ventricular diastole (Av opening)
Heart sounds: S1 = turbulence of blood around a closed AV valves, S2 = turbulence of blood around a closed semilunar valves.
14
Heart Sounds
15
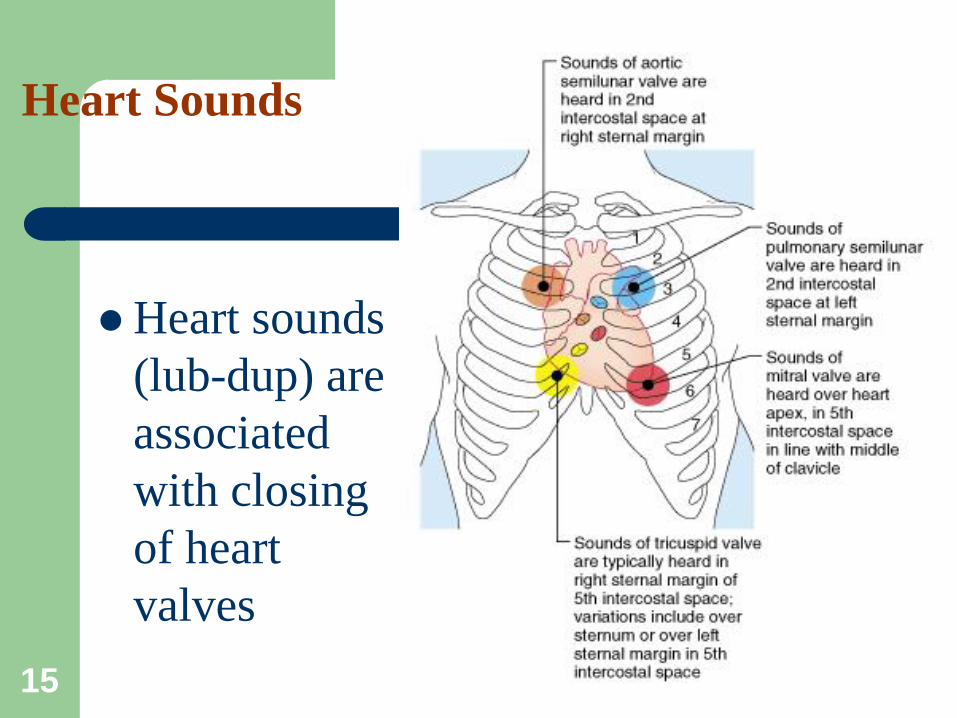
Heart Sounds
Heart sounds
(lub-dup) are
associated
with closing
of heart
valves

16
Auscultation – listening to heart sound via stethoscope
Four heart sounds
– S1 – “lubb” caused by the closing of the AV valves
– S2 – “dupp” caused by the closing of the semilunar
valves
– S3 – a faint sound associated with blood flowing into
the ventricles
– S4 – another faint sound associated with atrial
contraction
Heart sounds
17
Cardiac Output (CO) and Reserve
CO is the amount of blood pumped by each
ventricle in one minute
CO is the product of heart rate (HR) and stroke
volume (SV)
HR is the number of heart beats per minute
SV is the amount of blood pumped out by a
ventricle with each beat
Cardiac reserve is the difference between resting
and maximal CO
18
Cardiac Output: Example
CO (ml/min) = HR (75 beats/min)
x SV (70 ml/beat)
CO = 5250 ml/min (5.25 L/min)

19
Regulation of Stroke Volume
SV = end diastolic volume (EDV)
minus end systolic volume (ESV)
EDV = amount of blood collected in a
ventricle during diastole
ESV = amount of blood remaining in a
ventricle after contraction

20
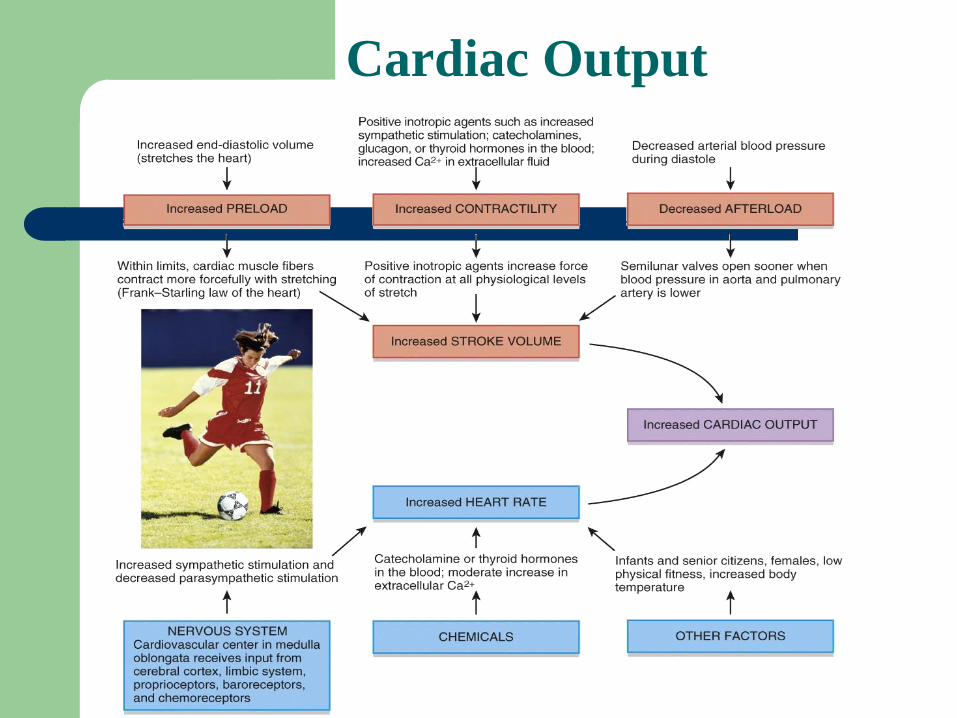
Factors Affecting Stroke Volume
Preload – amount ventricles are
stretched by contained blood
Contractility – cardiac cell contractile
force due to factors other than EDV
Afterload – back pressure exerted by
blood in the large arteries leaving the
heart

21
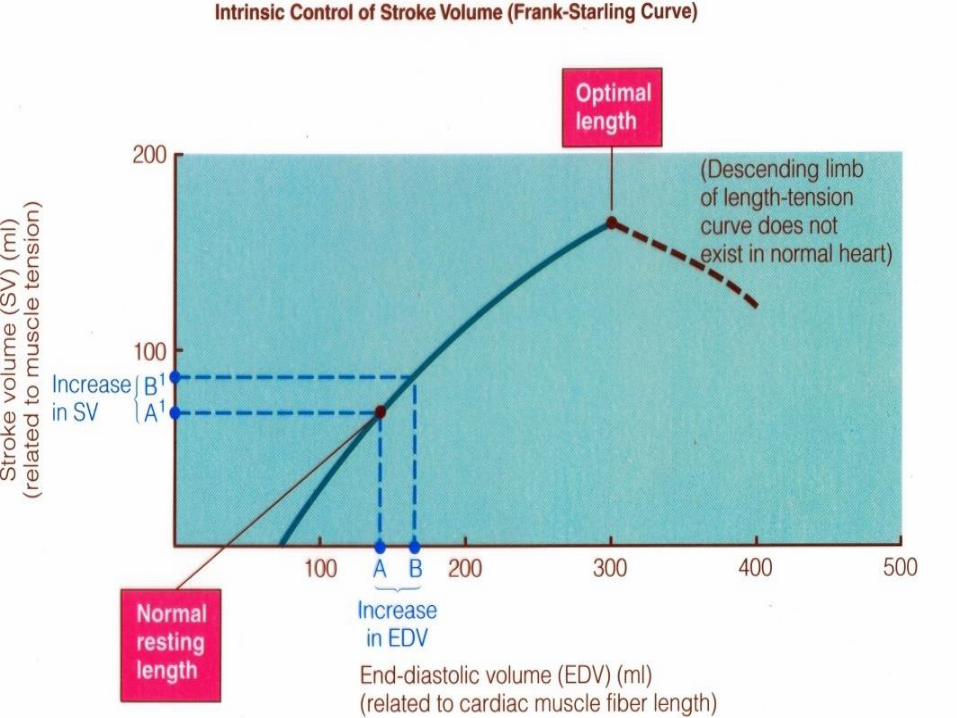
Frank-Starling Law of the Heart
Preload, or degree of stretch, of cardiac
muscle cells before they contract is the
critical factor controlling stroke volume
Slow heartbeat and exercise increase venous
return to the heart, increasing SV
Blood loss and extremely rapid heartbeat
decrease SV

22
Preload and Afterload
Cardiac Output

24
Phases of the Cardiac Cycle
25
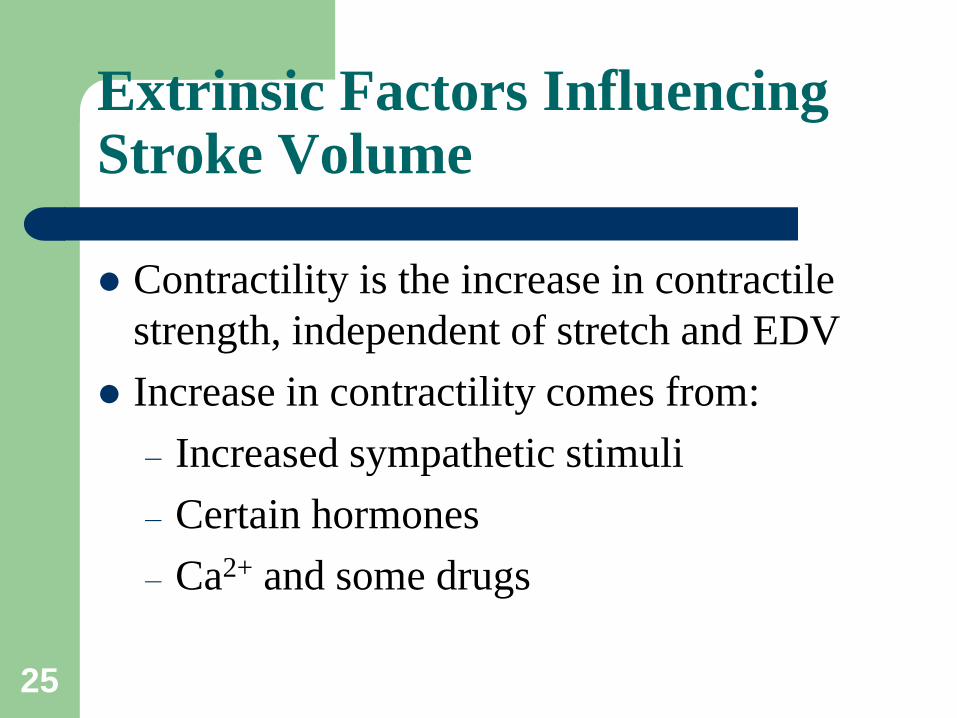
Extrinsic Factors Influencing Stroke Volume
Contractility is the increase in contractile
strength, independent of stretch and EDV
Increase in contractility comes from:
– Increased sympathetic stimuli
– Certain hormones
– Ca2+ and some drugs
26
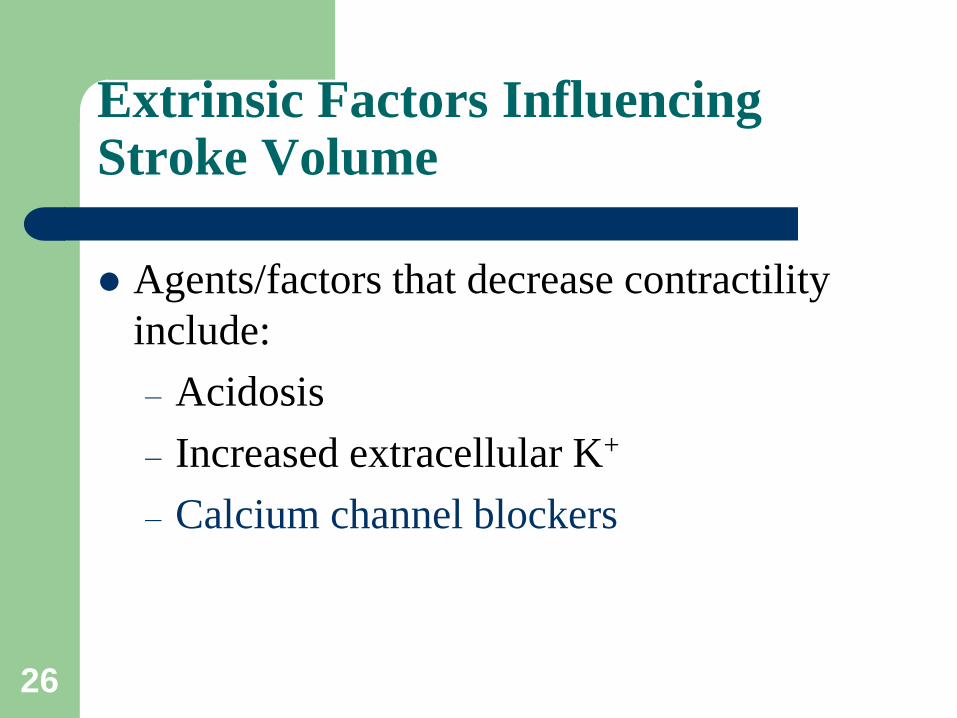
Extrinsic Factors Influencing Stroke Volume
Agents/factors that decrease contractility
include:
– Acidosis
– Increased extracellular K+
– Calcium channel blockers

Contractility and Norepinephrine
Sympathetic
stimulation
releases
norepinephrine
and initiates a
cyclic AMP
second-
messenger
system
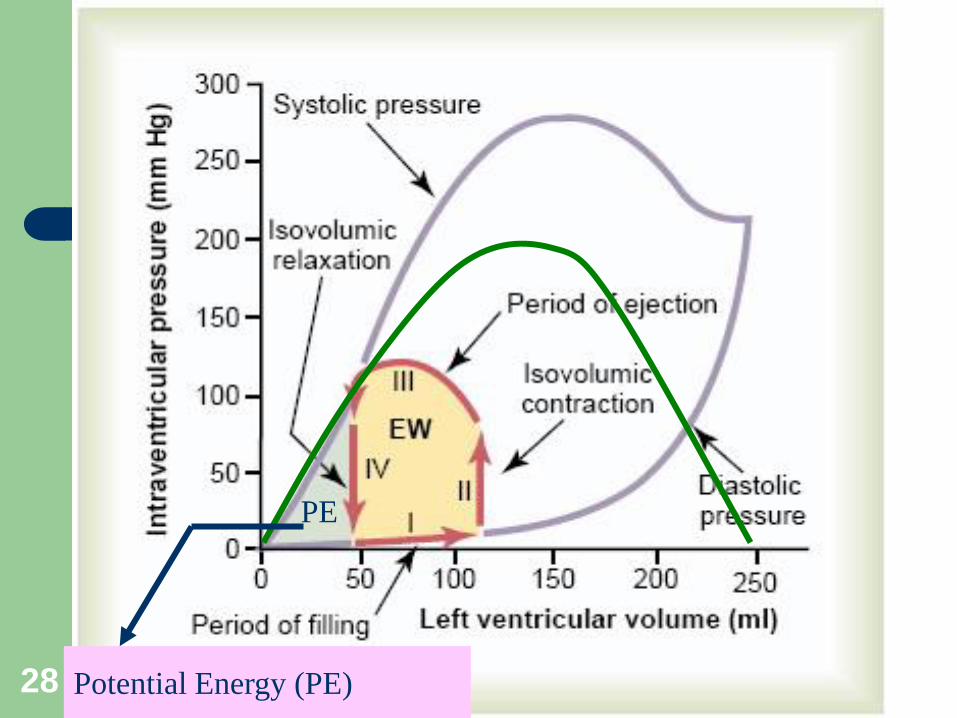
28 Potential Energy (PE)
PE
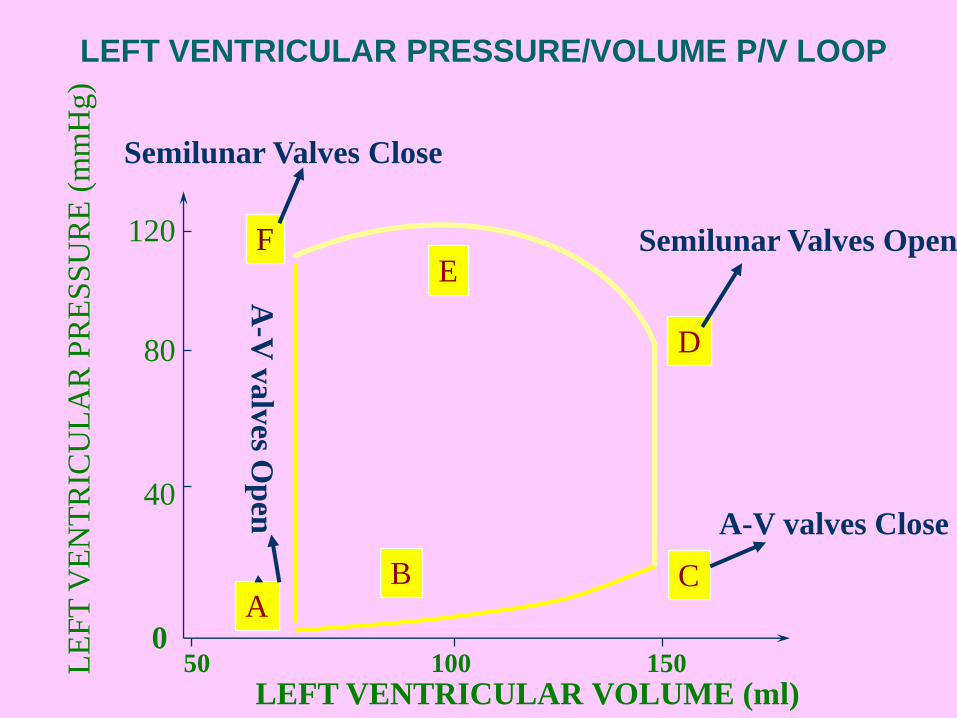
LEFT VENTRICULAR PRESSURE/VOLUME P/V LOOP L
EF
T V
EN
TR
ICU
LA
R P
RE
SS
UR
E (
mm
Hg)
LEFT VENTRICULAR VOLUME (ml)
A B C
D
E F
100 150 50 0
120
40
80
A-V valves Close
Semilunar Valves Open
Semilunar Valves Close
A-V
valv
es Op
en

30
Valvular Function
To prevent back-flow.
Chordae tendineae are attached to A-V valves.
Papillary muscle, attached to chordae
tendineae, contract during systole and help prevent
back-flow.
Because of smaller opening, velocity through
aortic and pulmonary valves exceed that through
the A-V valves.

Valvular Function (cont’d)
Most work is external work or pressure-volume
work.
A small amount of work is required to impart
kinetic energy to the heart (1/2 mV2).
What is stroke-volume in previous figure?
External work is area of Pressure-Volume curve.
Work output is affected by “preload” (end-diastolic
pressure) and “afterload” (aortic pressure).

50
100
150
200
50 100 150 200 0
Intr
aven
tric
ula
r P
ress
ure
(m
mH
g)
Left Ventricular Volume (ml)
Period of Filling
Isovolumic
Relaxation
Period of
Ejection
Isovolumic
Contraction
End Systolic Volume
End Diastolic Volume
Work Output of the Heart
33
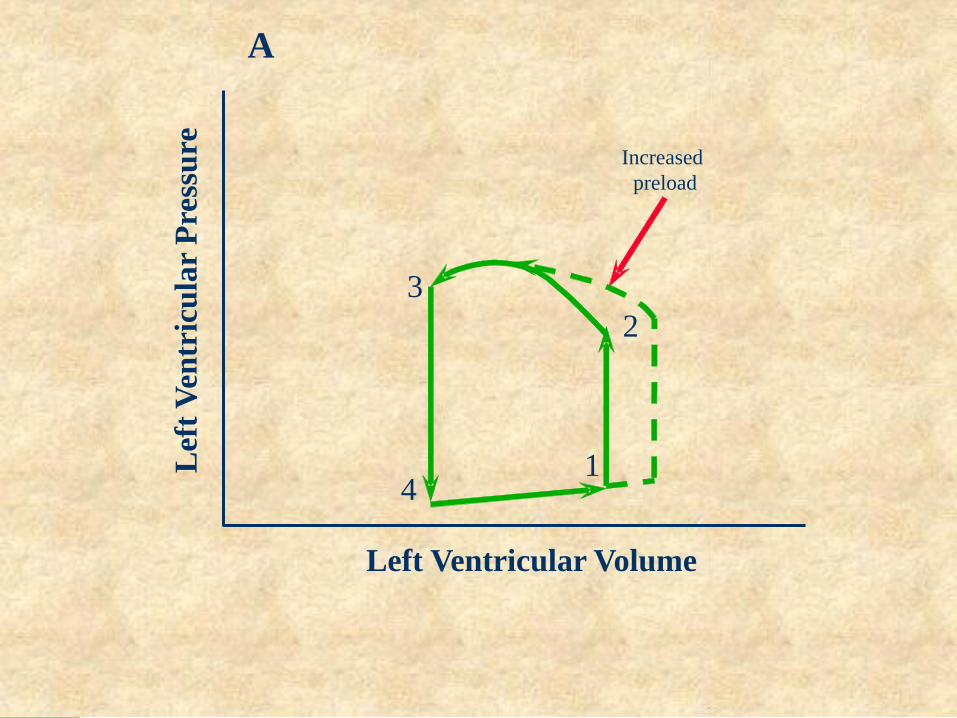
Left Ventricular Volume
Lef
t V
entr
icu
lar
Pre
ssu
re
A
3
4 1
2
Increased
preload

34
Left Ventricular Volume
Lef
t V
entr
icu
lar
Pre
ssu
re
B
Increased
afterload
3
4
2
1
35
Lef
t V
entr
icu
lar
Pre
ssu
re
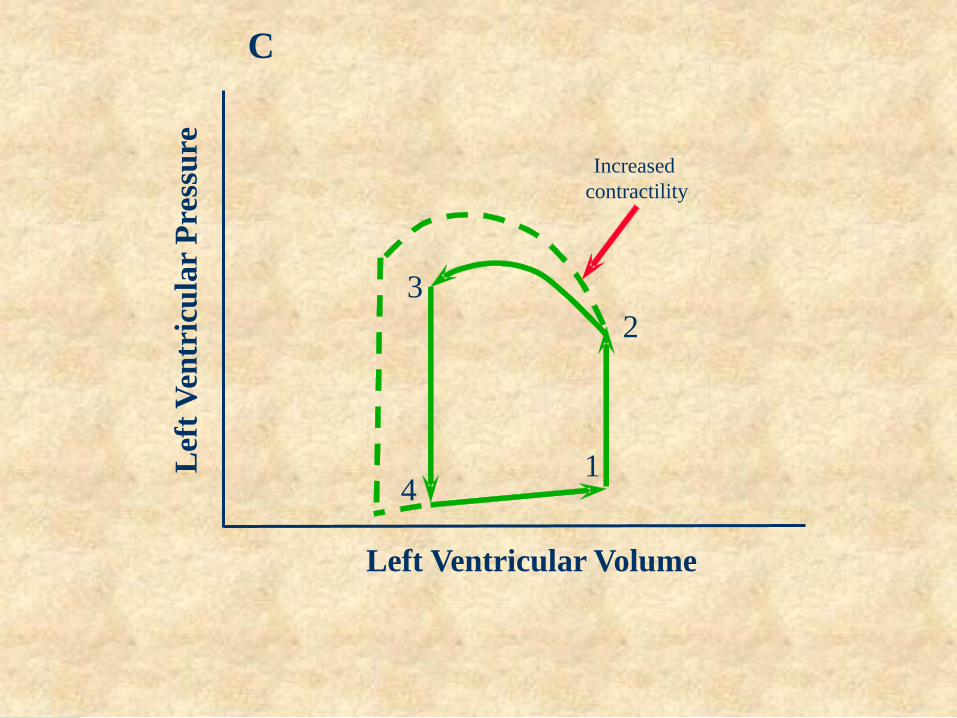
Left Ventricular Volume
C
Increased
contractility
3
4
2
1

PRESSURE/VOLUME RELATIONSHIPS UNDER DIFFERENT CONDITIONS
PRELOAD AFTERLOAD CONTRACTILITY
37
38
Regulation of Heart Rate
Positive chronotropic factors increase
heart rate
Negative chronotropic factors decrease
heart rate

39
Sympathetic nervous system (SNS) stimulation is
activated by stress, anxiety, excitement, or
exercise
Parasympathetic nervous system (PNS)
stimulation is mediated by acetylcholine and
opposes the SNS
PNS dominates the autonomic stimulation,
slowing heart rate and causing vagal tone
Regulation of Heart Rate: Autonomic Nervous System

40
Atrial (Bainbridge) Reflex
Atrial (Bainbridge) reflex – a
sympathetic reflex initiated by
increased blood in the atria
– Causes stimulation of the SA node
– Stimulates baroreceptors in the atria,
causing increased SNS stimulation

41
Chemical Regulation of the Heart
The hormones epinephrine and thyroxine
increase heart rate
Intra- and extracellular ion concentrations
must be maintained for normal heart
function

42
• Cardiac Output is the sum of all tissue flows and
is affected by their regulation (CO = 5L/min,
cardiac index = 3L/min/m2 (surface area in m2).
• CO is proportional to tissue O2. use.
• CO is proportional to 1/TPR when AP is constant.
• CO = (MAP - RAP) / TPR
Important Concepts About
Cardiac Output (CO) Control

NORMAL
HYPEREFFECTIVE
-4 0 +4 +8
25
20
15
10
5
0
CA
RD
IAC
OU
TP
UT
(L
/min
)
RIGHT ATRIAL PRESSURE (mmHg)
HYPOEFFECTIVE
CARDIAC OUTPUT
CURVES

• Plateau of CO curve determined by
heart strength (contractility + HR)
• Sympathetics plateau
• Parasympathetics (HR) plateau)
• Plateau
• Heart hypertrophy ’s plateau
• Myocardial infarction plateau)
• Plateau
The Cardiac Output Curve

• Valvular disease plateau
(stenosis or regurgitation)
• Myocarditis plateau
• Cardiac tamponade plateau)
• Plateau
• Metabolic damage plateau
The Cardiac Output Curve (cont’d)

46
During the latter part of the ejection phase how can
blood still leave the ventricle if pressure is higher in
the aorta? Momentum of blood flow
Total energy of blood = P + mV2/2
= pressure + kinetic energy
Total energy of blood leaving ventricle is greater than
in aorta.
Ventricular Pressure and Volume Curves (cont’d)

47
Ejection Fraction
End diastolic volume = 125 ml
End systolic volume = 55 ml
Ejection volume (stroke volume) = 70 ml
Ejection fraction = 70ml/125ml = 56%
(normally 60%)
If heart rate (HR) is 70 beats/minute, what is
cardiac output?
Cardiac output = HR * stroke volume
= 70/min. * 70 ml
= 4900ml/min.

48
Ejection Fraction (cont’d)
If HR =100, end diastolic volume = 180 ml,
end systolic vol. = 20 ml, what is cardiac
output?
C.O. = 100/min. * 160 ml = 16,000 ml/min.
Ejection fraction= 160/180%=~ 90%

49
Aortic Pressure Curve
Aortic pressure starts increasing during systole
after the aortic valve opens.
Aortic pressure decreases toward the end of the
ejection phase.
After the aortic valve closes, an incisura occurs
because of sudden cessation of back-flow toward
left ventricle.
Aortic pressure decreases slowly during diastole
because of the elasticity of the aorta.

Frank-Starling Mechanism
Within physiological limits the heart pumps all
the blood that comes to it without excessive
damming in the veins.
Extra stretch on cardiac myocytes makes actin
and myosin filaments interdigitate to a more
optimal degree for force generation.
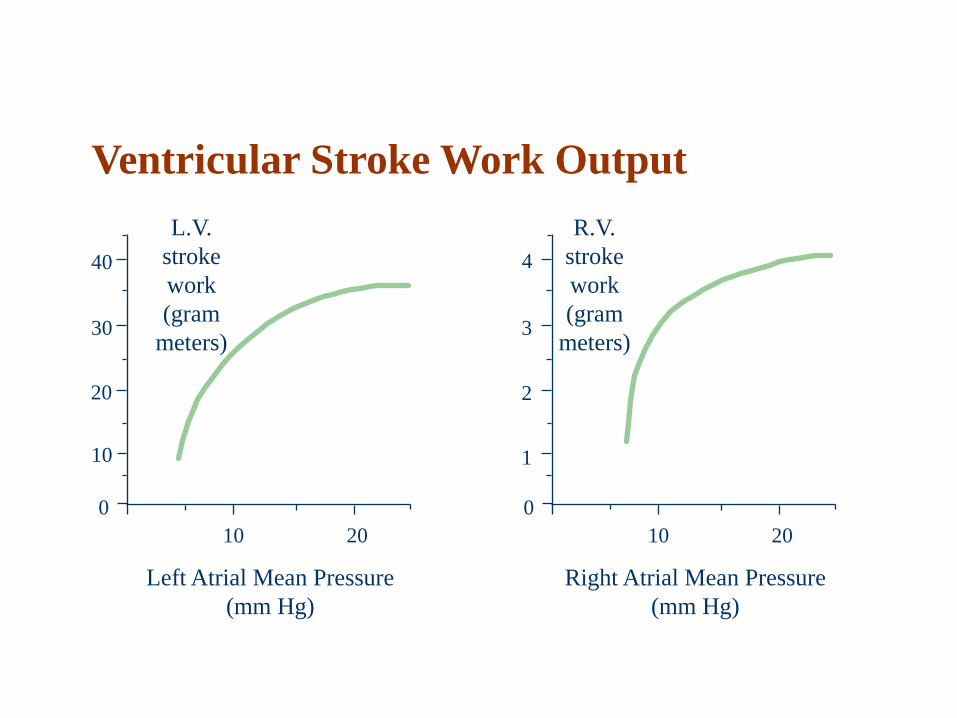
0
10
20
30
40
10 20
Left Atrial Mean Pressure
(mm Hg)
L.V.
stroke
work
(gram
meters)
0
1
2
3
4
10 20
Right Atrial Mean Pressure
(mm Hg)
R.V.
stroke
work
(gram
meters)
Ventricular Stroke Work Output

Autonomic Effects on Heart
Sympathetic stimulation causes increased HR and
increased contractility with HR = 180-200 and C.O.
= 15-20 L/min.
Parasympathetic stimulation decreases HR markedly
and decreases cardiac contractility slightly. Vagal
fibers go mainly to atria.
Fast heart rate (tachycardia) can decrease C.O.
because there is not enough time for heart to fill
during diastole.
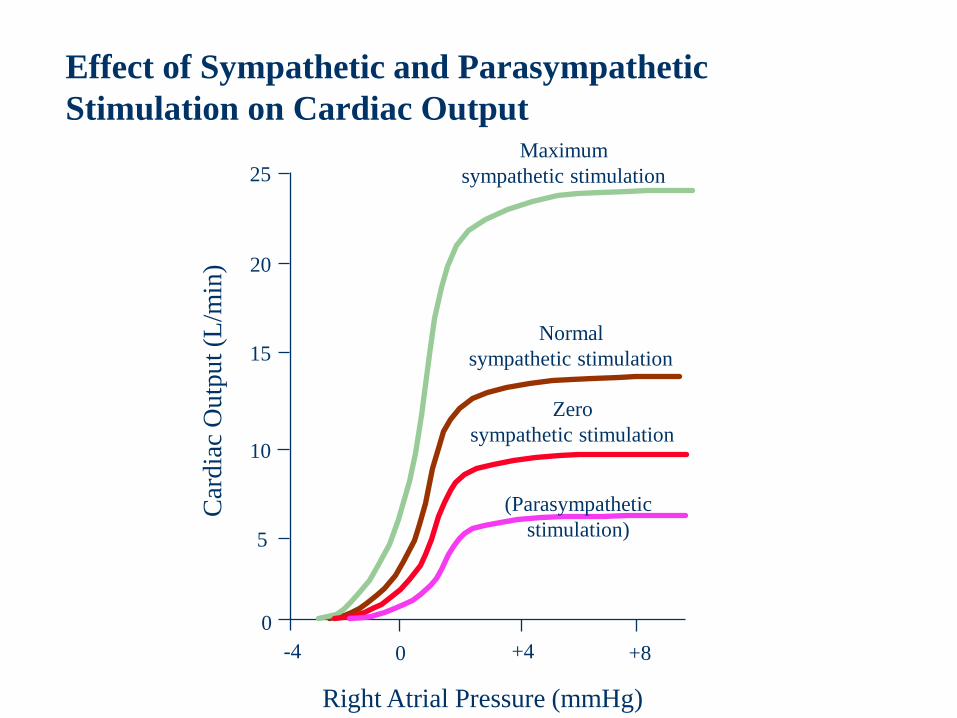
25
20
15
10
5
0
-4 0 +4 +8
Car
dia
c O
utp
ut
(L/m
in)
Right Atrial Pressure (mmHg)
(Parasympathetic
stimulation)
Zero
sympathetic stimulation
Normal
sympathetic stimulation
Maximum
sympathetic stimulation
Effect of Sympathetic and Parasympathetic
Stimulation on Cardiac Output

Cardiac Contractility
Best is to measure the C.O. curve, but this is
nearly impossible in humans.
dP/dt is not an accurate measure because this
increases with increasing preload and afterload.
(dP/dt)/P ventricle is better. P ventricle is
instantaneous ventricular pressure.
Excess K+ decreases contractility.
Excess Ca++ causes spastic contraction, and
low Ca++ causes cardiac dilation.

55
Thank You