Embed Size (px)
Citation preview

Healthcare Solutions that Work
North Bay Business Journal – Healthcare ConferenceNovember 11, 2009
Ken ShachmutSenior Vice President – Safeway Inc.
Executive Vice President – Safeway Health LLC
2
Agenda
U. S. healthcare challenge
Safeway experience
Policy implications
Safeway Health
3
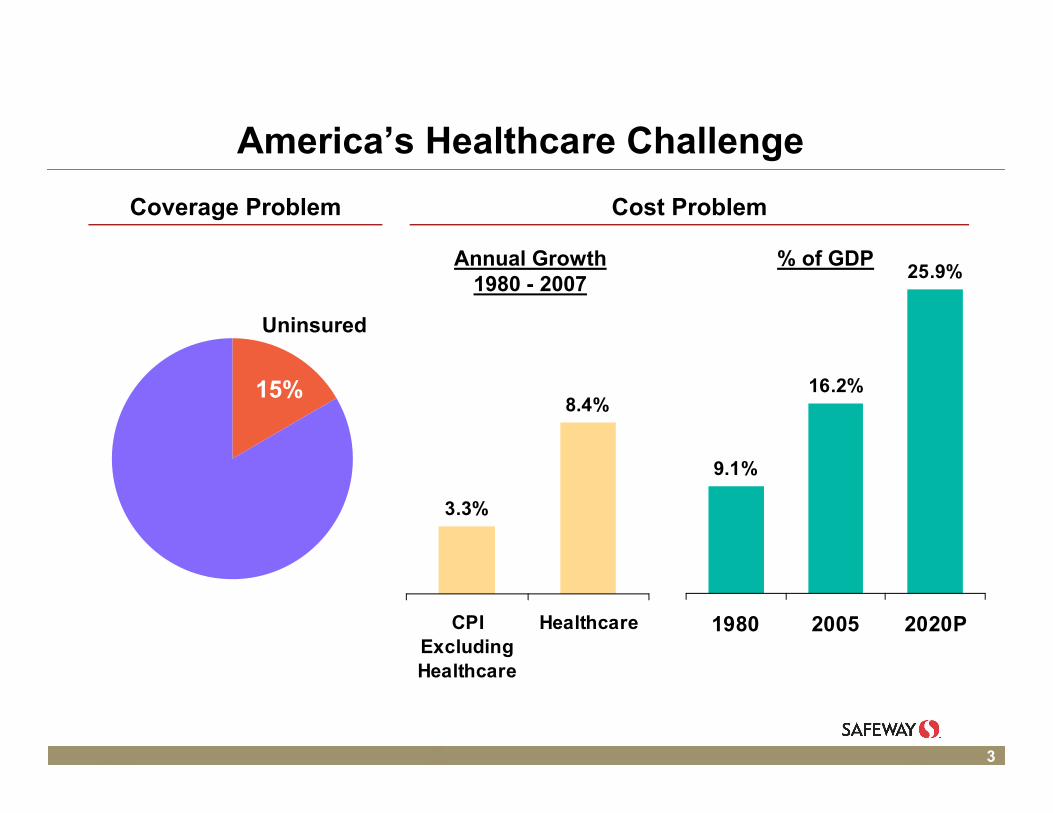
9.1%
16.2%
25.9%
1980 2005 2020P
America’s Healthcare Challenge
15%
Uninsured
3.3%
8.4%
CPIExcludingHealthcare
Healthcare
Annual Growth1980 - 2007
% of GDP
Coverage Problem Cost Problem

4
Lowering America’s Healthcare Cost Requires:
Improving the health of our population
Improving the effectiveness and efficiency of our healthcare delivery system
A market-based system in combination with universal coverage would address both of these requirements
5
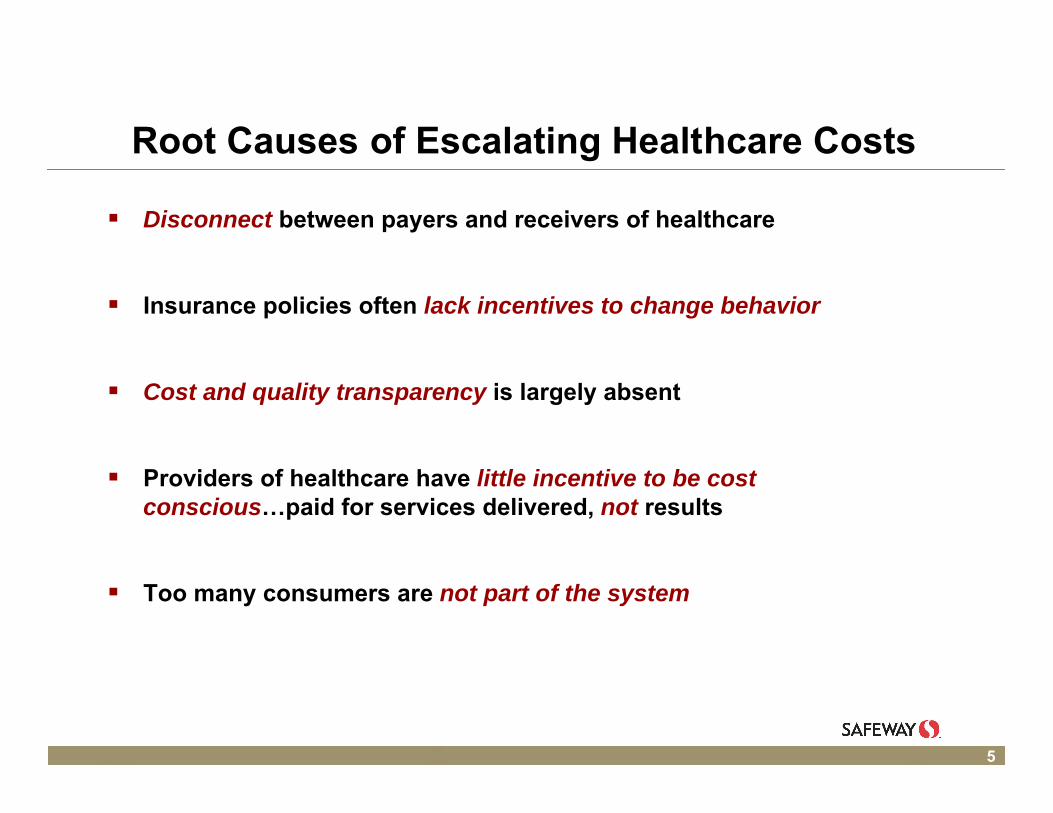
Root Causes of Escalating Healthcare Costs
Disconnect between payers and receivers of healthcare
Insurance policies often lack incentives to change behavior
Cost and quality transparency is largely absent
Providers of healthcare have little incentive to be cost conscious…paid for services delivered, not results
Too many consumers are not part of the system
6
Solving the Problem of Rising Costs
Create more personal responsibility
Encourage prevention and wellness by linking healthy behaviors to financial incentives
Provide cost and quality transparency
Pay more for results and less for services rendered
Insure everyone – no one should be left out
7
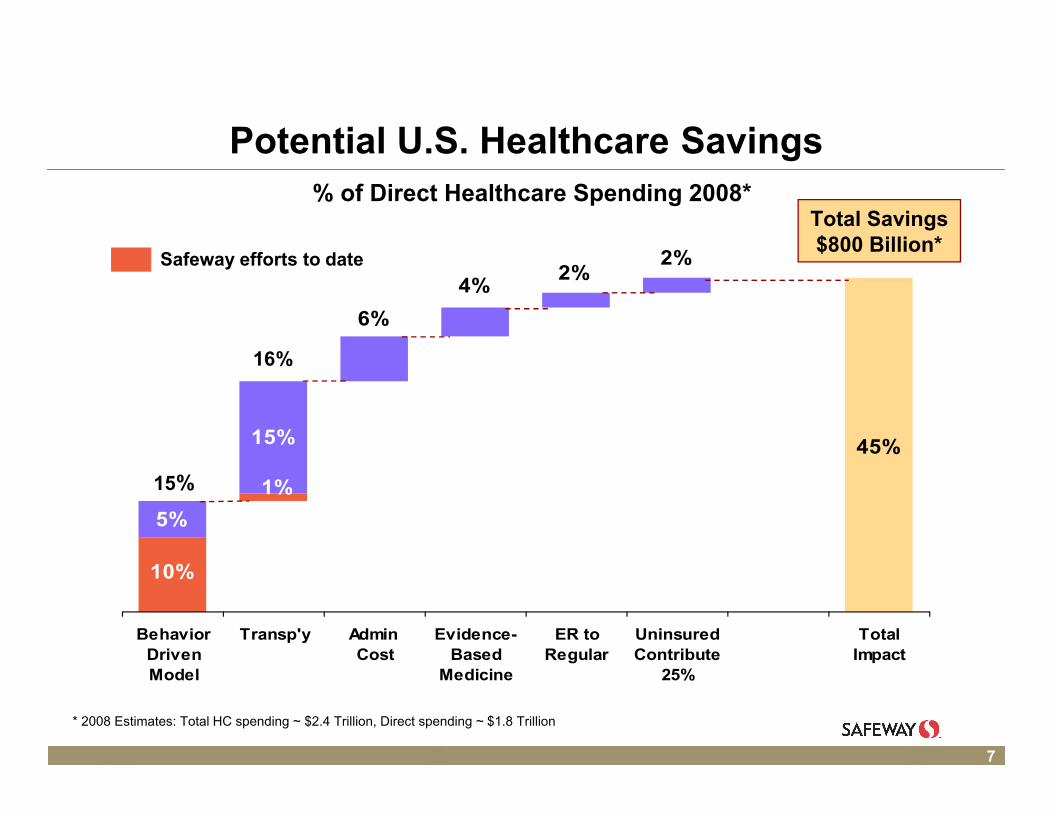
Potential U.S. Healthcare Savings
5%
10%
45%
2%2%
4%
6%
1%
15%
BehaviorDrivenModel
Transp'y Admin Cost
Evidence-Based
Medicine
ER toRegular
UninsuredContribute
25%
TotalImpact
% of Direct Healthcare Spending 2008*
* 2008 Estimates: Total HC spending ~ $2.4 Trillion, Direct spending ~ $1.8 Trillion
Total Savings $800 Billion*
Safeway efforts to date
15%
16%

8
Agenda
U. S. healthcare challenge
Safeway experience
Policy implications
Safeway Health

9
Safeway’s Healthcare Expense Trend*
101102949288
150138
100
128119
110
0
20
40
60
80
100
120
140
160
2005 2006 2007 2008 2009 F 2010 E
Index 2005 = 100
Business as Usual
New Plan
* Per-capita expenses for Safeway non-union EEs moving to new plan from former PPO plan
These per-capita expenses are all-inclusive – Safeway contribution, EE premium and EE out-of-pocket expense
CAGR
8.5%
0.2%

10
Safeway Healthcare SavingsShared by Safeway and Employees
$153
$78
$47
$53
$231
$34
$19
2006 2007 2008 2009F 2005 -2009F
2010E 2005 -2010E
Savings vs. BAU in $ Millions
LivesCovered
10,100 18,000 27,900 28,000 31,000E
11
Safeway Results Based on Major Discoveries
70% of healthcare costs are driven by behavior
Four chronic conditions comprise 74% of healthcare costs
Obesity is a driving factor in all four chronic conditions
Transparency is critical to controlling costs
12
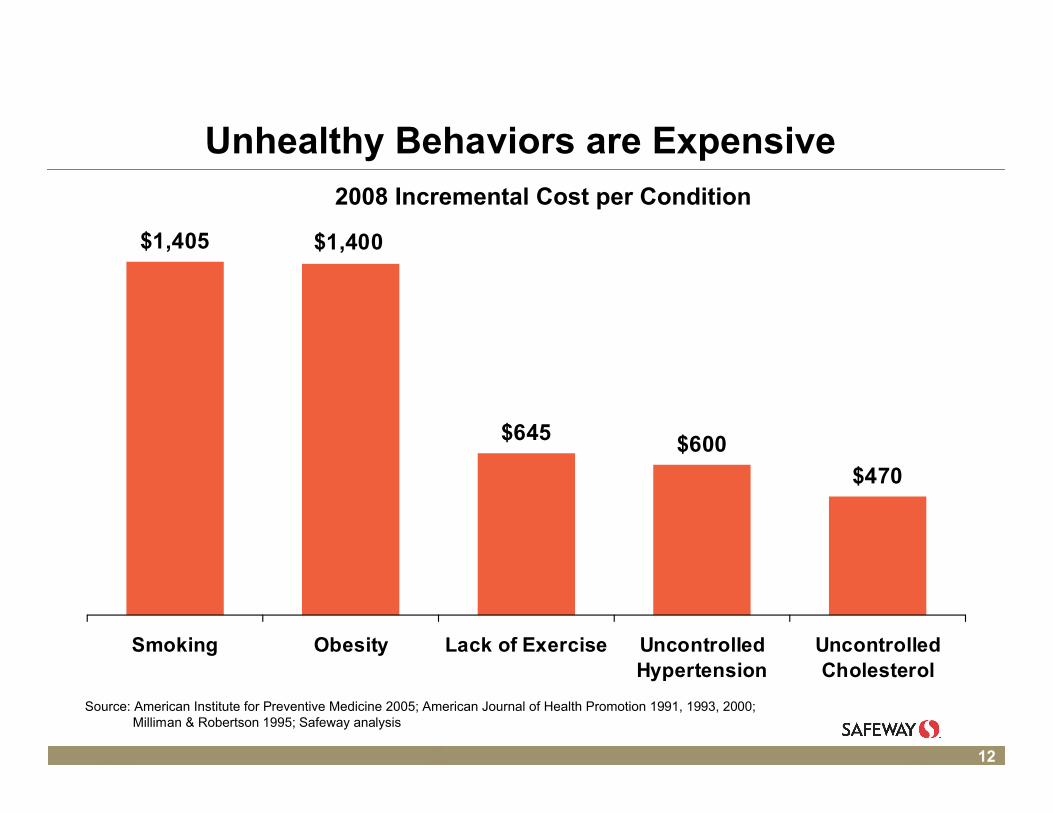
Unhealthy Behaviors are Expensive
$1,405
$645 $600
$470
$1,400
Smoking Obesity Lack of Exercise UncontrolledHypertension
UncontrolledCholesterol
2008 Incremental Cost per Condition
Source: American Institute for Preventive Medicine 2005; American Journal of Health Promotion 1991, 1993, 2000; Milliman & Robertson 1995; Safeway analysis
13
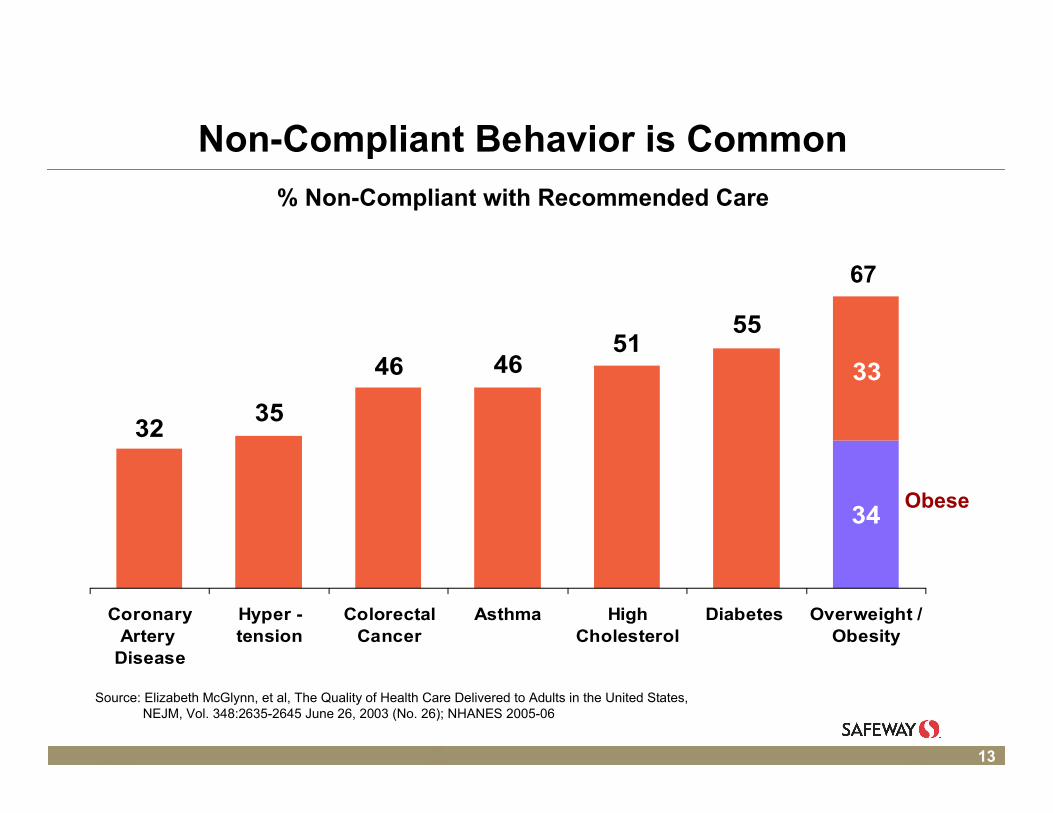
34
5551
4646
3532
33
CoronaryArtery
Disease
Hyper -tension
ColorectalCancer
Asthma HighCholesterol
Diabetes Overweight /Obesity
Non-Compliant Behavior is Common
% Non-Compliant with Recommended Care
Source: Elizabeth McGlynn, et al, The Quality of Health Care Delivered to Adults in the United States,NEJM, Vol. 348:2635-2645 June 26, 2003 (No. 26); NHANES 2005-06
Obese
67
14
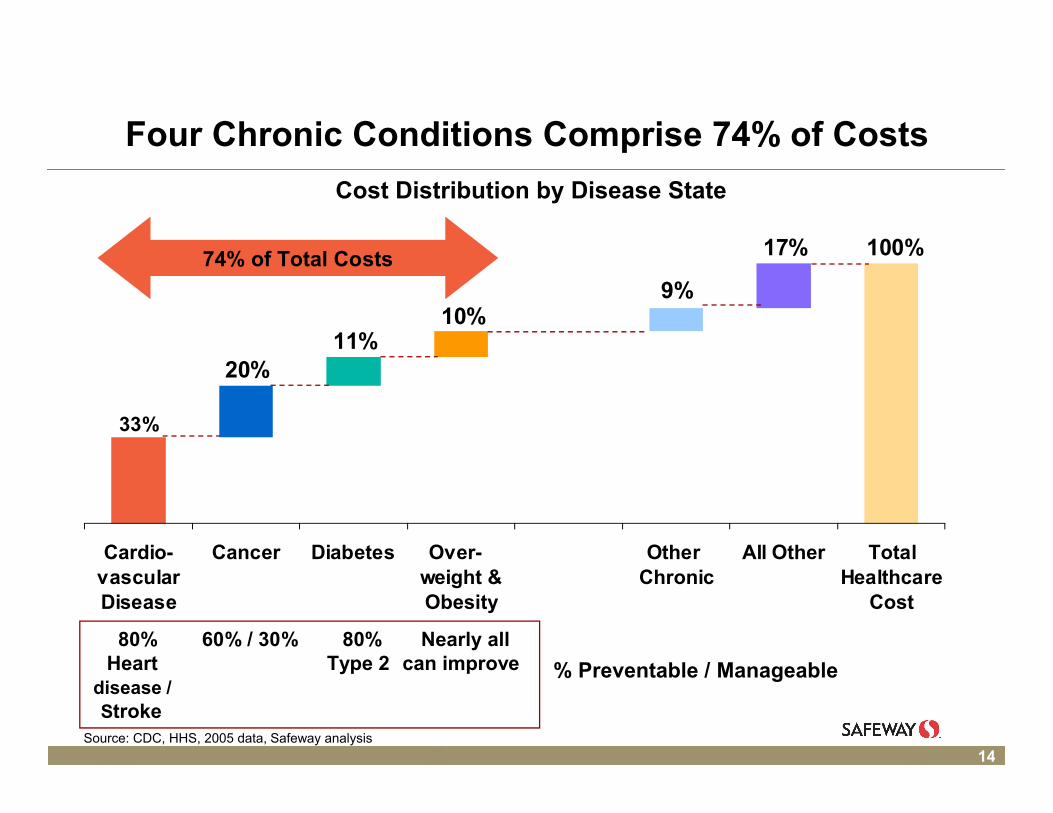
% Preventable / Manageable
Four Chronic Conditions Comprise 74% of Costs
33%
20%11%
10%9%
17% 100%
Cardio-vascularDisease
Cancer Diabetes Over- weight &Obesity
Other Chronic
All Other TotalHealthcare
Cost
Cost Distribution by Disease State
74% of Total Costs
80% 60% / 30% 80% Nearly allHeart Type 2 can improve
disease /Stroke
Source: CDC, HHS, 2005 data, Safeway analysis

15
Obesity is a Major Cost Driver – Top 4
26%
19%
27%
10%
7%
1%
9%
2%
47%
CardiovascularDisease
Cancer Diabetes Overweight &Obesity
Big 4 Total
Top 4 chronic diseases - % of total healthcare spending
Obesity
All other
*2008 Estimates: Total HC spending ~ $2.4 Trillion, Direct spending ~ $1.8 Trillion
33%
20%
11%
74%
16
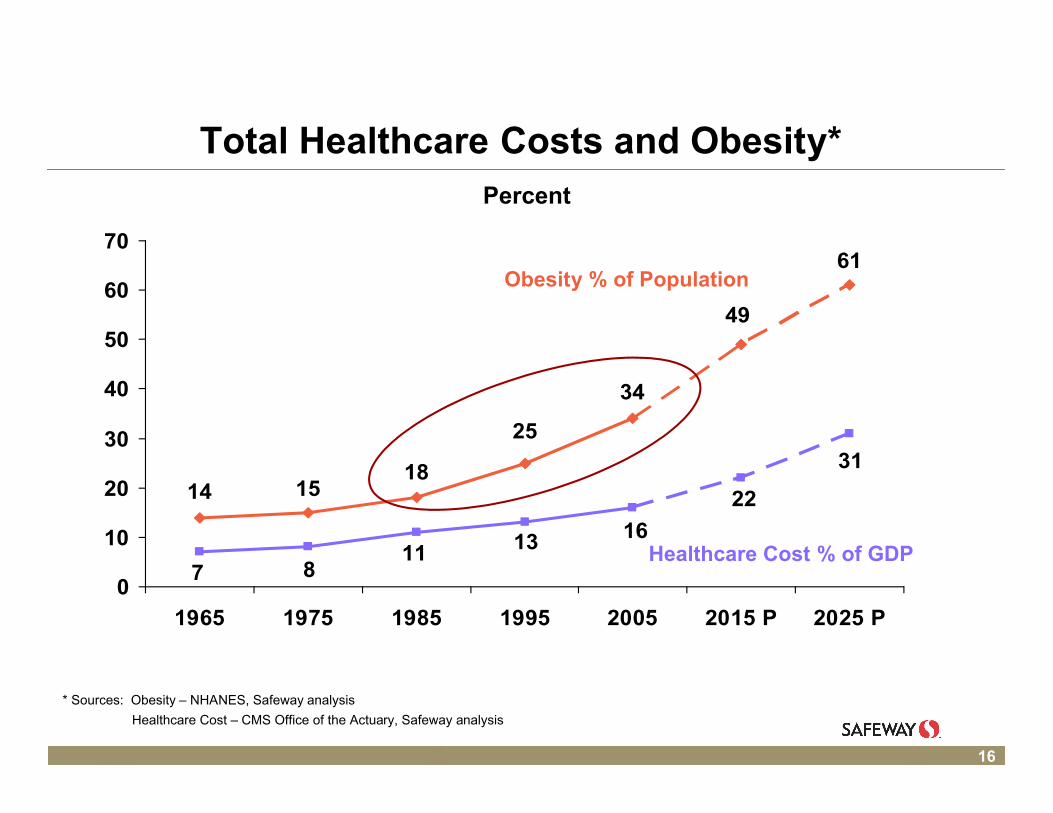
Total Healthcare Costs and Obesity*
31
22
16
7
13118
61
49
34
14
25
1815
0
10
20
30
40
50
60
70
1965 1975 1985 1995 2005 2015 P 2025 P
Percent
Obesity % of Population
Healthcare Cost % of GDP
* Sources: Obesity – NHANES, Safeway analysis
Healthcare Cost – CMS Office of the Actuary, Safeway analysis

17
Obesity Prevalence by Country
3 4
8 9 10 10 11 11 11 12 12 13 13 14 15 15 15 15 15 16 17 1719 20 20
2224
2730
34
Ja
pa
n
Ko
rea
Sw
itze
rla
nd
No
rwa
y
Ita
lyS
we
de
n
Fra
nc
eN
eth
erl
an
dD
en
ma
rk
Tu
rke
yA
us
tria
Po
lan
dB
elg
ium
Ge
rma
ny
Fin
lan
dS
pa
in
Ire
lan
dC
an
ad
aP
ort
ug
al
Gre
ec
eS
lov
ak
Cze
ch
Hu
ng
ary
Lu
xe
mb
ou
r
Ice
lan
dA
us
tra
lia UK
N Z
ea
lan
dM
ex
ico
US
A
Obesity Prevalence for Adult Population (Aged 15+) by Country1
Notes: (1) Estimates relate to the adult population (aged 15+), based on national health interview surveys for most countries. Rates are based on most recent data available, with years ranging between 2003-2007.
Source: OECD Health Data, http://www.oecd.org/document/16/0,3343,en_2649_34631_2085200_1_1_1_1,00.html
Percent of Population

18
Philosophy for Behavior Incentives
Individuals are responsible for their own behavior*
Health plans should be free to charge individuals the full cost of their behaviors
When consumers bear the true cost, they are motivated to change
The result will be improved health, higher productivity, and lower healthcare costs
*But not their genetics
19
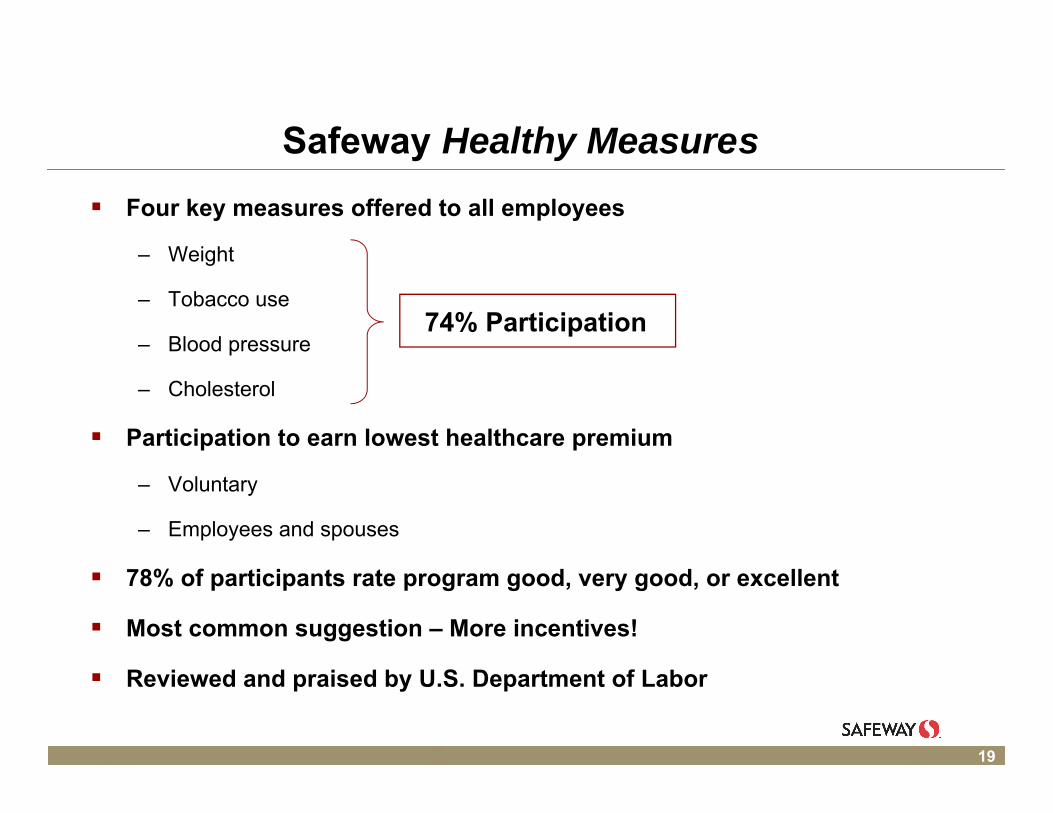
Safeway Healthy Measures
Four key measures offered to all employees
– Weight
– Tobacco use
– Blood pressure
– Cholesterol
Participation to earn lowest healthcare premium
– Voluntary
– Employees and spouses
78% of participants rate program good, very good, or excellent
Most common suggestion – More incentives!
Reviewed and praised by U.S. Department of Labor
74% Participation
20
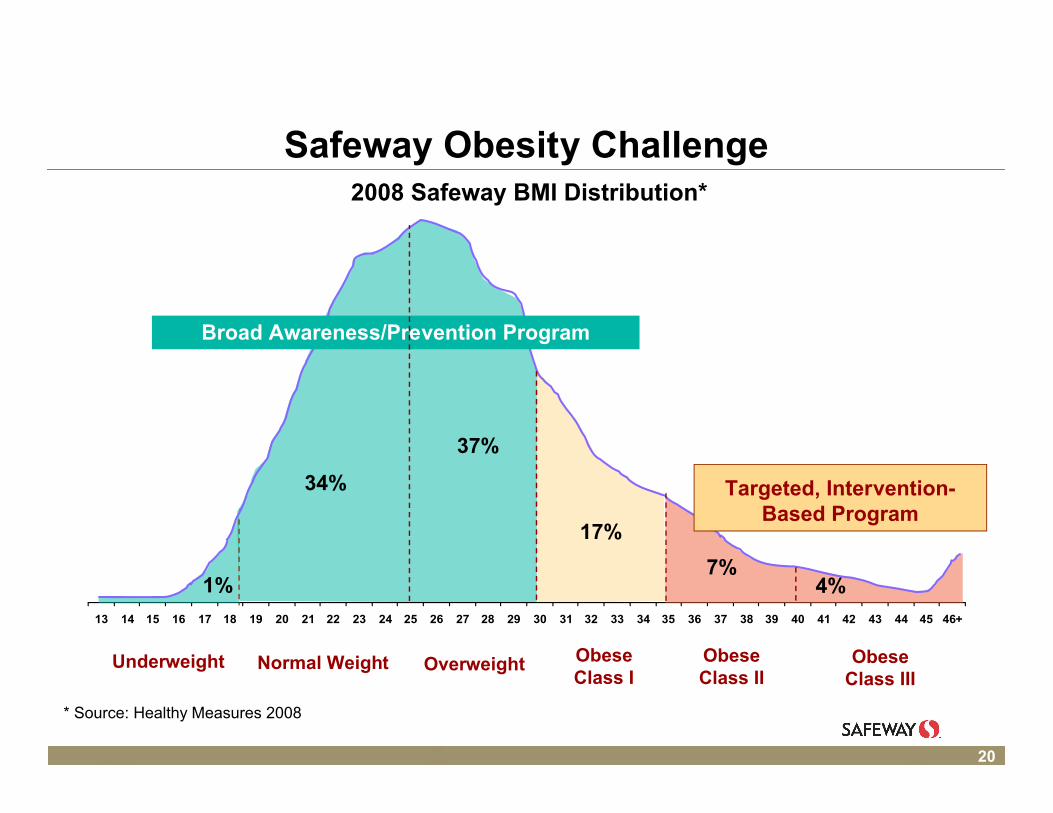
Safeway Obesity Challenge2008 Safeway BMI Distribution*
* Source: Healthy Measures 2008
13 14 15 16 17 18 19 20 21 22 23 24 25 26 27 28 29 30 31 32 33 34 35 36 37 38 39 40 41 42 43 44 45 46+
4%7%
37%
17%
34%
1%
Obese Class I
OverweightNormal WeightUnderweight Obese Class II
Obese Class III
Broad Awareness/Prevention Program
Targeted, Intervention-Based Program
21
0
50
100
150
200
250
18 19 20 21 22 23 24 25 26 27 28 29 30 31 32 33 34 35 36 37 38 39 40 41 42 43 44 45 46+
0
50
100
150
200
250
18 19 20 21 22 23 24 25 26 27 28 29 30 31 32 33 34 35 36 37 38 39 40 41 42 43 44 45 46+
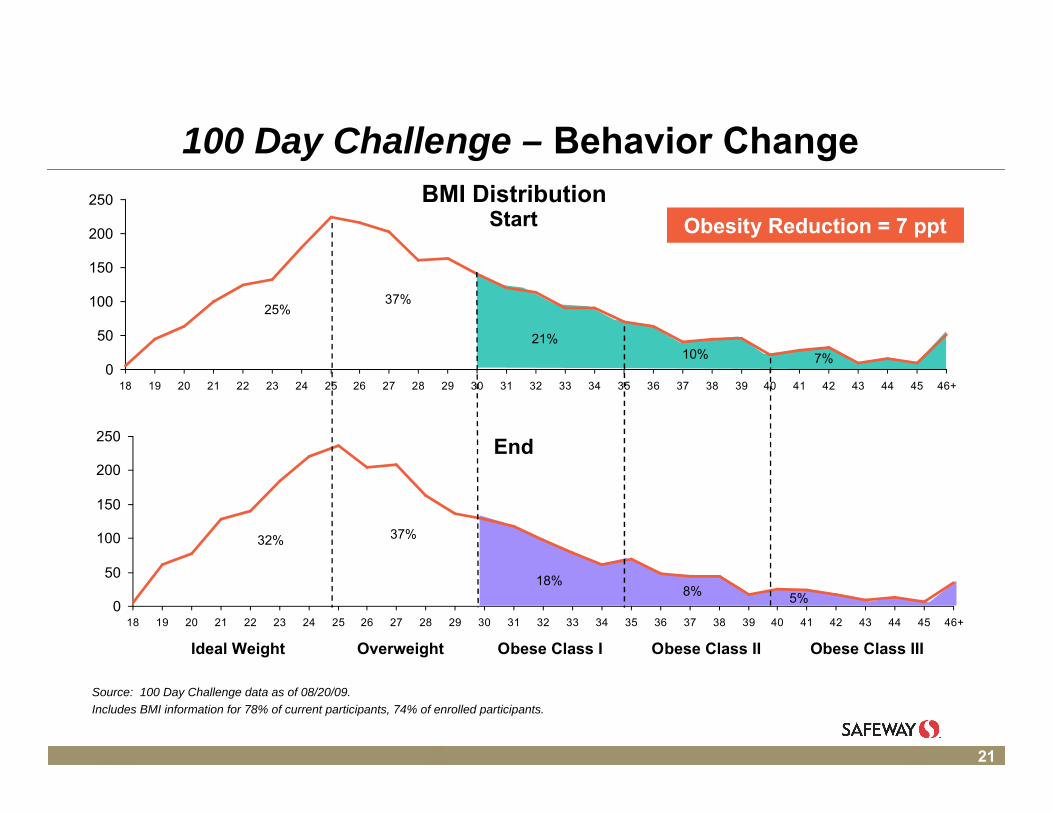
100 Day Challenge – Behavior Change
Source: 100 Day Challenge data as of 08/20/09.
Includes BMI information for 78% of current participants, 74% of enrolled participants.
Start
32% 37%
18%8% 5%
25%37%
21%10% 7%
End
Ideal Weight Overweight Obese Class I Obese Class II Obese Class III
Obesity Reduction = 7 ppt
BMI Distribution

22
Healthy Weight Commitment Foundation*Tackling Obesity Nationwide
Over 40 food manufacturers and retailers working together
Comprehensive approach to battling obesity
Focused on individual consumers, in schools, and in the workplace
Launched at National Press Club – October 5, 2009
* Food industry initiative; Safeway is Co-Founder

23
1,750 Less Calories In per WeekMany ways to achieve the goal – 250 / day
Keep the volume and taste, not the calories
Handful of raisins instead
of candy
Replace 1-traditional
dressing withvery low cal
dressing
One lesschocolate chip
cookie
Substitute 2 diet soda
for 2 reg soda
1 less Café Latte
Cutting1,750 cals/wk

24
1,750 More Calories Out per WeekMany ways to achieve the goal – 250 / day
Add activities incremental to normal movement
65 minutes shopping at
Safeway 7 days / week
45 minuteswalking at 4 mph
6 days / week
40 minutescircuit weight
training4 days / week
4.5 hoursplaying golf
walking (w/o cart)per week
1 hour of pacingwhile on the phone
6 days / week
Burning1,750 cals/wk
25
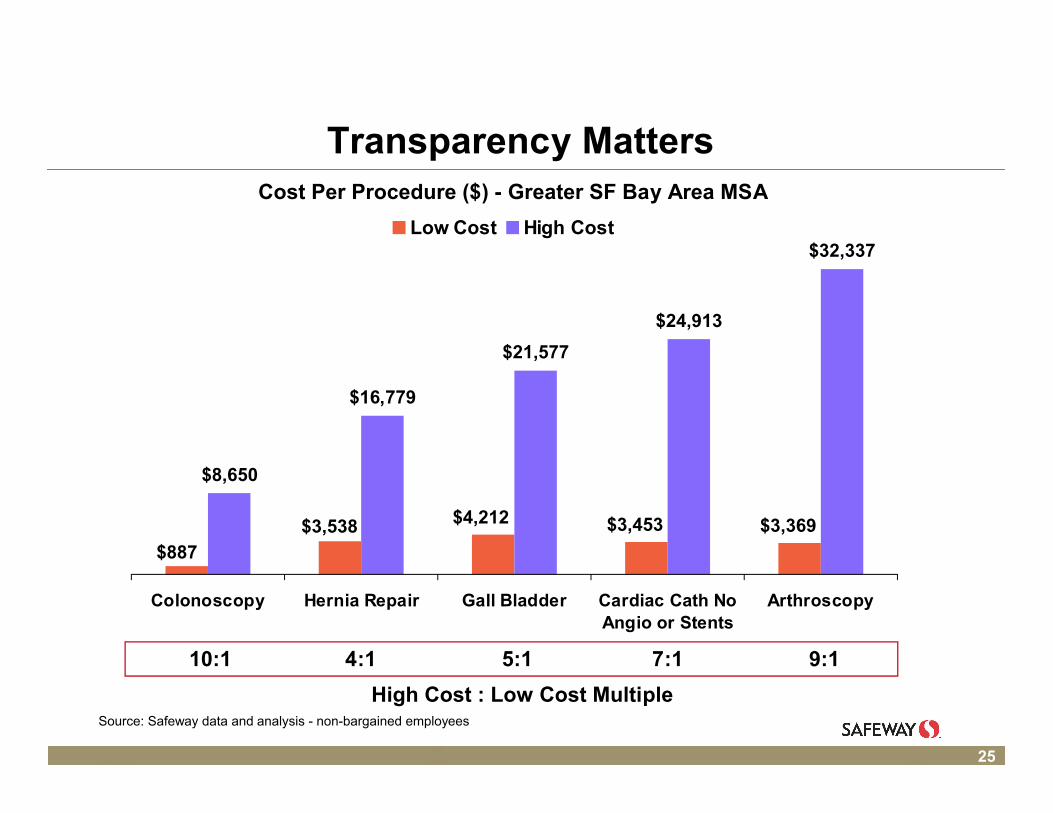
Transparency Matters
$8,650
$16,779
$21,577
$24,913
$32,337
$3,369
$887
$3,538 $4,212 $3,453
Colonoscopy Hernia Repair Gall Bladder Cardiac Cath NoAngio or Stents
Arthroscopy
Low Cost High Cost
10:1 4:1 5:1 7:1 9:1
High Cost : Low Cost MultipleSource: Safeway data and analysis - non-bargained employees
Cost Per Procedure ($) - Greater SF Bay Area MSA

26
Colonoscopy
$887
$932
$991
$999
$1,1
57$1
,169
$1,1
78$1
,245
$1,2
49$1
,306
$1,3
58$1
,377
$1,5
30$1
,535
$1,6
32$1
,642
$1,6
43$1
,728
$1,7
60$1
,860
$1,9
36$2
,015
$2,0
78$2
,090
$2,0
99$2
,309
$2,3
16$2
,409
$2,4
43$2
,603
$2,6
86$2
,751
$2,7
71$2
,816
$2,8
45$2
,848
$2,8
69$2
,987
$3,0
00$3
,013
$3,0
47$3
,144
$3,1
88$3
,245
$3,2
71$3
,314
$3,3
18$3
,367
$3,6
55$3
,676
$3,7
69$3
,793
$3,8
30$4
,032
$4,1
72$4
,388
$4,4
73$4
,518
$4,7
23$5
,596
$5,6
82$5
,734 $7
,347 $8
,650
Gol
den
Gat
e E
ndos
copy
Ctr
The
Red
woo
d S
urg
Ctr
Eas
t B
ay E
ndos
copy
Ctr
Pre
mie
r S
urge
ry C
trS
tock
ton
End
osco
py C
trE
ndos
copy
Ctr
of
Mar
inE
ast
Bay
End
osur
gery
Inc
San
Ram
on E
ndos
copy
Ctr
Mid
Pen
insu
la E
ndos
copy
Ctr
Mer
ced
Am
b E
ndos
copy
Ctr
St
Mar
ys M
ed C
tr-S
anLa
ser
Sur
gery
Ctr
Was
hing
ton
Out
patie
nt S
urg
For
t S
utte
r S
urg
Ctr
Tur
ney
Nov
ato
End
osco
py C
trS
utte
r R
osev
ille
End
osco
pyA
spen
Sur
g C
trA
dvan
ced
End
osco
py C
trS
onom
a V
alle
y H
osp
Tow
er H
ealth
& W
elln
ess
Val
leyC
are
Med
Ctr
End
osco
py C
tr o
f S
anta
Ros
aS
an R
amon
Reg
Med
Ctr
Sam
arita
n E
ndos
copy
Ede
n M
ed C
trT
resa
nti M
edic
al C
orp
Set
on M
ed C
tr-D
aly
City
UC
Dav
is M
ed C
trS
an F
ranc
isco
End
osco
pyV
alle
ycar
e M
emor
ial H
osp
Sut
ter
Tra
cy C
omm
Hos
pS
utte
r F
airf
ield
Sur
g C
trG
reat
er B
ay A
rea
End
osco
pyT
ing
UC
SF
Med
Ctr
Met
hodi
st H
osp
ofD
amer
on H
osp
Pro
cedu
re S
uite
Fre
mon
tA
ther
ton
End
osco
py C
trA
lam
eda
Hos
pF
olso
m S
ierr
a E
ndos
copy
Ctr
Fre
mon
t A
mbu
lato
ry S
urg
Ctr
Sut
ter
Med
Ctr
Sac
ram
ento
Que
en o
f th
e V
alle
y H
osp
John
Mui
r-M
t D
iabl
o H
lth S
ysLo
di M
emor
ial H
osp
Cal
iforn
ia P
acifi
c M
ed C
trS
utte
r D
elta
Med
Ctr
Gre
ater
Bay
End
osco
py C
trS
anta
Ros
a M
emor
ial H
osp
End
osur
gery
Ctr
Doc
tors
Hos
pita
l of
Man
teca
Adv
ance
d S
urg
Ctr
Mem
oria
l Hos
ps A
ssoc
iatio
nJo
hn M
uir
Beh
av H
ealth
Tra
cy S
urg
Ctr
Pet
alum
a V
alle
y H
osp
Los
Gat
os S
urg
Ctr
Sou
th B
ay S
urg
Ctr
Bay
Are
a S
urg
Grp
Hac
iend
a S
urg
Ctr
St
Hel
ena
Hos
pP
leas
anto
n S
urg
Ctr
Room & Supplies Professional GI Services All Other
Cost Per Procedure ($) – Greater SF Bay Area MSA
Colonoscopy Providers
27
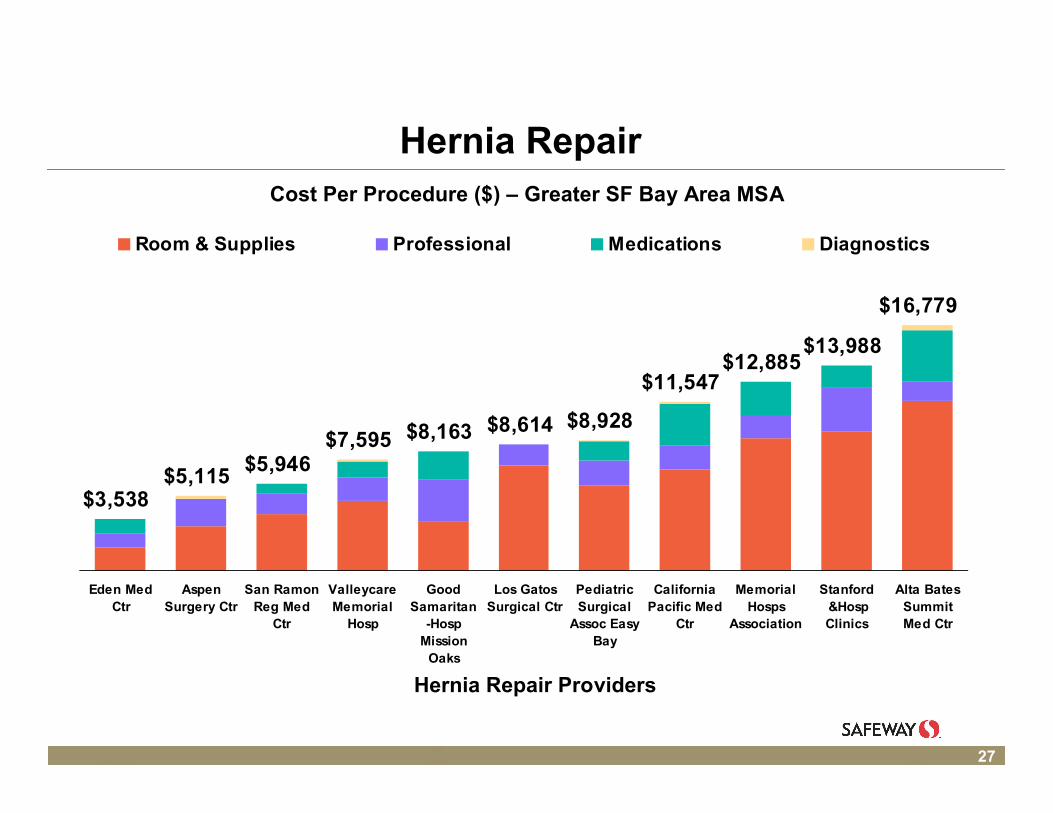
Hernia Repair
$3,538$5,115
$5,946$7,595 $8,163 $8,614 $8,928
$11,547$12,885
$13,988
$16,779
Eden MedCtr
AspenSurgery Ctr
San RamonReg Med
Ctr
ValleycareMemorial
Hosp
GoodSamaritan
-HospMission
Oaks
Los GatosSurgical Ctr
PediatricSurgical
Assoc EasyBay
CaliforniaPacific Med
Ctr
MemorialHosps
Association
Stanford &HospClinics
Alta BatesSummitMed Ctr
Room & Supplies Professional Medications Diagnostics
Cost Per Procedure ($) – Greater SF Bay Area MSA
Hernia Repair Providers
28
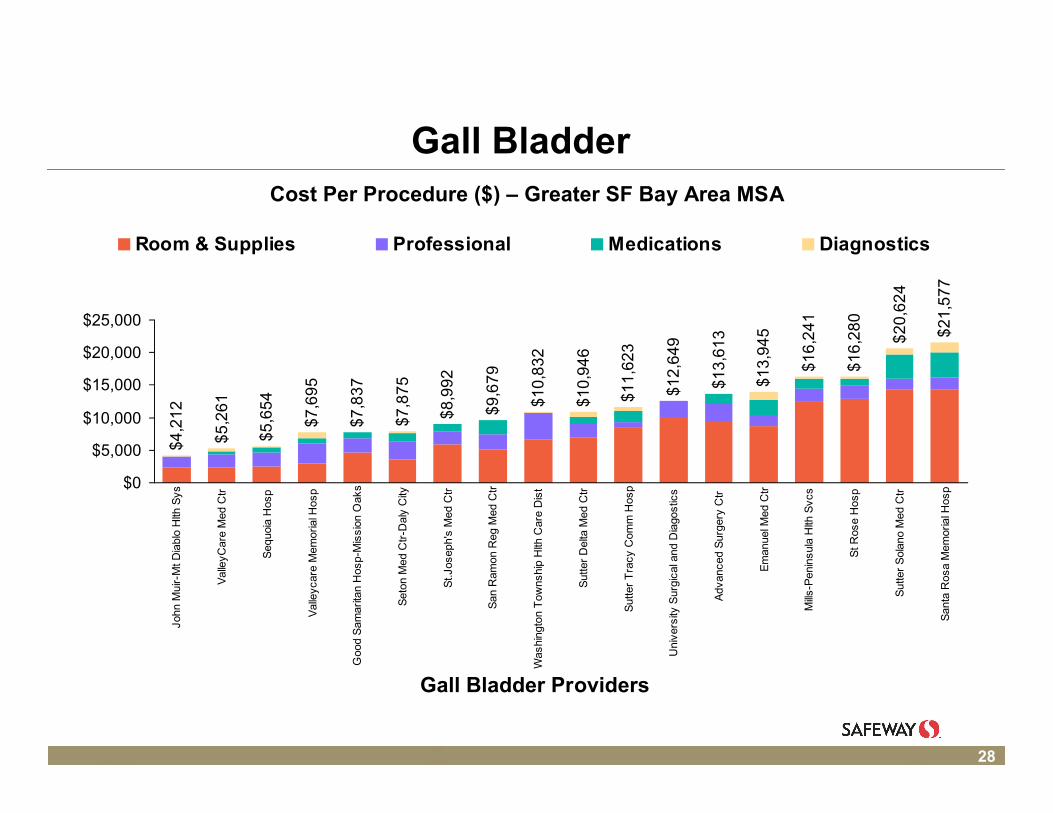
Gall Bladder$4
,21
2
$5
,26
1
$5,6
54
$7
,69
5
$7
,83
7
$7
,87
5
$8
,99
2
$9
,67
9
$1
0,8
32
$1
0,9
46
$1
1,6
23
$1
2,6
49
$1
3,6
13
$1
3,9
45
$1
6,2
41
$1
6,2
80
$2
0,6
24
$2
1,5
77
$0
$5,000
$10,000
$15,000
$20,000
$25,000
John
Mui
r-M
t Dia
blo
Hlth
Sys
Val
leyC
are
Med
Ctr
Seq
uoia
Hos
p
Val
leyc
are
Mem
oria
l Hos
p
Goo
d S
amar
itan
Hos
p-M
issi
on O
aks
Set
on M
ed C
tr-D
aly
City
St.J
osep
h's
Med
Ctr
San
Ram
on R
eg M
ed C
tr
Was
hing
ton
Tow
nshi
p H
lth C
are
Dis
t
Sut
ter
Del
ta M
ed C
tr
Sut
ter
Tra
cy C
omm
Hos
p
Uni
vers
ity S
urgi
cal a
nd D
iago
stic
s
Adv
ance
d S
urge
ry C
tr
Em
anue
l Med
Ctr
Mills
-Pen
insu
la H
lth S
vcs
St R
ose
Hos
p
Sut
ter
Sol
ano
Med
Ctr
San
ta R
osa
Mem
oria
l Hos
p
Room & Supplies Professional Medications Diagnostics
Cost Per Procedure ($) – Greater SF Bay Area MSA
Gall Bladder Providers
29
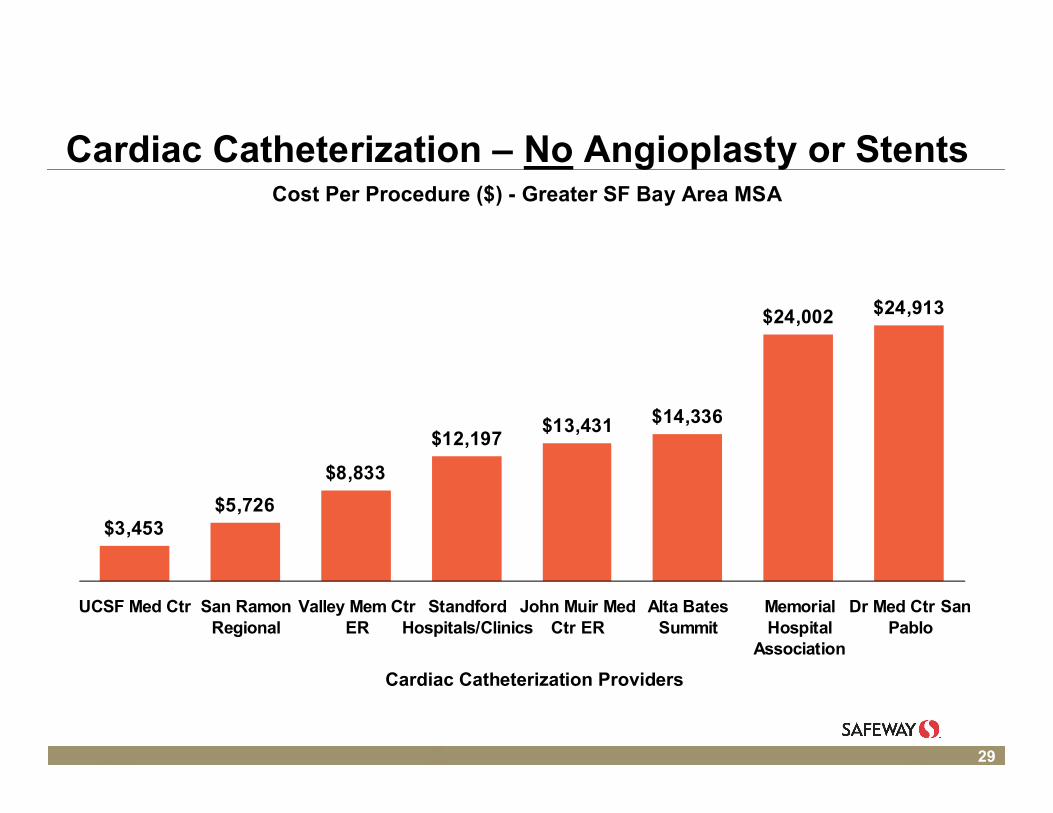
Cardiac Catheterization – No Angioplasty or Stents
$3,453$5,726
$8,833
$12,197$13,431 $14,336
$24,002 $24,913
UCSF Med Ctr San RamonRegional
Valley Mem CtrER
StandfordHospitals/Clinics
John Muir MedCtr ER
Alta BatesSummit
MemorialHospital
Association
Dr Med Ctr SanPablo
Cost Per Procedure ($) - Greater SF Bay Area MSA
Cardiac Catheterization Providers
30
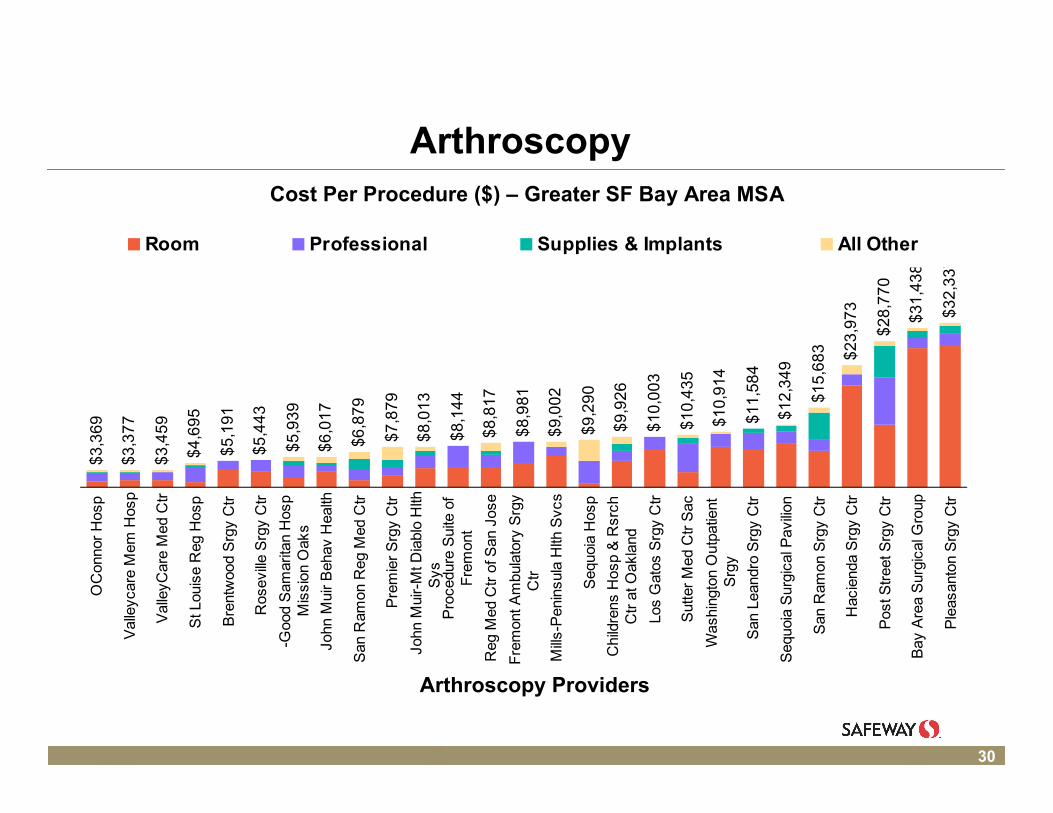
Arthroscopy
$3
,36
9
$3
,37
7
$3
,45
9
$4
,69
5
$5,
191
$5
,44
3
$5
,93
9
$6
,01
7
$6,8
79
$7
,87
9
$8
,01
3
$8
,14
4
$8
,81
7
$8,
981
$9,
002
$9
,29
0
$9
,92
6
$1
0,0
03
$1
0,4
35
$1
0,9
14
$1
1,58
4
$1
2,3
49
$1
5,6
83 $23
,97
3
$2
8,7
70
$3
1,4
38
$3
2,3
37
OC
onno
r H
osp
Val
leyc
are
Mem
Hos
p
Val
leyC
are
Med
Ctr
St L
ouis
e R
eg H
osp
Bre
ntw
ood
Srg
y C
tr
Ros
evill
e S
rgy
Ctr
-Goo
d S
amar
itan
Hos
pM
issi
on O
aks
John
Mui
r B
ehav
Hea
lth
San
Ram
on R
eg M
ed C
tr
Pre
mie
r S
rgy
Ctr
John
Mui
r-M
t Dia
blo
Hlth
Sys
Pro
cedu
re S
uite
of
Fre
mon
t
Reg
Med
Ctr
of S
an J
ose
Fre
mon
t Am
bula
tory
Srg
yC
tr
Mill
s-P
enin
sula
Hlth
Svc
s
Seq
uoia
Hos
p
Chi
ldre
ns H
osp
& R
srch
Ctr
at O
akla
nd
Los
Gat
os S
rgy
Ctr
Sut
ter
Med
Ctr
Sac
Was
hing
ton
Out
patie
ntS
rgy
San
Lea
ndro
Srg
y C
tr
Seq
uoia
Sur
gica
l Pav
ilion
San
Ram
on S
rgy
Ctr
Hac
iend
a S
rgy
Ctr
Pos
t Str
eet S
rgy
Ctr
Bay
Are
a S
urgi
cal G
roup
Ple
asan
ton
Srg
y C
tr
Room Professional Supplies & Implants All Other
Cost Per Procedure ($) – Greater SF Bay Area MSA
Arthroscopy Providers
31
Holistic Approach – Genuine Focus on Employee Health & Wellness
Free fitness center and gym membership discounts
Care management, wellness, 24-hour nurse line
Healthy foods discount in cafeteria
CareConnect program for breast and prostate cancer
Cancer fundraising since 2002 – more than $100 million to date
Engagement in policy discussion
Slide showing major elements of the Safeway health plan is omitted
32
Core Principles for Healthcare Reform
Market-based healthcare system
Universal coverage with individual responsibility
Financial assistance for low income
Healthier behavior and incentives
Equal tax treatment

33
CAHR Membership Playtex
Price Chopper
Procter & Gamble
Publix
Raley’s
RenderX
Rockwell Automation
Rockwell Collins
Roll International
Safeway
Schnuck’s
Smucker
SuperValu
Unified Western
United Healthcare
United Supermarkets
USAA
Wakefern
Wegmans
Winco Foods
Wrigley
Hershey
Humana
Illinois Tool Works
InnerLink
Jax Markets
KKR
Kaiser Permanente
Kimberly Clark
Kohl’s
Kraft Foods
Kroger
Land ‘O Lakes
Lund Food Holdings
Merck
McKesson
Medtronic
Morgan Stanley
Norfolk Southern
PG&E
PepsiCo
Pfizer
Aetna
Alex Lee Inc.
Bashas
Blue Shield of CA
Brookshire
Bumblebee Seafoods
C&S Wholesale
CIGNA
Clorox
Coca Cola
CVS / Caremark
Del Monte Foods
Edison International
Eli Lilly
GAP Stores
General Mills
Giant Eagle
GlaxoSmithKline
HCA
Health Net
Heinz
34
Agenda
U. S. healthcare challenge
Safeway experience
Policy implications
Safeway Health
35
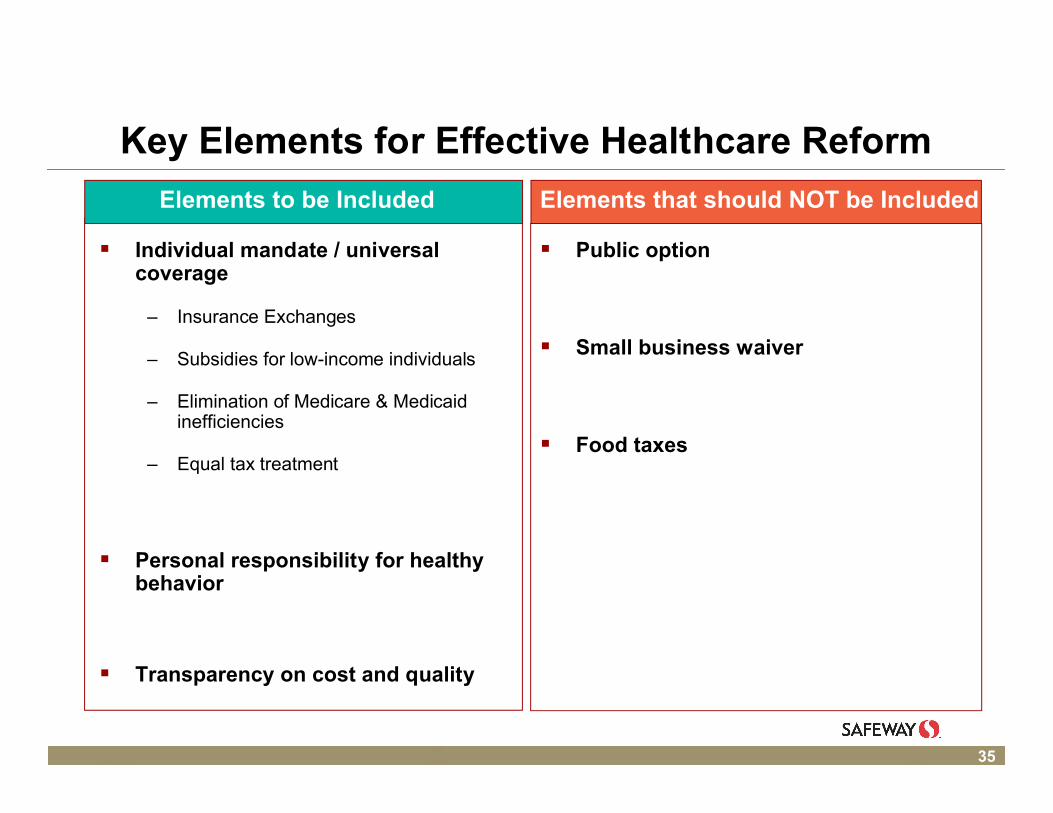
Key Elements for Effective Healthcare Reform
Elements to be Included
Individual mandate / universal coverage
– Insurance Exchanges
– Subsidies for low-income individuals
– Elimination of Medicare & Medicaid inefficiencies
– Equal tax treatment
Personal responsibility for healthy behavior
Transparency on cost and quality
Elements that should NOT be Included
Public option
Small business waiver
Food taxes
36
Financing Healthcare Reform
Cost to cover uninsured lower than commonly thought
Savings more than sufficient to finance healthcare reform
Government must enable the savings
– Individual mandate
– Mandatory transparency
– Increased HIPAA limits for behavior
Phased approach or transitional payroll tax on all employers
– Natural incentives to use transparency and behavior
– Capture savings and offset the tax
37
Individual mandate; no subsidy
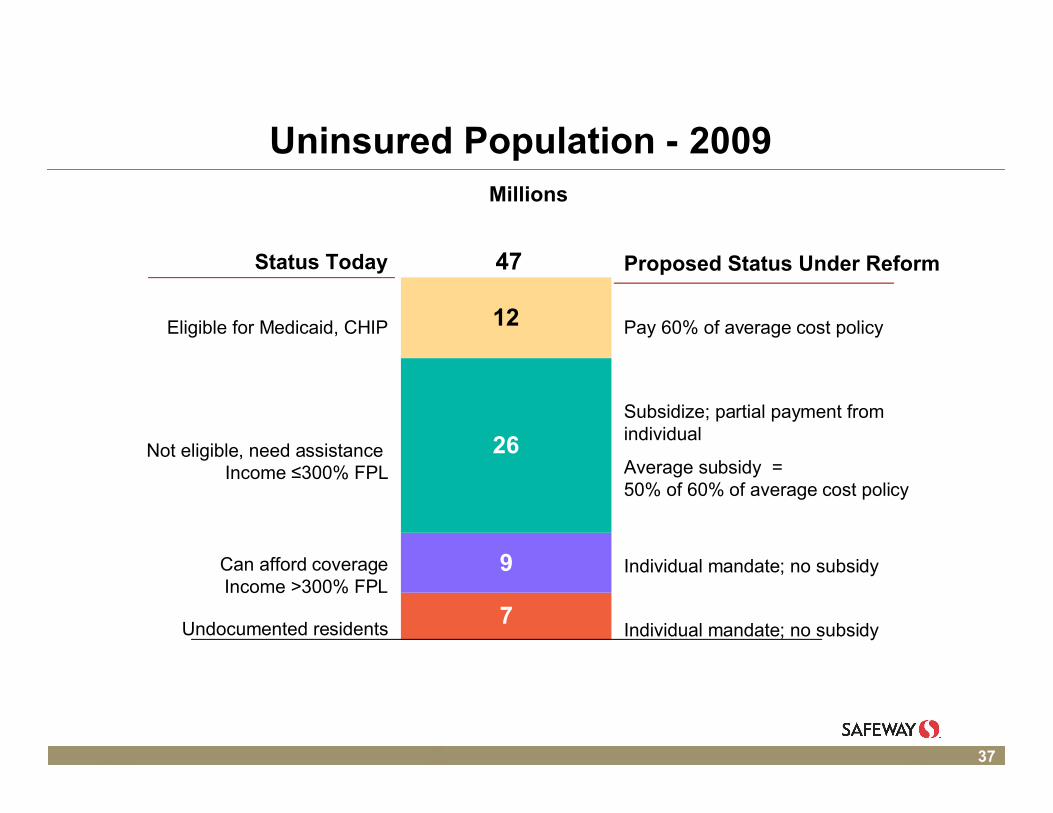
Uninsured Population - 2009
7
9
26
12
Millions
47Status Today
Eligible for Medicaid, CHIP
Not eligible, need assistance Income ≤300% FPL
Can afford coverageIncome >300% FPL
Undocumented residents
Proposed Status Under Reform
Pay 60% of average cost policy
Subsidize; partial payment fromindividual
Average subsidy = 50% of 60% of average cost policy
Individual mandate; no subsidy

38
Cost to Cover Uninsured
$3,694
$4,194
$2,077
$46.5
$41.6
Current Cost ofUninsuredEligible forMedicaid
60% of Avg Plan Not EligibleToday; 300%FPL; Subsidize
@ 50%
≤
$88.1
Total Cost to Cover ($ Billion)Per Person Cost
39
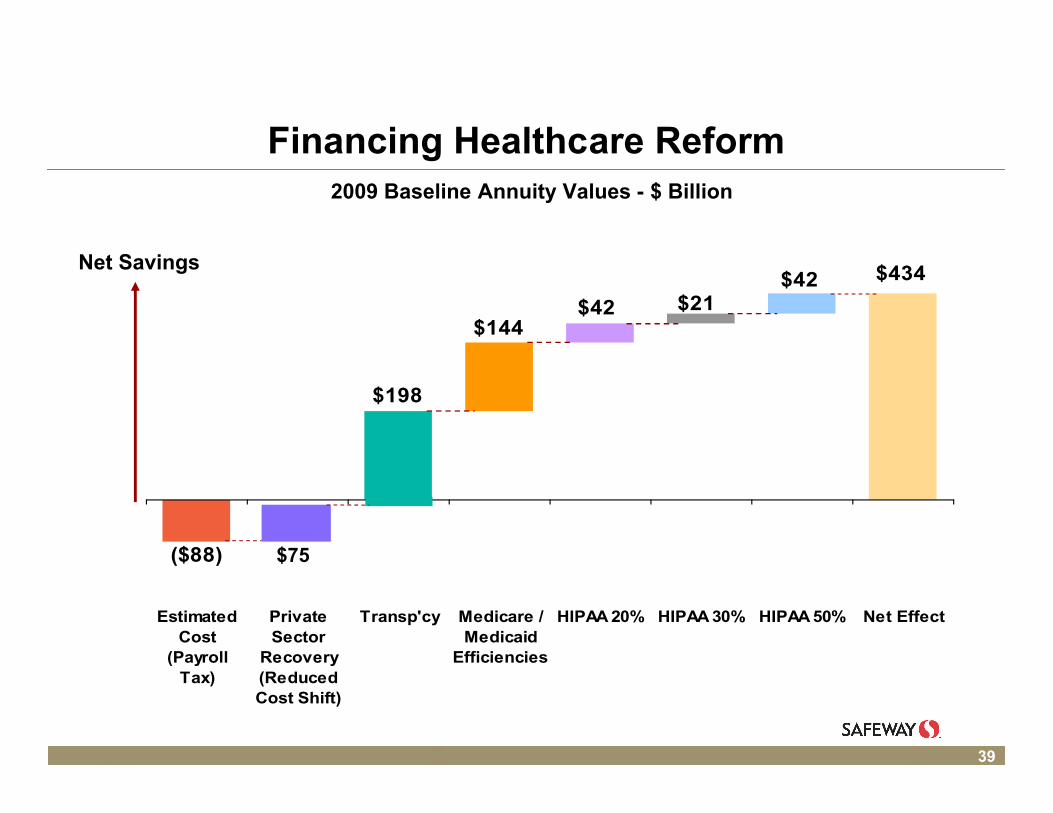
Financing Healthcare Reform2009 Baseline Annuity Values - $ Billion
$198
$144$42 $21
$42 $434
($88)
EstimatedCost
(PayrollTax)
PrivateSector
Recovery(ReducedCost Shift)
Transp'cy Medicare /Medicaid
Efficiencies
HIPAA 20% HIPAA 30% HIPAA 50% Net Effect
Net Savings
$75
40
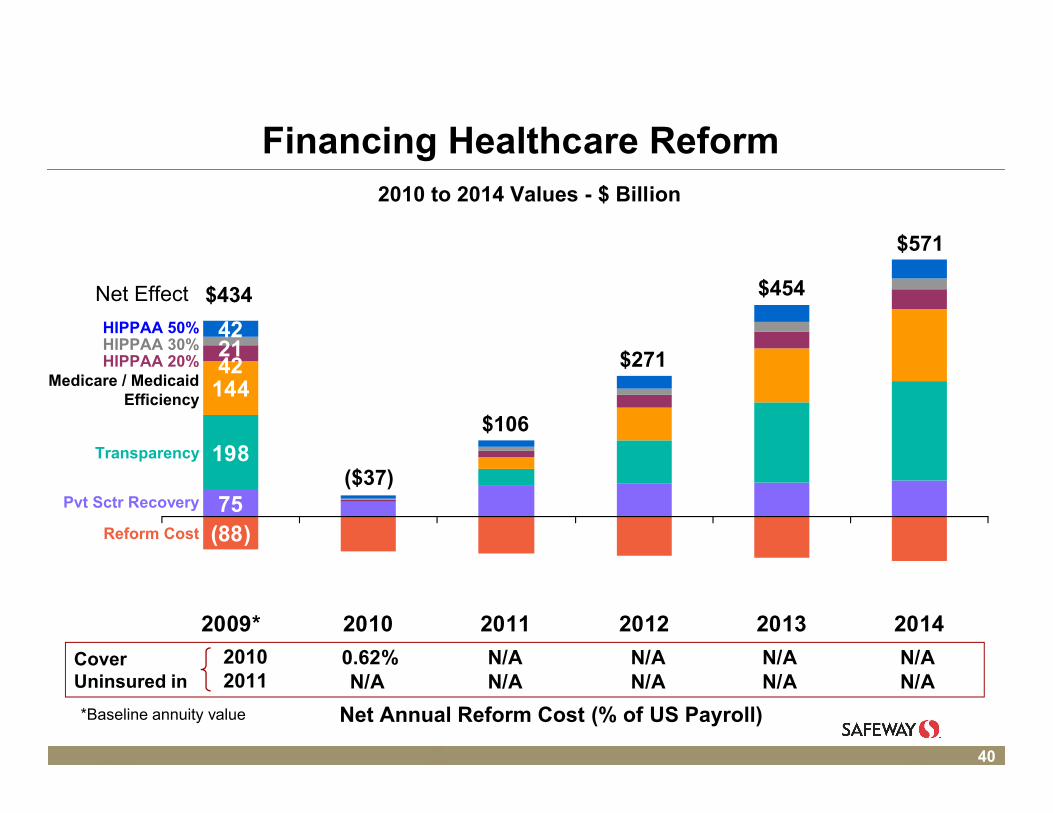
Financing Healthcare Reform
(88)75
198
144422142
2009* 2010 2011 2012 2013 2014
Reform Cost
Pvt Sctr Recovery
Transparency
Medicare / MedicaidEfficiency
HIPPAA 20%HIPPAA 30%HIPPAA 50%
2010 to 2014 Values - $ Billion
Net Annual Reform Cost (% of US Payroll)
$434
($37)
$106
$271
$454
$571
Net Effect
*Baseline annuity value
0.62% N/A N/A N/A N/AN/A N/A N/A N/A N/A
20102011
Cover Uninsured in
41
Why This Approach is Good Policy
Establishes an appropriate benefit for today’s uninsured, and achieves universal coverage
Finances reform completely and generates a surplus
Provides powerful financial incentives to the private sector to implement key reform elements in their own organizations . . .
– Behavior incentives
– Transparency
– Evidence-based medicine
. . . and more than offset the effect of a payroll tax quickly
Normalizes Medicare service levels and adjudication nation-wide

42
Agenda
U. S. healthcare challenge
Safeway experience
Policy implications
Safeway Health
43
Safeway Health Concept
Partner with client organizations
Replicate the Safeway experience
Strengthen the client’s healthcare paradigm
Reduce healthcare costs
– Plan design medical
– Plan design Rx – proprietary tools
– Transparency
Share savings achieved
44
Re-Designed Healthcare What’s it Worth For Individual Companies?
Lower, sustained per capita healthcare costs
Healthier employees
Improved productivity
Safeway Health a vehicle for achieving results
45
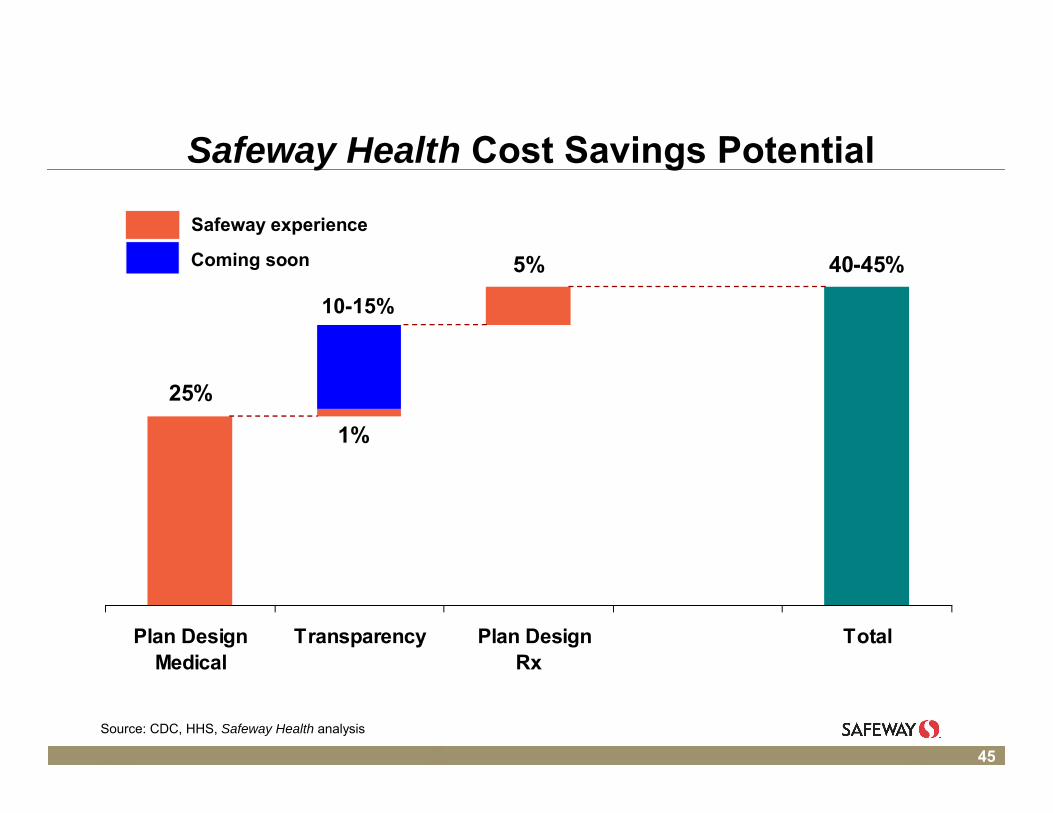
Safeway Health Cost Savings Potential
25%
1%
5% 40-45%
Plan DesignMedical
Transparency Plan Design Rx
Total
Source: CDC, HHS, Safeway Health analysis
Safeway experience
Coming soon
10-15%
46
Re-Designed Healthcare What’s it Worth For the Nation ?
Savings more than sufficient to fund today’s uninsured
Healthier citizens
Market forces in healthcare; lower costs and trends
Improved U.S. competitiveness in global markets
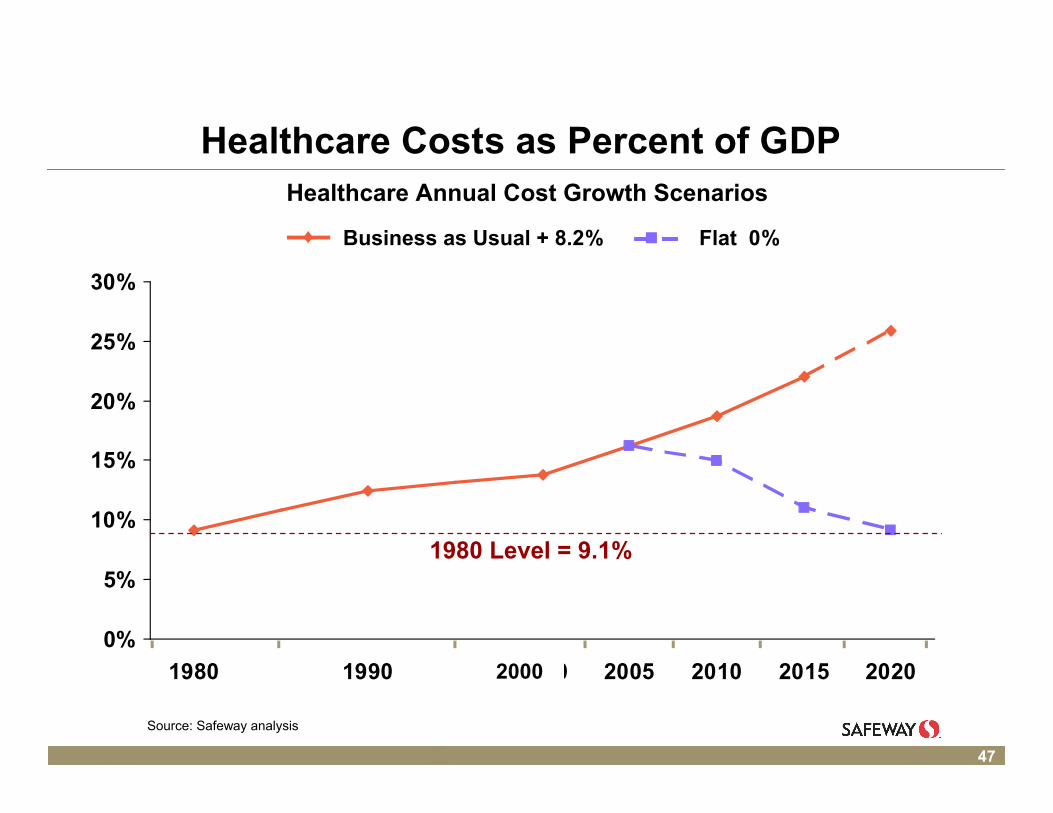
47
Healthcare Costs as Percent of GDP
0%
5%
10%
15%
20%
25%
30%
1980 1990 2000 2005 2010 2015 2020
Source: Safeway analysis
1980 Level = 9.1%
Business as Usual + 8.2% Flat 0%
Healthcare Annual Cost Growth Scenarios
2000

48
Safeway Health Contact Information
Ken Shachmut – Executive Vice President
Office (925) 467-3426
Brad Wolfsen – Vice President
Office (925)-467-2164
Dave Vielehr – Business Development Manager
Office (925) 778-1211
Safeway Health LLC
5918 Stoneridge Mall Road
Pleasanton, CA 94588-3229
Fax (925) 467-3632