Embed Size (px)
Citation preview

HEALTH TECHNOLOGY ASSESSMENT
OF NEW MODELS IN HEALTHCARE
RITIKA KAPOOR (B.Tech, M.Tech)
A THESIS SUBMITTED
FOR THE DEGREE OF DOCTOR OF PHILOSOPHY
NUS GRADUATE SCHOOL OF INTEGRATIVE
SCIENCE & ENGINEERING
NATIONAL UNIVERSITY OF SINGAPORE
2018
Supervisor:
Professor Teo Yik Ying
Examiners:
Associate Professor Mikael Hartman Associate Professor Lee Guat Lay Caroline Professor Shuhua Xu, CAS-MPG Partner, Institute of Computational Biology (PICB)

1
Declaration
I hereby declare that this thesis is my original work and it has been
written by me in its entirety. I have duly acknowledged all the sources
of information that have been used in this thesis.
This thesis has also not been submitted for any degree in any
university previously.
Ritika Kapoor
8th August 2017

2
Acknowledgements
This Ph.D. has been a wonderful journey of learnings and experiences
for me and today I would like to express my sincere and heartfelt thanks
to the many people who made it more knowledgeable, joyful and
enriching.
First and foremost, I would like to thank NGS, The Graduate School of
Integrative Science and Engineering, NUS, for considering me worthy
for such a wonderful opportunity to embark on this learning adventure.
Thank you for being so considerate, flexible and supporting us to attain
an excellent training and an unmatched international exposure.
I have been very fortunate to find my supervisor in Prof. Teo Yik Ying,
who has always been a strong pillar of supervision, support and
encouragement. His encouragement to contribute as an independent
thinker, advice to skill development, freedom to pursue whatever I am
interested in, trust he had on me and his efforts to foresee and resolve
any problems that might arise for me have been substantial to be able
to achieve this. Thank you YY for always being there irrespective of your
busy schedule, your never ending encouragement and trust which
helped me bring the very best of me in work and in life.
I am eternally thankful to my TAC members – Assoc. Prof. Joanne
Yoong, Assoc. Prof. Cynthia Sung and Prof. Christopher Chen Li Hsian
for their excellent supervision and suggestions throughout these years.

3
Special thanks to Assoc. Prof. Joanne Yoong, A/P Wee Hwee Lin for
working with me and guiding me on projects, career and life.
It was wonderful to work with Prof. Yeoh Khay Guan, Prof. Jimmy So
Bok Yan, Dr. Zhu Feng, Dr. Lihan Zhou, Dr. Calvin J. Koh, Dr Chester
Drum and Dr. Tai E Shyong and I want to express my sincere gratitude
for their suggestions and helping me develop clinical perspectives to
bring more meaning to my work. Also, I want to thank my lab mates and
friends – Xuanyao, Woei-Yuh, Dineli, Tra My, Wang Xu, Anthony, Eryu,
Rick, Wesley, Shiv, Jayantika, Dinesh, Aditi, Mahalakshmi for being
helpful, loving and caring and adding so many colours to these years.
Finally, I want to extend a special thanks to my family – my husband, Mr.
Abhishek Modi, my parents - Mr. R.S Kapoor, Mrs. Asha Kapoor and my
sisters Neha and Nidhi Kapoor for encouraging me to follow my dreams
and for the unconditional love, care and support. A special thanks to my
husband for being the one to encourage me to take this course, for his
unshakable faith in me and for celebrating with me all along.
You all have contributed to make it a joyful journey which I will cherish
for a lifetime. Thank you so much.
4
Table of Contents
Summary .............................................................................................. 8
Publications ........................................................................................ 11
List of Tables ...................................................................................... 12
List of Figures ..................................................................................... 14
List of Abbreviations ........................................................................... 16
Chapter 1 Role of Pharmacogenomics in public health and clinical healthcare: A SWOT Analysis ............................................................ 18
1.1 Strengths of Pharmacogenomics in Clinical Medicine .............. 20
1.1.1 Faster achievement of optimal drug dosages ................. 20
1.1.2 Minimising toxicity and adverse side effects ................... 21
1.1.3 Identifying efficacious drugs ............................................ 22
1.1.4 Reduce overall costs to the healthcare system ............... 23
1.2 Weaknesses of Pharmacogenomics in Clinical Medicine ......... 24
1.2.1 Costs of Pharmacogenomic tests to the individuals ........ 24
1.2.2 Speed of testing to the physicians .................................. 25
1.2.3 Imperfect understanding of genetically driven drug response variability ...................................................................... 25
1.3 Opportunities of pharmacogenomics in clinical medicine ......... 26
1.3.1 Technological innovations and falling prices of genetic tests ........................................................................................ 26
1.3.2 Next generation sequencing to encourage individualized pharmacogenomics ..................................................................... 27
1.3.3 Innovation in healthcare that impacts drug development and utility 28
1.3.4 Public pharmacogenomics network on clinical implementation ............................................................................ 28
1.3.5 Uptake of pharmacogenomics in outpatient settings ....... 29
1.4 Threats of pharmacogenomics in clinical medicine ................... 30

5
1.4.1 Availability of non-genetics alternatives to physicians ..... 30
1.4.2 Misaligned incentives for clinical discovery versus clinical implementation activities ............................................................. 31
1.4.3 Lack of healthcare infrastructure ..................................... 32
1.4.4 Mistrust over management and use of genetic information 32
1.4.5 Lack of buy-in by healthcare financiers ........................... 33
1.4.6 Higher institutional risk and threats of lawsuits ............... 33
1.4.7 Widening inequality in healthcare accessibility ............... 34
1.5 Discussion ................................................................................ 35
Chapter 2 Health Technology Assessment: A logic based approach to regulatory decision making ............................................................. 37
2.1 Perspective of Analysis ............................................................. 41
2.2 Allele frequencies, Disease Severity and Prevalence ............... 43
2.3 Patients Adherence .................................................................. 45
2.4 Willingness-To-Pay (Cost-effectiveness threshold) .................. 46
2.5 Healthcare system .................................................................... 47
2.6 Discussion ................................................................................ 48
Chapter 3 Cost Effectiveness Analysis of HLA-B*5701 Genotyping in Newly Diagnosed Persons Living with HIV/AIDS in Singapore, by Ethnicity 49
3.1 Introduction ............................................................................... 49
3.2 Methods .................................................................................... 51
3.2.1 Model Structure............................................................... 51
3.2.2 Model Inputs ................................................................... 54
3.3 Results ...................................................................................... 61
3.3.1 Sensitivity Analysis ......................................................... 62
3.4 Discussion ................................................................................ 68

6
Chapter 4 Cost-Effectiveness Analysis for including a Serum-microRNA Biomarker Panel as a Screen before Endoscopy, for Detection of Gastric Cancer among High Risk Patients in Singapore 72
4.1 Introduction ............................................................................... 72
4.1.1 Gastric Cancer statistics in Singapore ............................ 75
4.2 Methods .................................................................................... 80
4.2.1 Target Population: ........................................................... 80
4.2.2 Strategies Compared ...................................................... 83
4.2.3 Methodology ................................................................... 83
4.2.4 Model Inputs ................................................................... 86
4.2.5 Sensitivity Analysis ......................................................... 91
4.3 Analysis for the Korean population screening program ............ 93
4.4 Results ...................................................................................... 94
4.4.1 Hospital-clinic setting ...................................................... 94
4.4.2 Population screening for Chinese males (50-69 years) .. 97
4.4.3 Population screening in Korea ...................................... 101
4.5 Discussion .............................................................................. 105
Chapter 5 Cost-Effectiveness and Value of Information Analysis of SLCO1B1 Genotyping (rs4149056) before Simvastatin Prescription for Secondary Prevention of AMI in Singapore ...................................... 111
5.1 Introduction ............................................................................. 111
5.2 Methods .................................................................................. 114
5.2.1 Model Structure............................................................. 114
Side effects on Cholesterol Lowering Drugs .............................. 115
Clinical Management of Side effects ......................................... 116
5.2.2 Sources of Information .................................................. 117
5.2.3 Sensitivity analysis ........................................................ 126
5.3 Results .................................................................................... 127

7
5.3.2 Value of Information analysis ........................................ 129
5.4 Discussion .............................................................................. 133
Chapter 6 Conclusion .................................................................... 138
Bibliography ...................................................................................... 141
8
Summary
As defined by World Health Organization (WHO), Health Technology
Assessment is a multidisciplinary process to evaluate the social,
economic, organizational, and ethical issues of a health intervention or
healthcare technology. Comparing a novel technology to the current
standard of care or other alternatives, it provides evidence for healthcare
authorities to make informed policy decisions.
With increasing interest in stratified medicine and multiple drug-gene
associations with proven clinical utility, there is a growing focus on
including pharmacogenomic tests as standard-of-practice in the clinics.
As clinical trials and programs are already evaluating the clinical
implications, the overall economic burden is an equally important
parameter to determine its applicability in routine healthcare. Many
features specific to the population demographics, ethnicity and the
healthcare setup impact the need, willingness and affordability of any
new model of care, like – ethnic makeup, disease prevalence, healthcare
facilities/services availability and costs, awareness among the
physicians and patients etc. With one of the world’s best healthcare
infrastructure in Singapore, clinical translation of pharmacogenomics to
offer effective treatment and/or reduce adverse reactions is of
paramount importance to provide efficient and patient friendly healthcare
experience, and yet manage the increasing expenditure. However, with
a genetically heterogeneous demographic makeup and difference in

9
healthcare services costs, the recommendations of Food & Drug
Administration (FDA) and European Medicines Agency (EMA) may not
always be of the best interest to Singapore. Thus, there is a need of
assessment of these emerging propositions specific to Singapore’s
healthcare and population setup to be able to devise optimal and
sustainable policies.
This PhD project was undertaken to conduct technology assessment,
particularly exploring the cost-effectiveness of implementing new
pharmacogenomic models of healthcare in Singapore. Besides its
academic pursuits, it also aimed to provide scientific evidence and
identify potentially valuable areas of future research to aid in translation
of these technologies in real practice. Working with the NUS Saw Swee
Hock School of Public Health, and public hospitals in Singapore, three
important studies were identified as part of this project, which are at
different stages of discovery and implementation – a technology with
FDA recommendations for clinical implementation (HLA-B*5701
genotyping before Abacavir), a technology with proven clinical utility but
no recommendations by FDA (SLCO1B1 genotyping before Simvastatin
prescription) and a novel technology which is at the stage of clinical
discovery and validation (miRNA serum test for gastric cancer
diagnosis). For the benefit of reader and reviewers, the thesis has been
organized into six chapters as follows:

10
Chapter 1 explores the role of pharmacogenetics in healthcare and
identifies the strengths, weakness, opportunities and threats involved
with its translation in the clinics.
Chapter 2 elaborates on the importance of Health Technology
Assessment for pharmacogenomic implementations and discusses on
the parameters which influence the evaluations and imparts it a
personalized flavor.
Chapter 3 evaluates the cost-effectiveness of implementation of HLA-
B*5701 genetic testing before Abacavir prescription for HIV patients in
Singapore. This genetic test has currently been recommended by FDA.
Chapter 4 evaluates the application of a novel miRNA biomarker serum
blood test to help in detection of gastric cancer in Singapore. The study
further evaluates the benefits of an improved adherence and its future
application for population cancer screening programs in Singapore.
Chapter 5 is focused on cost-effectiveness analysis for SLCO1B1
genotyping (SNP: rs4149056) for safer prescription of Simvastatin
among Chinese AMI patients for secondary prevention in Singapore.
Our study is the first attempt to explore the cost-effectiveness of clinical
translation of this pharmacogene.
Chapter 6 includes the concluding remarks.

11
Publications
1. Kapoor R, Martinez-Vega R, Dong D, et al. Reducing hypersensitivity
reactions with HLA-B*5701 genotyping before Abacavir prescription:
clinically useful but is it cost-effective in Singapore? Pharmacogenetics
and genomics 2014.
2. Kapoor R, Tan-Koi WC, Teo Y-Y. Role of pharmacogenetics in public
health and clinical health care: a SWOT analysis. Eur J Hum Genet
2016;24:1651-7.
3. Tan-Koi WC, Kapoor R, Teo YY. Pharmacogenetics through a public
health lens: from policy to practice. Pharmacogenetics and genomics
2015;25:518-20.
4. Zou R, Zhou L, Too HP, Kapoor R, Zhu F, Goo P, Rha SY, Chung
HC, Yoong J, Yap CT, Rao J, Chia CK, Tsao S, Shabbir A, Lam K. P.,
Yong W-P, Yeoh K-G, So J.B. Serum microRNA Panel Enables Early
Detection of Gastric Cancer. (In-preparation)
5. Kapoor R, Wee HJ. Cost-Effectiveness and Value of Information
Analysis of SLCO1B1 Genotyping (rs4149056) before Simvastatin
Prescription for Secondary Prevention. (In-preparation)

12
List of Tables
Table 1. Model Inputs ......................................................................... 60
Table 2. Cost effectiveness of HIV treatment strategies for newly diagnosed early and late stage HIV patients contra-indicated to Tenofovir ............................................................................................ 63
Table 3. Cost-effectiveness of HIV treatment strategies for newly-diagnosed early and late-stage HIV patients receptive to both Abacavir and Tenofovir ...................................................................................... 64
Table 4. Cost-effectiveness of HIV treatment strategies- Tenofovir as first line (current practice) with ABC as first line (cheapest strategy) for newly-diagnosed HIV patients receptive to both Abacavir and Tenofovir ........................................................................................................... 66
Table 5. Gastric Cancer Statistics for Singapore ................................ 75
Table 6. Base case values and sensitivity ranges for model inputs (Singapore) ......................................................................................... 87
Table 7. Distributions assigned to parameters in the probabilistic sensitivity analysis (Hospital-clinic) ..................................................... 92
Table 8. Base Case Values and Sensitivity Range for model Inputs specific to Korean healthcare setup .................................................... 93
Table 9. Cost-effectiveness results for Singapore Hospital-clinic scenario comparing the two strategies: ‘endoscopy for all’ and ‘miRNA test followed by endoscopy only for test positive patients’ (modelled for 14 years) ............................................................................................ 95
Table 10. Cost and health benefits estimation in hospital-clinic setting in Singapore ........................................................................................... 96
Table 11. Cost-effectiveness results for population screening of Singaporean Chinese from 50-69 years comparing the two strategies: ‘endoscopy for all’ and ‘miRNA test followed by endoscopy only for test positive patients’ (modelled for 20 years) ........................................... 98
Table 12. Results of base-case analysis for population screening for Singapore Chinese Males (50-69 years). ........................................... 99
Table 13. Sensitivity analysis investigating the impact of improvement in patient compliance with miRNA test on cost-effectiveness of endoscopy in the populations screening setup for Singaporean Chinese males (50-69 years) .......................................................................................... 103

13
Table 14. : Cost-effectiveness results for population screening program in Korea for Adults ≥40 years, comparing the two strategies: endoscopy for all and miRNA test followed by endoscopy only for test positive patients (modelled for 24 years) ....................................................... 104
Table 15. Results of base-case analysis for population screening for population screening program in Korea for Adults ≥40 years ........... 104
Table 16. Model estimates and sources ........................................... 121
Table 17. Cost-effectiveness analysis of the cholesterol lowering strategies for secondary prevention in Singapore ............................. 129
Table 18. 1-year Budget Impact of ezetimibe-Simvastatin combination in Singapore in comparison other cholesterol management strategies 131
Table 19. Evaluation of the rate of side effects across different strategies ......................................................................................................... 131
Table 20. Estimates of the value of additional information to resolve uncertainty ........................................................................................ 131
14
List of Figures
Figure 1. Possible treatment therapies considered for the HIV patient subgroups ........................................................................................... 53
Figure 2. Decision tree model for newly diagnosed HIV patients in Singapore who are contra-indicated to Tenofovir. .............................. 55
Figure 3. Decision tree model of the treatment strategy for newly diagnosed HIV patients in Singapore who can be prescribed Tenofovir or Abacavir ......................................................................................... 56
Figure 4. The decrement in utility values due to occurrence of side effect or ABC-HSS ....................................................................................... 59
Figure 5. Sensitivity analysis for early stage Chinese patients receptive to both Abacavir and Tenofovir ........................................................... 67
Figure 6. Sensitivity analysis of cost-effectiveness to variation in PPV and HLA-B*5701 frequency in early stage HIV patients ..................... 68
Figure 7. Cost effectiveness acceptability curve for early-stage Chinese HIV patient receptive to both Abacavir and Tenofovir ......................... 69
Figure 8. Age Specific Incidence rate of Gastric Cancer in Singapore (2008-2012) ........................................................................................ 76
Figure 9. Markov-Decision Tree Model for the strategy 'endoscopy for all' ....................................................................................................... 81
Figure 10. Decision Tree Model for Strategy 'miRNA screening with endoscopy only for test positive patients' and for the current strategy of No-Screening for the population cohort of Singaporean Chinese 50-69 years ................................................................................................... 82
Figure 11. Sensitivity analysis investigating the impact of gastric cancer incidence rate on cost-effectiveness of endoscopy for all at multiple miRNA test cost scenarios in the hospital-clinic setting ...................... 96
Figure 12. Cost-effectiveness acceptability curve for hospital-clinic scenario .............................................................................................. 97
Figure 13. Sensitivity analysis investigating the impact of gastric cancer incidence rate on cost-effectiveness of endoscopy for all at multiple miRNA test cost scenarios in the populations screening setup for Singaporean Chinese males (50-69 years) ...................................... 100
Figure 14. Cost-effectiveness acceptability curve for population screening of Singaporean Chinese Males (50-69 years) .................. 102

15
Figure 15. Sensitivity analysis investigating the impact of improvement in patient compliance with miRNA test on cost-effectiveness of miRNA-based strategy in comparison with endoscopic screening in the population screening program in Korea (for adults ≥ 40 years) ........ 107
Figure 16. Markov-Decision Tree Model for evaluating the cost-effectiveness of cholesterol management strategies for secondary prevention in AMI patients in Singapore ........................................... 120
Figure 17. Selection criteria for determining the Simvastatin side effect Burden .............................................................................................. 121
Figure 18. Possible cholesterol lowering treatment therapies compared for secondary prevention .................................................................. 125
Figure 19. Cost-effectiveness analysis comparing the four strategies on their cost and effectiveness .............................................................. 130
Figure 20. Tornado analysis evaluating the impact on ICER for genotyping strategy vs. Simvastatin for all ....................................... 132
Figure 21. Cost-effectiveness acceptability curve (Probabilistic Sensitivity analysis) evaluating ezetimibe-Simvastatin combination vs. Simvastatin for all ............................................................................. 133
Figure 22. Cost-effectiveness acceptability curve (Probabilistic Sensitivity analysis) .......................................................................... 134
16
List of Abbreviations
3TC Lamivudine
ABC Abacavir
ABC-HSS Abacavir Hypersensitivity Syndrome
ADR Adverse Drug Reaction
AMI Acute Myocardial Infraction
ASR Age Standardized Incidence Rate
AZT Zidovudine
CK Creatinine Kinase
CPIC Clinical Pharmacogenetics Implementation Consortium
CT Computerized Tomography
CX-R Chest X-Ray
EFV Efavirenz
EMA European Medicines Agency
EUR Endoscopic Ultrasound
FDA Food and Drug Administration, US
FTC Emtricitabine
GDP Gross Domestic Product
GST Goods and Service Tax
HAART Highly Active Antiretroviral Therapy
HIV Human Immunodeficiency Virus
HTA Health Technology Assessment
ICER Incremental Cost-Effectiveness Ratio
LDL Low Density Lipoprotein
miRNA micro RNA (ribo nucleic acid)
Mn Million
NNRTI Non-nucleoside Reverse Transcriptase Inhibitor
NPV Negative Predictive Value
NRTI Nucleoside Reverse Transcriptase Inhibitor
NUH National University Hospital, Singapore
PGx Pharmacogenes
PI Protease Inhibitor
PPV Positive Predictive Value
QALY Quality-Adjusted Life Years
QoL Quality of Life
RR Relative Risks
SNP Single Nucleotide Polymorphism
TDF Tenofovir
UGIS Upper-Gastrointestinal Series

17
ULN Upper limit of Normal Range
VOI Value of Information Analysis
WHO World Health Organization
WTP Willingness-to-Pay

18
Chapter 1 Role of Pharmacogenomics in public health and
clinical healthcare: A SWOT Analysis
The success of the Human Genome Project in 20031 marked the
beginning of a new era in medicine. Genomic research has gained
attention in a multitude of areas– understanding of diseases and drugs,
drug development, pre-symptomatic disease diagnosis, future disease
risk prediction, evaluation of drug compatibility and possibility of drug
adverse reactions. The development of large-scale genome-wide
approaches have led to the advent of pharmacogenomics, a more
diverse field of study which combines the traditional pharmaceutical
sciences such as biochemistry with annotated knowledge of genes,
proteins, RNA’s and single nucleotide polymorphism (SNPs) to develop
newer approached for disease diagnosis and stratified treatment with
greater efficacy and safety.
Pre-symptomatic disease diagnosis is of supreme importance to achieve
a better treatment success across diseases. However, in cancers this is
of compelling concern as cancer treatment have a significantly higher
success rates with improved survival if diagnosed in asymptomatic early
stages as compared to advanced stages when the patients begin to
show symptoms. Medical societies around the world have
recommended cancer screening tests for its population with a few high-
risk countries like South Korea and Japan also providing subsidized
cancer screening at national level2-4. However, in intermediate and low
19
risk countries there are still no pre-emptive cancer screening programs
due to concerns of the additional burden on the healthcare budget and
on the healthcare system. This has spurred the development of novel,
and effective pharmacogenomic screening approaches relying on
biomarker identification like disease-linked miRNA (micro ribonucleic
acid) and SNPs(Single nucleotide polymorphism) which can aid in
development of accurate and cheaper screening technologies5-7.
Inadequate response to drugs and adverse drug reactions, resulting
from incompatibility to medicines, are also a leading cause of death and
have grave health and financial implications. On average only 50% (25-
60%) of patients responds adequately to drugs8. Studies report adverse
drug reactions (ADRs) as a fourth to sixth leading cause of death in US
with 0.32% of patients suffering from ADR related deaths8. Genetic
polymorphisms may alter the enzyme synthesis responsible for drug
metabolism leading to either accumulation of unused drug in the body or
a faster breakdown and elimination, restricting the drug to function
appropriately and leading to inactivity and side effects. Some may also
have a genetic predisposition to drug-related immune responses leading
to drug hypersensitivities. As reported by PharmGKB, there are currently
193 biomarkers recognised by US FDA (Food and Drug Administration)
that can directly enhance patient treatment in diseases like HIV, cardiac
ailment, mental illness, neurological disorders, cancers, hepatitis C,
gout, cystic fibrosis etc9,10 . However, only 59 drug-gene associations
have been approved by the US FDA9, stating required/ recommended

20
genetic testing before drug prescription. Though there seems to be an
immediate health benefit for the patients, the uptake of these
advancements in pharmacogenomics in standard clinical practices has
been startlingly slow.
Thus, here we perform a SWOT analysis examining the strengths,
weaknesses, opportunities and threats around the role of
pharmacogenomics in public health and clinical medicine. The aim of our
analysis is to identify the strengths and opportunities of practicing
pharmacogenomics in public health along with the weaknesses and
threats leading to the sluggish uptake of pharmacogenomics in standard
clinical care. The SWOT analysis also identifies existing gaps in the
current situation, and provides a guide to identify the key areas for future
health systems research and developments to enable favourable
policies for public health translation.
1.1 Strengths of Pharmacogenomics in Clinical Medicine
1.1.1 Faster achievement of optimal drug dosages
Conventional clinical medicines and practices mostly rely on one-size fit
all approach followed by routine monitoring to establish a working
dosage of a compatible drug regimen. For many drugs, commercially
available drug dosages are suited for an “average” patient but can be
easily adjusted based on biometric factors such as weight and age. But
a few of pharmaceuticals demand careful dose titration to achieve the
compatible dosage and the appropriate clinical effect within a narrow

21
therapeutic range leading to multiple follow-up tests and monitoring.
Many of these dosages are found to be influenced by genetic variants
which influence the metabolism of the drug in the body. Using genetic
tests to identify the optimal dosage estimate coupled with a few follow
ups eventually helps in faster achievement of optimal dosage with
minimum toxicity. Warfarin11,12 irinotecan13 and atomoxetine14 are
examples of medications where genetic variant combinations strongly
correlates with different dose-response curves.
1.1.2 Minimising toxicity and adverse side effects
The potential to use pharmacogenetics to identify at-risk patients
prospectively poses a very attractive tool, especially when adverse
events from medications constitute as one of the leading causes of
mortality and a huge economic burden15-17. Recent studies have
uncovered numerous genetic linkages with drug-induced toxicity and/or
side effects, where an individual’s genetic profile can provide early
indication of the likelihood of an undesirable outcome and direct the
physician towards prescribing a possible alternative. Abacavir and
carbamazepine are two such befitting examples, especially as patients
who do not carry risk alleles (HLA-B*57:01 and HLA-B*15:02 alleles
respectively) for these two drugs will almost never experience a side
effect, namely, Abacavir-induced hypersensitivity or carbamazepine-
induced –Stevens-Johnson Syndrome (SJS). Conversely, patients who
carry these risk alleles present over hundred-fold increase in risk of
unpredicted potentially fatal side effects and physicians would almost

22
always recommend alternatives as a matter of good clinical practice.
Prospective trials of HLA-B*57:01 screening before Abacavir
prescription have indeed reported striking success with significantly
reduced adverse incidents rates by substituting alternatives for the risk
allele carriers18,19. An assurance of reduced side effects among patients
who are non-carriers of the risk allele also promises improved drug
compliance20, which in itself is a major clinical challenge and of immense
economic value to the healthcare system21.
1.1.3 Identifying efficacious drugs
Using pharmacogenomics to identify efficacious medication for patients
forms the cornerstone of practicing stratified medicine. With a
prospective approach, the Pharmacogenomic Resource for Enhanced
Decisions in Care and Treatment (PREDICT) program by Vanderbilt
University has already illustrated successful examples, for instance one
where physicians could use patients genetic profiles to appropriately
identify the compatible statin with suitable dosage for a heart patient
enduring the aftereffects due to incompatible statin treatments for
years22. Trastuzumab, commonly known as Herceptin®, is also an
effective therapy for cancer patients who are HER2 positive (breast or
gastric), lowering 3-year cancer relapse risk by almost 10% and
improving survival23, but offers no such benefit for HER2 negative
patients. The ability to identify an efficacious treatment, especially for a
debilitating and traumatic disease such as cancer, remarkably increases
patient confidence in both the genetic testing and treatment and the

23
possibility to recover as well, who otherwise get jinxed with a
deteriorating health and the huge bills for potentially harmful or
ineffective treatments.
1.1.4 Reduce overall costs to the healthcare system
Pharmacogenomic testing with an increased upfront cost due to
additional tests are mostly perceived to increase the economic burden
on the treatment. However, many a times genetically-related
medications are cheaper than their counterparts and identification of a
suitable population segment would help to improve not only the
treatment response but also the long-term medication costs. Drugs such
as Abacavir and Simvastatin with related genetic tests to help avoid
undesirable side effects are such examples as they are considerably
cheaper than their respective alternatives (Tenofovir, Alirocumab and
other stating like Atorvastatin, Rosuvastatin etc). In the absence of
genetic tests, assigning expensive alternatives to all incur unnecessary
expenses to the healthcare system along with the risk of alternative
forms of side effects, whereas unguided use of cheaper alternatives is
also not desirable with the risk of unwanted adverse events. Thus, in
such a scenario, genetic stratification of patients could help guide
prescription of costlier alternatives only to those who cannot tolerate the
cheaper medication. This may help to reduce the overall side effect
profile and generate significant cost-savings in the longer run as well. A
similar example is HLA-B*15:02 screening before carbamazepine
prescription in East Asians24-26, delivering overall savings to the

24
healthcare system despite having a low benefit to screening ratio.
However, it should be noted that these cost-savings are specific to
healthcare systems and are not directly transferable, as depicted by
studies concluding cost-effectiveness of HLA-B*57:01 genetic testing
before Abacavir in European populations27 but not being a cost-effective
strategy for Southeast Asian populations28. Patient stratification in risk
categories would also help the physician devise personalised follow-up
plans, ensuring strict monitoring schedule for the high-risk patients and
possibly not-so-strict one for those at low-risk. Along with ensuring an
improved drug risk profile, this might also help optimise the physician’s
workload and possibly save the unsusceptible patients some extra funds
and efforts by avoiding the unnecessary physician visits.
1.2 Weaknesses of Pharmacogenomics in Clinical Medicine
1.2.1 Costs of Pharmacogenomic tests to the individuals
Producing an individual’s pharmacogenomic information is an additional
expense on top of standard clinical care. Although the government/
healthcare agencies reimburse some pharmacogenomic tests, they are
still typically limited to only a handful of cancer-related and HLA-targeted
genetic tests (e.g. HLA-B*15:02 testing in Singapore29,30 and
Thailand31), even in countries like United Kingdom, Singapore and
Thailand with comprehensive universal health coverage (UHC) and
government subsidies. Many other medicines with clinically proven
genetically related potentially fatal side effects (e.g. Allopurinol32,

25
Codeine33 etc) and newer methods of cancer screening like miRNA
testing are not covered with most of the healthcare systems currently
passing on the expense of these pharmacogenetic tests to the
individuals.
1.2.2 Speed of genetic testing to aid in clinical decisions
The generation of test results in a timely manner is as important as the
accuracy of the test itself and its clinical impact. It is important to get the
results timely to contribute in decision making. For example, in Warfarin,
3-7 days are sufficient to adjust the International Normalised Ratio (INR)
to therapeutic range through rigorous monitoring. Testing for HLA alleles
to inform prescription of medications such as Abacavir, carbamazepine
or allopurinol can take even longer, although prescription immediacy is
often relatively less crucial for such patients. Though the turn-around
time of the actual test may be in days, the timeline of the entire
operations from obtaining patient’s samples to delivering the report to
the physician for clinical decision immensely concerns the practical
applicability in clinics, making it a rate determining step in the successful
clinical translation of pharmacogenomics
1.2.3 Imperfect understanding of genetically driven drug
response variability
Except a few of gene-drug associations, mostly HLA alleles-induced
adverse drug reactions and success stories in oncological treatments,
the role of genetics to explain the drug response variability is yet to be
well translated for majority of pharmacogenomic discoveries. For

26
example, the alleles in VKORC1 and CYP2C9, clinically useful for
predicting warfarin dosing explain less than 50% of the INR dosing
variation, with compelling benefits only in a few populations34,35. Rare
variants are also expected to contribute significantly to the functional
variability in pharmacogenes, for instance response variability estimated
to be 17.8% due to rare variants in SLCO1B136 for the drug
methotrexate. This incomplete understanding of the genetic impact on
drug outcomes is likely to affect the confidence of physicians and
patients to genetic testing.
1.3 Opportunities of pharmacogenomics in clinical medicine
1.3.1 Technological innovations and falling prices of genetic tests
The cost of whole genome sequencing has exponentially reduced from
USD3 billion in 2001 to less than USD 1,000 in 2016. Leveraging the
repository of genetic information gathered from thousands of whole
genome sequences, elaborate microarrays which incorporates about
500k -1 million clinically relevant genetic biomarkers have been
designed for relatively lower prices. With such low prices, genetic
information can be synthesized and possibly easily integrated into an
individual’s health records even before the need arises. This thwarts the
weakness of lack of timely procurement of test results to be of practical
usage. Technological innovations have also brought up a direct-to-
consumer market for genetic tests where the decision to genotype is
taken by the individual himself. Rapid test kits are very accessible to

27
order and test for general practitioners and specialists alike. In addition,
multiple initiatives for easy transfer of such data have also been
undertaken, for example - medicare safety code initiative (saving data in
QR code readable easily with a smartphone)37 and pharmacogenomic
IDs38. However, the framework to establish secure and easily accessible
storage services for huge genomic datasets has already begun with the
development of google genomics and its collaboration with Broad
institute. These developments greatly improve the accessibility to
genomic information and provide a platform for pharmacogenomics to
play a bigger role in healthcare.
1.3.2 Next generation sequencing to encourage individualized
pharmacogenomics
With classic pharmacogenomics focusing only on the common variants,
the concept of adapting prescription conforming to individual specific
rare-variants by interpreting individual’s genome is gaining more
importance. Rare variants, have been found to be critical in affecting
drug response, accounting for 30-40% of functional variability, which in-
turn potentially affects multiple drugs pharmacokinetics or
pharmacodynamics39. Thus, research projects (like personal genome
project) and international collaborations have been launched to promote
personal genomics and achieve true treatment personalization.

28
1.3.3 Innovation in healthcare that impacts drug development and
utility
Pharmacogenomics possesses the potential to change the paradigm of
medicine, not only in the prescription of drugs but also in their discovery
and development40. The concept of clinical trials guided with
pharmacogenomics principles is to improve and accelerate drug
development: by correlating patient’s genetic profiles with treatment
outcomes (mainly around safety and efficacy) in early phases of the
clinical trials, and consequently extending Phase III trials to patients with
favourable genotypes. This provides a significantly more precise
approach for drug development leading to a lower attrition of drug
candidates and hence lowering the overall cost of drug development.
Pharmaceutical companies can potentially be the main driver in
promoting use of pharmacogenomics as a standard of care, by
introducing dosage guidelines and safety profiles based on
pharmacogenomic information, thereby compelling the need to genotype
before prescription.
1.3.4 Public pharmacogenomics network on clinical
implementation
Numerous International consortiums have been developed to inspire
application of pharmacogenomics in clinical practice. CPIC, (Clinical
Pharmacogenomics Implementation Consortium, https://cpicpgx.org/) is
an online resource managed collectively by the Pharmacogenomics
Research Network and PharmGKB, with an aim to provide thoroughly
curated evidence and guide on the use of genetic tests in prescribing

29
and optimising drug41. Similar initiative called Dutch Pharmacogenetics
Working Group (DPWG) has been launched by The Royal Dutch
Pharmacist’s Association in Europe42. These consortiums not only focus
on educating on the need to order a genetic test but on the interpretability
of test results to enable genetically guided treatment. IGNITE
(Implementing Genomics in Practice), is an international consortium
funded by NIH and has been started to support in enabling effective
translation, and sustainability of using genomic information in diverse
clinical settings, integration of genomic information in electronic medical
health records and hence provide the much-needed clinical decision
support. These efforts are crucial in translation of pharmacogenomics in
the clinics, boosting the physician’s confidence by providing
internationally accredited portals to supplement and update physician’s
knowledge of new pharmacogenomic guidelines. Also with the rising
popularity of direct-to-consumer genetic tests, such portals can assist to
educate and guide patients as well.
1.3.5 Adoption of pharmacogenomics in outpatient settings
With current implementation of pharmacogenomics witnessed mostly in
specialized, inpatient settings within academic or tertiary medical
centres, integration of pharmacogenomics in outpatient settings like
community pharmacies can substantially help in its widespread adoption
in clinical practice43,44. With these being the most easily accessible
healthcare providers, outpatient settings have substantially contributed
to improve health outcomes in the past45,46 and can play a critical role
30
today in imparting the benefits of pharmacogenomics to the community.
With pilot studies already initiated in this sphere47, effective educational
strategies for pharmacists, strict vigilance to ensure practice of evidence
based approaches and policies to safeguard from commercial financial
interests are inevitable to empower the outpatient settings implement
pharmacogenomics effectively in the community.
1.4 Threats of pharmacogenomics in clinical medicine
1.4.1 Availability of non-genetics alternatives to physicians
There is the tendency that physicians view pharmacogenomics with
scepticism in comparison to the convention approach of an average
prescription, even for medications with genetically related safety and
efficacy concerns is perhaps the greatest threat undermining its clinical
translation. The overall benefits of genetics-based dosing of warfarin has
been challenged by clinical trials illustrating near-similar results using
conventional methods of dose optimization based on clinical factors and
INR monitoring48,49. However, the efficiency of such non-genetic
alternatives specifically that of aggressive monitoring, is hugely
dependent on implementation of a perfect healthcare system that can
diagnose, monitor and circumvent adverse effects or re-adjust drug
dosages in a timely manner. A not-so perfect healthcare system with
less rigorous monitoring due to lack of facilities or patient’s unwillingness
for continued follow-ups may lead to a surge in delayed or missed
diagnosis of adverse events and/or drug failures, for which genetic tests
would act as early preventive measures and help to minimise
31
1.4.2 Misaligned incentives for clinical discovery versus clinical
implementation activities
Currently a disproportionate amount of investment is being done on
pharmacogenomic studies focused on clinical discovery and validation
and less emphasis is being given to the translational phase. The
research studies with the familiar agenda to address the funding
agencies demands are easy to conduct and supervise, whereas the
translational phase studies introduce new complexities. With the need of
systems-level changes for translation in the clinics and incorporation in
national and international level policies/guidelines – a process with
which most clinician scientists are unfamiliar or even averse to. For
example, establishment of an authorized pipeline to certify the use of
pharmacogenomics in the clinic (from the point of blood withdrawal, bio-
informatics or microarray analysis to certified report generation);
provision of manpower training for post-testing genetic counselling;
incorporation of pharmacogenomics in medical schools’ curriculum; and
generation of evidence to guide formulation of national/ international
regulatory legislations. These formative transformations to the
healthcare infrastructure involve the consent of governments, hospital
authorities and universities alike. With the unfamiliarity and intrinsic
complexities of translational programs, the majority of actual research
activities and funding requests have remained focused around clinical
discovery. However, the existing statue of disconnect is unsustainable,
especially when the actual use of the technology in clinics is what both
the research and funding agencies aim to achieve.

32
1.4.3 Lack of healthcare infrastructure
Implementation of pharmacogenomic as a standard of care requires
multiple amendments to the healthcare infrastructure – availability of
data grid, electronic health records to integrate genetic information with
medical records, a platform for data sharing across healthcare
establishment, safety structures to ensure privacy of pharmacogenomic
information, trained manpower for test implementation and
interpretation, genetic counsellors, and the fundamental capital
infrastructure development. However, very few health systems currently
possess a capability to simultaneously accommodate and share genetic
information, leading to concerns over the initial establishment costs
involved.
1.4.4 Mistrust over management and use of genetic information
The flow-over implication of pharmacogenomic information beyond the
individual also adds hesitancy to patient adoption. Pharmacogenomic
information many a times does not solely offer insights into only the
individual-specific biology and disease risks, but also of the family.
Confidentiality of genetic details needs to be secured by the overall
healthcare system, with standard guidelines in place to advice
management of incidental findings especially those related to disease
risks. Insurance agencies can also potentially misuse genomic
information to offer/refuse medical policies over genetic risks50-52. This
fear of misuse of genetic information as a criterion of discrimination in
the society can deteriorate the acceptability of these methods.

33
1.4.5 Lack of buy-in by healthcare financiers
The dilemma with such tests is the tricky predicament faced by
healthcare financiers: to bear tests costs for everyone and sponsor
alternatives among patients incompatible to standard treatment
regimens as compared to the standard treatment for all. Even with
genetically increased risk of a potential drug incompatibility, only a
fraction of such risk-sensitive individuals will eventually end up
experiencing a suboptimal outcome, which many times are already
arrested with routine monitoring. This creates a compelling case to
favour standard treatment especially for chronic diseases with long-term
medications before switching to genetically compatible potentially
costlier alternatives. However, the individuals have a higher motivated
to seek the best possible healthcare. This discrepancy between patient-
centric healthcare and universal healthcare coverage may lead to
unwillingness to cover and reimburse, what may be perceived as an,
unnecessary cost by the financiers.
1.4.6 Higher institutional risk and threats of lawsuits
Though, pharmacogenomic based prescription of alternatives for
patients at high-risk of drug incompatibility/ inefficacy helps physician
provide good clinical care avoiding both - unnecessary adverse events
and any potential legal troubles arising from such complication; there are
scenarios where it may work to the contrary. The interpretability of
pharmacogenomics relies on a complex set of recommendations based
on statistical concepts of positive and negative predictive values.

34
Relegating clinical decision-making to the interpretation of a set of
statistical probabilities inevitably increases institutional risks and the
threats of lawsuits to the healthcare sector, especially when patients are
increasingly risk averse and patient preference for genetic testing may
differ from the physician’s recommendations. This is particularly in the
case of rare adverse outcomes or for low-risk patient groups where
benefits of the medication far outweigh the rare risk of adverse events.
In addition, where such rare occurrence happens independent of
medication or genetic factors, insufficient counselling of such difficult-to-
grasp concepts may mislead patients to assume that the event has
resulted from physician’s oversight and mismanagement. Additionally,
though development of personalised follow-up schedules for patients
based on their risk-groups to improve overall care and save both money
and time seems as a win-win situation, currently drug label inserts with
pharmacogenomic advisories predominantly focus on patients who carry
risk-alleles. There are no recommendations for risk-allele negative
individual and given the incomplete understanding on the role of genetics
in drug response variation, physicians might be reluctant or even scared
of legal consequences to place too much confidence in genotype-
negativity and reduce the level of monitoring.
1.4.7 Widening inequality in healthcare accessibility
One of the unintended after-effects of using pharmacogenomic
techniques in clinics is to widen the inequality in accessibility of
healthcare in the society. It is likely that with the slow incorporation of

35
these techniques in the policies, owing to high cost of establishments
and low acceptability, majority of them may remain uncovered by
insurance companies and as an out-of-pocket expense. This would lead
to a disparity to access among the wealthy in the society. Also, at the
country level, developing countries may consider this advanced
healthcare technology as secondary to the establishment of classical
essential healthcare whereas the developed economies would have the
resources to offer these advanced technologies improving the quality of
care.
1.5 Discussion
Even though today we witness uncertainty about the application of
pharmacogenomics in clinics, no one doubts the enormous public health
benefits pharmacogenomics entails. Multiple efforts are already
underway with numerous organizations and consortiums bringing
researchers, technologists and payer and patient communities together
to help devise ways of successful implementation. Numerous expensive
clinical trials and programs (like PREDICT, UPGRADE etc.,) have begun
to prove the benefits of translation of pharmacogenomics as a standard
of care. However, the healthcare community gravely requires not only
clinical discovery research but also significant efforts and insistence for
translating proven discoveries to impactful solutions in the standard of
care and rectify the implementation hindrances in the health system.
Here, an evidence-based approach would be essential to generate

36
robust and convincing quantitative proof of the value the new healthcare
intervention would add, and this must be performed before regulatory
agencies can be convinced on whether the genetic test ought to be
implemented in the system.

37
Chapter 2 Health Technology Assessment: A logic based
approach to regulatory decision making
As analyzed in the previous chapter, pharmacogenomics accompanies
itself with multiple strengths and opportunities to benefit public health but
also weaknesses and threats, which have led to its sluggish uptake in
actual practice.
Though discovering significant drug-gene associations has always been
a core requirement of pharmacogenomics, its successful clinical
application is the fundamental cornerstone to derive tangible benefits
from all the research. Intuitively a pharmacogenomic (PGx) test seems
like any other medical test but there are intricate complexities underlying
this healthcare proposition. In comparison to a medical test which
immediately helps to diagnose a disease or evaluate overall health,
application of PGx testing before drug prescription claims to prevent a
“potential side effect” or lead to “better treatment efficacy”. However, in
many cases, these may not lead to immediately quantifiable health
benefits like avoiding a life-threatening side effects or guaranteed early
disease recovery. Also, the medical tests have restricted predictive
ability and even if accurate, the genetic associations are able to explain
only limited variability in patient responses. Accompanied with lack of
awareness, low confidence, availability of more familiar alternatives and
many other factors, clinicians tend to be suspicious and prefer traditional
38
methods like trial and error and treatment response tracking to identify
any possible need of therapy change.
However, even with these weaknesses and threats, pharmacogenomic
associations are currently the strongest predictors to realize the lurking
patient-specific drug-response variability. The well documented
evidences of pharmacogenomics9, present a compelling case of its
clinical utility to achieve an efficient stratified system of care.
A fundamental necessity to integrate PGx testing successfully in
standard clinical care is identification of a comprehensive framework of
implementation which offers better health benefits with affordable costs.
Here economic viability stands out as an elemental factor to ensure
sustainability of this intervention. An elemental question rises in the mind
of the patient and health systems alike - Are the test benefits worth the
money? Healthcare systems today are reeling under multiple challenges
– ageing population, increasing burden of chronic diseases, emerging
threats and unknown diseases, innovation and rapid developments in
medical technologies, high user expectation and a worldwide goal to
provide best possible healthcare to all. With a rise in demand and
increasing innovative healthcare solutions and technologies, but limited
resources, the healthcare authorities faces many difficult questions. How
do they decide which new technology, prevention program or healthcare
service delivery model to adopt? How do they determine if their
recommendations have acceptable value for money? With budget
39
constraints there is an inability to afford everything that is clinically
useful. A decision to implement one healthcare activity inevitably
eliminates the resources for some other program, compelling the policy
makers to make important choices. This demands a well-informed
system to support prioritization of resources to be able to provide the
highest “value for money” and help policy makers ensure maximize
health for its population.
These concerns can be addressed by Health Technology Assessment
(HTA) – a multidisciplinary process to evaluate the economic, social,
organizational and ethical issues of a healthcare intervention. Health
technology assessment acts as a tool to compare the current against
new interventions and inform evidence-based, sustainable and
pragmatic policy decisions with budget impact considerations. Such
analysis accounts for long term consequences (both pros and cons) of
health interventions, and helps identify justifiable initial investment on
basis of long term gains and budget impacts. Though such evaluations
do not provide an immediate answer, they act as tools to develop
scenario specific models and provide evidence to identify the key
consequences of allocating resources in different programs. There are
many economic evaluation frameworks to quantify the costs and/or
health benefits – analysis of cost-minimization, cost-benefit, cost-
effectiveness and cost-utility, among which cost-effectiveness analysis,
has particularly gained a lot of popularity among the policymakers.
40
Health technology assessment when broadly applied also includes
social, ethical and legal aspects of health approaches.
Identifying an intervention which helps achieve better health benefits at
a lower cost is the best possible scenario. However, in many cases
betterment of care using an advanced technology involves an additional
cost. Cost-effectiveness evaluation provides a comparative analysis of
two or more proposed interventions based on measurement of their
costs (direct and indirect costs) and achieved health benefits. The health
benefits can be quantified by measuring favourable health outcomes or
adverse events/ mortality avoided or by using a more quantitative
measure called QALY (quality adjusted life years). Used in cost- utility
analysis, a specialised form of cost-effectiveness analysis, a QALY
represents one year in perfect health. It is calculated by using quality-of-
life (QoL) scale - an index measuring health on a 0-1 scale (with death
and perfect health represented by the extremes respectively). QoL
multiplied by the number of years lived in that condition represents the
total QALYs for the patient. A cost-effective strategy helps to validate the
benefit of an intervention’s underlying expenses and identify a superior
healthcare strategy, the population segment where it is most cost-
effective and the preferred cost range and duration of implementation as
well. The less frequently used methodologies include cost-minimization
which helps identify the cheapest strategy and cost-benefit evaluations
which measures the cost and health benefits in monetary terms, which
of increased interest of private payer organisations.
41
Cost-effectiveness analysis involves decision modelling to synthesize
evidence for the different strategies. Along with information about the
clinical effectiveness of the intervention, knowledge about the
epidemiology of the disease, characteristics of the population segment,
natural history of disease, healthcare services availability and overall
acceptability of the proposed interventions all play a role to derive
substantial evidence to identify the best intervention for the target
population segment. Countries with varied characteristics for the above-
mentioned parameters might have different interventions appearing as
most cost-effective, imparting this research methodology a much
personalised flavour. Below we have tried to innumerate five such
important parameters, which make cost-effectiveness analysis a
methodology specific to a country, disease and population segment.
2.1 Perspective of Analysis
Perspective of cost-effectiveness analysis is a very important aspect,
which can generate varying recommendations for the same intervention.
Three main perspectives which cost-effectiveness analysis is performed
with are: patient’s perspective, payer perspective (insurance or
government healthcare system) and policy-maker (societal) perspective.
Provider perspective (perspective of the clinician), is also an additional
perspective which can influence the decisions of the patient and payer.
Every perspective values costs and health benefits from their view point
– patient perspective valuing the individual’s health the most with a

42
concern of out-of-pocket expense, payer perspective evaluating the
public health benefits and contribution to economy over individual’s
health (if government is the payer) or organization’s profit (if the payer is
a private insurance company). Confusions and misunderstandings
unavoidably arises in above two perspectives with conflicts in their
fundamental interests. Thus, there is need of clear distinction in the
evaluation between private healthcare where additional cost will be
borne by the individual who will enjoy the benefits, versus reimbursable
healthcare (by government or insurance), where the patient would
expect the best care irrespective of the cost.
In government subsidized healthcare setting, where the payer aims to
give its population the best healthcare, the unlimited needs of the
population has led to an immense burden on health care budget,
highlighting the need of an evaluation method to prioritize resource
utilization for the benefit of the entire society. This introduces the societal
perspective which analyzes from the society’s viewpoint, the benefits of
a healthcare intervention for public health and contribution to the
economy which would benefit the whole society. This perspective
intends to make all parties aware of the overall effects and forms the
basis to make decisions which is fair for all. This is in line with the goals
of the healthcare systems which aim to utilize the resources in the public
interest.

43
2.2 Allele frequencies, Disease Severity and Prevalence
A new test/ therapy to identify a compatible treatment for a severe illness
and/or avoid a life-threatening or physically debilitating side effects is
welcomed in the clinical settings as they seem cost-effective intuitively.
This mirrors the successful implementation of genetic tests to provide
personalized care to cancer patients53 and in various other serious
illnesses like HIV54 and Epilepsy55. On the contrary, with a lower
prevalence of the risk allele, these clinical practices recommending
screening for all may in turn become economically burdensome as only
a few patients would carry the risk genotype. HLA-B*5701 testing before
Abacavir, a success story of clinical application of genetic testing to
prevent potentially life threatening adverse reaction in HIV patients
carrying the risk-allele, suffers from such a dilemma. While studies in
US27 and UK56 prove its cost-effectiveness, resulting in FDA
recommendation in favor of testing, a similar study in Singapore proves
it to be not cost-effective28 (see Chapter 3). With a lower prevalence of
HIV in Singapore, and a very low risk allele frequency among
Singaporean Chinese and Malays (1% - 2%), the huge cost expenditure
of screening all HIV patients to avoid a handful of adverse events
renders this clinically useful test, economically unfavorable. HLA-B*1502
screening in epilepsy patients for preventing carbamazepine-induced
SJS (Stevens- Johnson syndrome) is another such example which is
proved cost-effective in Singapore24 and Thailand26 but is not an
economically preferred option in the US55.

44
As we note that a low frequency of risk-allele seems to increase the
economic burden of preventive testing, but with a high disease
prevalence, these public health interventions can drive substantial health
benefits and reinforce their importance by achieving health benefits
worth for the overall expense. A well fitted example is cardiovascular
diseases. Currently FDA warning exists for two widely used drugs in this
therapeutic area – Warfarin (anti-coagulant)57 and Clopidogrel (anti-
platelet)58. Simvastatin (a cholesterol lowering drug) also has an FDA
alert limiting its dosage59, with research attributing this risk to genetic
causes60. With about 32% (73.5 million) adults suffering from high
cholesterol61, 29% (70 million) with hypertension62 and approximately
one death every minute due to heart disease related event in US alone63,
cardiovascular diseases poses an enormous public health burden. High
cholesterol, being a prevalent risk factor approximately doubles the risk
of a heart disease64. With a widespread Simvastatin usage, even a low
incidence rate of rhabdomyolysis (3.4 per 100,000 person years with
subsequent 10% mortality)65 - a potential life threatening adverse event
with an existing PGx biomarker60,66, the large absolute patient numbers
and ability to save even some of them using PGx testing stresses on the
benefits of its inclusion as a standard-of-care.
In a scenario where, irrespective of drug’s risk profile based on patient
genetic makeup, it still remains the prescription of choice due to lack of
alternatives, an identification of high-risk patients would help clinicians
in implementing a more aggressive follow-up plan with enhanced patient

45
education measures to help in early diagnosis of adverse events or
treatment inadequacy. This would be instrumental to strengthen the
drug’s benefit profile and reduce the resultant side effects.
2.3 Patients Adherence
Patient adherence is a major parameter governing the success of any
healthcare intervention. Though lot of resources are being invested in
the diagnosis and provision of best treatment to all, the willingness of the
patient to be compliant to the treatment is of vital concern for the overall
success. Medication non-adherence though difficult to quantify is
estimated to be yet another immense economic burden on healthcare,
amounting to more than USD300 billion in the US alone67.
The patient’s non-adherence can have important implications on the
cost-effectiveness of healthcare interventions. Introduction of a new
sophisticated medical technology with significantly better health benefits
but invasive/ logistically demanding procedure may appear very
attractive for its clinical utility but not so cost-effective due to lower
patient willingness. Moderate side effects which are not of major clinical
concern sometimes also inflict an increase in patient discontinuation
rates influencing the cost effectiveness of its prevention strategies. For
example, recently there has been an increasing concern for mild muscle
related side effects of statins like myalgia and myopathy, which though
not guilty of grave medical consequences, contribute as one of the
leading causes of non-compliance among statin- takers68. With non-

46
adherence as high as 75% in the first year itself69,70 it is a major
challenge in practicing effective medicine, leading to poor cholesterol
management among patients and high rate of heart diseases. Thus,
cost-effectiveness of implementation of a SLCO1B1 genetic testing to
stratify Simvastatin users by their side effect risk and achieve safer statin
prescription may be potentially worthwhile predominantly for its ability to
achieve improved adherence.
Currently most of the cost-effectiveness analyses are performed
assuming perfect patient adherence, which is hardly the case. Thus,
along with the improved clinical utility, the willingness to be accepted by
the target population is also vital to identify the cost-effective solutions
and formulate sustainable policy decisions.
2.4 Willingness-To-Pay (Cost-effectiveness threshold)
The patient’s or society’s willingness to pay to accept a solution for a
healthcare problem is critical in health technology assessment. Since
many years the world health organization (WHO) threshold of
USD50,000 or 1-3 GDP (gross domestic product) per capita for gain of
one QALY has been the most commonly used benchmark71. However,
a society’s true willingness-to-pay for health benefits may vary with its
healthcare budget and priorities for public health. Even within a country,
health care priorities may vary with economic settings, especially for a
private or insurance based healthcare system.

47
A clearer idea of willingness to pay of the individual or the target society
would add a lot of value to the actual translation of cost-effective
interventions in policies and practice.
2.5 Healthcare system
A country’s healthcare setup can also influence the benefits which can
be derived from an intervention. An aggressive and well executed
healthcare system would diagnose and cure the side effects or readjust
the doses timely, undermining the benefits of the preventive measures,
whereas a country’s negligent medical network can in-turn lead to
missed diagnosis and consequent adverse events/ mortalities,
increasing the benefits derived from initial preventive tests. Thus, even
for the strategy with the same clinical benefit in two countries, a
pragmatic comparative analysis of the way a healthcare system
responds to a condition and the benefits derived from a proposed
intervention are crucial to determine the actual cost-effectiveness of its
clinical translation.
For example, Warfarin is a drug with a well-established
pharmacogenomic association72 with an FDA approved drug label73 and
an online Warfarin dosing algorithm recommended by CPIC (Clinical
Pharmacogenetics Implementation Consortium)74 which stresses on the
importance of genome-based dosage optimization. Though, not denying
the therapeutic benefits of the PGx based Warfarin dosing, many recent
clinical trials have challenged the overall benefits by illustrating near

48
similar results by dosage optimization based on other clinical factors and
INR monitoring48,49. However, the study performed in the strict setup of
clinical trial is unable to capture the true effectiveness of non-
pharmacogenetic interventions as it fails to account for the
responsiveness of healthcare setups, ease of access of healthcare
facilities and availability of healthcare professionals, patient willingness
for repeated consultations and the overall expenditure due to repeated
visits, consultation and logistics as well.
2.6 Discussion
Thus, cost-effectiveness evaluation is not simply measured by
treatment-related expenses and the health benefits, but involves a
complex approach accounting for the multiple pragmatic parameters
impacting the healthcare availability, implementation and uptake. Failure
to adopt a long-range national-level perspective to cost-effectiveness is
otherwise adopting a myopic view that undermines the development of
sustainable and beneficial national healthcare strategy.
In the next three chapters we have provided three cost-effectiveness
evaluations for different healthcare problems and represent how
beneficial evidence can be generated across disease conditions and
healthcare setups.
49
Chapter 3 Cost Effectiveness Analysis of HLA-B*5701
Genotyping in Newly Diagnosed Persons Living with
HIV/AIDS in Singapore, by Ethnicity
3.1 Introduction
Highly active anti-retroviral therapy (HAART) is an extremely efficacious
three drug combination therapy, credited to progress HIV from a fatal to
a chronic disease. It includes a combination of different classes of drugs,
2 NRTI’s (Nucleoside Reverse Transcriptase Inhibitor) with usually 1
NNRTI (Non- Nucleoside Reverse Transcriptase Inhibitor) or sometimes
a PI (Protease Inhibitor). Tenofovir (TDF), currently the preferred first-
line NRTI is WHO recommended and among the most commonly
prescribed drug (with Lamivudine (3TC)/ Emtricitabine (FTC): NRTI and
Efavirenz (EFV): the NNRTI. Abacavir (ABC) and Zidovudin (AZT) are
the recommended alternatives in case of any Tenofovir related side
effects75.
Though Abacavir is currently used as an alternative 1st line drug, its
comparable in-vitro potency, good bio-availability and tolerability and no
dietary regulations76, makes it a contender for being a first-line drug.
Studies have shown Abacavir and Tenofovir efficacy to be comparable
for patients with viral load <105 copies/ml77. However, for patients with
viral load >105 copies/ml, results are disputed with one study reporting
similar but another reporting a lower efficacy than Tenofovir77,78. Also,
Abacavir combination with lamivudine is ~ 40% cheaper than similar

50
Tenofovir combination in Singapore. Though similar efficacy and lower
cost drives Abacavir as a preferred choice, one of its major drawbacks
is the Abacavir associated hypersensitivity syndrome (ABC-HSS).
Abacavir has been found to cause HSS in approximately 5% of its users’
globally. Characterized initially by general symptoms like rash, fever,
gastro-intestinal issues, constitutional problems, and respiratory
complaints, it initiates mostly within the first 6 weeks after drug
prescription and demands immediate drug cessation which can bring
improvements in symptoms as early as 48-72 hours without any
additional medication. However, with Abacavir re-challenge, the
symptoms tend to worsen and lead to life-threatening reactions or even
sudden death79,80.
Researchers have proved strong genetic association between HLA-
B*5701 allele and the occurrence of Abacavir hypersensitivity
syndrome81. Based on clinical studies proving a statistical decrease in
ABC-HSS cases driven by pre-HLA-B*5701 genetic screening, the US
Food and Drug Administration (FDA) has recommended HLA-B*5701
genetic screening in patients before initiating or re-starting Abacavir or
Abacavir-containing medication and does not recommend it in any form
to test positive patients19,81. Studies conducted in US82 and UK56 has
also concluded its cost-effectiveness. However, with difference in
population dynamics, these studies may not be aptly translated to
Singapore population.

51
The variation of HLA-B*5701 allele frequency across ethnicities governs
the incidence rate of ABC-HSS on Abacavir usage which in turn
influences the effectiveness of the HLA-B*5701 screening test in
preventing ABC-HSS cases. Variations in cost of drugs, genetic
screening tests and medical consultation, medical setup and supervision
system across countries are among other factors governing the potential
harms posed by Abacavir side effects on HIV patients in Singapore.
Thus, this study aims to analyze the cost-effectiveness of HLA-B*5701
genetic screening prior to Abacavir prescription specific to Singapore
healthcare setup. It also focuses to compare all the possible HIV
treatment regimens with Abacavir as a potential first/ second-line drug
with or without HLA-B*5701 screening to be able to weigh the possible
benefits and guide HIV treatment regimen towards a cost-effective
approach.
3.2 Methods
3.2.1 Model Structure
A decision tree model was developed in TreeAge Pro2013 (Figure 2,
Figure 3) to help evaluate the cost-effectiveness of HLA-B*5701 genetic
screening prior to Abacavir prescription separately for the three major
ethnicities in Singapore – Chinese, Malays and Indians. As HIV patients
diagnosed at different disease stages have significant variation in life
expectancies, separate models were developed for patients diagnosed
with early stage HIV and late stage HIV/ AIDS with a further
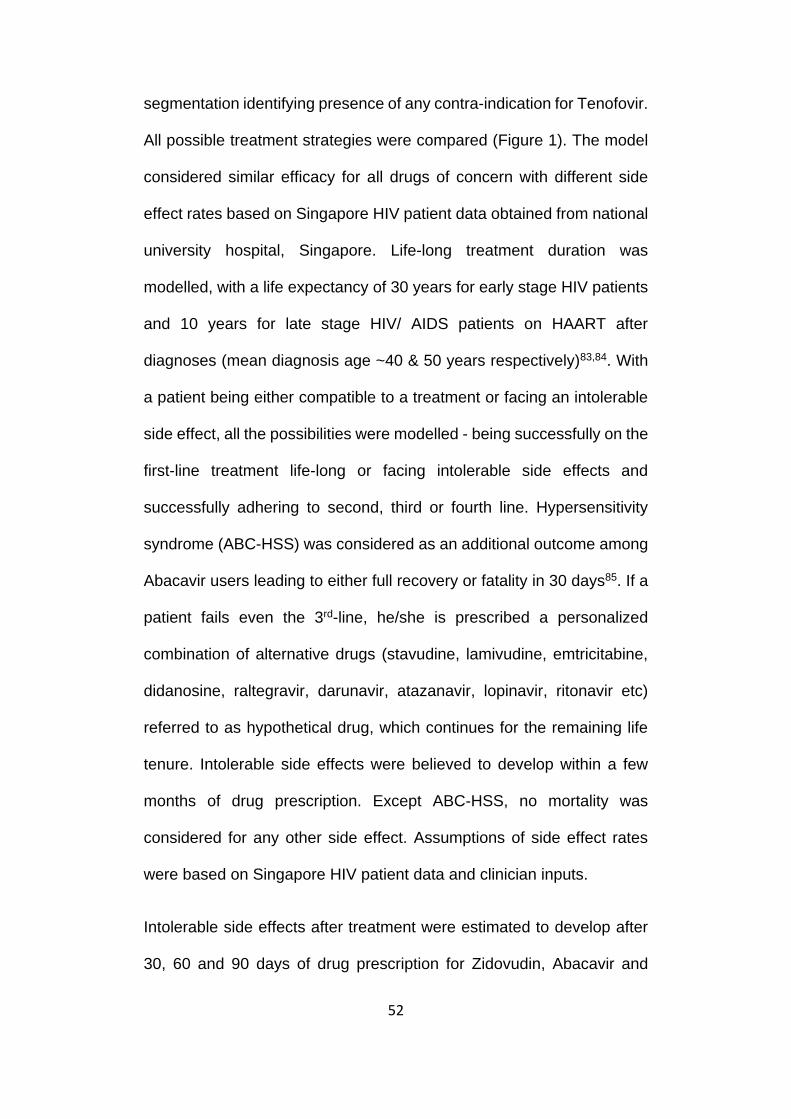
52
segmentation identifying presence of any contra-indication for Tenofovir.
All possible treatment strategies were compared (Figure 1). The model
considered similar efficacy for all drugs of concern with different side
effect rates based on Singapore HIV patient data obtained from national
university hospital, Singapore. Life-long treatment duration was
modelled, with a life expectancy of 30 years for early stage HIV patients
and 10 years for late stage HIV/ AIDS patients on HAART after
diagnoses (mean diagnosis age ~40 & 50 years respectively)83,84. With
a patient being either compatible to a treatment or facing an intolerable
side effect, all the possibilities were modelled - being successfully on the
first-line treatment life-long or facing intolerable side effects and
successfully adhering to second, third or fourth line. Hypersensitivity
syndrome (ABC-HSS) was considered as an additional outcome among
Abacavir users leading to either full recovery or fatality in 30 days85. If a
patient fails even the 3rd-line, he/she is prescribed a personalized
combination of alternative drugs (stavudine, lamivudine, emtricitabine,
didanosine, raltegravir, darunavir, atazanavir, lopinavir, ritonavir etc)
referred to as hypothetical drug, which continues for the remaining life
tenure. Intolerable side effects were believed to develop within a few
months of drug prescription. Except ABC-HSS, no mortality was
considered for any other side effect. Assumptions of side effect rates
were based on Singapore HIV patient data and clinician inputs.
Intolerable side effects after treatment were estimated to develop after
30, 60 and 90 days of drug prescription for Zidovudin, Abacavir and

53
Tenofovir respectively with patients being immediately switched to the
alternative treatment with the appropriate decrease in quality-of-life.
Attributed to the rigorous follow-ups for HIV patients in Singapore,
patients are expected to be diagnosed with side effects and switched to
alternative even before they experience any substantial health
complication. The major side effect considered were renal dysfunction
and anemia for TDF and AZT respectively, which would add two
additional diagnostic medical tests for these health conditions.
Figure 1. Possible treatment therapies considered for the HIV patient subgroups28
The HIV patients contra-indicated to Tenofovir are considered to be prescribed on only one treatment regimen whereas the patients who are eligible for both Abacavir and Tenofovir can be prescribed one of two possible treatment regimen. Each regimen further considers Abacavir prescription with or without HLA-B*5701 genotyping as different strategies, which are compared for their cost and effectiveness. Abbreviations used are: ABC = Abacavir, TDF = Tenofovir, AZT = Zidovudine, Hyp. Drug = hypothetical drug

54
A sensitivity analysis was conducted to determine the robustness of the
model. The impact of individual variable variation was analyzed using a
one-way sensitivity analysis, whereas a probabilistic sensitivity analysis
was done to understand impact of simultaneous variations. Gamma and
beta distributions was assigned to costs and probability/ utility variables
respectively, except for the probability of other side effects by Abacavir,
progression of early stage HIV to late stage and duration of mortality
after ABC-HSS, which were assigned triangular distributions.
3.2.2 Model Inputs
All inputs variables and sensitivity ranges are shown in Table 1.
Treatment duration
Referencing a Singapore study for the age at diagnoses for early and
late stage HIV patients from 1996 to 2009 and with the help of HIV
statistics data from ministry of health, Singapore, the average age for a
patient diagnosed with early/ late stage HIV can be estimated to be ~40
years / 50 years respectively83,84. Benchmarking with published studies
reporting average life expectancy86, the treatment duration was
calculated to be 30 years and 10 years for early and late stage patients
respectively.

55
Figure 2. Decision tree model for newly diagnosed HIV patients in Singapore who are contra-indicated to Tenofovir28
HIV patients contra-indicated to Tenofovir were modelled for two possible side effects: 1) No HLA-B*5701 genetic testing and assigning Abacavir-based ART to everyone; 2) HLA-B*5701 genotyping and assigning Abacavir-based ART to test negative and Zidovudine-based ART to test positive patients. Three possible outcomes were assigned accordingly: 1) Development of intolerable side effects which leads to treatment switching. Patients on Abacavir based ART are switched to Zidovudine based ART followed by hypothetical drug in case of side effects; 2) No intolerable side effects in which case long term treatment is continued for the entire life tenure; 3) Development of Abacavir induced hypersensitivity which in turn has two possible outcomes – mortality or treatment switch. Abbreviations- ABC: Abacavir, TDF: Tenofovir, AZT: Zidovudine, SE: Side effects: Hypo. Drug: Hypothetical drug, ART: Anti-retroviral treatment, ABC-HSR: Abacavir hypersensitivity syndrome

56
Figure 3. Decision tree model of the treatment strategy for newly diagnosed HIV patients in Singapore who can be prescribed Tenofovir or Abacavir28
HIV patients who can be prescribed ABC or TDF were modelled for three possible strategies: 1) HLA-B*5701 genetic testing and TDF-based ART to test positive and ABC based ART to test negative 2) No HLA-B*5701 genetic testing and ABC-based ART to everyone; 3) TDF-based ART to everyone. Three possible outcomes were

57
assigned accordingly: 1) Development of intolerable side effects which leads to treatment switching; 2) No intolerable side effects in which case long term treatment is continued for the entire life tenure; 3) Diagnosis of Abacavir induced hypersensitivity which in turn can lead to – mortality or treatment switch. Also in 3rd strategy, intolerable side effect can be followed by Abacavir prescription with/ without genotyping. ABC and TDF based ART are the potential first or second line option followed by AZT-based ART and hypothetical drug being the last choice. Abbreviations - ABC: Abacavir, TDF: Tenofovir, AZT: Zidovudine, SE: Side effects: Hypo. Drug: Hypothetical drug, ART: Anti-retroviral treatment, ABC-HSS: Abacavir hypersensitivity syndrome
PPV of HLA-B*5701 genotyping
PREDICT-1 clinical trial reports HLA-B*5701 genetic screening test to
have 45.5% sensitivity and 97.6% specificity and a positive predictive
value (PPV) of 61.2% (46.2–74.8%) and Negative Predictive Value
(NPV) of 95.5% (93.3-96.7%) for clinically suspected cases19. The
cohort consisted of predominantly white population but had representing
patients from other races (African/ Arabic/ others) as well. Though the
HLA-B*5701 genetic screening test is expected to show similar
sensitivity and specificity in Singapore population but the lower allele
frequency and hence lower ABC-HSS incidence rates in Asian than
white population might lead to slightly different PPV and NPV values for
the HLA-B*5701 genetic screening. However, due to lack of availability
of local side effect data, the values reported by Predict-1 trial have been
considered for the study with the impact of variable uncertainty being
evaluated using sensitivity analysis.

58
Cost
The cost for concerned drugs and medical tests were taken from the
National University hospital (NUH) pharmacy and facilities. The
hypothetical drug cost was a weighted average of the several commonly
used alternative drug combinations in NUH. As Singapore has very few
cases of ABC-HSS being diagnosed and no fatal cases has been
reported in the near past, an approximate cost data for ABC-HSS cases
reported in a similar study in US27 has been considered. Every
intolerable side effect is expected to increase 3 consultation visits on an
average for the patient for initial diagnosis and follow-ups. The baseline
costs similar in all strategies (like regular medical checkup costs etc.)
have been ignored and only the cost varying across treatment strategies
have been considered. For ease of exposition all the cost values have
been converted to equivalent cost in US dollars using the exchange rate
of 1.26 SGD to 1 USD in January 2014.
Utility/ Quality of life
Published quality of life (QoL) values have been taken for early and late
stage HIV patients87. The decrements in QoL due to ABC-HSS has been
taken as 0.08 for 3 days for mild HSS88, 0.15 for 7 days for severe HSS89,
0.36 for 15 days for fatal HSS90 (Figure 4). Weighted average decrement
in QoL by ABC-HSS severity has been used for the analysis. Any
intolerable side effect due to TDF or AZT was assumed to cause a
quality-of-life decrement equivalent to mild ABC-HSS. An average early

59
stage HIV patient on has been considered to progress to late stage HIV
after 25 years with the related decrease in quality of life. No gradual
decrement in QoL due to ageing or long-term adherence to the treatment
or any other factor has been considered.
Probabilities
The probabilities of development of intolerable side effects have been
taken as per Singapore HIV data. The side effect rate has been assumed
to be independent of the line of therapy and patient disease stage. Also,
Figure 4. The decrement in utility values due to occurrence of side effect or ABC-HSS28
Perfect health has a utility value of 1. The drop-in utility due to HIV disease stage is throughout the life tenure. However, side effects and ABC-HSS cause a temporary drop in utility which goes back to initial after the SE is successfully treated.

60
only the intolerable side effects occurring in a span of 1-3 months after
drug prescription have been considered. Patients are assumed to be
adherent to the treatment. Although Singapore has not reported any
ABC-HSS related death in the recent past, a 0.7% mortality rate among
ABC-HSS cases has been assumed based on a medical review study91.
Table 1. Model Inputs
Variable Base case Sensitivity
Range Source
Costs (USD)
ABC + lamivudine (monthly) 174 63.2-347.6
NUH pharmacy
TDF + lamivudine (monthly) 296 102-592
AZT + lamivudine (monthly) 132 79-264
EFV (monthly) 79 55-158
Hypothetical drug (monthly) 408 180-824
Clinician consultation 85 42.5-170
HLA-B*5701 genetic test 277 139-554
ABC-HSS cases treatment 1580 790- 3160
Other Intolerable side effects on ABC 32 16-64
Fatal ABC-HSS 31,600 15,800-63,200
Schackman et al.82
TDF intolerable side effects 66 33-132
AZT intolerable side effects 32 16-64
Renal panel & urine analysis 33 16.5-66 NUH
Probabilities
Severity of ABC-HSS
Mild 0.585 Yeni et al.92
Severe, nonfatal 0.408
Fatal 0.007
Yeni et al.92
Hetherington et al.91
Intolerable SE on Tenofovir 6% 3-12% Singapore public hospital data
Intolerable SE on Abacavir 0% 0-5%
Intolerable SE on Zidovudin 24% 12-48%
Mortality among ABC-HSS 0.70% 0-1.4% Hetherington et al.91
HLA-B*5701 genotyping

61
Population frequency
Chinese 1.10% 0.55-2.2% Singapore Genome Variation Project93,94
Malays 1.80% 0.9-3.6%
Indians 6.30% 3.2-12.6%
PPV 61.20% 46.2-74.8% Mallal et al.19
NPV 95.50% 93.3-96.7%
QoL/ utility
Early stage HIV patient 0.781 0.616-0.946 Kauf TL et al.87
Late stage HIV/ AIDS patient 0.746 0.572-0.92
QoL decrements due to side effects
Mild HSS 0.08
(for 3 days) Dodek et al.88
Severe HSS 0.15
(for 7 days) Pepper et al.89
Fatal HSS 0.36
(for 15 days) 2.7 – 10.8 Freedberg et al.90
Avg. QoL decrement for ABC HSS cases (except fatal cases) 0.57 0.24 – 1.05
Other side effects 0.08
(for 3 days) 0 – 0.48 Similar to mild HSS
Abbreviations - ABC: Abacavir, TDF: Tenofovir, AZT: Zidovudine, SE: Side effects: Hypo. Drug: Hypothetical drug, ART: Anti-retroviral treatment, ABC-HSS: Abacavir hypersensitivity, NPV: Negative predictive value, PPV: Positive predictive value
3.3 Results
Based on the commonly cited Incremental cost effectiveness ratio
(ICER) threshold of USD 50,000, HLA-B*5701 genotyping before
Abacavir prescription was not found to be cost-effective for
Singaporean Chinese and Malay HIV patients in both patient
segments irrespective of disease stage. Among Singaporean Indians,
it was found to be cost-effective for early stage HIV patients contra-
indicated to TDF, but not cost-effective for all other segments (Table
2, Table 3). Considering Abacavir-based ART without pre HLA-B*5701
genetic screening (the cheapest treatment strategy) as 1st line, a
comparison with the current prevalent practice in Singapore (TDF-based

62
ART as 1st line followed with ABC-based ART) was made for the early stage
patients who can be prescribed both ABC or TDF. The current practice was
found to be not cost-effective with an ICER of USD 3-6x10⁶/QALY as
compared to the cheapest strategy. Similar results were found for late stage
patients as well (Table 4).
3.3.1 Sensitivity Analysis
Among HIV patients who can be prescribed both ABC and TDF, ABC-
HSS mortality rate was found to be significant for determination of cost-
effectiveness (Figure 5). Among Chinese patients, a mortality rate of
greater than 6.4% for early stage and 13.9% for late stage patient
renders genotyping cost-effective. Similar figures for Malay and Indian
patients were 3.2% / 9.3% and 4.9%/ 3.3% respectively for early/ late
stage patients. For patients who are contra-indicated to Tenofovir, the
mortality rate was again an important parameter with the values being
3.7%/ 10.9% for Chinese, 2.3% / 6.5% for Malay and 0.67% / 1.6% for
Indian early/ late stage patients.
To generalize the results across ethnicities in Singapore, the collective
impact of the two population specific variables - PPV and HLA-B*5701
frequency, were analyzed. Genotyping was found not to be cost-
effective below an allele frequency of 3% for early stage patients and 6%
for late stage patients at any PPV value, irrespective of their contra-
indication to Tenofovir (Figure 6).

63
The probabilistic sensitivity analysis reveals that at USD 50,000/QALY,
genotyping is cost-effective in ~44% of the iterations for Indian HIV
patients contra-indicated to TDF. However, for all the other ethnicities
and patient groups, ABC- based ART as first line with prescription
without HLA-B*5701 genotyping is the most cost-effective strategy for
majority of iterations (Figure 7).
Table 2. Cost effectiveness of HIV treatment strategies for newly diagnosed early and late stage HIV patients contra-indicated to Tenofovir
Strategy Cost Costs QALY's
QALY's
ICER (USD/ QALY)
EARLY-STAGE PATIENTS
Chinese
No Genetic Testing 91167.1 23.2466
HLA-B*5701 Testing 91444.38 277.28 23.2477 0.0011 2,52,350
Malays
No Genetic Testing 91179.42 23.2460
HLA-B*5701 Testing 91457.2 277.78 23.2478 0.0018 1,54,490
Indians
No Genetic Testing 91258.65 23.2418
HLA-B*5701 Testing 91539.63 280.98 23.2481 0.0063 44,649
LATE-STAGE PATIENTS
Chinese
No Genetic Testing 30,449 7.457286
HLA-B*5701 Testing 30,718 269 7.457641 0.0004 757,270
Malays
No Genetic Testing 30,458 7.457076
HLA-B*5701 Testing 30,722 264 7.457656 0.0006 454,223
Indians
No Genetic Testing 30,515 7.455724
HLA-B*5701 Testing 30,746 232 7.457757 0.0020 114,068
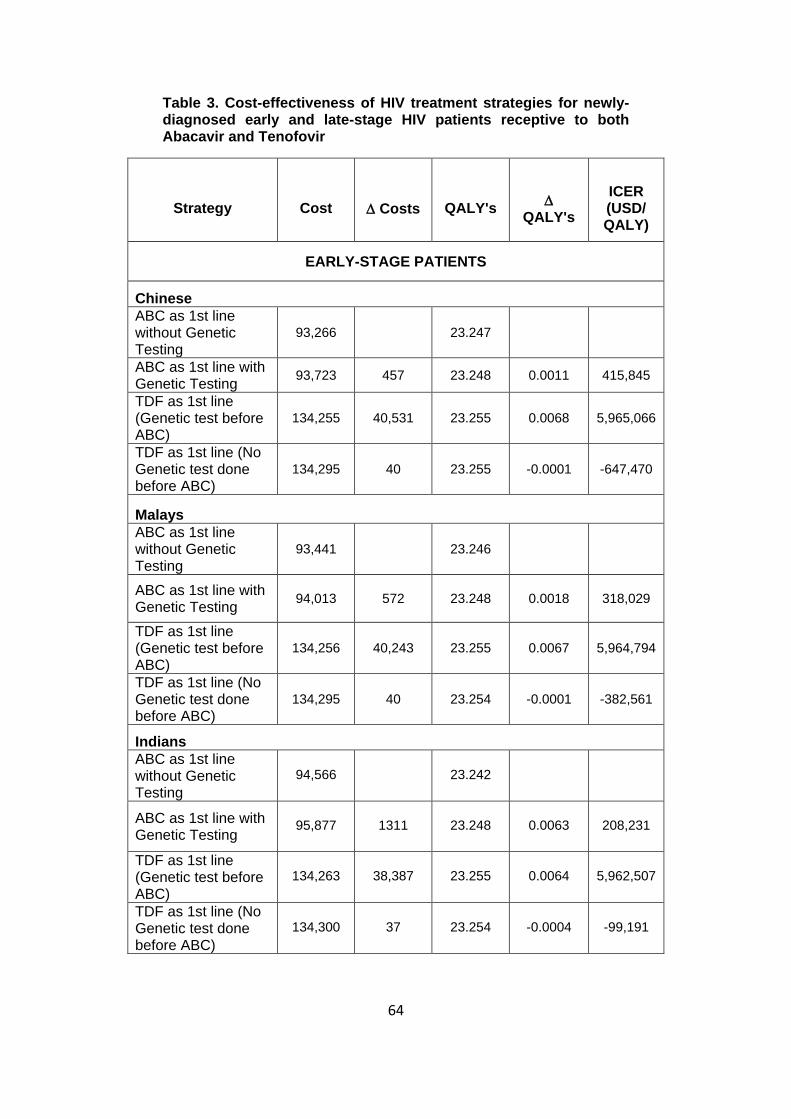
64
Table 3. Cost-effectiveness of HIV treatment strategies for newly-diagnosed early and late-stage HIV patients receptive to both Abacavir and Tenofovir
Strategy Cost Costs QALY's
QALY's
ICER (USD/ QALY)
EARLY-STAGE PATIENTS
Chinese
ABC as 1st line without Genetic Testing
93,266 23.247
ABC as 1st line with Genetic Testing
93,723 457 23.248 0.0011 415,845
TDF as 1st line (Genetic test before ABC)
134,255 40,531 23.255 0.0068 5,965,066
TDF as 1st line (No Genetic test done before ABC)
134,295 40 23.255 -0.0001 -647,470
Malays
ABC as 1st line without Genetic Testing
93,441 23.246
ABC as 1st line with Genetic Testing
94,013 572 23.248 0.0018 318,029
TDF as 1st line (Genetic test before ABC)
134,256 40,243 23.255 0.0067 5,964,794
TDF as 1st line (No Genetic test done before ABC)
134,295 40 23.254 -0.0001 -382,561
Indians
ABC as 1st line without Genetic Testing
94,566 23.242
ABC as 1st line with Genetic Testing
95,877 1311 23.248 0.0063 208,231
TDF as 1st line (Genetic test before ABC)
134,263 38,387 23.255 0.0064 5,962,507
TDF as 1st line (No Genetic test done before ABC)
134,300 37 23.254 -0.0004 -99,191
65
LATE-STAGE PATIENTS
Chinese
ABC as 1st line without Genetic Testing
31,143 7.457
ABC as 1st line with Genetic Testing
31,472 329 7.458 0.0004 926,938
TDF as 1st line (Genetic test before ABC)
44,748 13,275 7.460 0.0022 6,162,560
TDF as 1st line (No Genetic test done before ABC)
44,764 13,291 7.460 0.0022 6,120,953
Malays
ABC as 1st line without Genetic Testing
31,205 7.457
ABC as 1st line with Genetic Testing
31,568 363 7.458 0.0006 624,297
TDF as 1st line (Genetic test before ABC)
44,748 13,180 7.460 0.0021 6,200,514
TDF as 1st line (No Genetic test done before ABC)
44,764 13,196 7.460 0.0022 6,120,100
Indians
ABC as 1st line without Genetic Testing
31,607 7.456
ABC as 1st line with Genetic Testing
32,186 579 7.458 0.0020 284,598
TDF as 1st line (Genetic test before ABC)
44,752 12,565 7.460 0.0019 6,471,208
TDF as 1st line (No Genetic test done before ABC)
44,765 12,579 7.460 0.0021 6,114,310

66
Table 4. Cost-effectiveness of HIV treatment strategies- Tenofovir as first line (current practice) with ABC as first line (cheapest strategy) for newly-diagnosed HIV patients receptive to both Abacavir and Tenofovir
Strategy Cost Costs QALY's
QALY's
ICER (USD/ QALY)
EARLY-STAGE PATIENTS
Chinese
ABC as 1st line without Genetic Screening
93,266 23.24663
TDF as 1st line (No genetic test before ABC if SE develops)
134,295 41,028 23.25446 0.0078 5,237,899
Malays
ABC as 1st line without Genetic Screening
93,441 23.24598
TDF as 1st line (No genetic test before ABC if SE develops)
134,295 40,854 23.25442 0.0084 4,839,405
Indians
ABC as 1st line without Genetic Screening
94,566 23.24181
TDF as 1st line (No genetic test before ABC if SE develops)
134,300 39,734 23.25418 0.0124 3,213,980
LATE-STAGE PATIENTS
Chinese
ABC as 1st line without Genetic Screening
31,607 7.455733
TDF as 1st line (No genetic test before ABC if SE develops)
44,752 13,144 7.459710 0.0040 3,305,059
Malays
ABC as 1st line without Genetic Screening
31,205 7.457082
TDF as 1st line (No genetic test before ABC if SE develops)
44,748 13,543 7.459789 0.0027 5,002,848
Indians
ABC as 1st line without Genetic Screening
31,143 7.457292

67
TDF as 1st line (No genetic test before ABC if SE develops)
44,748 13,605 7.459801 0.0025 5,422,356
QALY: Quality adjusted life-years; ICER: Incremental cost-effectiveness ratio (USD/QALY); ABC = Abacavir; TDF = Tenofovir
Figure 5. Sensitivity analysis for early stage Chinese patients receptive to both Abacavir and Tenofovir28
One-way sensitivity analysis (Tornado analysis) of independent variables evaluates the influence of their uncertainty on incremental cost-effectiveness ratio (ICER) of the HLA-B*5701 genotyping strategy in comparison to baseline strategy (Abacavir as 1st line without genotyping). The variables dependent on other variable(s) are not shown. Minus sign at the left side of the bar indicate ICER decrease when variable increases. Abbreviations used are: ABC = Abacavir, TDF = Tenofovir, AZT = Zidovudine, 3TC = lamivudine, SE = side effects, ABC-HSS = Abacavir hypersensitivity syndrome.

68
3.4 Discussion
HLA-B*5701 genetic screening prior to Abacavir prescription though
significantly reduces the incidence of ABC-HSS; the cost-effectiveness
of genotyping varies across ethnicities and healthcare setups. In
Singapore healthcare setup, among early stage patients, genotyping has
been found cost-effective only for patients of Indian ethnicity who are
Figure 6. Sensitivity analysis of cost-effectiveness to variation in PPV and HLA-B*5701 frequency in early stage HIV patients28
(A) Two-way sensitivity analysis to analyze the combined effect of positive prediction value (PPV) of the HLA-B*5701 genotyping and population HLA-B*5701 frequency on the incremental cost-effectiveness ratio (ICER) of the genotyping strategy. Only the cost-effective strategy is shown in the figure. Genetic screening prior to Abacavir prescription is found to be not cost-effective for ethnicities with allele frequency lower than 3%. For allele frequencies higher than 3%, a very high PPV value (>85%) is required to render genotyping cost-effective (B) One-way sensitivity analysis of the influence of positive prediction value (PPV) of HLA-B*5701 genetic screening on the Incremental cost-effectiveness ratio (ICER) of the genotyping strategy, for an early-stage HIV patient receptive to both Abacavir and Tenofovir. A strategy is considered cost-effective for an ICER≤ $50,000/QALY. For this patient group, HLA-B*5701 genotyping before Abacavir prescription was found to be not cost-effective for Chinese and Malay patients. For Indian patients, a PPV > 91.5% was required to achieve cost-effectiveness. Abbreviations used are: ABC = Abacavir, TDF = Tenofovir

69
contra-indicated to TDF. This can be attributed to the high allele
frequency among Indians, which increases the risk of ABC-HSS and
the long-time treatment among early stage patient where avoiding ABC-
HSS saves many QALYs. Among other ethnicity patients, though the
QALY’s saved are similar, the low prevalence of the risk allele lowers the
overall benefit of genotyping. A high cost of alternative drug (TDF) for
early stage patients who are receptive for both ABC and TDF mitigates
the benefits of ABC-HSS prevention by genotyping, rendering the
Figure 7. Cost effectiveness acceptability curve for early-stage Chinese HIV patient receptive to both Abacavir and Tenofovir28
Cost effectiveness acceptability curves from probabilistic sensitivity analysis (PSA) represent the number of iterations for which the genotyping strategy is cost-effective for various willingness to pay values. For early stage HIV patients of Chinese ethnicity, Abacavir without genetic screening was found to be cost-effective for 91% of the iterations, whereas Abacavir with genetic screening was not found to be cost-effective at all (0% iterations). Abbreviations used are: ABC = Abacavir, TDF = Tenofovir, SE = Side effect

70
strategy not-cost-effective for all. Among the late stage HIV patients, as
the life expectancy is low, the overall benefit of preventing ABC-HSS
further diminishes, making it not cost-effective for all late stage patients
irrespective of ethnicity or TDF contra-indication. Thus, the study does
not recommend the policy makers to subsidize HLA-B*5710 test for HIV
patients in Singapore except for Indian HIV patients.
The present study has a few limitations. The study assumes no co-
infections or other death causes among HIV patients as modelling the
complexity of treatment and disease outcomes in such cases was
beyond the scope of this study. We assume perfect patient compliance
leading to absolute treatment compatibility throughout the modelled
duration and that no drug resistance to develop on long-term treatment.
With limited Abacavir usage and almost no ABC-HSS related mortality
observed in Singapore, relevant local data was unavailable, and
literature based assumptions have been made. All drugs are assumed
to have similar efficacy.
With limited government subsidies for HIV drugs in Singapore and an
expensive life-long treatment, costs is of extreme importance to the
patients and their families. Abacavir - a cheap, efficacious and safe
alternative for majority of Singaporean patients can immensely help to
achieve considerable cost-savings for the patient and their families. As
currently the possibility of a side effect and the FDA recommendation of
an expensive HLA-B*5701 screening before Abacavir raises many

71
questions in the minds of clinicians and patients alike, this study
highlights that unlike Caucasians, the risk of ABC-HSS is very low for
two of the three ethnicities in Singapore, and that the expensive
genotyping test is not cost-effective in Singapore, except for a subset of
early stage Indian patients who are contra-indicated to Tenofovir. In
addition, Singapore’s excellent healthcare system further mitigates the
benefits of prior genotyping by providing a strong framework for quick
diagnosis. Thus, except for early stage Indian HIV patients, Abacavir as
a first-line without genotyping appears to be the most cost-effective
strategy for all other HIV patients in Singapore.
72
Chapter 4 Cost-Effectiveness Analysis for including a Serum-
microRNA Biomarker Panel as a Screen before
Endoscopy, for Detection of Gastric Cancer among
High Risk Patients in Singapore
4.1 Introduction
Gastric Cancer is among the top four cancers by prevalence and the
third leading cause of death worldwide. Starting from the inner lining of
the stomach, with no symptoms in the early stages, the cancer silently
progresses across the stomach walls and/or to the other organs.
However, with advancement in medical science, highly efficacious
treatments have been developed for treatment of early stage gastric
cancer, late presentation in the clinic due to delayed manifestation of
symptoms and limited treatment success in advanced stages is the
biggest challenge in its successful treatment.
The world witnessed almost 1 million gastric cancer cases in 2012 with
0.7 million deaths every year due to this malignancy95. Although both
genders have distressing incidence rates, males are at double the risk
than females. Highest incidence of gastric cancer is reported in Eastern
Asia, Latin America and the Caribbean with majority of cases globally
happening in China alone (42%). The Republic of Korea had the highest
risk of gastric cancer in 2012, followed by Mongolia and Japan with an
age-standardized incidence rate of 41.8, 32.5 and 29.9 per 100,000
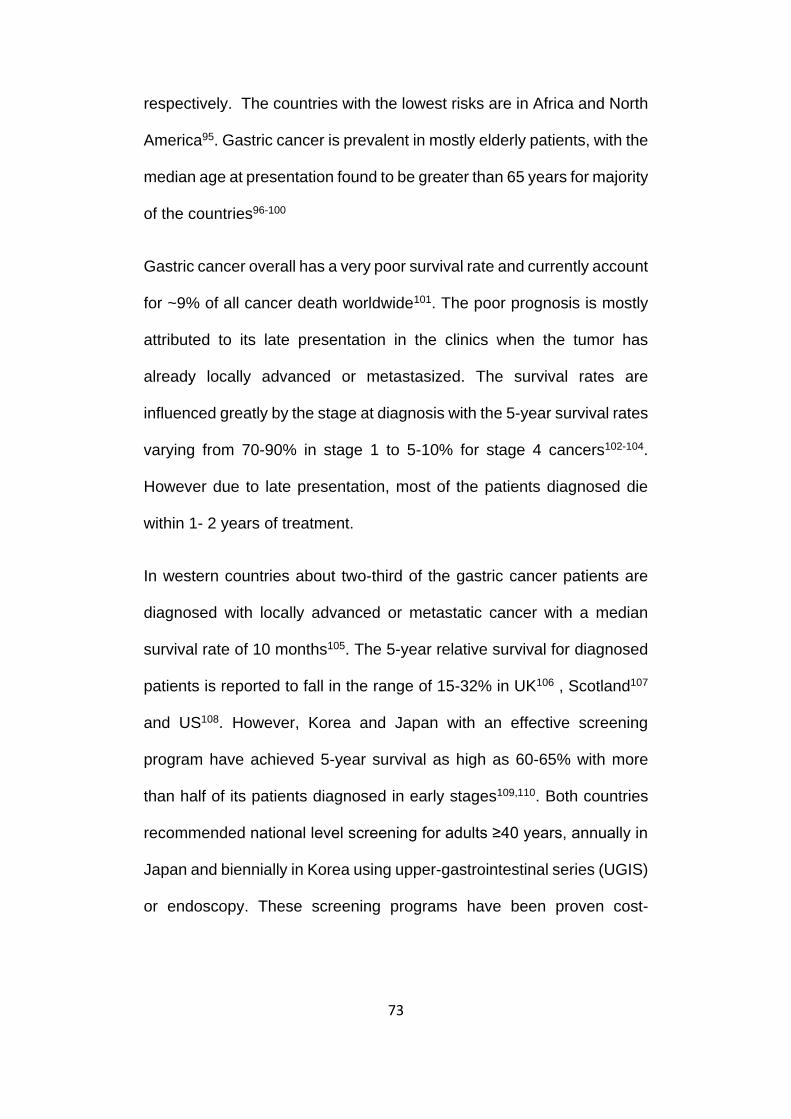
73
respectively. The countries with the lowest risks are in Africa and North
America95. Gastric cancer is prevalent in mostly elderly patients, with the
median age at presentation found to be greater than 65 years for majority
of the countries96-100
Gastric cancer overall has a very poor survival rate and currently account
for ~9% of all cancer death worldwide101. The poor prognosis is mostly
attributed to its late presentation in the clinics when the tumor has
already locally advanced or metastasized. The survival rates are
influenced greatly by the stage at diagnosis with the 5-year survival rates
varying from 70-90% in stage 1 to 5-10% for stage 4 cancers102-104.
However due to late presentation, most of the patients diagnosed die
within 1- 2 years of treatment.
In western countries about two-third of the gastric cancer patients are
diagnosed with locally advanced or metastatic cancer with a median
survival rate of 10 months105. The 5-year relative survival for diagnosed
patients is reported to fall in the range of 15-32% in UK106 , Scotland107
and US108. However, Korea and Japan with an effective screening
program have achieved 5-year survival as high as 60-65% with more
than half of its patients diagnosed in early stages109,110. Both countries
recommended national level screening for adults ≥40 years, annually in
Japan and biennially in Korea using upper-gastrointestinal series (UGIS)
or endoscopy. These screening programs have been proven cost-

74
effective and have resulted in significant health benefits in these high-
incidence countries2,103.
Endoscopy and upper-gastrointestinal series (UGIS) are the two major
modalities for gastric cancer screening. In endoscopy, a thin flexible
lighted tube with a small video camera on the end is passed into the
stomach through the throat and helps in direct visualization of the gastric
mucosa. In the case of abnormal areas, samples can be collected using
the endoscope and sent for biopsy. Endoscopic ultrasound using a small
transducer attached on the endoscope tip helps doctors take a closer
look at the layers of the stomach wall and nearby lymph nodes to study
the suspicious area more closely and obtain biopsy samples. However,
UGIS is an x-ray technique to look at the inner lining of the esophagus,
stomach and first part of the small intestine. It includes the patient
drinking a barium solution, which lines the stomach, esophagus and
small intestine. As x-rays cannot pass through the barium lining, the
images obtained would outline any abnormalities of the lining of these
organs. A double-contrast technique, which involves pumping air using
a thin tube passed into the stomach, makes barium coating very thin to
help in diagnosis of even small abnormalities common in early gastric
cancer. Although, both these techniques are commonly used for
screening, endoscopy is the gold standard. It has good accuracy and is
also the follow up diagnosis test for suspicious cancer cases identified
through UGIS. But because of the invasive procedure and high cost of
endoscope, there are concerns about patent willingness limiting its

75
outreach as a screening tool. A compliance rate as low as ~30% has
been observed for endoscopic screening in national screening programs
even in high incidence country like Korea111.
4.1.1 Gastric Cancer statistics in Singapore
Singapore being a multi-racial country comprises of Chinese, Malay and
Indian ethnicities as its majority of residents. With a 5.4 million
population, Singapore witnesses an overall gastric cancer incidence rate
of 10 per 100,000 residents. However, the risk is seen to rise sharply
above the age of 50 years, with an incidence rate as high as 60 to 160
per 100,000 for residents aged 65 to 75 years (Figure 8). Chinese, which
comprise ~ 75% of Singapore’s population, are at the highest risk among
the ethnicities, accounting for 90% of the total gastric cancer burden of
the country. Basic Singapore-specific gastric cancer statistics are
presented in Table 5.
Table 5. Gastric Cancer Statistics for Singapore (Singapore Cancer Registry Committee 2015)112
Incidence Data
(2008-2012)
Males Females Total
ASR RR ASR RR ASR RR
All residents
11.9 - 7.1 - 9.2 -
Chinese 13.3 1.0 7.7 1.0 10.2 1.0
Malay 4.5 0.4
(0.3-0.5) 4.0
0.5 (0.4-0.7)
4.3 0.4
(0.3-0.5)
Indian 8.3 0.6
(0.5-0.8) 3.9
0.5 (0.4-0.7)
6.1 0.6
(0.5-0.7)
ASR: age standardized incidence rate; RR: relative risk

76
Although the 5-year survival rates for gastric cancer in Singapore is
among the best in the world (5-year survival by stages 1:2:3:4::
90%:70%:40%:10%), the overall survival among cancer patients
continues to be poor due to the diagnosis of patients at advanced stages.
With 320 deaths every year, gastric cancer is among the top five causes
of cancer associated deaths98, raising concerns about the need for
strategies to encourage early diagnosis.
Figure 8. Age Specific Incidence rate of Gastric Cancer in Singapore (2008-2012)
(Singapore Cancer Registry Committee 2015)98
Although population level screening in Korea and Japan has led to
significant health benefits with proven cost-effectiveness, its replication
in Singapore with a low to intermediate gastric cancer risk profile may
appear to be unnecessary and an additional cost burden. With half of the
population >40 years, 5500-6000 persons would need to be screened to

77
identify just one case of gastric cancer creating immense economic
burden and enormous stress on the healthcare service setup. Thus, with
an aim to achieve early diagnosis, currently clinicians in Singapore
recommend endoscopic screening to the patients presenting in the
specialist/ hospital clinics with any form of persistent gastric distress
especially for Chinese patients.
Even though endoscopic screening in this high-risk patient group has
improved the cancer diagnosis in Singapore, there are many challenges
yet to overcome. Firstly, this still leads to an immense cost burden as
the absolute incidence remains low and many negative endoscopies are
being done. Although the cancer incidence in the hospital-clinic patient
group for Singaporean Chinese patients is more than 30 times higher
than the population incidence overall (0.7% vs. 0.01% respectively), the
absolute value of incidence remains low, implying that majority of
endoscopies are still being done on non-cancer cases. Currently only 1
in 150 patients being screened in this high-risk group are diagnosed with
cancer which leads to an estimated expenditure of ~ SGD100,000 on
endoscopy alone to identify just one gastric cancer case. Secondly, most
of the cancers diagnosed in this target group are already at advanced
stages. About >80% of cancer cases diagnosed in hospital-clinics are
already stage 2 or higher with ~20% of cases being terminal cancers.
With most of the patients presenting in hospital-clinics with some
symptoms and the poor outcomes associated with late stage cancers,
the potential benefits from the abovementioned intervention are

78
fundamentally limited. Thirdly, endoscopy is an invasive and costly
procedure limiting patient’s willingness and adherence for follow up
procedures. Even though local studies have proved cost-effectiveness
of endoscopic screening in intermediate risk population group in
Singapore, the implementation has been restricted, potentially due to
budgetary impacts and concerns about patients’ willingness.
With these challenges, scientists are focusing on cheaper and more
efficient screening methods to achieve patient risk stratification cost-
effectively and in a patient-friendly manner. There have been multiple
efforts with methodologies like nano-array analysis of breath
composition for VOC’s (volatile organic compounds)113 and microarray
analysis of microRNA (miRNA) samples in blood, to name a few to
achieve this aforementioned goal.
miRNA are small non-coding RNAs that regulate gene-expression post-
transcriptionally. Altered miRNA expressions are suspected in the
pathogenesis of many diseases including cancers with research
correlating their presence in body fluids (serum, plasma etc) with disease
onset and progression. The scientists in Singapore have successfully
developed and validated a miRNA panel specific to gastric cancer, which
can be utilized as a minimally invasive biomarker panel for detection of
gastric cancer. Using a case-cohort study model, the novel miRNA panel
has been formulated in a large Singapore Chinese study cohort and
validated blindly in two independent cohorts: a Korean and a Singapore

79
cohort. With favorable results, a novel microRNA biomarker panel has
been designed, which would help to stratify patients based on their
cancer risks and achieve an efficiently targeted population for
endoscopic screening, reducing the false endoscopies without
compromising substantially on the diagnosis accuracy. In addition, this
simple blood test with the merit of its non-invasiveness is believed to
improve the follow-up adherence and further enhance the overall
diagnosis accuracy.
Thus, this study aims to analyze the cost-effectiveness of implementing
the newly developed miRNA biomarker panel as a screen before
endoscopy in the current framework of Singapore’s hospital-clinic setting
and evaluate the potential cost-savings. Further, with an aim to enhance
gastric cancer diagnosis strategies through mass screenings, we also
evaluate the performance of translating miRNA panel for population
screening of intermediate risk population cohort in Singapore (Chinese
male, age 50-69 years) and analyze benefits achieved through an
enhanced coverage and its cost-implications. Furthermore, we also
explore the cost-effectiveness of translating miRNA-based strategy in
high-risk country setup by replicating the analysis for existing national
screening program for gastric cancer in Korea.

80
4.2 Methods
4.2.1 Target Population:
The study analyses the translation of miRNA blood test for gastric cancer
screening in the following scenarios:
Patients at specialist hospital-clinic in Singapore: This subgroup consists
of patients who visit the hospital clinic with gastric distress and are
screened using endoscopy as per the current practice. The annual
incidence of gastric cancer in this group is >30 times the population
incidence98, making it a favorable high-risk group for screening.
Singaporean Chinese aged 50-69 years: Chinese ethnicity carries 90%
of gastric cancer disease burden in Singapore with males at a 30%
higher risk of gastric cancer than females112. With the cancer incidence
rising sharply after the age of 50 years, this subgroup with intermediate
gastric cancer risk has a 4 times higher annual incidence rate than the
general population98.
National screening program for gastric cancer in Korea: With gastric
cancer among the top 2 most prevalent cancers in Korea114, currently
screening is recommended for adults ≥40 years under the national
screening program for cancer.

81
Figure 9. Markov-Decision Tree Model for the strategy 'endoscopy for all'
The tree structure divides for the distribution of patients by stages, accounting for true positives and false negative test outcomes among the patients and false positive and true negative among the healthy people. The disease progression among the missed cancer cases are evaluated specific to the stage, with all missed stage 1 cancers expected to be diagnosed after 3 years as stage 3 or stage 4 cancers and all missed stage 2,3,4 cancers diagnosed later as stage 4. Patients who were non-compliant are expected to follow a similar disease journey as the missed cancer patients. Abbreviations used are: TP: True Positive, FP; False positive, TN: True Negatives, FN: False Negatives
82
Figure 10. Decision Tree Model for Strategy 'miRNA screening with endoscopy only for test positive patients' and for the current strategy of No-Screening for the population cohort of Singaporean Chinese 50-69 years

83
4.2.2 Strategies Compared
The two strategies compared are:
1. Screen for cancer using the miRNA test, followed by upper-endoscopy
for test-positive patients
2. Current clinical practice of upper-endoscopy for all
As Singapore does not have any national cancer-screening program for
the population, the analysis for the population screening for Chinese
males (50 – 69 years) involves comparison with no screening as the
current practice.
4.2.3 Methodology
A Markov decision model was built in TreeAgePro2017 to compare the
two strategies and assess their cost-effectiveness in the two
aforementioned scenarios (Figure 9, Figure 10). The model was
populated using local and published data with any required technical
assumptions drawn with a conservative bias i.e. in favor of current
practice, universal endoscopy. With a healthcare system perspective,
model was built with a lifetime horizon accounting for the remaining life
expectancy of each population subgroup. As mean patient age in
hospital clinic setting (discovery cohort) is 68 years, model was built for
14 years (average life expectancy: 82 years)115 and 20 years for
population screening cohort (mean age 60 years, life expectancy of
males: 80 years)115. Patients were modelled in five progressive health

84
states – healthy (cancer-free), TNM Stage 1, TNM Stage 2, TNM Stage
3 and untreatable terminal (Stage 4). Early or advanced stage patients
(stage 1, 2, and 3) received curative treatment with a stage specific
recurrence probability after a mean duration of 2 years116,117, while
terminal cancer patients (stage 4) received only palliative care with a
conditional life expectancy of 1 year116,117. As prognosis of the cancer
recurrence is poor, patients diagnosed with recurrence were assumed
untreatable (equivalent to stage 4) and were given palliative care.
The patients not diagnosed with gastric cancer would include both
healthy and missed cancer cases. The model admits the possibility of
missed cancer cases at early as well as advanced stages in both the
strategies as per the relevant sensitivity. The healthy cases are expected
to remain healthy for the complete duration of the analysis, while the
missed cancer patients were expected to experience the consequences
of treatment delays – disease progression, impact on cost and quality-
of-life and an increased mortality, as the cancer would progress in them
undiagnosed and untreated. Missed stage1 patients are considered to
progress to advanced-stages in an average of 3 - 4 years as per the
natural course of progression of gastric cancer118 at which they are
assumed to be diagnosed due to presentation in the clinics with
symptoms (by endoscopy). With a conservative assumption, we have
assumed all the missed stage 1 cancers to progress to stage 3 or 4
cancer in 3 years (in ratio observed at hospital clinics) and get
diagnosed. After diagnosis, the appropriate treatment is started with

85
possibility of potential recurrence for stage 3 cancers as discussed
above. Patients initially missed at stage 2 & 3 are believed to be
diagnosed after they have advance to stage 4 in 12 months. They are
expected to return to the clinic with symptoms where they are diagnosed
by endoscopy and treated with palliative care. Missed stage 4 patients
are experienced to be diagnosed after a mean time of 2 months followed
by palliative treatment, with their life expectancy reduced to half due to
initial misdiagnosis. No other causes of mortality are considered.
The hospital clinic scenario expects 100% compliance among the
patients for both the strategies. On the contrary, as the general
population is not always fully compliant, an additional compliance rate
among the population-screening cohort (Chinese males 50-69 years),
has been considered to account for the unwillingness for screening
among the population. In the base-case, the compliance for endoscopy
has been assumed to be 45%, based on the overall screening
participation rate in Korean national programs. miRNA test was
expected to improve the compliance by 50% in comparison to
endoscopy due to its lower costs and minimally invasive testing
procedure. However, with a miRNA test positive, 100% compliance is
assumed for the follow-up endoscopy. Performance across a range of
compliance rates has been evaluated. All costs quoted in US dollars
have been calculated based on the exchange rate of 1.41 SGD to 1 USD
as per exchange rates in March 2017.

86
4.2.4 Model Inputs
Treatment Protocols for Cancer Treatment and Related Costs
Stage-specific treatment protocols and average medical expenditures
for gastric cancer were obtained from the National University Hospital
and expert opinions of clinicians based on current practices in Singapore
(Table 6). Patients diagnosed with gastric cancer undergo staging
investigation, which includes Computerized Tomography (CT), Chest X-
Ray (CX-R), Endoscopic Ultrasound (EUR) and a specialist consultation
(including the cost of nurse counseling and an estimated round-trip
transport). Curative treatment administered to stage 1, 2, and 3 cancer
patients includes surgery (total/ partial gastrectomy) and hospital stay of
12 days. Stage 3 patients undergo an additional chemo-radiotherapy (5
follow-ups) and radiotherapy sessions (5 sessions/ week for 5 weeks).
Palliative care for stage 4 patients includes bypass surgery (30%),
endoscopic stenting (6%), palliative chemotherapy-5 sessions (16%)
and conservative treatment (2x specialist visits) (48%) with an
appropriate hospital stay (12 days in surgery cases and 2.5 days for
cases with no surgery). Patients are also expected to adhere to follow
up visits (average 2.2 visits/ 5 years) and repeat CT and CXR (average
1.5per year for 5years after the diagnosis). The miRNA panel test cost
in Singapore has been assumed to be SGD100 (~ USD70), which is
~15% of endoscopy cost, an approximate estimation with the locally
prevalent cost of RNA – based diagnostic test (~SGD100-150), which
follows a testing procedure similar to the developed miRNA test.

87
However, a sensitivity analysis has been performed on the miRNA test
cost to evaluate its impact. In the hospital clinic model, a biopsy rate of
40% is assumed to probe on suspicious cases (as obtained from local
hospital) whereas in population screening model the biopsy rate is
expected to be only 15%. Total costs have been evaluated inclusive of
GST and without considering any subsidy. A discount rate of 3% has
been considered for cost and health benefits.
Quality of life values
Stage-specific EQ-5D quality-of-life (QoL) index measures were
obtained from a previous local study119 performed on Chinese gastric
cancer patients in National University Hospital, Singapore (Table 6). A
diagnosed patient is expected to be immediately started on treatment,
and experience the diagnosed stage-specific QoL for 1 year with a 6-
months additional decrease in QoL due to the initial surgery referred as
disutility120. After one year of treatment, the patient is expected to enjoy
a QoL equivalent to an asymptomatic patient (similar to stage 1 cancer)
for the remaining time until faced with any recurrence, which would
subsequently drop the QoL to the stage 4 equivalent.
Test Characteristics
Test characteristics for diagnostic endoscopy with biopsy for the
suspected cases (sensitivity: 93%, specificity: 100%) have been
Table 6. Base case values and sensitivity ranges for model inputs (Singapore)

88
Variable name Base case value Sensitivity
Range Source
Costs (SGD)
MiRNA test 100 (USD70) 0 – 300 Assumed
Upper -endoscopy (EGD) 605 (USD432) 300 – 1,210
National University Hospital, Singapore (NUH)
Biopsy 150 (USD106) 75 - 300
Bypass Surgery 4,520 2,260 – 9,040
Curative Chemotherapy
(5 sessions/week x 5
weeks)
22,432 11,216 – 44,865
Curative Surgery
(partial or total
gastrectomy)
6,227 3,115 – 12,000
Endoscopic Stenting 1,280 640 – 2,560
CT & CXR (follow up
tests) 485 242 – 970
Hospital stay (per day) 471 235 – 942
Palliative Chemotherapy
(5 sessions) 3,000 1,500 – 6,000
Specialist Consultation 104 52 – 208
Staging Investigation (EUS + CT+ CXR+ follow-up)
1,856 925 – 3,700
Probabilities
Diagnosis by Stages in
Singapore
Stage1 : 2 : 3 : 4
30% : 15% : 23% :
32%
(Hospital-Clinic)
Discovery cohort statistics
40%: 32% : 18%:
10%
(population
screening)
Calculated
Diagnosis Rate in
hospital clinic by
endoscopy (annual)
(per 100,000)
0.67% 0.3-1.4% NUH
Prevalence of
undiagnosed gastric
cancer in Chinese
Males (50-69 years)
(per 100,000)
130
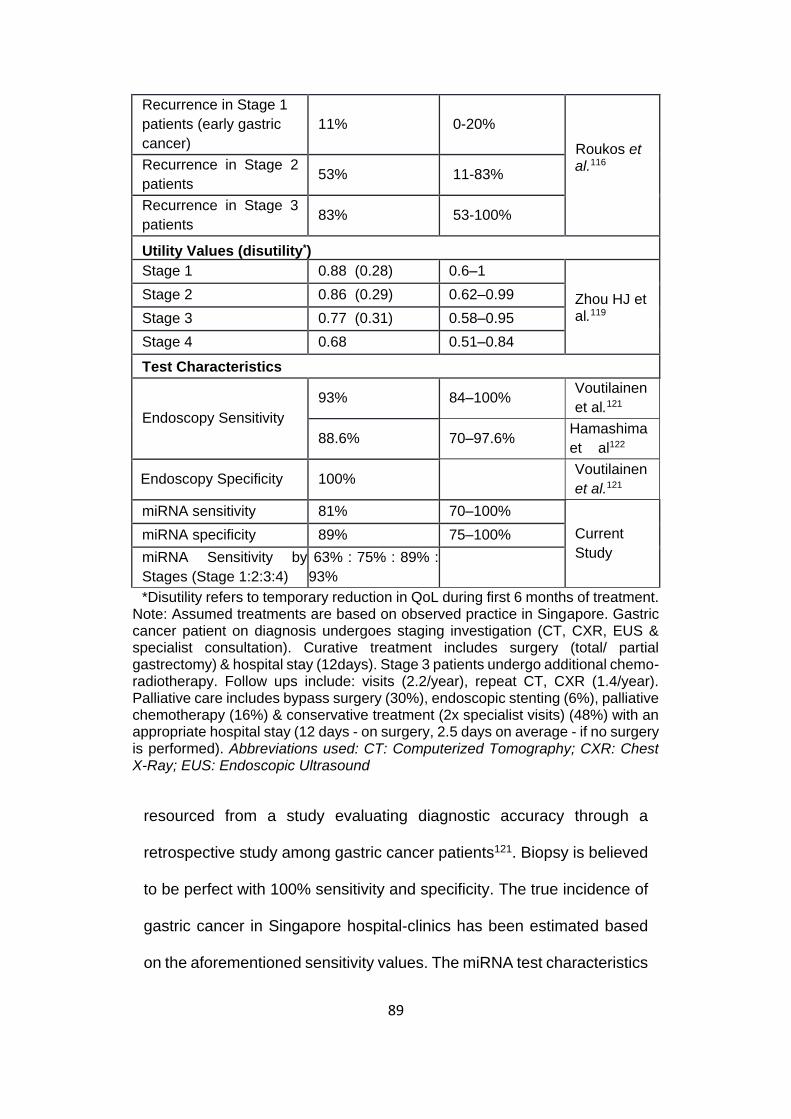
89
resourced from a study evaluating diagnostic accuracy through a
retrospective study among gastric cancer patients121. Biopsy is believed
to be perfect with 100% sensitivity and specificity. The true incidence of
gastric cancer in Singapore hospital-clinics has been estimated based
on the aforementioned sensitivity values. The miRNA test characteristics
Recurrence in Stage 1
patients (early gastric
cancer)
11% 0-20%
Roukos et al.116
Recurrence in Stage 2
patients 53% 11-83%
Recurrence in Stage 3
patients 83% 53-100%
Utility Values (disutility*)
Stage 1 0.88 (0.28) 0.6–1
Zhou HJ et al.119
Stage 2 0.86 (0.29) 0.62–0.99
Stage 3 0.77 (0.31) 0.58–0.95
Stage 4 0.68 0.51–0.84
Test Characteristics
Endoscopy Sensitivity
93% 84–100% Voutilainen
et al.121
88.6% 70–97.6% Hamashima
et al122
Endoscopy Specificity 100% Voutilainen
et al.121
miRNA sensitivity 81% 70–100%
Current
Study
miRNA specificity 89% 75–100%
miRNA Sensitivity by
Stages (Stage 1:2:3:4)
63% : 75% : 89% :
93%
*Disutility refers to temporary reduction in QoL during first 6 months of treatment. Note: Assumed treatments are based on observed practice in Singapore. Gastric cancer patient on diagnosis undergoes staging investigation (CT, CXR, EUS & specialist consultation). Curative treatment includes surgery (total/ partial gastrectomy) & hospital stay (12days). Stage 3 patients undergo additional chemo-radiotherapy. Follow ups include: visits (2.2/year), repeat CT, CXR (1.4/year). Palliative care includes bypass surgery (30%), endoscopic stenting (6%), palliative chemotherapy (16%) & conservative treatment (2x specialist visits) (48%) with an appropriate hospital stay (12 days - on surgery, 2.5 days on average - if no surgery is performed). Abbreviations used: CT: Computerized Tomography; CXR: Chest X-Ray; EUS: Endoscopic Ultrasound

90
estimated from the Singapore Discovery Cohort have been considered
as the base case value in the hospital-clinic model with an overall
sensitivity and specificity of 81% and 89% respectively.
As in the population-screening model, the diagnosed gastric cancer
tends to have a different mix by stages with an increase in proportion of
early cancers, a population study from Japan reporting a sensitivity of
88% for endoscopy has been referenced122. As all suspicious cases are
followed-up with biopsy, the specificity of endoscopy (and biopsy) is
considered 100%. miRNA test stage specific sensitivity and specificity
values have been used.
Estimating population prevalence of gastric cancer in Chinese
Males 50-69 years
As the study aims to evaluate a one-time population screening in the
cohort of Chinese males, 50-69yrs in Singapore, it is essential to
calculate the population prevalence of undiagnosed gastric cancer
cases in this target group. The current annual age-specific incidence rate
is 43 cancers per 100,000 in this group98. All these cases diagnosed
currently (in absence of any screening program) are expected to have a
stage specific distribution of stage 1:2:3:4:: 30%:15%:23%:32%
equivalent to that observed in current hospital clinic setting. As all
advanced cancers diagnosed in next 2-3 years are expected to be
present as early cancers in the current year, an approximation of

91
prevalence of undiagnosed gastric cancer prevalence was calculated
based on following assumptions:
Time to progress from stage 1 gastric cancer to stage 2 is 1-2 years
and to advanced stages (stage 3,4) is 3 years
Stage 2 cancers progress to stage 3 cancers in 1-2 years and to
stage 4 in 2 years
Stage 3 cancer progresses to stage 4 cancers in 1 year
Thus, the prevalence of undiagnosed gastric cancer in the 50-69 years
Chinese male population cohort was estimated to be 0.13% with
expected stage distribution as stage 1:2:3:4 :: 40%: 32%: 18% 10%.
4.2.5 Sensitivity Analysis
Both deterministic and probabilistic sensitivity analysis (100,000
iterations) has been done to evaluate the robustness of the model. The
deterministic sensitivity analysis evaluates the impact of varying one
variable at a time in a specified range (Table 6) whereas probabilistic
analysis varies all the variables simultaneously across 100,000
iterations, with each variable value been determined by a random draw
from an assigned distribution as specified (Table 7). Cost-effectiveness
of miRNA strategy was also analyzed with varying miRNA test cost,
compliance rates and gastric cancer incidence rates.
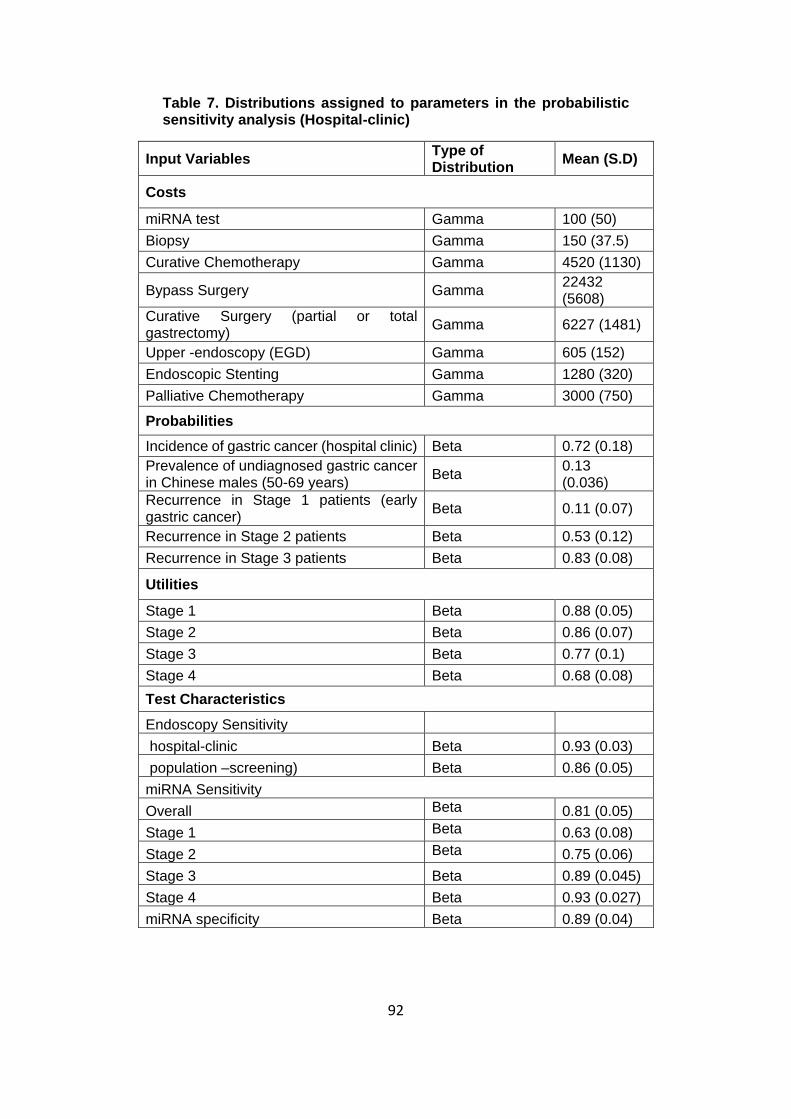
92
Table 7. Distributions assigned to parameters in the probabilistic sensitivity analysis (Hospital-clinic)
Input Variables Type of Distribution
Mean (S.D)
Costs
miRNA test Gamma 100 (50)
Biopsy Gamma 150 (37.5)
Curative Chemotherapy Gamma 4520 (1130)
Bypass Surgery Gamma 22432 (5608)
Curative Surgery (partial or total gastrectomy)
Gamma 6227 (1481)
Upper -endoscopy (EGD) Gamma 605 (152)
Endoscopic Stenting Gamma 1280 (320)
Palliative Chemotherapy Gamma 3000 (750)
Probabilities
Incidence of gastric cancer (hospital clinic) Beta 0.72 (0.18)
Prevalence of undiagnosed gastric cancer in Chinese males (50-69 years)
Beta 0.13 (0.036)
Recurrence in Stage 1 patients (early gastric cancer)
Beta 0.11 (0.07)
Recurrence in Stage 2 patients Beta 0.53 (0.12)
Recurrence in Stage 3 patients Beta 0.83 (0.08)
Utilities
Stage 1 Beta 0.88 (0.05)
Stage 2 Beta 0.86 (0.07)
Stage 3 Beta 0.77 (0.1)
Stage 4 Beta 0.68 (0.08)
Test Characteristics
Endoscopy Sensitivity
hospital-clinic Beta 0.93 (0.03)
population –screening) Beta 0.86 (0.05)
miRNA Sensitivity
Overall Beta 0.81 (0.05)
Stage 1 Beta 0.63 (0.08)
Stage 2 Beta 0.75 (0.06)
Stage 3 Beta 0.89 (0.045)
Stage 4 Beta 0.93 (0.027)
miRNA specificity Beta 0.89 (0.04)

93
4.3 Analysis for the Korean population screening program
Analysis for the Korean population screening cohort (age ≥40 years) was
done for a time horizon of 24 years in accordance with the median
patient age (57 years)123 and life expectancy (81 years)124. Cost of
endoscopy (USD35), biopsy (USD25)125 and stage–specific treatment
cost for gastric cancer126, age specific incidence rates (130 per
100,000)97 and stage at diagnosis (stage 1:2:3:4:: 63%:14%:14%:9%)
was obtained specific to Korea from published literature109 (Table 8).
Benchmarking with the healthcare services costs in Korea, the miRNA
test cost was assumed to USD20.
Table 8. Base Case Values and Sensitivity Range for model Inputs specific to Korean healthcare setup
Variable name Base case
value Sensitivity
Range Source
Costs (USD)
MiRNA test 20 0 – 40 Assumed
Upper -endoscopy (EGD) 35 12 - 70 Lee et al.125
Biopsy 25 12 - 50
Treatment Costs (for first-year after diagnosis)
Kim et al.126
Stage 1 3318 6000 – 22,000
Stage 2 12891 6000 – 24,000
Stage 3 16464 16000 – 68000
Stage 4 31759 15000 – 60000
Specialist Consultation 4 2 – 10
Probabilities
Diagnosis by Stages
Stage1 : 2 : 3 : 4 63% : 14% : 14% : 9%
Choi et al.109
Age specific incidence rate (per
100,000) 130 0.3-1.4% Shin et al.97

94
4.4 Results
4.4.1 Hospital-clinic setting
Analyzing in a hospital- clinic setup with 100% compliance for both
strategies, the universal endoscopy was found to have a mean cost per
patient of SGD807 (SGD573 additional dollars as compared to miRNA
strategy) for an incremental health benefit of 0.0035 QALY only. This
leads to an ICER of SGD162,000/QALY (USD 116,000/QALY) for
universal endoscopy, making it unfavorable and miRNA-based strategy
(screening the patients by miRNA test followed by endoscopy only for
the test positive patients) cost-effective than universal endoscopy (Table
9). Thus, for every 800 patients screened in the hospital-clinic, miRNA-
based strategy would create a cost-savings of 0.45 million SGD (USD
0.32 million) but at expense of 1 additional missed gastric cancer case
(Table 10). With endoscopy used as the confirmatory diagnostic test
among miRNA positive patients, both the strategies have a perfect PPV
of 100%, with miRNA-based strategy having a NPV of 99.82% in
comparison of an NPV of 99.95% for universal endoscopy.
Sensitivity Analysis
Evaluating the model for sensitivity to the value of variables, none of the
variables affected the model outcomes up to willingness-to-pay (WTP)
of SGD 100,000/QALY in the hospital clinic setting for the specified
sensitivity ranges (Table 6). The strategy of endoscopy for all is not cost-
effective even at a very high incidence rate of 2000 (age-specific crude

95
incidence rate/ 100,000) across miRNA price range from SGD30-
SGD100, highlighting the huge cost-burden of this strategy on the
Singapore healthcare system (Figure 11).
Probabilistic sensitivity analysis also identifies miRNA-based strategy as
the cost-effective strategy for majority of the iterations (>80% iterations)
up to WTP of SGD 100,000/QALY (USD 70,000/QALY). 92% of
iterations support miRNA cost-effectiveness for a WTP of SGD
71,000/QALY (USD 50,700/QALY) with these numbers rising to >97%
iterations for WTP lower than SGD 50,000/QALY (WTP: USD
35000/QALY) (Figure 12).
Table 9. Cost-effectiveness results for Singapore Hospital-clinic scenario comparing the two strategies: ‘endoscopy for all’ and ‘miRNA test followed by endoscopy only for test positive patients’ (modelled for 14 years)
As endoscopy for all has an ICER >SGD71,000, it is not cost-effective, making miRNA test a cost-effective strategy for hospital clinic scenario
Strategy Cost
(SGD) Costs (SGD)
Efficiency (QALY)
Efficiency (QALY)
ICER (SGD/Q
ALY)
miRNA test followed by Endoscopy for test positive patients
234 (USD167)
8.7232
Endoscopy for all
807 (USD576)
573
8.7267 0.0035 162,497
(USD 116,069)

96
Table 10. Cost and health benefits estimation in hospital-clinic setting in Singapore
Endoscopy for all
miRNA-based strategy
Sample Cohort Size 1000 1000
Cost of testing (SGD) 807,000 234,000
Additional cost spent for endoscopy (SGD) 573,000 -
Number of cancers diagnosed* 6.7 5.4
Additional cancers detected by endoscopy 1.3 -
Expense per additional cancer detected (SGD)
450,387 (USD321,705)
-
Figure 11. Sensitivity analysis investigating the impact of gastric cancer incidence rate on cost-effectiveness of endoscopy for all at multiple miRNA test cost scenarios in the hospital-clinic setting As ‘endoscopy for all’ has a high ICER (> SGD71,000), miRNA based strategy is the cost-effective strategy for gastric cancer incidence rates from 200-2000 per 100,000 and for miRNA test cost from SGD30-100. miRNA-based strategy is the cheaper strategy in hospital-clinic scenario and is hence used as the baseline strategy

97
4.4.2 Population screening for Chinese males (50-69 years)
As currently there are no population screening programs in Singapore,
current practice of no-screening has been used as the baseline to
compare both the strategies – endoscopy for all and miRNA based
strategy (miRNA test followed by endoscopy for test positive patients).
Figure 12. Cost-effectiveness acceptability curve for hospital-clinic scenario
Cost-effectiveness acceptability curve represents the number of iterations for which the two strategies are cost-effective for various willingness-to-pay (WTP) values. miRNA-based strategy was found to be cost-effective for 92% of iterations at a WTP of SGD71,000 (1GDP per capita). WTP represents the amount of an organization is willing to pay to gain 1 QALY of health benefits and helps to develop the cost-effectiveness threshold.

98
Analyzing a one-time population screening for gastric cancer among
Singapore Chinese males (50-69 years) in comparison to no-screening,
miRNA-based strategy would lead to a mean cost per patient of SGD146
(USD127) leading to a gain of 0.0028 QALY and a resultant ICER of
SGD 45,821/QALY (USD 32,533/QALY). Thus, at a WTP of SGD
71,000/QALY (threshold of 1 GDP/capita), miRNA-based strategy is
cost-effective in comparison to current practice of no screening whereas
endoscopic screening is not cost-effective with an ICER of SGD
112,772/QALY (USD 80,068/QALY). Comparing with endoscopic
screening for all, miRNA-based screening would save SGD160 per
patient with an average gain of 0.0002 QALY (Table 11). Evaluating over
a range of miRNA cost SGD30 – 60 (USD 21-43), the resultant ICER
would lie between SGD 28,000-35,700/QALY (USD 19,806-
25,253/QALY) at a baseline prevalence of 0.13% (Figure 13).
Table 11. Cost-effectiveness results for population screening of Singaporean Chinese from 50-69 years comparing the two strategies: ‘endoscopy for all’ and ‘miRNA test followed by endoscopy only for test positive patients’ (modelled for 20 years)
Strategy Cost
(SGD)
Costs (SGD)
Efficiency
(QALY)
Efficiency
(QALY)
ICER (SGD/Q
ALY)
Current Practice: No screening
20 (USD14)
12.091
miRNA test followed by Endoscopy for test positive patients
146 (USD104)
126 12.0937 0.0027 45,821 (USD
32,729)
Endoscopy for all 306
(USD219) 160 12.0935 -0.0002
112,772 (USD
80,551)

99
miRNA-based strategy also appears to be the most cost-effective
screening strategy for gastric cancer prevalence as high as 0.7% in the
population cohort (Figure 13). With the population cohort size for
Singaporean Chinese 50-69 years estimated to be ~400,000 subjects in
Singapore127, a one-time screening with miRNA-based strategy
(compliance: 70%) would lead to an incremental cost of SGD~51 million
and diagnose 240 cancer cases in comparison to the current practice of
no screening. On the other hand, endoscopy for all (compliance: 45%)
would lead to an incremental cost of SGD~114 M but lead to diagnosis
of only 207 gastric cancer cases in comparison to the current practice of
no screening (Table 12).
Table 12. Results of base-case analysis for population screening for Singapore Chinese Males (50-69 years).
Screening ~400,000 people will lead to an incremental cost of SGD~51 million with miRNA-based strategy and diagnose 240 gastric cancer cases as compared to the current practice of no screening. This is cost-effective with an ICER of SGD 45,821/QALY, which is lower than the threshold of SGD 71,000. Comparing with endoscopy for all, miRNA-based strategy will result in cost savings of SGD 63 million along with 16% better diagnosis rate for cancer cases and an 85% decrease in the endoscopes performed. Baseline used: No screening | GC: Gastric Cancer
Endoscopy
for all miRNA-based
strategy
Cohort size 400,000
Compliance 45% 75%
Incremental cost for screening 114,448,000 (USD 81Mn)
50,660,000 (USD 36Mn)
Number of cancers diagnosed 207 240
To diagnose 1 gastric cancer
Number needed to screen 868 1,165
Number of miRNA tests done - 1,165
Number of endoscopes done 868 129
Cost of diagnosing 1 GC case 552,025 210,794
Incremental Cost per QALY saved 112,772 45,821

100
Figure 13. Sensitivity analysis investigating the impact of gastric cancer incidence rate on cost-effectiveness of endoscopy for all at multiple miRNA test cost scenarios in the populations screening setup for Singaporean Chinese males (50-69 years)
Endoscopy for all has an ICER > 71,000 SGD/QALY for all scenarios’, making it not cost-effective. Whereas, miRNA based strategy always have an ICER lower than the threshold ( < SGD 71,000/QALY) identifying its cost-effectiveness
Sensitivity Analysis
Evaluating the model for sensitivity to the value of variables (variable
range mentioned in (Table 6), cost of miRNA and endoscopy were found
to be significant variables at a WTP of 71,000 SGD/QALY in the
population screening scenario for Singaporean Chinese (50-69 years).

101
SGD200 (USD141) was estimated as the threshold cost for miRNA to
remain cost-effective after which no screening seems as the preferred
approach. In addition, endoscopy with a cost lower than SGD133
(USD94) would drive universal endoscopy to cost-effectiveness.
Although the miRNA test has a lower sensitivity than endoscopy,
achieving a 45% or greater improvement in patient coverage for testing
than endoscopy would result in better health gains, making miRNA-
based strategy a superior strategy for both health and cost benefits
(Table 13).
Probabilistic sensitivity analysis identifies miRNA-based strategy as the
cost-effective strategy for majority of the iterations at a WTP >SGD
60,000/QALY (>80% iterations). 90% of iterations support miRNA cost-
effectiveness for a WTP of SGD 71,000/QALY (WTP: USD
50,700/QALY) (Figure 14).
4.4.3 Population screening in Korea
Replicating the analysis for population screening program for Korea,
miRNA-based strategy was found to be cost-effective with an ICER of
USD 1600/QALY in comparison to endoscopic screening at the base
case scenario with cost of miRNA assumed USGD20 and a patient
compliance of 45% for endoscopy and 70% for miRNA test (Table 14).
miRNA based strategy is expected to improve gastric cancer diagnosis
rate by 10%, identifying 1209 additional cancer cases with an
incremental expenditure of 4 million USD (USD 3,315 per cancer case

102
diagnosed) considering the population size of 22 million adults in this
cohort123 (Table 15).
Sensitivity analysis
Sensitivity analysis reveals three significant variables influencing the
cost effectiveness results, which include the cost of miRNA, improved
patient compliance and specificity of miRNA test. A miRNA cost < USD
24, a 50% or greater improvement in patient compliance and miRNA
Figure 14. Cost-effectiveness acceptability curve for population screening of Singaporean Chinese Males (50-69 years)
miRNA-based strategy was found to be cost-effective for 90% of iterations at a WTP of SGD71,000 (1GDP per capita). WTP represents the amount of an organization is willing to pay to gain 1 QALY of health benefits and helps to develop the cost-effectiveness threshold.

103
specificity higher than 79% would each drive miRNA-based strategy for
cost-effectiveness in the base case scenario with a WTP of USD
26,000/QALY (1 GDP/capita). However, even with a higher miRNA test
cost (USD30-40), an 80% or more improvement in compliance by using
miRNA would drive miRNA-based strategy to cost-effectiveness with its
higher health gains for the population in comparison to endoscopic
screening for all (Figure 15).
Table 13. Sensitivity analysis investigating the impact of improvement in patient compliance with miRNA test on cost-effectiveness of endoscopy in the populations screening setup for Singaporean Chinese males (50-69 years)
Even with a lower sensitivity and specificity than endoscopy, miRNA-based strategy achieves better overall health benefits for a 50% and higher improved patient compliance in comparison to endoscopy.
Improvement in
Compliance with miRNA
Strategies Cost
(SGD) Efficiency
(QALY)
ICER (SGD/QALY)
0%
No Screening 20 12.0909 0
miRNA test followed by Endoscopy (for test positive patients) 101 12.0927 45821
Endoscopy for all 306 12.0935 269255
20%
No Screening 20 12.0909 0
miRNA test followed by Endoscopy (for test positive patients) 117 12.0931 45821
Endoscopy for all 306 12.0935 465377
40%
No Screening 20 12.0909 0
miRNA test followed by Endoscopy (for test positive patients) 134 12.0934 45821
Endoscopy for all 306 12.0935 3478169
60% No Screening 20 12.0909 0

104
miRNA test followed by Endoscopy (for test positive patients) 150 12.0938 45821
Endoscopy for all 306 12.0935 -509496
80%
No Screening 20 12.0909 0
miRNA test followed by Endoscopy (for test positive patients) 166 12.0941 45821
Endoscopy for all 306 12.0935 -211058
100%
No Screening 20 12.0909 0
miRNA test followed by Endoscopy (for test positive patients) 183 12.0945 45821
Endoscopy for all 306 12.0935 -121263
Table 14.: Cost-effectiveness results for population screening program in Korea for Adults ≥40 years, comparing the two strategies: endoscopy for all and miRNA test followed by endoscopy only for test positive patients (modelled for 24 years)
miRNA-based test with an ICER < USD 1,600/QALY is the cost-effective strategy for this cohort
Strategy Cost
(USD) Costs (USD)
Efficiency (QALY)
Efficiency
(QALY)
ICER (USD/QALY)
Endoscopy for all 51.47
14.0143
miRNA test followed by Endoscopy for test positive patients
51.65 USD 0.18
14.01441 0.00011 1600
Table 15. Results of base-case analysis for population screening for population screening program in Korea for Adults ≥40 years
Screening ~22 million people with miRNA-based strategy will lead to an incremental cost of USD ~4 million but diagnose 1209 additional gastric cancer cases as compared to the practice of endoscopic screening. This is cost-effective with an ICER of USD 1600/QALY, which is lower than the threshold of US 26,000 in comparison to endoscopic screening
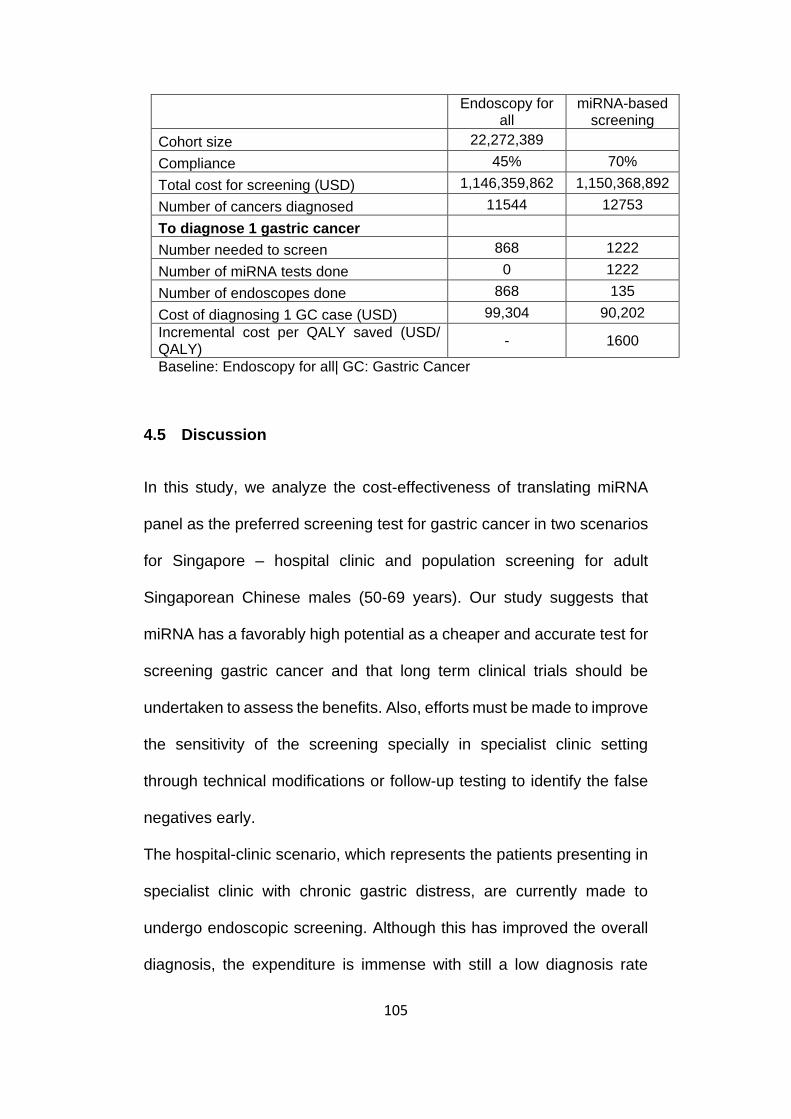
105
Endoscopy for
all miRNA-based
screening
Cohort size 22,272,389
Compliance 45% 70%
Total cost for screening (USD) 1,146,359,862 1,150,368,892
Number of cancers diagnosed 11544 12753
To diagnose 1 gastric cancer
Number needed to screen 868 1222
Number of miRNA tests done 0 1222
Number of endoscopes done 868 135
Cost of diagnosing 1 GC case (USD) 99,304 90,202
Incremental cost per QALY saved (USD/ QALY)
- 1600
Baseline: Endoscopy for all| GC: Gastric Cancer
4.5 Discussion
In this study, we analyze the cost-effectiveness of translating miRNA
panel as the preferred screening test for gastric cancer in two scenarios
for Singapore – hospital clinic and population screening for adult
Singaporean Chinese males (50-69 years). Our study suggests that
miRNA has a favorably high potential as a cheaper and accurate test for
screening gastric cancer and that long term clinical trials should be
undertaken to assess the benefits. Also, efforts must be made to improve
the sensitivity of the screening specially in specialist clinic setting
through technical modifications or follow-up testing to identify the false
negatives early.
The hospital-clinic scenario, which represents the patients presenting in
specialist clinic with chronic gastric distress, are currently made to
undergo endoscopic screening. Although this has improved the overall
diagnosis, the expenditure is immense with still a low diagnosis rate
106
leading to suboptimal utilization of healthcare services and resources.
miRNA-blood test with a cheaper and simpler testing procedure is much
less resource intensive and easier to integrate in the existing testing
structures and skill set. With its comparable negative predictive value to
endoscopic screening (99.82% vs 99.95%), the projected cost savings
of SGD 450k per 800 persons screened would be a significant asset with
the concerns about current increasing healthcare expenses but at the
expense of 1 missed gastric cancer. However, there is a need to
evaluate the benefits of extending follow up testing for miRNA test
negative patients, which could potentially help in improving the overall
efficacy and safety of this strategy.
With the majority of the gastric cancer cases diagnosed in advanced
stages in the hospital-clinic, the proposed population-screening
scenario, aims to improve the early diagnosis that is favorable for
improving the health and overall survival and reducing the expenditures
on gastric cancer treatment. With the globally recognized approach of
early diagnosis for better survival among cancer patients, there have
been many studies, with a few specific to Singapore evaluating
endoscopic screening in population cohort for achieving this goal.
However, to persuade older populations to undergo an expensive
invasive endoscopy procedure without any immediate health care
concerns is a daunting task. The willingness to undergo a screening test
is of crucial importance for any preventive national program to succeed
which has prominently been missing from earlier studies. Thus, in our

107
analysis, we have tried to forecast the health benefits and budget impact
of using both miRNA-based screening test
Figure 15. Sensitivity analysis investigating the impact of improvement in patient compliance with miRNA test on cost-effectiveness of miRNA-based strategy in comparison with endoscopic screening in the population screening program in Korea (for adults ≥ 40 years)
If miRNA test is unable to improve compliance by 50%more than endoscopy, the ICER of miRNA-based strategy is negative due to higher cost but lower health benefits. However, if compliance improves greater than 80% than that on endoscopy, the miRNA-based strategy becomes cost-effective even at a higher cost than endoscopy.
-60000
-40000
-20000
0
20000
40000
60000
80000
0% 20% 40% 60% 80% 100%
ICE
R (
US
D/
QA
LY
)
(Base
lin
e: E
nd
osc
op
y f
or
all
)
Improvement in Compliance
compared to baseline with miRNA
cost of miRNA = USD 30
cost of miRNA = USD 35
cost of miRNA = USD 40
Threshold
ICER = 26,000

108
benefits and budget impact of using both miRNA-based screening test
and endoscopic screening for the population cohort incorporating
quintessential willingness among the population to be compliant take the
test at the first place. With the miRNA test being a cheaper and simple
blood test, the compliance is expected to be much higher enabling the
health care systems to enforce this preventive care effort and achieve
improved diagnosis
Endoscopy stands as the gold standard for gastric cancer screening,
with an assumed sensitivity of 93% for hospital-clinic and 89% for
population screening in our analysis, whereas miRNA tests sensitivity is
expected to be less accurate with the sensitivity for early gastric cancer
calculated to be 63%. As the population screening is expected to
encounter mostly early gastric cancers, sensitivity of the screening test
is a major concern. However, the improved compliance using the miRNA
blood test in comparison to endoscopy is found to offset the loss due to
lower sensitivity, making it a superior strategy for both costs and health
benefits. The sensitivity of endoscopy is also overly dependent on the
skill and experience of the attending clinician who undertakes this
complicated procedure along with the accuracy of equipment leading to
a varied sensitivity reported in literature ranging 60-70% from Korean
national screening programs to 70-90% from Japanese screening
programs. Whereas, miRNA-test with a comparably standard testing
procedure is expected to have less variability in these test characteristics
109
across countries. An evaluation in Korean healthcare setup also
validates the benefits of using a simpler miRNA test than endoscopy for
national screening program. However, there is a need of detailed cost
evaluations to obtain estimates that are more accurate.
The study has a few limitations. Firstly, the analysis in the hospital-clinic
setup does not consider the endoscopies recommended for other health
conditions and believe all the endoscopies are being performed to
screen for gastric cancer. This was based on the premise that without
the fear of gastric cancer, any other condition like peptic ulcer would
include initial medicine prescription with endoscopes recommended only
on no-response on treatment. Secondly, our evaluation does not
consider indirect costs for the family due to gastric cancer and considers
only the direct costs and implications. Thirdly, the assumption of
willingness-to-pay is based on the WHO guidelines, which was the best
estimate in absence of locally published guidelines. In addition, the
improvement in compliance with miRNA test is based on an estimate.
Although sensitivity analysis evaluates for all the values across a range,
there is a need to validate these parameters locally in the population to
evaluate the benefits more accurately. Lastly, an evaluation measuring
the cost-effectiveness for an extended strategy consisting annual or
biennial follow-up for persons with negative miRNA test would be able
to explore detailed screening programs and evaluate the cost and health
implications more accurately.
110
The future of cancer prevention relies on timely detection of cancer and
appropriate treatment, making higher survival rates and lower healthcare
cost feasible. With the ageing population of Singapore and the world, the
population at risk is increasing. Effective screening or prevention
programs can be efficient tools to check the rise of cancer and lead to
reductions in incidence and subsequent mortality. The national cancer
screening programs in Korea and Japan have exemplified this claim.
However, cancers with its low incidence but grave health and economic
consequences calls for a need to optimize screening programs and find
innovative, effective and cheaper methods of cancer prevention and
early detection to achieve the goal of improved care, better survival and
manageable costs.
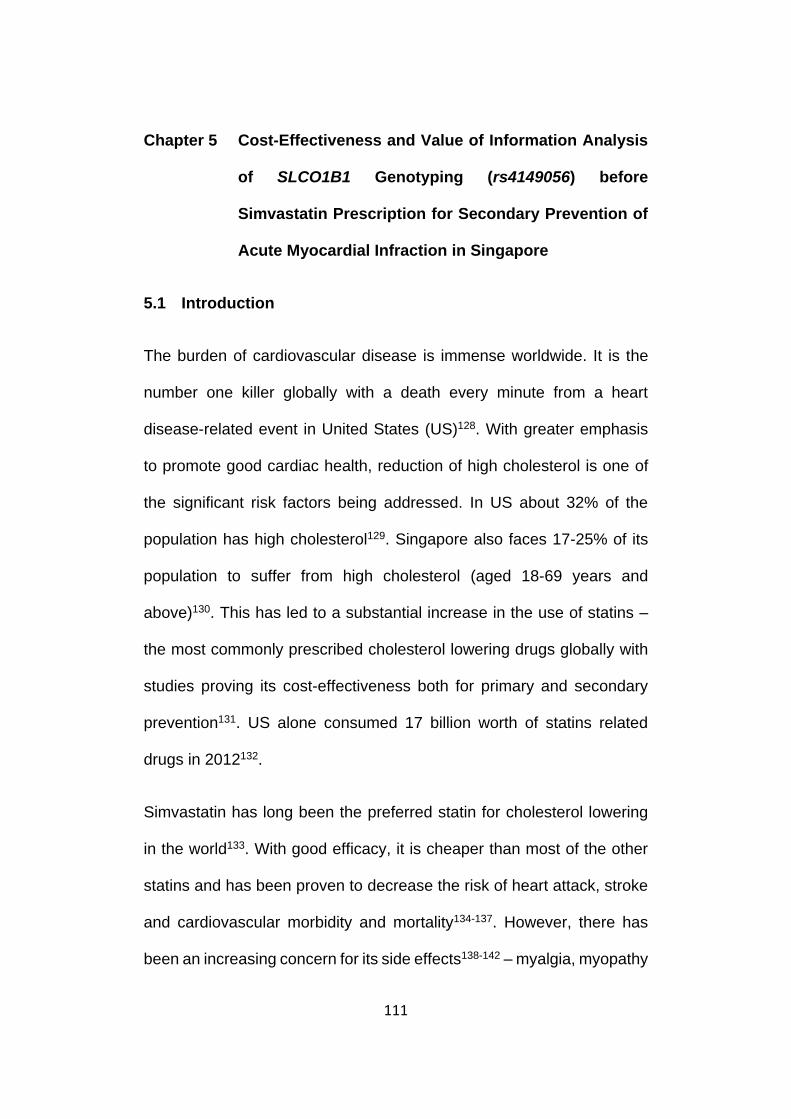
111
Chapter 5 Cost-Effectiveness and Value of Information Analysis
of SLCO1B1 Genotyping (rs4149056) before
Simvastatin Prescription for Secondary Prevention of
Acute Myocardial Infraction in Singapore
5.1 Introduction
The burden of cardiovascular disease is immense worldwide. It is the
number one killer globally with a death every minute from a heart
disease-related event in United States (US)128. With greater emphasis
to promote good cardiac health, reduction of high cholesterol is one of
the significant risk factors being addressed. In US about 32% of the
population has high cholesterol129. Singapore also faces 17-25% of its
population to suffer from high cholesterol (aged 18-69 years and
above)130. This has led to a substantial increase in the use of statins –
the most commonly prescribed cholesterol lowering drugs globally with
studies proving its cost-effectiveness both for primary and secondary
prevention131. US alone consumed 17 billion worth of statins related
drugs in 2012132.
Simvastatin has long been the preferred statin for cholesterol lowering
in the world133. With good efficacy, it is cheaper than most of the other
statins and has been proven to decrease the risk of heart attack, stroke
and cardiovascular morbidity and mortality134-137. However, there has
been an increasing concern for its side effects138-142 – myalgia, myopathy

112
and rhabdomyolysis, shifting the prescriptions to other costlier
alternative drugs – Atorvastatin, Rosuvastatin, Ezetimibe-Statin
combinations and other statins.
Many of these side effects, which are muscle related, are characterized
by debilitating muscular pain, muscle breakdown, increasing creatinine
levels in the blood and in severe cases of myopathy and rhabdomyolysis
may cause kidney damage or even death. Though clinical trials report
negligible side effect rates, observational and behavioral studies are
headlining the high prevalence of side effects which usually go
unreported in formal dossiers68,140,143. The USAGE survey
(Understanding Statin Usage in America and Gaps in Patient
Education), the largest survey conducted to understand the behavior
and attitude of cholesterol users in US68, highlights a 30% prevalence of
side effects among the statin-users with a non-compliance rate as high
as 25%. It further concludes side effects as a major reason of non-
compliance accounting for 60% of such cases. With high discontinuation
rate among statin-users, non-compliance is emerging as a major
challenge to effectively lower cholesterol and prevent cardiovascular
diseases.
Researchers have identified significant genetic linkages with the
potential to stratify patients by side effect risks144,145 and prescribe
Simvastatin with higher confidence. A significant genetic association has
been found between a SNP (rs4149056) in SLCO1B1 gene and side

113
effects on Simvastatin144,145. A carrier of one or two copies of the risk
allele carrier are estimated to be at 4.5 times to 17-times increased risk
for developing significant myopathy respectively and 2-fold increased
risk of myalgia in comparison to non-risk allele carriers144,145. Based on
multiple study reports, the Clinical Pharmacogenetics Implementation
Consortium (CPIC) has issued an update to Simvastatin Dosage
Guideline in 201436 warning about this genetic linkage and
recommending a lower dosage or an alternative statin to the risk-allele
carriers36. Though currently, FDA does not recommend SLCO1B1
screening before Simvastatin prescription, many clinical studies like
Vanderbilt university’s PREDICT initiative & Icahn School of Med.’s
CLIPMERGE program are testing patients for this variant and a success
story has already been published22.
The objective of this study is to evaluate the cost-effectiveness of
rs4149056 genetic screening before Simvastatin prescription in
comparison to the current and other plausible management options for
acute myocardial infraction (AMI) patients in Singapore. The study
focusses on Chinese male patients, who carry the majority of the disease
burden in the country146, addressing secondary prevention, where the
absolute benefit of efficient statin treatment is expected to be among the
highest. To the best of our knowledge, this is the first study evaluating
the cost-effectiveness of SLCO1B1 genetic testing in a clinical setting.
We further aim to assess the significant uncertainties in the current

114
knowledgebase and identify priority areas of future research using value
of information analysis (VOI).
5.2 Methods
5.2.1 Model Structure
A markov model was developed with a healthcare perspective in
TreeAge Pro 2017 for secondary prevention of AMI patients in Singapore
with an aim to quantify the health and cost implications of all strategies
and their impact on side effect cases and resultant non-adherence
among patients (Figure 16). Strategies compared were: 1) Simvastatin
as 1st line for all; 2) Atorvastatin as 1st line for all; 3) Genotyping and
Atorvastatin to risk allele carriers and Simvastatin to risk allele non-
carriers; 4) Ezetimibe/ Simvastatin combination as 1st-line for all. The
prescribed patient was expected to be either compatible to the drug or
develop side effects. The model considered only muscle-related side
effects – myalgia (Creatine Kinase (CK) < 3 ULN)147, myopathy (3 < CK
< 10 ULN)147 and rhabdomyolysis (CK >10 ULN)147 (ULN: upper limit of
normal range). Patients with side effects were managed as per clinical
recommendations (explained below) with some myalgia and myopathy
patients expected to become non-adherent69. Non-adherence would not
have an immediate impact on the patient’s health but lead to an increase
in risk of recurrent AMI (in comparison to those adherent to statins
>80%)137,148. All strategies have been illustrated in Figure 18.

115
Safer statin prescription after genotyping is expected to reduce the side
effect rates, improving patient adherence to simvastatin and a
subsequent reduction in recurrent AMI events. As majority of side effects
and ~50% of recurrent AMI’s happens in the first year of statin
treatment137,149, the model has been developed with a one year time
horizon with an aim to compute the side effect cases avoided with
confidence and identify parameters critical for cost-effectiveness.
Side effects on Cholesterol Lowering Drugs
Only muscle-related side effects were considered as they form most of
the clinical complaints. Myalgia leads to muscle pains, myopathy causes
serious muscle weaknesses, degradation and pain and rhabdomyolysis,
a severe and debilitating side effect, leads to degradation of skeletal
muscle, potential kidney damage and even death in rare cases.
All cholesterol lowering drugs were prescribed in comparable medium
intensity dosages (based on LDL lowering capacity) with non-statin
drugs having a low-intensity dosage prescription59 (Table 16).
Simvastatin and Atorvastatin could result in side effect events of myalgia,
myopathy or rhabdomyolysis after 1 month140,147 whereas rosuvastatin,
a safer and well tolerated statin, was expected to cause only myalgia
after a mean time of 5 months150. Ezetimibe/ Simvastatin combination is
reported to be very safe with negligible side effects. However, a 2%
myalgia rate occurring after 1 month of prescription was assumed to
account for the rare occurrences151. Though in current practice,
116
intolerance of a patient to all statins – Simvastatin, Atorvastatin,
Rosuvastatin and Ezetimibe-Simvastatin combinations is a rare
possibility, but our model considers this event and such patients are
prescribed on non-statin alternative. Once switched to alternatives, the
patients were expected to be compatible and adherent to them for the
rest of the duration of the analysis. The non-statin alternatives
considered were Ezetimibe alone, Fibrates or Gemfibrozil.
Clinical Management of Side effects
If patients develop myalgia, they were expected to be immediately
switched to the next in-line treatment – Simvastatin, Atorvastatin,
Rosuvastatin, Ezetimibe/ Simvastatin combination or non-statins in the
given order of preference with myalgia symptoms persisting for 2
months147. For myopathy and rhabdomyolysis cases, patients were
immediately stopped from the current medication and treated for the side
effect with an estimated time to recover of 2 and 4 months
respectively147. Only after complete recovery, the patients were re-
initiated on drugs- myopathy patients on either Rosuvastatin or
Ezetimibe/ Simvastatin combination, whereas rhabdomyolysis patients
were started on non-statin alternatives only, as they were considered
contra-indicated to statins after the side effect. Patients developing
myalgia on the Ezetimibe-Simvastatin combination administered as 1st
line (4th strategy), were expected to switch to Rosuvastatin followed by
non-statin alternatives only if myalgia re-appears. Non-statin alternatives

117
with a lower efficacy than medium-intensity statins were also considered
to increase the AMI risk152.
The model considers only additional side effect cases, AMI cases and
consequent mortality and expenses and did not account for the identical
baseline costs, death rates and other health conditions associated with
high cholesterol. Only 30-day mortality cases were considered for
recurrent AMI as it accounts for >75% of AMI related mortality146. Based
on WHO guidelines, the willingness-to-pay (WTP) was fixed at
SGD71,000 (~ equivalent to 1GDP/ capita)71,153.
5.2.2 Sources of Information
Rate of Side effect
The analysis was performed with the perspective of Singapore
healthcare systems and evidence obtained from literature, Singapore
registry and hospital data from National University Hospital (NUH),
Singapore (Table 16). As the literature does not report the side effect
rates for Simvastatin 40mg, a retrospective analysis was performed
using electronic medical records of diabetes mellitus patient admitted in
National University Hospital from January 2010 – December 2011. The
selection criteria have been illustrated (Figure 17). The dataset was
curated for a separate study and comprised of patients with Type 2
diabetes mellitus (T2DM, identified through a combination of anti-
diabetes drugs, International Classification of Diseases (ICD) diagnosis

118
codes and laboratory tests) who were managed in NUH. We further
extracted a subset of Chinese male patients with an earlier episode of
1A
The model compares the four strategies with the preferred first-line drugs: 1) Simvastatin for all; 2) Atorvastatin for all; 3) Genotyping and Simvastatin for allele negative patients and Atorvastatin for allele positive patients; 4) Ezetimibe-

119
Simvastatin for all. Abbreviations used: Simva40: Simvastatin 40 mg, Atorva 20: Atorvastatin 20 mg, Rosuva 5 mg: Rosuvastatin 5mg. Non-statin alternatives considered are ezetimibe, fenofibrate or gemfibrozil.
1A) Decision tree model for the strategy 1: Simvastatin for all. The strategy begins with Simvastatin for all as first line which could potentially lead to side effects namely-myalgia, myopathy, and rhabdomyolysis or long term treatment with no side effects. Patients on myalgia would be immediately switched to the next line with side effect symptoms continuing for next 2 months. Patients with myopathy and rhabdomyolysis will be first treated for the side effect and then switched to the next-in line treatment. Myalgia and myopathy patients are expected to become non-adherent which increases their risk of recurrent AMI. The decision tree only considers additional AMI cases and does not account of baseline events and costs similar to all strategies.
Strategy 2: Atorvastatin for all can be identified in the tree structure as a subset of the first strategy, starting from “atorva 20mg (2nd line)” as the first line. Strategy3: Genotyping strategy involves SLCO1B1 genetic testing for all patients with Simvastatin to allele non-carriers and Atorvastatin for allele carriers.
1B
Decision Tree Model for Strategy 4: This strategy considers ezetimibe-Simvastatin combination (10/10 mg) for all as first-line drug with myalgia as a possible side effect. Myalgia patients are then immediately switched to the next line of treatment i.e. rosuvastatin 5 mg recovering with myalgia symptoms for the next 2 months. Patients on rosuvastatin are expected to be tolerant with a small fraction facing myalgia, who would be switched immediately to non-statin alternatives. This strategy does not consider prescription of Simvastatin or Atorvastatin to patients.

120
Figure 16. Markov-Decision Tree Model for evaluating the cost-effectiveness of cholesterol management strategies for secondary prevention in AMI patients in Singapore
AMI and those being treated on Simvastatin 40mg after the AMI episode
were identified. We further used the serum CK levels to identify the
patients with side effects due to Simvastatin excluding those patients
with CK/ CKMB ratio >2.5 to remove potential CK elevations due to
cardiac events themselves. CKMB is the bound combination of two
variants (isoenzyme CKM and CKB) of the enzyme phosphocreatine
kinase which is used as a biomarker to diagnose acute myocardial
infraction. Though diabetes mellitus patients can be expected to be at a
higher risk of side effect, literature reports mixed reviews with some
studies reporting significant differences whereas others identifying no
difference in the risk profile142,154,155. In our current analysis, we assume
a similar risk profile overall for patients under secondary prevention.
Costs
Cost of genotyping was assumed to be SGD200 in accordance with the
existing cost of similar tests (HLA-B*1502 screening) and unsubsidized
costs for cholesterol lowering treatments were obtained from hospital
pharmacy. The treatment expenses for the side effects were estimated
by accounting the health services expenses used for side effect
management based on expert opinion. Cost of treating AMI was
estimated from average of hospital bills across six public hospitals in
Singapore, which was adjusted to account for the subsidy.

121
Table 16. Model estimates and sources
Parameter Value Sensitivity
Range Distribution Source
Costs
Genetic Test Cost 200 0.0 to 500.0 Gamma(α = 7.11, λ = 0.036) Assumed
Simvastatin 40mg cost (monthly) 7.2 3.6 to 21.6
Gamma(α = 36, λ = 5)
NUH
Atorvastatin 20 mg cost (monthly) 40.2 40.0 to 160.0
Gamma(α = 74.74, λ = 1.86)
Rosuvastatin 5 mg cost (monthly) 46.5 10.0 to 50.0
Gamma(α = 1465.8, λ = 36.46)
Expense (fatal Rhabdomyolysis) 40675
0.0 to 80,000.0
Gamma(α = 16, λ = 0.0004)
NUH (expert opinion)
Consultation cost 80 40.0 to 160.0 Fixed NUH
Routine test cost (for patients with side–effect)* 40 20.0 to 80.0 Fixed NUH
Expense (Myopathy) 3944
1,000.0 to 8,000.0
Gamma(α = 9.0, λ = 0.002)
NUH (based on expert opinion) Expense( Myalgia) 134 50.0 to 500.0
Gamma(α = 3.19, λ = 0.024)
Figure 17. Selection criteria for determining the Simvastatin side effect Burden The data was analysed form the diabetes mellitus patient database for Chinese patients from NUH, Singapore (1/2010- 12/2011)

122
Expense (Rhabdomyolysis) 13923
0.0 to 25,000.0
Gamma(α = 16, λ = 0.001)
Ezetimibe/ Simvastatin (10/10 mg) cost (monthly) 87 40.0 to 160.0
Gamma(α = 5256.25, λ = 60.42) NUH
Cost of non-statin alternatives (last line of treatment)** 47 4.0 to 80.0
Gamma(α = 2.16, λ = 0.05) NUH
Hospital expense on AMI (1st month)^ 18353
0.0 to 18,353.0
Gamma(α = 10.80, λ = 0.0006)
ref156
Allele frequency
Allele frequency (C/C: C/T:T/T)
0.021 :0.177 :0.80
2 0.6 to 1.0 Fixed ref94
Non Adherence
Non adherence (on myalgia ) 27% 0.0 to 1.0
Beta(α = 5.05, β = 13.66)
ref69
Non adherence (on myopathy) 40% 0.0 to 1.0
Beta(α = 2.92, β = 4.38)
Probabilities
Myalgia (Simvastatin) 22% 0.0 to 0.3
Beta(α = 11, β = 39)
NUH (DM patient database)
Myopathy (Simvastatin) 10% 0.0 to 0.1
Beta(α = 17, β = 134)
Rhabdomyolysis (Simvastatin) 4.50% 0.0 to 0.05
Beta(α = 6, β = 134)
Death rate (Rhabdomyolysis) 10% 0.0 to 1.0 Fixed ref65,157
Recurrent AMI rate 19% 0.0 to 0.3 Beta(α = 32.3, β = 137.7) ref146,148
Death rate (AMI: 30-days mortality) 14% 0.07 to 0.28
Beta(α = 6.60, β = 40.56) ref146
Myalgia (Rosuvastatin) 11% 0.0 to 0.2
Beta(α = 11.86, β = 95.92) ref150
Myalgia (Ezetimibe/ Simvastatin: 10/10) 2% 0.01 to 0.2
Beta(α = 0.34, β = 16.66) assumed
Quality of life
QoL on Rhabdomyolysis p 0.4 0.0 to 0.61
Beta(α = 0.30, β = 0.45)
ref158
QoL on Myopathy q 0.61 0.4 to 0.85 Beta(α = 2.68, β = 1.72) ref159
QoL in patients with an index AMI 0.85 0.73 to 1.0
Beta(α = 1.86, β = 0.33) ref160
QoL (Myalgia) r 0.73 0.61 to 0.85 Beta(α = 3.71, β = 1.37) ref159
QoL after AMI (immediate) 0.66 0.0 to 0.73 Fixed
ref160

123
QoL (after recurrent AMI)
0.73 (0.66 - 0.85) 0.66 to 0.85
Beta(α = 1.57, β = 0.58)
Relative Risks/ Odds Ratio
OR (Myalgia on Atorvastatin) a 0.72 0.45 – 1.15 - ref140
RR of myalgia on Atorvastatin b 0.77 0.77 to 1.1
ln N(µ = -0.26, σ = 0.1) ref140
RR of AMI (statin adherence > 80%) 0.19 0.08 to 0.47
Beta(α = 2.06, β = 8.78) ref137
RR of AMIc (on non-statin alternatives/ pravastatin) 1.29 1.06 to 1.53
ln N(µ = 0.25, σ = 0.09) ref152
RR of Rhabdomyolysis on Atorvastatin 1 0.5 to 1.5
ln N(µ = 0, σ = 0.28) Assumed
Notes: All drugs except alternatives are prescribed in comparable medium intensity dosage (LDL lowering capacity- Simvastatin 40mg, Atorvastatin 20 mg, Rosuvastatin-5mg, Ezetimibe-Simvastatin combination 10/10mg)59. Simvastatin and Atorvastatin can cause all three side effects – myalgia, myopathy and rhabdomyolysis, Rosuvastatin and Ezetimibe-Simvastatin combination with only side effect of myalgia. *Routine tests in such cases include: Urine analysis + CK + LDH (lactate dehydrogenase) + AST (aspartate transaminase). **Alternatives include non-statins with low-intensity dosage in terms of LDL lowering capacity (Ezetimibe alone -10mg, fenofibrate – 150mg, gemfibrozil-600mg x twice daily) and Pravastatin (40mg). ^Approximated to the expense in angioplasty+ stent (without complications) as they represent majority of treatment cases in Singapore. Average of hospital bill size across public hospitals is considered. aOR was reported for high dosage of Atorvastatin (20,40mg) and Simvastatin (40,80mg). bRR were calculated using formula from ref157. cRR of AMI on alternatives (low intensity dosage) was considered equal to low intensity statins with medium intensity statins as reference152. Ezetimibe-Simvastatin combination is very safe for use but a 2% side effect rate has been assumed accounting for rare cases161. QoL due to side effects have been approximated to similar health conditions: p acute kidney injury, q chronic widespread pain, rfibromyalgia.
124
A) Strategy 1: Simvastatin as 1st line followed by 2nd line drugs based on treatment outcomes: Atorvastatin (myalgia), Rosuvastatin or Ezetimibe-Simvastatin combination (myopathy) and alternative drugs (rhabdomyolysis). Please refer to the key (with the figure caption) to read the figure below
B) Strategy2: Atorvastatin as 1st line followed by 2nd line drugs based on treatment outcomes: rosuvastatin (myalgia), rosuvastatin or ezetimibe-Simvastatin combination (myopathy) and alternatives as 2nd line (rhabdomyolysis)
Strategy3: Genotyping and A) for risk allele non-carriers and B) for risk allele carriers Patients with myalgia on rosuvastatin are prescribed ezetimibe-Simvastatin combination, followed with alternatives if myalgia persists on ezetimibe-Simvastatin combination (rare possibility)
A)
B)

125
Figure 18. Possible cholesterol lowering treatment therapies compared for secondary prevention
Quality-of-life (QoL) value
Baseline QoL of patients for secondary prevention was assumed based
on published literature160. As statin side effects are not very widely
studied with negligible literature reporting their quality of life values,
these estimates were obtained for the health condition with similar health
outcomes, namely, widespread body pain for myalgia, fibromyalgia for
C) Strategy4: Ezetimibe-Simvastatin combination as 1st line followed by rosuvastatin as 2nd line in case of myalgia and alternatives as 3rd line if myalgia occurs again.
Key to the figure: SE outline colors represent the causative drug (for ex: Myalgia with green outline represents myalgia caused due to Simvastatin). As all the side effects are expected to happen within one month, the text boxes are accordingly
placed with the vertical lines with a t=1 mentioned below. Vertical lines represent time points. The next-in line treatment follow the side effect, which is atorvastatin for myalgia (due to simvastatin in strategy A) and rest and treatment lag for myopathy and rhabdomyolysis cases. The period of treatment lag in myopathy and rhabdomyolysis cases is represented as recovering. Due to space constraints, SE corresponding to the 1st time a drug appears in the strategy is shown. All other occurrences can have similar outcomes | Alternatives refer to drugs like – fenofibrate, gemfibrozil, ezetimibe alone or Pravastatin at low intensity dosage. All other drugs are prescribed at medium intensity (based on LDL lowering capacity)
Abbreviations used: Simva: Simvastatin 40mg; Atorva: Atorvastatin 20mg; Rosuva5: Rosuvastatin 5mg, Eze/Simva combination: Ezetimibe 10mg + Simvastatin 10mg; Myo.: Myopathy; Rhabdo: Rhabdomyolysis; SE: side effect
C)

126
myopathy and acute kidney injury for rhabdomyolysis. AMI incidence is
expected to cause an immediate decrease in QoL for 2 months after
which the health is expected to return to a baseline value lower than that
of initial patient cohort. All values have been reported in Table 16.
Other variables
As reported by literature, Atorvastatin was considered to have a safer
profile for myalgia than Simvastatin140, but have similar rates for
myopathy and rhabdomyolysis. Reduced risk of AMI recurrence among
patients adherent to statins was estimated from a six-year follow up
study investigating impact of statin adherence (>80% adherence) on
secondary prevention patients in Scotland, UK137. The patient non-
adherence rates were estimated from a retrospective cohort study
evaluating the discontinuation of statins in routine care settings in the US
with all patients with >80% adherence to enjoy the health benefits of full
compliance69.
5.2.3 Sensitivity analysis
Both discrete and probabilistic sensitivity analysis (100,000 iterations)
were performed to test the model robustness with gamma, beta and
lognormal distributions being assigned to cost, probabilities and relative
risks variables respectively (Table 16). A discrete 2-way and 3-way
sensitivity analysis was also done to explore the impact of uncertainty
surrounding side effect rates, relative risk of side effects and non-
adherence among patients on overall decision making. Monte Carlo
127
simulations were used to estimate net benefits (NB) and calculate value
of information (VOI) measures (1000 inner and 1000 outer loops)
reporting the worth of future research for those parameters. A budget
impact evaluation was done to analyze the affordability of clinical
translation.
5.3 Results
For secondary prevention of AMI in Singapore using cholesterol lowering
strategies, our analysis indicated Simvastatin for all as 1st-line as the
cheapest strategy and Ezetimibe-Simvastatin combination as the most
cost-effective strategy (Table 17, Figure 19). Both genotyping strategy
and Atorvastatin for all as 1st-line were dominated by Ezetimibe-
Simvastatin combination (Figure 19) which adds an average of 0.2 QALY
per patient, achieving a 100% reduction in myopathy and
rhabdomyolysis cases and ~90% reduction in myalgia cases. Sensitivity
analysis identifies rate of rhabdomyolysis on Simvastatin, quality of life
values for rhabdomyolysis and AMI patients in the first month to be of
critical importance with threshold values of 0.6% or greater and below
0.09 or 0.4 respectively to favor Ezetimibe-Simvastatin combination
(Figure 20). Probabilistic sensitivity analysis also ensures the robustness
of the results with this strategy being cost-effective for 87% of iterations
(Figure 21). However, the average additional cost this strategy incurs is
estimated to be SGD520 with a potential budget impact of 1.2 - 2.2
million dollars in the first year for the limited cohort of Singaporean
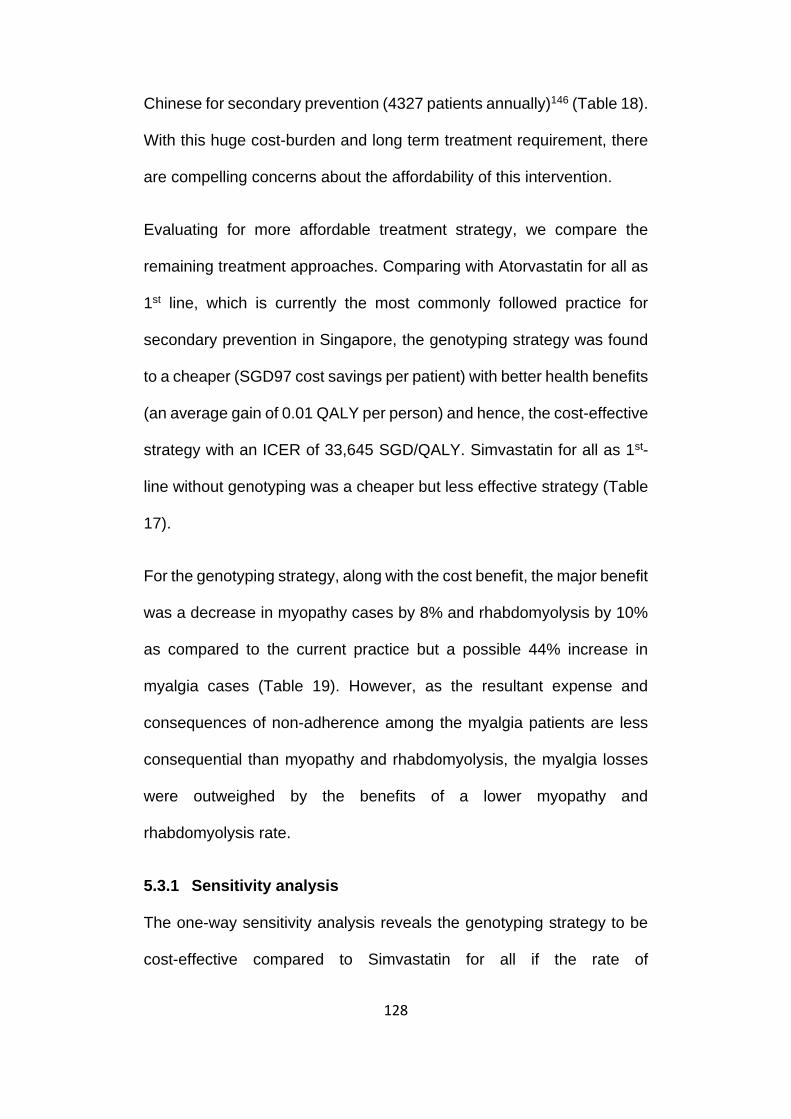
128
Chinese for secondary prevention (4327 patients annually)146 (Table 18).
With this huge cost-burden and long term treatment requirement, there
are compelling concerns about the affordability of this intervention.
Evaluating for more affordable treatment strategy, we compare the
remaining treatment approaches. Comparing with Atorvastatin for all as
1st line, which is currently the most commonly followed practice for
secondary prevention in Singapore, the genotyping strategy was found
to a cheaper (SGD97 cost savings per patient) with better health benefits
(an average gain of 0.01 QALY per person) and hence, the cost-effective
strategy with an ICER of 33,645 SGD/QALY. Simvastatin for all as 1st-
line without genotyping was a cheaper but less effective strategy (Table
17).
For the genotyping strategy, along with the cost benefit, the major benefit
was a decrease in myopathy cases by 8% and rhabdomyolysis by 10%
as compared to the current practice but a possible 44% increase in
myalgia cases (Table 19). However, as the resultant expense and
consequences of non-adherence among the myalgia patients are less
consequential than myopathy and rhabdomyolysis, the myalgia losses
were outweighed by the benefits of a lower myopathy and
rhabdomyolysis rate.
5.3.1 Sensitivity analysis
The one-way sensitivity analysis reveals the genotyping strategy to be
cost-effective compared to Simvastatin for all if the rate of

129
rhabdomyolysis on Simvastatin is 1.6% or higher. In comparison to the
current practice, Atorvastatin having a relative risk of rhabdomyolysis of
0.8 or greater than Simvastatin or a QoL value on rhabdomyolysis lesser
than 0.17 favors genotyping. The model robustness was reaffirmed by
probabilistic sensitivity analysis, with 65% iterations supportive of the
genotyping strategy followed by 23% in favor of Atorvastatin as 1st line
and 11% for Simvastatin for all (Figure 22).
5.3.2 Value of Information analysis
Value of information (VOI) analysis identifies overall model uncertainty
to risk SGD1.2 million in treatment decision making in the first year with
the relative risk of side effects and the absolute side effect rates to be
significant in driving cost-effectiveness. The RR of myalgia and
rhabdomyolysis on Atorvastatin in comparison to Simvastatin was
identified as a potentially significant uncertainty amounting to 50% of the
overall risk (Table 20). The probability of non-adherence, and cost-
variables were not found to be of significant importance.
Table 17. Cost-effectiveness analysis of the cholesterol lowering strategies for secondary prevention in Singapore
No. Strategies Cost
(SGD) Δ
Cost Efficacy (QALY)
ΔEfficacy ICER (SGD/QALY)
1 Simvastatin to all 517 Ref 0.8295 Ref Ref
2 Genotyping and Simvastatin to risk allele non-carriers and Atorvastatin 20mg to risk allele carriers
653 136 0.8335 0.004 33645
3 Atorvastatin to all 750 233 0.8325 0.0029 79255

130
Figure 19. Cost-effectiveness analysis comparing the four strategies on their cost and effectiveness
Evaluating cost-effectiveness graphically, the cost-effectiveness frontier connects Simvastatin for all, which is the cheapest option with Ezetimibe-Simvastatin combination strategy which is the optimal choice. The strategy Atorvastatin for all is dominated with genotyping strategy being cheaper and more effective. Also, genotyping strategy is being extendedly dominated as a combination of a combination of other two strategies on the cost-effectiveness
frontier could potentially be a cheaper and more effective alternative.
4 Ezetimibe-Simvastatin combination to all
1037 520 0.8495 0.02 26055
Abbreviations used: QALY: Quality adjusted life years; ICER: Incremental cost-effectiveness ratio; Ref: Reference
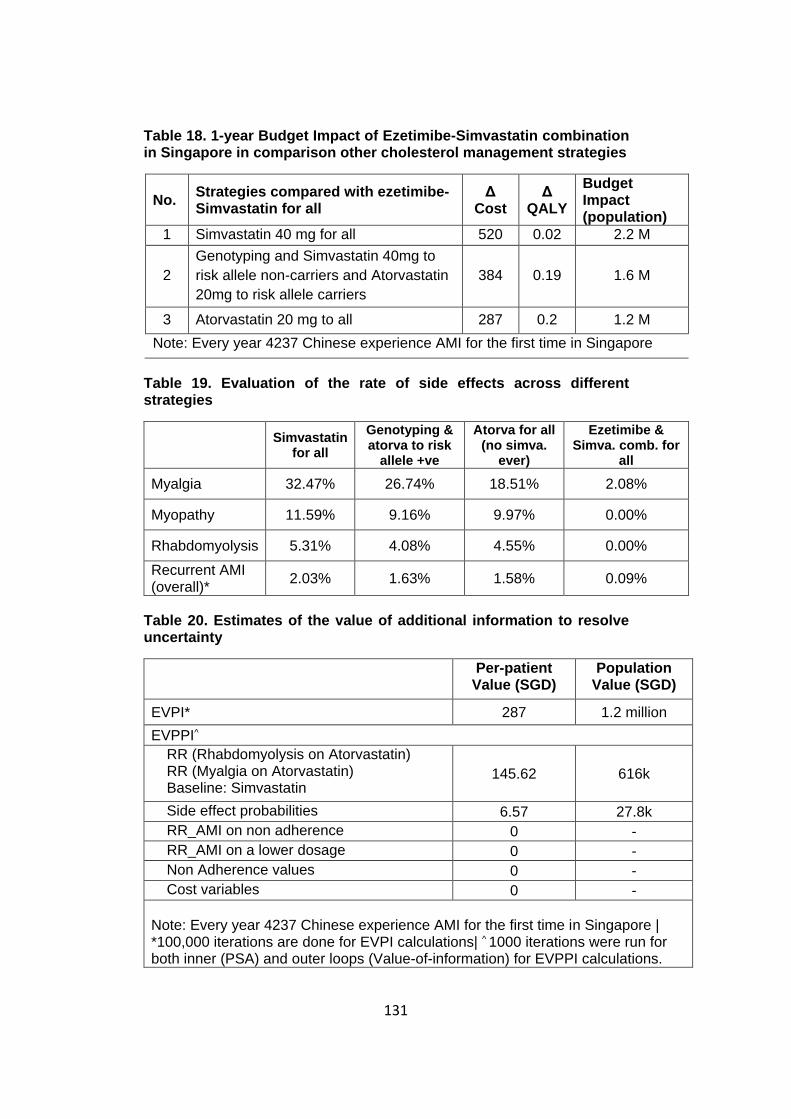
131
Table 18. 1-year Budget Impact of Ezetimibe-Simvastatin combination in Singapore in comparison other cholesterol management strategies
No. Strategies compared with ezetimibe-Simvastatin for all
Δ Cost
Δ QALY
Budget Impact (population)
1 Simvastatin 40 mg for all 520 0.02 2.2 M
2
Genotyping and Simvastatin 40mg to
risk allele non-carriers and Atorvastatin
20mg to risk allele carriers
384 0.19 1.6 M
3 Atorvastatin 20 mg to all 287 0.2 1.2 M
Note: Every year 4237 Chinese experience AMI for the first time in Singapore
Table 19. Evaluation of the rate of side effects across different strategies
Simvastatin
for all
Genotyping & atorva to risk
allele +ve
Atorva for all (no simva.
ever)
Ezetimibe & Simva. comb. for
all
Myalgia 32.47% 26.74% 18.51% 2.08%
Myopathy 11.59% 9.16% 9.97% 0.00%
Rhabdomyolysis 5.31% 4.08% 4.55% 0.00%
Recurrent AMI (overall)*
2.03% 1.63% 1.58% 0.09%
Table 20. Estimates of the value of additional information to resolve uncertainty
Per-patient Value (SGD)
Population Value (SGD)
EVPI* 287 1.2 million
EVPPI^
RR (Rhabdomyolysis on Atorvastatin) RR (Myalgia on Atorvastatin) Baseline: Simvastatin
145.62 616k
Side effect probabilities 6.57 27.8k
RR_AMI on non adherence 0 -
RR_AMI on a lower dosage 0 -
Non Adherence values 0 -
Cost variables 0 -
Note: Every year 4237 Chinese experience AMI for the first time in Singapore | *100,000 iterations are done for EVPI calculations| ^ 1000 iterations were run for both inner (PSA) and outer loops (Value-of-information) for EVPPI calculations.

132
EVPI: Expected value of perfect information | EVPPI: Expected Value of perfect parameter information| RR: Relative risk
Figure 20. Tornado analysis evaluating the impact on ICER for genotyping strategy vs. Simvastatin for all
Using one-way sensitivity analysis (Tornado analysis), we are analysing the influence of uncertainty of independent variables on Incremental cost-effectiveness ratio of Ezetimibe-Simvastatin combination strategy in comparison to Simvastatin for all which is the cheapest strategy. Rate of rhabdomyolysis on Simvastatin, quality of life values for rhabdomyolysis and AMI patients in the first month are found to be of critical importance with threshold values of 0.6% or greater and below 0.09 or 0.4 respectively to favour Ezetimibe-Simvastatin combination. These variables have been highlighted in red.

133
Figure 21. Cost-effectiveness acceptability curve (Probabilistic Sensitivity analysis) evaluating Ezetimibe-Simvastatin combination vs. Simvastatin for all
Cost-effectiveness acceptability curve represents the number of iterations for which genotyping strategy is cost-effective for varying willingness-to-pay (WTP). This study found ezetimibe-Simvastatin combination to be cost-effective in 87% of the iterations and Simvastatin for all strategy as cost-effective only for 13% of iterations.
5.4 Discussion
Our study identified Ezetimibe-Simvastatin combination as the safest
drug options for cholesterol management aimed at secondary prevention
of AMI in Singaporean Chinese males with an ICER of SGD
26,055/QALY in the first year of treatment. Although this strategy offers
the best health benefit profile, it has very high costs (12x expensive

134
than Simvastatin) leading to concerns of additional economic burden to
the healthcare system in the long run. An average patient with a survival
of 16 years after the index AMI (mean age of index AMI: 68 years), is
expected to spend approximately an additional 15,000 SGD on
treatment costs during the lifetime based on these estimates. However,
with cheaper generic versions of Ezetimibe expected to enter the market
soon, long term analysis of cost-implications would be valuable.
Figure 22. Cost-effectiveness acceptability curve (Probabilistic Sensitivity analysis)
Cost-effectiveness acceptability curve represents the number of iterations for which genotyping strategy is cost-effective for varying willingness-to-pay (WTP). This study found genotyping strategy to be cost-effective in 65% of the iterations and Atorvastatin for all strategy as cost-effective only for 23% of iterations. This evaluation was done with the genotyping cost assumed to vary between SGD5 – SGD500.

135
Further analyzing with atorvastatin for all, the most prevalent clinical
practice, genotyping before Simvastatin prescriptions was found to be
cost-effective when evaluated for the first year of treatment. Although
with an incremental cost of SGD200 for genetic test, genotyping strategy
is eventually cost-savings for the patient with better health benefits (cost-
saving of SGD100 and incremental QALY of 0.01) in the first year itself.
As statins are prescribed for longer durations, cost-savings are expected
to increase with Simvastatin being 5x times cheaper than Atorvastatin in
Singapore. We also identify side effect rates as a critical driving factor
and recognize the need of future research to quantify population specific
side effect rates corresponding to statin dosages. Thus, our study
suggests that it may be worthwhile to prioritize a long term evaluation
but with more certain estimates of relative risks and absolute measures
of statins’ side effects, specific by their dosage levels.
Our study has a few limitations. With the lack of literature reporting statin
side effect rates, our side effect estimates are based on a limited patient
cohort seen in National University Hospital. Although we have been
conservative in identifying side effect cases, excluding patients with CK
elevations due to cardiac events, the rates identified are higher than the
published values available. This may be due to the event of sampling
errors or an increased risk in our cohort due to age, an earlier AMI event
or Chinese ethnicity. Also, only CK elevations have been used to identify
side effect cases. This is specifically of concern among myalgia patients,
as many cases with statin associated muscle pain but without any CK

136
elevations have been reported. Also, with only voluntary reporting of side
effect cases, it was a practical limitation to identify these events and
could have potentially lead to underestimation of actual myalgia
concerns in the society. Value-of-information analysis identifies
uncertainty in side effect rates of significant value and future studies
evaluating the statin side effect rates in Singapore would be potentially
worthwhile to drive decision making.
Also, non-adherence rates among patients with side effects have been
estimated from a study done in the US. With patient behavior varying in
Singapore, these estimates may change. However, sensitivity analysis
and value-of-information analysis have revealed it to be not a critical
parameter of concern. Also, quality-of-life values for side effects have
been estimated based on similar health conditions, which however are
the best estimate based on the available literature. Our model considers
only AMI events and does not account for stroke and other health
complications. However, as prevention of only one outcome i.e. AMI
favors cost-effectiveness, the actual benefits which can be derived from
using genotyping to achieve a safer statin prescription profile and better
cholesterol management are expected to be higher. Finally, our model
evaluates only for a 1-year time horizon. Though, longer time duration
would have been ideal, but with limited available evidence on dosage
specific side effect rates and impact on quality of life, a 1-year study still
enables to validate potential health and cost benefits of a safer statin
prescription practice and identify uncertainties which are critical to
137
perform future long-term evaluations with confidence. As majority of side
effects and recurrent AMI happen in the first-year of secondary
prevention, our study intends to capture the majority of side effects
avoided by using a safer statin prescription method and with the results
showing cost-savings for genotyping even in this short timeline, it
provides strong evidence of the cost-effectiveness in real practice.
Lastly, though our study has been based on strong clinical evidence of
the clinical benefits offered by statins in secondary AMI prevention, there
have been scientific speculations on the benefits. Thus, remaining
mindful of the scientific progress is advisable to ensure the applicability
of this evaluation.
With an increase in concern over statin side effect rates in observational
studies and clinically useful genetic associations, there is a need to
identify novel methods to implement stratified medicine in clinics for the
benefit for all. Our study is an attempt to evaluate the cost-effectiveness
of application of SLCO1B1 genotyping in actual practice in Singapore.
Our study has identified that among all parameters relative risk of side
effects on Atorvastatin in comparison to Simvastatin and the availability
of lower cost generics are critical for efficient decision making. Further,
internationally recognized clinical guidelines to manage statin side effect
cases and analysis evaluating the implications of long term costs
impacts would help to evaluate across ethnicities and health care
systems.

138
Chapter 6 Conclusion
The healthcare market is expected to reach USD8.7 trillion dollars by
2020 with an expected increase of 2.4-7.5% between 2015 to 2020
worldwide162. With increasing life expectancy, ageing population and
immense burden of chronic and other diseases, the world is reeling
under an enormous pressure to provide effective healthcare to all.
Innovation is being sought in every aspect - healthcare practices,
operations, social engagement, financial and care delivery models to
achieve improved patient outcomes cost-effectively.
Development of efficacious and compatible treatment practices to
improve patient outcomes is a fundamental goal to reduce clinical and
financial inefficiencies in the system. With the advent of genomics and
many success stories, the future medicine promises to be much more
customized to patient’s needs. It involves focus on prescription of
genomic compatible drugs, a personalised drug development approach
as well as pharmaco-vigilance checks. Here cost-effectiveness analysis
would work as an impetus for the network, aiding in successful
incorporation in standard care with proved economic gains. Convincing
the health systems to make the necessary changes to enhance clinical
practice must stem from an evidence-based approach that rigorously
interrogates whether a pharmacogenomic test genuinely improves the
quality of care in a cost-effective manner, prior to convincing regulatory
agencies on its implementation. Implementation of pharmacogenomic

139
IDs in Thailand serves as a commendable example where even in a
resource-limited setup; the country equipped with its pharmacogenomic
strategy is on the verge of eradicating the severe SJS/TEN side effect
(arising from carbamazepine usage) cost-effectively, whereas the
developed countries are more dependent on the expensive alternative
for all approaches. More comprehensive phenotype specific chips which
could potentially test for multiple mutations leading to an adverse drug
reaction phenotype, or a co-morbidity testing platform can offer one stop
test to clinicians to be able to prescribe an effective treatment right away,
looking attractive on the cost-effectiveness parameter as well.
In recent years, the greater focus on effective application of health
technology and budget constraints has led to an increase in its
application. Along with countries in Europe, North America & Britain,
where traditionally HTA has been used, there has been increased
emphasis in Asian and other developing countries on its applications.
The recent HTA pilot program started from April 2016 in Japan, inclusion
of HTA system developments under the Healthy China 2030 Plan with a
focus of development of hubs and national policy documents for HTA,
incorporation in PhilHealth in Philippines (a national health insurance
which covers >92% of the population), increased interest by South Korea
and Japan to include it for evaluation of medical devices are some of the
many such initiatives.

140
Even though health technology assessment is one of the best scientific
tools at the service of decision-makers, it faces many challenges163-165.
Lack of understanding for the establishment’s need and structure among
the senior authorities, need of co-ordination among the many
stakeholders, absence of a systematic system of collecting evidence to
compare and an inherent shortage of experts and academic excellence
centres are among the prominent few. Different stakeholders may hold
different views regarding the specific nature of health problems,
interpretation of our moral commitments and also methodologies to
collect reliable information. The available evidence for health benefits
may not always be straight-forward. Though randomized clinic trials are
considered the gold standard for evidence of clinical efficiency, they may
sometimes be inconclusive or susceptible to biases and other sources
like observational studies, routine data, reference sources and expert
opinions may provide important contextual information. In addition, an
enhanced understanding of HTA processes and improved co-ordination
at the policy-making level are significant to facilitate its application in
practice.
The advancements and innovation in healthcare, presents this decade
with enormous opportunities and challenges and Health Technology
Assessment would play a significant role to inform and drive decision-
making and assist to achieve an improved sustainable healthcare setup
for all.

141
Bibliography
1. Finishing the euchromatic sequence of the human genome. Nature
2004;431:931-45.
2. Kim Y, Jun JK, Choi KS, Lee HY, Park EC. Overview of the National
Cancer screening programme and the cancer screening status in Korea. Asian
Pacific journal of cancer prevention : APJCP 2011;12:725-30.
3. Yamaguchi K. Overview of Cancer Control Programs in Japan.
Japanese Journal of Clinical Oncology 2002;32:S22-S31.
4. Monden M. [The basic plan to promote cancer control in Japan]. Gan
to kagaku ryoho Cancer & chemotherapy 2013;40:559-64.
5. Sanjay ST, Fu G, Dou M, et al. Biomarker detection for disease
diagnosis using cost-effective microfluidic platforms. The Analyst
2015;140:7062-81.
6. Lee JW, Figeys D, Vasilescu J. Biomarker assay translation from
discovery to clinical studies in cancer drug development: quantification of
emerging protein biomarkers. Advances in cancer research 2007;96:269-98.
7. Erichsen HC, Chanock SJ. SNPs in cancer research and treatment.
British journal of cancer 2004;90:747-51.
8. Squassina A, Manchia M, Manolopoulos VG, et al. Realities and
expectations of pharmacogenomics and personalized medicine: impact of
translating genetic knowledge into clinical practice. Pharmacogenomics
2010;11:1149-67.
9. Whirl-Carrillo M, McDonagh EM, Hebert JM, et al.
Pharmacogenomics knowledge for personalized medicine. Clinical
pharmacology and therapeutics 2012;92:414-7.
10. Drug Labels. Pharmgkb.org, 2017. (Accessed 20th April, 2017, at
https://www.pharmgkb.org/view/drug-labels.do.)
11. Klein TE, Altman RB, Eriksson N, et al. Estimation of the warfarin
dose with clinical and pharmacogenetic data. The New England journal of
medicine 2009;360:753-64.
12. Chan SL, Suo C, Lee SC, Goh BC, Chia KS, Teo YY. Translational
aspects of genetic factors in the prediction of drug response variability: a case
study of warfarin pharmacogenomics in a multi-ethnic cohort from Asia. The
pharmacogenomics journal 2012;12:312-8.
13. Marsh S, Hoskins JM. Irinotecan pharmacogenomics.
Pharmacogenomics 2010;11:1003-10.

142
14. Brown JT, Bishop JR. Atomoxetine pharmacogenetics: associations
with pharmacokinetics, treatment response and tolerability.
Pharmacogenomics 2015;16:1513-20.
15. Sultana J, Cutroneo P, Trifirò G. Clinical and economic burden of
adverse drug reactions. Journal of Pharmacology & Pharmacotherapeutics
2013;4:S73-S7.
16. Shepherd G, Mohorn P, Yacoub K, May DW. Adverse drug reaction
deaths reported in United States vital statistics, 1999-2006. The Annals of
pharmacotherapy 2012;46:169-75.
17. Park WB, Choe PG, Song KH, et al. Should HLA-B*5701 screening
be performed in every ethnic group before starting abacavir? Clinical
infectious diseases : an official publication of the Infectious Diseases Society
of America 2009;48:365-7.
18. Rauch A, Nolan D, Martin A, McKinnon E, Almeida C, Mallal S.
Prospective genetic screening decreases the incidence of abacavir
hypersensitivity reactions in the Western Australian HIV cohort study.
Clinical infectious diseases : an official publication of the Infectious Diseases
Society of America 2006;43:99-102.
19. Mallal S, Phillips E, Carosi G, et al. HLA-B*5701 Screening for
Hypersensitivity to Abacavir. New England Journal of Medicine
2008;358:568-79.
20. Charland SL, Agatep BC, Herrera V, et al. Providing patients with
pharmacogenetic test results affects adherence to statin therapy: results of the
Additional KIF6 Risk Offers Better Adherence to Statins (AKROBATS) trial.
The pharmacogenomics journal 2014;14:272-80.
21. Fung B. The $289 Billion Cost of Medication Noncompliance, and
What to Do About It. The Atlantic 2012 Sep12, 2012.
22. Whitney K. PREDICT helps pinpoint right statin for patient. Reporter
2012.
23. Moja L, Tagliabue L, Balduzzi S, et al. Trastuzumab containing
regimens for early breast cancer. The Cochrane database of systematic reviews
2012:CD006243.
24. Dong D, Sung C, Finkelstein EA. Cost-effectiveness of HLA-B*1502
genotyping in adult patients with newly diagnosed epilepsy in Singapore.
Neurology 2012;79:1259-67.
25. Rattanavipapong W, Koopitakkajorn T, Praditsitthikorn N,
Mahasirimongkol S, Teerawattananon Y. Economic evaluation of HLA-
143
B*15:02 screening for carbamazepine-induced severe adverse drug reactions
in Thailand. Epilepsia 2013;54:1628-38.
26. Tiamkao S, Jitpimolmard J, Sawanyawisuth K, Jitpimolmard S. Cost
minimization of HLA-B*1502 screening before prescribing carbamazepine in
Thailand. International journal of clinical pharmacy 2013;35:608-12.
27. Schackman BR, Scott CA, Walensky RP, Losina E, Freedberg KA,
Sax PE. The cost-effectiveness of HLA-B*5701 genetic screening to guide
initial antiretroviral therapy for HIV. Aids 2008;22:2025-33.
28. Kapoor R, Martinez-Vega R, Dong D, et al. Reducing hypersensitivity
reactions with HLA-B*5701 genotyping before abacavir prescription:
clinically useful but is it cost-effective in Singapore? Pharmacogenetics and
genomics 2014.
29. Nieves Calatrava D, Calle-Martin Ode L, Iribarren-Loyarte JA, et al.
Cost-effectiveness analysis of HLA-B*5701 typing in the prevention of
hypersensitivity to abacavir in HIV+ patients in Spain. Enfermedades
infecciosas y microbiologia clinica 2010;28:590-5.
30. Health sciences authority MoH, Singapore. Dear Healthcare
Professional Letter: Recommendations for HLA-B*1502 genotype testing
prior to initiation of carbamazepine in new patients. 2013.
31. Shotelersuk V, Limwongse C, Mahasirimongkol S. Genetics and
genomics in Thailand: challenges and opportunities. Molecular Genetics &
Genomic Medicine 2014;2:210-6.
32. Hershfield MS, Callaghan JT, Tassaneeyakul W, et al. Clinical
Pharmacogenetics Implementation Consortium guidelines for human
leukocyte antigen-B genotype and allopurinol dosing. Clinical pharmacology
and therapeutics 2013;93:153-8.
33. Crews KR, Gaedigk A, Dunnenberger HM, et al. Clinical
Pharmacogenetics Implementation Consortium (CPIC) guidelines for codeine
therapy in the context of cytochrome P450 2D6 (CYP2D6) genotype. Clinical
pharmacology and therapeutics 2012;91:321-6.
34. Anderson JL, Horne BD, Stevens SM, et al. Randomized trial of
genotype-guided versus standard warfarin dosing in patients initiating oral
anticoagulation. Circulation 2007;116:2563-70.
35. Pilote L, Lauzon C, Huynh T, et al. Quality of life after acute
myocardial infarction among patients treated at sites with and without on-site
availability of angiography. Archives of internal medicine 2002;162:553-9.
36. Ramsey LB, Johnson SG, Caudle KE, et al. The clinical
pharmacogenetics implementation consortium guideline for SLCO1B1 and

144
simvastatin-induced myopathy: 2014 update. Clinical pharmacology and
therapeutics 2014;96:423-8.
37. The Medication Safety Code Initiative. 2013. at http://safety-
code.org/.)
38. Sukasem C, Chantratita W. A success story in pharmacogenomics:
genetic ID card for SJS/TEN. Pharmacogenomics 2016;17:455-8.
39. Kozyra M, Ingelman-Sundberg M, Lauschke VM. Rare genetic
variants in cellular transporters, metabolic enzymes, and nuclear receptors can
be important determinants of interindividual differences in drug response.
Genet Med 2017;19:20-9.
40. Surendiran A, Pradhan SC, Adithan C. Role of pharmacogenomics in
drug discovery and development. Indian Journal of Pharmacology
2008;40:137-43.
41. Caudle KE, Klein TE, Hoffman JM, et al. Incorporation of
pharmacogenomics into routine clinical practice: the Clinical
Pharmacogenetics Implementation Consortium (CPIC) guideline development
process. Current drug metabolism 2014;15:209-17.
42. Relling MV, McDonagh EM, Chang T, et al. Clinical
Pharmacogenetics Implementation Consortium (CPIC) guidelines for
rasburicase therapy in the context of G6PD deficiency genotype. Clinical
pharmacology and therapeutics 2014;96:169-74.
43. Johnson JA, Weitzel KW. Advancing Pharmacogenomics as a
Component of Precision Medicine: How, Where, and Who? Clinical
Pharmacology & Therapeutics 2016;99:154-6.
44. Kisor DF, Bright DR, Conaway M, Bouts BA, Gerschutz GP.
Pharmacogenetics in the Community Pharmacy. Journal of Pharmacy Practice
2014;27:416-9.
45. Bunting BA, Smith BH, Sutherland SE. The Asheville Project: Clinical
and economic outcomes of a community-based long-term medication therapy
management program for hypertension and dyslipidemia. Journal of the
American Pharmacists Association 2008;48:23-31.
46. Kalista T, Lemay V, Cohen L. Postdischarge community pharmacist-
provided home services for patients after hospitalization for heart failure.
Journal of the American Pharmacists Association : JAPhA 2015;55:438-42.
47. Ferreri SP, Greco AJ, Michaels NM, et al. Implementation of a
pharmacogenomics service in a community pharmacy. Journal of the
American Pharmacists Association : JAPhA 2014;54:172-80.
145
48. Kimmel SE, French B, Kasner SE, et al. A Pharmacogenetic versus a
Clinical Algorithm for Warfarin Dosing. New England Journal of Medicine
2013;369:2283-93.
49. Baker WL, Chamberlin KW. New oral anticoagulants vs. warfarin
treatment: no need for pharmacogenomics? Clinical pharmacology and
therapeutics 2014;96:17-9.
50. Prince AER, Roche MI. Genetic Information, Non-Discrimination, and
Privacy Protections in Genetic Counseling Practice. Journal of genetic
counseling 2014;23:891-902.
51. Hall MA, Rich SS. Patients' fear of genetic discrimination by health
insurers: the impact of legal protections. Genet Med 2000;2:214-21.
52. Hall MA, McEwen JE, Barton JC, et al. Concerns in a primary care
population about genetic discrimination by insurers. Genet Med 2005;7:311-6.
53. Rodriguez-Antona C, Taron M. Pharmacogenomic biomarkers for
personalized cancer treatment. Journal of internal medicine 2014.
54. FDA. Information for Healthcare Professionals: Abacavir (marketed as
Ziagen) and Abacavir-Containing Medications. 2008.
55. FDA. Information for Healthcare Professionals: Dangerous or Even
Fatal Skin Reactions - Carbamazepine (marketed as Carbatrol, Equetro,
Tegretol, and generics).
http://wwwfdagov/Drugs/DrugSafety/PostmarketDrugSafetyInformationforPat
ientsandProviders/ucm124718htm 2007.
56. Hughes DA, Vilar FJ, Ward CC, Alfirevic A, Park BK, Pirmohamed
M. Cost-effectiveness analysis of HLA B*5701 genotyping in preventing
abacavir hypersensitivity. Pharmacogenetics 2004;14:335-42.
57. Hughes S. Black Box for Warfarin. Medscape Medical News 2006.
58. FDA. FDA safety information for Plavix (clopidogrel bisulfate) tablet.
http://wwwfdagov/Safety/MedWatch/SafetyInformation/ucm225843htm 2010.
59. FDA Drug Safety Communication: New restrictions, contraindications,
and dose limitations for Zocor (simvastatin) to reduce the risk of muscle
injury. December 15, 2011. at
http://www.fda.gov/Drugs/DrugSafety/ucm256581.htm.)
60. Wilke RA, Ramsey LB, Johnson SG, et al. The Clinical
Pharmacogenomics Implementation Consortium: CPIC Guideline for
SLCO1B1 and Simvastatin-Induced Myopathy. Clinical pharmacology and
therapeutics 2012;92:112-7.

146
61. Mozaffarian D, Benjamin EJ, Go AS, et al. Heart disease and stroke
statistics--2015 update: a report from the American Heart Association.
Circulation 2015;131:e29-322.
62. Nwankwo T, Yoon SS, Burt V, Gu Q. Hypertension among adults in
the United States: National Health and Nutrition Examination Survey, 2011-
2012. NCHS data brief 2013:1-8.
63. Roger VL, Go AS, Lloyd-Jones DM, et al. Heart disease and stroke
statistics--2012 update: a report from the American Heart Association.
Circulation 2012;125:e2-e220.
64. High Cholesterol Facts. (Accessed September 19, 2015, at
http://www.cdc.gov/cholesterol/facts.htm.)
65. Law M, Rudnicka AR. Statin safety: a systematic review. Am J
Cardiol 2006;97:52C-60C.
66. Stewart A. SLCO1B1 Polymorphisms and Statin-Induced Myopathy.
PLoS currents 2013;5.
67. NEHI 2011. Thinking Outside the Pillbox: A System-wide Approach
to Improving
Patient Medication Adherence for Chronic Disease.
68. Cohen JD, Brinton EA, Ito MK, Jacobson TA. Understanding Statin
Use in America and Gaps in Patient Education (USAGE): an internet-based
survey of 10,138 current and former statin users. Journal of clinical lipidology
2012;6:208-15.
69. Zhang H, Plutzky J, Skentzos S, et al. Discontinuation of statins in
routine care settings: a cohort study. Annals of internal medicine
2013;158:526-34.
70. The USAGE Survey Fact Sheet. 2014. at statinusage.com.)
71. Cost effectiveness and strategic planning (WHO-CHOICE). (Accessed
11 Jun, 2015, at http://www.who.int/choice/costs/CER_thresholds/en/.)
72. Johnson JA, Gong L, Whirl-Carrillo M, et al. Clinical
Pharmacogenetics Implementation Consortium Guidelines for CYP2C9 and
VKORC1 genotypes and warfarin dosing. Clinical pharmacology and
therapeutics 2011;90:625-9.
73. Coumadin® tablets (Warfarin sodium tablets, USP) Crystalline
coumadin® for injection (Warfarin sodium for injection, USP) [package
insert]. 2011 at http://dailymed.nlm.nih.gov/dailymed/lookup
.cfm?setid=c0f238ff-2804-4150-9766-22a5111b4e74.)

147
74. CPIC Dosing Guideline for warfarin and CYP2C9, VKORC1. at
https://www.pharmgkb.org/guideline/PA166104949.)
75. World Health Organization. Consolidated guidelines on the use of
antiretroviral drugs for treating and preventing HIV infection. In: HIV AIDS
program, ed. June 2013 edJune 2013.
76. Clay PG. The abacavir hypersensitivity reaction: A review.
2002;24:1502-514.
77. Sax PE, Tierney C, Collier AC, et al. Abacavir/lamivudine versus
tenofovir DF/emtricitabine as part of combination regimens for initial
treatment of HIV: final results. The Journal of infectious diseases
2011;204:1191-201.
78. Tan DH, Chan K, Raboud J, et al. Comparison of abacavir/lamivudine
and tenofovir/emtricitabine among treatment-naive HIV-infected patients
initiating therapy. Journal of acquired immune deficiency syndromes (1999)
2011;58:38-46.
79. Hewitt RG. Abacavir hypersensitivity reaction. Clinical infectious
diseases : an official publication of the Infectious Diseases Society of America
2002;34:1137-42.
80. Hughes CA, Foisy MM, Dewhurst N, et al. Abacavir hypersensitivity
reaction: an update. The Annals of pharmacotherapy 2008;42:387-96.
81. Mallal S, Nolan D, Witt C, et al. Association between presence of
HLA-B*5701, HLA-DR7, and HLA-DQ3 and hypersensitivity to HIV-1
reverse-transcriptase inhibitor abacavir. Lancet 2002;359:727-32.
82. Schackman BR, Gebo KA, Walensky RP, et al. The lifetime cost of
current human immunodeficiency virus care in the United States. Medical care
2006;44:990-7.
83. Tey JS, Ang LW, Tay J, et al. Determinants of late-stage HIV disease
at diagnosis in Singapore, 1996 to 2009. Annals of the Academy of Medicine,
Singapore 2012;41:194-9.
84. Ministry of Health Singapore. HIV Statistics. 2012.
85. Escaut L, Liotier JY, Albengres E, Cheminot N, Vittecoq D. Abacavir
rechallenge has to be avoided in case of hypersensitivity reaction. Aids
1999;13:1419-20.
86. Guidry JA UL, Yi O. HIV and aging: emerging issues in the HAART
era. LGBTQ policy journal at harvard kennedy school
87. Kauf TL, Roskell N, Shearer A, et al. A predictive model of health
state utilities for HIV patients in the modern era of highly active antiretroviral

148
therapy. Value in health : the journal of the International Society for
Pharmacoeconomics and Outcomes Research 2008;11:1144-53.
88. Dodek P, Phillips P. Questionable history of immediate-type
hypersensitivity to penicillin in Staphylococcal endocarditis: treatment based
on skin-test results vers-us empirical alternative treatment--A decision
analysis. Clinical infectious diseases : an official publication of the Infectious
Diseases Society of America 1999;29:1251-6.
89. Pepper PV, Owens DK. Cost-Effectiveness of the Pneumococcal
Vaccine in Healthy Younger Adults. Medical Decision Making 2002;22:S45-
S57.
90. Freedberg KA, Losina E, Weinstein MC, et al. The Cost Effectiveness
of Combination Antiretroviral Therapy for HIV Disease. New England Journal
of Medicine 2001;344:824-31.
91. Hetherington S, McGuirk S, Powell G, et al. Hypersensitivity reactions
during therapy with the nucleoside reverse transcriptase inhibitor abacavir.
Clinical therapeutics 2001;23:1603-14.
92. Eron J, Jr., Yeni P, Gathe J, Jr., et al. The KLEAN study of
fosamprenavir-ritonavir versus lopinavir-ritonavir, each in combination with
abacavir-lamivudine, for initial treatment of HIV infection over 48 weeks: a
randomised non-inferiority trial. Lancet 2006;368:476-82.
93. Pillai NE, Okada Y, Saw WY, et al. Predicting HLA alleles from high-
resolution SNP data in three Southeast Asian populations. Human molecular
genetics 2014;23:4443-51.
94. Teo YY, Sim X, Ong RT, et al. Singapore Genome Variation Project: a
haplotype map of three Southeast Asian populations. Genome research
2009;19:2154-62.
95. Ferlay J, Soerjomataram I, Dikshit R, et al. Cancer incidence and
mortality worldwide: sources, methods and major patterns in GLOBOCAN
2012. International journal of cancer 2015;136:E359-86.
96. Chen W, Zheng R, Baade PD, et al. Cancer statistics in China, 2015.
CA: a cancer journal for clinicians 2016;66:115-32.
97. Shin A, Kim J, Park S. Gastric Cancer Epidemiology in Korea. Journal
of Gastric Cancer 2011;11:135-40.
98. Office NRoD. Cancer incidence and mortality 2003 - 2012 and
selected trends 1973 - 2012 in Singapore2015.
99. Lin Y, Ueda J, Kikuchi S, et al. Comparative epidemiology of gastric
cancer between Japan and China. World Journal of Gastroenterology : WJG
2011;17:4421-8.

149
100. Kim Y, Park J, Nam B-H, Ki M. Stomach cancer incidence rates
among Americans, Asian Americans and Native Asians from 1988 to 2011.
Epidemiology and Health 2015;37:e2015006.
101. GLOBOCAN 2012: Estimated Cancer Incidence, Mortality, and
Prevalence Worldwide in 2012. 2012. (Accessed 7 July, 2015, at
http://globocan.iarc.fr/Pages/fact_sheets_cancer.aspx.)
102. Koong HN, Chan HS, Nambiar R, et al. Gastric cancers in Singapore:
poor prognosis arising from late presentation. The Australian and New
Zealand journal of surgery 1996;66:813-5.
103. Tsubono Y, Nishino Y, Tsuji I, Hisamichi S. Screening for Gastric
Cancer in Miyagi, Japan: Evaluation with a Population-Based Cancer
Registry. Asian Pacific journal of cancer prevention : APJCP 2000;1:57-60.
104. Lello E, Furnes B, Edna TH. Short and long-term survival from gastric
cancer. A population-based study from a county hospital during 25 years. Acta
oncologica (Stockholm, Sweden) 2007;46:308-15.
105. Chau I, Norman AR, Cunningham D, Waters JS, Oates J, Ross PJ.
Multivariate prognostic factor analysis in locally advanced and metastatic
esophago-gastric cancer--pooled analysis from three multicenter, randomized,
controlled trials using individual patient data. Journal of clinical oncology :
official journal of the American Society of Clinical Oncology 2004;22:2395-
403.
106. Age-Standardised One-, Five- and Ten-Year Net Survival, Adults
(Aged 15-99), England and Wales, 2010-2011. Cancer Research UK, 2014.
(Accessed 15th March, 2017,
107. Trends in Cancer Survival 1983-2007. ISD Scotland 2010, 2010.
(Accessed 15th March 2017,
108. Howlader N NA, Krapcho M, Miller D, Bishop K, Altekruse SF,
Kosary CL, Yu M, Ruhl J, Tatalovich Z, Mariotto A, Lewis DR, Chen HS,
Feuer EJ, Cronin KA (eds). SEER Cancer Statistics Review, 1975-2013:
National Cancer Institute; 2015.
109. Choi KS, Jun JK, Suh M, et al. Effect of endoscopy screening on stage
at gastric cancer diagnosis: results of the National Cancer Screening
Programme in Korea. British journal of cancer 2015;112:608-12.
110. Cancer Statistics in Japan-2015 Tokyo: Foundation for Promotion of
Cancer Research; 2015.
111. Lee S, Jun JK, Suh M, et al. Gastric Cancer Screening Uptake Trends
in Korea: Results for the National Cancer Screening Program From 2002 to
2011: A Prospective Cross-Sectional Study. Medicine 2015;94:e533.
150
112. Trends in Cancer Incidence in Singapore 2009-2013. 2014. (Accessed
7 July, 2015, at https://www.nrdo.gov.sg/docs/librariesprovider3/Publications-
Cancer/cancer-trends-report-2009-
2013.pdf?sfvrsn=0&AspxAutoDetectCookieSupport=1.)
113. Amal H, Leja M, Funka K, et al. Detection of precancerous gastric
lesions and gastric cancer through exhaled breath. Gut 2016;65:400.
114. Jung K-W, Won Y-J, Kong H-J, Oh C-M, Seo HG, Lee J-S. Cancer
Statistics in Korea: Incidence, Mortality, Survival and Prevalence in 2010.
Cancer Res Treat 2013;45:1-14.
115. Life expectancy at birth. 2017,
116. Roukos DH, Lorenz M, Karakostas K, Paraschou P, Batsis C, Kappas
AM. Pathological serosa and node-based classification accurately predicts
gastric cancer recurrence risk and outcome, and determines potential and
limitation of a Japanese-style extensive surgery for Western patients: a
prospective with quality control 10-year follow-up study. British journal of
cancer 2001;84:1602-9.
117. Hozo SP, Djulbegovic B, Hozo I. Estimating the mean and variance
from the median, range, and the size of a sample. BMC medical research
methodology 2005;5:13.
118. Tsukuma H, Oshima A, Narahara H, Morii T. Natural history of early
gastric cancer: a non-concurrent, long term, follow up study. Gut
2000;47:618-21.
119. Zhou HJ, So JB, Yong WP, et al. Validation of the functional
assessment of cancer therapy-gastric module for the Chinese population.
Health and quality of life outcomes 2012;10:145.
120. Zhou HJ. Health Services Research on Endoscopic Surveillance for
Gastric Cancer in the Singapore Chinese Population - Experience of the
Gastric Cancer Epidemiology Clinical and Genetic Program: National
University of Singapore; 2013.
121. Voutilainen ME, Juhola MT. Evaluation of the diagnostic accuracy of
gastroscopy to detect gastric tumours: clinicopathological features and
prognosis of patients with gastric cancer missed on endoscopy. European
journal of gastroenterology & hepatology 2005;17:1345-9.
122. Hamashima C, Okamoto M, Shabana M, Osaki Y, Kishimoto T.
Sensitivity of endoscopic screening for gastric cancer by the incidence
method. International journal of cancer 2013;133:653-9.
123. (2012) OfEC-oaD. Total population by age and sex. OECD.stat2012.

151
124. Bank TW. Life expectancy at birth, total (years). The World Bank;
2016.
125. Lee HY, Park EC, Jun JK, Choi KS, Hahm MI. Comparing upper
gastrointestinal X-ray and endoscopy for gastric cancer diagnosis in Korea.
World J Gastroenterol 2010;16:245-50.
126. Kim SS, Kim J-H, Cheung DY, Park S-H. Analysis of medical
expenses according to the stage of gastric cancer during the first year after
diagnosis. Journal of Clinical Oncology 2014;32:4-.
127. Department of Statistics S. Population Trends 20162016.
128. WHO. Cardiovascular disease (CVDs) factsheet.
http://wwwwhoint/mediacentre/factsheets/fs317/en/ 2015.
129. Ohsfeldt RL, Gandhi SK, Fox KM, McKenney JM. Statin cost-
effectiveness comparisons using real-world effectiveness data: formulary
implications. Value in health : the journal of the International Society for
Pharmacoeconomics and Outcomes Research 2008;11:1061-9.
130. Ministry of Health Singapore. National Health Survey 2010. 2010.
131. Ward S, Lloyd Jones M, Pandor A, et al. A systematic review and
economic evaluation of statins for the prevention of coronary events. Health
technology assessment (Winchester, England) 2007;11:1-160, iii-iv.
132. Christensen K, Doblhammer G, Rau R, Vaupel JW. Ageing
populations: the challenges ahead. Lancet 2009;374:1196-208.
133. Fernandez G, Spatz ES, Jablecki C, Phillips PS. Statin myopathy: a
common dilemma not reflected in clinical trials. Cleveland Clinic journal of
medicine 2011;78:393-403.
134. Zhou Z, Rahme E, Abrahamowicz M, et al. Effectiveness of statins for
secondary prevention in elderly patients after acute myocardial infarction: an
evaluation of class effect. CMAJ : Canadian Medical Association Journal
2005;172:1187-94.
135. Sakamoto T, Kojima S, Ogawa H, et al. Effects of early statin
treatment on symptomatic heart failure and ischemic events after acute
myocardial infarction in Japanese. Am J Cardiol 2006;97:1165-71.
136. Kadota S, Matsuda M, Izuhara M, et al. Long-term effects of early
statin therapy for patients with acute myocardial infarction treated with stent
implantation. Journal of Cardiology 2008;51:171-8.
137. Wei L, Wang J, Thompson P, Wong S, Struthers AD, MacDonald TM.
Adherence to statin treatment and readmission of patients after myocardial
infarction: a six year follow up study. Heart 2002;88:229-33.
152
138. Joy TR, Hegele RA. Narrative review: statin-related myopathy. Annals
of internal medicine 2009;150:858-68.
139. Wagner M, Muhldorfer-Fodor M, Prommersberger KJ, Schmitt R.
Statin-induced focal myositis of the upper extremity. A report of two cases.
European journal of radiology 2011;77:258-60.
140. Bruckert E, Hayem G, Dejager S, Yau C, Begaud B. Mild to moderate
muscular symptoms with high-dosage statin therapy in hyperlipidemic
patients--the PRIMO study. Cardiovascular drugs and therapy / sponsored by
the International Society of Cardiovascular Pharmacotherapy 2005;19:403-14.
141. Kuncova K, Sedlackova M, Vencovsky J, et al. Inflammatory
myopathy associated with statins: report of three cases. Modern rheumatology
/ the Japan Rheumatism Association 2014;24:366-71.
142. Rallidis LS, Fountoulaki K, Anastasiou-Nana M. Managing the
underestimated risk of statin-associated myopathy. International journal of
cardiology 2012;159:169-76.
143. Tomlinson SS, Mangione KK. Potential adverse effects of statins on
muscle. Physical therapy 2005;85:459-65.
144. Voora D, Shah SH, Spasojevic I, et al. The SLCO1B1*5 genetic
variant is associated with statin-induced side effects. Journal of the American
College of Cardiology 2009;54:1609-16.
145. Link E, Parish S, Armitage J, et al. SLCO1B1 variants and statin-
induced myopathy--a genomewide study. The New England journal of
medicine 2008;359:789-99.
146. NRoD. O. Trends in Acute Myocardial Infarction in Singapore 2007 -
2013. Ministry of Health, Singapore.
147. Hansen KE, Hildebrand JP, Ferguson EE, Stein JH. Outcomes in 45
patients with statin-associated myopathy. Archives of internal medicine
2005;165:2671-6.
148. Smolina K, Wright FL, Rayner M, Goldacre MJ. Long-term survival
and recurrence after acute myocardial infarction in England, 2004 to 2010.
Circulation Cardiovascular quality and outcomes 2012;5:532-40.
149. Suzuki S, Takaki H, Yasumura Y, et al. Assessment of quality of life
with 5 different scales in patients participating in comprehensive cardiac
rehabilitation after acute myocardial infarction. Circulation journal : official
journal of the Japanese Circulation Society 2005;69:1527-34.
150. Meek C, Wierzbicki AS, Jewkes C, et al. Daily and intermittent
rosuvastatin 5 mg therapy in statin intolerant patients: an observational study.
Current medical research and opinion 2012;28:371-8.

153
151. Florentin M, Liberopoulos EN, Elisaf MS. Ezetimibe-associated
adverse effects: what the clinician needs to know. International journal of
clinical practice 2008;62:88-96.
152. (UK) NIfHaCE. Lipid Modification: Cardiovascular Risk Assessment
and the Modification of Blood Lipids for the Primary and Secondary
Prevention of Cardiovascular Disease. London: National Clinical Guideline
Centre (UK); 2014 Jul.
153. Annual GDP at Current Market Prices. (Accessed Jun 11, 2015, at
http://www.singstat.gov.sg/statistics/browse-by-theme/national-accounts.)
154. Derosa G, D'Angelo A, Franzetti IG, et al. Efficacy and safety of
ezetimibe/simvastatin association on non-diabetic and diabetic patients with
polygenic hypercholesterolemia or combined hyperlipidemia and previously
intolerant to standard statin treatment. Journal of clinical pharmacy and
therapeutics 2009;34:267-76.
155. Magni P, Macchi C, Morlotti B, Sirtori CR, Ruscica M. Risk
identification and possible countermeasures for muscle adverse effects during
statin therapy. European journal of internal medicine 2015.
156. Ministry of Health S. Total Hospital Bills - By condition/procedure.
www.moh.gov.sg: Ministry of Health, Singapore; 2016.
157. Xu Cong Ruan YHK, Joanne Chang. Prevalence of statin-induced
rhabdomyolysis in Asian populations. ACCP Annual Meeting.
Pharmacotherapy 2012;10.
158. Johansen KL, Smith MW, Unruh ML, Siroka AM, O'Connor TZ,
Palevsky PM. Predictors of health utility among 60-day survivors of acute
kidney injury in the Veterans Affairs/National Institutes of Health Acute Renal
Failure Trial Network Study. Clinical journal of the American Society of
Nephrology : CJASN 2010;5:1366-72.
159. Schaefer C, Mann R, Masters ET, et al. The Comparative Burden of
Chronic Widespread Pain and Fibromyalgia in the United States. Pain Practice
2015:n/a-n/a.
160. Henriksson C, Larsson M, Herlitz J, Karlsson JE, Wernroth L, Lindahl
B. Influence of health-related quality of life on time from symptom onset to
hospital arrival and the risk of readmission in patients with myocardial
infarction. Open heart 2014;1:e000051.
161. Bays HE, Ose L, Fraser N, et al. A multicenter, randomized, double-
blind, placebo-controlled, factorial design study to evaluate the lipid-altering
efficacy and safety profile of the ezetimibe/simvastatin tablet compared with
ezetimibe and simvastatin monotherapy in patients with primary
hypercholesterolemia. Clinical therapeutics 2004;26:1758-73.

154
162. ablBirkemeyer R, Dauch A, Müller A, et al. Short term cost
effectiveness of a regional myocardial infarction network. Health Economics
Review 2013;3:10-.
163. Olyaeemanesh A, Doaee S, Mobinizadeh M, Nedjati M, Aboee P,
Emami-Razavi SH. Health technology assessment in Iran: challenges and
views. Medical Journal of the Islamic Republic of Iran 2014;28:157-.
164. Simard C, Pharm B, Poirier P. Ezetimibe-associated myopathy in
monotherapy and in combination with a 3-hydroxy-3-methylglutaryl
coenzyme A reductase inhibitor. The Canadian journal of cardiology
2006;22:141-4.
165. Abrams HL, Hessel S. Health technology assessment: problems and
challenges. AJR American journal of roentgenology 1987;149:1127-32.