Embed Size (px)
Citation preview

HEDG Working Paper 10/29
Health systems’ responsiveness and itscharacteristics: a cross-country
comparative analysis
Silvana RoboneNigel Rice
Peter C. Smith
November 2010
york.ac.uk/res/herc/hedgwp

1
Health systems’ responsiveness and its characteristics: a cross-countrycomparative analysis
Silvana Robone1, Nigel Rice1, Peter C. Smith2
1 Centre for Health Economics, University of York2 Imperial College Business School
November 2010
AbstractThis paper investigates the influence of aggregate country-level characteristics on health systemresponsiveness, using data on 62 countries present in the World Health Survey. While evidenceexists on variations in reported levels of health system responsiveness across countries, theliterature is sparse on the determinants of responsiveness, particularly of system widecharacteristics (World Health Report, 2000). We attempt to bridge this gap in the literature byconsidering simultaneously several plausible country-level characteristics as potentialdeterminants of health system responsiveness. These characteristics refer to the way health caresystems are organised and funded, the socio-demographic traits of the populations served and theeconomic, cultural and institutional characteristics of countries. We pay particular attention tothe role of health care expenditures per capita while controlling for potential confoundingfactors. Data on responsiveness and socio-demographic characteristics of respondents are takenfrom the World Health Survey, a survey launched by the World Health Organization in 2001.Information on the country-level characteristics are obtained from the United NationsDevelopment Program (UNDP), the World Value Survey and the Polity IV Project database. Theempirical analysis is performed by adopting a two step procedure. First, we increase the cross-country comparability of the data by adjusting for variation in the way survey respondents ratean objective level of responsiveness using the hierarchical ordered probit (hopit) model.Secondly, we investigate the influence of health spending per capita and other countrycharacteristics on the adjusted country-level measures of responsiveness. Our results suggest thatthe most relevant determinants of responsiveness appear to be health expenditure per capita,health care expenditure in the public sector and population levels of education.
Keywords: Health systems responsiveness; Anchoring vignettes; Health care expenditures.
Corresponding author: Silvana Robone, Centre for Health Economics, University of York,York, YO10 5DD, United Kingdom; +44(0)1904 321452; [email protected]
Acknowledgement: The authors gratefully acknowledge funding from the Economic and SocialResearch Council under grant reference RES-060-25-0045. We thank the World Healthorganization for providing access to the World Health Survey. Responsibility for interpretationof the data, as well as any errors, is the authors’ alone.

2
Introduction
Health system responsiveness has been identified as one of the intrinsic goals of health care
systems, together with health outcomes and fairness of financial contributions (World Health
Report 2000). Responsiveness relates to a system’s ability to respond to the legitimate
expectations of potential users about non-health enhancing aspects of care (Murray and Frenk,
2000) and in broad terms can be defined as the way in which individuals are treated and the
environment in which they are treated encompassing the notion of an individual’s experience of
contact with the health system (Valentine et al. 2003a). The concept is operationalised through
measurement across eight domains which aim to distinguish between aspects of health systems
related to the rights of patients as human beings (e.g. domain of dignity) and aspects related to
how the system meets the needs of patients as clients of the system (e.g. quality of health care
facilities).
While there exists evidence on variation in reported levels of health system responsiveness
across countries (Valentine et al. 2003b, Valentine et al. 2009, Sirven et al. 2008, Rice et al,.
2010a) there has been little investigation of the determinants of responsiveness, particularly of
system wide characteristics (World Health Report, 2000). Of the few studies that do exist
attention has focused on health care spending per capita revealing a positive association with
responsiveness (World Health Report, 2000, Anderson and Hussey 2001). However, it has been
argued that responsiveness is not just a matter of health spending, since some of its elements,
such as the respectful treatment of patients, are almost costless to implement (World Health
Report, 2000). In addition, characteristics such as institutional factors have been suggested as
important determinants of whether a country’s health system meets its citizens’ expectations
(Blendon et al. 2001, Azfar and Gurgur, 2008). This point appears to be corroborated by
empirical evidence showing that a positive and significant relationship between health care

3
spending and responsiveness exists only for specific groups of countries and specific types of
treatments (Valentine et al., 2003b, Valentine et al. 2009).
The paper investigates the influence of aggregate country-level characteristics on health
system responsiveness, using data on 62 countries present in the World Health Survey (WHS).
Potential determinants considered include the characteristics of health systems, the structure of
the population served and the economic, cultural and institutional characteristics of countries.
We pay particular attention to the role of health care expenditures per capita while controlling for
potential confounding factors. Data on responsiveness in the WHS are self-reported and
measured on an ordinal categorical scale. A common problem with such scales is that individuals
when faced with the instrument are likely to interpret the meaning of the available response
categories in a way that systematically differs across population or population sub-groups
(Salomon et al., 2004). This compromises the comparability of data, particularly for cross-
country analyses and has been termed differential item functioning (Kapteyn et al. 2007). To
address this issue our empirical approach adopts a two step procedure. First we adjust for
differential item functioning by making use of information on the set of anchoring vignettes
available in the WHS and by applying the hierarchical ordered probit model (hopit: Tandon et
al., 2003; Terza, 1985). This provides more comparable data purged of variation in reporting
behaviour. Secondly, we investigate the potential influence of health spending per capita and
other country characteristics on the adjusted country-level measures of responsiveness. Since our
analysis is based on aggregate, country-level cross-sectional data, caution needs to be used in
drawing strong inferences about causality from these results.
1) Health system responsiveness and its potential determinants
The concept of responsiveness as a measure of health system performance was developed
and promoted by the World Health Organisation (WHO) and covers a set of non-clinical and

4
non-financial dimensions of quality of care that reflect respect for human dignity and
interpersonal aspects of the care process (Valentine et al., 2009). Human rights include concepts
such as respecting patient autonomy and dignity, while interpersonal aspects of care, or client
orientation, focus on aspects that are commonly expressed as hotel facilities, for example, the
quality of basic amenities. Increasingly, patients’ views and opinions are being recognised as an
appropriate source of information on non-technical aspects of health care delivery and the
measurement of health system responsiveness has largely been based on surveys of user views.
In principle, the concept of responsiveness covers both interactions with health services together
with broader experiences and interactions with health systems, including, for example, health
promotion campaigns, and public health interventions (Valentine et al., 2009). For the purpose of
this analysis, we focus on the former where respondents are asked to rate their most recent (in
the previous year) experience of contact with health services within each of eight domains. The
concept of responsiveness is viewed as a multidimensional concept, with each domain measured
on a categorical scale for which there is an assumed underlying latent representation.
We consider several plausible country-level characteristics as being potential determinants
of health system responsiveness. These refer to the way health care systems are organised and
funded, the socio-demographic characteristics of the populations served and the economic,
cultural and institutional characteristics of countries.
In particular we focus on the role of health expenditures per capita which has been shown
to have a positive relationship with responsiveness (World Health Report 2000, Anderson and
Hussey 2001). However, responsiveness may not simply be a matter of the level of health
spending: while some elements of responsiveness are likely to be costly (e.g. quality of facilities)
other elements are not (e.g. dignity and communication), and may simply require a moderately
increased level of training and awareness (World Health Report 2000, Blendon et al. 2001).
Moreover, as indicated by Azfar and Gurgur (2008), an increase in funding for the health sector
5
does not necessarily lead to the provision of better services where institutions fail to function
efficiently. Empirical evidence suggests that health care spending influences responsiveness
differentially across countries and types of treatments (Valentine et al., 2003b, Valentine et al.
2009).
In addition to the level of health care funding we consider the proportion of total health
care expenditures consumed by the public sector provision of care (from here on termed public
sector health expenditure). Previous studies have attempted to explain the variation across
countries in the share of publically provided health care (Epple-Romano 1996, Gouveia 1997),
its redistributive impact (Besley and Coate 1991, Castro-Leal et al. 2000, Sahn and Younger
2000, O`Donnell et al. 2007) and the relative efficiency of public versus private provision
(Besley and Gouveia 1994, Handson et al. 2008). Poutillard (2007), Bennet et al., (2005),
Brugha et al. (1998), and Angelopoulou et al., (1998) have suggested that publicly funded health
care is characterised by higher technical quality than privately funded provision. As far as
responsiveness is concerned, it has been hypothesised that the quality of health services is
contingent on market incentives. Since private providers are not usually subsidized by
governments and depend on payments from clients, they will be more likely than public
providers to meet patients’ expectations about non-technical aspects of care (Andaleeb, 2000).
This hypothesis appears to be supported by empirical evidence (Andaleeb, 2000; Angelopoulou
et al., 1998).
The demographic structure of a population is generally considered a useful indicator of its
health care needs and forms an important component of capitation formulae used to distribute
health care resources (for example, see Rice and Smith, 2001, Smith et al. 2001, Gravelle et al.
2003). Concern over rising health care expenditures have further led to a debate about the
relationship to age or proximity to death as the driving factor (i.e. Zweifel et al. 1999, Felder et
al. 2000, Dow and Norton 2002, Seshamani and Gray 2004). The demands placed on a health

6
system will have implications for the resources available for non-health enhancing aspects of
care, such as the responsiveness of the system to patients expectations and preferences and
accordingly we account for the demographic structure of a population using the proportion of the
population over the age of 65 years. Additionally, since it is likely that higher educated citizens
will also demand more from health services including the way it responds to legitimate
expectations of quality, we further include the population average level of education.
Further, responsiveness is expected to be greater in more economically developed countries
due to an increased availability of human capital and better developed infrastructure (Valentine
et al. 2009). We attempt to verify that countries at a more advanced state of economic
development are characterized by more responsive health systems. We further include the level
of inequality (via income inequality) within a country which has been found to be a determinant
of health via for example, life expectancy (Vollmer and Ziegler 2009) as a potential determinant
of health system responsiveness.
It has been suggested that the beliefs, values and social norms prevailing in a country
influence the organizational culture present in health care organizations (Davies et al. 2000). The
generic question of whether organizational culture impacts on performance has not been
explored extensively (Davies et al. 2000), however, with regard to the health sector, it has been
shown that cultural factors are important components for health systems’ reforms leading to
quality improvements (Marshall et al. 2002). We use a measure of beliefs, values and social
norms derived via the World Values Survey (Inglehart and Welzel, 2005) as a plausible
determinant of responsiveness. In addition we consider the political history of a country. Past
political control will have important consequences for the way in which the health care sector is
organized; for example, a past soviet system is likely to retain remnants of a highly centralised
and planned public sector. Recent studies have shown that a stable democratic political system
favours economic development (Gerring, et al. 2005, Persson and Tabellini, 2008) and we

7
hypothesize that countries with a long history of democracy are associated with higher levels of
health systems responsiveness compared to those where democratic political processes have
more recently been introduced.
2) Data
We make use of data from the World Health Survey (WHS). The WHS is an initiative
launched by the World Health Organization in 2001 aimed at strengthening capacity to monitor
health outputs and outcomes across countries through the fielding of a comparable household
survey instrument (see Üstün et al., 2003). The basic survey mode was an in-person interview,
consisting of either a 90-minute in-household interview (53 countries), a 30-minute face-to face
interview (13 countries) or a computer assisted telephone interview (4 countries). In total,
seventy countries participated in the WHS 2002-2003, and all of them, with the exception of
Turkey, reported data on responsiveness. All surveys were drawn from nationally representative
frames with known probability resulting in sample sizes of between 600 and 10,000 respondents
across the countries surveyed. Samples have undergone extensive quality assurance procedures,
including the testing of the psychometric properties of the responsiveness instrument (Valentine
et al., 2009), and close attention has been paid to the issue of inter-country comparability (Ustun
et al., 2003).
The WHS responsiveness module gathers basic information on utilization for both inpatient
and outpatient health services. In the analysis that follows we make reference only to inpatient
services. The measurement of responsiveness was obtained by asking respondents to rate their
most recent experience of contact with the health system within a set of eight domains by
responding to set questions. The domains consist of “autonomy” (involved in decisions),
“choice” (of health care provider), “clarity of communication” (of health care personnel),
“confidentiality” (e.g. talk privately), “dignity” (respectful treatment and communication),

8
“prompt attention” (e.g. waiting times), “quality of basic facilities” and “access to family and
community support”.1 We present analyses for the following six domains: Dignity, Prompt Attention,
Clarity of Communication, Choice, Confidentiality, Quality of Facilities. 2 When rating their experience of
contact with services the following categories were available to respondents: “very good”,
“good”, “moderate”, “bad”, and “very bad”. Definitions of these domains together with
examples of the questions asked to survey respondents are provided in Figure 1. In addition to
respondents’ ratings of own contact with health services, the WHS contains a number of
anchoring vignettes describing the experiences of hypothetical individuals within each of the
eight domains. Respondents are asked to rate these vignettes using the same scale available when
reporting their own experiences of health system responsiveness. Examples of vignette questions
are presented in Figure 2. Information from the vignettes is used to anchor respondent reports to
a common scale when comparing reported responsiveness across countries.
The WHS further contains information on respondent characteristics. We make use of age,
gender, level of education and income. Level of education is a continuous variable measuring the
number of years in education. Gender is a dummy variable coded 0 for women and 1 for men.
Income is derived from a measure of permanent income based on information on the physical
assets owned by households (Ferguson et al., 2003). We construct dummy variables to indicate
the tertiles of the within-country distribution of household permanent income to which
individuals belong. For the analysis presented here, the first income tertile is considered as the
baseline category.
Information on the country-level determinants of responsiveness are obtained from the
United Nations Development Program (UNDP). Cross-country data on health expenditures per
capita, health expenditures in the public sector and total health expenditures relate to 2001 and
are expressed in 1000 US$. Data regarding the demographic structure and aggregate level of
education in a country also relate to 2001. The education index provided by the UNDP data is

9
scaled from 0 (the country with the lowest level of education) to 1 (country with the highest
levels of education). All other countries have an index lying between these extremes. Country
level income inequality is measured via the Gini index.3 The index takes the value of 0 in the
case of absolute equality and 100 in the case of absolute inequality. We rescale the index to lie
between 0 and 1. The degree of economic development is measured through the GDP per capita
in 2001, in US$. We compute a discrete variable to represent countries with less than the median
level of GDP per capita (value of 0) and countries with greater than the median level (value of
1). 4 Countries with low GDP per capita are considered as the reference group.
To proxy the social norms and values prevailing in a country we make reference to the
World Value Survey (Inglehart and Welzel 2005), which identifies a set of basic values common
across countries. We focus on the Traditional/Secular dimension of cross-cultural variation
which reflects the contrast between societies in which religion is considered as an important
element of life and those in which it is not. We include a dummy variable to indicate whether a
country is characterised by secular versus traditional values.
Information on a country’s democratic history is provided by the Polity IV Project
database, which offers information for 163 countries over the period 1800-2008
(http://www.systemicpeace.org/polity/polity4.htm). The Polity Score represents the level of
democracy on a spectrum from 0 to 10 with 10 representing a fully democratic political system.
We have computed an index of democratic history for each country as the average of the Polity
Score over the last 35 years, divided by 10. Descriptive statistics for the set of explanatory
variables of health system responsiveness at country level are presented in Table 1. Average
health expenditures per capita is approximately 560 US$. There is, however, substantial variation
across countries with a range of 3 to 2580 US$.

10
3) Empirical approach
Data on responsiveness are usually self-reported and measured on an ordinal 5 point
categorical scale, ranging from “very good” to “very bad”. A common problem with such scales
is that individuals, when faced with the instrument, are likely to interpret the meaning of the
response categories in a way that systematically differs across populations or population sub-
groups (for example, see Salomon et al., 2004). Accordingly, respondents’ self-reports will not
be comparable across populations if they do not correspond to the same underlying level of the
responsiveness construct. This has been termed differential item functioning (Kapteyn et al.
2007). To address this issue we make use of information on the set of anchoring vignettes in the
WHS that allow us to benchmark self reports of responsiveness to a common scale using what
has been termed the hierarchical ordered probit model (hopit: Tandon et al., 2003; Terza, 1985).
The approach allows us to enhance the cross-country comparability of the data prior to exploring
the potential drivers of country level responsiveness. Accordingly, we adopt a two step
procedure: first we control for differential item functioning using the hopit model and secondly
we investigate the influence of health spending per capita and other country characteristics on
the adjusted country-level measures of responsiveness.
Hopit model
The standard ordered probit model which is often used to model ordered categorical
responses makes use of a set of constant thresholds applicable to all individuals to map responses
on a latent scale to observed outcomes. For an ordered variable with categories these can be
represented as with and and for Where the
assumption of constant thresholds does not hold, estimates of the impact of explanatory variables
on outcomes of interest will be biased. The hierarchical ordered probit model (hopit) developed
by Tandon et al. (2003) (also see Terza, 1985) is an extension of the ordered probit model that

11
relaxes the restriction of constant thresholds by allowing these to vary across individuals. The
method draws on the use of responses to a set of anchoring vignettes to provide a source of
external information that facilitates the identification of the thresholds for respondent, i, as a
function of covariates, , such that , with and for
are parameters to be estimated. The idea is that since the vignettes are fixed descriptions of
responsiveness in hypothetical situations, variation across respondents in their ratings of the
vignettes can be used to identify differential item functioning and hence estimation of the
parameters, . Note that in the above specification, the impact of the covariates is allowed to
vary across thresholds such that it is greater at some levels of the ordered outcome than others –
this has been termed non-parallel threshold shift (Jones et al., 2007).
The hopit model can be specified in two parts. The first part draws on the use of vignettes
to identify the thresholds as a function of relevant characteristics – termed the reporting
behaviour equation. The second part of the model - the outcome equation - maps individual
socio-economic and other characteristics to underlying health system responsiveness while
controlling for differences in reporting behaviour obtained through the first step:
where represents a vector of regressors, including country dummy variables, predictive of
outcomes (responsiveness) and β is a conformably dimensioned vector of parameters to be
estimated.5 represents an unobserved latent variable and we assume that the observed
categorical response, , relates to in the following way: if , where are
defined as above through the use of vignettes. Full details of the estimation method can be found,

12
for example, in King, et al. (2004); Kapteyn et al., (2007), Bago d’Uva et al., (2008), Rice et al.
(2010a).
The use of vignettes to identify differential reporting behaviour relies on two assumptions.
The first is response consistency. This assumes that individuals classify the vignettes in a way
that is consistent with the rating of their own experiences of health system responsiveness. The
second is vignette equivalence where it is assumed that “the level of the variable represented by
any one vignette is perceived by all respondents in the same way and on the same
unidimensional scale” (King et al., 2004; p.194).
We apply the hopit model across the pool of sixty-seven countries present in the WHS, by
specifying a set of dummy variables for country of residence together with a set of respondent
characteristics (age, gender, level of education and income).6 The estimated country coefficients
obtained from the responsiveness equation represent the mean level of responsiveness on a latent
scale for each country. These estimates are purged of variation in reporting behavior and can be
used as the regressand in the modelling of the potential determinants of responsiveness.
Throughout Mexico is taken as the baseline country.7
Estimation of the characteristics of responsiveness
To investigate country-specific determinants of responsiveness we use an estimated
dependent variable model (Lewis and Linzer, 2005) and regress the coefficients of the country
dummy variables derived from the application of the hopit model on the country-level
characteristics. The coefficients of the country dummies contain information on the relative
levels of responsiveness present in countries controlling for differential item functioning. For
example, if country A has a greater (positive) coefficient than country B, we can assume that the
health care system in country A is more responsive than that in country B all other things being
13
equal. Hence we can exploit the variability in the coefficients of the country dummies in order to
investigate the influence of country characteristic.
The model is first estimated on a pool of 62 countries.8 The use of the estimated dependent
variable model is likely to induce heteroskedasticity due to sampling variation in the estimated
levels of country specific responsiveness (Lewis and Linzer, 2005). Accordingly, we apply
Huber-White estimated standard errors (White, 1980). To investigate heterogeneity in the impact
of regressors on responsiveness across different groups of countries, we stratify the countries
into European and Non-European (25 and 37 countries respectively), and estimate the model
separately on the two sub-samples. We also stratify the countries into low and medium HDI and
high HDI countries (38 and 29 countries respectively). The HDI is a composite index of human
development which combines indicators of life expectancy, educational attainment and income
(United Nations Development Program, 2006). Grouping countries into more homogeneous
groups aids analysis and interpretation of the results by facilitating comparison across countries
that are more similar in their stage of social and economic development (for example, see
Hollingsworth and Wildman, 2003).
4) Results:
All countries.
Table 2 presents the results of the application of the hopit model to correct for differential
item functioning for the domain of Dignity which is chosen as an example. The table reports the
coefficients and standard errors separately for the responsiveness equation and the reporting
behaviour equation. For brevity we report only the coefficients of first ten of the countries in
alphabetical order. For each country, the effects are significant in at least one of the four
thresholds. This indicates that differential item functioning is present in the data and is associated
with the country in which the respondent resides. Conditional on differential item functioning the

14
majority of the estimated coefficients on the country dummies in the responsiveness equation are
significant. These coefficients reflect observed differences in the adjusted levels of
responsiveness across countries relative to the baseline country of Mexico and are subsequently
used as the regressand in the second step of the estimation procedure.
Table 3 reports the estimates obtained from regressing the coefficients of the country
effects obtained through the hopit model on the country-wide determinants of responsiveness.
Three different specifications are reported: column (1) includes health system and population
socio-demographic characteristics; column (2) additionally includes measures of country wealth
and its income distribution, while column (3) is a saturated model which includes the regressors
of column (2) plus institutional factors. In this latter model the R^2 is higher for the domains
Dignity, Clarity of Communication, Confidentiality and Quality of Facilities (between 54% and
64%), than for Prompt Attention (33%) and Choice (13%). Comparing across the three
specifications for any particular domain it is noticeable that there are, in general, few large
changes in the sign, magnitude and statistical significance of the coefficients of variables
common to all models. This suggests that the regressors in specification (3) do not suffer from
high collinearity and that we are able to estimate robustly the independent effect of each
variable. Results of a link test for specification (3), shown in Table 3, also suggest that the
functional form of the model is correctly specified.9
The results of the saturated model show that health care expenditure per capita has a
positive association with responsiveness across all domains. The coefficients are significant with
the exception of Prompt attention and Choice. Of other plausible determinants of responsiveness
the proportion of health care expenditure in the public sector and population levels of education
appear most relevant. For both, the related coefficients are statistically significant (at the 10%
level or below), with the exception of the domain of Dignity. The percentage of health care
expenditure in the public sector has a negative association in all domains. This result tends to

15
confirm previous literature suggesting that public sector services are less likely to respond to the
preferences of users compared to private sector provision (Andaleeb, 2000; Angelopoulou et al.,
1998). As expected, population levels of education are positively related to responsiveness. GDP
per capita is consistently positively related to responsiveness but only attains statistical
significance for the domain Clarity of Communication. The percentage of the population over 65
and country secular social norms and values generally appear negatively associated with
responsiveness, while democratic history and income inequality mostly have a positive
association. The coefficients of these regressors, however, fail to reach statistical significance.
Sub-group results
Table 4 reports, for each domain, results for the estimated coefficients and standard errors
for the saturated model estimated separately for European and Non-European countries.10 In
estimating these models we are reliant on small samples (25 European and 37 non-European
countries) which have implications for the precision of the estimated relationships. Accordingly,
we should be cautious in drawing inferences from the results, particularly for the set of European
countries. Within these country groupings health care expenditure per capita generally continues
to be positively associated with responsiveness, with the exception of Prompt Attention and
Choice for Low and Medium HDI countries. For Non-European countries education is positively
associated with responsiveness in five domains and statistically significant in three of the six
domains. As before we observe a negative relationship with the percentage of health care
consumed in the public sector across all domains, which obtains statistical significance in four
domains. The consistency of results across domains suggests that this characteristic is important
for Non European countries. For democratic history, no consistent pattern across the two groups
of countries and domains is apparent; however, this regressor appears to be positively associated
with responsiveness in a large number of cases.
16
We also estimate saturated model on countries stratified into two groups according to their
level of the HDI Index, results for which are presented in Table 5.11 Adopting this stratification,
the coefficients of health care expenditures per capita continue to have a positive sign, with the
exception of Prompt Attention for Low and Medium HDI countries. The relationship between
education and responsiveness follows a similar pattern to that observed for European and Non-
European countries. The percentage of health care consumed in the public sector appears to have
a negative association with responsiveness for all domains and for both high HDI and low-
medium HDI countries, with the exception of Choice for high HDI countries.
5) Conclusions
This paper investigates the potential influence of aggregate country-level characteristics on
health system responsiveness, using data on 62 countries present in the World Health Survey.
While there exists evidence on variation in reported levels of health system responsiveness
across countries (Valentine et al. 2003b, Valentine et al. 2009, Sirven et al. 2008, Rice et al,.
2010a) there has been little investigation of the potential determinants of responsiveness,
particularly of system wide characteristics (World Health Report, 2000). To our knowledge no
other study exists that considers simultaneously several plausible country-level characteristics as
being potential determinants of health system responsiveness. Other studies have considered
only bivariate associations between health care spending per capita and responsiveness (World
Health Report, 2000, Anderson and Hussey 2001, Valentine et al., 2003b, Valentine et al. 2009)
and do not control for other potential influences. Moreover, the majority of those studies rely on
data that are not as extensive as those offered by the WHS and do not consider the issue of
country-level differences in the reporting of responsiveness (differential item functioning) which
arises when dealing with self-reported survey data.

17
The country-level characteristics considered as potential determinants of health system
responsiveness refer to the way health care systems are organised and funded, the socio-
demographic characteristics of the populations served and the economic, cultural and
institutional characteristics of countries. We pay particular attention to the role of health care
expenditures per capita while controlling for potential confounding factors. In order to address
the issue of differential item functioning we make use of information on the set of anchoring
vignettes that allow us to benchmark self reports of responsiveness to a common scale using the
hopit model. Accordingly, we adopt a two step procedure: after correcting for differential item
functioning using the hierarchical ordered probit model we investigate the influence of health
spending per capita and other country characteristics on levels of responsiveness that have been
made cross-country comparable by controlling for systematic differences in reporting behaviour.
Health expenditure per capita has a positive association with responsiveness across all domains,
and its effect is statistically significant for the majority. The other relevant determinants of
responsiveness appear to be health care expenditure in the public sector and population levels of
education. These variables appear to have a negative and positive association with
responsiveness, respectively.
To investigate heterogeneity in influences on responsiveness, we stratify countries into
European and Non-European and according to the Human Development Index. Grouping
countries into more homogeneous groups allows comparison across countries that are more
similar in their stage of social and economic development which aids interpretation of results.
This is, however, at the cost of relying on small sample sizes. In general, health care expenditure
per capita continues to be positively associated with responsiveness across countries within these
sub-groups.
We are cautious in drawing strong inferences about causality from this study. However, the
results are plausible and indicate that levels of responsiveness are likely to be positively related

18
to a country’s level of health spending and its educational development. Equally, the negative
association with public sector spending is consistent with the hypothesis that private markets for
health care generate improved levels of responsiveness as market participants seek to attract
patients. We therefore tentatively suggest that policy makers seeking to enhance responsiveness
levels might consider sharpening some elements of choice and competition within their systems.
However, such experiments should be implemented and evaluated carefully, as there are likely to
be numerous other consequences of such reforms.
19
1 The long-form questionnaire uses two questions items per domain, while the short-form questionnaire uses only
one. We use the eight items that are common to both the long and short form questionnaire.
2 It has not been possible to perform the analysis on Autonomy and Social Support due to convergence problems in
estimating the hopit model to adjust for reporting behaviour.
3 In our analysis we use the average of the Gini coefficient across the years 1992-2007, as reported in the Human
Development Report 2009.
4 We use GDP per capita as a dummy variable due to high collinearity between the original continuous variable and
health care expenditure per capita (the coefficient of correlation is 0.95).
5 Since model identification is secured through the use of the set of anchoring vignettes, can be specified to be
equivalent to . This contrast with the related generalized ordered probit model where identification is secured
through imposing exclusion restrictions on the set of covariates, , in the outcome equation.
6 We exclude Australia and Norway since data on some of the key domains are not available for these countries.
7 Mexico is chosen as the baseline due to the large sample size for this country compared to other countries.
8 Mauritius, Morocco, Sri Lanka, United Arab Emirates and Tunisia are excluded due to missing data on key
variables.
9 The link test is undertaken by performing an auxiliary regression of the dependent variable on the linear prediction
from the estimated regression function and its squared value. The test is based on the coefficient for this second
term: if significant then the linearity assumption of the original model is likely to be misspecified (Pregibon, 1980).
10 We do not include in this specification the dummy variable “secular values” since its inclusion would create
identification problems, given that the vast majority of European countries appear to be characterized by these
values.
11 Again, as with the stratification by European and non-European countries, the estimates are based on low sample
sizes and caution is warranted in drawing strong conclusions from these estimates.

20
References
Anderson, G. and P. Hussey .2001. “Comparing Health System Performance in OECD
Counties”. Health Affairs 20(3): 219-232.
Angelopoulou, P., P. Kangis and G. Babis. 1998. “Private and public medicine: a comparison of
quality perception”. International Journal of Health Care Quality Assurance 11(1): 14-
20._
Azfar, O. and T. Gurgur. 2008. “Does corruption affect health and education outcomes in the
Philippines?'' Economics of Governance, 9, 197–244.
Bago d'Uva, T., E. van Doorlsaer, M. Lindeboom and O. O'Donnell. 2008. “Does reporting
heterogeneity bias the measurement of health disparities?”. Health Economics 17(3): 351-
375.
Bennett, S., K. Hanson, P. Kadama and D. Montagu. 2005. “Working with the non state sector to
achieve public health goals”. Working Paper No 2 Geneva, World Health Organisation.
Besley, T. and S. Coate. 1991. “Public Provision of Private Goods and the Redistribution of
Income”. American Economic Review 81(4): 979–84.
Besley, T. and M. Gouveia. 1994. “Alternative Systems of Health Care Provision”. Economic
Policy 9(19): 200-258.
Blendon, R. J., M. Kim and J. M. Benson. 2001. “The Public Versus The World Health
Organization On Health System Performance”. Health Affairs 20(3): 10-20.
Brugha, R. and A. Zwi. 1998. “Improving the quality of private sector delivery of public health
services: challenges and strategies”. Health Policy Plan 13(2):107-120.
Castro-Leal, F., G. Dayton, L. Demery and K. Mehra. 2000. “Public Spending on Health Care in
Africa: Do the Poor Benefit?”. Bulletin of the World Health Organisation 78(1): 66–74.
Davies, H.T.O., S.M. Nutley and R. Mannion. 2000. “Organisational culture and quality of
health care”. Quality in Health Care 9: 111–119.

21
Dow, W.H. and E. Norton. 2002. “The red herring that eats cake: Heckit versus two-part model
redux”. Triangle Health Economics Working Paper Series, Working Paper 1.
Epple, D. and R.E Romano. 1996. “Public Provision of Private Goods”. The Journal of Political
Economy 104(1): 57-84.
Felder, S., M. Meier and H. Schmitt, 2000. “Health care expenditure in the last months of life”.
Journal of Health Economics 19: 679–95.
Ferguson, B.D., A. Tandon, E. Gakidou and C.J.L. Murray.,2003. “Estimating Permanent
Income using Indicator Variables”. In Health systems performance assessment: debates,
methods and empiricism, edited by C.J.L. Murray and D.B. Evans, pp 748-760. Geneva:
World Health Organisation.
Gerring, J., P.J. Bond, W.T.Barndt and C. Moreno. 2005. “Democracy and Economic Growth: A
Historical Perspective.”. World Politics 57(3): 323–64.
Gouveia, M. 1997. “Majority rule and the public provision of a private good”. Public Choice 93:
221–244.
Gravelle, H., M. Sutton, S. Morris, F. Windmeijerd, A. Leylande, C. Dibbenf and M. Muirheadg.
2003. “Modelling supply and demand influences on the use of health care: implications for
deriving a needs-based capitation formula”. Health Economics 12: 985–1004.
Hanson, K., L. Gilson, C. Goodman, A. Mills, R. Smith, R. Feachem, N. Sekhri Feachem, T.
Perez Koehlmoos and H. Kinlaw. 2008. “Is Private Health Care the Answer to the Health
Problems of the World’s Poor?”. PLoS Medicine 5(11): 1528-1532.
Hollingsworth, B. and J. Wildman. 2003. “The efficiency of health production: re-estimating the
WHO panel data using parametric and non-parametric approaches to provide additional
information”. Health Economics 12: 493–504.
Inglehart, R. and C. Welzel. 2005. Modernization, Cultural Change and Democracy. New York:
Cambridge University Press.

22
Kapteyn, A., P.J. Smith and A. van Soest. 2007. “Disability and vignettes in the US and the
Netherlands”. The American Economic Review 97: 461-473.
King, G., C. J. L. Murray, J. Salomon and A. Tandon. 2004. “Enhancing the validity and cross-
cultural comparability of measurement in survey research”. American Political Science
Review 98(1): 184-91.
Lewis, J. B. and D.A. Linzer. 2005. “Estimating Regression Models in Which the Dependent
Variable Is Based on Estimates”. Political Analysis 13: 345-364.
Jones, A.M., N. Rice, T. Bago d'Uva and S. Balia. 2007. Applied Health Economics. New York:
Routledge.
Marshall, M., R. Sheaff, A. Rogers, S. Campbell, S. Halliwell, S. Pickard, B. Sibbald and M.
Roland. 2002. “Qualitative study of the cultural changes in primary care organisations
needed to implement clinical governance”. British Journal of General Practice 52: 641-
645.
Murray, C. and J. Frenk. 2000. “A framework for assessing the performance of health systems”.
Bulletin of the World Health Organization 78: 717-731.
O'Donnell, O., E. van Doorslaer, R.P. Rannan-Eliya, A. Somanathan, S.R. Adhikari, D.
Harbianto, C.C. Garg, P. Hanvoravongchai,M.N. Huq, A Karan, M.G. Leung, C.W. Ng,
B.R. Pande, K. Tin, K. Tisayaticom, L. Trisnantoro, Y. Zhang, and Y Zhao. 2007. “The
Incidence of Public Spending on Healthcare: Comparative Evidence from Asia”. World
Bank Economic Review 21(1): 93-123.
Patouillard, E., C.A. Goodman, K.G. Hanson and A.J. Mills. 2007. “Can working with the
private for-profit sector improve utilization of quality health services by the poor? A
systematic review of the literature”. International Journal for Equity in Health 6(17): 1-11.
Persson, T. and G. Tabellini. 2009. “Democratic Capital: The Nexus of Political and Economic
Change”. American Economic Journal, Macroeconomics 1(2): 88–126.

23
Pregibon D. 1980. “Goodness-of-link tests for generalized linear models”. Applied Statistics 29:
15–24.
Rice, N. and P.C. Smith. 2001. “Capitation and risk adjustment in health care financing: an
international progress report”. The Milbank Quarterly 79: 81-113.
Rice, N., S. Robone and P.C. Smith. 2010a. “International Comparison of Public Sector
Performance: The Use of Anchoring Vignettes to adjust Self-Reported Data”. Evaluation
16(1): 81-101.
Rice, N., S. Robone and P.C. Smith. 2010b. Analysis of the Validity of the Vignette Approach to
Correct for Heterogeneity in Reporting Health System Responsiveness”. European Journal
of Health Economics: forthcoming.
Sahn, D.E. and S.D. Younger. 2000. “Expenditure Incidence in Africa: Microeconomic
Evidence”. Fiscal Studies 21(3):321–48.
Salomon, J., A. Tandon, C. J. L. Murray and World Health Survey Pilot Study Collaborating
Group. 2004. “Comparability of self-rated health: Cross sectional mutli-country survey
using anchoring vignette”s. British Medical Journal 328(258).
Seshamani, M. and A. Gray. 2004. “A longitudinal study of the effects of age and time to death
on hospital costs”. Journal of Health Economics 23: 217–35.
Sirven, N., B. Santos-Eggimann and J. Spagnoli. 2008. “Comparability of Health Care -
Responsiveness in Europe - Using anchoring vignettes from SHARE”, IRDES Working
Paper 15, 2008/09.
Smith, P.C., N. Rice and R. Carr-Hill. 2001. “Capitation Funding in the Public Sector”. Journal
of the Royal Statistical Society, Series A 164(2): 217-257.
Tandon, A., C. J. L. Murray, J.A. Salomon and G. King. 2003. “Statistical models for enhancing
cross-population comparability”. In Health systems performance assessment: debates,

24
methods and empiricism, edited by C.J.L. Murray and D.B. Evans, pp 727-746. Geneva:
World Health Organisation.
Terza, J. V. 1985. “Ordinal probit: a generalization”, Communication in Statistics 14(1): 1-11.
UNDP. 2006, ``Capacity development practice note'',
http://www.capacity.undp.org/index.cfm?module=Library&page=Document&DocumentI
D=5599
Üstün, T. B., A. Mechbal and C. J. L. Murray. 2003. “The World Health Surveys”. In Health
systems performance assessment: debates, methods and empiricism, edited by C.J.L.
Murray and D.B. Evans, pp 762-796. Geneva: World Health Organisation.
Valentine, N.B., A. De Silva, K. Kawabata, C. Darby, C.J.L. Murray and D. Evans. 2003a.
“Health system responsiveness: concepts, domains and operationalization”. In Health
systems performance assessment: debates, methods and empiricism, edited by C.J.L.
Murray and D.B. Evans, pp 573-596. Geneva: World Health Organisation.
Valentine, N.B., J.P. Ortiz, A. Tandon, K. Kawabata, D.B. Evans, C.J.L. Murray. 2003b.
“Patient Experiences with Health Services: Population Surveys from 16 OECD Counties”.
In Health systems performance assessment: debates, methods and empiricism, edited by
C.J.L. Murray and D.B. Evans, pp 643-652. Geneva: World Health Organisation.
Valentine, N.B., A. Prasad, N. Rice, S. Robone, and S. Chatterji. 2009. “Health systems
responsiveness - a measure of the acceptability of health care processes and systems”. In:
Performance measurement for health system improvement: experiences, challenges and
prospects, edited by P.C. Smith, E. Mossialos and S. Leatherman. Pp 138-186. London:
WHO European Regional Office.
Vollmer, S. and M. Ziegler. 2009. “Political Institutions and Human Development Does
Democracy Fulfill its 'Constructive' and 'Instrumental' Role?”. Word Bank, Policy
Research Working Paper, WPS4818

25
White, H. 1980. ‘‘A Heteroscadastically-Consistent Covariance Matrix Estimator and a Direct
Test for the Heteroscasticity”.Econometrica 48: 817–838.
World Health Organization. 2000. The World Health Report 2000. Health systems: improving
performance. Geneva: World Health Organization.
Zweifel, P., S. Felder S and M. Meiers. 1999. “Ageing of population and health care
expenditure: a red herring?”. Health Economics 8: 485–96.

26
Appendix 1: Illustration of reporting heterogeneity
Differential reporting behaviour can be shown diagrammatically with the following example
Country A
Country B
NOTE:
Yi* = latent (and unobservable) possible levels of responsiveness = cut points that divide two different response categoriesRed vertical line = (unobservable) level of responsiveness experienced by individual in every country
Assume individuals in country A and country B are asked to rate the responsiveness of their health systemsaccording to the scale ranging from “very bad” to “very good” and assume individuals within a country have the
same reporting behaviour. The thresholds in the figure represent the points that divide the available response
categories. Reporting heterogeneity results in respondents in country A applying a different set of thresholds to theunderlying latent construct compared to respondents in country B. A casual inspection of the ratings in the twocountries would suggest that individuals in country A face poorer health system responsiveness compared toindividuals in country B (for example, the proportion of individuals reporting “very good” responsiveness is less incountry A than in country B). However, both groups face the same underlying level of responsiveness as depictedby the solid vertical line. Anchoring the location of the thresholds to a common scale is fundamental to comparativeanalysis across the two countries. The challenge is to model the positioning of the thresholds as functions ofobserved characteristics of the relevant populations and use this information to benchmark a comparison to a chosenthreshold scale. A situation in which the effect of a given characteristic, such as educational attainment, appliesequally across all thresholds is termed parallel cut-point shift. More commonly, where the effect of a characteristicvaries across thresholds, this is termed non-parallel cut-point shift.
*iY
Latent
Very Bad Bad ModerateGood Very Good
1 2 3 4
*iY
Latent
Very Bad BadModerate
GoodVery Good
1 2 3 4

27
Figure 1: Domains of responsivenessThe eight domains of responsiveness defined by the WHO are as follows (see Valentine et al.,2003a for a full exposition of these domains):
Autonomy: respect of patients’ views of what is appropriate and allowing the patient tomake informed choices; Choice: An individual’s right or opportunity to choose a health care institution and health
provider and to secure a second opinion and access specialist services when required; Clarity of communication: Clear explaination to patients and family the nature of the illness,
details of treatment and available options; Confidentiality of Personal Information: privacy in the environment in which consultations are
conducted and the concept of privileged communication and confidentiality of medical records; Dignity: the ability of patients to receiving care in a respectful, caring, and non-
discriminatory setting; Prompt attention: the ability to access care rapidly in the case of emergencies, or readily with
short waiting times for non-emergencies; Quality of basic amenities: the physical environment and services often referred to as “hotel
facilities”, including clean surroundings, regular maintenance, adequate furniture, sufficientventilation, enough space in waiting rooms etc; Access to family and community support: the extent to which patients have access to their
family and friends when receiving care and the maintenance of regular activities (e.g. opportunityto carry out religious and cultural practices).
Example questions used in the WHS to measure responsiveness include: Autonomy: How would you rate your experience of being involved in making decisions
about your health care of treatment? Choice: How would you rate the freedom you had to choose the health care providers that
attended to you? Communication: How would you rate your experience of how clearly health care providers
explained things to you? Confidentiality: How would you rate the way your personal information was kept
confidential? Dignity: How would you rate the way your privacy was respected during physical
examinations and treatments? Quality of basic amenities: How would you rate the cleanliness of the rooms inside the
facility, including toilets? Prompt attention: How would you rate the amount of time you waited before being attended
to? Access to family and friends: How would you rate the ease of having family and friends visit
you?
The above provide examples only and not an exhaustive list of questions for each domain. Theresponse categories available to respondents were “very good”, “good”, “moderate”, “bad” and“very bad”.

28
Figure 2: Examples of vignette questions used in the WHS
Respectful Treatment[Anya] took her baby for a vaccination. The nurse said hello but did not ask for [Anya’s] or thebaby’s name. The nurse also examined [Anya] and made her remove her shirt in the waitingroom.Q1: How would you rate her experience of being greeted and talked to respectfully?Q2; How would you rate the way her privacy was respected during physical examinations andtreatments?
Communication[Rose] cannot write or read. She went to the doctor because she was feeling dizzy. The doctordidn’t have time to answer her questions or to explain anything. He sent her away with a piece ofpaper without telling her what it said.Q1: How would you rate her experience of how clearly health care providers explained things toher?Q2: How would you rate her experience of getting enough time to ask questions about her healthproblem of treatment?
Confidentiality[Simon] was speaking to his doctor about an embarrassing problem. There was a friend and aneighbour of his in the crowded waiting room and because of the noise the doctor had to shoutwhen telling [Simon] the treatment he needed.Q1: How would you rate the way the health services ensured [Simon] could talk privately tohealth care providers?Q2: How would you rate the way [Simon’s] personal information was kept confidential?
Quality of Basic Amenities[Wing] had his own room in the hospital and shared a bathroom with two others. The room andbathroom were cleaned frequently and had fresh air.Q1: How would you rate the cleanliness of the rooms inside the facility, including toilets?Q2: How would you rate the amount of space [Wing] had?
Note that the above provide examples only and not an exhaustive list of possible vignettes foreach domain. The response categories available to respondents were “very good”, “good”,“moderate”, “bad” and “very bad”.

29
Table 1: Descriptive statistics on the country variable potentially influencing health systemresponsiveness
n. obs mean st.dv min max
health expeditures per capita 66 0.561 0.821 0.003 2.852
percentage public exp over total exp 66 0.531 0.212 0.06 0.90
percentage population over 65 67 0.088 0.058 0.01 0.20
education index 67 0.783 0.208 0.23 0.99
corruption index 67 0.438 0.224 0.14 0.94
HIGH gdp 67 0.507 0.504 0 1
gini coefficient 63 0.395 0.100 0.25 0.74
secular values 67 0.433 0.499 0 1
democratic history 67 0.494 0.357 0 1
full democracy 67 0.313 0.467 0 1

30
Table 2: coefficients and standard errors for the responsiveness equation and thereporting behaviour equation of the HOPIT model (first step of the estimationprocedure) for the domain “Dignity”, for the pool of countries
Coef. Std. Err. Coef. Std. Err. Coef. Std. Err. Coef. Std. Err. Coef. Std. Err.
dumI2 0.02 0.01 0.04 0.01 0.01 0.01 -0.01 0.01 -0.02 0.01dumI3 0.09 0.01 0.07 0.01 0.02 0.01 -0.02 0.01 -0.06 0.01female 0.03 0.01 0.03 0.01 0.02 0.01 0.00 0.01 0.00 0.01age_yrs 0.00 0.00 0.00 0.00 0.00 0.00 0.00 0.00 0.00 0.00edu_yrs 0.00 0.00 0.01 0.00 0.00 0.00 0.00 0.00 -0.01 0.00
ARE 0.11 0.06 -0.01 0.05 -0.05 0.04 0.06 0.04 -0.43 0.04AUT 0.18 0.07 0.06 0.08 -0.19 0.06 -0.14 0.06 -0.62 0.06BEL 0.42 0.08 0.67 0.07 0.47 0.07 0.38 0.07 -0.03 0.07BFA -0.09 0.04 0.21 0.04 0.21 0.03 0.18 0.03 -0.13 0.04BGD -0.19 0.04 0.08 0.03 -0.04 0.02 0.10 0.02 -0.22 0.02BIH -0.04 0.06 0.17 0.05 -0.06 0.04 -0.01 0.04 -0.43 0.04BRA 0.20 0.03 0.48 0.02 0.22 0.02 0.08 0.02 -0.25 0.02CHN 0.07 0.04 -0.45 0.04 0.03 0.03 0.39 0.03 0.17 0.03CIV -0.11 0.05 0.16 0.04 0.26 0.04 0.33 0.04 -0.02 0.04COG -0.05 0.07 0.21 0.07 0.43 0.06 0.57 0.06 -0.10 0.06
responsiveness
equationreporting behaviour equation
1st cut-point 2nd cut-point 3rd cut-point 4th cut-point

31
Table 3: OLS estimates of the influence of all country-specific variables on health system responsiveness
variables 1 2 3 1 2 3 1 2 3b/se b/se b/se b/se b/se b/se b/se b/se b/se
health exp. per capita 0.228*** 0.219*** 0.206*** 0.038 0.035 0.046 0.150*** 0.115** 0.106*0.046 0.05 0.058 0.044 0.049 0.057 0.039 0.04 0.045
% public exp. over total -0.204 -0.28 -0.279 -0.432* -0.539** -0.572** -0.322* -0.467** -0.452**0.155 0.143 0.15 0.187 0.182 0.183 0.157 0.138 0.14
% population over 65 -0.009 -0.003 -0.005 -0.007 0.001 -0.005 -0.006 -0.005 -0.0030.007 0.011 0.013 0.009 0.01 0.009 0.008 0.009 0.012
education index 0.528** 0.355 0.354 0.730** 0.649** 0.571* 0.941*** 0.724** 0.758*0.187 0.214 0.22 0.218 0.24 0.266 0.241 0.266 0.286
high gdp 0.074 0.063 -0.025 0.013 0.213** 0.193*0.065 0.075 0.083 0.094 0.077 0.083
GINI index 0.352 0.306 0.18 0.353 0.108 0.0180.312 0.329 0.269 0.313 0.316 0.336
secular values 0.006 0.121 -0.0510.101 0.092 0.118
democratic history 0.059 -0.032 0.0330.113 0.128 0.104
constant -0.355** -0.395** -0.384** -0.392** -0.397* -0.394* -0.929*** -0.815*** -0.812***0.118 0.128 0.135 0.146 0.174 0.169 0.143 0.191 0.195
r2 0.509 0.544 0.546 0.262 0.315 0.334 0.569 0.633 0.636N 66 62 62 66 62 62 66 62 62link test p-values p-values p-valueshat 0.000 0.000 0.000hat^2 0.904 0.306 0.633
Dignity Prompt Attention Clarity of Communic.
Notes: Robust standard errors; *** p<0.01, ** p<0.05, * p<0.1.

32
Table 3: (cont.)
variables 1 2 3 1 2 3 1 2 3b/se b/se b/se b/se b/se b/se b/se b/se b/se
health exp. per capita 0.169*** 0.159*** 0.140** 0.321*** 0.282*** 0.275*** 0.111 0.078 0.1110.036 0.036 0.04 0.06 0.064 0.075 0.104 0.108 0.125
% public exp. over total -0.178 -0.317* -0.301* -0.422 -0.658* -0.637* -0.592* -0.634* -0.624*0.146 0.137 0.14 0.287 0.271 0.268 0.289 0.286 0.295
% population over 65 -0.01 0.001 0.002 -0.019 -0.014 -0.01 -0.003 -0.001 0.0050.008 0.008 0.008 0.013 0.011 0.012 0.013 0.014 0.017
education index 0.608*** 0.446* 0.484* 1.073** 0.900* 0.950* 0.506 0.488 0.5150.17 0.18 0.207 0.38 0.416 0.451 0.262 0.263 0.292
high gdp 0.045 0.015 0.173 0.149 0.04 0.0590.068 0.079 0.086 0.1 0.12 0.127
GINI index 0.342 0.21 -0.015 -0.122 0.103 0.1760.309 0.349 0.604 0.64 0.512 0.603
secular values -0.052 -0.076 -0.0560.087 0.12 0.14
democratic history 0.078 0.017 -0.1580.097 0.138 0.227
constant -0.598*** -0.638*** -0.628*** -0.952*** -0.795* -0.797* -0.460* -0.456 -0.4870.108 0.172 0.176 0.25 0.376 0.37 0.176 0.262 0.288
r2 0.462 0.531 0.54 0.55 0.601 0.603 0.094 0.126 0.133N 66 62 62 66 62 62 66 62 62link test p-values p-values p-valueshat 0.005 0.000 0.169hat^2 0.464 0.661 0.522
Confident. Quality of Facilities Choice
Notes: Robust standard errors; *** p<0.01, ** p<0.05, * p<0.1.

33
Table 4: OLS estimates of the influence of country-specific variables on health system responsiveness, for countries stratified inEuropean and Non-European
variablesEuropean
Countries
Non
European
Countries
European
Countries
Non
European
Countries
European
Countries
Non
European
Countries
European
Countries
Non
European
Countries
European
Countries
Non
European
Countries
European
Countries
Non
European
Countries
b/se b/se b/se b/se b/se b/se b/se b/se b/se b/se b/se b/se
health exp. per capita 0.173 0.125 0.02 -0.501 0.131 0.686 0.218* 0.464 0.297* 1.021 0.187 -0.434
0.126 0.278 0.072 0.398 0.093 0.387 0.081 0.361 0.123 0.585 0.187 0.498
% public exp. over total 0.201 -0.468** -0.567 -0.514* 0.158 -0.417 -0.095 -0.36 0.011 -0.705* 0.36 -0.864**
0.535 0.157 0.304 0.225 0.395 0.218 0.344 0.203 0.52 0.33 0.794 0.281
% population over 65 -0.006 0.022 0.02 0.017 0.012 -0.001 0.022 -0.019 0.029 -0.044 0.015 0.03
0.023 0.012 0.013 0.017 0.017 0.017 0.015 0.016 0.022 0.026 0.034 0.022
education index 0.677 0.002 -7.289*** 0.503 0.719 0.617* -1.638 0.677* -0.133 1.138** -8.166 -0.252
2.933 0.189 1.668 0.272 2.169 0.264 1.886 0.246 2.856 0.399 4.355 0.34
high gdp -0.066 0.150* -0.053 0.174 0.05 0.127 -0.233 -0.066 -0.063 0.026 -0.079 0.555***
0.2 0.072 0.114 0.104 0.148 0.101 0.129 0.094 0.195 0.152 0.297 0.13
GINI index -1.642 0.721* -0.972 0.227 0.563 -0.353 0.364 -0.019 0.462 -0.661 1.978 -0.046
1.485 0.294 0.844 0.421 1.098 0.41 0.955 0.382 1.445 0.619 2.204 0.528
democratic history 0.208 0.005 0.811** -0.124 -0.083 0.141 0.336 0.131 0.11 0.109 0.287 -0.219
0.432 0.12 0.246 0.172 0.32 0.167 0.278 0.156 0.421 0.252 0.642 0.215
constant -0.388 -0.407* 6.681*** -0.4 -1.486 -0.659** 0.678 -0.546* -1.051 -0.566 5.963 -0.076
2.9 0.153 1.649 0.219 2.144 0.213 1.865 0.198 2.824 0.322 4.307 0.274
r2 0.54 0.62 0.59 0.52 0.48 0.68 0.60 0.45 0.65 0.51 0.31 0.57
N 25 37 25 37 25 37 25 37 25 37 25 37
Dignity
Prompt
Attention
Clarity of
Communic. Confident
Quality of
Facilities Choice
Notes: Robust standard errors; “High gdp” has been defined relative to the set of countries analyzed; *** p<0.01, ** p<0.05, * p<0.1.
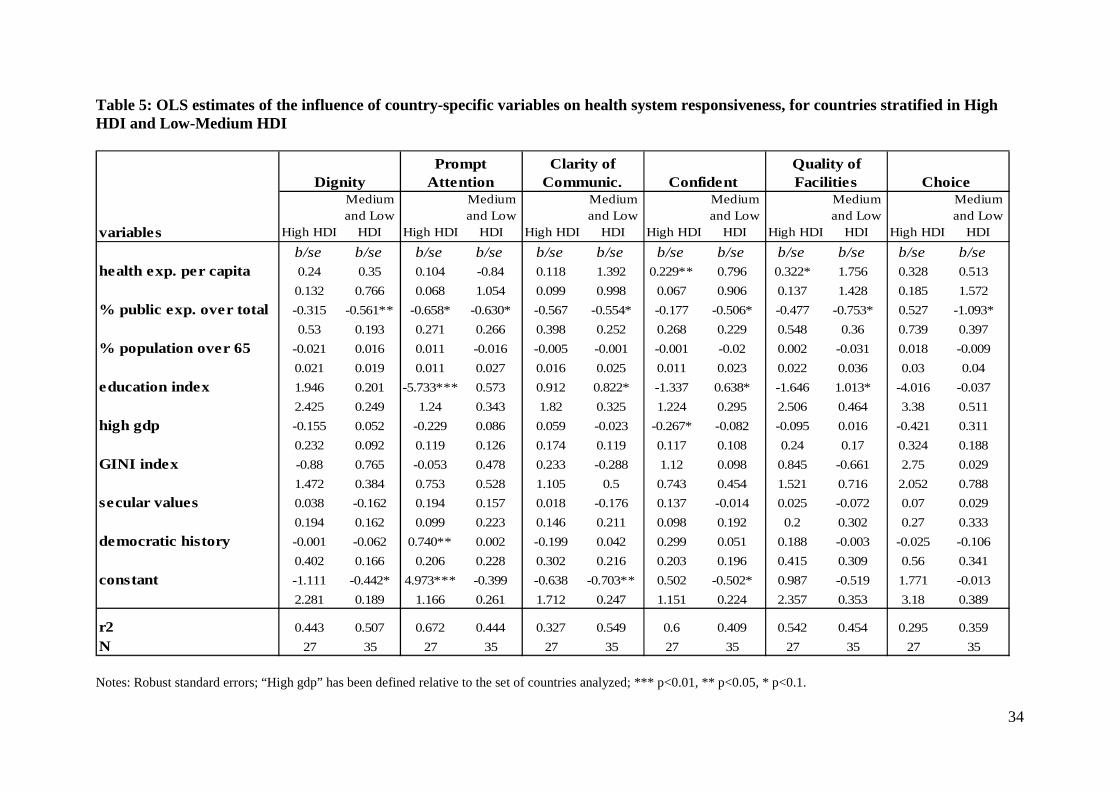
34
Table 5: OLS estimates of the influence of country-specific variables on health system responsiveness, for countries stratified in HighHDI and Low-Medium HDI
variables High HDI
Medium
and Low
HDI High HDI
Medium
and Low
HDI High HDI
Medium
and Low
HDI High HDI
Medium
and Low
HDI High HDI
Medium
and Low
HDI High HDI
Medium
and Low
HDI
b/se b/se b/se b/se b/se b/se b/se b/se b/se b/se b/se b/se
health exp. per capita 0.24 0.35 0.104 -0.84 0.118 1.392 0.229** 0.796 0.322* 1.756 0.328 0.513
0.132 0.766 0.068 1.054 0.099 0.998 0.067 0.906 0.137 1.428 0.185 1.572
% public exp. over total -0.315 -0.561** -0.658* -0.630* -0.567 -0.554* -0.177 -0.506* -0.477 -0.753* 0.527 -1.093*
0.53 0.193 0.271 0.266 0.398 0.252 0.268 0.229 0.548 0.36 0.739 0.397
% population over 65 -0.021 0.016 0.011 -0.016 -0.005 -0.001 -0.001 -0.02 0.002 -0.031 0.018 -0.009
0.021 0.019 0.011 0.027 0.016 0.025 0.011 0.023 0.022 0.036 0.03 0.04
education index 1.946 0.201 -5.733*** 0.573 0.912 0.822* -1.337 0.638* -1.646 1.013* -4.016 -0.037
2.425 0.249 1.24 0.343 1.82 0.325 1.224 0.295 2.506 0.464 3.38 0.511
high gdp -0.155 0.052 -0.229 0.086 0.059 -0.023 -0.267* -0.082 -0.095 0.016 -0.421 0.311
0.232 0.092 0.119 0.126 0.174 0.119 0.117 0.108 0.24 0.17 0.324 0.188
GINI index -0.88 0.765 -0.053 0.478 0.233 -0.288 1.12 0.098 0.845 -0.661 2.75 0.029
1.472 0.384 0.753 0.528 1.105 0.5 0.743 0.454 1.521 0.716 2.052 0.788
secular values 0.038 -0.162 0.194 0.157 0.018 -0.176 0.137 -0.014 0.025 -0.072 0.07 0.029
0.194 0.162 0.099 0.223 0.146 0.211 0.098 0.192 0.2 0.302 0.27 0.333
democratic history -0.001 -0.062 0.740** 0.002 -0.199 0.042 0.299 0.051 0.188 -0.003 -0.025 -0.106
0.402 0.166 0.206 0.228 0.302 0.216 0.203 0.196 0.415 0.309 0.56 0.341
constant -1.111 -0.442* 4.973*** -0.399 -0.638 -0.703** 0.502 -0.502* 0.987 -0.519 1.771 -0.013
2.281 0.189 1.166 0.261 1.712 0.247 1.151 0.224 2.357 0.353 3.18 0.389
r2 0.443 0.507 0.672 0.444 0.327 0.549 0.6 0.409 0.542 0.454 0.295 0.359
N 27 35 27 35 27 35 27 35 27 35 27 35
Dignity
Prompt
Attention
Clarity of
Communic. Confident
Quality of
Facilities Choice
Notes: Robust standard errors; “High gdp” has been defined relative to the set of countries analyzed; *** p<0.01, ** p<0.05, * p<0.1.