Embed Size (px)
Citation preview

Chapter 4
Understanding LLW—Its Characteristics, Volumes,
and Health Effects
CONTENTSPage
Overview . . . . . . . . . . . . . . . . . . . . . . . . . . . . . . . . . . . . . . . . . . . . . . . . . . . . . . . . . . . . . . . . . . . . . . . . .81What Is Low-Level Radioactive Waste? . . . . . . . . . . . . . . . . . . . . . . . . . . . . . . . . . . . . . . . . . . . . .81Commercial LLW . . . . . . . . . . . . . . . . . . . . . . . . . . . . . . . . . . . . . . . . . . . . . . . . . . . . . . . . . . . . . . . . . 81
Class A Waste . . . . . . . . . . . . . . . . . . . . . . . . . . . . . . . . . . . . . . . . . . . . . . . . . . . . . . . . . . . . . . . . . . 83Class B Waste . . . . . . . . . . . . . . . . . . . . . . . . . . . . . . . . . . . . . . . . . . . . . . . . . . . . . . . . . . . . . . . . . .83Class C Waste . . . . . . . . . . . . . . . . . . . . . . . . . . . . . . . . . . . . . . . . . . . . . . . . . . . . . . . . . . . . . . . . . 85Greater-Than-Class C Waste . . . . . . . . . . . . . . . . . . . . . . . . . . . . . . . . . . . . . . . . . . . . . . . . . . . . 85
Special Categories of LLW . . . . . . . . . . . . . . . . . . . . . . . . . . . . . . . . . . . . . . . . . . . . . . . . . . . . . . . . 85Mixed LLW . . . . . . . . . . . . . . . . . . . . . . . . . . . . . . . . . . . . . . . . . . . . . . . . . . . . . . . . . . . . . . . . . . . 85Naturally Occurring and Accelerator Produced Radioactive Material (NARM) . . . . . . . 87Other LLW . . . . . . . . . . . . . . . . . . . . . . . . . . . . . . . . . . . . . . . . . . . . . . . . . . . . . . . . . . . . . . . . . . . . 87
Comparison of LLW to Other Types of Radioactive Waste . . . . . . . . . . . . . . . . . . . . . . . . . . . 87Implications of Waste Minimization and Treatment Tecchniques
on Future Waste Volumes . . . . . . . . . . . . . . . . . . . . . . . . . . . . . . . . . . . . . . . . . . . . . . . . . . . . .87Understanding Radiation and Its Health Effects . . . . . . . . . . . . . . . . . . . . . . . . . . . . . . . . . . . . . . 90
Sources of Ionizing Radiation . . . . . . . . . . . . . . . . . . . . . . . . . . . . . . . . . . . . . . . . . . . . . . . . . . . .90The Nature of Ionizing Radiation . . . . . . . . . . . . . . . . . . . . . . . . . . . . . . . . . . . . . . . . . . . . . . . . .91Measuring Radiation . . . . . . . . . . . . . . . . . . . . . . . . . . . . . . . . . . . . . . . . . . . . . . . . . . . . . . . . . . . . 92Biological Responses to Radiation . . . . . . . . . . . . . . . . . . . . . . . . . . . . . . . . . . . . . . . . . . . . . . . 92Uncertainties in Estimating Health Effects From Low Radiation Doses . . . . . . . . . . . . . . 93Migration Pathways and Mechanisms of Radiation Exposure . . . . . . . . . . . . . . . . . . . . . . . 94
Chapter 4 References . . . . . . . . . . . . . . . . . . . . . . . . . . . . . . . . . . . . . . . . . . . . . . . . . . . . . . . . . . . . . . 96
BoxesBox Page4-A. types of Radioactive Waste . . . . . . . . . . . . . . . . . . . . . . . . . . . . . . . . . . . . . . . . . . . . . . . . . . 824-B. Waste Minimization and Treatment Techniques . . . . . . . . . . . . . . . . . . . . . . . . . . . . . . . . 89
FiguresFigure Page4-1. Commercial LLW Disposal in 1988 . . . . . . . . . . . . . . . . . . . . . . . . . . . . . . . . . . . . . . . . . . . 834-2. Generators of Commercial LLW Received at Disposal Sites in 1987 . . . . . . . . . . . . . . 844-3. Estimated Annual Generation of Commercial LLW in 1987 . . . . . . . . . . . . . . . . . . . . . . 844-4. Yearly Volumes and Radioactivity of Commercial LLW
Shipped for Disposal (1980-1988) . . . . . . . . . . . . . . . . . . . . . . . . . . . . . . . . . . . . . . . . . . . . . . 884-5. Volumes of Commercial LLW Disposal in 1986, 1987, and 1988 . . . . . . . . . . . . . . . . 904-6. The Percentage Contribution of Various Radiation Sources to the Total
Average Effective Dose Equivalent in the U.S. Population . . . . . . . . . . . . . . . . . . . . . . . 914-7. Pathway Analysis to Biota and Man: Generation and
Disposal Locations on Common Site . . . . . . . . . . . . . . . . . . . . . . . . . . . . . . . . . . . . . . . . . . . . 95●
TablesTable Page4-1. Principal Generators and Types of Commercial LLW . . . . . . . . . . . . . . . . . . . . . . . . . . . . 834-2. Principal Radionuclides Found in Commercial LLW . . . . . . . . . . . . . . . . . . . . . . . . . . . . . 834-3. Summary of Mixed LLW Generation Practices . . . . . . . . . . . . . . . . . . . . . . . . . . . . . . . . . 864-4. Cumulative Amounts of Radioactive Waste Generated Through 1988 . . . . . . . . . . . . . 884-5. Projected Volume Reduction of Commercial LLW . . . . . . . . . . . . . . . . . . . . . . . . . . . . . . 904-6. Acute Health Effects Estimated From Whole Body Irradiation . . . . . . . . . . . . . . . . . . . . 93
Chapter 4
Understanding LLW—Its Characteristics,Volumes, and Health Effects
OVERVIEWCommercial low-level radioactive waste (LLW)
in the United States is classified as Class A, Class B,Class C, or Greater-Than-Class C (GTCC), withGTCC waste being the most radioactive. About 97percent of the total LLW volume is Class A waste.About 3 to 10 percent of all LLW is also consideredmixed LLW because it contains low-level radioac-tive constituents as well as hazardous constituents.Principal generators of commercial LLW and mixedLLW include nuclear power plants, other industries,and academic and medical institutions.
In 1988, about 1.4 million cubic feet of commer-cial LLW was generated in the United States anddisposed of at licensed disposal sites at Barnwell,SC; Richland, WA; and Beatty, NV. This volume ofwaste would fill about 390 average-size tractortrailers, forming a line over 3½ miles long. ] Thisvolume contains about 260,000 curies of radioactiv-ity.
Over the last 9 years the volume of commercialLLW shipped for disposal has decreased by about 55percent. If this trend continues, the volume of LLWshipped for disposal in 1989 should remain at 1988levels of 1.4 million cubic feet; however, anothersignificant decrease in waste volume will likelyoccur in 1990 when disposal surcharges are sched-uled to double. If available volume reductiontechniques are more widely applied and belowregulatory concern (BRC) limits are finalized (seech. 3), LLW volumes will probably continue todecrease over the next several years, perhaps byanother 40 to 50 percent (see section on ‘‘ Implica-tions of Waste Minimization and Treatment Tech-niques on Future Waste Volumes”).2
WHAT IS LOW-LEVELRADIOACTIVE WASTE?
Low-level radioactive waste (LLW) is defined inthe Low-Level Radioactive Waste Policy Amend-ments Act (LLRWPAA) of 1985 by what it is not,rather than by what it is. LLW includes allradioactive waste that is not classified as spentfuel, high-level waste, or uranium mill tailings(see box 4-A). The majority of LLW volume—ClassA waste-contains very low levels of radiation andheat, requires no shielding to protect workers or thegeneral public, and decays in less than 100 years tolevels that the Nuclear Regulatory Commission(NRC) finds do not pose an unacceptable risk topublic health and safety. The remaining 3 percent ofLLW volume-Class B, Class C, and GTCC—requires shielding and can remain harmful for 300 to500 years or more.3
Generators of commercial LLW include: nuclearpower plants; fuel fabrication facilities; researchreactors; industrial plants using radioactive materi-als; manufacturers of radioactive instruments andradiopharmaceuticals; hospitals, clinics, and othermedical facilities; and other private sector anduniversity laboratories. LLW typically includes anassortment of materials that table 4-1 lists in threegeneral categories of generators.
COMMERCIAL LLW
Each business, institution, or organization thathandles radioactive material must be licensed by theNRC or an Agreement State that has been grantedlicensing authority by the NRC. There are about17,000 licensees in this country authorized to handleradioactive materials (17). However. each licenseemay employ many individuals who work withradioactive material. For example. on nine Univer-
IThls ~a]ou ~~lng ~ac[or [rm]er~ appllcs 10 V()]umes only, n~( actual (rans~fia[lon sccnarloi, since [rac[or [r~ler wclgh[ liml[~ would prohlblt thc
transport of such heavy loads.
~!vlost treatment technlqucs, vcrws wasIc mlmmlzation tcchmqucs that keep waste from ever bcmg gcncrdlcd, hwc IILdc ci[cct on rcduclng thewaste’s rachoactlvity.
3GTcc ~,m(e is tie responslbllj[y of the Federal Government to dlsposc. Isolation of GTCC waste needs to bc for a lkw hundred [O d fc~ thous~~dyears. For a thorough discussion of GTCC waste, see U.S. Congress, Office of Technology Asscssmcn~, i4n Evuhumon of Op([on~ for MunugIngGreuter-Than-Ck.n C Ln+-h’vel l?udmucr~ke Wrak, OTA-BP-O-50, (lctober 1988
-81-

82 ● partnerships Under Pressure: Managing Commercial Low-Level Radioactive Waste
Box 4-A—Types of Radioactive Wrote
The following types of radioactive waste are differentiated by the nature and intensity of the radiation they emit,as well as by their physical and chemical forms. They are listed roughly in order of decreasing risk to humans.
Spent fuel consists of fuel rods that have been “burned” (irradiated) in commercial, defense, or researchnuclear reactors to the point that they no longer contribute efficiently to the nuclear chain reaction. Spent fuel isthermally hot, is highly radioactive, and requires heavy shielding. Commercial spent fuel is being stored at 113operating commercial nuclear power plants pending the availability of a federally monitored retrievable facility forstorage or a deep-geologic repository for disposal.
High-level waste (HLW), as the term is used in this report, is generated when spent fuel is reprocessed torecover plutonium and uranium. The vast majority of HLW in the United States has been generated over the lastfour decades in support of national defense programs. HLW is highly radioactive, generates some heat, and requiresheavy shielding. Most HLW is now stored at Richland, WA; Aiken, SC; and Idaho Falls, ID, pending availabilityof a deep-geologic repository.
Transuranic waste is generated from the production of plutonium for nuclear weapons, from themanufacturing of sealed radioactive sources, and from the refurbishing or decommissioning of nuclear power plants.Transuranic waste contains radionuclides that have atomic numbers greater than 92, the atomic number of uranium.Defense transuranic wastes are currently being stored pending disposal in a deep-geologic repository called theWaste Isolation Pilot Project (WIPP), located near Carlsbad, New Mexico. Commercial transuranic waste isincluded as low-level radioactive waste.
Low-level radioactive waste (LLW) includes radioactive waste not classified as uranium mill tailings,high-level waste, or spent fuel. About 97 percent of all LLW-Class A--has relatively low levels of radioactivity.Class A waste remains hazardous for less than 100 years, Class B and C waste remains hazardous for a few hundredyears, while Greater-Than-Class C waste remains hazardous for a few hundred to a few thousand years. GTCC wasteis the responsibility of the Federal Government to manage. All classes of commercial LLW can contain transuranicelements.
Uranium mill tailings are the earthen residues--coarse sand and a “slime’ of clay-like particles-that remainafter extracting uranium from mined uranium ore. These tailings contain low concentrations of radioactive material,but tailing volumes are very large. Mill tailings are found in New Mexico, Wyoming, Colorado, Utah, Texas,Washington, and South Dakota.
Byproduct material is material contaminater or made radioactive during the production or use of specialnuclear material.SOURCE: I.P. Weber and S.D. Wiltshire, The Nuclear Waste Primer: A Handbook for Citizens, The League of Women Voters Education Fund
(New York, NY: Nick Lyons Books, 1985).
sity of California campuses there are over 15,000 clear power plants is addressed in appendix B.individual users of radioactive material (20). Industries account for most of the remaining volume
As shown in figure 4-1, about 1,440,000 cubic and radioactivity. Some of the principal radio-
feet of commercial LLW (containing about 260,000 nuclides found in LLW from different generators arelisted in figure 4-2 while their half-lives4 and type ofcuries) was disposed of in 1988 at the three operating
commercial disposal sites in Barnwell, SC; Rich- radiation emitted5 are listed in table 4-2.
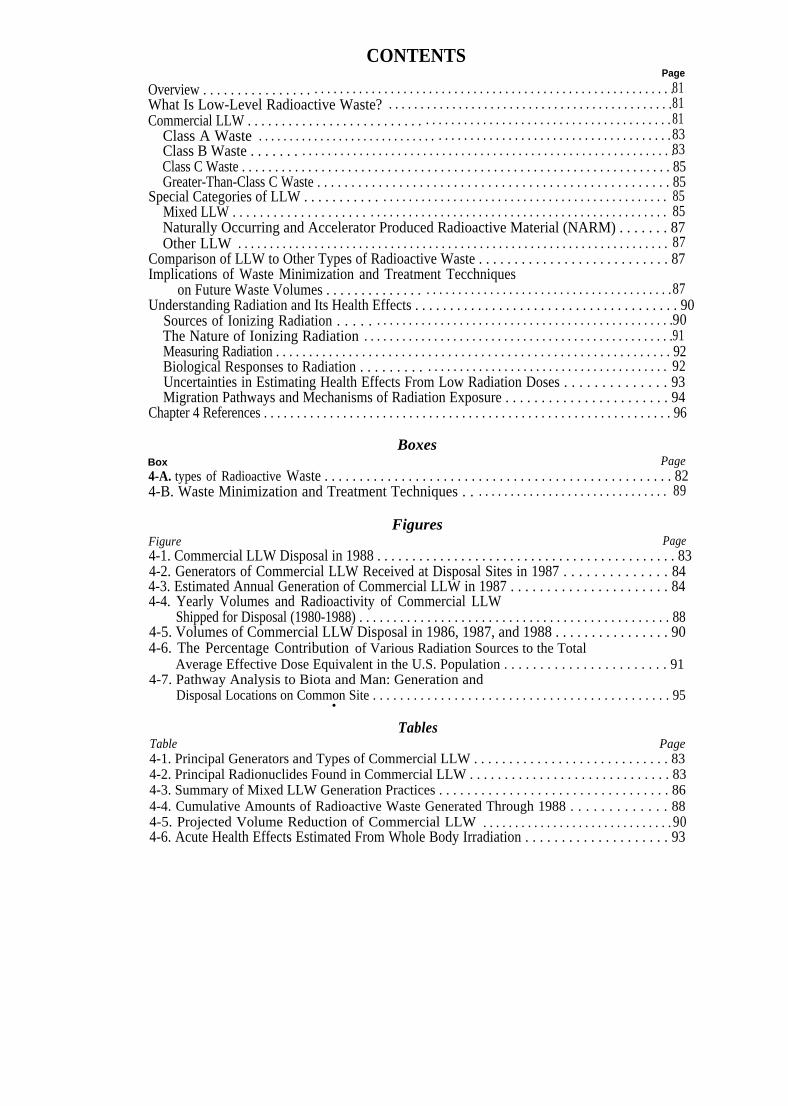
land, WA; and Beatty, NV. Figure 4-2 indicates that In light of the wide range of materials, theirnuclear power plants throughout the country pro- half-lives, and the type of radiation they emit, NRCduce over 50 percent of the volume of LLW uses a four-tiered classification system for commer-generated nationwide and over 80 percent of the cial LLW based on the types and concentrations ofradioactivity. The LLW from decommissioned nu- different radionuclides in the waste. This classifica-
dH~f-life is fie [fie in which half of tie atoms of a particular radioactive substance disintegrate to another nuclear form. For cx~ple, wrotecontaining 50 curies of a radionuclide with a half-life of 10 years will contain only 25 curies in 10 years. In 10 more years the waste will conmm 12.5curies and this decay process continues. Each radionuclide has a specific half-life. Measured half-lives vary from millionths of a second to billions ofyears.
SR~i~ion cm ~ ~lt~ ~ a p~icle—~pha or beta, or as a ray—a gamma ray or an X-ray. lb understand the differences in how these particlesand rays affwt humans, see the section on “Understanding Radiation and Its Health Effects. ”

Chapter 4--Understanding LLW--Its Characteristics, Volumes, and Health Effects ● 83
Table 4-1-Principal Generators and Typesof Commercial LLW
Table 4-2-Principal RadionuclidesFound in Commercial LLW
Nuclear power plants:Dry solids (e.g., protective clothing, rags, paper, plastics, andother trash); used equipment; sludges, organic solvents, andother liquids; water purification filter media and “resins”;irradiated hardware; and gases.
Industries:Radiopharmaceuticals; wastes from fabricating nuclear fuel;sealed sources.
Academic & medical institutions:Dry solids, glassware, plastics, and other laboratory equip-ment; scintillation fluids and other organic liquids; animalcarcasses, medical treatment and research materials; andgaseous wastes.
SOURCE: Adapted from U.S. Department of Energy, Managing Low-LevelRadioactfie Wastes: A Proposed Approach, DOE/LLLW-9, April1983, p. 206,
tion system, which NRC describes in 10 CFR Part61.55, generally reflects the waste’s potential long-term hazards to humans.
Class A Waste
Class A waste, the least radioactive of the fourtypes, must meet numerous minimum requirementson packaging to facilitate handling of the waste andto protect the health and safety of workers at disposalsites (see ch. 5). Class A waste is normally segre-gated from other LLW waste at disposal sites, unlessthe waste meets the more stringent physical stabilityrequirements for Class B and C waste. As indicatedin figure 4-3, most of the volume of LLW is Class A
Volume(1,440,000 total cubic
Chem-Nuclear SystemsBa
Approximate Type ofRadionuclide half-life radiation emitted
Technetium-99 . . . 6 hours GammaXenon-133 . . . . . . . 5 days Beta, gammaPhosphorus-32 . . . 14 days BetaCobalt-58 . . . . . . . . 2 months X-rays, beta, gammaiodine-125 , ., ... , 2 months GammaSulfur-35 . . . . . . . . 3 months BetaMagnesium-54 . . . 10 months X-rays, gammaCesium-134 . . . . . . 2 years Beta, gammaCobalt-60 . . . . . . . . 5 years Beta, gammaTritium . . . . . . . . . . 12 years BetaCesium-137 . . . . . . 30 years Beta, gammaStrontium-90 . . . . . 30 years BetaNickel-61 . . . . . . . . 90 years BetaCarbon-14 . . . . . . . 5,700 years BetaNickel-59 . . . . . . . . 80,000 years X-raysiodine-129 . . . . . . . 15,700,000 years BetaUranium-235 . . . . . 700,000,000 years Alpha, gammaUranium-238 . . . . . 4,470,000,000 years Alpha, gammaSOURCE: Office of Technology Assessment, 1989.
waste, although it actually accounts for only a smallportion of the radioactivity in LLW.
Class B Waste
Class B waste has intermediate levels of radioac-tivity that are generally 10 to 40 times higher thanlevels for Class A waste. In addition to satisfying allthe packaging requirements for Class A waste, ClassB waste must be structurally stable for at least 300years to prevent collapse of the caps that typically
Figure 4-1--Commercial LLW Disposal in 1088
feet )
Chem-N
US Ecology, Inc.Beatty, NV
7 %
Radioactivity y
(260,000 total curies)
30/0
US Ecology, Inc.Rich land, WA
280/o
SOURCE: Data provided by EG&G Idaho In May 1989 during the preparation of U.S. Department of Energy, DRAFT Integrated Data Base for 1989; SpentFuel and Radioactive Waste lnventories, Projections, and Characteristics, DOE/RW-0006, Rev.5, August 1969.
84 ● Partnerships Under Pressure: Managing Commercial Low-Level Radioactive Waste
Figure 4-2-Generators of Commercial LLW Received at Disposal Sites in 1987
Volume Radioactivity y
Nuclear utilities a
5 7 %Nuclear utilities a
8 2 %
Academic &v------ medical groups d
1%
5 % Industries b
Government agencies c 13%
6% Government agencies c
4%Industries b
3 2 %
Typical radionuclides from different generators:aNuclear power plants: cobalt-58 and -60, chromium-51, manganese-54, ceswm-1 34 and -137, nickel-59, trltlum (I.e., hydrogen-3), zinc-65, and Iodine-l 31bR~iophWm=u~=l W=tes: ~r~n-14, trltlum, lodlne.125, phosphorus.sp, SUKIN-35, and techneclum-gg; fuel-fabrication wastes: uranium-235 and -238;and sealed sourcss: ceswm-137, and cobalt-60.
%overnment (commercial sites accspt LLW from non-DOE government agencies for disposal): phosphorus-32, cobalt-60, chromium-51, nickel-63, trtlum,and carbon-14.
d~~pltals ~d Univemltles: t~tlum, c=~n. 14, l~lne-l 25, phosphorus.sp, sulfur-35, rubldlum-371 ~clum-45, sulfur-35, chromium-51 , indlum-1 92, andtechnetium-99.
SOURCE: Adapted from U.S. Department of Energy, The 1987 State-by-State Assessment of Low-Level Radioactive Wastes Received at CommercialDisposal Sites, National Low-Level Radioactive Waste Management Program, DOE/LLW-69T, December 1988, p. 141
Figure 4-3-Estimated Annual Generation of Commercial LLW in 1987
Class A9 7 %
Volume
Class C < 1 %Class B 2 %
Radioactivity yClass B
2 5 %. - - ’ ”
,
Category
class AClass BClass C —
Volume( 1 03 ft3
1,3883 9
1 2
Class C650 / .
Category Radioactivity(103 Ci)
class A 26Class B 67Class C 177
Total 270GTCC* 400
Total 1,449GTCC* 1
● *Sine the disposal of GTCC waste IS the responsibility of the FederalGovernment, GTCC waste IS usually excluded from most discussionsabout LLW.
SOURCE: U.S. Department of Energy, The 1987 State-by-State Assessment of Low-Leve/ Radioactive Wastes Received at Commercial Disposal Sites,National Low-Level Radioactive Waste Management Program, DOE/LLW-69T, December 1988, and Office of Technology Assessment, AnEvaluation of Options for Managing Greater-Than-C/ass C Low-Level Radioactive Waste, OTA-BP-O-50, October 1988, p 43.

Chapter 4--Understanding LLW--Its Characteristics, Volumes, and Health Effects ● 85
cover disposed waste; stability is also important inlimiting exposure to an inadvertent intruder. Highintegrity containers are used for Class B and Cwaste. (See ch. 5 for more detail on packaging andchs. 3 and 6 for more detail on disposal regulations.)
Class C Waste
The levels of radioactivity in Class C waste aregenerally 10 to 100 times higher than levels for ClassB waste. Packaging and stability requirements forClass C waste are the same as those for Class Bwaste. Because of its relatively high levels ofradioactivity, some Class C waste must also beshielded and handled remotely to avoid excessexposures to workers. To prevent inadvertent expo-sure to human intruders, Class C waste must beburied at least 16 feet below the Earth’s surface orcovered with a thick intrusion barrier (e.g., concreteslab). (See ch. 5 for more detail on packaging andchs. 3 and 6 for more detail on disposal regulations.)
Greater-Than-Class C Waste
Greater-than-Class C (GTCC) waste is moreradioactive than Class C waste, but less radioactivethan spent fuel. GTCC waste is generally notacceptable for near-surface disposal. In theLLRWPAA of 1985, the Federal Government wasgiven the responsibility for the disposal of GTCCwaste, The Department of Energy is currentlydeveloping an inventory of GTCC waste and evalu-ating alternative disposal technologies, includingdisposal in deep-geologic repositories along withcommercial spent fuel and defense high-level waste.GTCC waste is now being stored onsite pending adecision about its offsite storage and/or disposal(13).
At present, there are about 15,000 cubic feet ofpackaged GTCC waste now in storage at severalhundred generation sites; an additional 1,400 cubicfeet of GTCC waste are generated each year. Theradioactivity of this waste is about 5 million curies,or an amount of radioactivity equivalent to all othercommercial LLW that has been generated anddisposed of to date (13).
SPECIAL CATEGORIES OF LLWThe following categories of LLW do not fall
neatly into commercial LLW but can be consideredin some way special because of their composition,volume, or unique characteristics.
Mixed LLW
Several studies performed in the mid-1980s indi-cated that about 3 to 10 percent of all commercialLLW is mixed LLW because it contains bothradioactive and chemically hazardous constituents(12). Commercial mixed waste is defined andidentified in a document issued jointly by NRC andthe Environmental Protection Agency (EPA) in1987 (19). This waste is produced by a full range ofLLW generators (e.g., nuclear power plants, medicaland academic institutions, and various industriessuch as pharmaceutical and biotechnology firms)and waste processors.
As shown in table 4-3, the hazardous constituentsin mixed LLW typically include: organic liquids,metallic lead, cadmium, chromates, and waste oils(12). Several of the types of mixed LLW listed in thetable have been consolidated into five categories:
1. Organic liquids: Organic liquids are producedby a full range of LLW generators. Scintillationfluids, which are used in diagnostic tests andgeneral laboratory counting procedures forenvironmental and facility monitoring, com-prise the largest volume of mixed LLW. Thesefluids typically contain toluene and xylene.Organic liquids are also generated by industriesduring the manufacture of sealed sources,pharmaceuticals, radiopharmaceuticals, and di-agnostic tests. Industries and nuclear powerplants use organic chemicals, such as acetoneand chlorofluorocarbons (CFCs), commonlyreferred to as freon, for cleaning protectiveclothing, tools, equipment, and instrumenta-tion. Trash can also be contaminated withorganic chemicals.Metallic lead: Metallic lead becomes radioac-tively contaminated when it is used to storeradioactive materials in a shielded container orto shield workers from radiation exposureduring product manufacturing and laboratoryresearch. This lead may be in the form of foil,sheets, bricks, or containers for storage orshipping. If lead is decontaminated, the clean-ing solutions containing dissolved lead andradioactive material will also be classified as amixed LLW.
3. Cadmium: Nuclear power plants generateradioactively contaminated cadmium wastewhen welding rods containing cadmium areused. Equipment with such welds and the
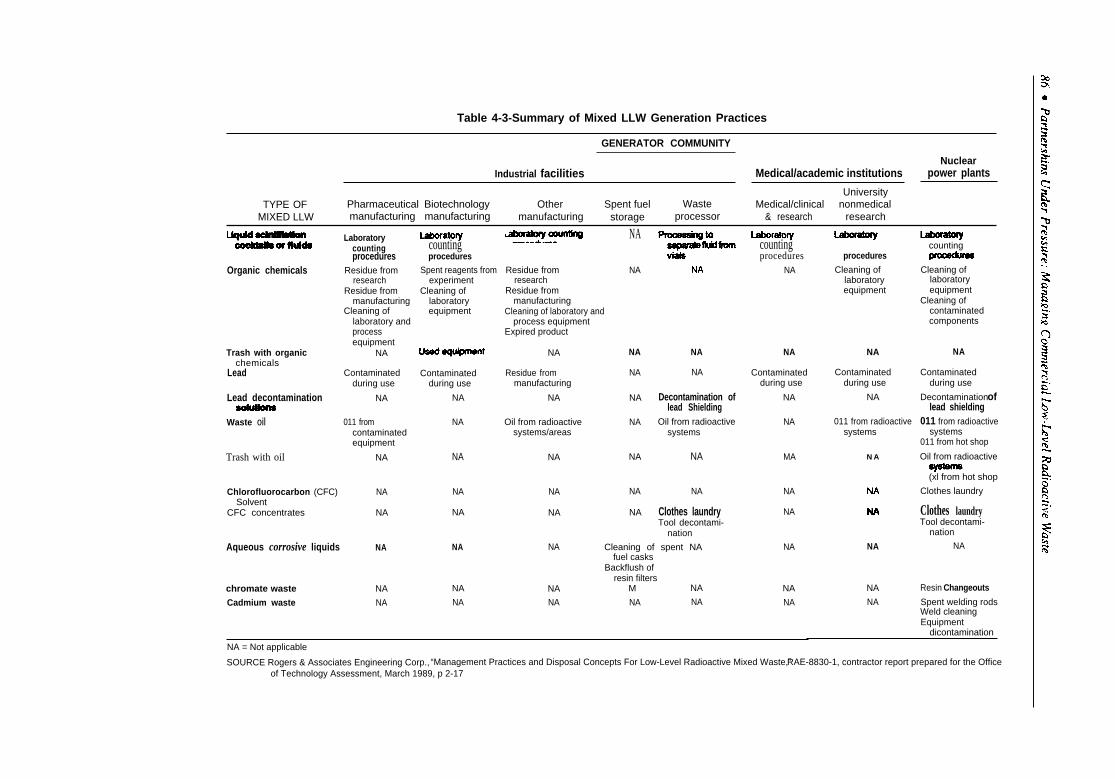
Table 4-3-Summary of Mixed LLW Generation Practices
GENERATOR COMMUNITY
NuclearIndustrial facilities Medical/academic institutions power plants
UniversityTYPE OF Pharmaceutical Biotechnology Other Spent fuel Waste Medical/clinical nonmedical
MIXED LLW manufacturing manufacturing manufacturing storage processor & research research
countingprocedures
NA
countingprocedures
Cleaning of Cleaning oflaboratory laboratoryequipment equipment
Cleaning ofcontaminatedcomponents
Laboratorycountingprocedures
Residue fromresearch
Residue frommanufacturing
Cleaning oflaboratory andprocessequipment
NA
countingprocedures
NA
Residue from NAresearch
Residue frommanufacturing
Cleaning of laboratory and
Spent reagents fromexperiment
Cleaning oflaboratoryequipment
Organic chemicals
process equipmentExpired product
NA
Residue frommanufacturing
NA
Oil from radioactivesystems/areas
NA
NA
NA
NA
NA
NA
NA NATrash with organicchemicals
Lead Contaminatedduring use
NA
NA
NA
NA
NA
NA
NA
NA
NA NA
Contaminatedduring use
NA
NA
Contaminatedduring use
NA
Contaminatedduring use
Decontamination oflead shielding
011 from radioactivesystems
011 from hot shop
Oil from radioactive
(xl from hot shop
Clothes laundry
Contaminatedduring use
NA
NA
Decontamination oflead Shielding
Oil from radioactivesystems
Lead decontamination
Waste oil 011 from radioactivesystems
011 fromcontaminatedequipment
NA
NA
NA MA N ATrash with oil NA
NA
NA
Chlorofluorocarbon (CFC) NA NASolvent
CFC concentrates NA NA
Aqueous corrosive liquids NA NA
chromate waste NA NA
Cadmium waste NA NA
NA
Clothes laundry Clothes laundryTool decontami-
nation
Cleaning of spent NA NAfuel casks
Backflush ofresin filters
M NA NA
NA NA NA
Tool decontami-nation
NA NA
NA Resin Changeouts
NA Spent welding rodsWeld cleaningEquipment
dicontamination
NA = Not applicable
SOURCE Rogers & Associates Engineering Corp., “Management Practices and Disposal Concepts For Low-Level Radioactive Mixed Waste,”RAE-8830-1, contractor report prepared for the Officeof Technology Assessment, March 1989, p 2-17
Chapter 4--Understanding LLW-Its Characteristics, Volumes, and Health Effects ● 87
liquids and solid materials used to clean suchequipment may also be contaminated withcadmium. This waste may not be found to bemixed if it passes EPA’s EP toxicity test, whichtests for leachability.
4. Chromates: Some nuclear power plants usechromates to inhibit corrosion in water circula-tion systems. When the water purificationresins are periodically changed, they will beconsidered mixed wastes if they fail EPA’s EPtoxicity test.
5. Waste oils: When the oil in pumps and otherequipment located in radioactive areas is peri-odically changed, the oil is generally contami-nated. Such waste oils and oily trash, princi-pally from radioactively contaminated machineshops, are considered hazardous under someState regulations, EPA is currently making adetermination on whether waste oil will belisted as a hazardous waste (see ch. 3).
Until 1985, most commercial mixed LLW wasdisposed of in NRC-licensed LLW disposal facili-ties. In the future, disposal facilities for mixed LLWwill be licensed by NRC and EPA or by States withNRC/EPA licensing/permitting authority. However,neither the three currently operating LLW dis-posal facilities nor any hazardous waste landfillsare licensed to accept mixed LLW. (The onlyexception is that some waste oils and lead may beaccepted at LLW sites if they meet requirements ofthe individual sites. ) The vast majority of commer-cial mixed LLW that cannot be treated and disposedof as ordinary trash, LLW, or hazardous waste,therefore, will have to remain in storage until mixedLLW disposal facilities are developed by States orcompacts. (See chs. 3 and 5 for more detail on thissituation.)
Naturally Occurring and AcceleratorProduced Radioactive Material (NARM)
NARM includes such naturally occurring materialas radium-226 used in some smoke detectors andwatch dials, and polonium-210 used in some indus-trial gauges; NARM also includes accelerator pro-duced radioactive material generated in linear accel-erators for use in medical instruments, Twenty-eightStates regulate NARM and existing commercialdisposal sites can accept such waste. Under Federallaw, however, neither the States nor the FederalGovernment is presently responsible for disposal ofNARM.
Other LLW
Some LLW is also generated by certain specialprojects. Two examples are the decontamination ofUnit 2 of the Three Mile Island nuclear power plantand the cleanup operation at West Valley, NY, thesite of a no-longer operating commercial spent-fuelreprocessing plant.
COMPARISON OF LLWTO OTHER TYPES OFRADIOACTIVE WASTE
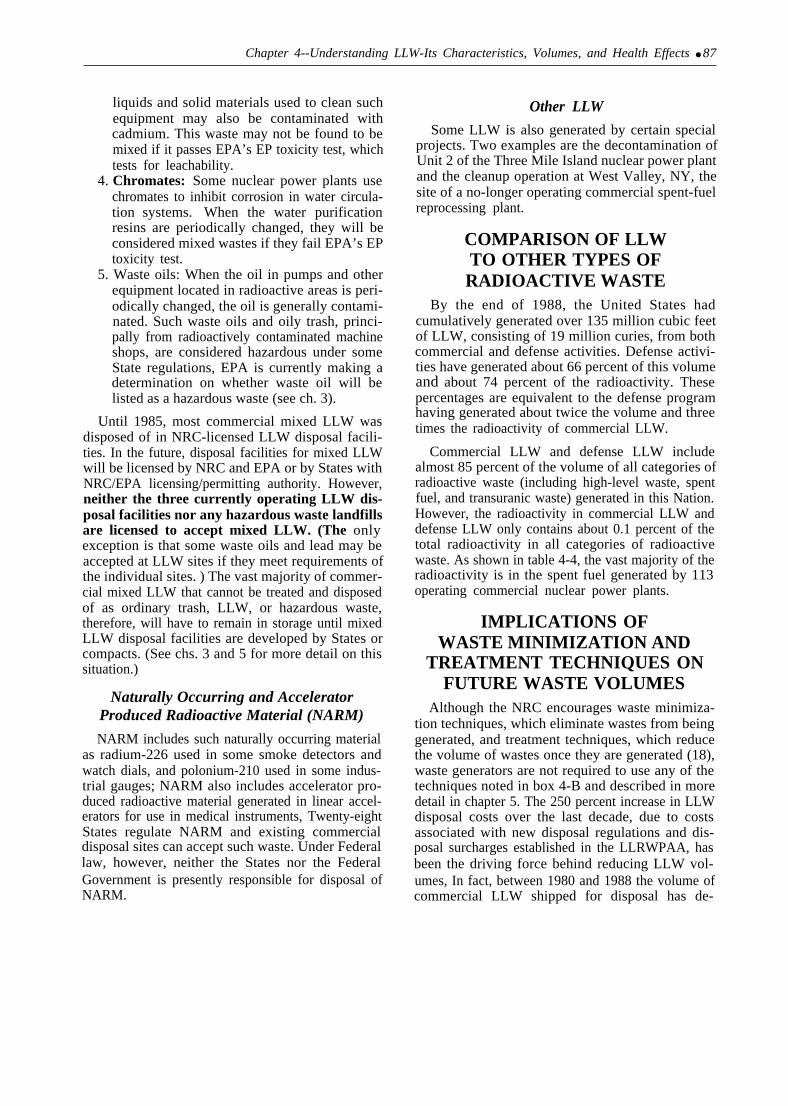
By the end of 1988, the United States hadcumulatively generated over 135 million cubic feetof LLW, consisting of 19 million curies, from bothcommercial and defense activities. Defense activi-ties have generated about 66 percent of this volumeand about 74 percent of the radioactivity. Thesepercentages are equivalent to the defense programhaving generated about twice the volume and threetimes the radioactivity of commercial LLW.
Commercial LLW and defense LLW includealmost 85 percent of the volume of all categories ofradioactive waste (including high-level waste, spentfuel, and transuranic waste) generated in this Nation.However, the radioactivity in commercial LLW anddefense LLW only contains about 0.1 percent of thetotal radioactivity in all categories of radioactivewaste. As shown in table 4-4, the vast majority of theradioactivity is in the spent fuel generated by 113operating commercial nuclear power plants.
IMPLICATIONS OFWASTE MINIMIZATION AND
TREATMENT TECHNIQUES ONFUTURE WASTE VOLUMES
Although the NRC encourages waste minimiza-tion techniques, which eliminate wastes from beinggenerated, and treatment techniques, which reducethe volume of wastes once they are generated (18),waste generators are not required to use any of thetechniques noted in box 4-B and described in moredetail in chapter 5. The 250 percent increase in LLWdisposal costs over the last decade, due to costsassociated with new disposal regulations and dis-posal surcharges established in the LLRWPAA, hasbeen the driving force behind reducing LLW vol-umes, In fact, between 1980 and 1988 the volume ofcommercial LLW shipped for disposal has de-
88 ● Partnerships Under Pressure: Managing Commercial Low-Level Radioactive Waste
Table 4-4-Cumulative Amounts of Radioactive Waste Generated Through 1988a
Volumes ActivityWaste type (in 103 ft3) Percent (in 106 Ci) Percent
Low-level wasteCommercial . . . . . . . . . . . . . . . . . . . . . 46,000 29.3 5 0.02Defense . . . . . . . . . . . . . . . . . . . . . . . . 87,000 55.5 14 0.06
High-level wasteCommercialb . . . . . . . . . . . . . . . . . . . . 80 0.05 30 0.2Defense . . . . . . . . . . . . . . . . . . . . . . . 13,500 8.6 1,175 5.4
Commercial spent fuel . . . . . . . . . . . . . . 270 0.17 20,400 94,3Defense TRU waste . . . . . . . . . . . . . . . . 10,000 6.4 4 0.02
Total . . . . . . . . . . . ....>..., . . . . . . 156,850 100.02 21,628 100.00aDoes not include mill tadings or waste from remedial action projects.%ommercial waste now located at West Valley, NY Also assumes no commercial reprocessing of spent fuel.
SOURCE: U.S. Department of Energy, DRAFT Integrated Data Base for 1989: Spent Fuel and Radioactive Waste Inventories, Projections, andCharacteristics, DOE/RW-0006, Rev. 5, August 1988, p. 22.
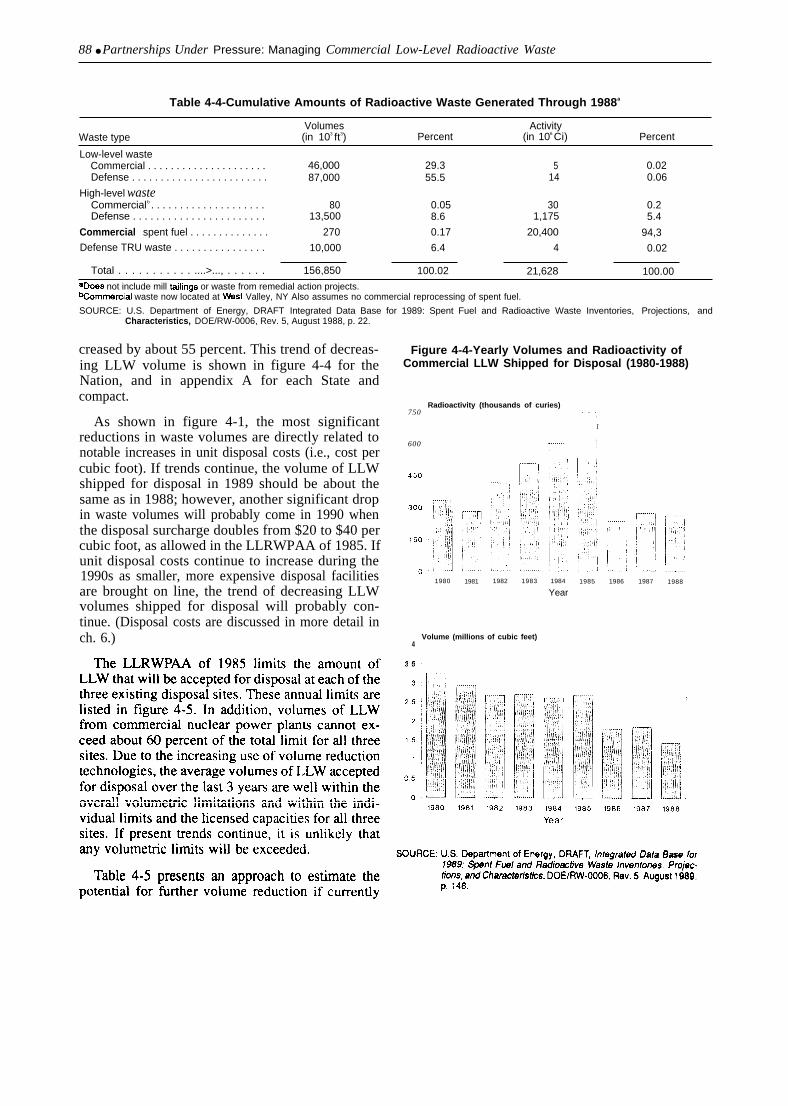
creased by about 55 percent. This trend of decreas-ing LLW volume is shown in figure 4-4 for theNation, and in appendix A for each State andcompact.
As shown in figure 4-1, the most significantreductions in waste volumes are directly related tonotable increases in unit disposal costs (i.e., cost percubic foot). If trends continue, the volume of LLWshipped for disposal in 1989 should be about thesame as in 1988; however, another significant dropin waste volumes will probably come in 1990 whenthe disposal surcharge doubles from $20 to $40 percubic foot, as allowed in the LLRWPAA of 1985. Ifunit disposal costs continue to increase during the1990s as smaller, more expensive disposal facilitiesare brought on line, the trend of decreasing LLWvolumes shipped for disposal will probably con-tinue. (Disposal costs are discussed in more detail inch. 6.)
Figure 4-4-Yearly Volumes and Radioactivity ofCommercial LLW Shipped for Disposal (1980-1988)
Radioactivity (thousands of curies)750 . . .,
I
600
1980 1981 1982 1983 1984 1985 1986 1987 1988
Year
Volume (millions of cubic feet)4
3 5
-
Chapter 4--Understanding LLW--Its Characteristics, Volumes, and Health Effects ● 89
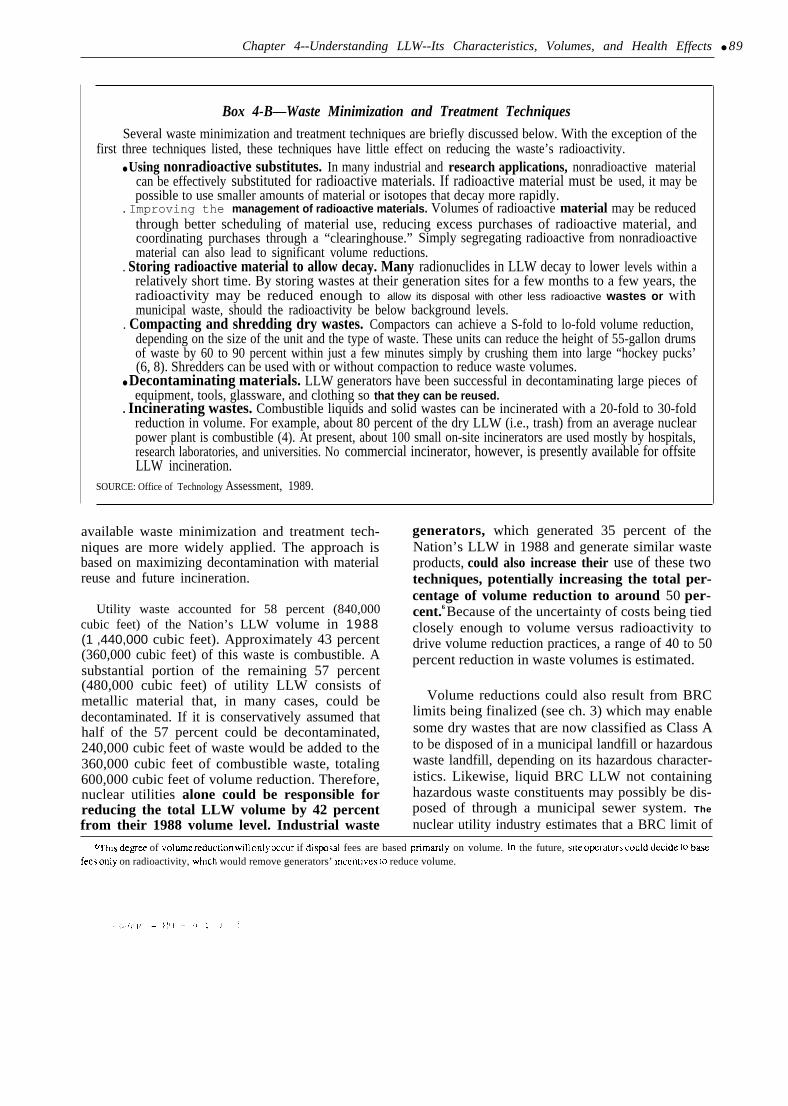
Box 4-B—Waste Minimization and Treatment TechniquesSeveral waste minimization and treatment techniques are briefly discussed below. With the exception of the
first three techniques listed, these techniques have little effect on reducing the waste’s radioactivity.● Using nonradioactive substitutes. In many industrial and research applications, nonradioactive material
can be effectively substituted for radioactive materials. If radioactive material must be used, it may bepossible to use smaller amounts of material or isotopes that decay more rapidly.
. Improving the management of radioactive materials. Volumes of radioactive material may be reducedthrough better scheduling of material use, reducing excess purchases of radioactive material, andcoordinating purchases through a “clearinghouse.” Simply segregating radioactive from nonradioactivematerial can also lead to significant volume reductions.
. Storing radioactive material to allow decay. Many radionuclides in LLW decay to lower levels within arelatively short time. By storing wastes at their generation sites for a few months to a few years, theradioactivity may be reduced enough to allow its disposal with other less radioactive wastes or withmunicipal waste, should the radioactivity be below background levels.
. Compacting and shredding dry wastes. Compactors can achieve a S-fold to lo-fold volume reduction,depending on the size of the unit and the type of waste. These units can reduce the height of 55-gallon drumsof waste by 60 to 90 percent within just a few minutes simply by crushing them into large “hockey pucks’(6, 8). Shredders can be used with or without compaction to reduce waste volumes.
● Decontaminating materials. LLW generators have been successful in decontaminating large pieces ofequipment, tools, glassware, and clothing so that they can be reused.
. Incinerating wastes. Combustible liquids and solid wastes can be incinerated with a 20-fold to 30-foldreduction in volume. For example, about 80 percent of the dry LLW (i.e., trash) from an average nuclearpower plant is combustible (4). At present, about 100 small on-site incinerators are used mostly by hospitals,research laboratories, and universities. No commercial incinerator, however, is presently available for offsiteLLW incineration.
SOURCE: Office of Technology Assessment, 1989.
available waste minimization and treatment tech- generators, which generated 35 percent of theniques are more widely applied. The approach isbased on maximizing decontamination with materialreuse and future incineration.
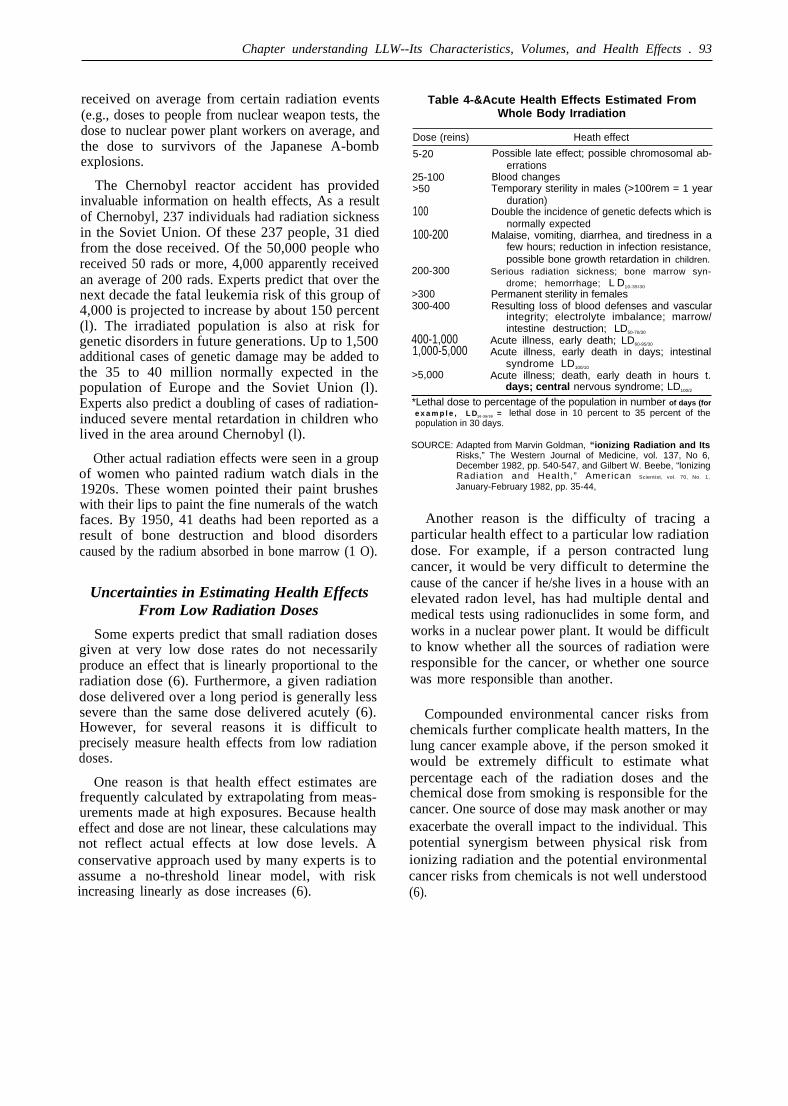
Utility waste accounted for 58 percent (840,000cubic feet) of the Nation’s LLW volume in 1988(1 ,440,000 cubic feet). Approximately 43 percent(360,000 cubic feet) of this waste is combustible. Asubstantial portion of the remaining 57 percent(480,000 cubic feet) of utility LLW consists ofmetallic material that, in many cases, could bedecontaminated. If it is conservatively assumed thathalf of the 57 percent could be decontaminated,240,000 cubic feet of waste would be added to the360,000 cubic feet of combustible waste, totaling600,000 cubic feet of volume reduction. Therefore,nuclear utilities alone could be responsible forreducing the total LLW volume by 42 percentfrom their 1988 volume level. Industrial waste
Nation’s LLW in 1988 and generate similar wasteproducts, could also increase their use of these twotechniques, potentially increasing the total per-centage of volume reduction to around 50 per-cent.6 Because of the uncertainty of costs being tiedclosely enough to volume versus radioactivity todrive volume reduction practices, a range of 40 to 50percent reduction in waste volumes is estimated.
Volume reductions could also result from BRClimits being finalized (see ch. 3) which may enablesome dry wastes that are now classified as Class Ato be disposed of in a municipal landfill or hazardouswaste landfill, depending on its hazardous character-istics. Likewise, liquid BRC LLW not containinghazardous waste constituents may possibly be dis-posed of through a municipal sewer system. The
nuclear utility industry estimates that a BRC limit of
6Th1s de~u of Volmc redu~tlon wi]] only Wcur if d]sposal fees are based pnmady on volume. In the future, sue operalors could dwide 10 b-fees only on radioactivity, wh]ch would remove generators’ ]ncenti\cs [o reduce volume.
90 ● Partnerships Under Pressure: Managing Commercial Low-Level Radioactive W a s t e
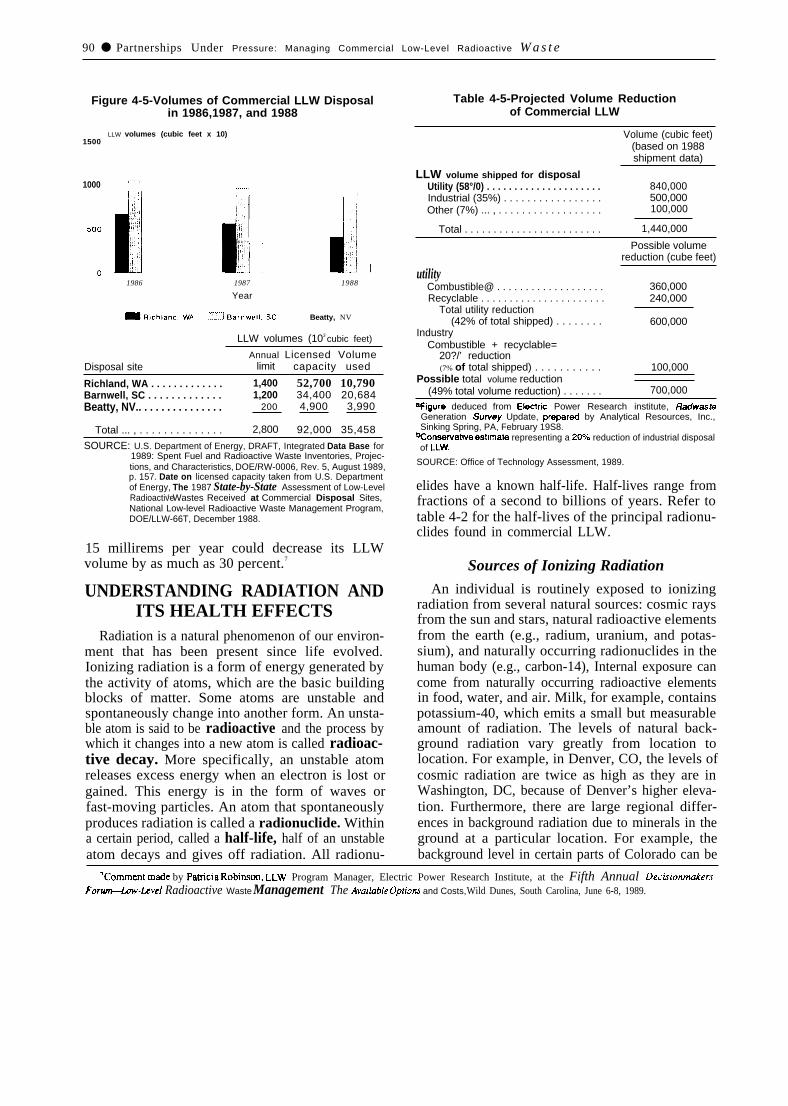
Figure 4-5-Volumes of Commercial LLW Disposalin 1986,1987, and 1988
LLW volumes (cubic feet x 10)1500
1000
1986 1987 1988
Year
Beatty, NV
LLW volumes (103 cubic feet)
Annual Licensed VolumeDisposal site limit capacity used
Richland, WA . . . . . . . . . . . . . 1,400 52,700 10,790Barnwell, SC . . . . . . . . . . . . . 1,200 34,400 20,684Beatty, NV.. . . . . . . . . . . . . . . 200 4,900 3,990
Total ... , . . . . . . . . . . . . . . 2,800 92,000 35,458
SOURCE: U.S. Department of Energy, DRAFT, Integrated Data Base for1989: Spent Fuel and Radioactive Waste Inventories, Projec-tions, and Characteristics, DOE/RW-0006, Rev. 5, August 1989,p. 157. Date on licensed capacity taken from U.S. Departmentof Energy, The 1987 State-by-State Assessment of Low-LevelRadioactive ‘ Wastes Received at Commercial Disposal Sites,National Low-level Radioactive Waste Management Program,DOE/LLW-66T, December 1988.
15 millirems per year could decrease its LLWvolume by as much as 30 percent.7
UNDERSTANDING RADIATION ANDITS HEALTH EFFECTS
Radiation is a natural phenomenon of our environ-ment that has been present since life evolved.Ionizing radiation is a form of energy generated bythe activity of atoms, which are the basic buildingblocks of matter. Some atoms are unstable andspontaneously change into another form. An unsta-ble atom is said to be radioactive and the process bywhich it changes into a new atom is called radioac-tive decay. More specifically, an unstable atomreleases excess energy when an electron is lost orgained. This energy is in the form of waves orfast-moving particles. An atom that spontaneouslyproduces radiation is called a radionuclide. Withina certain period, called a half-life, half of an unstableatom decays and gives off radiation. All radionu-
Table 4-5-Projected Volume Reductionof Commercial LLW
Volume (cubic feet)(based on 1988shipment data)
LLW volume shipped for disposalUtility (58°/0) . . . . . . . . . . . . . . . . . . . . . 840,000Industrial (35%) . . . . . . . . . . . . . . . . . 500,000Other (7%) ... , . . . . . . . . . . . . . . . . . . 100,000
Total . . . . . . . . . . . . . . . . . . . . . . . . 1,440,000
Possible volumereduction (cube feet)
utilityCombustible@ . . . . . . . . . . . . . . . . . . . 360,000Recyclable . . . . . . . . . . . . . . . . . . . . . . 240,000
Total utility reduction(42% of total shipped) . . . . . . . . 600,000
IndustryCombustible + recyclable=
20?/’ reduction(7% of total shipped) . . . . . . . . . . . 100,000
Possible total volume reduction(49% total volume reduction) . . . . . . . 700,000
aFlgure deduced from Eleetric Power Research institute, RadwasteGeneration Survey Update, prepard by Analytical Resources, Inc.,Sinking Spring, PA, February 19S8.
%onservatwe estimate representing a 200/0 reduction of industrial disposalof LLW.
SOURCE: Office of Technology Assessment, 1989.
elides have a known half-life. Half-lives range fromfractions of a second to billions of years. Refer totable 4-2 for the half-lives of the principal radionu-clides found in commercial LLW.
Sources of Ionizing Radiation
An individual is routinely exposed to ionizingradiation from several natural sources: cosmic raysfrom the sun and stars, natural radioactive elementsfrom the earth (e.g., radium, uranium, and potas-sium), and naturally occurring radionuclides in thehuman body (e.g., carbon-14), Internal exposure cancome from naturally occurring radioactive elementsin food, water, and air. Milk, for example, containspotassium-40, which emits a small but measurableamount of radiation. The levels of natural back-ground radiation vary greatly from location tolocation. For example, in Denver, CO, the levels ofcosmic radiation are twice as high as they are inWashington, DC, because of Denver’s higher eleva-tion. Furthermore, there are large regional differ-ences in background radiation due to minerals in theground at a particular location. For example, thebackground level in certain parts of Colorado can be
Tcoment m~e by parncia Robins~, LLW Program Manager, Electric Power Research Institute, at the Fifth Annual ~ecisionmakers’Forum+inv-tivel Radioactive Waste Management The Avadable Optwm and Costs, Wild Dunes, South Carolina, June 6-8, 1989.

Chapter 4--Understanding LLW-Its Characteristics, Volumes, and Health Effects ● 91
three times higher than Gulf Coast States such asMississippi and Alabama. Increased exposure canalso result from living in a brick or stone houseversus wood due to radon gas released from stoneand brick. On average, all natural sources ofradiation together represent about 82 percent of allradiation an individual receives (1 1). (See figure4-6.)
Individuals are also exposed to man-made sourcesof ionizing radiation, such as radiotherapy fordisease and X-rays for medical and dental tests. Aswith natural sources of radiation, the level ofradiation received by man-made sources variesgreatly with the individual, For example, the radia-tion from diagnostic X-rays received for a lowergastrointestinal test is almost 10 times greater thanthat received for a chest X-ray (8). On average, theseman-made sources of radiation for medical usesrepresent about 15 percent of all radiation anindividual receives (1 1). (See figure 4-6.)
The remaining amount of ionizing radiationcomes from industrial uses of radioactive materials,emissions from certain consumer products, radiationfrom fallout of previously conducted above-groundtests of nuclear weapons, nuclear power plantoperations, and miscellaneous activities. The amountof radiation from all of these sources is estimated tobe about 3 percent of the total (1 1). The amount ofradiation from LLW is some fraction of 1 percent(1 1). (See figure 4-6.)
The Nature of Ionizing Radiation
There are three types of ionizing radiation—alphaparticles, beta particles, and gamma rays or photons—that result from the decay of radionuclides. Theradioactivity of radionuclides is measured in unitscalled curies, with 1 curie describing the radiationfrom 1 gram of radium for 1 second, or about 37billion disintegrations per second.8
Alpha radiation consists of positively charged,highly energized particles that rapidly lose energywhen passing through matter. They are emitted fromnaturally occurring radioactive elements, such asradium and uranium, and from man-made elementssuch as plutonium. Alpha particles are larger andheavier than the particles of beta radiation. Alphaparticles can be stopped by a sheet of paper or byhuman skin so that holding a piece of plutonium in
Figure 4-6-The Percentage Contribution of VariousRadiation Sources to the Total Average Effective Dose
Equivalent in the U.S. Population
Terrestrial Internal
8% 11%
Cosmic8%
‘i
Nuclear Medicine 4%
Radon Consumer products 3%
55% Other <1%
Occupational O 3%Fallout <0.3%Nuclear
Natural (82%) Fuel Cycle 0 .1%Miscellaneous 0.1%
Man-made (18%)
SOURCE: National Council on Radiation Protection and Measurements,Ionizing Radiation Exposures of the Population of the UnitedStates, NCRP Report 93, Bethesda, MD, 1987, p. 55.
your hand would be perfectly safe. If ingested orinhaled, however, alpha particles would damageinternal tissues with grave consequences (see sec-tion on “Biological Responses to Radiation”).Inhalation of even tiny amounts of plutonium cancause lung cancer. Low-level radioactive wastegenerally does not contain alpha-producing radionu-elides.
Beta radiation consists of smaller particles thattravel more quickly in air and can penetrate severalcell layers of skin. Beta radiation can be reduced orstopped by a layer of clothing or through the use ofa few millimeters of aluminum, glass, or plasticshielding. Beta-emitting radionuclides are found inmost LLW.
Gamma radiation is in a wave form like light andX-rays and consists of photons—small packets ofenergy that can travel great distances and penetratematter. Gamma rays can pass through the humanbody or can be absorbed by tissue or bone. Three feetof concrete or 2 inches of lead will reduce or stop 90percent of typical gamma radiation. Gamma photonsare used in cancer treatment to destroy the cells of atumor without causing major damage to healthycells nearby. Gamma-emitting radionuclides arefound in most LLW.
Radionuclides in LLW that emit both beta parti-cles and gamma photons are classified as either betaemitters or gamma emitters according to whichemitter is biologically more harmful. For example,
.S~e intcmation~ ~it for radioactivity is the becquerel (Bq), which UPMIS one disinte~ation PET ~~d.

92 ● Partnerships Under Pressure: Managing Commercial Low-Level Radioactive Waste
cobalt-60 is referred to as a gamma emitter becausethe accompanying beta radiation is biologically lessdamaging.
Measuring Radiation
The amount of ionization that a given quantity ofradiation produces is the exposure. A common unitfor measuring exposure is the roentgen; one roent-gen is 2.58 x 10⁻⁴ coulombs per kilogram of air.
When radiation penetrates biological material itgives up its energy in a series of collisions or otherinteractions with the atoms of the material beingirradiated. The consequences of these interactionsmay be the dislocation of atoms, the breaking ofchemical bonds, or the loss of electrons. Thesemolecular alterations may in turn impair the biologi-cal functions of the irradiated material. The amountof energy deposited in the material is the absorbeddose. A common unit used to measure absorbed doseis the rad, an abbreviation for radiation absorbeddose. 9 Note that exposure and absorbed dose arevery different. Exposure describes a property of theradiation, while the absorbed dose describes some-thing that happens to a particular material when theradiation is absorbed.
Biological Responses to Radiation
The amount of biological damage resulting froma particular absorbed dose is the dose equivalent.The dose equivalent depends on the kind, amount,and rate of the radiation; on the nature of theorganism exposed; on the organism’s age, sex, stateof health, and surroundings; and on the particularbiological effect being considered (10).
The dose equivalent is often referred to as simplythe dose, when the absorbed dose is equivalent to thedose equivalent. This equivalence is generally truefor X-rays, gamma rays, and for most beta particles(10). The major exception is alpha radiation, whichcan lead to more serious biological damage. Oncealpha particles are absorbed by tissue, their large sizeand density and the slow speed at which they travelresults in more energy being released in a smallerarea. The radiation is, therefore, more concentratedand causes more damage. Since this study primarilydeals with beta rays and gamma rays, the term dose
is used for dose equivalent. Dose is measured inreins, or ‘‘roentgen equivalent man.”10
The average annual whole body dose to a personin the United States from natural and man-madesources is about 360 millirems (1 1).l 1 An actual doseto any given individual could vary widely, however.Over the course of a lifetime, an individual mayaccumulate doses from background exposures ofbetween 5 and 10 reins (6).
An excessive dose of radiation can result insomatic damage (i.e., damage to the cells of the bodythat compose the tissues and organs) and in geneticdamage that can become hereditary. Somatic dam-age is most common in cells that divide morefrequently, such as blood-forming cells of the bonemarrow and cells that line the intestinal wall (10).The body concentrates certain radionuclides selec-tively in one or another organ (3). Iodine-129 andiodine-1 31, for example, concentrate in the thyroid;strontium-90 concentrates in the bone; and nickel-59concentrates in the intestine. Radiation damage tothese kinds of cells are caused mainly by the acute(short-term) effects of large doses of radiation.
Embryos are particularly sensitive to somaticeffects from radiation. They are more susceptible tomalformities and death than adults (6).
Cancer can result if cell reproduction is impairedby radiation and uncontrolled growth occurs. Leuke-mia and lung, breast, and thyroid cancers appearmore common than other types of cancer due toradiation (6),
Radiation doses can also cause two types ofgenetic damage-whole chromosome damage andgene mutation. With whole chromosome damage,the number of chromosomes in a genetic cell maychange or a chromosome may break, in which casethe broken pieces may reattach in a way that leavesthe chromosome’s function impaired. With genemutation, a gene may change such that the individ-ual inheriting the gene demonstrates an observablemalfunction such as mental retardation, or, moredrastically, the gene may be so damaged that itcannot reproduce itself (10). Table 4-6 gives thetypes of effects that can be expected from certainranges of radiation doses. Data have also beencollected on actual doses that individuals have
Whe international unit for absorbed dose is the gray (Gy), which is equal to one joule per kilogram. The rad is equal to 10”2 Gy.l~c intematim~ unit for dose is the sievert (Sv); a rem is equal to 10-2 SV.
11A mlll~er:l is a one-thousmdth of a rem (10-3 rem).
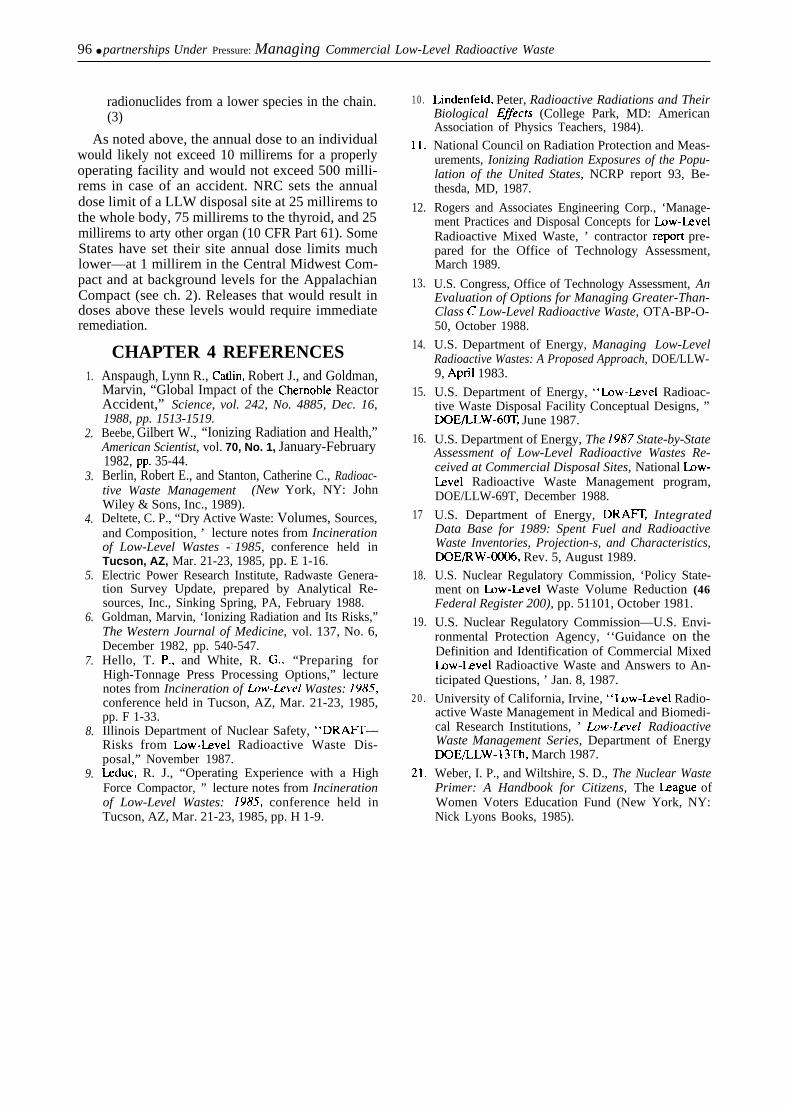
Chapter understanding LLW--Its Characteristics, Volumes, and Health Effects . 93
received on average from certain radiation events(e.g., doses to people from nuclear weapon tests, thedose to nuclear power plant workers on average, andthe dose to survivors of the Japanese A-bombexplosions.
The Chernobyl reactor accident has providedinvaluable information on health effects, As a resultof Chernobyl, 237 individuals had radiation sicknessin the Soviet Union. Of these 237 people, 31 diedfrom the dose received. Of the 50,000 people whoreceived 50 rads or more, 4,000 apparently receivedan average of 200 rads. Experts predict that over thenext decade the fatal leukemia risk of this group of4,000 is projected to increase by about 150 percent(l). The irradiated population is also at risk forgenetic disorders in future generations. Up to 1,500additional cases of genetic damage may be added tothe 35 to 40 million normally expected in thepopulation of Europe and the Soviet Union (l).Experts also predict a doubling of cases of radiation-induced severe mental retardation in children wholived in the area around Chernobyl (l).
Other actual radiation effects were seen in a groupof women who painted radium watch dials in the1920s. These women pointed their paint brusheswith their lips to paint the fine numerals of the watchfaces. By 1950, 41 deaths had been reported as aresult of bone destruction and blood disorderscaused by the radium absorbed in bone marrow (1 O).
Uncertainties in Estimating Health EffectsFrom Low Radiation Doses
Some experts predict that small radiation dosesgiven at very low dose rates do not necessarilyproduce an effect that is linearly proportional to theradiation dose (6). Furthermore, a given radiationdose delivered over a long period is generally lesssevere than the same dose delivered acutely (6).However, for several reasons it is difficult toprecisely measure health effects from low radiationdoses.
One reason is that health effect estimates arefrequently calculated by extrapolating from meas-urements made at high exposures. Because healtheffect and dose are not linear, these calculations maynot reflect actual effects at low dose levels. Aconservative approach used by many experts is toassume a no-threshold linear model, with riskincreasing linearly as dose increases (6).
Table 4-&Acute Health Effects Estimated FromWhole Body Irradiation
Dose (reins) Heath effect
5-20
25-100>50
100
100-200
200-300
>300300-400
400-1,0001,000-5,000
>5,000
Possible late effect; possible chromosomal ab-errations
Blood changesTemporary sterility in males (>100rem = 1 year
duration)Double the incidence of genetic defects which is
normally expectedMalaise, vomiting, diarrhea, and tiredness in a
few hours; reduction in infection resistance,possible bone growth retardation in children.
Serious radiation sickness; bone marrow syn-drome; hemorrhage; L D10-35/30
Permanent sterility in femalesResulting loss of blood defenses and vascular
integrity; electrolyte imbalance; marrow/intestine destruction; LD50-70/30
Acute illness, early death; LD60-95/30
Acute illness, early death in days; intestinalsyndrome LD100/10
Acute illness; death, early death in hours t.days; central nervous syndrome; LD100/2
*Lethal dose to percentage of the population in number of days (fore x a m p l e , L D10-35 /30 = lethal dose in 10 percent to 35 percent of thepopulation in 30 days.
SOURCE: Adapted from Marvin Goldman, “ionizing Radiation and ItsRisks,” The Western Journal of Medicine, vol. 137, No 6,December 1982, pp. 540-547, and Gilbert W. Beebe, “lonizingRadiat ion and Health,” American Scientist, vol. 70, No. 1,
January-February 1982, pp. 35-44,
Another reason is the difficulty of tracing aparticular health effect to a particular low radiationdose. For example, if a person contracted lungcancer, it would be very difficult to determine thecause of the cancer if he/she lives in a house with anelevated radon level, has had multiple dental andmedical tests using radionuclides in some form, andworks in a nuclear power plant. It would be difficultto know whether all the sources of radiation wereresponsible for the cancer, or whether one sourcewas more responsible than another.
Compounded environmental cancer risks fromchemicals further complicate health matters, In thelung cancer example above, if the person smoked itwould be extremely difficult to estimate whatpercentage each of the radiation doses and thechemical dose from smoking is responsible for thecancer. One source of dose may mask another or mayexacerbate the overall impact to the individual. Thispotential synergism between physical risk fromionizing radiation and the potential environmentalcancer risks from chemicals is not well understood(6).

94 ● Partnerships Under pressure: Managing Commercial Low-Level Radioactive Waste
Another problem with estimating low-dose healtheffects is the radiation latency factor—the time froma brief exposure to the first appearance of disease.For example, the minimal latent period for leukemiaand bone cancer is 2 to 4 years. It may be 10 or moreyears for other types of cancer (2). The incidence ofleukemia among Japanese A-bomb survivorsreached a peak 6 years after the explosion. Mostsolid tumors require 10 to 20 years to develop (10).
A further complication is that much of our data isbased on animal studies (8). For humans, the fullsignificance of age and sex on cancer response is notknown, nor is the significance of biologic factorssuch as immune competence, hormonal status,capacity for DNA repair, and genetic composition.
Finally, conducting a valid epidemiologic study isdifficult because of too small an exposure group andbecause of the time necessary to conduct a study. Inmost cases of radiation exposure events, the popula-tion size is too small to conduct a study wherestatistically significant risk estimates can be calcu-lated. The exceptions are victims and survivors ofthe Japanese A-bombs and Chernobyl accident.Even with these two events, health effect estimatesfor the low-dose population are difficult to calculatebecause of the competing unrelated sources ofradiation exposure and environmental risks fromchemicals.
With respect to LLW disposal, no actual data onradiation exposures to the general public from pastdisposal practices exists. The collective dose tonearby residents is calculated to be well below theoperating limits established by the Nuclear Regula-tory Commission (NRC). Furthermore, no memberof the public is known to have received a measurableradiation dose from disposal practices. Workers atthe disposal sites during the operational period of thesite receive the greatest dose. Workers wear radia-tion detection devices to ensure that the exposurethey receive is below the allowable limits set byNRC. NRC requires that at all times exposure bekept as low as reasonably achievable (ALARA).
The ALARA concept developed from the scien-tific consensus that there is no clearly definablethreshold level of exposure. The ALARA conceptrequires that the cost of achieving an incrementalreduction below regulatory limits be weighed againstthe benefit received in terms of reduced occupationalor population exposures (3). At LLW disposal sites,ALARA has influenced:
●
●
●
imposition of engineered controls and barriersto limit effluent releases,the improvement of instrumentation to validatelower objectives for allowable concentrationsin conjunction with enhanced monitoring of theworkplace and the surrounding regions, andevolution of radiation protection programs inthe facilities designed specifically to achieveALARA conditions (3).
A Department of Energy study estimates that thehighest dose rate to the maximally exposed memberof the public from a properly functioning LLWdisposal facility would be 10 millirems per year ( 15).The collective dose rate to nearby residents would bemuch lower. If a LLW disposal facility had a majorfailure, it is estimated that a maximally exposedmember of the public could receive as much as 500millirems per year (8). This dose rate is equal to thelimit that a worker is allowed to receive within 1 yearin the unrestricted areas of a site (10 CFR Part 20).In a restricted area, a worker may receive a dose anorder of magnitude higher. Even at the 500 milliremdose rate, however, the facility would have to beremediated immediately; therefore, this dose ratewould not be expected to continue.
Migration Pathways and Mechanismsof Radiation Exposure
Figure 4-7 outlines the migration pathways andmechanisms of human exposure from radionuclidesin a LLW disposal site, These pathways includeseepage or runoff from surface water, groundwatertransport, and atmospheric transport. Computeranalyses indicate that the groundwater is the majorpathway at humid sites (8). No single pathwayappears to be dominant for dry sites.
The primary mechanisms for human exposureinclude:
●
●
●
●
●
direct radiation of individuals near the source ornear disposed material;inhalation of emissions dispersed directly intothe air;direct ingestion of groundwater and/or surfacewater;ingestion of contaminated vegetation on whichparticulate have settled, or where gaseousexchange has occurred, or which have grown inconcentrated soils; andingestion of fauna (e.g., livestock, fish) in thefood chain that have ingested and concentrated

Chapter Understanding LLW--Its Characteristics, Volumes, and Health Effects ● 95
Figure +7—Pathway Analysis to Biota and Man: Generation and Disposal Locations on Common Site
A i r b o r n e D i s p e r s i o n
(Gases and P a r t i c u l a t e s )
Settling
J 1
SOURCE. Robert E Berlin and Catherine S Stanton, Radioactive Waste Management (New York NY John Wiley & Sons, Inc. 1989), p 128
96 ● partnerships Under Pressure: Managing Commercial Low-Level Radioactive Waste
radionuclides from a lower species in the chain.(3)
As noted above, the annual dose to an individualwould likely not exceed 10 millirems for a properlyoperating facility and would not exceed 500 milli-rems in case of an accident. NRC sets the annualdose limit of a LLW disposal site at 25 millirems tothe whole body, 75 millirems to the thyroid, and 25millirems to arty other organ (10 CFR Part 61). SomeStates have set their site annual dose limits muchlower—at 1 millirem in the Central Midwest Com-pact and at background levels for the AppalachianCompact (see ch. 2). Releases that would result indoses above these levels would require immediateremediation.
CHAPTER 4 REFERENCES1.
2.
3.
4.
5.
6.
7.
8.
9.
Anspaugh, Lynn R., Catlin, Robert J., and Goldman,Marvin, “Global Impact of the Chemoble ReactorAccident,” Science, vol. 242, No. 4885, Dec. 16,1988, pp. 1513-1519.Beebe, Gilbert W., “Ionizing Radiation and Health,”American Scientist, vol. 70, No. 1, January-February1982, pp. 35-44.Berlin, Robert E., and Stanton, Catherine C., Radioac-tive Waste Management (New York, NY: JohnWiley & Sons, Inc., 1989).Deltete, C. P., “Dry Active Waste: Volumes, Sources,and Composition, ’ lecture notes from Incinerationof Low-Level Wastes -- 1985, conference held inTucson, AZ, Mar. 21-23, 1985, pp. E 1-16.Electric Power Research Institute, Radwaste Genera-tion Survey Update, prepared by Analytical Re-sources, Inc., Sinking Spring, PA, February 1988.Goldman, Marvin, ‘Ionizing Radiation and Its Risks,”The Western Journal of Medicine, vol. 137, No. 6,December 1982, pp. 540-547.Hello, T. P,, and White, R. G., “Preparing forHigh-Tonnage Press Processing Options,” lecturenotes from Incineration of L.ow-i.evcl Wastes: 1985,conference held in Tucson, AZ, Mar. 21-23, 1985,pp. F 1-33.Illinois Department of Nuclear Safety, “DRAIT—Risks from Lmw-bvel Radioactive Waste Dis-posal,” November 1987.bduc, R. J., “Operating Experience with a HighForce Compactor, ” lecture notes from Incinerationof Low-Level Wastes: Z985, conference held inTucson, AZ, Mar. 21-23, 1985, pp. H 1-9.
10.
11.
12.
13.
14.
15.
16.
17
18.
19.
20.
21.
LindenfeM, Peter, Radioactive Radiations and TheirBiological Eflects (College Park, MD: AmericanAssociation of Physics Teachers, 1984).National Council on Radiation Protection and Meas-urements, Ionizing Radiation Exposures of the Popu-lation of the United States, NCRP report 93, Be-thesda, MD, 1987.
Rogers and Associates Engineering Corp., ‘Manage-ment Practices and Disposal Concepts for Low-bvelRadioactive Mixed Waste, ’ contractor report pre-pared for the Office of Technology Assessment,March 1989.
U.S. Congress, Office of Technology Assessment, AnEvaluation of Options for Managing Greater-Than-Class C Low-Level Radioactive Waste, OTA-BP-O-50, October 1988.
U.S. Department of Energy, Managing Low-LevelRadioactive Wastes: A Proposed Approach, DOE/LLW-9, April 1983.
U.S. Department of Energy, “Imw-hvel Radioac-tive Waste Disposal Facility Conceptual Designs, ”DOE/LLW-6~, June 1987.
U.S. Department of Energy, The 1987 State-by-StateAssessment of Low-Level Radioactive Wastes Re-ceived at Commercial Disposal Sites, National Imw-bvel Radioactive Waste Management program,DOE/LLW-69T, December 1988.
U.S. Department of Energy, DRAIT, IntegratedData Base for 1989: Spent Fuel and RadioactiveWaste Inventories, Projection-s, and Characteristics,DOE/RW-0006, Rev. 5, August 1989.U.S. Nuclear Regulatory Commission, ‘Policy State-ment on Lmw-Uvel Waste Volume Reduction (46Federal Register 200), pp. 51101, October 1981.
U.S. Nuclear Regulatory Commission—U.S. Envi-ronmental Protection Agency, ‘‘Guidance on theDefinition and Identification of Commercial MixedLmw-I..evel Radioactive Waste and Answers to An-ticipated Questions, ’ Jan. 8, 1987.
University of California, Irvine, “Imw-hvel Radio-active Waste Management in Medical and Biomedi-cal Research Institutions, ’ Luw-1-evel RadioactiveWaste Management Series, Department of EnergyDOE/LLW-13Th, March 1987.
Weber, I. P., and Wiltshire, S. D., The Nuclear WastePrimer: A Handbook for Citizens, The Isague ofWomen Voters Education Fund (New York, NY:Nick Lyons Books, 1985).