Embed Size (px)
DESCRIPTION
Health statistics of Abu Dhabi for latest years
Citation preview

Health Statistics 2012
Health Authority Abu Dhabi Reliable Excellence in Healthcare
www.haad.ae/statistics
www.haad.ae/statistics-xl
10 Oct 2013

Contents
Overview Vision 2 Achieving our vision… the journey so far 3 Statistical highlights 4 Public Health highlights 5 Investor highlights 6 Benchmarks 7
Population Population various breakdowns 9 Births and Deaths 12 Leading causes of death 13 Injury deaths 15 Communicable diseases 16 Health status 17 Diabetes Mellitus 19 Cancer 21
Episodes and activities Episodes various analyses 24 Activities by type 27 Procedures 28 Drugs 29
Note The data presented have been prepared to the best of our knowledge at time of release. Although effort has been invested to creating consistency and coherence, this should be considered work in progress. Feedback on content and layout are welcome.
Providers Provider overview 31 Clinical performance 32 Labour productivity 33 Hospitals 34 Hospital inpatient profile 35 Centers and Clinics 36 Beds including critical care 37 Blood bank 39 Market structure 40
Claims Claims 43 Payers Payer members 45 Payer claims 46
Financing Enhanced plans premiums 48 Enhanced plans limits 49 Enhanced plans benefits 50
1

Person
Provider Payer
Stable vision
• The health system finances itself through mandatory health insurance for all Abu Dhabi residents
• The financing system is flexible to manage for change over time and the degree of subsidy should be managed as efficiently as possible
• In the Emirate of Abu Dhabi, everyone has access to healthcare and freedom to choose their provider
• A system encompassing the full spectrum of health - protecting, promoting, sustaining and restoring services across the territory of the Emirate
• Providers are independent and predominantly private.
• An open system for all certified providers of health services delivers world-class quality care and outcomes in compliance with the highest international standards.
Quality driven by ambitious improvement
targets set by the regulatory authority of the
Emirate and reflected in the regularly monitored
and published key performance indicators of
the system
2

Achieving our vision … the journey so far
3
In 2006 we first defined a vision for Abu Dhabi’s health system with the mission to Ensure Reliable Excellence in Healthcare. This vision has guided major reforms and continues to inform daily decisions in healthcare. The Health Authority Abu Dhabi (HAAD) was created to track and steer progress towards realizing the vision and, to measure returns on investments for a healthy society. HAAD regulates all healthcare actors – public/private, provider/payer/professionals – by licensing, setting clear and simple rules, e.g., minimum standards for facilities, and ensuring compliance. HAAD does not own, build or manage healthcare facilities, treat patients, pay for treatment (insurers and other payers do), or pay the private sector to partner. SEHA (Arabic for ‘health’) is the largest public provider; it owns and develops existing public healthcare facilities, including partnerships with several renowned overseas operators to manage its facilities. Everyone has access to healthcare via mandatory health insurance. A first in the region, in 2006 Abu Dhabi guaranteed access to healthcare for all expatriates by mandating health insurance and linking it to resident permits. In 2008 the old Ministry of Health’s health cards for Nationals were replaced with Thiqa health insurance, which provided free access to care in both private and public sectors, and the freedom to choose the provider. World-class quality care and outcomes with Quality regularly monitored and published. In support of improving quality, HAAD develops clinical care and service standards tailored to Abu Dhabi across the health sector. In 2012, Abu Dhabi Health Regulations (Policy Manuals) were published for implementation across the healthcare sector. Since 2011, we have been working on the development of a comprehensive, consistent and trustworthy provider rating system that would allow benchmarking of the quality of services among Abu Dhabi providers, as well as internationally. HAAD has disseminated individualized and comprehensive performance reports to respective participating providers for their feedback on the methodology and actions to improve quality. Many clinical outcomes have improved in the last 5 years for example a reduction in under 5 year olds mortality from 8.7/1000 live births to 6.2/1000 live births an improvement of 29%. Full spectrum of health services. Our model of care sets out services which are appropriate, convenient and well coordinated around patient’s needs. Prevention. Disease prevention and health promotion are cornerstones of our public health strategy to reduce burden of diseases at onset in vulnerable population. This requires continuous collaboration with strategic stakeholders, e.g., municipalities on tobacco control, schools on healthy eating and exercise, police on road safety, and employers on workplace health promotion. Screening for health risks. When Nationals were first screened for various health risk factors in a programme called ‘Weqaya’ (Arabic for ‘protection’), it showed that 71% had at least one cardiovascular diseases (CVD) risk factor; many were unaware thus unable to seek care, and risk factors are projected to increase.
Community-based services help patients manage their chronic conditions, like diabetes, on a daily basis. For instance, the Imperial College London Diabetes Centre offers integrated consultation, diagnostic and pharmacy services to diabetics. Another creative solution is to treat patients, particularly those who are frail, in their homes as the Venecia Abu Dhabi Home Health Care group is currently doing. Specialty care. Competition for patients has helped the creation of new services, increased convenience and efficiency for existing services. Examples include: SKMC’s pediatric kidney transplantation service; Tawam and Lifeline providing mobile breast cancer screening services; and the Corniche Hospital opening a conveniently located Women’s Health Centre. Several private providers have opened new sub-acute care facilities. Patients also have greater choice as private facilities offer services previously only available at SEHA, such as Al Noor Hospital’s dialysis service, and cancer treatments at the Gulf International Cancer Centre. Health facilities & clinicians. The desire is to treat patients outside hospitals wherever possible, however, to account for population increase, 8 new private hospitals have opened in the last 5 years. In addition, 289 new clinics and centres have opened, with more planned, in both private and public sectors. The challenge is to manage potential over-supply in some areas and to ensure the hospitals operate with both quality and cost comparable with international benchmarks. In the last 5 years the number of doctors per 10,000 population has increased from 20 to 27 (35% improvement) and nurses from 38 per 10,000 population to 43.6 (15% improvement). Ambulance services. Good hospitals are worthless if patients can’t get there. The police provide emergency ambulance services. HAAD is working with them to develop a more integrated service that responds to a wider range of health emergencies and ensures the patients are taken to the most appropriate facility. Predominantly private providers. Based on positive experience both locally and regionally, we would like private operators to provide most healthcare, as well as add required new capacity. Private Investors are generally more responsive to market needs than the public sector. HAAD continues close monitoring of providers both public and private against robust clinical indicators to ensure high quality of care is provided. A Flexible and efficient financial system. We want to pay providers for the patients they actually treat and the quality of that treatment, as well as limit direct subsidies to public providers. The DRG system introduced in 2010 rewards quality: it pays hospitals on the basis of how sick patients are, not how long they stay or how many health services they are provided with. Insurers are also set to pay a bonus for high quality care. HAAD is focussed on improving the reimbursement system to ensure aadequate reimbursement levels that are based on reference prices.

Statistical highlights
Note * An Episode is an inpatient Encounter or a set of outpatient Encounters linked to the same clinical case based on the patient (identified by insurance member ID), Episode Clinician – the clinician responsible for consultation, and principal diagnosis, ** percentages by value ***the total number of reported operational beds (2011 where 2012 data is not available) and licensed beds for new facilities
Population
Providers Payers Claims
Financing Episodes*
• 2.58m residents, 18% Nationals • Median age 19.6 for Nationals and
31.7 for Expatriates • 34’358 births and 2’923 deaths
• 12.8 million Episodes* – 1.3% inpatient (163’859) – 41% by Nationals – 49% by hospitals
• 67.2 million Activities**:
• 5’528 physicians, 969 dentists,12’375 nurses and 4’319 allied health professionals & 1’993 pharmacists in 1’508 licensed facilities including: – 39 hospitals (4’226 beds***) – 856 centers and clinics – 454 pharmacies
39 licensed insurers compete for members
There are more insurance contracts (3.1m) than residents
• 19.8 Million claims submitted • 99.1 % of claims for outpatients
4
– 47% Consultations and procedures
– 21% Drugs – 19% DRGs
– 5% Services – 5% Dental – 3% Materials
(HCPCS)

Public health highlights • Population. One in 5 residents are Nationals, of whom two thirds
are under 30 and half under 199. Expatriates are overwhelmingly male and of Asian origin and predominantly aged between 20 and 409. A significant share are employed in construction and accommodated in labour camps. The introduction of mandatory health insurance in 2006 provided all residents in Abu Dhabi access to high quality care. Residence status is generally contingent on being employed, so there are very few retired or unemployed expatriates. The population has been growing rapidly in previous years, with, a temporary decline in 2009.
• Birth. Fertility rates – the main driver of growth for Nationals – has declined for over 30 years11,12. The UAE’s Total Fertility Rate has declined from 4.4 to 1.7 per woman between 1990 and 2010. Declining birth rates are attributed to urbanisation, delayed marriage, changing attitudes about family size, and increased education and work opportunities for women.
• Death. Mortality rates have also declined steadily11,12 over the past years. Infant mortality is now comparable with other developed countries7 and the WHO has reported a decrease in the under 5 mortality rate from 22 to 7 per 1’000 live births between 1990 and 2010 across the UAE. In 2012, the diseases of circulatory system caused the highest number of deaths, accounting for 38.8% of all death cases registered in the Abu Dhabi Emirate. External causes of morbidity and mortality and neoplasms are the second and third highest causes of death13,14.
• Injuries. Abu Dhabi has one of the highest rates of injuries resulting from road traffic accidents. They account for 10.4% of all deaths and are the leading cause of death amongst young males13-15. Speeding fines, free provision of child seats, and traffic safety education programs are some of the actions being
taken by government agencies. Occupational injuries are now covered by health insurance.
• Non-communicable diseases. The Emirate has high rates of chronic diseases related to life style, such as obesity, diabetes, and cardiovascular diseases. Cardiovascular diseases accounted for over a quarter of deaths in 2012. Adult Nationals were screened for cardiovascular risk factors in 2008 as a condition for enrollment in Thiqa insurance. Early analysis of results of this screening showed obesity rates of 33% for males and 38% for females and high proportions of people at risk of diabetes and hypertension among UAE nationals over 1517. Without major changes, these rates are set to increase further as the young population ages. Individuals thought to be at high risk of cardiovascular disease are being followed up.
• Cancer caused 13.9% of all deaths in the Emirate in 2012. Lymphoid, Haematopoietic and related tissue cancers are the dominant cancers in Abu Dhabi. Late detection of breast cancer leads to significant increases in mortality. Adult female Nationals aged 40-69 are being screened for breast cancer as part of their Thiqa insurance renewal. Education and awareness campaigns have increased screening rates for all nationalities.
• Communicable diseases. Rates of childhood communicable diseases are very low, due to immunization programs targeting children aged <5 years16. Expatriates are screened for communicable diseases before acquiring residence status16.
• Respiratory infections are the second most common non-life threatening condition in the Emirate after “signs, symptoms and ill-defined”, accounting for 12.3% of Episodes across all healthcare facilities27. Respiratory infections mostly impact workforce productivity and quality of life.
5

Investor highlights • Population. The population is concentrated on or nearby Abu Dhabi
islandC43. Areas of growth in the short to medium term are expected to be just off the island (Mohammed Bin Zayed city, Capital district, Shamkha and the islands adjacent to Abu Dhabi island) and Al Ain city. At the end of 2012 there were 0.46m National Thiqa members, 1.34m Basic members and 1.36 m Enhanced members45.
• Demand. Aggressive growth in demand is expected for general medical services and services linked to lifestyle related diseases, e.g. diabetes and cardiovascular diseases, and cancer with larger volume increases in outpatient settingsC46.
• Supply. Since the end of 2011 There has been 13% growth in the number of licensed physicians & dentistsC9,C10 and 11% growth in the number of licensed facilities*C9. By 2022, 2000 additional doctors and over 5000 nurses will be required, if turnover remains as now, this translates into 1,500 doctors and over 2000 nurses to be recruited annuallyC45. HAAD demand projectionsC33 also indicate that in 2021 demand for inpatient services may require over 1300 additional beds beyond the current 3,659 beds**34 (based on improved occupancy rate of 70%) . However, there are currently 2159 hospital beds under construction and more than 50% completeC40,C41. Which signals significant future capacity to meet this demandC34.
• Capacity gaps. Intensive and Critical Care medicine is the most severe capacity gap impacting healthcare services within Abu Dhabi. Severe capacity gaps also exist in Emergency care, Neonatology, Paediatrics, Oncology, Orthopaedics, Rehabilitation and PsychiatryC10. Sub specialty gaps exist in Paediatric and Paediatric surgery sub specialties, adult surgical sub specialties including Neurosurgery, Plastics, surgical Oncology are all severely undersupplied in Abu Dhabi.
• Significant new inpatient capacity is anticipatedC40 particularly in
rehabilitation and general hospital services, however, the number of planned Emergency services does not meet projected demand levels.C34. Overall bed occupancy rates vary by facility, but are lower than optimal38 indicating low efficiency. Bed occupancy in ICU, NICU, PICU, CICU, CCU and Isolation was consistently over the optimal 75% during 201138.
• Reimbursement. HAAD sets prices for the Basic product uniformly. Providers negotiate prices with Payers for Enhanced plans, generally as a multiple of Basic product rates. Thiqa rates are equivalent to Daman’s most generous Enhanced plan. Prices have been weighted towards outpatient care. DRGs were introduced for the Basic product in 2010, were voluntarily applied for Thiqa in 2011, and have been applied for Enhanced during 2012. 2013 will see more outpatient payments based on Evaluation and Management codes, thereby changed to reflect the severity of the patient’s condition not the grade of doctor seen.
• Provider market. Government-subsidised SEHA hospitals provided care in 59% of all inpatient Episodes (6% decrease from 2011) and 39% of all hospital outpatients (1% decrease from 2011)24. The largest independent groups are Al Noor and NMC34. International providers have come to Abu Dhabi, generally on the basis of a management service agreement, such as the Cleveland Clinic for SKMC and Johns Hopkins for Tawam.
• Payer market. Overall, the competitive Enhanced health insurance market has increased to almost 1.36m members. Over 50% of this market is held by three payers – Daman (33.5%), Al Dhafra (14.1%) and Oman Insurance(12.3%)45. Daman also administers Thiqa and Basic product. Claims per member have risen from 4.6 in 2009 to 6.3 in 201243. On average payers take 46 days to remit AED1 claimed46. This has improved from 47 days in 2011. Al Buhaira, Alliance and Oman Insurance had the lowest time to remit, less than 35 days46.
6 Note* *Percentage growth needs to be interpreted with caution, due to the fact of having some services within SEHA facilities holding a separate license
**2011 Operational beds

Benchmarks
Notes Bed ratio calculations were adjusted, as the population in Abu Dhabi is young and is not expected to need to go to hospital as frequently as other older population. To enable a fair comparison the bed ratio was adjusted by mapping the population age structure of Abu Dhabi to that of Germany, using German resource consumption profiles.
Life expectancy 2010 for Abu Dhabi Emirate, 2009 for others.
Sources WHO Statistical Information System/World Health Statistics 2012, Public health department, HAAD population estimates, SCAD, and Health Statistics Analysis 7
8
5
7
3
18
8
9
11
4
10
8.2
USA
UK
UAE
Singapore
Saudi Arabia
Qatar
Oman
Kuwait
Germany
Bahrain
Abu Dhabi
Under 5 mortality rate /1000 live births
24.2
27.4
19.3
18.3
9.4
27.6
19
17.9
36
14.4
21.4
Physicians /10'000 population
98.2
101.3
40.9
59
21
73.7
41.1
45.5
111
37.3
47.9
Nurses / 10'000 population
3.0
3.3
1.9
3.1
2.2
1.2
1.8
2.0
8.2
1.8
2.7
Beds / 1'000 population
1
0.5
4.1
1.9
2.4
8.7
1.9
3.5
0
2.2
5.5
USA
UK
UAE
Singapore
Saudi Arabia
Qatar
Oman
Kuwait
Germany
Bahrain
Abu Dhabi
Population growth, 1999-2009
7
5
6
2
15
7
8
10
3
9
6.3
Infant mortality rate / 1'000 live birth
76
78
77
79
69
78
72
78
78
73
77
Life expectancy at birth (years), Males
81
82
80
84
75
79
77
79
83
76
78
Females

Population
Providers Payers Claims
Financing Episodes
8

Population by age, gender and nationality
Notes HAAD is collaborating with SCAD to align figures with official SCAD estimates
National population and regional distribution are based on SCAD data
Source SCAD population estimates for Nationals, as well as additional HAAD assumptions and analysis based on raw insurance data
9
National Expatriate
Age band All Male Female Total Male Female Total
2'041 752 817 1'569 198 274 472
2'461 790 797 1'587 350 524 874
4'056 1'271 1'106 2'377 747 932 1'679
7'325 2'104 1'974 4'078 1'588 1'659 3'247
National 11'522 2'643 2'430 5'073 3'848 2'601 6'449
Expatriate 26'782 3'420 3'770 7'190 14'353 5'239 19'592
62'227 3'908 5'437 9'345 42'395 10'487 52'882
100'392 4'525 6'529 11'054 72'788 16'550 89'338
144'240 6'225 8'192 14'417 106'763 23'060 129'823
225'641 8'148 10'851 18'999 171'872 34'770 206'642
296'424 12'677 15'990 28'667 218'340 49'417 267'757
422'249 18'002 21'420 39'422 314'587 68'240 382'827
493'608 20'630 23'290 43'920 370'176 79'512 449'688
280'141 22'418 22'505 44'923 187'805 47'413 235'218
95'811 24'707 23'992 48'699 26'385 20'727 47'112
106'680 26'980 26'328 53'308 27'545 25'827 53'372
135'479 33'402 32'748 66'150 35'791 33'538 69'329
164'360 38'781 37'153 75'934 45'582 42'844 88'426
Total 2'581'439 231'383 245'329 476'712 1'641'113 463'614 2'104'7270-4
05-09
10-14
15-19
20-24
25-29
30-34
35-39
40-44
45-49
50-54
55-59
60-64
65-69
70-74
75-79
80-84
85+
♂ Male♀ Female

Population by region and nationality
10
Notes HAAD is collaborating with SCAD to align figures with official SCAD estimates
In this edition, both National population and regional distribution are based on SCAD data
Source SCAD population estimates for Nationals, as well as additional HAAD assumptions and analysis based on raw insurance data
Region National Expatriate Total
Abu Dhabi 253'735 1'319'206 1'572'941
Al Ain 194'153 494'896 689'049
Western 28'824 290'625 319'449
Total 476'712 2'104'727 2'581'439
53.2%62.7%
40.7% 23.5%
6.0%13.8% Abu Dhabi
Al Ain
Western
9.0%
28.2%
16.1%
91.0%
71.8%
83.9%
National Expatriate

Births and deaths
Note Rates = crude birth and death rates calculation are based on internal HAAD population estimates (per 1000) other rates based on crude births (per 1000); HAAD and SCAD are collaborating to align with official SCAD data
Source Birth and Death notifications; Health Statistics Analysis 11
Total By Region Rates By Nationality and Gender
Number % Number National Expatriate NA
20
11
20
12
Nat
ion
al
Mal
es
Ab
u
Dh
abi
East
ern
We
ste
rn
NA
Tota
l
Ab
u
Dh
abi
East
ern
We
ste
rn
Mal
e
Fem
ale
NA
Mal
e
Fem
ale
NA
Mal
e
Fem
ale
NA
Live Births 32'084 34'358 44% 51% 20'997 11'941 1'178 13.5 13.3 16.6 4.8 7'713 7'457 9'723 9'408 28 29
Deaths 2'902 2'923 33% 70% 1'750 971 200 2 1.2 1.1 1.3 0.8 618 352 6 1434 508 3 2
Still births 68 104 30% 23% 75 25 4 3.0 3.6 2.1 3.4 9 9 13 14 24 24 1 2 8
Neonatal mortality 127 135 53% 56% 102 27 5 1 3.9 4.9 2.3 4.2 43 27 2 32 28 2 1
Infant mortality 205 217 25% 35% 150 60 6 1 6.3 7.1 5.0 5.1 37 18 39 28 1
Child mortality (1-4) 75 64 53% 59% 35 27 2 1.9 1.7 2.3 1.7 21 12 1 17 13
Death by Age Group % % % %
0-6 days 99 94 53% 53% 76 14 4 3% 4% 1% 2% 28 20 2 22 20 1 1
7-27 days 28 41 54% 61% 26 13 1 1 1% 1% 1% 1% 15 7 10 8 1
28-364 days 78 82 40% 62% 48 33 1 3% 3% 3% 1% 22 11 29 20
1-4 75 64 53% 59% 35 27 2 2% 2% 3% 1% 21 12 1 17 13
5-9 24 33 55% 61% 14 16 3 1% 1% 2% 2% 12 6 8 7
10-14 25 26 46% 69% 11 11 4 1% 1% 1% 2% 8 4 10 4
15-19 45 51 69% 78% 31 16 4 2% 2% 2% 2% 28 6 1 12 4
20-24 152 126 37% 81% 73 42 11 4% 4% 4% 6% 35 11 67 12 1
25-29 193 195 14% 85% 112 55 28 7% 6% 6% 14% 17 10 148 20
30-34 176 175 14% 87% 100 45 30 6% 6% 5% 15% 23 2 130 20
35-39 182 154 14% 87% 97 39 18 5% 6% 4% 9% 14 7 120 13
40-44 200 194 12% 87% 110 63 21 7% 6% 6% 11% 19 5 149 21
45-49 188 217 18% 83% 143 54 20 7% 8% 6% 10% 28 12 152 25
50-54 229 235 17% 72% 127 93 15 8% 7% 10% 8% 22 19 147 47
55-59 245 240 25% 80% 153 72 14 1 8% 9% 7% 7% 32 28 159 21
60-64 184 192 35% 66% 115 74 3 7% 7% 8% 2% 40 27 86 39
65-69 166 168 42% 67% 98 68 2 6% 6% 7% 1% 57 14 56 41
70-74 170 190 52% 57% 117 70 3 7% 7% 7% 2% 56 42 1 52 38 1
75-79 142 137 57% 50% 85 48 4 5% 5% 5% 2% 41 37 28 31
80-84 125 131 57% 47% 71 53 7 4% 4% 5% 4% 43 32 18 38
85+ 176 178 55% 40% 108 65 5 6% 6% 7% 3% 57 40 1 14 66
NA
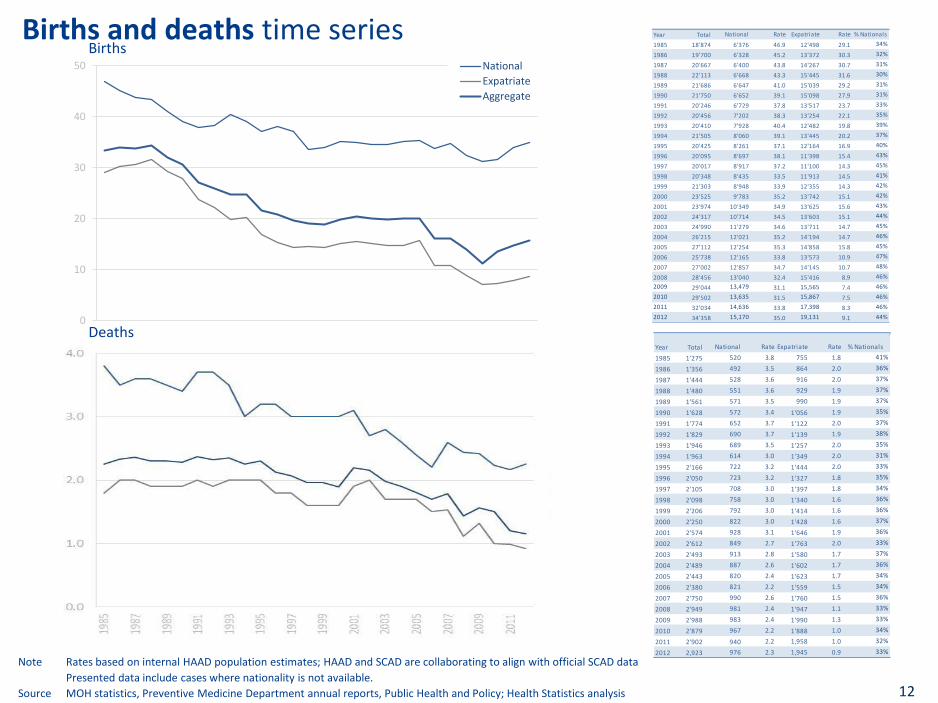
Births and deaths time series
Note Rates based on internal HAAD population estimates; HAAD and SCAD are collaborating to align with official SCAD data
Presented data include cases where nationality is not available.
Source MOH statistics, Preventive Medicine Department annual reports, Public Health and Policy; Health Statistics analysis
Births
Deaths
12
0
10
20
30
40
50 National
Expatriate
Aggregate
Year Total National Rate Expatriate Rate % Nationals
1985 1'275 520 3.8 755 1.8 41%
1986 1'356 492 3.5 864 2.0 36%
1987 1'444 528 3.6 916 2.0 37%
1988 1'480 551 3.6 929 1.9 37%
1989 1'561 571 3.5 990 1.9 37%
1990 1'628 572 3.4 1'056 1.9 35%
1991 1'774 652 3.7 1'122 2.0 37%
1992 1'829 690 3.7 1'139 1.9 38%
1993 1'946 689 3.5 1'257 2.0 35%
1994 1'963 614 3.0 1'349 2.0 31%
1995 2'166 722 3.2 1'444 2.0 33%
1996 2'050 723 3.2 1'327 1.8 35%
1997 2'105 708 3.0 1'397 1.8 34%
1998 2'098 758 3.0 1'340 1.6 36%
1999 2'206 792 3.0 1'414 1.6 36%
2000 2'250 822 3.0 1'428 1.6 37%
2001 2'574 928 3.1 1'646 1.9 36%
2002 2'612 849 2.7 1'763 2.0 33%
2003 2'493 913 2.8 1'580 1.7 37%
2004 2'489 887 2.6 1'602 1.7 36%
2005 2'443 820 2.4 1'623 1.7 34%
2006 2'380 821 2.2 1'559 1.5 34%
2007 2'750 990 2.6 1'760 1.5 36%
2008 2'949 981 2.4 1'947 1.1 33%
2009 2'988 983 2.4 1'990 1.3 33%
2010 2'879 967 2.2 1'888 1.0 34%
2011 2'902 940 2.2 1,958 1.0 32%
2012 2,923 976 2.3 1,945 0.9 33%
Year Total National Rate Expatriate Rate % Nationals
1985 18'874 6'376 46.9 12'498 29.1 34%
1986 19'700 6'328 45.2 13'372 30.3 32%
1987 20'667 6'400 43.8 14'267 30.7 31%
1988 22'113 6'668 43.3 15'445 31.6 30%
1989 21'686 6'647 41.0 15'039 29.2 31%
1990 21'750 6'652 39.1 15'098 27.9 31%
1991 20'246 6'729 37.8 13'517 23.7 33%
1992 20'456 7'202 38.3 13'254 22.1 35%
1993 20'410 7'928 40.4 12'482 19.8 39%
1994 21'505 8'060 39.1 13'445 20.2 37%
1995 20'425 8'261 37.1 12'164 16.9 40%
1996 20'095 8'697 38.1 11'398 15.4 43%
1997 20'017 8'917 37.2 11'100 14.3 45%
1998 20'348 8'435 33.5 11'913 14.5 41%
1999 21'303 8'948 33.9 12'355 14.3 42%
2000 23'525 9'783 35.2 13'742 15.1 42%
2001 23'974 10'349 34.9 13'625 15.6 43%
2002 24'317 10'714 34.5 13'603 15.1 44%
2003 24'990 11'279 34.6 13'711 14.7 45%
2004 26'215 12'021 35.2 14'194 14.7 46%
2005 27'112 12'254 35.3 14'858 15.8 45%
2006 25'738 12'165 33.8 13'573 10.9 47%
2007 27'002 12'857 34.7 14'145 10.7 48%
2008 28'456 13'040 32.4 15'416 8.9 46%
2009 29'044 13,479 31.1 15,565 7.4 46%
2010 29'502 13,635 31.5 15,867 7.5 46%
2011 32'034 14,636 33.8 17,398 8.3 46%
2012 34'358 15,170 35.0 19,131 9.1 44%

Leading causes of death
Note Causes of death classified according to WHO ICD-10
Source Death notifications; Health Statistics Analysis 13
Causes 2012 2011 2010 2009 2008 2007 2006 2005 2004 2003 2002 2001
Diseases of the circulatory system 1'135 1'089 762 707 697 506 378 424 413 624 778 622
External causes of morbidity 451 481 202 632 464
Injury, poisoning and certain other
consequences of external causes81 100 385 57 85
Neoplasms 474 461 461 397 360 370 315 294 298 276 289 252
Endocrine, nutritional and metabolic diseases 63 98 194 210 79 201 130 133 126 103 73 65
Congenital malformations, deformations and
chromosomal abnormalities85 72 144 199 120 177 131 156 146 152 199 190
Other 634 601 731 786 1'144 867 993 874 943 763 664 845
Total 2'923 2'902 2'879 2'988 2'949 2'742 2'450 2'446 2'489 2'492 2'617 2'574
614 600621 503 565 563 574
Injury, poisoning and certain other consequences of external causes
3%
Congenital malformations,
deformations and chromosomal abnormalities
3%
Diseases of the circulatory system
39%
External causes of morbidity
16%
Neoplasms16%
Other causes21%
Endocrine, nutritional and
metabolic diseases2%

Leading causes of death
Note Classification according to ICD 10
Source Death notifications; Health Statistics Analysis 14
National Expatriate NA
By Gender By Age Group By Gender By Age Group By Gender By Age Group
Causes of death Cases ♂ ♀ NA 0-1 1-15 15-30 30-45 45-60 60+ ♂ ♀ NA 0-1 1-15 15-30 30-45 45-60 60+ ♂ ♀ 0-1 15-30
Total Death 2'923 618 352 6 105 64 108 70 141 488 1'434 508 3 111 59 263 453 551 508 2 1 1
Diseases of the circulatory system 1'135 224 114 7 18 22 28 59 204 653 143 12 4 78 216 276 210 1 1
External causes of morbidity 451 95 19 2 1 20 56 13 16 10 305 30 2 24 119 115 63 12
Neoplasms 474 83 73 6 7 7 36 100 162 155 1 3 9 14 41 112 139
Diseases of the respiratory system 134 52 28 2 1 3 6 3 65 26 27 1 5 2 2 6 8 31
Symptoms, signs and abnormal clinical and laboratory
findings, not elsewhere classified158 25 19 1 5 1 1 1 1 36 74 39 5 2 16 26 20 44
Injury, poisoning and certain other consequences of external
causes81 14 6 1 5 8 5 2 1 49 10 2 16 23 18 1 1
Endocrine, nutritional and metabolic diseases 63 13 14 1 4 2 1 3 16 26 10 4 2 2 4 11 13
Certain conditions originating in the perinatal period 70 18 15 33 23 14 37
Certain infectious and parasitic diseases 83 18 15 7 2 1 6 17 27 22 1 1 4 4 4 16 21
Congenital malformations, deformations and chromosomal
abnormalities85 25 18 2 38 5 2 24 16 34 4 1 1
Diseases of the digestive system 61 18 4 2 3 10 7 28 11 1 1 2 7 15 13
Diseases of the genitourinary system 52 17 13 1 1 1 1 4 22 13 9 4 4 14
Diseases of the nervous system 37 10 10 2 2 4 3 9 13 4 1 1 7 2 3 3
Diseases of the blood and blood-forming organs and certain
disorders involving the immune mechanism9 4 5 2 4 1 2
Diseases of the musculoskeletal system and connective tissue 12 3 1 1 1 4 5 2 1 3 3
Diseases of the skin and subcutaneous tissue
Pregnancy, childbirth and the puerperium 2 2 2
Diseases of the ear and mastoid process 2 1 1 1 1
Diseases of the eye and adnexa
Mental, Behavioral and Neurodevelopmental disorders 3 1 1 1 1 2
NA 11 5 1 6 1 4 4 1

Injury deaths
Source HAAD Death notification data complemented by investigation into the causes of injury using medical records and police reports - Public Health and Policy; Health Statistics Analysis.
* Injury deaths by age group in 2012
15
Cases Nationals (Rate per 100'000) Expatriates (Rate per 100'000)
2012 2011 2010 2009 2008 2007 2012 2011 2010 2009 2008 2007 2012 2011 2010 2009 2008 2007
Total 514 537 551 680 623 607 24.33 23.74 25.13 34.17 34.28 37.87 18.91 21.82 23.42 35.85 27.89 35.50
RTI 303 342 379 456 430 460 19.51 18.90 22.13 28.27 29.56 33.04 9.98 13.07 15.00 22.60 17.88 25.67
Suicide 62 47 42 52 66 40 0.00 0.23 0.00 0.00 0.25 0.27 2.95 2.31 2.23 3.45 3.74 2.97
Falls/Falling Object 55 64 66 55 56 43 0.00 0.46 0.46 0.98 0.00 0.54 2.61 3.12 3.39 3.38 3.22 3.12
Drowning 29 12 17 23 14 13 1.89 0.92 0.46 1.47 1.24 1.07 0.95 0.40 0.79 1.13 0.52 0.69
Other 18 26 13 21 17 24 0.84 2.07 0.92 1.23 1.24 1.61 0.67 0.85 0.48 1.06 0.69 1.37
Poisoning 16 7 10 12 3 7 1.47 0.46 0.46 0.74 0.25 0.54 0.43 0.25 0.42 0.60 0.12 0.38
Homicide 12 7 10 16 11 9 0.42 0.00 0.00 0.25 0.25 0.27 0.48 0.35 0.53 0.99 0.58 0.61
Electricity 11 14 6 20 11 9 0.00 0.23 0.00 0.25 0.50 0.00 0.52 0.65 0.32 1.26 0.52 0.69
Fire/Flame, Burn 8 18 8 25 15 2 0.21 0.46 0.69 0.98 0.99 0.54 0.33 0.80 0.26 1.39 0.63 0.00
Nationals* Expatriates*
RTI
59%
Suicide12%
Falls/Falling
Object11%
Drowning
6%
Other
3%Poisoning
3%
Homicide
2%Electricity
2%Fire/Flame, Burn2%
1118
110
96
74
41
10 2 0
74
14
7
1
3
00.18
0.03
0.190.31
0.53
1.69
2.03
1.49
0.000.000
0.500
1.000
1.500
2.000
2.500
0-9 10-19 20-29 30-39 40-49 50-59 60-69 70-79 80+
Female
Male
Rate per 1'000
1219
33
158 7
3
1 0
5
1
6
2
1 12 0
0.17
0.03 0.06 0.05 0.06
0.31
0.61
2.23
0.000-9 10-19 20-29 30-39 40-49 50-59 60-69 70-79 80+

Communicable diseases
Note Preventable: Diseases preventable by vaccination; Screened: Adult expatriates are screened on application or renewal of residence visa, some data where updated by the Communicable Diseases Department.
Source HAAD infectious diseases notification data 2010-2012 BI report - Public Health and Policy; Health Statistics Analysis 16
Total National Expatriate NA
Prev
enta
ble
Scre
ened
Disease 2010 2011 2012 0-14 15-34 35-5455-64 65+ 0-14 15-34 35-54 55-64 65+ 0-14
n Chickenpox 7'429 11'768 9'872 3067 253 28 3 5 3054 2680 745 34 2 1
Malaria 1'415 2'731 2'715 3 1 1 66 1734 802 102 6
Other Food Poisoning 469 667 1'147 362 75 15 2 6 329 224 121 10 2 1
Scabies 654 585 758 33 35 18 2 5 81 368 195 19 2
n n Viral Hepatitis B 711 673 665 1 102 40 13 8 3 256 201 33 8
Viral Hepatitis C 668 578 527 13 45 12 9 2 128 240 64 14
Typhoid Fever 335 394 443 6 17 1 1 56 236 115 10 1
n Pulmonary Tuberculosis 450 380 350 12 5 9 7 6 207 87 12 5
n Seasonal Influenza 248 282 298 96 31 11 3 3 48 46 49 6 5
n Viral Hepatitis A 193 138 279 83 22 108 56 8 2
Scarlet Fever 105 239 201 98 103
n Mumps 221 194 198 44 3 2 72 52 25
Extra Pulmonary Tuberculosis 175 182 192 2 9 3 2 1 5 115 46 6 3
Other STD 318 363 136 60 19 1 1 39 16
Brucellosis 52 75 135 30 19 17 2 1 9 31 19 6 1
Giardia Lambia 55 82 103 12 4 1 16 36 29 4 1
n Syphilis 62 99 88 4 7 1 1 1 30 40 4
n Measles 50 48 56 15 1 31 8 1
n Whooping Cough 73 39 53 31 22
Viral Meningitis 36 37 52 20 6 1 10 9 6
Gonorrhoea 62 42 44 1 18 2 1 14 7 1
Acute Encephalitis 10 10 26 5 1 3 1 1 4 8 3
Acute Flaccid Paralysis 11 14 21 6 15
n Rubella 22 42 18 2 3 11 2
Other Viral Hepatitis 26 8 14 1 12 1
n Tetanus 1 3 2 1 1
Other 315 422 875 113 81 14 9 5 218 216 183 28 7 1

Selected cardiovascular indicators overview
Source 1Preliminary analysis of Weqaya sample of 112’301 UAE Nationals in the Emirate screened in 2008-9, Public Health and Policy; Definitions:
Obesity: body-mass index ≥ 30; Hypertension: systolic blood pressure ≥ 140 mm Hg or diastolic blood pressure > 90 mm Hg; High lipids: LDL >4.1 mmol/l or HDL <1 mmol/l; Diabetes: HbA1c ≥ 6.1%; Smoking: at least one cigarette per day, 1 cigar/pipe per week or one shisha per month
2Preliminary analysis of Weqaya sample1, Public Health and Policy; Indicators used in correlation analysis: Obesity: body-mass index; Hypertension: systolic blood pressure; High lipids: LDL; Diabetes: HbA1c; Smoking: self-reported consumption
3Extrapolation based on a survey of 76,070 residents in the Emirate in 2005; Definitions: High lipids: self-reported history of high cholesterol and/or total serum cholesterol >200 mg/dl; Hypertension: self-reported history of hypertension, and/or systolic blood pressure ≥ 140 mm Hg or diastolic blood pressure > 90 mm Hg; Obesity: body-mass index > 30; Diabetes: self-reported diabetes or fasting glucose over 126 mg/dl; where only random glucose was available, diabetes status was imputed using a logistic model; Smoking: self-reported smoking; UAE University and Health Statistics analysis 17
Tota
l
Mal
e
Fem
ale
Ob
esit
y
Hyp
erte
nsi
on
Dia
bet
es
Hig
h li
pid
s
Smo
kin
g
Tota
l
Mal
e
Fem
ale
Obesity 36% 33% 38% 20% 17% 32%
Hypertension 17% 24% 12% 35% 33% 41%
Diabetes 21% 22% 20% 18% 18% 18%
High lipids 36% 50% 26% 18% 19% 15%
Smoking 11% 24% 0.8% 25% 29% 6.6%
National1 Correlation2 Expatriate3
Less More
likely likelyPeople who are obese are more likely to have high blood pressure, high lipids and diabetes, but are as likely to be smokers as those who aren't obese

Selected cardiovascular indicators by age group and gender
Source 1 Preliminary analysis of Weqaya sample of 112’301 UAE Nationals in the Emirate screened in 2008-9, Public Health and Policy; Definitions:
Obesity: body-mass index ≥ 30; Hypertension: systolic blood pressure ≥ 140 mm Hg or diastolic blood pressure > 90 mm Hg; High lipids: LDL >4.1 mmol/l or HDL <1 mmol/l; Diabetes: HbA1c ≥ 6.1%; Smoking: at least one cigarette per day, 1 cigar/pipe per week or one shisha per month.
2 Extrapolation based on a survey of 76,070 residents in the Emirate in 2005; Definitions: High lipids: self-reported history of high cholesterol and/or total serum cholesterol >200 mg/dl; Hypertension: self-reported history of hypertension, and/or systolic blood pressure ≥ 140 mm Hg or diastolic blood pressure > 90 mm Hg; Obesity: body-mass index > 30; Diabetes: self-reported diabetes or fasting glucose over 126 mg/dl; where only random glucose was available, diabetes status was imputed using a logistic model; Smoking: self-reported smoking; Physical exercise: self-reported physical exercise; UAE University and Health Statistics analysis.
Female Male
Nationality Indicator 20-29 30-39 40-49 50-59 60-69 70-79 80+ 20-29 30-39 40-49 50-59 60-69 70-79 80+
National Obesity 25% 41% 57% 65% 55% 45% 37% 29% 37% 37% 36% 30% 25% 23%
High lipids 20% 26% 34% 37% 38% 36% 35% 44% 56% 57% 55% 49% 51% 50%
Hypertension 5% 8% 18% 34% 44% 50% 47% 18% 20% 28% 42% 47% 49% 46%
Diabetes 8% 14% 34% 57% 61% 59% 57% 8% 17% 34% 55% 64% 62% 50%
Smoking 1% 1% 1% 1% 1% 0% 0% 27% 27% 22% 17% 10% 7% 7%
Heart disease 0% 1% 3% 8% 11% 14% 13% 1% 1% 3% 7% 12% 14% 14%
Stroke 0% 1% 2% 4% 5% 6% 6% 1% 1% 1% 3% 5% 6% 6%
Physical exercise 25% 27% 25% 20% 13% 5% 6% 43% 40% 35% 33% 27% 19% 24%
Expatriate Obesity 21% 32% 42% 51% 49% 30% 67% 12% 18% 21% 23% 30% 21% 18%
High lipids 29% 37% 61% 66% 60% N/A N/A 16% 37% 48% 52% 52% 51% 50%
Hypertension 3% 9% 28% 45% 65% 61% 58% 9% 16% 30% 46% 58% 53% 33%
Diabetes 5% 13% 32% 46% 61% 44% 33% 5% 15% 35% 46% 53% 47% 33%
Smoking 6% 7% 9% 6% 5% 10% 0% 33% 29% 25% 21% 21% 14% 21%
Physical exercise 21% 23% 27% 29% 23% 9% 8% 32% 31% 34% 37% 36% 24% 36%
2
1
18

Note Risk of diabetes is defined as HbA1c ≥ 6.1%
Source Preliminary analysis of Weqaya sample of 112’301 UAE Nationals in the Emirate screened in 2008-9, Health Statistics
Prevalence of diabetes mellitus by age group
19

Notes Green indicates improvement
Diabetics is the number of members who had an Encounter with diagnosis of diabetes. Well controlled diabetes is a measure of diabetics whose latest HbA1c<7%. Moderate and well controlled diabetics are those whose latest HbA1c<7.5%. Poorly controlled diabetics are those whose latest HbA1c was >9%. Related care indicators apply to diabetics only and indicate ≥1 test per member per annum. Rates shown are rates within breakdown category. Indicator definitions are available at https://www.shafafiya.org
Source KEH Episodes with Encounter start date 1 January – 31 December 2011 20
Diabetes performance
Diabetes performance
Target
direction Indicator 2011
Change
2010-11 Male Female 0-9 10-19 20-39 40-59 60+ Thiqa Enhanced Basic
Diabetics 190'407 +14'841 126'325 64'082 1'960 2'997 49'352 108'301 27'797 46'146 70'188 79'510
Well controlled diabetics 34 % +2 % 30 % 42 % 7 % 18 % 29 % 35 % 43 % 48 % 32 % 28 %
Diabetics w HbA1c observation & latest HbA1c<7% QI 59 % -1 % 55 % 65 % 38 % 45 % 66 % 57 % 59 % 63 % 64 % 51 %
Moderate & well controlled diabetics 40 % +2 % 36 % 49 % 8 % 22 % 32 % 42 % 53 % 56 % 38 % 34 %
Diabetics w HbA1c observation & latest HbA1c<7.5% QI 70 % -1 % 67 % 75 % 46 % 53 % 74 % 69 % 71 % 74 % 75 % 63 %
Poorly controlled diabetics 17 % +1 % 17 % 16 % 8 % 21 % 12 % 18 % 21 % 22 % 12 % 19 %
Diabetics w HbA1c observation & latest HbA1c>9% QI 29 % +1 % 32 % 25 % 48 % 52 % 27 % 30 % 28 % 29 % 23 % 34 %
Annual HbA1c test 66 % +0 % 63 % 72 % 28 % 50 % 51 % 70 % 83 % 82 % 64 % 59 %
Annual lipid profile test 54 % +9 % 53 % 58 % 14 % 31 % 42 % 59 % 65 % 65 % 53 % 50 %
Annual renal test 70 % +0 % 67 % 74 % 33 % 51 % 57 % 73 % 82 % 81 % 69 % 64 %
Annual eye exam 89 % +7 % 89 % 90 % 87 % 84 % 90 % 89 % 89 % 91 % 84 % 92 %
latest LDL:HDL > 3.5 w/o treatment 28 % +1 % 29 % 28 % 75 % 76 % 53 % 23 % 12 % 27 % 27 % 36 %Re
late
d c
are
ind
icat
ors

Cancer death cases
21
By site
Note Data need to be interpreted with caution, due to undercounting and ambiguity about the overall population (denominator).
Source Death Notifications, Health Statistics Analysis
Cancer death cases Rate per 100'000 population
Total Male Female Male Female
405 214 191 12.3 28.0
National 136 75 61 34.4 28.2
Expatriate 269 139 130 9.1 27.9
21.9%
3.4%
4.2%
5.2%
6.4%
6.9%
8.4%
8.6%
9.9%
11.8%
13.3%
Other
Lymphoma
Brain, nervous system
Pancreas
Stomach
Other Cancer
Leukaemia
Liver and intrahepatic bile ducts
Colorectum
Trachea, bronchus and lung
Breast
All
17.8%
3.7%
4.7%
4.7%
5.1%
5.6%
5.6%
9.8%
12.1%
13.1%
17.8%
Other
Lymphoma
Other Cancer
Prostate
Pancreas
Brain, nervous system
Stomach
Colorectum
Leukaemia
Liver and intrahepatic bile ducts
Trachea, bronchus and lung
Male
17.3%
3.7%
4.2%
4.7%
5.2%
5.2%
5.8%
6.8%
9.4%
9.9%
27.7%
Other
Liver and intrahepatic bileducts
Leukaemia
Cervix uteri
Pancreas
Trachea, bronchus and lung
Ovary
Stomach
Other Cancer
Colorectum
Breast
Female
National33%
Expatriate67%
By nationality
Male53%Female
47%
By gender
Cancer death cases Rate per 100'000 population
Total Male Female NA Male Female
406 214 191 1 12.3 28.0
National 136 75 61 34.4 28.2
Expatriate 270 139 130 1 9.1 27.9
National33%
Expatriate67%
By nationality
Male53%Female
47%
By gender
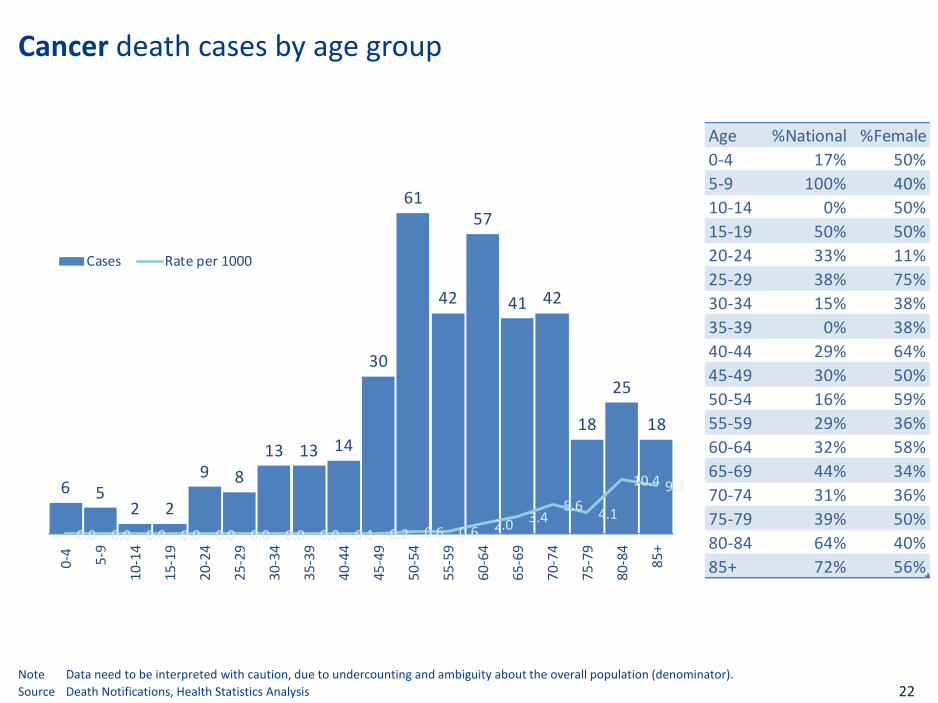
Cancer death cases by age group
Note Data need to be interpreted with caution, due to undercounting and ambiguity about the overall population (denominator).
Source Death Notifications, Health Statistics Analysis 22
Age %National %Female
0-4 17% 50%
5-9 100% 40%
10-14 0% 50%
15-19 50% 50%
20-24 33% 11%
25-29 38% 75%
30-34 15% 38%
35-39 0% 38%
40-44 29% 64%
45-49 30% 50%
50-54 16% 59%
55-59 29% 36%
60-64 32% 58%
65-69 44% 34%
70-74 31% 36%
75-79 39% 50%
80-84 64% 40%
85+ 72% 56%
6 52 2
9 8
13 13 14
30
61
42
57
41 42
18
25
18
0.0 0.0 0.0 0.0 0.0 0.0 0.0 0.0 0.1 0.2 0.6 0.6 2.0 3.45.6
4.1
10.4 9.3
0-4
5-9
10
-14
15
-19
20
-24
25
-29
30
-34
35
-39
40
-44
45
-49
50
-54
55
-59
60
-64
65
-69
70
-74
75
-79
80
-84
85
+
Cases Rate per 1000

Population
Providers Payers Claims
Financing Episodes
23

Episodes by type, setting and nationality
Notes An Episode is an inpatient Encounter or a set of outpatient Encounters linked to the same clinical case based on the patient (identified by insurance member ID). An Episode clinician is the clinician responsible for consultation, and principal diagnosis. Episodes are attributed to facility types according to Episode Clinician facility as per clinician licensing database. Non-SEHA ER Episodes are underrepresented because of miscoding of ER Encounter types as outpatient. 2010 estimates are based on Encounters reported in 2010 eClaims and Encounter/Episode ratios.
Source Cube 2012; Health Statistics Analysis 24
2012 SEHA 2011 SEHA 2010 SEHA
Total 12'765'198 37% 11,361,157 37% 10,998,469 34%
Hospital 6'311'459 40% 5,774,551 40% 5,954,723 38%
Inpatient 163'859 59% 130,219 65% 136,725 63%
ER 60'124 88% 45,138 94% 36,576 95%
National 29'886 94% 21,216 97% 18,311 98%
Expatriate 26'102 87% 21,232 92% 17,469 95%
N/A 4'136 43% 2,690 76% 796 22%
Non-ER 103'735 42% 85,081 49% 100,149 51%
National 33'484 66% 28,894 67% 40,878 75%
Expatriate 44'576 37% 40,135 41% 43,793 45%
N/A 25'675 21% 16,052 39% 15,478 4%
Outpatient 6'147'600 39% 5,644,332 40% 5,817,998 38%
ER 828'293 81% 655,394 97% 575,654 95%
National 440'637 87% 354,837 99% 321,781 96%
Expatriate 368'230 75% 297,177 96% 251,751 93%
N/A 19'426 46% 3,380 61% 2,123 61%
Non-ER 5'319'307 33% 4,988,938 32% 5,242,343 31%
National 1'779'900 58% 1,647,896 57% 1,875,221 53%
Expatriate 3'121'611 22% 2,907,096 22% 3,000,493 21%
N/A 417'796 6% 433,946 2% 366,629 2%
Center 5'860'605 38% 5,049,446 38% 4,528,463 31%
National 2'771'498 60% 2,269,165 63% 1,974,079 54%
Expatriate 2'794'952 19% 2,497,339 19% 2,340,605 15%
N/A 294'155 5% 282,941 1% 213,779 1%
Clinic 593'134 3% 537,160 2% 515,283 1%
National 131'091 5% 103,564 7% 107,613 2%
Expatriate 425'743 2% 394,009 0% 380,371 0%
N/A 36'300 1% 39,588 0% 27,298 0%
Outpatient
ExpatriateHospital
Center National
ER N/AClinic Inpatient
Provider type Setting Nationality

Episodes by diagnosis group, % of volume
Source Cube 2012; Health Statistics analysis; diagnosis groups based on WHO classification of diagnoses ICD 9 25
Outpatient Inpatient
Total Non-ER ER Non-ER ER
% of Total Episodes 100 92.0 6.4 0.9 0.8
Signs, symptoms and ill-defined 19.9 19.7 22.3 27.5 16.9
Respiratory infections 12.3 12.0 17.7 3.5 5.8
Musculoskeletal diseases 8.3 8.5 6.0 3.0 2.1
Digestive diseases 6.6 6.5 7.4 7.8 8.2
Endocrine disorders 6.6 6.7 3.5 8.2 11.8
Respiratory diseases 6.2 6.2 5.8 4.4 4.9
Cardiovascular diseases 4.9 5.0 3.6 5.5 7.6
Genitourinary diseases 4.5 4.5 4.2 3.9 4.5
Skin diseases 4.1 4.3 2.7 1.5 2.0
Diabetes mellitus 4.0 4.1 2.6 2.9 4.8
Infectious and parasitic diseases 3.9 4.0 2.3 2.7 4.5
Sense organ diseases 3.8 4.0 2.4 1.2 1.2
Nutritional deficiencies 3.6 3.8 1.1 3.2 3.4
Injuries 3.3 2.8 11.2 2.5 5.2
Oral conditions 2.7 2.9 0.8 0.5 0.3
Neuropsychiatric conditions 2.3 2.3 2.2 2.8 4.4
Maternal and Perinatal conditions 2.2 2.0 3.1 15.3 9.2
Cancer 0.5 0.5 0.3 1.8 1.4
Congenital anomalies 0.2 0.2 0.2 1.4 0.8
RTA 0.1 0.0 0.7 0.2 0.9
100.0 100.0 100.0 100.0 100.0

Episodes by diagnosis group, % of value
Source Cube 2012; Health Statistics analysis; diagnosis groups based on WHO classification of diagnoses ICD 9 26
Total Outpatient Inpatient
100.0% 67.5% 32.5%
Break down Break down
Services Procedures Drugs Supplies DRG Services Procedures Drugs Supplies
% of Total value 100 100 1.3 67.6 28.3 2.9 100.8 59.2 14.3 21.1 4.5 1.8
Signs, symptoms and ill-defined 18.4 18.0 1.2 13.1 3.1 0.7 18.9 12.8 1.4 3.5 1.1 0.2
Diabetes mellitus 9.5 13.5 0.0 6.6 6.1 0.8 1.2 0.6 0.1 0.2 0.3 0.1
Respiratory infections 7.7 8.8 0.0 5.5 3.3 0.0 5.3 3.0 0.3 1.5 0.5 0.1
Cardiovascular diseases 7.0 5.9 0.0 3.0 2.7 0.2 9.4 6.6 1.0 1.2 0.2 0.4
Musculoskeletal diseases 6.6 7.6 0.0 5.3 2.2 0.1 4.5 1.7 0.2 2.2 0.3 0.1
Maternal and Perinatal conditions 6.4 3.2 0.0 2.8 0.3 0.0 13.1 11.0 0.6 1.4 0.1 0.0
Digestive diseases 5.2 4.1 0.0 2.6 1.4 0.0 7.4 4.2 0.6 2.2 0.3 0.1
Genitourinary diseases 5.0 5.3 0.0 4.2 1.1 0.1 4.5 1.9 0.4 2.0 0.1 0.1
Oral conditions 5.0 7.1 0.0 6.9 0.1 0.0 0.6 0.1 0.1 0.3 0.0 0.0
Respiratory diseases 4.8 4.0 0.0 2.2 1.7 0.1 6.6 2.8 2.4 1.0 0.2 0.1
Endocrine disorders 4.3 4.8 0.0 3.1 1.6 0.1 3.3 2.2 0.3 0.4 0.3 0.1
Neuropsychiatric conditions 4.2 2.9 0.0 1.6 1.0 0.3 6.9 1.2 5.0 0.5 0.1 0.1
Injuries 3.9 2.4 0.0 2.0 0.3 0.1 7.2 4.2 0.5 2.2 0.1 0.1
Infectious and parasitic diseases 3.2 2.9 0.0 1.9 1.0 0.0 3.8 3.0 0.4 0.3 0.1 0.0
Sense organ diseases 3.0 3.3 0.0 2.5 0.5 0.3 2.3 0.3 0.2 1.2 0.3 0.2
Skin diseases 2.6 3.2 0.0 2.1 1.1 0.0 1.2 0.5 0.1 0.4 0.2 0.0
Cancer 1.8 1.3 0.0 0.8 0.4 0.0 2.8 1.8 0.3 0.4 0.3 0.0
Nutritional deficiencies 1.2 1.6 0.0 1.2 0.4 0.0 0.2 0.1 0.0 0.1 0.0 0.0
Congenital anomalies 0.7 0.4 0.0 0.3 0.0 0.1 1.6 0.9 0.5 0.1 0.0 0.0
RTA 0.0 0.0 0.0 0.0 0.0 0.0 0.0 0.0

Activities by type, % of value
* Dark area indicates proportion of outpatient
Note Not all drugs have been mapped to the appropriate ATC code http://en.wikipedia.org/wiki/ATC_code_A02 ; HCPCS CMS Hospital Outpatient Payment system includes 90% unclassified drugs
Source Cube 2012; Health statistics analysis 27
CPT 100% OP*
Pathology & Laboratory 41.7%
Evaluation & Management 30.8%
Diagnostic Ultrasound 7.2%
Radiology 6.2%
Musculoskeletal 2.6%
Digestive System 1.9%
Integumentary 1.7%
Eye & Ocular Adnexa 1.4%
Respiratory System 1.4%
Urinary System 1.1%
Maternity Care & Delivery .8%
Nuclear Medicine .8%
Cardiovascular System .5%
Auditory System .4%
Radiation Oncology .4%
Female Genital System .4%
Male Genital System .3%
Nervous System .2%
Other CPT .2%
Breast Mammography .1%
Service 100% OP*
Other 22.7%
Perdiem - Haemodialysis (HD) 13.3%
Observation or Treatment room 8.0%
Outlier Payment 5.3%
Perdiem - Day Stay (Day care) 4.6%
Per diem Inpatient 4.0%
Room and Board: First Class Room 2.8%
Per diem Intensive - Care Unit (ICU) 2.3%
Per diem N-ICU 1.0%
Operating Room and Services .9%
Room and Board: Shared Room .7%
Perdiem - Room Rate difference .5%
Comprehensive screening evaluation and management.4%
Room and Board: Ward .2%
Per diem - Special-Care Baby Unit (SCBU) .1%
Perdiem - SCU - Daily Rate (Day 1 to 3) .1%
Neonatal Intensive Care Unit (NICU) .1%
Intensive Care Unit (ICU) .1%
Delivery Room .0%
Perdiem - PICU - Daily Rate (Day 1 to 7) .0%
Room and Board: Private Room Deluxe or better .0%
Special Care Baby Unit (SCBU) .0%
Coronary Care Unit (CCU) .0%
Perdiem - Non-Medical Escort .0%
Catheterization Lab .0%
Other services .0%
CPT47%
Drug21%
DRG19%
Service5%
Dental5%
HCPCS3%
Drug 100% OP*
Alimentary tract and metabolism 26.1%
Cardiovascular system 15.6%
Antiinfectives for systemic use 13.8%
Antineoplastic and immunomodulating agents 10.4%
Respiratory system 9.0%
Musculo-skeletal system 5.8%
Blood and blood forming organs 5.4%
Nervous system 4.9%
Dermatologicals 2.4%
Genito-urinary system and sex hormones 2.2%
Sensory organs 2.2%
Systemic hormonal preparations, excluding sex hormones and insulins1.3%
Various .7%
Antiparasitic products, insecticides and repellents .3%
DRG 100% OP*
Newborns & Other Neonates 20.7%
Diseases & Disorders Of The Respiratory System 14.4%
Childbirth 14.3%
Diseases & Disorders Of The Circulatory System 9.5%
Diseases & Disorders Of The Digestive System 8.1%
Diseases & Disorders Of The Musculoskeletal System & Connective Tissue6.0%
Diseases & Disorders Of The Nervous System 3.8%
Diseases & Disorders Of The Female Reproductive System3.5%
Diseases & Disorders Of The Ear, Nose, Mouth & Throat2.8%
Diseases & Disorders Of The Urinary Tract 2.7%
Infectious & Parasitic Diseases Of Systemic Or Unspecified Sites2.4%
Diseases & Disorders Of The Endocrine, Nutritional & Metabolic Systems2.3%
Diseases & Disorders Of The Hepatobiliary System & Pancreas2.2%
Diseases & Disorders Of The Skin, Subcutaneous Tissue & Breast2.0%
Diseases & Disorders Of Blood, Blood Forming Organs, Immunological System1.2%
Diseases & Disorders Of The Myeloproliferative System & Poorly Differentiated Neoplasms1.0%
Mental Diseases & Disorders .7%
Diseases & Disorders Of The Male Reproductive System.6%
Injuries, Poisonings & Toxic Effects Of Drugs .5%
Diseases & Disorders Of The Eye .3%
Other DRG .7%
Dental 100% OP*
Restoration 34.8%
Diagnostic 11.9%
Oralmaxillo 10.7%
Adjunctivegeneral 9.6%
Orthodontics 9.3%
Endodontics 9.1%
Prevention 6.1%
Fixedprostho 5.2%
Periodontics 2.5%
Removableprostho .9%

Procedures by diagnosis group, % of value
* Dark area in pie charts represents share of top 5 procedures within total value of diagnosis group
Note Procedures: CPT excluding E&M codes. Data should be interpreted with caution, particularly for categories with low counts
Source Cube 2012; Health Statistics analysis; diagnosis groups based on WHO classification of diagnoses ICD 9 28
Diagnosis group 100 Top 5* 1st 2nd 3rd 4th 5th
Signs, symptoms and ill-defined 20 #####Complete Cbc W/Auto Diff Wbc
(3.6%)Ob Us >/= 14 Wks, Sngl Fetus (3.0%) Echo Exam Of Heart (2.9%) Assay Of Vitamin D (2.8%) Comprehen Metabolic Panel (2.1%)
Oral conditions 12 ##### Two Surfaces (5.5%)Crown, Porcelain/Ceramic/Polymer
Glass + L (5.3%)One Surface (5.3%) Three Surfaces (4.5%) Class I Malocclusion + L (4.3%)
Diabetes mellitus 10 ##### Assay Of Parathormone (10.1%) Assay Of Vitamin D (9.3%) Lipid Panel (6.7%)Glycosylated Hemoglobin Test
(5.6%)Eye Exam With Photos (4.3%)
Musculoskeletal diseases 9 ##### Knee Arthroscopy/Surgery (10.9%) Mri Lumbar Spine W/O Dye (10.4%)Mri Jnt Of Lwr Extre W/O Dye
(5.0%)Mri Neck Spine W/O Dye (4.5%) Assay Of Vitamin D (3.8%)
Genitourinary diseases 7 ##### Us Exam, Pelvic, Complete (7.4%)Fragmenting Of Kidney Stone
(7.3%)Transvaginal Us, Non-Ob (7.1%)
Us Exam Abdo Back Wall, Comp
(4.3%)Us Exam, Pelvic, Limited (2.5%)
Maternal and Perinatal conditions 5 #####Ob Us >/= 14 Wks, Sngl Fetus
(17.2%)Ob Us < 14 Wks, Single Fetus (9.5%) Ob Us, Detailed, Sngl Fetus (8.4%) Cesarean Delivery Only (5.1%) Ob Us, Follow-Up, Per Fetus (4.2%)
Digestive diseases 5 ##### Upper Gi Endoscopy, Biopsy (7.7%) Us Exam, Abdom, Complete (5.4%) Colonoscopy And Biopsy (4.2%)Complete Cbc W/Auto Diff Wbc
(3.8%)Hepatic Function Panel (3.7%)
Endocrine disorders 5 ##### Assay Of Vitamin D (7.9%) Assay Thyroid Stim Hormone (6.7%) Lipid Panel (6.4%) Assay Of Parathormone (4.0%) Free Assay (Ft-3) (4.0%)
Cardiovascular diseases 5 ##### Echo Exam Of Heart (9.9%)Cath Placement, Angiography
(4.5%)Lipid Panel (4.4%) Extremity Study (3.4%) Doppler Echo Exam, Heart (3.0%)
Injuries 4 #####Repair Superficial Wound(S)
(11.8%)
Mri Jnt Of Lwr Extre W/O Dye
(6.9%)Knee Arthroscopy/Surgery (4.2%)
Remove Foreign Body From Eye
(2.7%)Layer Closure Of Wound(S) (2.4%)
Sense organ diseases 4 ##### Cataract Surg W/Iol, 1 Stage (12.3%) Eye Exam, New Patient (7.8%) Remove Impacted Ear Wax (6.0%) Eye Exam Established Pat (4.5%) Treatment Of Retinal Lesion (4.5%)
Respiratory infections 3 ##### Nasal Endoscopy, Dx (9.8%)Complete Cbc W/Auto Diff Wbc
(6.5%)Ther/Proph/Diag Inj, Sc/Im (5.1%) Airway Inhalation Treatment (4.7%) Chest X-Ray (4.5%)
Respiratory diseases 3 ##### Nasal Endoscopy, Dx (23.5%) Ct Maxillofacial W/O Dye (5.5%) Airway Inhalation Treatment (5.1%)Remove Tonsils And Adenoids
(3.3%)Chest X-Ray (2.8%)
Neuropsychiatric conditions 2 #####Psytx, Off, 20-30 Min W/E&M
(9.9%)Psy Dx Interview (6.8%) Psytx, Office, 75-80 Min (6.4%)
Motor Nerve Conduction Test
(6.3%)Psytx, Off, 45-50 Min (4.8%)
Infectious and parasitic diseases 2 ##### Destruct B9 Lesion, 1-14 (6.9%) Transvaginal Us, Non-Ob (6.5%) Us Exam, Pelvic, Complete (4.3%)Complete Cbc W/Auto Diff Wbc
(3.6%)Hepatic Function Panel (2.7%)
Skin diseases 2 ##### Drainage Of Skin Abscess (16.9%)Photochemotherapy With Uv-B
(4.9%)Hepatic Function Panel (4.3%) Laser Tx, Skin < 250 Sq Cm (3.3%)
Complete Cbc W/Auto Diff Wbc
(3.2%)
Nutritional deficiencies 2 ##### Assay Of Vitamin D (18.0%) Assay Of Parathormone (5.4%) Assay Thyroid Stim Hormone (5.0%)Complete Cbc W/Auto Diff Wbc
(4.8%)Assay Of Ferritin (4.2%)
Cancer 2 ##### Pet Image W/Ct, Full Body (14.5%)Pet Image W/Ct, Skull-Thigh
(10.5%)Comprehen Metabolic Panel (3.5%) Tissue Exam By Pathologist (3.5%) Radiation Tx Delivery, Imrt (2.9%)
Congenital anomalies ##### Echo Transthoracic (26.6%) Suspension Of Testis (5.5%) Doppler Echo Exam, Heart (5.4%) Echo Exam Of Heart (3.1%)Us Exam Abdo Back Wall, Comp
(2.3%)
RTA ##### Ct Lower Extremity W/O Dye (19.6%)Active Wound Care/20 Cm Or < (12.8%)Ct Neck Spine W/O Dye (11.2%) Ct Head/Brain W/O Dye (8.5%) Assay Of Progesterone (7.4%)

Drugs by diagnosis group, % of value
* Dark area in pie charts represents share of top 5 drugs within total value of diagnosis group Note Data should be interpreted with caution, particularly for categories with low counts Source Cube 2012; Health Statistics analysis; diagnosis groups based on WHO classification of diagnoses ICD 9 29
Diagnosis group 100 Top 5* 1st 2nd 3rd 4th 5th
Diabetes mellitus 20 ##### Janumet 50Mg/1000Mg (7.5%)Lantus Solostar 100Iu/Ml (5.2%)Victoza 6Mg/Ml (5.1%) Januvia 100 (3.5%) Crestor 10Mg (2.8%)
Signs, symptoms and ill-defined 12 ##### Herceptin 440Mg (6.4%) Norditropin 10Mg/1.5Ml Nordilet (2.2%)Avastin 400Mg/16Ml (1.7%) Glivec 100Mg (1.5%) Nexium 40Mg (1.4%)
Respiratory infections 11 ##### Augmentin 1G (5.5%) Zinnat 500Mg (2.8%) Augmentin 457Mg/5Ml (2.3%) Rocephin 1G Im (2.2%) Avalox 400Mg (2.2%)
Cardiovascular diseases 9 ##### Plavix 75Mg (7.0%) Norvasc 5Mg (4.0%) Lipitor 40Mg (3.5%) Crestor 10Mg (3.3%) Lipitor 20Mg (3.0%)
Musculoskeletal diseases 8 ##### Humira 40 (10.3%) Celebrex 200Mg (9.3%) Arcoxia 90Mg (5.6%) Enbrel 50Mg (3.2%) Voltaren 1% (3.1%)
Endocrine disorders 6 ##### Kogenate Fs 1000 Iu (7.8%) Exjade 500Mg (5.2%) Crestor 10Mg (4.9%) Norditropin 10Mg/1.5Ml Nordilet (3.4%)Lipitor 20Mg (2.5%)
Respiratory diseases 6 ##### Singulair 10Mg (7.4%) Seretide Diskus 50/250Mcg (4.6%)Symbicort Turbuhler 160/4.5Mcg/Dose (4.6%) Singulair 5Mg (Paediatric) (2.8%) Pulmicort 0.5Mg/Ml (2.8%)
Digestive diseases 5 ##### Nexium 40Mg (9.1%) Humira 40 (6.3%) Pantozol 40Mg (6.0%) Pariet 20Mg (4.2%) Remicade 100Mg (3.6%)
Skin diseases 4 ##### Humira 40 (17.2%) Remicade 100Mg (7.4%) Enbrel 50Mg (4.9%) Roaccutane 20Mg (4.7%) Cetaphil Cream (2.9%)
Genitourinary diseases 4 ##### Gonal - F 900 Iu (6.6%) Ciprobay 500Mg (4.4%) Omnic Ocas 0.4Mg (3.9%) Xatral Xl 10Mg (3.4%) Gonal - F 450 Iu (3.2%)
Infectious and parasitic diseases 3 ##### Pegasys 180Mcg/0.5Ml (3.6%)Truvada (3.3%) Baraclude 1Mg (2.8%) Lamisil 250Mg (2.6%) Zovirax 800Mg (2.0%)
Neuropsychiatric conditions 3 ##### Gilenya 0.5Mg (8.2%) Rebif 44Mcg (4.0%) Avonex 30Mcg/0.5Ml (4.0%) Zyprexa Velotab 10Mg (3.6%) Keppra 500Mg (3.0%)
Sense organ diseases 2 ##### Lucentis 3Mg/0.3Ml (22.5%) Ceprotin 500 Iu (5.0%) Cosopt 2% / 0.5% (4.2%) Travatan 0.004% (2.4%) Emadine 0.05% (2.2%)
Cancer 2 ##### Glivec 100Mg (11.4%) Sprycel 50Mg (7.1%) Herceptin 440Mg (6.6%) Revlimid (5.5%) Fdg (5.0%)
Injuries 1 ##### Celebrex 200Mg (6.6%) Augmentin 1G (4.1%) Voltaren 1% (3.7%) Arcoxia 90Mg (3.6%) Fastum 2.5% (2.5%)
Nutritional deficiencies 1 ##### D-Forte (7.5%) Calciferol (3.4%) Humira 40 (2.5%) Crestor 10Mg (2.3%) Victoza 6Mg/Ml (1.9%)
Maternal and Perinatal conditions 1 ##### Promise Nunal Tablets (7.6%)Duphaston 10Mg (6.0%) Clexane 4000 Anti-Xa Iu/0.4Ml (5.5%) Synagis 100 (3.6%) Osteocare (2.7%)
Oral conditions ##### Augmentin 1G (23.4%) Augmentin 625Mg (8.2%) Augmentin 457Mg/5Ml (3.3%) Cataflam 50Mg (3.1%) Amoxil 500Mg (2.7%)
Congenital anomalies ##### Norditropin 10Mg/1.5Ml Nordilet (17.1%)Synagis 100 (6.7%) Tobi (4.6%) Viagra 50Mg (2.9%) Tracleer (2.7%)
RTA ##### Celebrex 200Mg (14.2%) Arcoxia 90Mg (8.8%) Suprax 400Mg (7.4%) Emilok 20Mg (6.2%) Arcoxia 60Mg (5.7%)

Population
Providers Payers Claims
Financing Episodes
30

Providers
Notes Definitions of categories as per Health Facilities Licensing criteria, see www.haad.ae Behavioral Science Pavilion is considered as part of SKMC as it is under SKMC management Liwa licensed as a hospital but doesn't have inpatients, therefore classified as a Center Al Ain Military Hospital added to the Eastern region Non-SEHA hospitals, not licensed by HAAD, but they do operate in Eastern region with about 130 bed capacity
Source Clinicians licensing database; facility licensing database
31
Facilities Clinicians
Total SEHA Abu Dhabi Eastern Western Total Physicians SEHA Dentists SEHANurses&
MidwifesSEHA AHP SEHA
Pharma-
cistsSEHA
Alternative
MedicineSEHA
Total 1'508 10% 1'035 398 75 25'219 5'528 45% 969 25% 12'375 55% 4'319 47% 1'993 35% 35 0%
Hospital 39 32% 22 11 6 14'540 3'627 57% 197 28% 8'390 67% 2'304 68% 17 29% 5 0%
Centers (various) 540 9% 385 129 26 5'289 1'433 26% 666 25% 1881 35% 1271 35% 9 0% 29 0%
Center 391 12% 279 95 17 4'673 1'365 26% 666 25% 1'716 31% 901 42% 8 0% 17 0%
Rehabilitation 109 1% 83 25 1 228 4 0% 16 0% 195 2% 1 0% 12 0%
Diagnostic 23 26% 14 6 3 198 45 36% 10 80% 143 36%
Dialysis 11 82% 4 2 5 107 102 100% 5 100%
Fertilization 6 17% 5 1 83 19 11% 37 16% 27 41%
Clinic 316 1% 201 100 15 506 129 5% 75 277 5% 25 0%
Pharmacy 454 15% 295 135 24 1'714 1714 39%
Store 69 4% 61 8 114 114 4%
Other 91 12% 71 16 4 339 14% 31 1827 27% 719 5% 139 14% 1 0%
National Male 294 38% 43 37% 27 4% 84 31% 3 0
Female 479 74% 86 53% 233 35% 323 60% 47 60% 0
Expatriate Male 3'305 42% 535 20% 2'673 41% 1'866 39% 1'040 32% 19 0%
Growth rate (CAGR 2007 - 12) Female 1'448 44% 305 24% 9'440 59% 2'044 53% 903 38% 16 0%
2011 2010 2009 2008 2007 CAGR NA Male 2 100% 0 1 100% 1 0% 0 0
Hospital 35 33 39 37 33 3.4 Female 0 0 1 0% 1 0% 0 0
Centers (various) 494 429 365 386 389 6.8 Breakdown by Region
Clinic 265 239 207 196 188 10.9 Abu Dhabi 3'742 36% 680 20% 8'395 48% 3'069 36% 1'344 27% 32 0%
Pharmacy 427 408 405 369 358 4.9 Al Ain 1'518 62% 258 31% 3'439 68% 1'066 72% 547 48% 3 0%
Store 67 60 61 62 63 1.8 Western 268 75% 31 71% 541 72% 184 85% 102 70% 0
Centers (various)
36%
Pharmacy30%
Clinic21%
Store4%
Other6%
Hospital3%
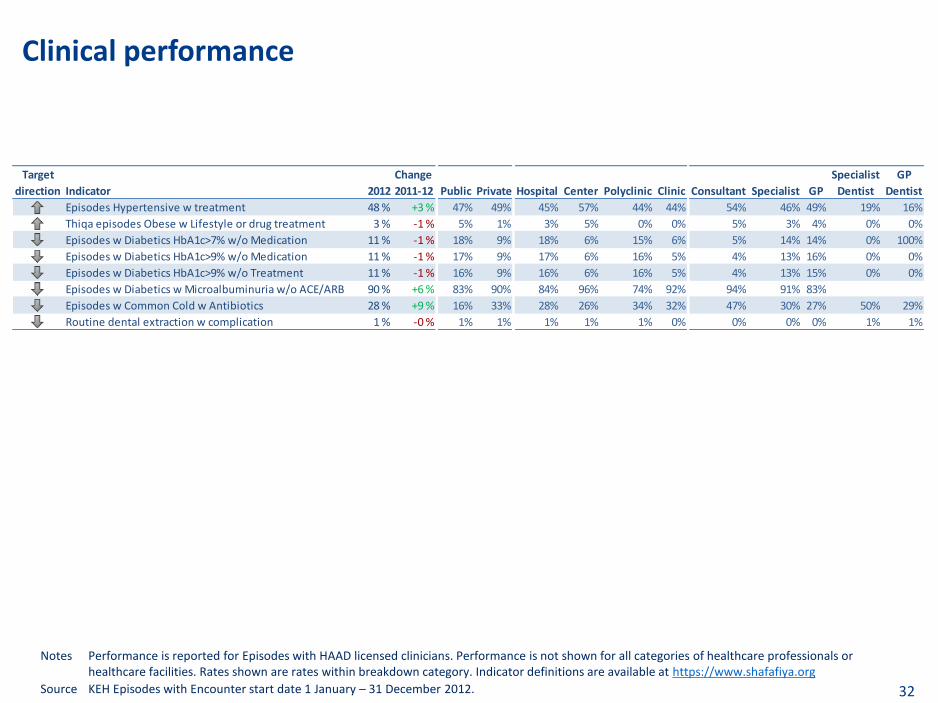
Notes Performance is reported for Episodes with HAAD licensed clinicians. Performance is not shown for all categories of healthcare professionals or healthcare facilities. Rates shown are rates within breakdown category. Indicator definitions are available at https://www.shafafiya.org
Source KEH Episodes with Encounter start date 1 January – 31 December 2012. 32
Clinical performance
Target
direction Indicator 2012
Change
2011-12 Public Private Hospital Center Polyclinic Clinic Consultant Specialist GP
Specialist
Dentist
GP
Dentist
Episodes Hypertensive w treatment 48 % +3 % 47% 49% 45% 57% 44% 44% 54% 46% 49% 19% 16%
Thiqa episodes Obese w Lifestyle or drug treatment 3 % -1 % 5% 1% 3% 5% 0% 0% 5% 3% 4% 0% 0%
Episodes w Diabetics HbA1c>7% w/o Medication 11 % -1 % 18% 9% 18% 6% 15% 6% 5% 14% 14% 0% 100%
Episodes w Diabetics HbA1c>9% w/o Medication 11 % -1 % 17% 9% 17% 6% 16% 5% 4% 13% 16% 0% 0%
Episodes w Diabetics HbA1c>9% w/o Treatment 11 % -1 % 16% 9% 16% 6% 16% 5% 4% 13% 15% 0% 0%
Episodes w Diabetics w Microalbuminuria w/o ACE/ARB 90 % +6 % 83% 90% 84% 96% 74% 92% 94% 91% 83%
Episodes w Common Cold w Antibiotics 28 % +9 % 16% 33% 28% 26% 34% 32% 47% 30% 27% 50% 29%
Routine dental extraction w complication 1 % -0 % 1% 1% 1% 1% 1% 0% 0% 0% 0% 1% 1%
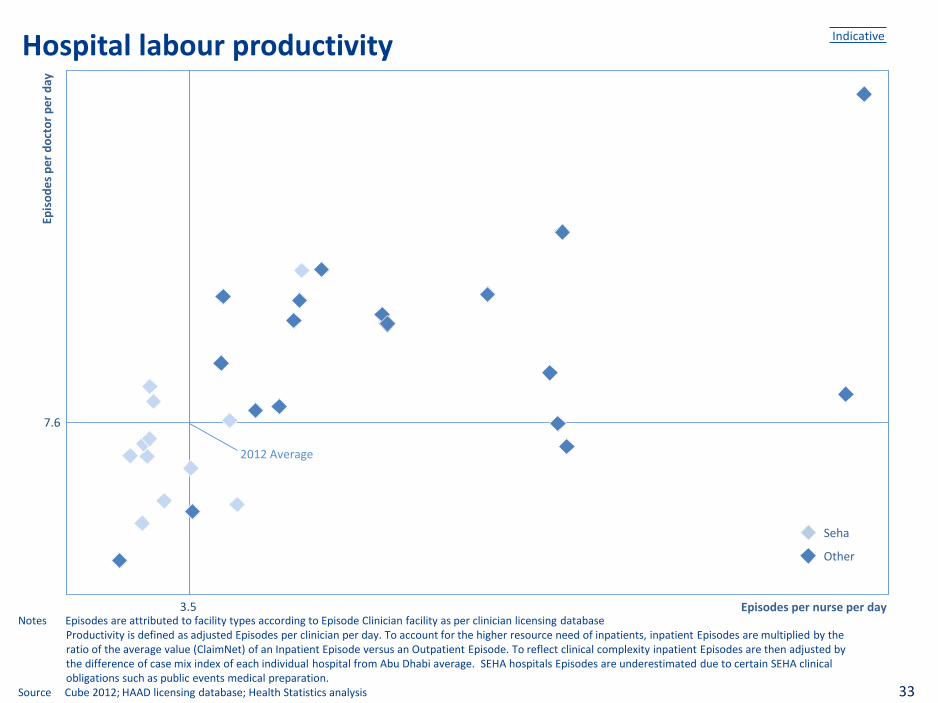
Hospital labour productivity
Notes Episodes are attributed to facility types according to Episode Clinician facility as per clinician licensing database Productivity is defined as adjusted Episodes per clinician per day. To account for the higher resource need of inpatients, inpatient Episodes are multiplied by the
ratio of the average value (ClaimNet) of an Inpatient Episode versus an Outpatient Episode. To reflect clinical complexity inpatient Episodes are then adjusted by the difference of case mix index of each individual hospital from Abu Dhabi average. SEHA hospitals Episodes are underestimated due to certain SEHA clinical obligations such as public events medical preparation.
Source Cube 2012; HAAD licensing database; Health Statistics analysis
Indicative
33
Seha
Other
Epis
od
es
pe
r d
oct
or
pe
r d
ay
Episodes per nurse per day
2012 Average
3.5
7.6
Hospitals
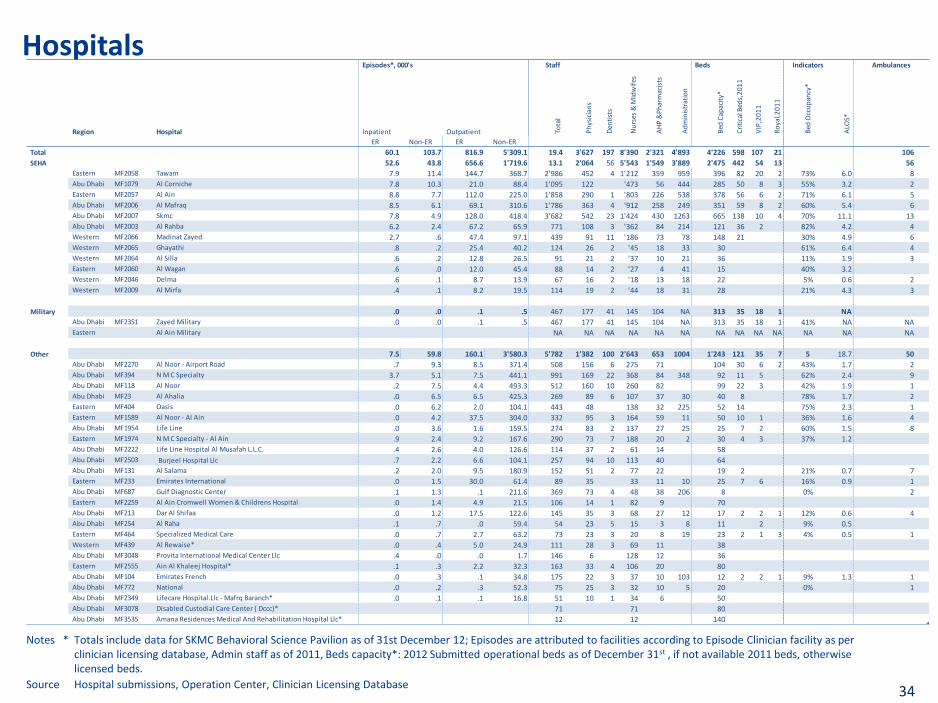
Notes * Totals include data for SKMC Behavioral Science Pavilion as of 31st December 12; Episodes are attributed to facilities according to Episode Clinician facility as per clinician licensing database, Admin staff as of 2011, Beds capacity*: 2012 Submitted operational beds as of December 31st , if not available 2011 beds, otherwise licensed beds.
Source Hospital submissions, Operation Center, Clinician Licensing Database 34
Episodes*, 000's Staff Beds Indicators Ambulances
Region Hospital Inpatient Outpatient To
tal
Ph
ysic
ian
s
Den
tist
s
Nu
rses
& M
idw
ifes
AH
P &
Ph
arm
acis
ts
Ad
min
istr
atio
n
Bed
Cap
acit
y*
Cri
tica
l Bed
s,2
01
1
VIP
,20
11
Ro
yal,2
01
1
Bed
Occ
up
ancy
*
ALO
S*
ER Non-ER ER Non-ER
Total 60.1 103.7 816.9 5'309.1 19.4 3'627 197 8'390 2'321 4'893 4'226 598 107 21 106
SEHA 52.6 43.8 656.6 1'719.6 13.1 2'064 56 5'543 1'549 3'889 2'475 442 54 13 56Eastern MF2058 Tawam 7.9 11.4 144.7 368.7 2'986 452 4 1'212 359 959 396 82 20 2 73% 6.0 8
Abu Dhabi MF1079 Al Corniche 7.8 10.3 21.0 88.4 1'095 122 '473 56 444 285 50 8 3 55% 3.2 2Eastern MF2057 Al Ain 8.8 7.7 112.0 225.0 1'858 290 1 '803 226 538 378 56 6 2 71% 6.1 5
Abu Dhabi MF2006 Al Mafraq 8.5 6.1 69.1 310.6 1'786 363 4 '912 258 249 351 59 8 2 60% 5.4 6Abu Dhabi MF2007 Skmc 7.8 4.9 128.0 418.4 3'682 542 23 1'424 430 1263 665 138 10 4 70% 11.1 13
Abu Dhabi MF2003 Al Rahba 6.2 2.4 67.2 65.9 771 108 3 '362 84 214 121 36 2 82% 4.2 4
Western MF2066 Madinat Zayed 2.7 .6 47.4 97.1 439 91 11 '186 73 78 148 21 30% 4.9 6Western MF2065 Ghayathi .8 .2 25.4 40.2 124 26 2 '45 18 33 30 61% 6.4 4
Western MF2064 Al Silla .6 .2 12.8 26.5 91 21 2 '37 10 21 36 11% 1.9 3Eastern MF2060 Al Wagan .6 .0 12.0 45.4 88 14 2 '27 4 41 15 40% 3.2
Western MF2046 Delma .6 .1 8.7 13.9 67 16 2 '18 13 18 22 5% 0.6 2Western MF2009 Al Mirfa .4 .1 8.2 19.5 114 19 2 '44 18 31 28 21% 4.3 3
Military .0 .0 .1 .5 467 177 41 145 104 NA 313 35 18 1 NA
Abu Dhabi MF2351 Zayed Military .0 .0 .1 .5 467 177 41 145 104 NA 313 35 18 1 41% NA NA
Eastern Al Ain Military NA NA NA NA NA NA NA NA NA NA NA NA NA
Other 7.5 59.8 160.1 3'580.3 5'782 1'382 100 2'643 653 1004 1'243 121 35 7 5 18.7 50Abu Dhabi MF2270 Al Noor - Airport Road .7 9.3 8.5 371.4 508 156 6 275 71 104 30 6 2 43% 1.7 2
Abu Dhabi MF394 N M C Specialty 3.7 5.1 7.5 441.1 991 169 22 368 84 348 92 11 5 62% 2.4 9Abu Dhabi MF118 Al Noor .2 7.5 4.4 493.3 512 160 10 260 82 99 22 3 42% 1.9 1
Abu Dhabi MF23 Al Ahalia .0 6.5 6.5 425.3 269 89 6 107 37 30 40 8 78% 1.7 2Eastern MF404 Oasis .0 6.2 2.0 104.1 443 48 138 32 225 52 14 75% 2.3 1Eastern MF1589 Al Noor - Al Ain .0 4.2 37.5 304.0 332 95 3 164 59 11 50 10 1 36% 1.6 4
Abu Dhabi MF1954 Life Line .0 3.6 1.6 159.5 274 83 2 137 27 25 25 7 2 60% 1.5 8Eastern MF1974 N M C Specialty - Al Ain .9 2.4 9.2 167.6 290 73 7 188 20 2 30 4 3 37% 1.2
Abu Dhabi MF2222 Life Line Hospital Al Musafah L.L.C. .4 2.6 4.0 126.6 114 37 2 61 14 58Abu Dhabi MF2503 Burjeel Hospital Llc .7 2.2 6.6 104.1 257 94 10 113 40 64
Abu Dhabi MF131 Al Salama .2 2.0 9.5 180.9 152 51 2 77 22 19 2 21% 0.7 7Eastern MF233 Emirates International .0 1.5 30.0 61.4 89 35 33 11 10 25 7 6 16% 0.9 1
Abu Dhabi MF687 Gulf Diagnostic Center .1 1.3 .1 211.6 369 73 4 48 38 206 8 0% 2
Eastern MF2259 Al Ain Cromwell Women & Childrens Hospital .0 1.4 4.9 21.5 106 14 1 82 9 70Abu Dhabi MF213 Dar Al Shifaa .0 1.2 17.5 122.6 145 35 3 68 27 12 17 2 2 1 12% 0.6 4
Abu Dhabi MF254 Al Raha .1 .7 .0 59.4 54 23 5 15 3 8 11 2 9% 0.5Eastern MF464 Specialized Medical Care .0 .7 2.7 63.2 73 23 3 20 8 19 23 2 1 3 4% 0.5 1
Western MF439 Al Rewaise* .0 .4 5.0 24.9 111 28 3 69 11 38Abu Dhabi MF3048 Provita International Medical Center Llc .4 .0 .0 1.7 146 6 128 12 36
Eastern MF2555 Ain Al Khaleej Hospital* .1 .3 2.2 32.3 163 33 4 106 20 80Abu Dhabi MF104 Emirates French .0 .3 .1 34.8 175 22 3 37 10 103 12 2 2 1 9% 1.3 1Abu Dhabi MF772 National .0 .2 .3 52.3 75 25 3 32 10 5 20 0% 1
Abu Dhabi MF2349 Lifecare Hospital.Llc - Mafrq Baranch* .0 .1 .1 16.8 51 10 1 34 6 50Abu Dhabi MF3078 Disabled Custodial Care Center ( Dccc)* 71 71 80
Abu Dhabi MF3535 Amana Residences Medical And Rehabilitation Hospital Llc* 12 12 140

Hospital inpatient profile by value
* Dark area in pie chart represents share of top 5 Diagnosis groups within the total value of provider’s services
Source Cube 2012; Health Statistics analysis; diagnosis groups based on WHO classification of diagnoses ICD 9. 35
Diagnosis group 100 Top 5* 1st 2nd 3rd 4th 5th
Tawam 17 Signs, Symptoms And Ill-Defined (22.6%) Maternal And Perinatal Conditions (13.2%) Cardiovascular Diseases (8.2%) Respiratory Diseases (7.5%) Neuropsychiatric Conditions (7.2%)
SKMC 15 Cardiovascular Diseases (18.9%) Infectious And Parasitic Diseases (9.9%) Signs, Symptoms And Ill-Defined (9.3%) Injuries (9.1%) Respiratory Diseases (8.4%)
Al Mafraq 9 Signs, Symptoms And Ill-Defined (18.2%) Injuries (16.4%) Cardiovascular Diseases (14.5%) Maternal And Perinatal Conditions (12.4%) Digestive Diseases (6.4%)
Al Ain 9 Maternal And Perinatal Conditions (19.0%) Signs, Symptoms And Ill-Defined (15.4%) Cardiovascular Diseases (10.7%) Digestive Diseases (9.5%) Injuries (9.1%)
Al Corniche 8 Signs, Symptoms And Ill-Defined (50.9%) Maternal And Perinatal Conditions (47.6%) Genitourinary Diseases (0.8%) Cancer (0.4%) Endocrine Disorders (0.1%)
Al Noor - Airport Road 5 Maternal And Perinatal Conditions (25.3%) Signs, Symptoms And Ill-Defined (24.3%) Cardiovascular Diseases (14.7%) Digestive Diseases (9.9%) Respiratory Diseases (4.1%)
Provita International Medical Center 5 Respiratory Diseases (44.6%) Neuropsychiatric Conditions (42.5%) Signs, Symptoms And Ill-Defined (6.4%) Endocrine Disorders (3.3%) Congenital Anomalies (1.9%)
Al Rahba 4 Signs, Symptoms And Ill-Defined (29.6%) Maternal And Perinatal Conditions (22.1%) Infectious And Parasitic Diseases (7.6%) Injuries (7.2%) Cardiovascular Diseases (6.9%)
Al Noor 4 Maternal And Perinatal Conditions (28.9%) Signs, Symptoms And Ill-Defined (25.3%) Cardiovascular Diseases (9.3%) Digestive Diseases (8.8%) Endocrine Disorders (7.8%)
N M C Specialty 4 Cardiovascular Diseases (30.5%) Maternal And Perinatal Conditions (12.7%) Digestive Diseases (11.3%) Respiratory Infections (8.8%) Signs, Symptoms And Ill-Defined (7.5%)
Abu Dhabi Rehabilitation Center 2 Neuropsychiatric Conditions (85.0%) Congenital Anomalies (8.9%) Injuries (1.9%) Genitourinary Diseases (1.5%) Cardiovascular Diseases (1.2%)
Al Ahalia 2 Digestive Diseases (21.2%) Cardiovascular Diseases (19.1%) Genitourinary Diseases (12.2%) Maternal And Perinatal Conditions (11.8%) Musculoskeletal Diseases (8.5%)
Oasis 2 Signs, Symptoms And Ill-Defined (47.1%) Maternal And Perinatal Conditions (36.3%) Respiratory Infections (5.1%) Digestive Diseases (3.3%) Respiratory Diseases (2.1%)
Al Noor - Al Ain 2 Maternal And Perinatal Conditions (18.1%) Digestive Diseases (14.4%) Signs, Symptoms And Ill-Defined (12.7%) Cardiovascular Diseases (11.0%) Musculoskeletal Diseases (9.5%)
Madinat Zayed 2 Maternal And Perinatal Conditions (17.1%) Digestive Diseases (12.8%) Injuries (11.4%) Respiratory Infections (11.4%) Cardiovascular Diseases (10.6%)
Life Line 1 Digestive Diseases (21.7%) Maternal And Perinatal Conditions (20.3%) Cardiovascular Diseases (18.4%) Signs, Symptoms And Ill-Defined (10.6%) Genitourinary Diseases (5.0%)
N M C Specialty - Al Ain 1 Cardiovascular Diseases (26.8%) Digestive Diseases (16.3%) Maternal And Perinatal Conditions (12.8%) Genitourinary Diseases (10.2%) Musculoskeletal Diseases (9.3%)
Behavioral Sciences Pavilion 1 Neuropsychiatric Conditions (99.2%) Signs, Symptoms And Ill-Defined (0.3%) Infectious And Parasitic Diseases (0.2%) Infectious And Parasitic Diseases (0.2%) Injuries (0.1%)
Al Salama 1 Digestive Diseases (13.5%) Musculoskeletal Diseases (13.0%) Maternal And Perinatal Conditions (12.4%) Cardiovascular Diseases (10.0%) Respiratory Diseases (9.9%)
Life Line Hospital Al Musafah 1 Respiratory Infections (16.8%) Digestive Diseases (15.4%) Cardiovascular Diseases (15.2%) Respiratory Diseases (12.9%) Infectious And Parasitic Diseases (6.7%)
Burjeel Hospital Llc 1 Maternal And Perinatal Conditions (20.1%) Digestive Diseases (17.6%) Signs, Symptoms And Ill-Defined (16.4%) Injuries (7.2%) Respiratory Infections (7.1%)
Al Ain Cromwell Women & Children Hospital 1 Maternal And Perinatal Conditions (52.0%) Signs, Symptoms And Ill-Defined (27.6%) Respiratory Diseases (5.7%) Digestive Diseases (5.3%) Respiratory Infections (4.5%)
Emirates International Hospital - (Llc) 1 Endocrine Disorders (35.2%) Digestive Diseases (15.6%) Maternal And Perinatal Conditions (10.5%) Signs, Symptoms And Ill-Defined (7.4%) Cardiovascular Diseases (5.5%)
Ghayathi 1 Respiratory Infections (18.8%) Digestive Diseases (17.5%) Cardiovascular Diseases (17.4%) Neuropsychiatric Conditions (11.9%) Maternal And Perinatal Conditions (9.0%)
Gulf Diagnostic Center Respiratory Diseases (21.2%) Genitourinary Diseases (15.4%) Digestive Diseases (13.0%) Cardiovascular Diseases (10.6%) Signs, Symptoms And Ill-Defined (6.9%)
Dar Al Shifa Hospital L.L.C Maternal And Perinatal Conditions (40.1%) Digestive Diseases (17.3%) Signs, Symptoms And Ill-Defined (10.7%) Respiratory Diseases (9.5%) Genitourinary Diseases (5.6%)
Al Raha Musculoskeletal Diseases (17.0%) Respiratory Infections (14.6%) Digestive Diseases (13.7%) Respiratory Diseases (12.8%) Maternal And Perinatal Conditions (12.8%)
Al Silla Cardiovascular Diseases (22.7%) Maternal And Perinatal Conditions (17.9%) Respiratory Infections (14.4%) Digestive Diseases (13.3%) Neuropsychiatric Conditions (10.7%)
Al Wagan Respiratory Infections (47.2%) Endocrine Disorders (15.3%) Respiratory Diseases (14.2%) Digestive Diseases (6.6%) Genitourinary Diseases (4.4%)
Al Mirfa Maternal And Perinatal Conditions (30.3%) Respiratory Infections (15.3%) Digestive Diseases (9.7%) Cardiovascular Diseases (9.6%) Infectious And Parasitic Diseases (5.3%)
Specialized Medical Care Respiratory Infections (27.1%) Respiratory Diseases (16.0%) Maternal And Perinatal Conditions (15.9%) Genitourinary Diseases (14.2%) Digestive Diseases (11.1%)
Al Rewaise Maternal And Perinatal Conditions (29.0%) Digestive Diseases (20.0%) Respiratory Infections (14.6%) Cardiovascular Diseases (11.1%) Signs, Symptoms And Ill-Defined (6.8%)
Emirates French Respiratory Diseases (77.0%) Maternal And Perinatal Conditions (12.1%) Signs, Symptoms And Ill-Defined (2.7%) Respiratory Infections (2.6%) Musculoskeletal Diseases (1.6%)
Delma Maternal And Perinatal Conditions (18.5%) Injuries (14.0%) Cardiovascular Diseases (13.8%) Digestive Diseases (13.1%) Infectious And Parasitic Diseases (12.3%)
National Digestive Diseases (28.0%) Cardiovascular Diseases (13.2%) Musculoskeletal Diseases (12.5%) Injuries (10.7%) Genitourinary Diseases (10.5%)
Lifecare Hospital.Llc - Mafrq Baranch Infectious And Parasitic Diseases (73.0%) Respiratory Infections (18.6%) Respiratory Diseases (8.0%) Musculoskeletal Diseases (0.5%) 0 (0.0%)

Region Facility
Episodes
(best
estimate) Ph
ysi
cia
ns
De
nti
sts
Nu
rse
s
AH
P
Total 2'218'539 377 169 659 447
Abu Dhabi Baniyas 168'204 13 2 3 8
Khalifa A 130'034 25 6 37 28
Bain Al Gesreen 105'526 26 6 40 22
Shahama 97'308 18 5 27 20
Al Bateen 70'519 7 0 9 1
Samha 45'369 9 4 18 8
Disease Prevention And Screening Center 42'064 * 17 0 15 50
Al Ettihad Urgent Care 39'056 7 0 6 1
Al Khalidiya Urgent Care 35'091 6 0 19 0
Al Mafraq Dental Center 29'770 0 29 0 33
Abu Dhabi City Dental Center 28'696 0 27 8 10
Disease Prevention And Screening Center - Mussafah 24'743 * 10 0 7 25
Al Zafra Dental Center 23'023 0 7 5 9
Al Khatim 17'129 6 2 10 4
Airport 14'846 * 6 0 13 0
Seha Dialysis Services – Sheikh Khalifa Medical City 11'523 0 0 46 1
Abu Dhabi Blood Bank 7'423 * 3 0 1 8
Mafraq Dialysis Centre 5'420 0 0 23 4
Seha Dialysis Services – Al Rahba Hospital 3'467 0 0 22 0
Other 200'100 * 18 2 24 5
Al Ain Neima 122'456 17 4 21 7
Al Jahili 116'069 20 0 27 6
Al Yahar 89'877 11 5 22 3
Mezyed 77'013 15 4 18 6
Al Maqam 70'062 12 4 18 7
Al Masoudi Primary Health Care Center 69'809 10 2 14 1
Muweiji 68'559 14 8 21 21
Al Khabisi Clinic 59'852 11 2 16 2
Hili 47'625 6 1 10 2
Tawam Dental Center 44'957 0 41 0 62
Niyadat 38'541 7 1 13 5
Al Qua'A 38'354 7 2 12 3
Zakher 37'659 7 0 11 0
Oud Al Toba Primary Health Care Center 35'815 7 0 13 4
Blood Bank Center 27'094 * 1 0 0 15
Al Hayer 22'807 5 1 11 0
Swaihan 20'098 6 1 11 1
Remah 17'356 5 0 8 2
Al Khazna 8'208 3 1 9 0
Disease Prevention And Screening Center-Alain 5'833 10 0 13 26
Tawam Ivf Center 4'949 * 2 0 6 11
Other 26'537 * 6 0 13 4
Western Al Dhafra Family Medicine Center 33'544 9 0 18 5
Liwa Hospital 22'877 9 2 17 4
Other 13'277 * 6 0 4 13
Centres & clinics
Notes List of Non-SEHA facilities with more than 10 clinicians, some centers’ Episodes were reported under the managing hospital.
* Includes estimates based on the number of clinicians and average productivity
Source Cube 2012; Professionals licensing database; Extrapolation and Facility submissions
SEHA
36
Other
Region Facility
Episodes
(best
estimate) Physi
cians
Denti
sts
Nurse
s
AHP
Total 4'228'173 1'188 576 1'506 854
Abu Dhabi Medical Services Administration Of Abu Dhabi Police Ghq 138'833 103 22 169 90
Imperial College London Diabetes Centre 105'133 46 0 38 31
Al Noor Hospital Clinics - Al Mussaffah 83'367 9 0 8 1
Adnoc Medical Center* 72'378 19 10 28 32
Al Musaffah Al Alhli Medical Centre 69'739 10 1 12 3
Dr. Ahmed Hassan Fikri Medical Centre 60'533 8 2 7 2
Prince Specialized Medical Centre 57'599 25 2 55 14
Al Musaffah Al Alhli Medical Centre - Branch 57'042 10 1 6 4
New National Medical Centre 54'589 17 4 24 7
Al Amal Medical Centre 53'627 4 1 5 4
Ibn Al Nafis Medical Centre 42'384 16 2 3 10
Home Health Medical Centre L.L.C 41'674 7 1 5 0
Amrita Midical Centre 41'596 23 5 12 3
Al Mafraq Medical Centre 37'601 4 2 9 3
Advance Cure Diagnostic Centre L.L.C 36'649 23 1 8 9
Taha Medical Centre 35'974 10 6 6 4
Al Wahda Medical Centre 35'629 6 0 5 0
Al Kamal Medicdal Poly Clinics- L L C 35'295 7 3 3 0
Cosmesurge Emarites Hospital For One Day Surgery 34'026 26 3 31 10
Top Care Medical Centre 31'548 6 0 8 2
Nadia Medical Center L.L.C 31'071 7 1 4 0
Adco Medical Centre* 29'949 12 0 13 3
Al Noor Hospital Speciality Clinics- Al Musafah 29'280 22 2 10 14
Gulf Radiology &Laboratory 26'308 3 0 0 11
Proficiency Central Laboratories 25'259 3 0 0 12
Harley Street Medical Centre* 24'958 10 0 16 5
Abu Dhabi Marine Operating Company Clinic (Adma Opco)* 24'958 10 0 9 4
Well Health Medical Center L.L.C. 24'452 6 2 3 4
Al Hendawy Medical Centre 24'201 10 0 3 4
Dr.Munir Silwadi Dental Centre* 22'462 0 9 0 4
American European Medical Center 22'375 9 1 13 3
Zakum Development Zadco Medical Center* 19'966 7 1 4 0
Capital Medical Centre For Health Screening - L.L.C* 19'966 8 0 11 6
Al Rafa Medical Center L.L.C 19'944 8 1 8 5
Golden Sand Medical Centre 19'558 5 1 5 1
Almazroui Hospital One Day Surgery 18'914 17 3 9 5
Dar Al Mouasah Diagnostic Centre 17'620 4 0 0 10
Advanced American Dental Centre* 17'471 0 7 0 5
Etihad Airways Polyclinic* 17'471 7 0 11 0
Magrabi Specialized Hospital 17'306 8 0 7 1
Prime Medical Center 17'204 10 1 12 6
Oxford Medical Center 16'221 6 3 4 0
Al Rayyan Medical Clinic 15'168 6 1 3 2
Consultant Medical Centre 15'036 7 0 5 1
American Fertility Center* 14'975 6 0 10 5
Open Mri For Spine Surgery-Abu Dhabi Branch* 14'975 6 0 1 4
Healthplus Womens Health Center L Lc 13'704 5 0 11 0
Samaya Specialized Hospital 12'614 8 1 3 2
Gulf International Cancer Center* 12'479 5 0 5 6
Al Rawdah German Medical Center - L L C 10'977 6 0 9 3
Sadd Maareb Medical Centre 10'279 5 3 5 0
Life Medical Centre 10'189 4 0 0 7
American Center For Psychiatry & Neurology 8'769 6 0 2 10
Health Plus Fertility Center 7'903 4 0 9 5
Ruwais Housing Medical Center 7'807 4 2 18 8
Al Borg Diagnostic Centre For Laboratories & X Ray 7'704 2 0 0 11
Exeter Medical Center 7'517 12 0 3 2
Grace Medical Center* 7'487 2 1 13 1
National Petroleum Construction Company Medical Center 7'408 2 0 14 2
Seha Emirates One Day Surgery Centerllc 7'368 12 1 11 3
Al Bustan Medical Center 6'719 5 3 4 0
Magrabi Specialized Hospital 6'110 7 0 15 2
Alriyadh Medical Centre L.L.C 5'824 6 1 5 0
Cosmesurge & Emarites Hospital For One Day Surgery Llc - Branch 25'772 4 1 7 0
Merhi Dental & Orthodontic Center 5'168 0 7 0 6
National Rehabilitation Centre* 4'992 2 0 8 15
National Reference Laboratory Llc* 4'992 2 0 0 16
Al Salama One Day Surgery Center 4'944 10 0 17 3
Miami Emirates Medical Complex.Llc 4'707 6 1 2 2
Abu Dhabi Knee And Sports Medicine Center 4'301 5 0 16 7
American Crescent Health Care Centre 3'751 5 1 8 4
Al Hikma Medical Centre 3'013 0 7 4 0
Shadi International Dental & Orthodontic Center 2'990 0 7 1 3
Mekkah Specialized Polyclinic 2'328 5 1 1 4
Canadian Medical Center Llc 1'892 1 2 25 7
Abu Dhabi Rehabilitation And Care Center For People With Special Needs0 0 0 1 43
Other* 1'306'394 267 271 370 202
Al Ain Al Sultan Advanced Medical Clinics 59'348 10 2 1 4
Imperial College London Diabetes Centre - Al Ain 37'384 11 0 21 13
Al Madar Medical Center - Branch 35'595 12 7 18 3
Al Noor Hospital Clinics - Alain - Al-Yahar Brach 34'925 11 1 5 3
Mubarak Medical Center 26'856 5 1 5 1
Dr. Khalid Aljamal Medical Center 13'579 5 3 7 0
Cosmo Health Medical Polyclinics L.L.C.* 9'983 1 3 11 0
Morani Orthodontic Center & General Medical - L.L.C 5'272 0 6 0 5
Emirates International Poly Clinic 4'734 4 2 4 2
Cosmesurge & Emirates Hospital For One Day Surgery Polyclinic L L C. Al Ain Branch3'210 4 1 8 0
Uae University Clinics - Tawam Clinic 2'413 1 0 21 0
Arabic Canadian Medical Center 185 0 0 4 9
Other* 605'547 107 134 128 79
Western Al- Noor Hospital Clinics - Madinat Zayed 61'437 12 0 8 9
Alnoor Hospital Speciality Clinics Llc Madinet Zayed Branch 18'204 9 1 8 1
Al Noor Hospital Speciality Clinics - Almirfa -Branch 8'189 4 1 4 5
Saipem Abu Dhabi Clinic* 2'496 1 0 10 0
Habshan Clinic 525 0 0 21 0
Other* 119'907 13 5 32 2

Bed capacity
Note The information above is missing some facilities, due to the incomplete submissions.
Source Operation Center as of 31st December 2012 37
Total CC
U
CIC
U
ICU
NIC
U
No
rmal
Ward
VIP
Ward
Ro
yal
Su
ite
S.
Ste
p D
ow
n
Ob
s &
Gyn
Paed
iatr
ic B
ed
s
Med
ical
Bed
s
Su
rgic
al
Bed
s
Iso
lati
on
Tele
metr
y B
ed
s
CC
U S
tep
Do
wn
Psych
iatr
y
Su
rgic
al
HD
U
Total 1'760 10 13 94 29 1'209 25 5 12 44 76 14 24 38 23 10 123 11
SEHA 1'055 10 10 29 11 680 18 3 0 44 45 0 0 38 23 10 123 11
SKMC 601 10 10 29 375 10 23 10 123 11
Corniche Hospital 227 224 3
Mafraq Hospital 134 11 8 44 45 26
Al Rahba 93 81 12
Military 282 0 3 8 0 259 0 0 12 0 0 0 0 0 0 0 0 0
Zayed Military Hospital 282 3 8 259 12
Other 423 0 0 57 18 270 7 2 0 0 31 14 24 0 0 0 0 0
Al Noor 84 15 66 3
New Medical Center 76 76
Al Noor (Airport Road) 70 9 2 21 14 24
Burjeel 59 6 3 40 10
Ahalia 38 6 32
Provita 36 36
National 20 20
Al Salama 17 17
Dar Al Shifaa 14 12 2
Franco Emirates 7 7
Al Raha 2 2

Bed occupancy
Notes Incomplete submissions from some facilities * All Burns beds are shown in green and are provided by SEHA Optimal occupancy is 85% for normal beds and 75% for critical care beds Source HAAD Operation Center 38
CICU
Jan Apr Jul Oct
SCBU
0%
25%
50%
75%
100%
Jan Apr Jul Oct
Isolation & Burns*0%
25%
50%
75%
100%ICU PICU
NICU
Jan Apr Jul Oct
CCU/Medical Stepdown
0%
25%
50%
75%
100%Normal Ward
CCU
Occupancy above optimal level
Seha 2012 Private 2012
Average 2012 Average 2011

Blood bank donors
Source Abu Dhabi Blood Bank, Health Statistics Analysis 39
Year 2012 2011 2010 2009 2008 2007 2006
Donors 26'819 27'094 25'850 24'758 21'834 19'461 16'737
National 5'077 3'794 4'240 4'116 3'832 3'311 2'664
Expatriate 21'742 23'300 21'610 20'642 18'002 16'150 14'073
Units donated 26'819 27'094 25'850 24'758 22'379 19'849 17'129
O + 10'279 10'141 9'441 8'960 8'314 7'242 6'396
A + 6'705 6'704 6'620 1'430 5'840 5'263 4'548
B + 5'364 5'740 5'423 6'421 4'294 4'040 3'396
AB + 1'555 1'767 1'727 705 1'302 1'074 857
O - 1'501 1'310 1'274 5'130 1'346 1'101 953
A - 705 706 711 483 667 587 501
B - 576 575 521 1'493 501 426 381
AB - 134 151 133 136 115 116 97
2'664 3'311 3'832 4'116 4'240 3'794 5'077
14'07316'150
18'00220'642 21'610 23'300 21'742
2006 2007 2008 2009 2010 2011 2012
National Expatriate

Inpatient market by value
* Dark area in pie chart represents share of top 5 providers within the total value of diagnosis group.
Source Cube 2012; Health Statistics analysis; diagnosis groups based on WHO classification of diagnoses ICD 9. 40
Diagnosis group 100 Top 5* 1st 2nd 3rd 4th 5th
Signs, symptoms and ill-defined 18 ##### Al Corniche (21.8%) Tawam (19.9%) Al Mafraq (9.0%) SKMC (7.3%) Al Ain (7.2%)
Maternal and Perinatal conditions 16 ##### Al Corniche (23.7%) Tawam (13.5%) Al Ain (10.3%) Al Noor - Airport Road (8.3%) Al Noor (7.3%)
Cardiovascular diseases 11 ##### SKMC (25.2%) Tawam (12.3%) Al Mafraq (12.2%) N M C Specialty (10.1%) Al Ain (8.5%)
Neuropsychiatric conditions 8 #####Abu Dhabi Rehabilitation
Center (25.1%)
Provita International Medical
Center (23.3%)Tawam (14.2%)
Behavioral Sciences Pavilion
(11.9%)SKMC (10.9%)
Respiratory diseases 7 #####Provita International Medical
Center (28.9%)Tawam (17.7%) SKMC (17.5%) Al Ain (7.3%) Al Mafraq (4.4%)
Digestive diseases 7 ##### SKMC (13.5%) Al Ain (11.8%) Tawam (9.1%) Al Mafraq (8.6%) Al Noor - Airport Road (7.5%)
Injuries 7 ##### Al Mafraq (22.9%) SKMC (20.1%) Tawam (16.2%) Al Ain (11.9%) Al Rahba (4.7%)
Infectious and parasitic diseases 5 ##### SKMC (31.5%) Tawam (21.3%) Al Mafraq (11.4%) Al Ain (8.1%) Al Rahba (7.2%)
Musculoskeletal diseases 5 #####Abu Dhabi Knee And Sports
Medicine Center (40.4%)SKMC (12.9%) Tawam (7.9%) Al Ain (5.9%) N M C Specialty (4.7%)
Respiratory infections 4 ##### SKMC (16.7%) Tawam (14.6%) Al Ain (11.7%) Al Mafraq (8.1%) N M C Specialty (7.1%)
Endocrine disorders 3 ##### Tawam (26.0%) SKMC (24.2%) Al Noor (9.3%) Al Mafraq (9.1%)Emirates International Hospital -
(Llc) (5.3%)
Genitourinary diseases 3 ##### Tawam (19.5%) SKMC (14.1%) Al Ahalia (8.9%) Al Mafraq (8.3%) Al Ain (7.7%)
Cancer 3 ##### Tawam (36.9%) SKMC (31.4%) Al Mafraq (9.8%) Al Ain (5.2%) Al Noor (2.4%)
Congenital anomalies 2 ##### SKMC (56.4%) Tawam (12.6%)Abu Dhabi Rehabilitation
Center (11.8%)
Provita International Medical
Center (4.8%)Al Ain (3.7%)
Diabetes mellitus 1 ##### SKMC (23.9%) Tawam (16.4%) Al Mafraq (14.8%) Al Ain (13.8%) Al Rahba (7.5%)
Skin diseases 1 ##### SKMC (20.3%) Al Ain (12.8%) Tawam (12.6%) Al Mafraq (11.9%) Al Noor - Airport Road (4.3%)
Sense organ diseases 1 ##### Al Mafraq (38.2%) SKMC (15.3%) Al Ain (13.2%) N M C Specialty (6.2%) Tawam (5.8%)
Oral conditions ##### SKMC (56.9%) Tawam (14.9%) Al Mafraq (9.4%) Al Rahba (3.0%) Gulf Diagnostic Center (3.0%)
Nutritional deficiencies ##### Tawam (20.0%) SKMC (16.4%) Al Rahba (14.5%) Al Mafraq (9.2%) Al Ain (7.3%)
RTA #####

Outpatient market by value
* Dark area in pie chart represents share of top 5 providers within the total value of diagnosis group.
Source Cube 2012; Health Statistics analysis; diagnosis groups based on WHO classification of diagnoses ICD 9. 41
Diagnosis group 100 Top 5* 1st 2nd 3rd 4th 5th
Signs, symptoms and ill-defined 18 Tawam (13.7%) SKMC (6.9%) Al Noor (4.5%) Al Noor - Airport Road (4.1%) Al Mafraq (4.1%)
Diabetes mellitus 12Imperial College London Diabetes
Centre (39.3%)
Imperial College London Diabetes
Centre - Al Ain (17.5%)SKMC (4.5%) Tawam (3.6%) N M C Pharmacy (1.8%)
Respiratory infections 9 Al Noor (5.7%) Al Noor - Airport Road (4.0%) N M C Specialty (2.6%) Tawam (2.4%) Baniyas (2.3%)
Musculoskeletal diseases 7 SKMC (7.3%) Al Noor (6.3%) Tawam (5.7%) N M C Specialty (4.5%) Al Mafraq (4.1%)
Oral conditions 7 Tawam Dental Center (13.0%) Al Mafraq Dental Center (7.9%) Abu Dhabi Dental Clinic (4.4%) Bain Al Gesreen (3.8%) Khalifa A (3.0%)
Cardiovascular diseases 6 SKMC (11.4%) Al Noor (5.7%) Tawam (5.5%) Al Noor - Airport Road (3.7%) N M C Specialty (3.7%)
Genitourinary diseases 6 SKMC (9.1%) Tawam (8.7%) Al Noor (5.7%) Al Noor - Airport Road (4.1%)Cosmesurge Emarites Hospital For
One Day Surgery (3.9%)
Endocrine disorders 5 SKMC (15.2%)Imperial College London Diabetes
Centre (15.2%)Tawam (9.5%)
Imperial College London Diabetes
Centre - Al Ain (5.3%)Al Noor (3.8%)
Digestive diseases 5 SKMC (7.4%) Tawam (7.2%) Al Noor (5.4%) Gulf Diagnostic Center (4.9%) Al Noor - Airport Road (4.3%)
Respiratory diseases 4 SKMC (7.2%) Al Noor (6.3%) Tawam (5.0%) Al Noor - Airport Road (4.6%)Dr. Ahmed Hassan Fikri Medical
Centre (3.5%)
Sense organ diseases 4 Samaya Specialized Hospital (9.0%) Al Noor (9.0%) SKMC (6.7%) Al Mafraq (6.1%) N M C Specialty (5.5%)
Maternal and Perinatal conditions 3 Al Noor (10.0%) Al Corniche (9.2%) Al Noor - Airport Road (9.1%) Tawam (8.0%) Al Ain (3.8%)
Skin diseases 3 SKMC (8.8%) Al Noor (6.6%) Tawam (5.1%) Al Mafraq (4.8%) Al Ain (4.4%)
Injuries 3 SKMC (7.6%) Tawam (6.2%) Al Noor - Airport Road (6.2%) Al Mafraq (5.6%) Al Ain (5.5%)
Neuropsychiatric conditions 3 SKMC (15.4%) Behavioral Sciences Pavilion (12.5%) Tawam (12.4%) Al Ain (7.0%) Gulf Diagnostic Center (5.4%)
Infectious and parasitic diseases 3 Al Noor (7.9%) Tawam (7.8%) SKMC (5.4%) Gulf Diagnostic Center (4.3%) Al Noor - Airport Road (3.7%)
Nutritional deficiencies 2Imperial College London Diabetes
Centre (15.1%)
Imperial College London Diabetes
Centre - Al Ain (8.5%)SKMC (8.5%) Life Line (4.5%) Gulf Diagnostic Center (4.2%)
Cancer 1 SKMC (24.3%) Tawam (17.5%) Al Mafraq (15.6%)Gulf International Cancer Center
(13.7%)
Tawam Molecular Imaging Centre
(7.0%)
Congenital anomalies SKMC (35.3%) Tawam (19.4%) Al Mafraq (7.4%) Al Noor - Airport Road (6.6%)Venecia Management Services Llc
(4.3%)
RTA Emirates International Hospital - (Llc) (18.4%)Al Rahba (15.3%) N M C Specialty - Al Ain (10.6%) Al Noor - Airport Road (10.2%) Tawam (9.4%)

Population
Providers Payers Claims
Financing Episodes
42

Claims
Notes (1) Average for population is set to 100% to allow comparison across inpatient and outpatient utilisation.
(2) Average Claim Net per Claim, represents claimed amount.
(3) Numbers of claims with Encounter start date in respective years. These include electronic claims of Abu Dhabi providers for members with insurance provided by payers from outside of Abu Dhabi.
(4) 2011 data differs from previously published which was attributed to years based on Episode start date.
Source Cube 2012; Health Statistics analysis. 43
■ Outpatient
Claims per member per year, standardised (1) ■ Inpatient
Average
ClaimNet
(AED)(2) Claims (000)(3) Claims per member(4)
2012 2012 2011 2010 2009 2012 2011 2010 2009
Inpatient 11'884 166 145 166 146 0.05 0.05 0.06 0.06
InpatientBasic 8'868 42 39 35 25 0.03 0.03 0.03 0.03
InpatientEnhanced 10'185 52 46 55 50 0.04 0.04 0.05 0.05
InpatientThiqa 14'874 72 60 76 71 0.16 0.14 0.18 0.18
Outpatient 314 19'684 17'186 12'918 10'443 6.22 6.10 4.84 4.52
OutpatientBasic 147 4'964 4'029 2'928 2'107 3.7 3.0 2.4 2.3
OutpatientEnhanced 321 7'620 6'963 4'146 3'932 5.6 6.6 4.0 4.0
OutpatientThiqa 423 7'100 6'193 5'844 4'404 15.5 14.0 13.8 11.2
Total 410 19'850 17'331 13'084 10'589 6.3 6.1 4.9 4.660%
72%
300%
59%
90%
249%
Basic
Enhanced
Thiqa
Utilisation for Population (100%)

Population
Providers Payers Claims
Financing Episodes
44
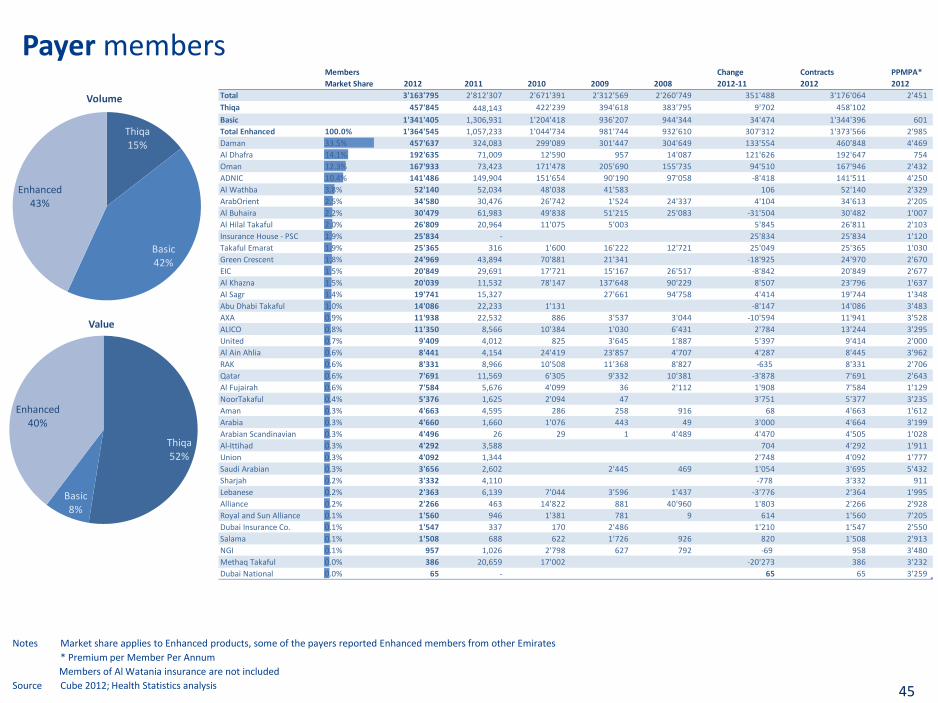
Payer members
Notes Market share applies to Enhanced products, some of the payers reported Enhanced members from other Emirates
* Premium per Member Per Annum
Members of Al Watania insurance are not included
Source Cube 2012; Health Statistics analysis 45
Members
Market Share 2012 2011 2010 2009 2008
Change
2012-11
Contracts
2012
PPMPA*
2012
Total 3'163'795 2'812'307 2'671'391 2'312'569 2'260'749 351'488 3'176'064 2'451
Thiqa 457'845 448,143 422'239 394'618 383'795 9'702 458'102
Basic 1'341'405 1,306,931 1'204'418 936'207 944'344 34'474 1'344'396 601
Total Enhanced 100.0% 1'364'545 1,057,233 1'044'734 981'744 932'610 307'312 1'373'566 2'985
Daman 33.5% 457'637 324,083 299'089 301'447 304'649 133'554 460'848 4'469
Al Dhafra 14.1% 192'635 71,009 12'590 957 14'087 121'626 192'647 754
Oman 12.3% 167'933 73,423 171'478 205'690 155'735 94'510 167'946 2'432
ADNIC 10.4% 141'486 149,904 151'654 90'190 97'058 -8'418 141'511 4'250
Al Wathba 3.8% 52'140 52,034 48'038 41'583 106 52'140 2'329
ArabOrient 2.5% 34'580 30,476 26'742 1'524 24'337 4'104 34'613 2'205
Al Buhaira 2.2% 30'479 61,983 49'838 51'215 25'083 -31'504 30'482 1'007
Al Hilal Takaful 2.0% 26'809 20,964 11'075 5'003 5'845 26'811 2'103
Insurance House - PSC 1.9% 25'834 - 25'834 25'834 1'120
Takaful Emarat 1.9% 25'365 316 1'600 16'222 12'721 25'049 25'365 1'030
Green Crescent 1.8% 24'969 43,894 70'881 21'341 -18'925 24'970 2'670
EIC 1.5% 20'849 29,691 17'721 15'167 26'517 -8'842 20'849 2'677
Al Khazna 1.5% 20'039 11,532 78'147 137'648 90'229 8'507 23'796 1'637
Al Sagr 1.4% 19'741 15,327 27'661 94'758 4'414 19'744 1'348
Abu Dhabi Takaful 1.0% 14'086 22,233 1'131 -8'147 14'086 3'483
AXA 0.9% 11'938 22,532 886 3'537 3'044 -10'594 11'941 3'528
ALICO 0.8% 11'350 8,566 10'384 1'030 6'431 2'784 13'244 3'295
United 0.7% 9'409 4,012 825 3'645 1'887 5'397 9'414 2'000
Al Ain Ahlia 0.6% 8'441 4,154 24'419 23'857 4'707 4'287 8'445 3'962
RAK 0.6% 8'331 8,966 10'508 11'368 8'827 -635 8'331 2'706
Qatar 0.6% 7'691 11,569 6'305 9'332 10'381 -3'878 7'691 2'643
Al Fujairah 0.6% 7'584 5,676 4'099 36 2'112 1'908 7'584 1'129
NoorTakaful 0.4% 5'376 1,625 2'094 47 3'751 5'377 3'235
Aman 0.3% 4'663 4,595 286 258 916 68 4'663 1'612
Arabia 0.3% 4'660 1,660 1'076 443 49 3'000 4'664 3'199
Arabian Scandinavian 0.3% 4'496 26 29 1 4'489 4'470 4'505 1'028
Al-Ittihad 0.3% 4'292 3,588 704 4'292 1'911
Union 0.3% 4'092 1,344 2'748 4'092 1'777
Saudi Arabian 0.3% 3'656 2,602 2'445 469 1'054 3'695 5'432
Sharjah 0.2% 3'332 4,110 -778 3'332 911
Lebanese 0.2% 2'363 6,139 7'044 3'596 1'437 -3'776 2'364 1'995
Alliance 0.2% 2'266 463 14'822 881 40'960 1'803 2'266 2'928
Royal and Sun Alliance 0.1% 1'560 946 1'381 781 9 614 1'560 7'205
Dubai Insurance Co. 0.1% 1'547 337 170 2'486 1'210 1'547 2'550
Salama 0.1% 1'508 688 622 1'726 926 820 1'508 2'913
NGI 0.1% 957 1,026 2'798 627 792 -69 958 3'480
Methaq Takaful 0.0% 386 20,659 17'002 -20'273 386 3'232
Dubai National 0.0% 65 - 65 65 3'259
Thiqa15%
Basic42%
Enhanced43%
Volume
Thiqa52%
Basic8%
Enhanced40%
Value
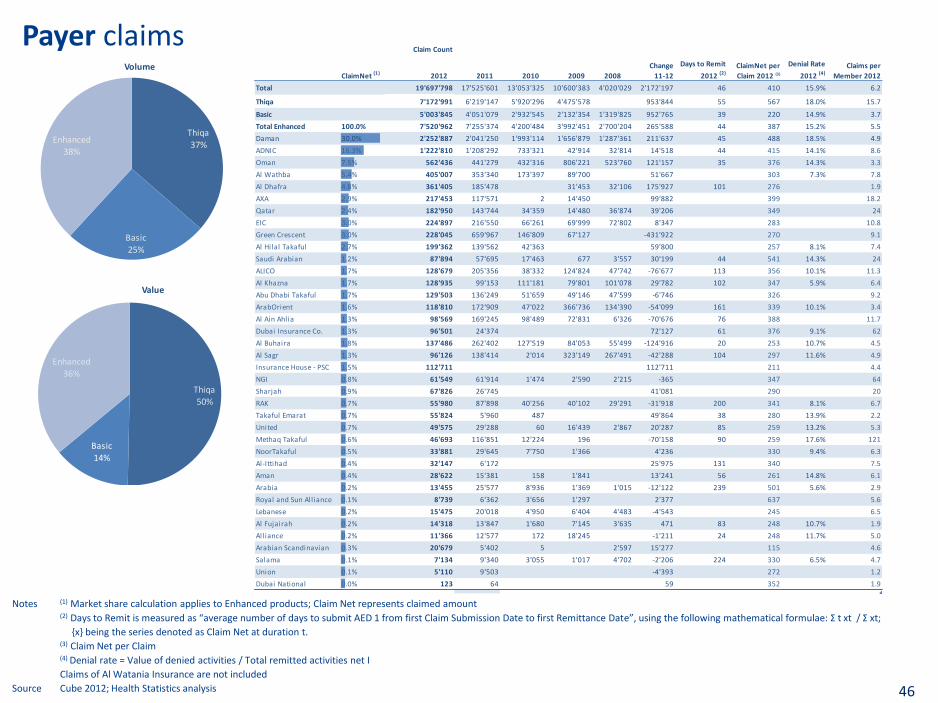
Payer claims
Notes (1) Market share calculation applies to Enhanced products; Claim Net represents claimed amount
(2) Days to Remit is measured as “average number of days to submit AED 1 from first Claim Submission Date to first Remittance Date”, using the following mathematical formulae: Σ t xt / Σ xt;
{x} being the series denoted as Claim Net at duration t. (3) Claim Net per Claim (4) Denial rate = Value of denied activities / Total remitted activities net I
Claims of Al Watania Insurance are not included
Source Cube 2012; Health Statistics analysis 46
Claim Count
ClaimNet (1) 2012 2011 2010 2009 2008
Change
11-12
Days to Remit
2012 (2)ClaimNet per
Claim 2012 (3)
Denial Rate
2012 (4)Claims per
Member 2012
Total 19'697'798 17'525'601 13'053'325 10'600'383 4'020'029 2'172'197 46 410 15.9% 6.2
Thiqa 7'172'991 6'219'147 5'920'296 4'475'578 953'844 55 567 18.0% 15.7
Basic 5'003'845 4'051'079 2'932'545 2'132'354 1'319'825 952'765 39 220 14.9% 3.7
Total Enhanced 100.0% 7'520'962 7'255'374 4'200'484 3'992'451 2'700'204 265'588 44 387 15.2% 5.5
Daman 30.0% 2'252'887 2'041'250 1'993'114 1'656'879 1'287'361 211'637 45 488 18.5% 4.9
ADNIC 16.3% 1'222'810 1'208'292 733'321 42'914 32'814 14'518 44 415 14.1% 8.6
Oman 7.5% 562'436 441'279 432'316 806'221 523'760 121'157 35 376 14.3% 3.3
Al Wathba 5.4% 405'007 353'340 173'397 89'700 51'667 303 7.3% 7.8
Al Dhafra 4.8% 361'405 185'478 31'453 32'106 175'927 101 276 1.9
AXA 2.9% 217'453 117'571 2 14'450 99'882 399 18.2
Qatar 2.4% 182'950 143'744 34'359 14'480 36'874 39'206 349 24
EIC 3.0% 224'897 216'550 66'261 69'999 72'802 8'347 283 10.8
Green Crescent 3.0% 228'045 659'967 146'809 67'127 -431'922 270 9.1
Al Hilal Takaful 2.7% 199'362 139'562 42'363 59'800 257 8.1% 7.4
Saudi Arabian 1.2% 87'894 57'695 17'463 677 3'557 30'199 44 541 14.3% 24
ALICO 1.7% 128'679 205'356 38'332 124'824 47'742 -76'677 113 356 10.1% 11.3
Al Khazna 1.7% 128'935 99'153 111'181 79'801 101'078 29'782 102 347 5.9% 6.4
Abu Dhabi Takaful 1.7% 129'503 136'249 51'659 49'146 47'599 -6'746 326 9.2
ArabOrient 1.6% 118'810 172'909 47'022 366'736 134'390 -54'099 161 339 10.1% 3.4
Al Ain Ahlia 1.3% 98'569 169'245 98'489 72'831 6'326 -70'676 76 388 11.7
Dubai Insurance Co. 1.3% 96'501 24'374 72'127 61 376 9.1% 62
Al Buhaira 1.8% 137'486 262'402 127'519 84'053 55'499 -124'916 20 253 10.7% 4.5
Al Sagr 1.3% 96'126 138'414 2'014 323'149 267'491 -42'288 104 297 11.6% 4.9
Insurance House - PSC 1.5% 112'711 112'711 211 4.4
NGI 0.8% 61'549 61'914 1'474 2'590 2'215 -365 347 64
Sharjah 0.9% 67'826 26'745 41'081 290 20
RAK 0.7% 55'980 87'898 40'256 40'102 29'291 -31'918 200 341 8.1% 6.7
Takaful Emarat 0.7% 55'824 5'960 487 49'864 38 280 13.9% 2.2
United 0.7% 49'575 29'288 60 16'439 2'867 20'287 85 259 13.2% 5.3
Methaq Takaful 0.6% 46'693 116'851 12'224 196 -70'158 90 259 17.6% 121
NoorTakaful 0.5% 33'881 29'645 7'750 1'366 4'236 330 9.4% 6.3
Al-Ittihad 0.4% 32'147 6'172 25'975 131 340 7.5
Aman 0.4% 28'622 15'381 158 1'841 13'241 56 261 14.8% 6.1
Arabia 0.2% 13'455 25'577 8'936 1'369 1'015 -12'122 239 501 5.6% 2.9
Royal and Sun Alliance 0.1% 8'739 6'362 3'656 1'297 2'377 637 5.6
Lebanese 0.2% 15'475 20'018 4'950 6'404 4'483 -4'543 245 6.5
Al Fujairah 0.2% 14'318 13'847 1'680 7'145 3'635 471 83 248 10.7% 1.9
Alliance 0.2% 11'366 12'577 172 18'245 -1'211 24 248 11.7% 5.0
Arabian Scandinavian 0.3% 20'679 5'402 5 2'597 15'277 115 4.6
Salama 0.1% 7'134 9'340 3'055 1'017 4'702 -2'206 224 330 6.5% 4.7
Union 0.1% 5'110 9'503 -4'393 272 1.2
Dubai National 0.0% 123 64 59 352 1.9
Thiqa
37%
Basic
25%
Enhanced
38%
Volume
Thiqa50%
Basic14%
Enhanced36%
Value

Population
Providers Payers Claims
Financing Episodes
47

Source KEH cube 2012 and Products Search Engine Database; Strategy Analysis
Enhanced plans premiums
48
Number of Contracts
Ave
rage
Gro
ss P
rem
ium
[600-999 AED]
[1'000-1,'99 AED] [2'000 - 2'999 AED] [3'000 - 3'999 AED]
[4'000-
4'999AED] [5'000+ AED]
7'802AED
4'372AED
3'485AED
2'481AED
1'492AED
'664AED
476'000 158'000 199'000 173'000 129'000 239'000

Note About 21% of the enhanced plans contracts are excluded due to non compliance with reporting of benefits information.
Source KEH and Products Search Engine Database; Strategy Analysis
Enhanced plans limits
49
Benefit Level
Basic Product
Better than Basic Product
Mem
ber
%
0 (34%)
20 (1%)50 (4%)
70 (4%)
80 (37%)
100(20%)
% Cover Outside Network
Other Emirates
Emergency,3%
+ Internation
al, 56%
+ Home Country,
11%
+ Other Emirates
In/Outpatient, 30%
GeographicCoverage
.25, 27%
.30, 27%
.35, 2%
.50, 17%
1.00, 14%
1.50, 2%2.50, 3%5.00, 1%
Other, 7%
Annual LimitAED millions

Enhanced plans benefits
50
Note Benefits are not mutually exclusive, a plan may have more than one of the listed benefits. About 26% of the enhanced plans contracts are excluded due to non compliance with reporting of benefits information
Source 2011 KEH cube and Products Search Engine Database; Strategy Analysis
* Some enhanced products include more than one of the listed benefits.
0%
0%
1%
2%
3%
4%
6%
8%
10%
11%
15%
16%
26%
76%
77%
Genetic Disorders
Cosmetic treatment
Dietician
Infertility
Preventive care
Rehabilitation
Chiropractic
Congenital Disorders
Home Nursing
Ophthalmology
Psychiatry
Alternative Medicine
Dental
Miscellaneous Enhanced Clinical & Non Clinical
Any Clinical Service > Basic Level
Member Count
Capacity Masterplan
10 Oct 2013
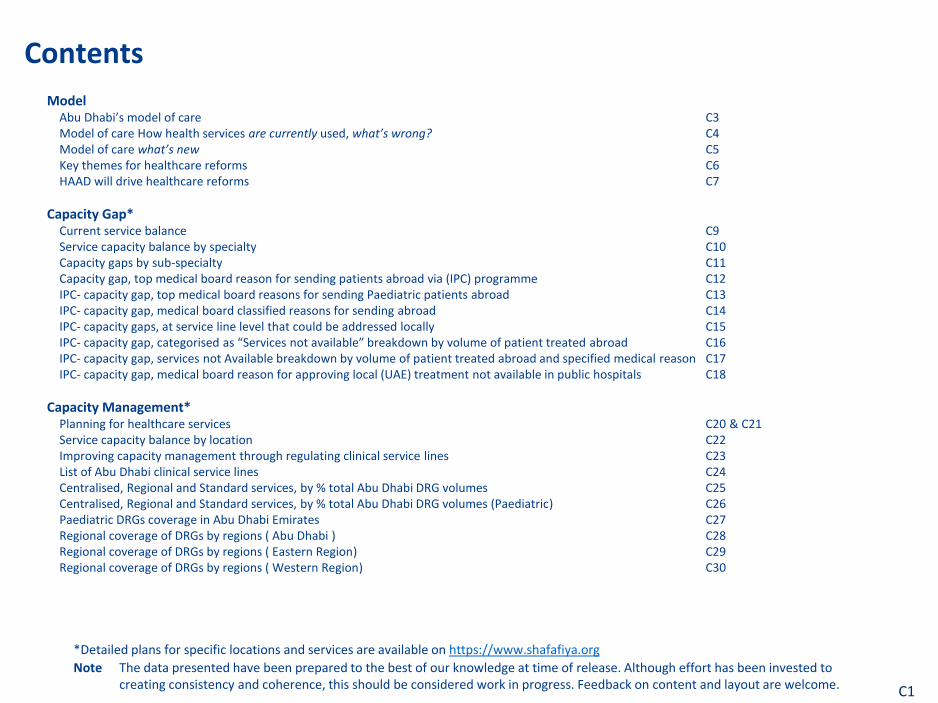
Model Abu Dhabi’s model of care C3 Model of care How health services are currently used, what’s wrong? C4 Model of care what’s new C5 Key themes for healthcare reforms C6 HAAD will drive healthcare reforms C7
Capacity Gap* Current service balance C9 Service capacity balance by specialty C10 Capacity gaps by sub-specialty C11 Capacity gap, top medical board reason for sending patients abroad via (IPC) programme C12 IPC- capacity gap, top medical board reasons for sending Paediatric patients abroad C13 IPC- capacity gap, medical board classified reasons for sending abroad C14 IPC- capacity gaps, at service line level that could be addressed locally C15 IPC- capacity gap, categorised as “Services not available” breakdown by volume of patient treated abroad C16 IPC- capacity gap, services not Available breakdown by volume of patient treated abroad and specified medical reason C17 IPC- capacity gap, medical board reason for approving local (UAE) treatment not available in public hospitals C18
Capacity Management* Planning for healthcare services C20 & C21 Service capacity balance by location C22 Improving capacity management through regulating clinical service lines C23 List of Abu Dhabi clinical service lines C24 Centralised, Regional and Standard services, by % total Abu Dhabi DRG volumes C25 Centralised, Regional and Standard services, by % total Abu Dhabi DRG volumes (Paediatric) C26 Paediatric DRGs coverage in Abu Dhabi Emirates C27 Regional coverage of DRGs by regions ( Abu Dhabi ) C28 Regional coverage of DRGs by regions ( Eastern Region) C29 Regional coverage of DRGs by regions ( Western Region) C30
Contents
*Detailed plans for specific locations and services are available on https://www.shafafiya.org
Note The data presented have been prepared to the best of our knowledge at time of release. Although effort has been invested to creating consistency and coherence, this should be considered work in progress. Feedback on content and layout are welcome. C1
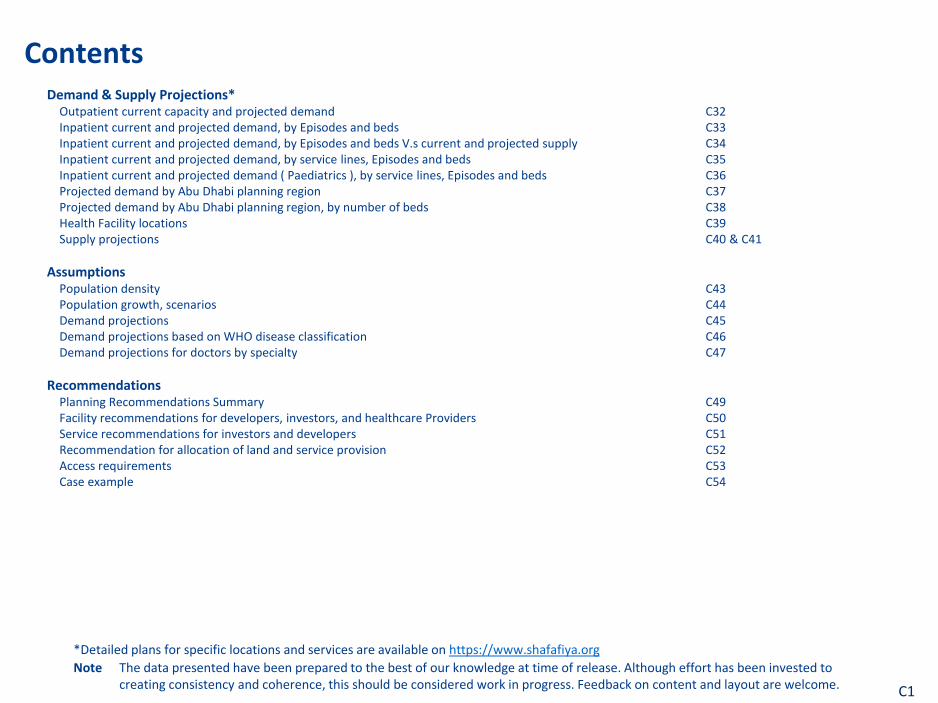
Demand & Supply Projections* Outpatient current capacity and projected demand C32 Inpatient current and projected demand, by Episodes and beds C33 Inpatient current and projected demand, by Episodes and beds V.s current and projected supply C34 Inpatient current and projected demand, by service lines, Episodes and beds C35 Inpatient current and projected demand ( Paediatrics ), by service lines, Episodes and beds C36 Projected demand by Abu Dhabi planning region C37 Projected demand by Abu Dhabi planning region, by number of beds C38 Health Facility locations C39 Supply projections C40 & C41
Assumptions Population density C43 Population growth, scenarios C44 Demand projections C45 Demand projections based on WHO disease classification C46 Demand projections for doctors by specialty C47
Recommendations Planning Recommendations Summary C49 Facility recommendations for developers, investors, and healthcare Providers C50 Service recommendations for investors and developers C51 Recommendation for allocation of land and service provision C52 Access requirements C53 Case example C54
Contents
*Detailed plans for specific locations and services are available on https://www.shafafiya.org
Note The data presented have been prepared to the best of our knowledge at time of release. Although effort has been invested to creating consistency and coherence, this should be considered work in progress. Feedback on content and layout are welcome. C1

Model of Care Capacity Gaps
Assumptions Recommendations
DRAFT
Patient self-care
Model of care How health services should be used
Source Institute of Medicine 2001 Crossing the Quality Chasm, Bodenheimer et al 2002 JAMA, Department of Health UK 2001 Reforming Emergency Care, Picker Institute, Strategy analysis 11
Remote support
Preventative
Screening
Check-up
Disease management
Non-emergency/elective
Outpatient Clinic
Elective Admission
Emergency
Ambulance
Emergency Admission .
Triage
Urgent Care Centre
ER
Including diagnostics
Population growth, scenarios
Note HAAD and SCAD are collaborating to align figures with official SCAD estimates; Estimates presented here are for internal HAAD use only
Projections for Nationals are rounded to the nearest 2.5% variance between high and low, and those for Expatriates at 5%.
Source SCAD population estimates; additional HAAD assumptions and analysis based on raw insurance data` 73
As at 31 December 2010 Draft
Population growth, Scenarios
National Expatriate
Year Low High
2011 411'200 1'945'000 2'045'000
2012 416'150 1'970'000 2'190'000
2013 422'200 2'060'000 2'350'000
2014 429'400 2'130'000 2'505'000
2015 437'800 2'175'000 2'675'000
2016 445'800 2'250'000 2'850'000
2017 453'600 2'310'000 3'045'000
2018 460'500 2'360'000 3'240'000
2019 467'600 2'400'000 3'400'000
2020 473'600 2'475'000 3'575'000
0.0
0.5
1.0
1.5
2.0
2.5
3.0
3.5
4.0
2010 2011 2012 2013 2014 2015 2016 2017 2018 2019 2020
Po
pu
lati
on
(mill
ion
s)
High
Low
DRAFT
For planning purposes, land must be available for hospitals, clinics and ambulance stations to serve anticipated population as per the following guidelines:
Land requirements Guidelines for urban planners
Notes 1Transient population includes staff and other non-residential visitors 2Clinics collectively refers to Clinics, Centers and Polyclinics3Appropriate facilities for co-location with Clinics include Hospitals, Ambulance Stations, Mosques, Neighbourhood Commercial Centres, Sport Facilities, Community/Cultural Centres, Pharmacies, Schools and Post Offices, 4Clinic GFA may be provided within larger commercial centre with adequate transport options and shared parking5 If residential population is less than 60,000 or transient population is less than 180,000, land provision for a hospital facility needs to be made on a site-based analysis which considers the accesibility of existing hospital facilities6Optimal hospital size is 200-600 beds7Appropriate facilities for co-location with Ambulance Stations include Clinics, Hospitals, Civil Defense Stations, Police Stations and Municipal Offices
Source HAAD Health Facility Community Guidelines 2009, Strategy analysis 5
Population (000’s people)
Land provision options Parking(spaces)
Minimum service requirement
Estimated Resources
Residential Transient1 Land area(m2 000’s)
Co-location GFA4
(m2 000’s)
Clinics2 4-5 12-15 6 ? 3 2.5 25 •Primary care•Pharmacy services (on-site or within 10 min walk)•Laboratory service
2 Physicians
8-12 24-36 7 ? 3 3 30 4-6 Physicians
12-30 36-90 8.5 ? 3 3.5 35 7-14 Physicians
30-40 90-120 12 ? 3 4.5 45 15-20 Physicians
Hospitals5 60-80 180-240 80 n/a n/a 3/bed •Emergency services•Laboratory services•Radiology services•Stand-alone building
180-240 Beds6
90-110 270-330 100 n/a n/a 3/bed 270-330 beds6
Ambulance Stations
10-16 30-48 3 ? 7 n/a 10 •Ambulance service (land /air) 1 Ambulance
16-40 48-120 4 ? 7 n/a 15 •Ambulance service (land /air) 2 Ambulances
OR OR OR
C2
Capacity Masterplan
Note: Abu Dhabi and Al Gharbia populations based on SCAD 2005 census. Al Ain population based on 2008 UPC estimate.
Source: Population: SCAD, UPC 2030 plans. Clinicians and Facilities: Licensing database. Planned Facilities ; SEHA, UPC 2030 plans, HAAD Planning analysis.
Capacity Gap
Severe
Moderate
None
Population Facilities Clinicians Ratios 2030 Plan growth 2030 requirements 2030 planned Projects under way
Region District Gap now Type Tota
l
% N
atio
nal
Nat
ion
als
Tota
l
Ho
spit
als
Cli
nic
s
Ne
arb
y
ho
spit
al
Do
cto
rs
Nu
rse
s
De
nti
sts
Oth
er
Fac
ilit
ies
/10
00
0
Do
cto
rs
/10
00
Nu
rse
s
/10
00
Population Growth
Ho
spit
als
req
uir
ed
Cli
nic
req
uir
ed
Ho
spit
als
Cli
nic
s
Ho
spit
als
Cli
nic
s
20
30
Po
pu
lati
on
Abu Dhabi Desert Villages Rural 28,480 #NAME? 10,963 None 81,520 1 110,000
Al Falah Rural 4,028 #NAME? 1,996 None 95,972 1 1 100,000
Ghantoot District Rural 2,478 #NAME? - None 97,522 1 100,000
Abu Dhabi Island Urban 313,809 #NAME? 44,004 229 13 182 2,529 3,878 430 1,284 6.2 8.1 12.4 111,191 425,000
CBD/Financial Centre Urban 174,625 #NAME? 14,141 124 5 86 1,131 1,663 241 539 5.2 6.5 9.5 15,375 1 190,000
Musaffah Urban 141,268 #NAME? 2,256 36 31 161 194 21 68 2.2 1.1 1.4 (41,268) 1 1 3 100,000
Bani Yas Rural 47,245 #NAME? 27,267 43 37 162 106 57 73 7.8 3.4 2.2 22,755 4 70,000
Al Shahama Rural 37,831 #NAME? 16,361 10 10 45 47 14 24 2.6 1.2 1.2 72,169 1 1 1 110,000
Shamkhah Rural 15,839 #NAME? 10,674 None 1 114,161 1 130,000
Al Rahba Rural 15,315 #NAME? 13,038 1 1 132 325 5 89 0.7 8.6 21.2 94,685 1 110,000
New Port City Rural 11,740 #NAME? 4,565 None 1 138,260 2 150,000
Capital District South Urban 9,247 #NAME? 33 None 1 45,753 1 1 55,000
Bain Al Jesrain Urban 7,694 #NAME? 4,927 3 3 33 42 10 17 3.9 4.3 5.5 17,306 1 1 25,000
Khalifa City A Urban 5,317 #NAME? 2,703 11 1 10 78 74 17 75 20.7 14.7 13.9 64,683 1 1 6 70,000
Grand Mosque District Urban 5,257 #NAME? 1,837 None 1 114,743 1 1 120,000
Inner Islands Urban 2,804 #NAME? 480 1 2 4 3.6 0.7 1.4 17,196 1 20,000
Capital District North Urban 2,371 #NAME? 2,121 2 1 1 426 792 36 302 8.4 179.7 334.0 67,629 1 3 70,000
Al Mina Urban 1,070 #NAME? 53 7 4 87 103 25 62 37.4 81.3 96.3 98,930 100,000
Al Raha Urban 827 #NAME? 397 2 1 1 41 42 9 12 49.6 50.8 119,173 1 120,000
Yas Island Urban 776 #NAME? 1 None 99,224 100,000
Mohamed Bin Zayed City Urban 328 #NAME? 95 2 2 1 2 4 2 3.0 6.1 49,672 1 1 4 50,000
Saadiyat Urban 122 #NAME? None 119,878 - 120,000
Airport District Urban 98 #NAME? 32 6 4 8 11 5 11 81.6 112.2 49,902 1 50,000
Lulu Island Urban 75 #NAME? None 19,925 1 20,000
Capital District Urban #NAME? None 240,000 2 240,000
Mohamed Bin Zayed Centre Urban #NAME? None 80,000 1 80,000
South Hudayriat Island Rural #NAME? None 100,000 1 100,000
Marina Village Urban #NAME? 3 2 1 3 6 5,000 5,000
Al Suwwah Urban #NAME? None 30,000 1 1 30,000
Al Reem Urban #NAME? None 200,000 200,000
Al Ain Umm Ghaffa Rural 8,851 #NAME? 5,873 None 3,049 1 1 11,900
Nahel Rural 5,196 #NAME? 2,377 None 4,804 1 1 10,000
Industrial City Rural 48,803 #NAME? 18 8 5 14 5 1 5 1.0 0.3 0.1 30,937 1 1 79,740
Al Salamat/Al Yaher Urban 37,544 #NAME? 23,400 1 1 1 3 1 6 0.3 0.1 0.0 36,456 1 1 2 74,000
Al Dhahra Rural 4,958 #NAME? 715 None 1,042 1 1 6,000
Abu Krayyah Rural 4,108 #NAME? 655 None 892 1 1 5,000
Al Saad Rural 3,829 #NAME? 702 None 1,171 1 1 5,000
Al Araad Rural 3,791 #NAME? 139 None 209 1 4,000
Abu Samra Rural 1,942 #NAME? 286 None 558 1 2,500
Al Ain City Urban 343,002 #NAME? 100,298 186 7 148 1,733 2,864 318 968 4.5 5.1 8.3 364,298 3 8 707,300
Al Quaa Rural 12,512 #NAME? 4,912 1 1 8 13 1 3 0.8 0.6 1.0 10,488 1 1 23,000
Al Wagan Rural 11,865 #NAME? 3,330 1 1 17 29 1 4 0.8 1.4 2.4 18,135 1 1 1 30,000
Al Hayer Rural 11,484 #NAME? 2,570 3 3 25 34 4 3 2.6 2.2 3.0 20,516 1 2 32,000
Al Dhaher Rural 10,641 #NAME? 7,325 1 1 13 20 3 4 0.9 1.2 1.9 3,709 1 1 14,350
Remah Rural 8,187 #NAME? 683 1 1 6 9 2 1.2 0.7 1.1 1,313 1 1 9,500
Sweihan Rural 7,880 #NAME? 713 1 1 8 11 1 1 1.3 1.0 1.4 32,120 1 2 40,000
Al Khazna Rural 7,350 #NAME? 1,071 2 2 4 13 1 2.7 0.5 1.8 1,650 1 1 9,000
Mezyad Rural 6,407 #NAME? 3,809 None 1 1,993 1 1 8,400
Al Shwaib Rural 3,260 #NAME? 1,546 1 1 3 4 3.1 0.9 1.2 2,240 1 1 5,500
Al Fagah Rural 2,089 #NAME? 378 1 1 3 3 4.8 1.4 1.4 1,411 1 3,500
Western Liwa Rural 20,000 #NAME? 661 5 1 1 8 17 5 32 1.0 0.4 0.9 45,000 1 65,000
Madinat Zayed Rural 29,000 #NAME? 6,785 16 2 11 175 256 23 107 4.5 6.0 8.8 11,000 1 1 40,000
Ruwais Rural 16,000 #NAME? 1,270 4 1 3 50 100 7 14 2.5 3.1 6.3 114,000 1 130,000
Mirfa Rural 15,000 #NAME? 3,676 4 1 3 32 61 3 17 2.7 2.1 4.1 60,000 75,000
Ghayathi Rural 8,000 #NAME? 3,898 6 1 5 38 63 5 18 7.5 4.8 7.9 7,000 1 15,000
Sila'a Rural 5,000 #NAME? - 1 1 22 39 2 10 2.0 4.4 7.8 65,000 70,000
Delma Island Rural 5,000 #NAME? 2,139 1 1 23 25 2 10 2.0 4.6 5.0 5,000 1 10,000
Capacity Management
Demand & Supply Projections
Current and projected demand, by Episodes and beds
C17
Notes :Sub Acute beds include: Rehabilitation, Palliative care, Maintenance, Older Persons and Psychogeriatric care; ICU beds excludePaediatrics, NICU, CCU, etc. Acute Overnight beds exclude day case beds. Sub acute numbers of beds adjustedSource: TAHPI, Health Facility briefing system, reference data is based on data extracted from the Australian Institute of Health and Welfare,supplemented by data from the USA inpatient sample and UK Hospital Episode Statistics Online (HES)Assumptions Projected bed numbers from 2016 onwards are based on ‘International Average’ ALOS and 75% occupancy for ICU beds.
Population growth based on: Abu Dhabi Urban Planning Council 2030 Plan projections, ‘Advantaged’ socio-economic classand with life expectancy >77years. Expatriate utilisation increases from 45% of UAE National utilisation to 55% of UAENational utilisation. Sub acute number of beds adjusted to meet international benchmark
Bed Occupancy 2011 Actual 2016 2021 2026 2031Acute Overnight
Episodes122,345 184,102 223,539 276,589 332,040
Acute Overnight Beds Current (58%) 3,289 3,992 5,223 6,769 7,061
Intermediate (70%) 3,308 4,328 5,609 5,850
Target (85%) 2,724 3,564 4,619 4,818
Sub Acute Overnight
EpisodesN/A 3,216 4,233 5,461 6,738
Sub Acute Overnight
Beds224 342 438 449 525
ICU beds 146 175 209 245 281
Emergency Bays N/A 789 987 1,182 1,379

• Healthcare in Abu Dhabi faces growing demand for services arising from an expanding populationC22,C44 that has a deteriorating health statusC46. The current population is young and has a high rate of chronic diseases that is set to increase as it ages. The current model of care in Abu Dhabi does not adequately support self care or prevention –screening programmes and diagnostic services are not integrated into care plans. Also, patients have undirected access to services and specialty care which leads to inappropriate use and, in turn, over-supply of servicesC4,C21,C22. In response HAAD is further developing its capacity management processes, its Weqaya screening programme and its approach to the continuum of care.
• Specialty care is not equally distributed across the 3 regions of Abu Dhabi Emirate. In addition rural primary care and sub acute care is not well developed in the Emirate. In response HAAD is developing its comprehensive capacity planning process to address these issues including resolving critical shortages including rural areas in the Western and Eastern Regions.
• Historically, Abu Dhabi has had a relatively limited supply of healthcare services, particularly hospital beds, which led to investment in infrastructure3. Achieving world-class quality care, however, is about much more than new buildingsC6. Before embarking on large-scale projects which affect community healthcare services long-term, it is important to be clear on what type of healthcare is appropriate for the evolving communities and population of Abu Dhabi in the 21st century.
• Abu Dhabi’s model of careC5 describes how healthcare should look in future and is based on robust international experience**. The focus is on empowering patients. As a first step, pro-active check-ups and convenient routine follow-up should help prevent disease. When there is a condition, patients should be supported to care for themselves, where appropriate and supported by well developed primary and sub acute care including home care and the integrated use of telemedicine*. In order to promote the use of home care and telemedicine HAAD has developed new “At Home” and telemedicine standards. This has been shown to improve quality, and improve access in rural areas. There need to be improved access to appropriate ‘elective’ and emergency care, and this should be streamlined and optimised from the patient’s perspective through an emphasis on early clinical triage. Diagnostics, for instance, should be more readily available to enable one-stop-treatment.
• Making such ambitious changes to our healthcare system will requires many decisions on what to do and what not to do. The Healthcare reforms proposed by major health stakeholdersC6 help clarify how trade-offs should be made in delivering health services and transitioning to the new model of care.
Abu Dhabi’s model of care
*A randomised controlled trial of child psychiatric assessment conducted by videoconferencing. Alford, R et al (2000) . ** Impact of home care on hospital days: a meta analysis. Hughes, SL et al (1997)
C3
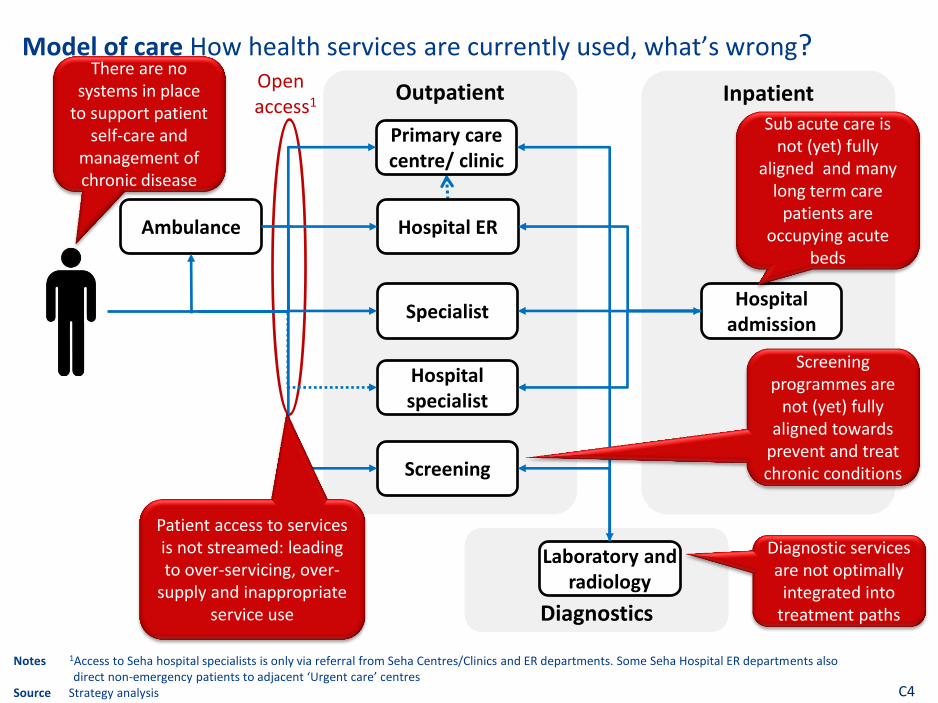
Diagnostics
Inpatient Outpatient
Model of care How health services are currently used, what’s wrong?
Hospital admission
Open access1
Primary care centre/ clinic
Hospital ER
Specialist
Hospital specialist
Screening
Laboratory and radiology
Ambulance
Notes 1Access to Seha hospital specialists is only via referral from Seha Centres/Clinics and ER departments. Some Seha Hospital ER departments also direct non-emergency patients to adjacent ‘Urgent care’ centres Source Strategy analysis
Patient access to services is not streamed: leading to over-servicing, over-
supply and inappropriate service use
There are no systems in place
to support patient self-care and
management of chronic disease
Screening programmes are
not (yet) fully aligned towards
prevent and treat chronic conditions
Diagnostic services are not optimally
integrated into treatment paths
C4
Sub acute care is not (yet) fully
aligned and many long term care
patients are occupying acute
beds

Patient self care
Desired model of care what’s new?
Note *Sub acute care include , elderly care, rehabilitation, maintenance therapy and psychogenic cases.**HAAD will regulate clinical services line by centralised, regional and standard DRGs Source Institute of Medicine 2001 Crossing the Quality Chasm, Bodenheimer et al 2002 JAMA, Department of Health UK 2001 Reforming Emergency Care, Picker Institute, Strategy analysis
Remote support
Preventive
Screening
Check-up
Disease management
Non-emergency/elective
Primary & community care
outpatients
Elective Admission
Emergency
Ambulance
Emergency Admission .
Triage
Urgent Care Centre
ER
Including diagnostics
C5
*Sub acute care
**Acute care
Telemedicine & mobile clinics

Key themes for healthcare reforms
Integrated continuum of care for individuals
Drive quality and safety as well as enhance patient experience
Attract/retain/train workforce
Emergency preparedness
Wellness and prevention—public Health approach
Ensure value for money + Sustainability of healthcare spend
Integrated Health Informatics and eHealth
Governance as a key enabler of the reform effort
1
2
3
4
5
6
7
Source Abu Dhabi Health Sector Strategic Review and Performance Evaluation. May 2013.
C6
The following 7 major priorities have been identified: Content under development
HAAD will drive healthcare reforms – 50+ key initiatives
C7
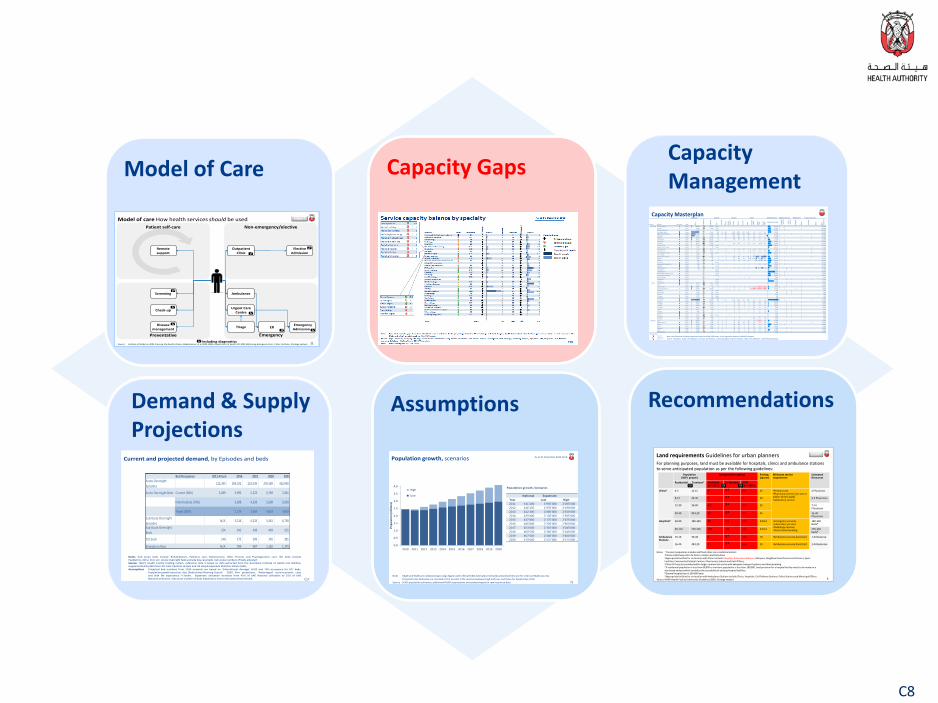
Model of Care Capacity Gaps
Assumptions Recommendations
DRAFT
Patient self-care
Model of care How health services should be used
Source Institute of Medicine 2001 Crossing the Quality Chasm, Bodenheimer et al 2002 JAMA, Department of Health UK 2001 Reforming Emergency Care, Picker Institute, Strategy analysis 11
Remote support
Preventative
Screening
Check-up
Disease management
Non-emergency/elective
Outpatient Clinic
Elective Admission
Emergency
Ambulance
Emergency Admission .
Triage
Urgent Care Centre
ER
Including diagnostics
Population growth, scenarios
Note HAAD and SCAD are collaborating to align figures with official SCAD estimates; Estimates presented here are for internal HAAD use only
Projections for Nationals are rounded to the nearest 2.5% variance between high and low, and those for Expatriates at 5%.
Source SCAD population estimates; additional HAAD assumptions and analysis based on raw insurance data` 73
As at 31 December 2010 Draft
Population growth, Scenarios
National Expatriate
Year Low High
2011 411'200 1'945'000 2'045'000
2012 416'150 1'970'000 2'190'000
2013 422'200 2'060'000 2'350'000
2014 429'400 2'130'000 2'505'000
2015 437'800 2'175'000 2'675'000
2016 445'800 2'250'000 2'850'000
2017 453'600 2'310'000 3'045'000
2018 460'500 2'360'000 3'240'000
2019 467'600 2'400'000 3'400'000
2020 473'600 2'475'000 3'575'000
0.0
0.5
1.0
1.5
2.0
2.5
3.0
3.5
4.0
2010 2011 2012 2013 2014 2015 2016 2017 2018 2019 2020
Po
pu
lati
on
(mill
ion
s)
High
Low
DRAFT
For planning purposes, land must be available for hospitals, clinics and ambulance stations to serve anticipated population as per the following guidelines:
Land requirements Guidelines for urban planners
Notes 1Transient population includes staff and other non-residential visitors 2Clinics collectively refers to Clinics, Centers and Polyclinics3Appropriate facilities for co-location with Clinics include Hospitals, Ambulance Stations, Mosques, Neighbourhood Commercial Centres, Sport Facilities, Community/Cultural Centres, Pharmacies, Schools and Post Offices, 4Clinic GFA may be provided within larger commercial centre with adequate transport options and shared parking5 If residential population is less than 60,000 or transient population is less than 180,000, land provision for a hospital facility needs to be made on a site-based analysis which considers the accesibility of existing hospital facilities6Optimal hospital size is 200-600 beds7Appropriate facilities for co-location with Ambulance Stations include Clinics, Hospitals, Civil Defense Stations, Police Stations and Municipal Offices
Source HAAD Health Facility Community Guidelines 2009, Strategy analysis 5
Population (000’s people)
Land provision options Parking(spaces)
Minimum service requirement
Estimated Resources
Residential Transient1 Land area(m2 000’s)
Co-location GFA4
(m2 000’s)
Clinics2 4-5 12-15 6 ? 3 2.5 25 •Primary care•Pharmacy services (on-site or within 10 min walk)•Laboratory service
2 Physicians
8-12 24-36 7 ? 3 3 30 4-6 Physicians
12-30 36-90 8.5 ? 3 3.5 35 7-14 Physicians
30-40 90-120 12 ? 3 4.5 45 15-20 Physicians
Hospitals5 60-80 180-240 80 n/a n/a 3/bed •Emergency services•Laboratory services•Radiology services•Stand-alone building
180-240 Beds6
90-110 270-330 100 n/a n/a 3/bed 270-330 beds6
Ambulance Stations
10-16 30-48 3 ? 7 n/a 10 •Ambulance service (land /air) 1 Ambulance
16-40 48-120 4 ? 7 n/a 15 •Ambulance service (land /air) 2 Ambulances
OR OR OR
C8
Capacity Masterplan
Note: Abu Dhabi and Al Gharbia populations based on SCAD 2005 census. Al Ain population based on 2008 UPC estimate.
Source: Population: SCAD, UPC 2030 plans. Clinicians and Facilities: Licensing database. Planned Facilities ; SEHA, UPC 2030 plans, HAAD Planning analysis.
Capacity Gap
Severe
Moderate
None
Population Facilities Clinicians Ratios 2030 Plan growth 2030 requirements 2030 planned Projects under way
Region District Gap now Type Tota
l
% N
atio
nal
Nat
ion
als
Tota
l
Ho
spit
als
Cli
nic
s
Ne
arb
y
ho
spit
al
Do
cto
rs
Nu
rse
s
De
nti
sts
Oth
er
Fac
ilit
ies
/10
00
0
Do
cto
rs
/10
00
Nu
rse
s
/10
00
Population Growth
Ho
spit
als
req
uir
ed
Cli
nic
req
uir
ed
Ho
spit
als
Cli
nic
s
Ho
spit
als
Cli
nic
s
20
30
Po
pu
lati
on
Abu Dhabi Desert Villages Rural 28,480 #NAME? 10,963 None 81,520 1 110,000
Al Falah Rural 4,028 #NAME? 1,996 None 95,972 1 1 100,000
Ghantoot District Rural 2,478 #NAME? - None 97,522 1 100,000
Abu Dhabi Island Urban 313,809 #NAME? 44,004 229 13 182 2,529 3,878 430 1,284 6.2 8.1 12.4 111,191 425,000
CBD/Financial Centre Urban 174,625 #NAME? 14,141 124 5 86 1,131 1,663 241 539 5.2 6.5 9.5 15,375 1 190,000
Musaffah Urban 141,268 #NAME? 2,256 36 31 161 194 21 68 2.2 1.1 1.4 (41,268) 1 1 3 100,000
Bani Yas Rural 47,245 #NAME? 27,267 43 37 162 106 57 73 7.8 3.4 2.2 22,755 4 70,000
Al Shahama Rural 37,831 #NAME? 16,361 10 10 45 47 14 24 2.6 1.2 1.2 72,169 1 1 1 110,000
Shamkhah Rural 15,839 #NAME? 10,674 None 1 114,161 1 130,000
Al Rahba Rural 15,315 #NAME? 13,038 1 1 132 325 5 89 0.7 8.6 21.2 94,685 1 110,000
New Port City Rural 11,740 #NAME? 4,565 None 1 138,260 2 150,000
Capital District South Urban 9,247 #NAME? 33 None 1 45,753 1 1 55,000
Bain Al Jesrain Urban 7,694 #NAME? 4,927 3 3 33 42 10 17 3.9 4.3 5.5 17,306 1 1 25,000
Khalifa City A Urban 5,317 #NAME? 2,703 11 1 10 78 74 17 75 20.7 14.7 13.9 64,683 1 1 6 70,000
Grand Mosque District Urban 5,257 #NAME? 1,837 None 1 114,743 1 1 120,000
Inner Islands Urban 2,804 #NAME? 480 1 2 4 3.6 0.7 1.4 17,196 1 20,000
Capital District North Urban 2,371 #NAME? 2,121 2 1 1 426 792 36 302 8.4 179.7 334.0 67,629 1 3 70,000
Al Mina Urban 1,070 #NAME? 53 7 4 87 103 25 62 37.4 81.3 96.3 98,930 100,000
Al Raha Urban 827 #NAME? 397 2 1 1 41 42 9 12 49.6 50.8 119,173 1 120,000
Yas Island Urban 776 #NAME? 1 None 99,224 100,000
Mohamed Bin Zayed City Urban 328 #NAME? 95 2 2 1 2 4 2 3.0 6.1 49,672 1 1 4 50,000
Saadiyat Urban 122 #NAME? None 119,878 - 120,000
Airport District Urban 98 #NAME? 32 6 4 8 11 5 11 81.6 112.2 49,902 1 50,000
Lulu Island Urban 75 #NAME? None 19,925 1 20,000
Capital District Urban #NAME? None 240,000 2 240,000
Mohamed Bin Zayed Centre Urban #NAME? None 80,000 1 80,000
South Hudayriat Island Rural #NAME? None 100,000 1 100,000
Marina Village Urban #NAME? 3 2 1 3 6 5,000 5,000
Al Suwwah Urban #NAME? None 30,000 1 1 30,000
Al Reem Urban #NAME? None 200,000 200,000
Al Ain Umm Ghaffa Rural 8,851 #NAME? 5,873 None 3,049 1 1 11,900
Nahel Rural 5,196 #NAME? 2,377 None 4,804 1 1 10,000
Industrial City Rural 48,803 #NAME? 18 8 5 14 5 1 5 1.0 0.3 0.1 30,937 1 1 79,740
Al Salamat/Al Yaher Urban 37,544 #NAME? 23,400 1 1 1 3 1 6 0.3 0.1 0.0 36,456 1 1 2 74,000
Al Dhahra Rural 4,958 #NAME? 715 None 1,042 1 1 6,000
Abu Krayyah Rural 4,108 #NAME? 655 None 892 1 1 5,000
Al Saad Rural 3,829 #NAME? 702 None 1,171 1 1 5,000
Al Araad Rural 3,791 #NAME? 139 None 209 1 4,000
Abu Samra Rural 1,942 #NAME? 286 None 558 1 2,500
Al Ain City Urban 343,002 #NAME? 100,298 186 7 148 1,733 2,864 318 968 4.5 5.1 8.3 364,298 3 8 707,300
Al Quaa Rural 12,512 #NAME? 4,912 1 1 8 13 1 3 0.8 0.6 1.0 10,488 1 1 23,000
Al Wagan Rural 11,865 #NAME? 3,330 1 1 17 29 1 4 0.8 1.4 2.4 18,135 1 1 1 30,000
Al Hayer Rural 11,484 #NAME? 2,570 3 3 25 34 4 3 2.6 2.2 3.0 20,516 1 2 32,000
Al Dhaher Rural 10,641 #NAME? 7,325 1 1 13 20 3 4 0.9 1.2 1.9 3,709 1 1 14,350
Remah Rural 8,187 #NAME? 683 1 1 6 9 2 1.2 0.7 1.1 1,313 1 1 9,500
Sweihan Rural 7,880 #NAME? 713 1 1 8 11 1 1 1.3 1.0 1.4 32,120 1 2 40,000
Al Khazna Rural 7,350 #NAME? 1,071 2 2 4 13 1 2.7 0.5 1.8 1,650 1 1 9,000
Mezyad Rural 6,407 #NAME? 3,809 None 1 1,993 1 1 8,400
Al Shwaib Rural 3,260 #NAME? 1,546 1 1 3 4 3.1 0.9 1.2 2,240 1 1 5,500
Al Fagah Rural 2,089 #NAME? 378 1 1 3 3 4.8 1.4 1.4 1,411 1 3,500
Western Liwa Rural 20,000 #NAME? 661 5 1 1 8 17 5 32 1.0 0.4 0.9 45,000 1 65,000
Madinat Zayed Rural 29,000 #NAME? 6,785 16 2 11 175 256 23 107 4.5 6.0 8.8 11,000 1 1 40,000
Ruwais Rural 16,000 #NAME? 1,270 4 1 3 50 100 7 14 2.5 3.1 6.3 114,000 1 130,000
Mirfa Rural 15,000 #NAME? 3,676 4 1 3 32 61 3 17 2.7 2.1 4.1 60,000 75,000
Ghayathi Rural 8,000 #NAME? 3,898 6 1 5 38 63 5 18 7.5 4.8 7.9 7,000 1 15,000
Sila'a Rural 5,000 #NAME? - 1 1 22 39 2 10 2.0 4.4 7.8 65,000 70,000
Delma Island Rural 5,000 #NAME? 2,139 1 1 23 25 2 10 2.0 4.6 5.0 5,000 1 10,000
Capacity Management
Demand & Supply Projections
Current and projected demand, by Episodes and beds
C17
Notes :Sub Acute beds include: Rehabilitation, Palliative care, Maintenance, Older Persons and Psychogeriatric care; ICU beds excludePaediatrics, NICU, CCU, etc. Acute Overnight beds exclude day case beds. Sub acute numbers of beds adjustedSource: TAHPI, Health Facility briefing system, reference data is based on data extracted from the Australian Institute of Health and Welfare,supplemented by data from the USA inpatient sample and UK Hospital Episode Statistics Online (HES)Assumptions Projected bed numbers from 2016 onwards are based on ‘International Average’ ALOS and 75% occupancy for ICU beds.
Population growth based on: Abu Dhabi Urban Planning Council 2030 Plan projections, ‘Advantaged’ socio-economic classand with life expectancy >77years. Expatriate utilisation increases from 45% of UAE National utilisation to 55% of UAENational utilisation. Sub acute number of beds adjusted to meet international benchmark
Bed Occupancy 2011 Actual 2016 2021 2026 2031Acute Overnight
Episodes122,345 184,102 223,539 276,589 332,040
Acute Overnight Beds Current (58%) 3,289 3,992 5,223 6,769 7,061
Intermediate (70%) 3,308 4,328 5,609 5,850
Target (85%) 2,724 3,564 4,619 4,818
Sub Acute Overnight
EpisodesN/A 3,216 4,233 5,461 6,738
Sub Acute Overnight
Beds224 342 438 449 525
ICU beds 146 175 209 245 281
Emergency Bays N/A 789 987 1,182 1,379

• To obtain an accurate picture of capacity balance in the Emirate, results from a detailed 2011 survey of 574 Clinicians were synthesised through interviews with Hospital Medical Directors and a number of quantitative sources including International Patient Care (IPC) data.
• Capacity Gaps Intensive and Critical Care medicine is the most severe capacity gap impacting healthcare services within Abu Dhabi. Severe capacity gaps also exist in Emergency care, Neonatology, Paediatric, Oncology, Orthopaedic, Rehabilitation and PsychiatryC10. Despite good growth over recent years in the number of clinicians licensed in the Emirate only modest increases have occurred in those specialties where shortages exist.
• Sub specialty gaps Paediatric and Paediatric surgery sub specialties, adult surgical sub specialties including Neurosurgery, Plastics, Surgical Oncology are all severely undersupplied in Abu DhabiC11.
• Health challenges. Growth in demand for healthcare services associated with the prevention and treatment of cancer, cardiovascular disease, diabetes, respiratory conditions, emergency medicine and neuropsychiatric conditions is expected to be particularly high. Growth in demand for outpatient services is generally anticipated to be greater than for inpatient servicesC46.
• Growth. The number of physicians and dentists licensed within the emirate has grown by 768 (13%)C10 since the end of 2011 continuing to ensure wider coverage across the range of specialties. The number of facilities offering healthcare has also grown to 1,5084. (11% increase on 2011 level)
• The private sector has been responsible for the largest proportion of growth in healthcare capacity, however this growth has been predominantly in areas such as general and internal medicine, dentistry and general surgeryC10. There has been little or no growth in the specialties where capacity gaps exist with the exception of Obstetrics & Gynecology and Paediatric where further capacity is also expected to be added by new and existing Providers in the futureC40,C41.
• Centralised and Regional services. In order to improve coverage, concentrate clinical expertise and improve quality and cost efficiency HAAD has designated a limited number of “Regional” services each serving a population of ~250,000 residents. For complex and highly specialised “Centralised” services HAAD has designated certain highly specialised services that will only be provided by 1 or 2 Abu Dhabi Providers to serve the whole Emirate. The detailed plans are included in pages C23 to C30.
• Improving capacity management through regulating clinical service lines. Since January 2013 HAAD has began licensing hospital providers clinical services at DRG level in order to reduce duplication of services, improve the coverage of capacity gaps both at a specialty and geographic level and to meet future demand. There is clear risk of oversupply within the Emirate. HAAD is developing measures including improved alignment of supply with demand.
• International Patient Care Programme. Over 9000 patients were treated abroad in 2012 indicating significant capacity gaps. Pages C11 to C18 detail the major capacity gaps.
C9
Current service balance

Note Gaps –Sub specialty gaps have been identified such as pediatric Cardio physiology, Pediatric Rheumatology and Hand Surgery by IPC data Medical Board, these gaps mainly reflect in small volume in Abu Dhabi and which are addressed via the IPC Program; Growth compares 2012 to 2011 Source Gap define by Analyzing IPC Gap; international benchmark using doctor per capita, bed censes analysis and regional DRG coverage, Planning analysis; Episodes: KEH; Physicians and Facilities: Licensing database.
As at 31 December 2012
C10
General Surgery 238
Neurosurgery 37
Plastic Surgery 41
Surgical Oncology 2
Traumatology 2
Vascular Surgery 8
Service capacity balance by specialty
Capacity Balance
Critical capacity gap
Severe capacity gap
No capacity gap
% private/public capacity
Growth - public private
Growth - public
General paediatrics 409
Paediatric cardiology 7
Paediatric Endo Crinology 8
Paediatrics gasterenterology 3
Paediatrics Infectious Disease 1
Paediatrics Intensive care 2
Paediatrics Nephrology 1
Paediatrics Neurology 4
Paediatrics Oncology 1
Paediatrics Pulmonology 2
Specialty Gaps Physicians/Dentists Growth Gro
wth
2
Facilities % P
riva
te2
Growth Pu
bli
c
Pri
vate
Pu
bli
c
Pri
vate
Intensive & Critical care medicine 37 6 9 -1 4 2 -3 2
Emergency medicine 107 18 18 14 4 -7 7
Neonatology 29 11 11 1 7 4 -4 5
Cardiology 79 -3 27 -3 2 -5 -2 -1
Psychiatry 62 5 17 10 5 4 6
Obstetrics & Gynecology 311 31 93 -24 7 24 -36 12
Pediatrics 438 29 103 -13 8 21 -23 10
Oncology 26 5 6 -2 4 1 1 -3
General surgery 328 47 75 -16 20 27 -18 2
Pediatric surgery 19 11 8 3 5
Internal Medicine 419 83 93 -2 29 54 -18 16
Physical medicine & Rehabilitation 21 -2 16 11 1 -3 6 5
Allergy & Immunology 4 1 4 3 1 1 2
Cardio-thoracic surgery 36 13 17 8 1 12 8
Orthopedics 166 31 56 9 4 27 -1 10
Family medicine 172 35 47 36 17 18 24 12
Radiology 180 18 69 21 -3 21 2 19
Neurology 29 4 16 11 1 3 3 8
Anesthesiology 258 28 50 -30 12 16 -37 7
Preventive medicine
Ophthalmology 152 21 63 16 -4 25 3 13
Infectious diseases 13 2 9 7 1 1 3 4
Dentistry 950 88 348 87 27 87 34 53
Urology 82 6 39 8 2 4 1 7
General medicine 1991 237 291 -154 155 82 -91 -63
Pulmonology 29 6 18 12 6 4 8
Pathology 157 14 85 40 14 3 37
Nephrology 30 -1 12 3 1 -2 3
Endocrinology 43 2 22 -1 3 4 -4
Dermatology 157 11 88 42 2 9 6 36
Gastroenterology 42 3 21 9 -2 5 4 5
Alternative therapies 34 2 24 2 1 2
Oral & Maxillofacial surgery 33 1 25 11 -1 2 2 9
Rheumatology 18 1 12 2 2 -1 2
Otolaryngology (ENT) 142 15 67 21 2 13 -1 10
Total 6,594 768 1862 79% 133
Appo

Capacity gaps by sub-specialty
C11
Notes: Sub-specialty gaps are subject to dynamic change; Sub-specialty gaps identified based on Medical Board referrals abroad for treatment (under International Patient Care, IPC)
Source IPC 2011 & 2012 Annual Statistics Report
2012 2011
Classification of Disease Reason for Sending Abroad Count of patients Count of patients2
Paediatric Ophthalmology Paediatric retina specialist NA 5 4
Paediatric Glaucoma specialist 2 2
paediatric cornea specialist 2
paediatric medical retina 1 1
Post eye inclination services specialist 1
specialized paediatric cornea 2
Paediatric Spinal surgery Paediatric spinal surgeon specialist 25 7
Paediatric Orthorpedic Surgery No Brachial plexus multidisplinary team 9 13
Hand Specialist 1
hand/upper arm deformities Specialist 1
Paediatric Orth-oncology Paediatric Ortho-oncology specialist 8 1
Neurology dystonia specialist 1
specialized neuromuscular disorder specialist 1 1
No Movement disorder specialist 1
Orthopedic Surgery foot and ankle 1
Hand Specialist 1
Ortho-oncology specialist (Sarcoma) 3 3
Paediatric Cardiology No Paediatric electrophysiology specialist 5 2
Paediatric Rheumatology Paediatric Rheumatology 5 5
Paediatric Pulmonology Cystic fibrosis multidisplinary well organized unit 1 1
Paediatric Neurology Neuromuscular disorder specialist 1
No muscle pathologist 1
Cardiology Congenital heart disease in adult Services NA 1
Metabolic Disease Expertise in the Metabolic field 1
Paediatric Ophthalmic Oncology Ophthalmic oncology Specialist 8 1
Ophthalmic Oncology Onco-Ophthalmology 4 1
Neurosurgery Neuro-Oncology specialist ,Neuro-Ophthalmic Specialist 3 1
Plastic Surgery Micro vascular plastic reconstruction 1
Facial Palsy plastic surgeon 1
Ear reconstruction plastic surgeon 2 1
Colrectal Surgery Required Pelvic Floor Expertise 1
Paediatric Vascular Surgery Specialized paediatric vascular centre 3 1
Ophthalmology No Glaucoma Specialist 2 2
94 58

Capacity gap, top medical board reason for sending patients abroad via International Patient Care (IPC) programme
C12
Note *Obstetric & Gynecology were showing high due to the numbers of patients/official family escort that were pregnant and approved while abroad for their pregnancy follow up/or delivery
Source HAAD- IPC 2012 statistic report, IPC Capacity Gap analysis- planning analysis
OncologyOrthopedic
SurgeryCardiology
Obestetric &Gynecology
Neurosurgery Plastic Surgery Spinal SurgeryPaediatric
CardiacSurgery
PaediatricOrthopeadic
SurgeryBMT follow up Neurology
GeneralSurgery
InfertilityBone Marrow
TransplantRehabilitation
Ophthalomology
2009 86 69 41 29 61 40 22 41 29 24 16 31 0 26 28 64
2010 102 70 44 42 41 38 38 31 30 28 27 26 26 25 33 49
2011 130 85 74 38 63 33 33 31 37 17 61 29 52 17 49 75
2012 128 66 39 57 67 51 64 32 40 8 33 20 22 7 34 63
0
20
40
60
80
100
120
140
Medical Board Top Reasons for Sending Abroad 2009-2012O
nco
log
y
Ort
ho
pe
dic
Su
rge
ry
Ca
rdio
log
y
Ob
est
etr
ic &
Gy
ne
colo
gy
Ne
uro
surg
ery
Pla
stic
Su
rge
ry
Sp
ina
l S
urg
ery
Pa
ed
iatr
ic
Ca
rdia
c S
urg
ery
Pa
ed
iatr
ic
Ort
ho
pe
ad
ic
Su
rge
ry
BM
T f
oll
ow
up
Ne
uro
log
y
Ge
ne
ral
Su
rge
ry
Infe
rtil
ity
Bo
ne
Ma
rro
w
Tra
nsp
lan
t
Re
ha
bil
ita
tio
n
Op
hth
alo
mo
log
y
2009 86 69 41 29 61 40 22 41 29 24 16 31 0 26 28 64
2010 102 70 44 42 41 38 38 31 30 28 27 26 26 25 33 49
2011 130 85 74 38 63 33 33 31 37 17 61 29 52 17 49 75
2012 128 66 39 57 67 51 64 32 40 8 33 20 22 7 34 63

IPC- capacity gap, top medical board reasons for sending Paediatric patients abroad
C13
0
5
10
15
20
25
30
35
40
45
Paed
iatr
ic O
ncol
ogy
Paed
iatr
ic O
rtho
pedi
c Su
rger
y
Paed
iatr
ic C
ardi
ac S
urge
ry
Paed
iatr
ic N
euro
logy
Paed
iatr
ic O
phth
alm
olog
y
Paed
iatr
ic G
astr
oent
erol
ogy
Paed
iatr
ic R
ehab
ilita
tion
Paed
iatr
ic P
ulm
onol
ogy
Paed
iatr
ic C
ardi
olog
y
Paed
iatr
ic O
ncol
ogy/
Hae
mat
olog
y
Paed
iatr
ic P
last
ic S
urge
ry
Paed
iatr
ic S
pine
Sur
gery
BMT
Paed
iatr
ic
Paed
iatr
ic H
eam
atol
ogy
Paed
iatr
ic G
ener
al S
urge
ry
Paed
iatr
ic N
euro
surg
ery
Paed
iatr
ic E
NT
Paed
iatr
ic U
rolo
gy
Paed
iatr
ic B
rach
ial P
lexu
s In
jury
Paed
iatr
ic B
MT
follo
w u
p
Paediatric MB Reason for Sending Abroad 2009 - 2012
2012
2011
2010
2009
Paediatric
Oncology
Paediatric
Orthopedic
Surgery
Paediatric
Cardiac
Surgery
Paediatric
Neurology
Paediatric
Ophthalmolo
gy
Paediatric
Gastroenterol
ogy
Paediatric
Rehabilitatio
n
Paediatric
Pulmonology
Paediatric
Cardiology
Paediatric
Oncology/Ha
ematology
Paediatric
Plastic
Surgery
Paediatric
Spine
Surgery
BMT
Paediatric
Paediatric
Heamatology
Paediatric
General
Surgery
Paediatric
Neurosurger
y
Paediatric
ENT
Paediatric
Urology
Paediatric
Brachial
Plexus Injury
Paediatric
BMT follow
up
2012 29 41 32 11 31 18 15 9 25 34 14 25 7 11 15 11 9 4 5 8
2011 40 37 29 26 21 18 18 17 17 16 15 14 12 11 9 8 8 7 7 6
2010 21 31 31 14 19 5 15 17 8 15 15 4 15 8 3 5 11 17
2009 16 28 41 2 15 4 19 18 16 5 16 4 12 8 3 10 15
Note Paediatric age is defined to be inclusive of ages from birth and up to 18 years old; this includes all new-borns, infants, children and young adults cared for in a facility
Source HAAD- IPC 2012 statistic report, IPC Capacity Gap analysis- planning analysis

0
50
100
150
200
250
300
350
400
450
Follow up previousTreatment Abroad
Limited Services/ServiceNot Available
complexity Emergency treatmentwhile abroad
Others
Classification of Reason of Sending Abroad -Medical Board 2012
IPC- capacity gap, medical board classified reasons for sending abroad
C14 Source IPC 2012 statistic report- Medical board sub reason for sending and approving treatment abroad.
C16 & C17
Classification Number of Patient
Follow up previous Treatment Abroad 450
Limited Services/Service Not Available 399
complexity 192
Emergency treatment while abroad 175
Others 41
Total of Cases Approved by Medical Board 1272

IPC- capacity gap, at service line level that could be addressed locally
C15
Note Gap based on selected criteria (Complexity, Services availability, high risk and second opinion), medical Board reason for sending abroad
Source HAAD- IPC 2012 statistic report, IPC Capacity Gap analysis- planning analysis
0 20 40 60 80 100 120
Oncology
Neurosurgery
Spine Surgery
Plastic Surgery
Orthopedic Surgery
Paediatric Orthorpedic Surgery
Paediatric Oncology/Haematology
Neurology
Ophthalmology
Paediatric Cardiac Surgery
Paediatric Ophthalmology
Paediatric Oncology
Paediatric Spine Surgery
Paediatric Cardiology
Obstetrics & Gynaecology
Cardiology
ENT
Infertility
Rehabilitation
Cardiac Surgery
Haematology
Paediatric Rehabilitation
Vascular Surgery
Gastroenterology
Urology
Paediatric Plastic Surgery
Paediatric Gastroenterology
Hepatology
Pulmonology
Donor
Paediatric Neurology
Paediatric Haematology
(blank)
General Surgery
Maxillo Facial Surgery
Nepherology
Paediatric
Paediatric Ophthalmic Oncology
Paediatric Urology
Paediatric BMT Follow up
Ortho-Oncology
Genetics
Paediatric Neurosurgery

IPC- capacity gap, categorised as “Services not available” breakdown by volume of patient treated abroad
C16 Source IPC 2012 statistic report- Medical board sub reason for sending ( Services Not available) and approving treatment abroad.
Classification of Disease Number of patientsPaediatric BMT Follow up 16Paediatric Ophthalmology 10Oncology 10Donor 10Neurosurgery 9Paediatric Rehabilitation 7Orthopedic Surgery 7Paediatric Bone Marrow transplant 7Paediatric Spine Surgery 6Neurology 6Rehabilitation 5Nepherology 5Paediatric Orthorpedic Surgery 5Paediatric Cardiology 5ENT 4Cardiology 4Bone Marrow transplant 3Ortho-Oncology 3Urology 3Spine Surgery 3Ophthalmology 3Cardiac Surgery 2Paediatric Pulmonology 2Plastic Surgery 2Infertility 2Paediatric Neurology 2Paediatric Oncology 2Haematology 2Fetal Medicine 1Paediatric Haematology 1Paediatric Gastroenterology 1Paediatric Neurosurgery 1Paediatric 1Vascular Surgery 1Ophthalmic Oncology 1Paediatric Ophthalmic Oncology 1Pulmonology 1Obstetrics & Gynaecology 1Paediatric Hepatology 1BMT Follow Up 1Cardiology 1Paediatric ENT 1Paediatric Brachial plexus injury 1Thoracic SurgeryPaediatric Vascular SurgeryPaediatric Plastic SurgeryGrand Total 167
0 5 10 15 20
Paediatric BMT Follow up
Paediatric Ophthalmology
Oncology
Donor
Neurosurgery
Paediatric Rehabilitation
Orthopedic Surgery
Paediatric Bone Marrow…
Paediatric Spine Surgery
Neurology
Rehabilitation
Nepherology
Paediatric Orthorpedic…
Paediatric Cardiology
ENT
Cardiology
Bone Marrow transplant
Ortho-Oncology
Urology
Spine Surgery
Ophthalmology
Cardiac Surgery
Paediatric Pulmonology
Plastic Surgery
Service Not Available 2012

IPC- capacity gap, Services not Available breakdown by volume of patient treated abroad and specified medical reason
C17 Source IPC 2012 statistic report- Medical board sub reason for sending ( Services Not available) and approving treatment abroad.
Classification Of Disease Reasons Number of patients
Paediatric BMT Follow up post BMT chimeric study 15
paediatriv BMT follow up 1
Oncology Autologus BMT 2
specilized center in neuromuscular disease 1
proton therapy beam 1
optic neuroma ttt 1
HIPEC SURGERY 1
reconstructive oral surgery 1
immune therapy 1
genetic test 1
(blank) 1
mitotane level and monitor 1
Donor Donor-BMT 5
donor 5
Paediatric Ophthalmology Paediatric Retina Specilisits NA 3
paediatric glucoma 1
retinoblastoma services 1
glucoma services 1
paediatric medical retina 1
Neuro-ophthalmology 1
glucoma fi ltration surgery/pediatric glucoma specil 1
paediatric cornea specialist 1
Neurosurgery gamma knife 4
sacral nerve stimulation 1
Interventional neuroradiological coil ing 1
DEEp Brain Stimulation 1
Brachial plexuses nerve root treatment 1
Facial nerve monitor during surgery 1
Paediatric Rehabilitation No intensive paediatric neuro rehab 6
(blank) 1
In-patient intensive rehabilitation 1
Orthopedic Surgery Allogft osteorhondral transplantaft 1
special prothesis 1
shoulder prothesis implementation 1
Musculoskletal pathology services 1
wrist arthrodesis 1
Radionuclear therapy for PVNS 1
rod lengthening 1
Paediatric Bone Marrow transplantBMT 7
Neurology specialized neuromuscular disorder 1
surgical epilepsy 1
specilized program 1
dystonia specialist 1
DEEp Brain Stimulation 1
Intersin (bladder neuromodulator device) 1
Rehabilitation No intensive paediatric neuro rehab 2
(blank) 1
Specilized spinal canal injury center 1
multidisplinary rehab team 1
specialized center for dystonia 1
Paediatric Spine Surgery VEPTR 3
VEPTR elongation 1
magnetic growth rod implanmtation 1
no intr operative neuromonotring 1
Paediatric Orthorpedic Surgery specilized center in conjenital anomalies 1
Brachial plexuses nerve root treatment 1
VEPTR elongation 1
Inter postion arthoplasty 1
No intensive paediatric neuro rehab 1
Classification Of Disease Reasons Number of patients
Paediatric Cardiology Paediatric cardioelectrophysiology 3
specilized pacemaker clinic 1
Pediatric resynchonization pacing 1
Nepherology non related donor 3
kidney transplant l iving donor 1
No living renal transplant 1
ENT laser tonsilectomy 1
laser stapedonotomy procedure 1
hypertonic oxygen therapy 1
laser cord removal 1
Cardiology valve baloon valvuplasty 1
Percutanous pulmonary vein ablation 1
Congenital Heart disease in Adult Specialist 1
Intra arterial DSA Technique & Embolization 1
Spine Surgery scolosis 1
VEPTR 1
spinal cord monitor during surgey 1
Ortho-Oncology Ortho-oncology services 2
Specilized muscluskletal oncology center 1
Ophthalmology artificial Iris 1
para plan vitrectomy-retinal detachement repair 1
Boston keratoprothesis 1
Paediatric Neurology neuromuscular disorder specialist 1
(blank) 1
no muscle pathologist/ specilized muscular center 1
Bone Marrow transplant BMT 3
Urology Artifical sphinter implantation for bladder incontinent 1
uretheral implementation 1
Penile prothesis 1
Plastic Surgery Ear reconstruction 2
Infertility spermatid injection-invitro sperm maturation 2
Cardiac Surgery minumun invasive surgery 1
Aortic aneurism ttt 1
Paediatric Pulmonology Lung Transplant 1
Cystic fibrosis multidisplinary well orgnized unit 1
Paediatric Oncology sarcoma treatment 1
Neuro-onclogy neuroblastoma 1
Haematology post BMT chimeric study 2
Paediatric EMG can not done on age below five 1
Thoracic Surgery (blank) 1
Paediatric ENT No intensive paediatric neuro rehab 1
Paediatric Neurosurgery Brachial plexuses nerve root treatment 1
Paediatric Haematology PGD HLA 1
Obstetrics & Gynaecology Shorkur procedure 1
Fetal Medicine Fetal intervension(vesico-anintric shunt-feto scopic laser ablation) 1
Paediatric Ophthalmic Oncologyretinoblastoma services 1
Paediatric Vascular Surgery (blank) 1
Cardiology laser extraction of pacemaker lead 1
Pulmonology bronchial thermoplasty 1
Vascular Surgery multidisplanary cutanous T cell lymphoma team 1
Paediatric Hepatology treatment of chronic hepatitis 1
Paediatric Plastic Surgery (blank) 1
Ophthalmic Oncology retinoblastoma services 1
Paediatric Gastroenterology paediatric mobility study 1
BMT Follow Up post BMT chimeric study 1
Paediatric Brachial plexus injury Brachial plexuses nerve root treatment 1

IPC- capacity gap, medical board reason for approving local (UAE) treatment not available in public hospitals
C18
Note This services normally dose not covered by insurance policy
Source IPC 2012 statistic report- Medical board reason for approving treatment locally
0
10
20
30
40
50
60
70
80
90
100O
phth
alm
olog
y
Spin
al S
urge
ry
Ort
hope
dic
Surg
ery
Infe
rtili
ty
Prot
hesi
s
paed
iatr
ic o
ptha
lom
olgy
paed
iatr
ic rh
emat
olog
y
PGD
Reha
bilit
atio
n
Inte
rnal
Med
icin
e
Paed
iatr
ic s
pine
sur
gery
paed
iatr
ic o
rtho
pedi
c
Han
d su
rger
y
Hep
atol
ogy
urol
ogy
Rhem
atol
ogy
gast
eren
tero
lgy
Den
tal t
reat
men
t
Onc
olog
y
Medical Board Reason for local treatment comparison 2011-2012
2012
2011
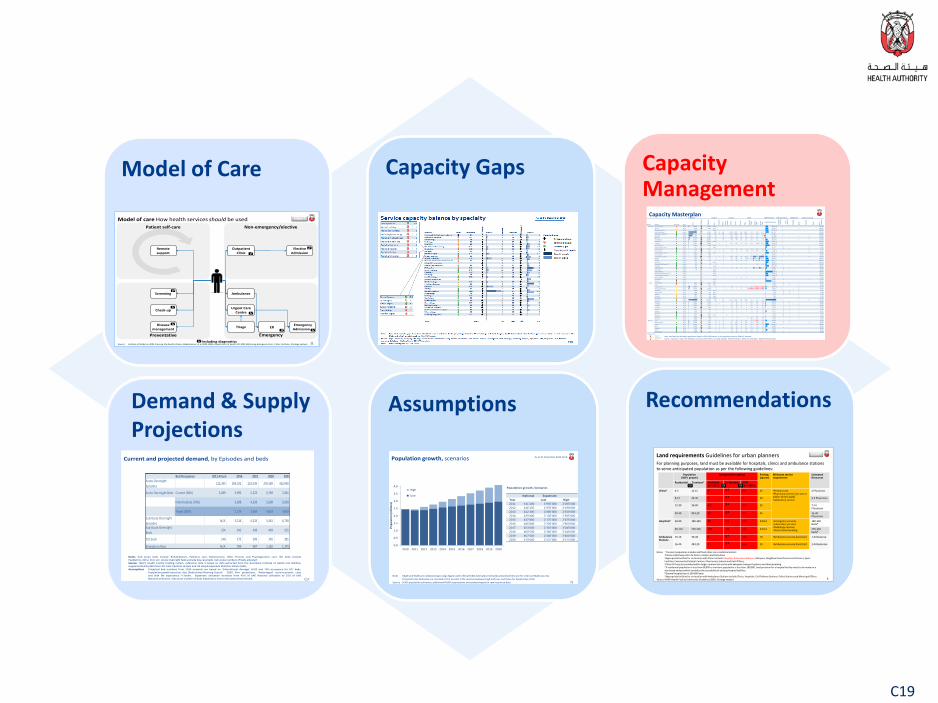
Model of Care Capacity Gaps
Assumptions Recommendations
DRAFT
Patient self-care
Model of care How health services should be used
Source Institute of Medicine 2001 Crossing the Quality Chasm, Bodenheimer et al 2002 JAMA, Department of Health UK 2001 Reforming Emergency Care, Picker Institute, Strategy analysis 11
Remote support
Preventative
Screening
Check-up
Disease management
Non-emergency/elective
Outpatient Clinic
Elective Admission
Emergency
Ambulance
Emergency Admission .
Triage
Urgent Care Centre
ER
Including diagnostics
Population growth, scenarios
Note HAAD and SCAD are collaborating to align figures with official SCAD estimates; Estimates presented here are for internal HAAD use only
Projections for Nationals are rounded to the nearest 2.5% variance between high and low, and those for Expatriates at 5%.
Source SCAD population estimates; additional HAAD assumptions and analysis based on raw insurance data` 73
As at 31 December 2010 Draft
Population growth, Scenarios
National Expatriate
Year Low High
2011 411'200 1'945'000 2'045'000
2012 416'150 1'970'000 2'190'000
2013 422'200 2'060'000 2'350'000
2014 429'400 2'130'000 2'505'000
2015 437'800 2'175'000 2'675'000
2016 445'800 2'250'000 2'850'000
2017 453'600 2'310'000 3'045'000
2018 460'500 2'360'000 3'240'000
2019 467'600 2'400'000 3'400'000
2020 473'600 2'475'000 3'575'000
0.0
0.5
1.0
1.5
2.0
2.5
3.0
3.5
4.0
2010 2011 2012 2013 2014 2015 2016 2017 2018 2019 2020
Po
pu
lati
on
(mill
ion
s)
High
Low
DRAFT
For planning purposes, land must be available for hospitals, clinics and ambulance stations to serve anticipated population as per the following guidelines:
Land requirements Guidelines for urban planners
Notes 1Transient population includes staff and other non-residential visitors 2Clinics collectively refers to Clinics, Centers and Polyclinics3Appropriate facilities for co-location with Clinics include Hospitals, Ambulance Stations, Mosques, Neighbourhood Commercial Centres, Sport Facilities, Community/Cultural Centres, Pharmacies, Schools and Post Offices, 4Clinic GFA may be provided within larger commercial centre with adequate transport options and shared parking5 If residential population is less than 60,000 or transient population is less than 180,000, land provision for a hospital facility needs to be made on a site-based analysis which considers the accesibility of existing hospital facilities6Optimal hospital size is 200-600 beds7Appropriate facilities for co-location with Ambulance Stations include Clinics, Hospitals, Civil Defense Stations, Police Stations and Municipal Offices
Source HAAD Health Facility Community Guidelines 2009, Strategy analysis 5
Population (000’s people)
Land provision options Parking(spaces)
Minimum service requirement
Estimated Resources
Residential Transient1 Land area(m2 000’s)
Co-location GFA4
(m2 000’s)
Clinics2 4-5 12-15 6 ? 3 2.5 25 •Primary care•Pharmacy services (on-site or within 10 min walk)•Laboratory service
2 Physicians
8-12 24-36 7 ? 3 3 30 4-6 Physicians
12-30 36-90 8.5 ? 3 3.5 35 7-14 Physicians
30-40 90-120 12 ? 3 4.5 45 15-20 Physicians
Hospitals5 60-80 180-240 80 n/a n/a 3/bed •Emergency services•Laboratory services•Radiology services•Stand-alone building
180-240 Beds6
90-110 270-330 100 n/a n/a 3/bed 270-330 beds6
Ambulance Stations
10-16 30-48 3 ? 7 n/a 10 •Ambulance service (land /air) 1 Ambulance
16-40 48-120 4 ? 7 n/a 15 •Ambulance service (land /air) 2 Ambulances
OR OR OR
C19
Demand & Supply Projections
Current and projected demand, by Episodes and beds
C17
Notes :Sub Acute beds include: Rehabilitation, Palliative care, Maintenance, Older Persons and Psychogeriatric care; ICU beds excludePaediatrics, NICU, CCU, etc. Acute Overnight beds exclude day case beds. Sub acute numbers of beds adjustedSource: TAHPI, Health Facility briefing system, reference data is based on data extracted from the Australian Institute of Health and Welfare,supplemented by data from the USA inpatient sample and UK Hospital Episode Statistics Online (HES)Assumptions Projected bed numbers from 2016 onwards are based on ‘International Average’ ALOS and 75% occupancy for ICU beds.
Population growth based on: Abu Dhabi Urban Planning Council 2030 Plan projections, ‘Advantaged’ socio-economic classand with life expectancy >77years. Expatriate utilisation increases from 45% of UAE National utilisation to 55% of UAENational utilisation. Sub acute number of beds adjusted to meet international benchmark
Bed Occupancy 2011 Actual 2016 2021 2026 2031Acute Overnight
Episodes122,345 184,102 223,539 276,589 332,040
Acute Overnight Beds Current (58%) 3,289 3,992 5,223 6,769 7,061
Intermediate (70%) 3,308 4,328 5,609 5,850
Target (85%) 2,724 3,564 4,619 4,818
Sub Acute Overnight
EpisodesN/A 3,216 4,233 5,461 6,738
Sub Acute Overnight
Beds224 342 438 449 525
ICU beds 146 175 209 245 281
Emergency Bays N/A 789 987 1,182 1,379
Capacity Management
Capacity Masterplan
Note: Abu Dhabi and Al Gharbia populations based on SCAD 2005 census. Al Ain population based on 2008 UPC estimate.
Source: Population: SCAD, UPC 2030 plans. Clinicians and Facilities: Licensing database. Planned Facilities ; SEHA, UPC 2030 plans, HAAD Planning analysis.
Capacity Gap
Severe
Moderate
None
Population Facilities Clinicians Ratios 2030 Plan growth 2030 requirements 2030 planned Projects under way
Region District Gap now Type Tota
l
% N
atio
nal
Nat
ion
als
Tota
l
Ho
spit
als
Cli
nic
s
Ne
arb
y
ho
spit
al
Do
cto
rs
Nu
rse
s
De
nti
sts
Oth
er
Fac
ilit
ies
/10
00
0
Do
cto
rs
/10
00
Nu
rse
s
/10
00
Population Growth
Ho
spit
als
req
uir
ed
Cli
nic
req
uir
ed
Ho
spit
als
Cli
nic
s
Ho
spit
als
Cli
nic
s
20
30
Po
pu
lati
on
Abu Dhabi Desert Villages Rural 28,480 #NAME? 10,963 None 81,520 1 110,000
Al Falah Rural 4,028 #NAME? 1,996 None 95,972 1 1 100,000
Ghantoot District Rural 2,478 #NAME? - None 97,522 1 100,000
Abu Dhabi Island Urban 313,809 #NAME? 44,004 229 13 182 2,529 3,878 430 1,284 6.2 8.1 12.4 111,191 425,000
CBD/Financial Centre Urban 174,625 #NAME? 14,141 124 5 86 1,131 1,663 241 539 5.2 6.5 9.5 15,375 1 190,000
Musaffah Urban 141,268 #NAME? 2,256 36 31 161 194 21 68 2.2 1.1 1.4 (41,268) 1 1 3 100,000
Bani Yas Rural 47,245 #NAME? 27,267 43 37 162 106 57 73 7.8 3.4 2.2 22,755 4 70,000
Al Shahama Rural 37,831 #NAME? 16,361 10 10 45 47 14 24 2.6 1.2 1.2 72,169 1 1 1 110,000
Shamkhah Rural 15,839 #NAME? 10,674 None 1 114,161 1 130,000
Al Rahba Rural 15,315 #NAME? 13,038 1 1 132 325 5 89 0.7 8.6 21.2 94,685 1 110,000
New Port City Rural 11,740 #NAME? 4,565 None 1 138,260 2 150,000
Capital District South Urban 9,247 #NAME? 33 None 1 45,753 1 1 55,000
Bain Al Jesrain Urban 7,694 #NAME? 4,927 3 3 33 42 10 17 3.9 4.3 5.5 17,306 1 1 25,000
Khalifa City A Urban 5,317 #NAME? 2,703 11 1 10 78 74 17 75 20.7 14.7 13.9 64,683 1 1 6 70,000
Grand Mosque District Urban 5,257 #NAME? 1,837 None 1 114,743 1 1 120,000
Inner Islands Urban 2,804 #NAME? 480 1 2 4 3.6 0.7 1.4 17,196 1 20,000
Capital District North Urban 2,371 #NAME? 2,121 2 1 1 426 792 36 302 8.4 179.7 334.0 67,629 1 3 70,000
Al Mina Urban 1,070 #NAME? 53 7 4 87 103 25 62 37.4 81.3 96.3 98,930 100,000
Al Raha Urban 827 #NAME? 397 2 1 1 41 42 9 12 49.6 50.8 119,173 1 120,000
Yas Island Urban 776 #NAME? 1 None 99,224 100,000
Mohamed Bin Zayed City Urban 328 #NAME? 95 2 2 1 2 4 2 3.0 6.1 49,672 1 1 4 50,000
Saadiyat Urban 122 #NAME? None 119,878 - 120,000
Airport District Urban 98 #NAME? 32 6 4 8 11 5 11 81.6 112.2 49,902 1 50,000
Lulu Island Urban 75 #NAME? None 19,925 1 20,000
Capital District Urban #NAME? None 240,000 2 240,000
Mohamed Bin Zayed Centre Urban #NAME? None 80,000 1 80,000
South Hudayriat Island Rural #NAME? None 100,000 1 100,000
Marina Village Urban #NAME? 3 2 1 3 6 5,000 5,000
Al Suwwah Urban #NAME? None 30,000 1 1 30,000
Al Reem Urban #NAME? None 200,000 200,000
Al Ain Umm Ghaffa Rural 8,851 #NAME? 5,873 None 3,049 1 1 11,900
Nahel Rural 5,196 #NAME? 2,377 None 4,804 1 1 10,000
Industrial City Rural 48,803 #NAME? 18 8 5 14 5 1 5 1.0 0.3 0.1 30,937 1 1 79,740
Al Salamat/Al Yaher Urban 37,544 #NAME? 23,400 1 1 1 3 1 6 0.3 0.1 0.0 36,456 1 1 2 74,000
Al Dhahra Rural 4,958 #NAME? 715 None 1,042 1 1 6,000
Abu Krayyah Rural 4,108 #NAME? 655 None 892 1 1 5,000
Al Saad Rural 3,829 #NAME? 702 None 1,171 1 1 5,000
Al Araad Rural 3,791 #NAME? 139 None 209 1 4,000
Abu Samra Rural 1,942 #NAME? 286 None 558 1 2,500
Al Ain City Urban 343,002 #NAME? 100,298 186 7 148 1,733 2,864 318 968 4.5 5.1 8.3 364,298 3 8 707,300
Al Quaa Rural 12,512 #NAME? 4,912 1 1 8 13 1 3 0.8 0.6 1.0 10,488 1 1 23,000
Al Wagan Rural 11,865 #NAME? 3,330 1 1 17 29 1 4 0.8 1.4 2.4 18,135 1 1 1 30,000
Al Hayer Rural 11,484 #NAME? 2,570 3 3 25 34 4 3 2.6 2.2 3.0 20,516 1 2 32,000
Al Dhaher Rural 10,641 #NAME? 7,325 1 1 13 20 3 4 0.9 1.2 1.9 3,709 1 1 14,350
Remah Rural 8,187 #NAME? 683 1 1 6 9 2 1.2 0.7 1.1 1,313 1 1 9,500
Sweihan Rural 7,880 #NAME? 713 1 1 8 11 1 1 1.3 1.0 1.4 32,120 1 2 40,000
Al Khazna Rural 7,350 #NAME? 1,071 2 2 4 13 1 2.7 0.5 1.8 1,650 1 1 9,000
Mezyad Rural 6,407 #NAME? 3,809 None 1 1,993 1 1 8,400
Al Shwaib Rural 3,260 #NAME? 1,546 1 1 3 4 3.1 0.9 1.2 2,240 1 1 5,500
Al Fagah Rural 2,089 #NAME? 378 1 1 3 3 4.8 1.4 1.4 1,411 1 3,500
Western Liwa Rural 20,000 #NAME? 661 5 1 1 8 17 5 32 1.0 0.4 0.9 45,000 1 65,000
Madinat Zayed Rural 29,000 #NAME? 6,785 16 2 11 175 256 23 107 4.5 6.0 8.8 11,000 1 1 40,000
Ruwais Rural 16,000 #NAME? 1,270 4 1 3 50 100 7 14 2.5 3.1 6.3 114,000 1 130,000
Mirfa Rural 15,000 #NAME? 3,676 4 1 3 32 61 3 17 2.7 2.1 4.1 60,000 75,000
Ghayathi Rural 8,000 #NAME? 3,898 6 1 5 38 63 5 18 7.5 4.8 7.9 7,000 1 15,000
Sila'a Rural 5,000 #NAME? - 1 1 22 39 2 10 2.0 4.4 7.8 65,000 70,000
Delma Island Rural 5,000 #NAME? 2,139 1 1 23 25 2 10 2.0 4.6 5.0 5,000 1 10,000

Planning for healthcare services
Source Abu Dhabi Urban Planning Council. http://www.upc.gov.ae/ C20
• Current capacity gaps. Geographic coverage in the urban parts of the Emirate is generally good. There are, however, severe capacity shortfalls in rural areas:
HAAD analysis (pages C30) shows that the Western region is poorly underserved at a regional specialty level. HAAD is addressing this issue through the alignment of HAAD licensing process with healthcare demand.
• Significant population growth. The Abu Dhabi Urban Planning Council (UPC) 2030 Plan envisages the population of Abu Dhabi Emirate doublingC22.
− In Abu Dhabi region Abu Dhabi Island and Musaffah population is expected to reduce over time, with aggressive growth ‘off island’ and in rural areas, e.g., Mohammed Bin Zayed, Capital District, Shamkha, and Al Reem Island populations are projected to grow by over 820,000 respectively. Growth in 17 of the 28 districts is projected to exceed 60,000 in each case. Population in the villages along the road stretching east from Bani Yas and west of Al Ain city is anticipated to grow to over 74,000 transforming it from a predominately rural area to an urban corridorC22.
− The Al Ain city population is projected to double by 2030 with more modest growth expected in the surrounding rural areasC22.
− Western region population is projected to almost double to over 378,000 with the biggest growth in Ruwais, Ghayathi, Mirfa, and LiwaC22.
During 2013/14 HAAD seeks to centrally procure for primary care facilities to serve these locations. In more remote rural areas innovation in delivering services is required, This might include the use of mobile and visiting clinics, and clinical staff on a visiting or rotational basis. In larger settlements of the Western region, the pre-existing hospitals will need to adapt and respond to changing and growing needs as the population grows so does the requirement for more specialised services to be available within the region.
Region Districts
Abu Dhabi Ghantoot
Desert Villages
Eastern Nahel
Umm Ghafa
Al Dhaher
Al Araad
Abu Karayyah
Abu samrah
Al Saad
Western Mirfa
Liwa
*Hmeen
*Brier

Planning for healthcare services
C21
Source Abu Dhabi Urban Planning Council. http://www.upc.gov.ae/
• Significant additional capacity is required to meet growth in demand for healthcare services as the population growsC45 and ages. In existing developed areas the emphasis is on growing existing facilities to facilitate specialization and scale. Future development plans should be focused on the areas where there is new residential and commercial development and planned population growth.
− Hospitals, clinics and emergency network. According to HAAD recommendations for allocation of land and service provisionC22 the 2030 projected populations may require a maximum of 16 new small-to-medium general hospitals and 56 (31 Large,11 Medium and 14 Small) new clinicsC22 to provide local access to the expanding communities. The actual number required will depend on many factors including the extent to which existing facilities expand or improve efficiency of services. The current ambulance service network will also need to expand to support populations in newly developed and remote areasC22.
− Clinical staff. Attracting and retaining qualified staff remains a challenge for healthcare services across the emirate, particularly in rural areas. It is estimated that by 2022 over 2000 additional doctors and over 5000 nurses will be required, if turnover remains high, this translates into 1,500 doctors and over 2000 nurses to be recruited annuallyC45. Clinical training and education of a world class standard must be established locally to build a sustainable healthcare workforce and service supply.
• The risk of potential oversupply of healthcare requires careful management. For example, Khalifa City A currently has 4 hospital projectsC22 under construction despite a projected 2030 population of ‘only’ 80,000C22. Similarly, Al Ain city has 15 provisional hospital projectsC22 with potential demand for only 3C22. In contrast to these examples, there are few health facility projects in rural areas of the emirateC22. HAAD will regulate to align planned supply with demand through below 3 recommendations
1) To control over-supply future land is to be allocated only via the UPC in accordance with planned residential developments and the healthcare needs as determined by HAAD planning. No new land to be issued by HAAD.
2) Upon review of projects with allocated land in already over-supplied locations HAAD to consider, on a case by case basis, reallocating existing land to the under-supplied locations as determined by HAAD Capacity Masterplan.
3) Pre-approval for highly specialised and regionally required services be obtained via HAAD planning section prior to issuance of preliminary licence for hospitals.
HAAD recommendations for urban planners and developers aim to ensure building of healthcare facilities occurs when and where demand exists, not years in anticipationC51.

Service capacity balance by location
Source Population: SCAD, 2010 Estimate, UPC 2030 plans. Clinicians and Facilities: Licensing database. Planned Facilities ; SEHA, UPC 2030 plans, HAAD Planning analysis. C22
Capacity Gap
Severe
Moderate
None
Supply
Undersupply/underserved
Potential over supply
L, M, S Clinic size, large, Medium, Small
Population Facilities Clinicians 2030 Plan growth
Region District Gap Now Type Tota
l
Tota
l
Hosp
itals
Clin
ics &
Cent
res
Nea
rby
hosp
ital
Doc
tors
/100
0
Population Growth
need
unde
r way
Und
er
Cons
truc
tion
need
unde
r way
Ambu
lanc
e
stat
ion
2030
Popu
latio
n
Abu Dhabi Desert Villages Rural 52,960 2 2 57,040 1L 1 110,000
Al Falah Rural 7,490 None 52,937 0 1M 1 1 60,427
Ghantoot District Rural 4,608 None 3,282 1M 1 7,890
Abu Dhabi Island Urban 583,543 229 14 182 4.3 (313,278) 5 4 270,265
CBD/Financial Centre Urban 324,723 124 5 86 3.5 667 1 1 1M 325,390
Musaffah Urban 262,695 36 1 31 0.6 (223,587) 4 2 39,108
Bani Yas Rural 87,854 43 37 1.8 (3,403) 4 0 1M 1 84,451
Al Shahama Rural 70,349 10 10 0.6 (8,339) 1 1 1 62,010
Shamkhah Rural 29,453 1 1 1 182,828 1 0 0 1 1 212,281
Al Rahba Rural 28,479 1 1 1 4.6 (11,304) 17,175
New Port City Rural 21,831 None 1 1,063 1L 1 22,894
Capital District South Urban 17,195 None 1 37,805 1 1L 1 55,000
Bain Al Jesrain Urban 14,307 3 3 2.3 28,991 1 1 1M 1 43,298
Khalifa City A Urban 9,887 11 2 10 7.9 70,113 1 8 4 1 80,000
Grand Mosque District Urban 9,776 None 1 32,418 1 1 1M 42,194
Inner Islands Urban 5,214 1 5,937 1M 1 11,151
Capital District North Urban 4,409 2 1 1 96.6 73,591 1 2 1 78,000
Al Mina Urban 1,990 7 4 43.7 64,553 1L 66,543
Al Raha Urban 1,538 2 1 26.7 103,161 1 0 1L 1 104,699
Yas Island Urban 1,443 None 67,292 0 1l 1 68,735
Mohamed Bin Zayed City Urban 610 2 2 1.6 287,390 2 3 0 1L 1 1 288,000
Saadiyat Urban 227 None 82,058 1 0 0 2L 1 82,285
Airport District Urban 182 6 4 43.9 64,303 1 0 0 1L 1 64,485
Lulu Island Urban 139 None 23,089 1M 1 23,228
Capital District Urban 2,238 None 267,868 2 0 1L 1 270,106
Mohamed Bin Zayed Centre Urban 5,969 None 74,031 1 0 80,000
South Hudayriat Island Rural 5,969 None 94,031 0 1L 100,000
Marina Village Urban 5,969 3 2 8,163 1S 14,132
Al Suwwah Urban 5,969 None 22,938 1 1 1 28,907
Al Reem Urban 5,969 None 163,919 2L 1 169,888
Al Ain Umm Ghaffa Rural 11,725 None 1,280 1S 1 13,005
Nahel Rural 6,883 None 3,117 1S 1 10,000
Industrial City Rural 64,649 8 5 0.21 (29,122) 35,527
Al Salamat/Al Yaher Urban 49,734 1 2 1 0.1 (32,460) 1 1 0 1 1 17,274
Al Dhahra Rural 6,568 None (1,032) 1S 5,536
Abu Krayyah Rural 5,442 None 715 1S 6,157
Al Saad Rural 5,072 None (1,380) 1S 3,692
Al Araad Rural 5,022 None (1,330) 1S 3,692
Abu Samra Rural 2,573 None (1,504) 1,069
Al Ain City Urban 454,374 186 9 158 3.8 252,926 3 15 4 2M 2 707,300
Al Quaa Rural 16,575 1 1 0.5 3,912 1M 1 20,487
Al Wagan Rural 15,718 1 1 1.1 10,050 1S 1 25,768
Al Hayer Rural 15,213 3 3 1.6 15,443 1M 1 1 30,656
Al Dhaher Rural 14,096 1 1 0.9 3,902 1M 1 17,998
Remah Rural 10,845 1 1 0.6 1,499 1S 12,344
Sweihan Rural 10,439 1 1 0.8 12,884 1L 1 1 23,323
Al Khazna Rural 9,737 2 2 0.4 100 1S 9,837
Mezyad Rural 8,487 None 1 2,861 1S 11,348
Al Shwaib Rural 4,319 1 1 0.7 336 1S 4,655
Al Fagah Rural 2,767 1 1 1.1 (552) 2,215
Western Liwa Rural 50,182 5 1 0.2 14,818 1L 1 65,000
Madinat Zayed Rural 72,764 16 1 11 2.4 (10,864) 2 0 1L 1 1 61,900
Ruwais Rural 40,146 4 1 3 1.2 65,854 1 1 1L 1 106,000
Mirfa Rural 37,637 4 1 3 0.9 37,363 1L 1 1 75,000
Ghayathi Rural 20,073 6 1 5 1.9 24,827 1 1 44,900
Sila'a Rural 12,546 1 1 1.8 4,954 1 1L 1 17,500
Delma Island Rural 12,546 1 1 1.8 (4,246) 1 8,300
4,223,025
Hospitals Clinics
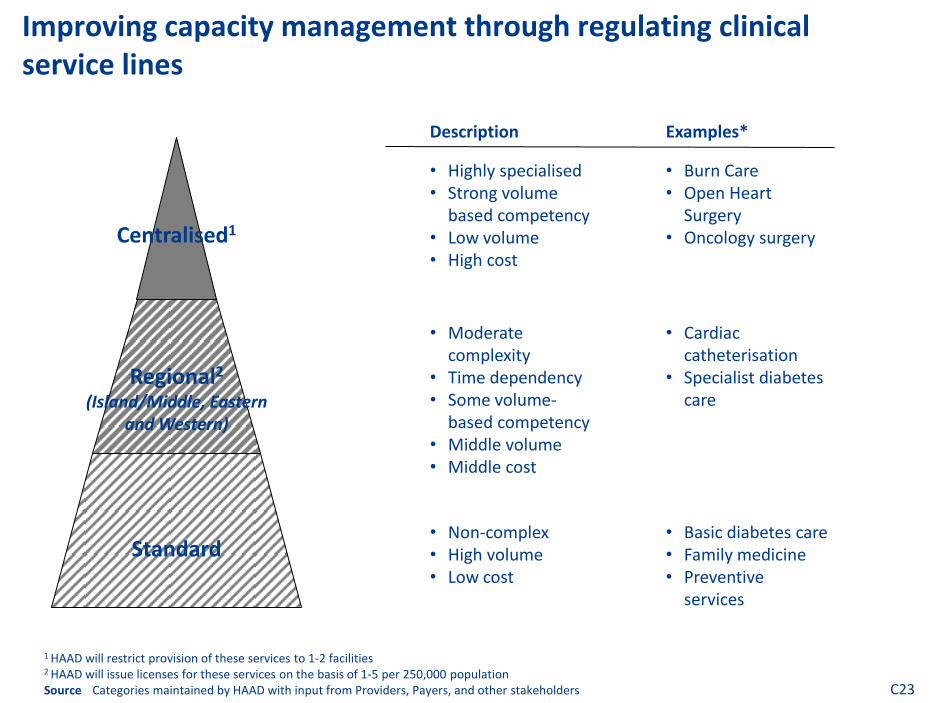
Improving capacity management through regulating clinical service lines
C23
• Moderate complexity
• Time dependency • Some volume-
based competency • Middle volume • Middle cost
• Non-complex • High volume • Low cost
• Highly specialised • Strong volume
based competency • Low volume • High cost
Description
• Cardiac catheterisation
• Specialist diabetes care
• Basic diabetes care • Family medicine • Preventive
services
• Burn Care • Open Heart
Surgery • Oncology surgery
Examples*
Centralised1
Regional2 (Island/Middle, Eastern
and Western)
Standard
1 HAAD will restrict provision of these services to 1-2 facilities 2 HAAD will issue licenses for these services on the basis of 1-5 per 250,000 population Source Categories maintained by HAAD with input from Providers, Payers, and other stakeholders

List of Abu Dhabi clinical service lines
For Planning and Licensing purposes HAAD will designate Centralised, Regional and Standard services at Diagnostic Resource Group level (DRG) level within the following 32 clinical service lines:
C24
Notes All stated services line encompassed all patient setting except LTC as this derived from IR-DRGs; Paediatric age is defined to be inclusive of ages
from birth and up to 18 years old; this includes all newborns, infants, children and young adults cared for in a facility. Source Categories maintained by HAAD with input from Providers, Payers, and other stakeholders. Same services line applied to paediatric DRGs with
exception of DRGs that not applicable to Paediatric categories
Burns Gynaecology Orthopaedic
Cardiology - Invasive Haematology Plastic surgery
Cardiology - Medical Immunology and infectious disease Psychiatry
Cardiothoracic surgery Neonatology Rehabilitation
Dentistry Nephrology Respiratory medicine
Dermatology Neurological surgery Rheumatology
Endocrinology Neurology Transplant surgery
ENT Obstetrics Trauma
Gastroenterology Obstetric - Delivery Urology
General medicine Oncology Vascular surgery
General surgery Ophthalmology

Centralised, Regional and Standard services, by % total Abu Dhabi DRG volumes
• Centralised services may only be provided by Providers designated by HAAD to do so (1-2 in Abu Dhabi)
• Regional services may only be offered by Providers designated by HAAD to do so (1-5 per Region, depending on demand and supply factors)
• Standard services may be offered by all HAAD Licensed Providers
• Note: Emergency cases presenting to any HAAD Licensed Facilities should be treated (in accordance with HAAD Regulations. In case the DRG falls under Centralised or Regional service line, the case should be transferred to Providers Licensed for those service lines when clinically appropriate.
C25
Notes Percentage figures are % by volume of all DRGs within each clinical service line; Details to be published on HAAD website (www.haad.ae)
1Trauma Service Line contains only 3 DRGs related to Head Trauma. Source Categories maintained by HAAD with input from Providers, Payers, and other stakeholders
# HAAD Service Line Centralised Regional Standard
1 Burns 99.5% 0.5% 0.0%
2 Cardiology - Invasive 5.3% 82.7% 12.0%
3 Cardiology - Medical 3.5% 44.9% 51.6%
4 Cardiothoracic surgery 100.0% 0.0% 0.0%
5 Dentistry 0.0% 0.0% 100.0%
6 Dermatology 0.0% 8.0% 92.0%
7 Endocrinology 0.5% 13.3% 86.2%
8 ENT surgery 0.5% 8.3% 91.3%
9 Gastroenterology 0.0% 1.0% 99.0%
10 General medicine 5.6% 26.6% 67.7%11 General surgery 1.2% 4.7% 94.0%
12 Gynaecology 0.2% 0.0% 99.8%
13 Haematology 3.5% 44.9% 51.6%
14 Immunology and infectious disease 0.4% 0.6% 99.0%
15 Neonatology 4.0% 13.1% 82.9%
16 Nephrology 0.0% 2.8% 97.2%
17 Neurological surgery 40.1% 4.5% 55.5%
18 Neurology 0.0% 34.4% 65.6%
19 Obstetrics 0.0% 13.3% 86.7%
20 Obstetric - Delivery 0.0% 0.0% 100.0%
21 Medical oncology 30.7% 69.3% 0.0%
22 Ophthalmology 0.0% 81.1% 18.9%
23 Orthopaedic 0.6% 13.3% 86.2%
24 Plastic surgery 0.0% 26.8% 73.1%
25 Psychiatric 0.0% 20.8% 79.2%
26 Rehabilitation 0.0% 100.0% 0.0%
27 Respiratory medicine 0.7% 7.9% 91.4%
28 Rheumatology 0.0% 39.6% 60.4%
29 Transplant surgery 100.0% 0.0% 0.0%
30 Trauma1
100.0% 0.0% 0.0%
31 Urology 0.4% 30.5% 69.1%32 Vascular surgery 32.5% 67.5% 0.0%

Centralised, Regional and Standard services, by % total Abu Dhabi DRG volumes (Paediatric)
• Centralised services may only be provided by Providers designated by HAAD to do so (1-2 in Abu Dhabi)
• Regional services may only be offered by Providers designated by HAAD to do so (1-5 per Region, depending on demand and supply factors)
• Standard services may be offered by all HAAD Licensed Providers
• Note: Emergency cases presenting to any HAAD Licensed Facilities should be treated (in accordance with HAAD Regulations. In case the DRG falls under Centralised or Regional service line, the case should be transferred to Providers Licensed for those service lines when clinically appropriate.
C26
Notes Percentage figures are % by volume of all DRGs within each clinical service line; Details to be published on HAAD website (www.haad.ae)
1Trauma Service Line contains only 3 DRGs related to Head Trauma; Paediatric age is defined to be inclusive of ages from birth and up to
18 years old; this includes all newborns, infants, children and young adults cared for in a facility Source Categories maintained by HAAD with input from Providers, Payers, and other stakeholders
# HAAD Paediatric Service Line Centralised Regional Standard
1 Paediatric Burns 96.60% 3.40% 0.00%
2 Gynecological Surg 24.10% 1.20% 72.29%
3 Neonatology 2.24% 2.78% 94.98%
4 Obstetrics 0.00% 0.00% 0.00%
5 Obstetrics/Delivery 0.00% 0.00% 0.00%
6 Paediatric Cardiology - Invasive 100.00% 0.00% 0.00%
7 Paediatric Cardiology - Medical 53.63% 27.02% 19.35%
8 Paediatric Cardiology - Open Heart Surgery 100.00% 0.00% 0.00%
9 Paediatric Dental 0.00% 0.00% 100.00%
10 Paediatric Dermatology 0.00% 47.67% 52.33%
11 Paediatric Endocrinology 0.04% 1.52% 98.43%
12 Paediatric ENT Surgery 0.51% 0.64% 98.86%
13 Paediatric Gastroenterology 0.60% 2.84% 96.55%
14 Paediatric General Medicine 6.86% 3.98% 89.16%
15 Paediatric General Surgery 0.45% 3.54% 96.01%
16 Paediatric Hematology 2.25% 49.16% 48.60%
17 Paediatric Infectious Disease 0.00% 0.00% 100.00%
18 Paediatric Nephrology 0.00% 7.41% 92.59%
19 Paediatric Neurological surgery 58.14% 39.53% 0.00%
20 Paediatric Neurology 0.00% 17.64% 82.36%
21 Paediatric Oncology 53.02% 46.78% 0.00%
22 Paediatric Ophthalmology 46.75% 0.00% 53.25%
23 Paediatric Orthopedic Surgery 2.55% 26.58% 70.87%
24 Paediatric Plastic Surgery 0.54% 31.64% 67.83%
25 Paediatric Rehabilitation 0.00% 100.00% 0.00%
26 Paediatric Respiratory 0.18% 0.38% 99.44%
27 Paediatric Rheumatology 0.00% 7.76% 92.24%
28 Paediatric Vascular Surgery 3.13% 96.88% 0.00%
29 Paeditric Urology 6.72% 49.89% 43.38%
30 Psychiatry 1.43% 95.71% 2.86%
31 Paediatric Transplant Surgery 100.00% 0.00% 0.00%
32 Paediatric Trauma 9.43% 11.32% 79.25%
Grand Total 2.88% 6.03% 90.71%

Paediatric DRGs coverage in Abu Dhabi Emirates
C27
Note Percentage figures are % by volume of all DRGs within each clinical service line; Details to be published on HAAD website (www.haad.ae); 1Trauma Service Line contains only 3 DRGs related to Head Trauma; Paediatric age is defined to be inclusive of ages from birth and up to 18 years old; this includes all newborns, infants, children and young adults cared for in a facility.
Source HAAD Strategy department, health statistics, planning analysis
# HAAD Paediatric Service Line
Count of
Total DRGs
Non
Available
Percent of
coverage
1 Paediatric Burns 9 0 100%
2 Gynecological Surg 27 16 41%
3 Neonatology 51 18 65%
4 Obstetrics 15 6 60%
5 Obstetrics/Delivery 12 5 58%
6 Paediatric Cardiology - Invasive 15 7 53%
7 Paediatric Cardiology - Medical 45 12 73%
8 Paediatric Cardiology - Open Heart Surgery 24 18 25%
9 Paediatric Dental 3 3 100%
10 Paediatric Dermatology 12 0 100%
11 Paediatric Endocrinology 15 4 73%
12 Paediatric ENT Surgery 33 5 85%
13 Paediatric Gastroenterology 30 3 90%
14 Paediatric General Medicine 24 2 92%
15 Paediatric General Surgery 48 12 75%
16 Paediatric Hematology 18 0 100%
17 Paediatric Infectious Disease 18 3 83%
18 Paediatric Nephrology 18 1 94%
19 Paediatric Neurological surgery 18 9 50%
20 Paediatric Neurology 42 10 76%
21 Paediatric Oncology 48 17 65%
22 Paediatric Ophthalmology 15 3 80%
23 Paediatric Orthopedic Surgery 69 22 68%
24 Paediatric Plastic Surgery 15 2 87%
25 Paediatric Rehabilitation 3 0 100%
26 Paediatric Respiratory 48 14 71%
27 Paediatric Rheumatology 12 0 100%
28 Paediatric Vascular Surgery 15 7 53%
29 Paeditric Urology 30 9 70%
30 Psychiatry 45 25 44%
31 Paediatric Transplant Surgery 9 9 0%
32 Paediatric Trauma 3 3 0%
Grand Total 789 239 70%
Capacity Gap
Severe
Moderate
None
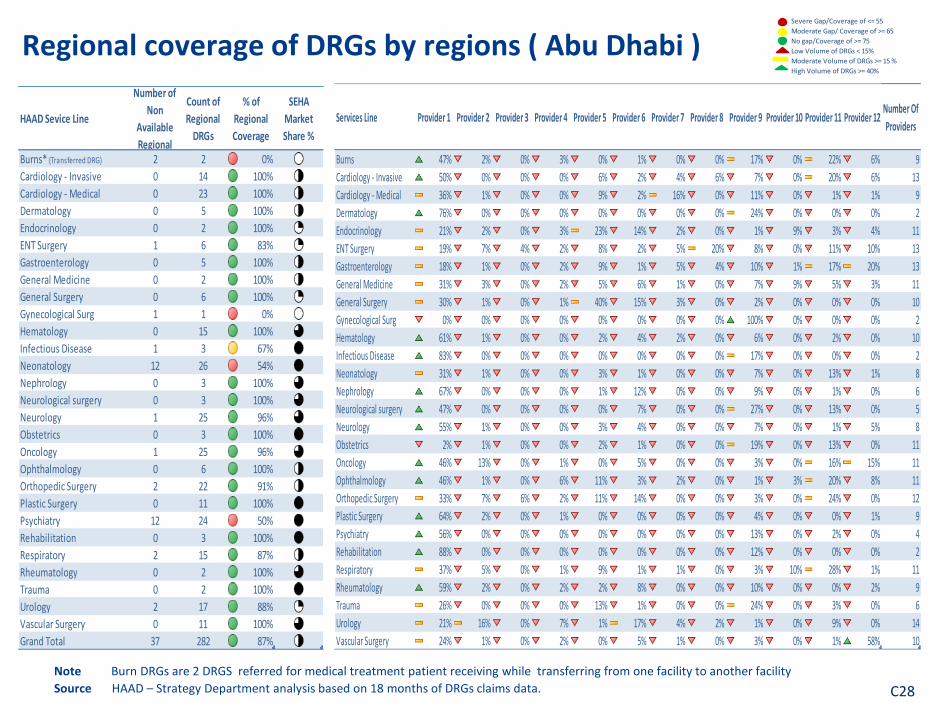
Regional coverage of DRGs by regions ( Abu Dhabi )
C28
Note Burn DRGs are 2 DRGS referred for medical treatment patient receiving while transferring from one facility to another facility
Source HAAD – Strategy Department analysis based on 18 months of DRGs claims data.
Services Line Provider 1 Provider 2 Provider 3 Provider 4 Provider 5 Provider 6 Provider 7 Provider 8 Provider 9 Provider 10 Provider 11 Provider 12Number Of
Providers
Burns 47% 2% 0% 3% 0% 1% 0% 0% 17% 0% 22% 6% 9
Cardiology - Invasive 50% 0% 0% 0% 6% 2% 4% 6% 7% 0% 20% 6% 13
Cardiology - Medical 36% 1% 0% 0% 9% 2% 16% 0% 11% 0% 1% 1% 9
Dermatology 76% 0% 0% 0% 0% 0% 0% 0% 24% 0% 0% 0% 2
Endocrinology 21% 2% 0% 3% 23% 14% 2% 0% 1% 9% 3% 4% 11
ENT Surgery 19% 7% 4% 2% 8% 2% 5% 20% 8% 0% 11% 10% 13
Gastroenterology 18% 1% 0% 2% 9% 1% 5% 4% 10% 1% 17% 20% 13
General Medicine 31% 3% 0% 2% 5% 6% 1% 0% 7% 9% 5% 3% 11
General Surgery 30% 1% 0% 1% 40% 15% 3% 0% 2% 0% 0% 0% 10
Gynecological Surg 0% 0% 0% 0% 0% 0% 0% 0% 100% 0% 0% 0% 2
Hematology 61% 1% 0% 0% 2% 4% 2% 0% 6% 0% 2% 0% 10
Infectious Disease 83% 0% 0% 0% 0% 0% 0% 0% 17% 0% 0% 0% 2
Neonatology 31% 1% 0% 0% 3% 1% 0% 0% 7% 0% 13% 1% 8
Nephrology 67% 0% 0% 0% 1% 12% 0% 0% 9% 0% 1% 0% 6
Neurological surgery 47% 0% 0% 0% 0% 7% 0% 0% 27% 0% 13% 0% 5
Neurology 55% 1% 0% 0% 3% 4% 0% 0% 7% 0% 1% 5% 8
Obstetrics 2% 1% 0% 0% 2% 1% 0% 0% 19% 0% 13% 0% 11
Oncology 46% 13% 0% 1% 0% 5% 0% 0% 3% 0% 16% 15% 11
Ophthalmology 46% 1% 0% 6% 11% 3% 2% 0% 1% 3% 20% 8% 11
Orthopedic Surgery 33% 7% 6% 2% 11% 14% 0% 0% 3% 0% 24% 0% 12
Plastic Surgery 64% 2% 0% 1% 0% 0% 0% 0% 4% 0% 0% 1% 9
Psychiatry 56% 0% 0% 0% 0% 0% 0% 0% 13% 0% 2% 0% 4
Rehabilitation 88% 0% 0% 0% 0% 0% 0% 0% 12% 0% 0% 0% 2
Respiratory 37% 5% 0% 1% 9% 1% 1% 0% 3% 10% 28% 1% 11
Rheumatology 59% 2% 0% 2% 2% 8% 0% 0% 10% 0% 0% 2% 9
Trauma 26% 0% 0% 0% 13% 1% 0% 0% 24% 0% 3% 0% 6
Urology 21% 16% 0% 7% 1% 17% 4% 2% 1% 0% 9% 0% 14
Vascular Surgery 24% 1% 0% 2% 0% 5% 1% 0% 3% 0% 1% 58% 10
Severe Gap/Coverage of <= 55
Moderate Gap/ Coverage of >= 65
No gap/Coverage of >= 75
Low Volume of DRGs < 15%
Moderate Volume of DRGs >= 15 %
High Volume of DRGs >= 40%
HAAD Sevice Line
Number of
Non
Available
Regional
Count of
Regional
DRGs
% of
Regional
Coverage
SEHA
Market
Share %
Burns* (Transferred DRG) 2 2 0%
Cardiology - Invasive 0 14 100%
Cardiology - Medical 0 23 100%
Dermatology 0 5 100%
Endocrinology 0 2 100%
ENT Surgery 1 6 83%
Gastroenterology 0 5 100%
General Medicine 0 2 100%
General Surgery 0 6 100%
Gynecological Surg 1 1 0%
Hematology 0 15 100%
Infectious Disease 1 3 67%
Neonatology 12 26 54%
Nephrology 0 3 100%
Neurological surgery 0 3 100%
Neurology 1 25 96%
Obstetrics 0 3 100%
Oncology 1 25 96%
Ophthalmology 0 6 100%
Orthopedic Surgery 2 22 91%
Plastic Surgery 0 11 100%
Psychiatry 12 24 50%
Rehabilitation 0 3 100%
Respiratory 2 15 87%
Rheumatology 0 2 100%
Trauma 0 2 100%
Urology 2 17 88%
Vascular Surgery 0 11 100%
Grand Total 37 282 87%

Regional coverage of DRGs by regions ( Eastern Region)
C29
Note Burn DRGs are 2 DRGS referred for medical treatment patient receiving while transferring from one facility to another facility
Source HAAD – Strategy department analysis based on 18 months of DRGs claims data.
Service Lines Provider 1 Provider 2 Provider 3 Provider 4 Provider 5 Provider 6Number of
Providers
Burns 0% 100% 0% 0% 0% 0% 1
Cardiology - Invasive 65% 1% 0% 10% 24% 0% 4
Cardiology - Medical 43% 43% 0% 6% 8% 1% 5
Dermatology 43% 48% 0% 0% 8% 1% 2
Endocrinology 33% 30% 0% 20% 16% 1% 5
ENT Surgery 14% 4% 2% 13% 59% 8% 6
Gastroenterology 31% 45% 0% 4% 6% 13% 5
General Medicine 37% 41% 0% 3% 14% 5% 5
General Surgery 47% 23% 0% 23% 6% 1% 5
Gynecological Surg 0% 0% 0% 0% 0% 0% 0
Hematology 52% 39% 0% 4% 4% 1% 5
Infectious Disease 92% 8% 0% 0% 0% 0% 2
Neonatology 74% 15% 0% 2% 3% 6% 5
Nephrology 89% 11% 0% 0% 0% 0% 2
Neurological surgery 25% 63% 0% 0% 13% 0% 3
Neurology 32% 54% 0% 4% 10% 1% 5
Obstetrics 42% 45% 2% 2% 1% 7% 5
Oncology 88% 10% 0% 0% 1% 0% 2
Ophthalmology 21% 55% 0% 15% 8% 0% 4
Orthopedic Surgery 36% 35% 0% 12% 16% 1% 4
Plastic Surgery 70% 7% 0% 0% 22% 0% 3
Psychiatry 15% 79% 0% 0% 3% 3% 4
Rehabilitation 0% 0% 0% 0% 0% 0% 0
Respiratory 65% 20% 0% 1% 8% 5% 5
Rheumatology 67% 24% 0% 2% 4% 2% 5
Trauma 53% 39% 0% 4% 3% 1% 5
Urology 33% 22% 5% 26% 9% 5% 6
Vascular Surgery 73% 16% 0% 2% 8% 1% 5
Grand Total 50% 30% 0% 8% 11% 2%
Severe Gap/Coverage of <= 55
Moderate Gap/ Coverage of >= 65
No gap/Coverage of >= 75
Low Volume of DRGs < 15%
Moderate Volume of DRGs >= 15 %
High Volume of DRGs >= 40%
HAAD Sevice Line
Number of
Non
Available
Regional
Count of
Regional
DRGs
% of
Regional
Coverage
SEHA
Market
Share %
Burns* (Transferred DRG) 1 2 50%
Cardiology - Invasive 6 14 57%
Cardiology - Medical 1 23 96%
Dermatology 0 5 100%
Endocrinology 0 2 100%
ENT Surgery 1 6 83%
Gastroenterology 0 5 100%
General Medicine 0 2 100%
General Surgery 1 6 83%
Gynecological Surg 1 1 0%
Hematology 0 15 100%
Infectious Disease 0 3 100%
Neonatology 10 26 62%
Nephrology 0 3 100%
Neurological surgery 1 3 67%
Neurology 2 25 92%
Obstetrics 0 3 100%
Oncology 0 25 100%
Ophthalmology 1 6 83%
Orthopedic Surgery 1 22 95%
Plastic Surgery 3 11 73%
Psychiatry 9 24 63%
Rehabilitation 3 3 0%
Respiratory 2 15 87%
Rheumatology 0 2 100%
Trauma 0 2 100%
Urology 1 17 94%
Vascular Surgery 2 11 82%
Grand Total 46 282 84%
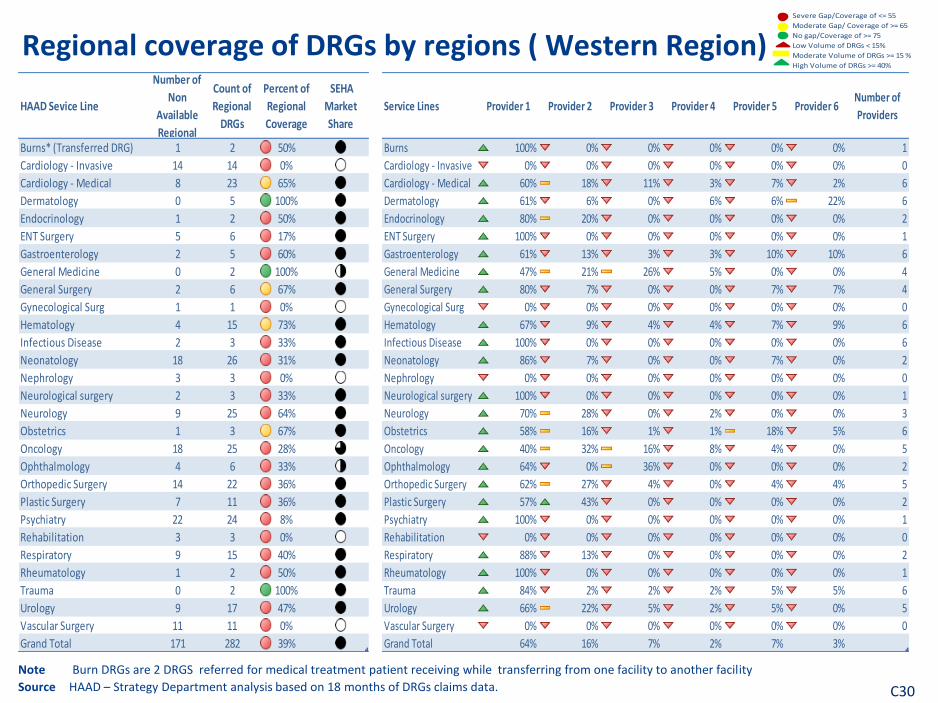
Regional coverage of DRGs by regions ( Western Region)
C30
Note Burn DRGs are 2 DRGS referred for medical treatment patient receiving while transferring from one facility to another facility
Source HAAD – Strategy Department analysis based on 18 months of DRGs claims data.
Service Lines Provider 1 Provider 2 Provider 3 Provider 4 Provider 5 Provider 6Number of
Providers
Burns 100% 0% 0% 0% 0% 0% 1
Cardiology - Invasive 0% 0% 0% 0% 0% 0% 0
Cardiology - Medical 60% 18% 11% 3% 7% 2% 6
Dermatology 61% 6% 0% 6% 6% 22% 6
Endocrinology 80% 20% 0% 0% 0% 0% 2
ENT Surgery 100% 0% 0% 0% 0% 0% 1
Gastroenterology 61% 13% 3% 3% 10% 10% 6
General Medicine 47% 21% 26% 5% 0% 0% 4
General Surgery 80% 7% 0% 0% 7% 7% 4
Gynecological Surg 0% 0% 0% 0% 0% 0% 0
Hematology 67% 9% 4% 4% 7% 9% 6
Infectious Disease 100% 0% 0% 0% 0% 0% 6
Neonatology 86% 7% 0% 0% 7% 0% 2
Nephrology 0% 0% 0% 0% 0% 0% 0
Neurological surgery 100% 0% 0% 0% 0% 0% 1
Neurology 70% 28% 0% 2% 0% 0% 3
Obstetrics 58% 16% 1% 1% 18% 5% 6
Oncology 40% 32% 16% 8% 4% 0% 5
Ophthalmology 64% 0% 36% 0% 0% 0% 2
Orthopedic Surgery 62% 27% 4% 0% 4% 4% 5
Plastic Surgery 57% 43% 0% 0% 0% 0% 2
Psychiatry 100% 0% 0% 0% 0% 0% 1
Rehabilitation 0% 0% 0% 0% 0% 0% 0
Respiratory 88% 13% 0% 0% 0% 0% 2
Rheumatology 100% 0% 0% 0% 0% 0% 1
Trauma 84% 2% 2% 2% 5% 5% 6
Urology 66% 22% 5% 2% 5% 0% 5
Vascular Surgery 0% 0% 0% 0% 0% 0% 0
Grand Total 64% 16% 7% 2% 7% 3%
Severe Gap/Coverage of <= 55
Moderate Gap/ Coverage of >= 65
No gap/Coverage of >= 75
Low Volume of DRGs < 15%
Moderate Volume of DRGs >= 15 %
High Volume of DRGs >= 40%
HAAD Sevice Line
Number of
Non
Available
Regional
Count of
Regional
DRGs
Percent of
Regional
Coverage
SEHA
Market
Share
Burns* (Transferred DRG) 1 2 50%
Cardiology - Invasive 14 14 0%
Cardiology - Medical 8 23 65%
Dermatology 0 5 100%
Endocrinology 1 2 50%
ENT Surgery 5 6 17%
Gastroenterology 2 5 60%
General Medicine 0 2 100%
General Surgery 2 6 67%
Gynecological Surg 1 1 0%
Hematology 4 15 73%
Infectious Disease 2 3 33%
Neonatology 18 26 31%
Nephrology 3 3 0%
Neurological surgery 2 3 33%
Neurology 9 25 64%
Obstetrics 1 3 67%
Oncology 18 25 28%
Ophthalmology 4 6 33%
Orthopedic Surgery 14 22 36%
Plastic Surgery 7 11 36%
Psychiatry 22 24 8%
Rehabilitation 3 3 0%
Respiratory 9 15 40%
Rheumatology 1 2 50%
Trauma 0 2 100%
Urology 9 17 47%
Vascular Surgery 11 11 0%
Grand Total 171 282 39%

Model of Care Capacity Gaps
Assumptions Recommendations
DRAFT
Patient self-care
Model of care How health services should be used
Source Institute of Medicine 2001 Crossing the Quality Chasm, Bodenheimer et al 2002 JAMA, Department of Health UK 2001 Reforming Emergency Care, Picker Institute, Strategy analysis 11
Remote support
Preventative
Screening
Check-up
Disease management
Non-emergency/elective
Outpatient Clinic
Elective Admission
Emergency
Ambulance
Emergency Admission .
Triage
Urgent Care Centre
ER
Including diagnostics
Population growth, scenarios
Note HAAD and SCAD are collaborating to align figures with official SCAD estimates; Estimates presented here are for internal HAAD use only
Projections for Nationals are rounded to the nearest 2.5% variance between high and low, and those for Expatriates at 5%.
Source SCAD population estimates; additional HAAD assumptions and analysis based on raw insurance data` 73
As at 31 December 2010 Draft
Population growth, Scenarios
National Expatriate
Year Low High
2011 411'200 1'945'000 2'045'000
2012 416'150 1'970'000 2'190'000
2013 422'200 2'060'000 2'350'000
2014 429'400 2'130'000 2'505'000
2015 437'800 2'175'000 2'675'000
2016 445'800 2'250'000 2'850'000
2017 453'600 2'310'000 3'045'000
2018 460'500 2'360'000 3'240'000
2019 467'600 2'400'000 3'400'000
2020 473'600 2'475'000 3'575'000
0.0
0.5
1.0
1.5
2.0
2.5
3.0
3.5
4.0
2010 2011 2012 2013 2014 2015 2016 2017 2018 2019 2020
Po
pu
lati
on
(mill
ion
s)
High
Low
DRAFT
For planning purposes, land must be available for hospitals, clinics and ambulance stations to serve anticipated population as per the following guidelines:
Land requirements Guidelines for urban planners
Notes 1Transient population includes staff and other non-residential visitors 2Clinics collectively refers to Clinics, Centers and Polyclinics3Appropriate facilities for co-location with Clinics include Hospitals, Ambulance Stations, Mosques, Neighbourhood Commercial Centres, Sport Facilities, Community/Cultural Centres, Pharmacies, Schools and Post Offices, 4Clinic GFA may be provided within larger commercial centre with adequate transport options and shared parking5 If residential population is less than 60,000 or transient population is less than 180,000, land provision for a hospital facility needs to be made on a site-based analysis which considers the accesibility of existing hospital facilities6Optimal hospital size is 200-600 beds7Appropriate facilities for co-location with Ambulance Stations include Clinics, Hospitals, Civil Defense Stations, Police Stations and Municipal Offices
Source HAAD Health Facility Community Guidelines 2009, Strategy analysis 5
Population (000’s people)
Land provision options Parking(spaces)
Minimum service requirement
Estimated Resources
Residential Transient1 Land area(m2 000’s)
Co-location GFA4
(m2 000’s)
Clinics2 4-5 12-15 6 ? 3 2.5 25 •Primary care•Pharmacy services (on-site or within 10 min walk)•Laboratory service
2 Physicians
8-12 24-36 7 ? 3 3 30 4-6 Physicians
12-30 36-90 8.5 ? 3 3.5 35 7-14 Physicians
30-40 90-120 12 ? 3 4.5 45 15-20 Physicians
Hospitals5 60-80 180-240 80 n/a n/a 3/bed •Emergency services•Laboratory services•Radiology services•Stand-alone building
180-240 Beds6
90-110 270-330 100 n/a n/a 3/bed 270-330 beds6
Ambulance Stations
10-16 30-48 3 ? 7 n/a 10 •Ambulance service (land /air) 1 Ambulance
16-40 48-120 4 ? 7 n/a 15 •Ambulance service (land /air) 2 Ambulances
OR OR OR
C31
Capacity Management
Capacity Masterplan
Note: Abu Dhabi and Al Gharbia populations based on SCAD 2005 census. Al Ain population based on 2008 UPC estimate.
Source: Population: SCAD, UPC 2030 plans. Clinicians and Facilities: Licensing database. Planned Facilities ; SEHA, UPC 2030 plans, HAAD Planning analysis.
Capacity Gap
Severe
Moderate
None
Population Facilities Clinicians Ratios 2030 Plan growth 2030 requirements 2030 planned Projects under way
Region District Gap now Type Tota
l
% N
atio
nal
Nat
ion
als
Tota
l
Ho
spit
als
Cli
nic
s
Ne
arb
y
ho
spit
al
Do
cto
rs
Nu
rse
s
De
nti
sts
Oth
er
Fac
ilit
ies
/10
00
0
Do
cto
rs
/10
00
Nu
rse
s
/10
00
Population Growth
Ho
spit
als
req
uir
ed
Cli
nic
req
uir
ed
Ho
spit
als
Cli
nic
s
Ho
spit
als
Cli
nic
s
20
30
Po
pu
lati
on
Abu Dhabi Desert Villages Rural 28,480 #NAME? 10,963 None 81,520 1 110,000
Al Falah Rural 4,028 #NAME? 1,996 None 95,972 1 1 100,000
Ghantoot District Rural 2,478 #NAME? - None 97,522 1 100,000
Abu Dhabi Island Urban 313,809 #NAME? 44,004 229 13 182 2,529 3,878 430 1,284 6.2 8.1 12.4 111,191 425,000
CBD/Financial Centre Urban 174,625 #NAME? 14,141 124 5 86 1,131 1,663 241 539 5.2 6.5 9.5 15,375 1 190,000
Musaffah Urban 141,268 #NAME? 2,256 36 31 161 194 21 68 2.2 1.1 1.4 (41,268) 1 1 3 100,000
Bani Yas Rural 47,245 #NAME? 27,267 43 37 162 106 57 73 7.8 3.4 2.2 22,755 4 70,000
Al Shahama Rural 37,831 #NAME? 16,361 10 10 45 47 14 24 2.6 1.2 1.2 72,169 1 1 1 110,000
Shamkhah Rural 15,839 #NAME? 10,674 None 1 114,161 1 130,000
Al Rahba Rural 15,315 #NAME? 13,038 1 1 132 325 5 89 0.7 8.6 21.2 94,685 1 110,000
New Port City Rural 11,740 #NAME? 4,565 None 1 138,260 2 150,000
Capital District South Urban 9,247 #NAME? 33 None 1 45,753 1 1 55,000
Bain Al Jesrain Urban 7,694 #NAME? 4,927 3 3 33 42 10 17 3.9 4.3 5.5 17,306 1 1 25,000
Khalifa City A Urban 5,317 #NAME? 2,703 11 1 10 78 74 17 75 20.7 14.7 13.9 64,683 1 1 6 70,000
Grand Mosque District Urban 5,257 #NAME? 1,837 None 1 114,743 1 1 120,000
Inner Islands Urban 2,804 #NAME? 480 1 2 4 3.6 0.7 1.4 17,196 1 20,000
Capital District North Urban 2,371 #NAME? 2,121 2 1 1 426 792 36 302 8.4 179.7 334.0 67,629 1 3 70,000
Al Mina Urban 1,070 #NAME? 53 7 4 87 103 25 62 37.4 81.3 96.3 98,930 100,000
Al Raha Urban 827 #NAME? 397 2 1 1 41 42 9 12 49.6 50.8 119,173 1 120,000
Yas Island Urban 776 #NAME? 1 None 99,224 100,000
Mohamed Bin Zayed City Urban 328 #NAME? 95 2 2 1 2 4 2 3.0 6.1 49,672 1 1 4 50,000
Saadiyat Urban 122 #NAME? None 119,878 - 120,000
Airport District Urban 98 #NAME? 32 6 4 8 11 5 11 81.6 112.2 49,902 1 50,000
Lulu Island Urban 75 #NAME? None 19,925 1 20,000
Capital District Urban #NAME? None 240,000 2 240,000
Mohamed Bin Zayed Centre Urban #NAME? None 80,000 1 80,000
South Hudayriat Island Rural #NAME? None 100,000 1 100,000
Marina Village Urban #NAME? 3 2 1 3 6 5,000 5,000
Al Suwwah Urban #NAME? None 30,000 1 1 30,000
Al Reem Urban #NAME? None 200,000 200,000
Al Ain Umm Ghaffa Rural 8,851 #NAME? 5,873 None 3,049 1 1 11,900
Nahel Rural 5,196 #NAME? 2,377 None 4,804 1 1 10,000
Industrial City Rural 48,803 #NAME? 18 8 5 14 5 1 5 1.0 0.3 0.1 30,937 1 1 79,740
Al Salamat/Al Yaher Urban 37,544 #NAME? 23,400 1 1 1 3 1 6 0.3 0.1 0.0 36,456 1 1 2 74,000
Al Dhahra Rural 4,958 #NAME? 715 None 1,042 1 1 6,000
Abu Krayyah Rural 4,108 #NAME? 655 None 892 1 1 5,000
Al Saad Rural 3,829 #NAME? 702 None 1,171 1 1 5,000
Al Araad Rural 3,791 #NAME? 139 None 209 1 4,000
Abu Samra Rural 1,942 #NAME? 286 None 558 1 2,500
Al Ain City Urban 343,002 #NAME? 100,298 186 7 148 1,733 2,864 318 968 4.5 5.1 8.3 364,298 3 8 707,300
Al Quaa Rural 12,512 #NAME? 4,912 1 1 8 13 1 3 0.8 0.6 1.0 10,488 1 1 23,000
Al Wagan Rural 11,865 #NAME? 3,330 1 1 17 29 1 4 0.8 1.4 2.4 18,135 1 1 1 30,000
Al Hayer Rural 11,484 #NAME? 2,570 3 3 25 34 4 3 2.6 2.2 3.0 20,516 1 2 32,000
Al Dhaher Rural 10,641 #NAME? 7,325 1 1 13 20 3 4 0.9 1.2 1.9 3,709 1 1 14,350
Remah Rural 8,187 #NAME? 683 1 1 6 9 2 1.2 0.7 1.1 1,313 1 1 9,500
Sweihan Rural 7,880 #NAME? 713 1 1 8 11 1 1 1.3 1.0 1.4 32,120 1 2 40,000
Al Khazna Rural 7,350 #NAME? 1,071 2 2 4 13 1 2.7 0.5 1.8 1,650 1 1 9,000
Mezyad Rural 6,407 #NAME? 3,809 None 1 1,993 1 1 8,400
Al Shwaib Rural 3,260 #NAME? 1,546 1 1 3 4 3.1 0.9 1.2 2,240 1 1 5,500
Al Fagah Rural 2,089 #NAME? 378 1 1 3 3 4.8 1.4 1.4 1,411 1 3,500
Western Liwa Rural 20,000 #NAME? 661 5 1 1 8 17 5 32 1.0 0.4 0.9 45,000 1 65,000
Madinat Zayed Rural 29,000 #NAME? 6,785 16 2 11 175 256 23 107 4.5 6.0 8.8 11,000 1 1 40,000
Ruwais Rural 16,000 #NAME? 1,270 4 1 3 50 100 7 14 2.5 3.1 6.3 114,000 1 130,000
Mirfa Rural 15,000 #NAME? 3,676 4 1 3 32 61 3 17 2.7 2.1 4.1 60,000 75,000
Ghayathi Rural 8,000 #NAME? 3,898 6 1 5 38 63 5 18 7.5 4.8 7.9 7,000 1 15,000
Sila'a Rural 5,000 #NAME? - 1 1 22 39 2 10 2.0 4.4 7.8 65,000 70,000
Delma Island Rural 5,000 #NAME? 2,139 1 1 23 25 2 10 2.0 4.6 5.0 5,000 1 10,000
Demand & Supply Projections
Current and projected demand, by Episodes and beds
C17
Notes :Sub Acute beds include: Rehabilitation, Palliative care, Maintenance, Older Persons and Psychogeriatric care; ICU beds excludePaediatrics, NICU, CCU, etc. Acute Overnight beds exclude day case beds. Sub acute numbers of beds adjustedSource: TAHPI, Health Facility briefing system, reference data is based on data extracted from the Australian Institute of Health and Welfare,supplemented by data from the USA inpatient sample and UK Hospital Episode Statistics Online (HES)Assumptions Projected bed numbers from 2016 onwards are based on ‘International Average’ ALOS and 75% occupancy for ICU beds.
Population growth based on: Abu Dhabi Urban Planning Council 2030 Plan projections, ‘Advantaged’ socio-economic classand with life expectancy >77years. Expatriate utilisation increases from 45% of UAE National utilisation to 55% of UAENational utilisation. Sub acute number of beds adjusted to meet international benchmark
Bed Occupancy 2011 Actual 2016 2021 2026 2031Acute Overnight
Episodes122,345 184,102 223,539 276,589 332,040
Acute Overnight Beds Current (58%) 3,289 3,992 5,223 6,769 7,061
Intermediate (70%) 3,308 4,328 5,609 5,850
Target (85%) 2,724 3,564 4,619 4,818
Sub Acute Overnight
EpisodesN/A 3,216 4,233 5,461 6,738
Sub Acute Overnight
Beds224 342 438 449 525
ICU beds 146 175 209 245 281
Emergency Bays N/A 789 987 1,182 1,379

Out patient current capacity and projected demand
C32
Assumption Out patient CAGR used 3.8
Gaps International benchmark using doctor per capita, Growth rate , and by Analyzing IPC Gap;
Note Growth compares 2012 to 2011. Figure are presented in encounters
Source HAAD, Planning analysis; Episodes: DRG Grouper-2012 and Physicians and Facilities: Licensing database.
Servise Line GAPCurrent
Demand 2012Growth
Growth
from 2011
Number of
Liscensed
Physcian
for that
services
line
Hospital
Provider
(Non SEHA
/ SEHA)
Current
Clinics-
centers (
NON SEHA /
SEHA
2016 2021 2026 2031
Burn 3 109 43.42% 43.42% 41 62.50% 78.57% 126 149 178 212
Cardiology - Invasive 3 1038 -3.80% -3.80% 79 72.22% 70.00% 1196 1423 1693 2015
Cardiology - Medical 3 112640 2.10% 2.10% 79 74.29% 83.97% 129761 154416 183755 218668
Dentistery 3 632704 -0.82% -0.82% 951 73.53% 89.04% 728875 867361 1032160 1228270
Dermatology 3 4000 49.87% 49.87% 157 70.00% 62.26% 4608 5484 6525 7765
Endocrinology 3 31816 20.54% 20.54% 43 68.97% 73.21% 36652 43616 51903 61765
ENT Surgery 3 114442 -2.61% -2.61% 107 74.29% 79.29% 131837 156886 186695 222167
Gastroenterology 3 866037 5.21% 5.21% 42 75.00% 85.11% 997675 1187233 1412807 1681240
General Medicine 3 8982653 -2.95% -2.95% 2956 75.00% 89.43% 10348016 12314139 14653826 17438053
General Surgery 3 751324 14.79% 14.79% 300 74.29% 84.74% 865525 1029975 1225670 1458548
Gynecology 3 199970 -5.87% -5.87% 14 75.76% 76.79% 230365 274135 326220 388202
Hematology 3 194712 -4.30% -4.30% 7 75.00% 84.98% 224308 266927 317643 377995
Infectious Disease 3 6575 17.94% 17.94% 3 70.97% 78.02% 7574 9014 10726 12764
Neonatology 3 5405 65.29% 65.29% 29 71.88% 78.07% 6227 7410 8817 10493
Nephrology 3 6021 -77.02% -77.02% 30 66.67% 69.77% 6936 8254 9822 11689
Neurology 3 50204 -4.37% -4.37% 29 74.29% 80.45% 57835 68824 81900 97461
Neurosurgery 1 2495 26.52% 26.52% 37 72.41% 71.05% 2874 3420 4070 4844
Obestetric 3 330524 19.59% 19.59% 311 72.73% 81.86% 380764 453109 539199 641647
Obstetrics Delivery 3 17489 24.23% 24.23% 311 75.00% 74.76% 20147 23975 28531 33951
Oncology 1 37428 -7.97% -7.97% 26 74.07% 69.33% 43117 51309 61058 72659
Ophthalmology 2 94467 14.97% 14.97% 152 73.53% 76.92% 108826 129503 154108 183389
Orthopedic Surgery 1 127399 -2.52% -2.52% 161 75.00% 85.92% 146764 174649 207832 247320
Plastic Surgery 3 94253 -13.23% -13.23% 41 75.00% 85.48% 108579 129210 153759 182974
Psychiatry 3 125084 -8.32% -8.32% 62 74.29% 84.15% 144097 171475 204055 242826
Rehabilitation 3 241422 -16.54% -16.54% 16 72.73% 70.75% 278118 330961 393843 468673
Respiratory 3 300359 10.70% 10.70% 29 74.29% 85.54% 346014 411756 489990 583088
Rheumatology 2 239 43.11% 43.11% 18 62.50% 100.00% 275 328 390 464
Trauma 3 111 6.73% 6.73% 5 57.14% 80.00% 128 152 181 215
Urology 3 159703 -7.32% -7.32% 82 74.29% 85.55% 183978 218934 260531 310032
Vascular Surgery 1 9972 7.16% 7.16% 5 74.07% 68.29% 11488 13670 16268 19359
Total 13502597 72.80% 82.96% 15554992 18510440 22027424 26212634
Demand Demand Projection
Capacity Gap
Severe
Moderate
None

Inpatient current and projected demand, by Episodes and beds
C33
Assumptions Projected bed numbers from 2016 onwards are based on ‘International Average’ ALOS and 75% occupancy for ICU beds. Population growth based on: Abu Dhabi Urban Planning Council 2030 Plan projections, ‘Advantaged’ socio-economic class and with life expectancy >77years. Expatriate utilisation increases from 45% of UAE National utilisation to 55% of UAE National utilisation. Sub acute number of beds adjusted to meet international benchmark Notes Sub Acute beds include: Rehabilitation, Palliative care, Maintenance, Older Persons and Psychogeriatric care; ICU beds exclude
Paediatrics, NICU, CCU, etc. Acute Overnight beds exclude day case beds. Sub acute numbers of beds adjusted Source: TAHPI, Health Facility briefing system, reference data is based on data extracted from the Australian Institute of Health and Welfare,
supplemented by data from the USA inpatient sample and UK Hospital Episode Statistics Online (HES)
Bed Occupancy 2011 Actual 2016 2021 2026 2031Acute Overnight
Episodes122,345 184,102 223,539 276,589 332,040
Acute Overnight Beds Current (58%) 3,289 3,992 5,223 6,769 7,061
Intermediate (70%) 3,308 4,328 5,609 5,850
Target (85%) 2,724 3,564 4,619 4,818
Sub Acute Overnight
EpisodesN/A 3,216 4,233 5,461 6,738
Sub Acute Overnight
Beds224 342 438 449 525
ICU beds 146 175 209 245 281
Emergency Bays N/A 789 987 1,182 1,379

Inpatient current and projected demand, by Episodes and beds V.s current and projected supply
C34
Demand Assumptions Projected bed numbers from 2016 onwards are based on ‘International Average’ ALOS and 75% occupancy for ICU beds. Population growth based on: Abu Dhabi Urban Planning Council 2030 Plan projections, ‘Advantaged’ socio-economic class and with life expectancy >77years. Expatriate utilisation increases from 45% of UAE National utilisation to 55% of UAE National utilization. Sub acute number of beds adjusted to meet international benchmark.
Supply Private provider bed projection based on preliminary license with more than 50% construction completion(HFL data base) and held a completion date, SEHA beds projection for 2030 for Al Ain & Mafraq hospitals, SEHA plan for emergency beds by 2016
Notes Sub Acute beds include: Rehabilitation, Palliative care, Maintenance, Older Persons and Psychogeriatric care; ICU beds exclude Paediatrics, NICU, CCU, etc. Acute Overnight beds exclude day case beds. Sub acute numbers of beds 2016 is for DCCC hospital, AMANA RESIDENCES MEDICAL AND REHABILITATION HOSPITAL LLC and LONG TERM MEDICAL AND REHABILITATION HOSPITAL LLC which were open on the Q1 2013.
Source TAHPI, Health Facility briefing system, reference data is based on data extracted from the Australian Institute of Health and Welfare, supplemented by data from the USA inpatient sample and UK Hospital Episode Statistics Online (HES)
2011 2016 2021 2026 2031
Acute 3289 3308 4328 5609 5850
Subacute 224 342 438 449 525
ICU 146 175 209 245 281
Emergency Bays 324 789 987 1182 1379
Base on 70% Occupancy rate Total 3659 3825 4975 6303 6656
Base on current Occupancy rate Total 4395 5724 7313 7455
SEHA Acute 2482 432 NA NA 2914
Subacute 188 0 NA NA 188
ICU 91 47 NA NA 91
Emergency Bays 220 94 314
Total 2615 783 NA NA 3364
Mubadala Acute - 294 NA NA 294
Subacute - 0 NA NA 0
ICU - 70 NA NA 70
Emergency Bays - 16
Total - 364 NA NA 364
Private-sector Acute 961 1923 NA NA 2884
Subacute 28 178 NA NA 206
ICU NA 78 NA NA 78
Emergency Bays 84 249 333
Total 1044 821 NA NA 1865
Total Acute 3443 2649 NA NA 6092
Subacute 216 178 NA NA 394
ICU 91 195 NA NA 286
Emergency Bays 324 359 683
Total 4074 3381 NA NA 7455
Demand
Supply
under-supply
Over-supply
Adequate supply

Inpatient current and projected demand, by service lines, Episodes and beds
C35
Assumptions Projected bed numbers from 2016 onwards are based on ‘International Average’ ALOS and 75% occupancy for ICU beds. Population growth based on: Abu Dhabi Urban Planning Council 2030 Plan projections, ‘Advantaged’ socio-economic class and with life expectancy >77years. Expatriate utilisation increases from 45% of UAE National utilisation to 55% of UAE National utilisation.
Notes Sub Acute beds include: Rehabilitation, Palliative care, Maintenance, Older Persons and Psychogeriatric care; ICU beds exclude Paediatrics, NICU, CCU, etc. Acute Overnight beds exclude day case beds.
Source TAHPI, Health Facility briefing system, reference data is based on data extracted from the Australian Institute of Health and Welfare, supplemented by data from the USA inpatient sample and UK Hospital Episode Statistics Online (HES)
No of
Episode No of Bed
No of
Episode No of Bed
No of
Episode No of Bed
No of
Episode No of Bed
No of
Episode No of Bed
Burn 954 18 1227 26 1558 35 2024 49 2520 61
Cardiology Inavsive 3261 34 4310 45 5462 59 7107 75 8889 95
Cardiology - Medical 8103 65 11362 90 15224 117 19396 144 24426 180
Cardiology - Open Heart Surgery 923 26 1276 121 1593 50 1868 60 2248 75
Dental 698 6 896 7 1098 8 1373 9 1756 10
Dermatology 894 12 1106 15 1317 19 1556 27 1865 34
Endocrinology 2844 46 3797 62 4875 82 6058 103 7473 129
ENT Surgery 11643 42 14111 49 16538 55 19085 63 22668 71
Gasterenterology 11265 92 13994 122 18696 151 22486 186 27138 227
General Medicine 6360 82 8383 107 10514 136 13000 171 16047 211
General Surgery 12629 95 15747 118 19085 148 22769 177 26816 213
Gynecological Surgery 2730 18 3025 23 3714 28 4099 30 5076 37
Hematology 645 10 815 12 1021 14 1216 19 1519 21
Infectious Disease 3575 49 4222 59 4934 76 5718 91 6557 115
Nenatology 15017 455 19554 612 26953 784 33823 975 41152 1203
Nephrology 4165 37 5184 46 6248 47 7304 69 8794 83
Neurology 6184 90 7765 115 9481 142 11307 171 13507 213
Neurological Surgery 4850 70 6265 91 7836 113 9532 137 11558 172
Obstetrics 1055 5 1406 5 1550 7 1684 9 2301 9
Obstetrics/Delivery 29852 295 37326 341 45074 421 55247 502 68687 619
Oncology 1861 28 2385 36 3044 44 3739 57 4583 69
Ophthalomology 815 6 928 7 1108 9 1389 10 1663 13
Orthopedic Surgery 21626 211 28207 270 33981 334 43814 403 53653 490
Plastic Surgery 3697 33 4669 42 5718 52 6889 66 8265 80
Psychiatry 4712 178 5957 237 7676 303 9363 375 11302 459
Rehabilitation 5728 72 9838 114 12624 144 15746 172 19647 209
Respirotory 14344 169 18998 219 24564 279 30353 360 38443 441
Rheumatology 1941 11 2263 13 2528 16 2902 18 3310 23
Transplant Surgery 118 8 158 10 189 13 264 18 311 21
Trauma 621 4 548 4 1074 6 1204 6 1475 7
Urology 4774 40 5849 47 7362 61 8895 74 10640 92
Vascular Surgery 995 24 1468 35 1919 47 2539 61 3126 78
2031 2036
Service Line2016 2021 2026

Inpatient current and projected demand ( Paediatric ), by service lines, Episodes and beds
Notes: Sub Acute beds include: Rehabilitation, Palliative care, Maintenance, Older Persons and Psychogeriatric care; ICU beds exclude Paediatrics, NICU,
CCU, etc. Acute Overnight beds exclude day case beds. Paediatric age is defined to be inclusive of ages from birth and up to 18 years old; this includes all newborns, infants, children and young adults cared for in a facility
Source: TAHPI, Health Facility briefing system, reference data is based on data extracted from the Australian Institute of Health and Welfare, supplemented by data from the USA inpatient sample and UK Hospital Episode Statistics Online (HES)
Assumptions: Projected bed numbers from 2016 onwards are based on ‘International Average’ ALOS and 75% occupancy for ICU beds. Population growth based on: Abu Dhabi Urban Planning Council 2030 Plan projections, ‘Advantaged’ socio-economic class and with life expectancy >77years. Expatriate utilisation increases from 45% of UAE National utilisation to 55% of UAE National utilisation.
C36
No of
Episode No of Bed
No of
Episode No of Bed
No of
Episode No of Bed
No of
Episode No of Bed
No of
Episode No of Bed
No of
Episode No of Bed
Burn 147 4 185 42 186 7 144 10 349 15 434 19
Cardiology Inavsive 42 2 66 2 92 2 58 2 159 2 203 2
Cardiology - Medical 150 2 222 2 300 4 185 5 488 6 607 8
Cardiology - Open Heart Surgery 97 2 129 4 169 6 108 8 264 9 342 12
Dental 101 2 113 2 113 2 48 2 142 2 250 2
Dermatology 228 5 302 6 370 7 210 8 512 13 588 17
Endocrinology 347 4 516 6 699 8 433 11 1157 13 1441 17
ENT Surgery 3320 13 4183 14 4776 16 2496 19 5835 20 6927 20
Gasterenterology 1979 11 2123 11 1945 17 1585 20 3761 26 4278 32
General Medicine 1238 13 1843 20 2508 28 1530 36 4131 47 5156 59
General Surgery 708 6 919 8 1112 11 611 13 1442 15 1625 18
Gynecological Surgery 0 0 0 0 0 0 0 0 0 0 0 0
Hematology 146 2 193 4 230 4 139 5 340 6 401 6
Infectious Disease 1178 8 1453 10 1653 12 654 13 2003 15 2111 18
Nenatology 10581 309 15017 455 19554 612 13062 784 33823 975 41152 1203
Nephrology 460 3 629 5 794 6 440 7 1133 9 1391 9
Neurology 753 7 1076 11 1306 13 738 17 1836 21 2192 27
Neurological Surgery 379 4 544 6 654 7 731 10 959 13 1146 17
Obstetrics 0 0 0 0 0 0 0 0 0 0 0 0
Obstetrics/Delivery 0 0 0 0 0 0 0 0 0 0 0 0
Oncology 121 2 182 2 251 3 151 4 418 6 534 7
Ophthalomology 135 2 172 2 204 2 130 3 339 3 434 4
Orthopedic Surgery 1427 11 2061 16 2598 21 1697 28 4457 36 5509 45
Plastic Surgery 180 2 236 2 290 2 171 2 436 3 523 4
Psychiatry 336 6 366 7 356 10 13 13 872 15 1034 18
Rehabilitation 14 2 20 2 28 2 17 2 45 2 55 2
Respirotory 3553 27 4889 34 6221 43 3920 59 9871 85 12891 104
Rheumatology 729 2 890 3 985 4 509 4 1060 4 1169 6
Transplant Surgery 17 2 24 3 31 4 34 5 56 7 69 8
Trauma 183 2 191 2 141 2 125 2 288 2 415 2
Urology 271 2 308 3 315 3 191 4 501 4 633 5
Vascular Surgery 31 2 47 2 63 2 39 2 106 2 132 2
2031 2036
Service Line2011 2016 2021 2026

Projected demand by Abu Dhabi planning region Number of Regional and Centralised Providers
From 2013 Centralised and Regional inpatient services may only be provided by providers designated by HAAD to do so. HAAD has determined the current and future maximum number of Centralised and Regional facilities for each region:
C37
Methodology Based on 2010 SCAD current population and UPC Plan 2030 projected population and derived compound annual growth rate 2010–2030 Note HAAD may limit the number of Regional facilities, for example, where there are low volumes Sources * 2010 population estimates from Statistics Centre – Abu Dhabi (SCAD); ** 2012–2030 projections based on Urban Planning Council (UPC)
Plan 2030
2010* 2012** 2017** 2030**
Abu Dhabi and Middle Region population 1,198,000 1,348,000 1,723,000 2,622,379
Regional Providers (Abu Dhabi and Middle Region) 4 5 7 10
Al Ain (Eastern) Region population 568,000 610,000 715,000 1,002,466
Regional Providers (Al Ain Region) 2 2 3 4
Al Gharbiya (Western) Region population 198,000 217,010 264,526 378,600
Regional Providers (Al Gharbiya Region) 1 1 1 2
Total Regional Facilities in Abu Dhabi 7 8 11 16
Emirate wide 'Centralised' Centers 1 (1-2) (2-3) 4

Projected inpatient demand by Abu Dhabi planning region, by number of beds (Acute, Sub Acute and Intensive Care) plus Emergency bays
C38
Assumptions Projected bed numbers from 2016 onwards are based on ‘International Average’ ALOS and 75% occupancy for ICU beds. Population growth based on: Abu Dhabi Urban Planning Council 2030 Plan projections, ‘Advantaged’ socio- economic class and with life expectancy >77years. Expatriate utilisation increases from 45% of UAE National utilisation to 55% of UAE National utilisation.
Notes Sub Acute beds include: Rehabilitation, Palliative care, Maintenance, Older Persons and Psychogeriatric care; ICU beds exclude Paediatrics, NICU, CCU, etc. Acute Overnight beds exclude day case beds.
Source TAHPI, Health Facility briefing system, reference data is based on data extracted from the Australian Institute of Health and Welfare, supplemented by data from the USA inpatient sample and UK Hospital Episode Statistics Online (HES)
Actual Demand
Region Beds Bed Occupancy 2011 2016 2021 2026 2031
Abu Dhabi & Middle Acute Overnight Current (58%) 1,946 2,146 2,666 3,277 3,967
Intermediate (70%) 1,778 2,209 2,715 3,287
Target (85%) 1,464 1,819 2,236 2,707
Sub acute 224 168 195 241 282
Intensive care 101 90 108 126 143
Emergency bays N/A 439 528 615 703
Al Ain Acute Overnight Current (67%) 1,012 1,153 1,407 1,801 2,213
Intermediate (70%) 1,104 1,347 1,724 2,118
Target (85%) 909 1,109 1,420 1,744
Sub acute N/A 141 141 147 163
Intensive care 41 57 70 79 91
Emergency bays N/A 285 384 480 578
Western Acute Overnight Current (30%) 240 592 717 864 1,031
Intermediate (70%) 254 307 370 442
Target (85%) 209 253 305 364
Sub acute N/A 18 22 27 33
Intensive care 4 12 14 16 18
Emergency bays N/A 64 75 86 97

Center
Clinic
Hospital H
Pharmacy
Current Health Facility locations
#
#
#
#
#
#
#
#
#
#
#
#
#
#
#
##
#
#
#
#
#
#
#
#
#
#
#
#
#
#
#
#
# #
#
#
#
#
#
#
#
#
#
##
# #
#
#
#
##
#
# #
#
#
#
# #
##
#
#
#
#
#
#
#
#
#
#
#
##
#
#
#
#
#
#
###
#
#
#
#
#
#
#
#
#
#
#
#
#
#
#
#
#
#
#
#
#
#
##
#
#
#
#
#
#
#
#
#
###
##
#
#
#
#
#
# #
#
##
# #
#
#
##
#
##
#
#
#
#
#
#
##
!
!
!!!!
!
!
!!
!
!!
!
!!!!
!
!
!!
!!
!
!
!
!
!
!
! !
!
!
!
!
!
!
!
!
!
!
!
!!
!
!
!
!!
!
!
!
!
!
!
!
!
!
!!
!
!
!
!
!
!
!
!!
!
!
!!
!!
!
!
!!
!
!
!
!
!
!!
!
!
!!
!
"
"
"
"
"
"
"
"
"
"
""
"
"
""
"
"
""
"
"" "
"
"
"
"
""
"
"
"""
"
"
"
"
""
"
"
"
"
"
""
"
"
"
""
"
""
"
"
"
"
"
"
"
"
"
"
"
"""
"
""
""
"
"
""
"
"
"
"
"
"
"
"
"
"
"""
"
"
"
"
"
"
"
""
"
"
""
"
"
"
"
""
"
"
"
"""
"
"
"
"
"
"
"
"
"
"
"
"
"
"
"
"
""
"
""
"
"
"
"
"
"
"
"
"
"
"
""
"
"
"
"
"
"
"
"
"
"
"
"
"
"
""
"
"
®v®v®v
®v
®v
®v®v
®v
®v
®v®v
®v
®v
®v
®v
®v®v
®v
®v
OBAGI HOSPTAL
Al Reef HospitalNational Hospital
Lifeline Hospital
Al Salama Hospital
Al Ahalia Hospital AL MAZROUI HOSPITAL
AL Corniche Hospital
New Al Noor Hospital
Dar Al Shifa HospitalNMC Specialty Hospital
Shaikh Khalifa Hospital
Zayed Military Hospital
Franco Emirates Hospital
Gulf Diagnostic Center Hospital
C39 Source HAAD Licensing database, GPS survey; not all Center and Clinic locations shown

Supply projections
Source Preliminary licensed facilities, HAAD Licensing and Strategy analysis.
Note *Completion date depend on the financial status of the project.
Mafraq & Al Ain Hospital existing beds were supstracted from the beds projection capacity (Maintained by HAAD Health Facility Licensing). C40
Districts Hospital Sub TypeNo. of
bed
Construction
Status Competion date Land
Public/
Private
Abu Dhabi Island Specialized Hospital 80 >50% 2013 Y Public
General Hospital 141 >50% 2014 N Private
Specialized Hospital 88 >50% 2013 YRENT Private
General Hospital 31 >50% End 2013 Y Private
Al Karama Specialized Hospital 838 Planned Y Public
Al Shamkha General Hospital 125 Planned Y Public
AlSowa Island General Hospital 364 >50% End 2014 Y Private
Bain Al Jesrain General Hospital 300 <50% End 2014 Y Private
Bani Yas General Hospital 25 Planned Y Private
General Hospital 100 Planned Y Private
General Hospital 120 Planned Y Private
General Hospital 90 Planned Y Private
Grand Mosque districts General Hospital 100 >50% posponded Y Private
Khalifa City A Rehabilitation Hospital 156 Planned Y Public
General Hospital 150 >50% 2nd quarter 2015 Y Private
Specialized Hospital 100 Planned Y Private
General Hospital 10 <50% stoped Y Private
General Hospital 250 >50% End 2013 Y Private
General Hospital 100 Planned Y Private
General Hospital 52 Planned Y Private
Khalifa City B General Hospital 99 Planned Y Private
Nursing Home 72 >50% YVILLA Private
Mafraq General Hospital 499 >50% 2014 Y Public
Mohamed Bin Zayed City General Hospital 50 >50% End 2013 Y Private
General Hospital 300 Planned Y Private
General Hospital 210 Planned Y Private
Mussfah General Hospital 100 Planned Y Private
General Hospital 35 Planned Y Private
General Hospital 100 >50% 2014 Y Private
General Hospital 119 >50% 2013 N Private
Districts Hospital Sub TypeNo. of
bed
Construction
Status Competion date Land
Public/
Private
Not specified General Hospital 400 Planned N Private
Rehabilitation Hospital 140 Planned N Private
Rehabilitation Hospital 90 Planned N Private
General Hospital 50 Planned N Private
General Hospital 100 Planned N Private
General Hospital 25 Planned N Private
General Hospital 150 Planned N Private
General Hospital 50 Planned N Private
General Hospital 150 Planned N Private
General Hospital 50 Planned N Private
General Hospital 50 Planned N Private
General Hospital 72 Planned N Private
General Hospital 140 Planned N Private
General Hospital 150 Planned N Private
General Hospital 100 Planned N Private
General Hospital 100 Planned N Private
General Hospital 50 Planned N Private
General Hospital 54 Planned N Private
Rehabilitation Hospital 140 Planned N Private
General Hospital 180 Planned N Private
Specialized Hospital 53 Planned N Private
General Hospital 100 Planned N Private
General Hospital 50 Planned N Private
Rehabilitation Hospital 40 Planned N Private
General Hospital 300 Planned N Private
General Hospital 300 Planned N Private
General Hospital 250 Planned N Private
General Hospital 235 Planned N Private
General Hospital 28 Planned N Private
General Hospital 100 Planned N Private
Shahama General Hospital 100 >50% stoped Y Private
Zaied Militarism city Specialized Hospital 20 Planned Y Private
As of 23rd May 2013 Region
Total Hospital beds with
Preliminary license
No. of Beds for Hospital >50%
Construction
No. of Beds for
Hospital <50%
Construction
No Construction
status
Total 9368 2159 333 6867
Abu Dhabi & Middle 7709 1757 310 5642

Supply projections
Source Preliminary licensed facilities, HAAD Licensing and Strategy analysis.
Note *Completion likelihood from Land and Project State List (Maintained by HAAD Health Facility Licensing). C41
As of 23rd May 2013
Region
Eastern
Total Hospital beds
with Preliminary
license
No. of Beds for Hospital
>50% Construction
No. of Beds for
Hospital <50%
Construction
No
Construction
status
Total 1425 402 0 1014
Districts Hospital Sub TypeNo. of
bed
Construction
Status
Competion
dateLand
SEHA/
Non
SEHAAl Ain city Specialized Hospital 619 >50% 2014 Y Public
General Hospital 50 >50% End 2015 Y Private
Rehabilitation Hospital 25 >50% 2013 N Private
General Hospital 36 Planned Y Private
General Hospital 112 Planned Y Private
Rehabilitation Hospital 48 >50% N Private
Al Hili General Hospital 30 Planned Y Private
General Hospital 100 Planned Y Private
Al Jimi General Hospital 100 Planned Y Private
Al Khabasi One Day Surgry 6 Planned Y Private
Al Towaya General Hospital 54 Planned Y Private
General Hospital 100 Planned Y Private
Al Yahar General Hospital 60 Planned Y Private
AlJimi General Hospital 30 Planned Y Private
Falej hazza General Hospital 46 Planned Y Private
General Hospital 40 Planned Y Private
Not specified General Hospital 126 Planned N Private
General Hospital 60 Planned N Private
Rehabilitation Hospital 32 Planned N Private
General Hospital 50 Planned N Private
Rehabilitation Hospital 32 Planned N Private
Region
Western
Total Hospital beds
with Preliminary
license
No. of Beds for Hospital
>50% Construction
No. of Beds for
Hospital <50%
Construction
No
Construction
status
Total 234 0 23 211
Districts Hospital Sub TypeNo. of
bed
Construction
Status
Competion
dateLand
SEHA/
Non
SEHAAl Ruwais General Hospital 52 Planned Y Public
Madinat zayed General Hospital 54 Planned Y Private
Specialized Hospital 23 <50% 2015 N Private
Not specified General Hospital 50 Planned N Private
General Hospital 30 Planned N Private
Sila General Hospital 25 Planned Y Public

Model of Care Capacity Gaps
Assumptions Recommendations
DRAFT
Patient self-care
Model of care How health services should be used
Source Institute of Medicine 2001 Crossing the Quality Chasm, Bodenheimer et al 2002 JAMA, Department of Health UK 2001 Reforming Emergency Care, Picker Institute, Strategy analysis 11
Remote support
Preventative
Screening
Check-up
Disease management
Non-emergency/elective
Outpatient Clinic
Elective Admission
Emergency
Ambulance
Emergency Admission .
Triage
Urgent Care Centre
ER
Including diagnostics
Population growth, scenarios
Note HAAD and SCAD are collaborating to align figures with official SCAD estimates; Estimates presented here are for internal HAAD use only
Projections for Nationals are rounded to the nearest 2.5% variance between high and low, and those for Expatriates at 5%.
Source SCAD population estimates; additional HAAD assumptions and analysis based on raw insurance data` 73
As at 31 December 2010 Draft
Population growth, Scenarios
National Expatriate
Year Low High
2011 411'200 1'945'000 2'045'000
2012 416'150 1'970'000 2'190'000
2013 422'200 2'060'000 2'350'000
2014 429'400 2'130'000 2'505'000
2015 437'800 2'175'000 2'675'000
2016 445'800 2'250'000 2'850'000
2017 453'600 2'310'000 3'045'000
2018 460'500 2'360'000 3'240'000
2019 467'600 2'400'000 3'400'000
2020 473'600 2'475'000 3'575'000
0.0
0.5
1.0
1.5
2.0
2.5
3.0
3.5
4.0
2010 2011 2012 2013 2014 2015 2016 2017 2018 2019 2020
Po
pu
lati
on
(mill
ion
s)
High
Low
DRAFT
For planning purposes, land must be available for hospitals, clinics and ambulance stations to serve anticipated population as per the following guidelines:
Land requirements Guidelines for urban planners
Notes 1Transient population includes staff and other non-residential visitors 2Clinics collectively refers to Clinics, Centers and Polyclinics3Appropriate facilities for co-location with Clinics include Hospitals, Ambulance Stations, Mosques, Neighbourhood Commercial Centres, Sport Facilities, Community/Cultural Centres, Pharmacies, Schools and Post Offices, 4Clinic GFA may be provided within larger commercial centre with adequate transport options and shared parking5 If residential population is less than 60,000 or transient population is less than 180,000, land provision for a hospital facility needs to be made on a site-based analysis which considers the accesibility of existing hospital facilities6Optimal hospital size is 200-600 beds7Appropriate facilities for co-location with Ambulance Stations include Clinics, Hospitals, Civil Defense Stations, Police Stations and Municipal Offices
Source HAAD Health Facility Community Guidelines 2009, Strategy analysis 5
Population (000’s people)
Land provision options Parking(spaces)
Minimum service requirement
Estimated Resources
Residential Transient1 Land area(m2 000’s)
Co-location GFA4
(m2 000’s)
Clinics2 4-5 12-15 6 ? 3 2.5 25 •Primary care•Pharmacy services (on-site or within 10 min walk)•Laboratory service
2 Physicians
8-12 24-36 7 ? 3 3 30 4-6 Physicians
12-30 36-90 8.5 ? 3 3.5 35 7-14 Physicians
30-40 90-120 12 ? 3 4.5 45 15-20 Physicians
Hospitals5 60-80 180-240 80 n/a n/a 3/bed •Emergency services•Laboratory services•Radiology services•Stand-alone building
180-240 Beds6
90-110 270-330 100 n/a n/a 3/bed 270-330 beds6
Ambulance Stations
10-16 30-48 3 ? 7 n/a 10 •Ambulance service (land /air) 1 Ambulance
16-40 48-120 4 ? 7 n/a 15 •Ambulance service (land /air) 2 Ambulances
OR OR OR
C42
Capacity Management
Capacity Masterplan
Note: Abu Dhabi and Al Gharbia populations based on SCAD 2005 census. Al Ain population based on 2008 UPC estimate.
Source: Population: SCAD, UPC 2030 plans. Clinicians and Facilities: Licensing database. Planned Facilities ; SEHA, UPC 2030 plans, HAAD Planning analysis.
Capacity Gap
Severe
Moderate
None
Population Facilities Clinicians Ratios 2030 Plan growth 2030 requirements 2030 planned Projects under way
Region District Gap now Type Tota
l
% N
atio
nal
Nat
ion
als
Tota
l
Ho
spit
als
Cli
nic
s
Ne
arb
y
ho
spit
al
Do
cto
rs
Nu
rse
s
De
nti
sts
Oth
er
Fac
ilit
ies
/10
00
0
Do
cto
rs
/10
00
Nu
rse
s
/10
00
Population Growth
Ho
spit
als
req
uir
ed
Cli
nic
req
uir
ed
Ho
spit
als
Cli
nic
s
Ho
spit
als
Cli
nic
s
20
30
Po
pu
lati
on
Abu Dhabi Desert Villages Rural 28,480 #NAME? 10,963 None 81,520 1 110,000
Al Falah Rural 4,028 #NAME? 1,996 None 95,972 1 1 100,000
Ghantoot District Rural 2,478 #NAME? - None 97,522 1 100,000
Abu Dhabi Island Urban 313,809 #NAME? 44,004 229 13 182 2,529 3,878 430 1,284 6.2 8.1 12.4 111,191 425,000
CBD/Financial Centre Urban 174,625 #NAME? 14,141 124 5 86 1,131 1,663 241 539 5.2 6.5 9.5 15,375 1 190,000
Musaffah Urban 141,268 #NAME? 2,256 36 31 161 194 21 68 2.2 1.1 1.4 (41,268) 1 1 3 100,000
Bani Yas Rural 47,245 #NAME? 27,267 43 37 162 106 57 73 7.8 3.4 2.2 22,755 4 70,000
Al Shahama Rural 37,831 #NAME? 16,361 10 10 45 47 14 24 2.6 1.2 1.2 72,169 1 1 1 110,000
Shamkhah Rural 15,839 #NAME? 10,674 None 1 114,161 1 130,000
Al Rahba Rural 15,315 #NAME? 13,038 1 1 132 325 5 89 0.7 8.6 21.2 94,685 1 110,000
New Port City Rural 11,740 #NAME? 4,565 None 1 138,260 2 150,000
Capital District South Urban 9,247 #NAME? 33 None 1 45,753 1 1 55,000
Bain Al Jesrain Urban 7,694 #NAME? 4,927 3 3 33 42 10 17 3.9 4.3 5.5 17,306 1 1 25,000
Khalifa City A Urban 5,317 #NAME? 2,703 11 1 10 78 74 17 75 20.7 14.7 13.9 64,683 1 1 6 70,000
Grand Mosque District Urban 5,257 #NAME? 1,837 None 1 114,743 1 1 120,000
Inner Islands Urban 2,804 #NAME? 480 1 2 4 3.6 0.7 1.4 17,196 1 20,000
Capital District North Urban 2,371 #NAME? 2,121 2 1 1 426 792 36 302 8.4 179.7 334.0 67,629 1 3 70,000
Al Mina Urban 1,070 #NAME? 53 7 4 87 103 25 62 37.4 81.3 96.3 98,930 100,000
Al Raha Urban 827 #NAME? 397 2 1 1 41 42 9 12 49.6 50.8 119,173 1 120,000
Yas Island Urban 776 #NAME? 1 None 99,224 100,000
Mohamed Bin Zayed City Urban 328 #NAME? 95 2 2 1 2 4 2 3.0 6.1 49,672 1 1 4 50,000
Saadiyat Urban 122 #NAME? None 119,878 - 120,000
Airport District Urban 98 #NAME? 32 6 4 8 11 5 11 81.6 112.2 49,902 1 50,000
Lulu Island Urban 75 #NAME? None 19,925 1 20,000
Capital District Urban #NAME? None 240,000 2 240,000
Mohamed Bin Zayed Centre Urban #NAME? None 80,000 1 80,000
South Hudayriat Island Rural #NAME? None 100,000 1 100,000
Marina Village Urban #NAME? 3 2 1 3 6 5,000 5,000
Al Suwwah Urban #NAME? None 30,000 1 1 30,000
Al Reem Urban #NAME? None 200,000 200,000
Al Ain Umm Ghaffa Rural 8,851 #NAME? 5,873 None 3,049 1 1 11,900
Nahel Rural 5,196 #NAME? 2,377 None 4,804 1 1 10,000
Industrial City Rural 48,803 #NAME? 18 8 5 14 5 1 5 1.0 0.3 0.1 30,937 1 1 79,740
Al Salamat/Al Yaher Urban 37,544 #NAME? 23,400 1 1 1 3 1 6 0.3 0.1 0.0 36,456 1 1 2 74,000
Al Dhahra Rural 4,958 #NAME? 715 None 1,042 1 1 6,000
Abu Krayyah Rural 4,108 #NAME? 655 None 892 1 1 5,000
Al Saad Rural 3,829 #NAME? 702 None 1,171 1 1 5,000
Al Araad Rural 3,791 #NAME? 139 None 209 1 4,000
Abu Samra Rural 1,942 #NAME? 286 None 558 1 2,500
Al Ain City Urban 343,002 #NAME? 100,298 186 7 148 1,733 2,864 318 968 4.5 5.1 8.3 364,298 3 8 707,300
Al Quaa Rural 12,512 #NAME? 4,912 1 1 8 13 1 3 0.8 0.6 1.0 10,488 1 1 23,000
Al Wagan Rural 11,865 #NAME? 3,330 1 1 17 29 1 4 0.8 1.4 2.4 18,135 1 1 1 30,000
Al Hayer Rural 11,484 #NAME? 2,570 3 3 25 34 4 3 2.6 2.2 3.0 20,516 1 2 32,000
Al Dhaher Rural 10,641 #NAME? 7,325 1 1 13 20 3 4 0.9 1.2 1.9 3,709 1 1 14,350
Remah Rural 8,187 #NAME? 683 1 1 6 9 2 1.2 0.7 1.1 1,313 1 1 9,500
Sweihan Rural 7,880 #NAME? 713 1 1 8 11 1 1 1.3 1.0 1.4 32,120 1 2 40,000
Al Khazna Rural 7,350 #NAME? 1,071 2 2 4 13 1 2.7 0.5 1.8 1,650 1 1 9,000
Mezyad Rural 6,407 #NAME? 3,809 None 1 1,993 1 1 8,400
Al Shwaib Rural 3,260 #NAME? 1,546 1 1 3 4 3.1 0.9 1.2 2,240 1 1 5,500
Al Fagah Rural 2,089 #NAME? 378 1 1 3 3 4.8 1.4 1.4 1,411 1 3,500
Western Liwa Rural 20,000 #NAME? 661 5 1 1 8 17 5 32 1.0 0.4 0.9 45,000 1 65,000
Madinat Zayed Rural 29,000 #NAME? 6,785 16 2 11 175 256 23 107 4.5 6.0 8.8 11,000 1 1 40,000
Ruwais Rural 16,000 #NAME? 1,270 4 1 3 50 100 7 14 2.5 3.1 6.3 114,000 1 130,000
Mirfa Rural 15,000 #NAME? 3,676 4 1 3 32 61 3 17 2.7 2.1 4.1 60,000 75,000
Ghayathi Rural 8,000 #NAME? 3,898 6 1 5 38 63 5 18 7.5 4.8 7.9 7,000 1 15,000
Sila'a Rural 5,000 #NAME? - 1 1 22 39 2 10 2.0 4.4 7.8 65,000 70,000
Delma Island Rural 5,000 #NAME? 2,139 1 1 23 25 2 10 2.0 4.6 5.0 5,000 1 10,000
Demand & Supply Projections
Current and projected demand, by Episodes and beds
C17
Notes :Sub Acute beds include: Rehabilitation, Palliative care, Maintenance, Older Persons and Psychogeriatric care; ICU beds excludePaediatrics, NICU, CCU, etc. Acute Overnight beds exclude day case beds. Sub acute numbers of beds adjustedSource: TAHPI, Health Facility briefing system, reference data is based on data extracted from the Australian Institute of Health and Welfare,supplemented by data from the USA inpatient sample and UK Hospital Episode Statistics Online (HES)Assumptions Projected bed numbers from 2016 onwards are based on ‘International Average’ ALOS and 75% occupancy for ICU beds.
Population growth based on: Abu Dhabi Urban Planning Council 2030 Plan projections, ‘Advantaged’ socio-economic classand with life expectancy >77years. Expatriate utilisation increases from 45% of UAE National utilisation to 55% of UAENational utilisation. Sub acute number of beds adjusted to meet international benchmark
Bed Occupancy 2011 Actual 2016 2021 2026 2031Acute Overnight
Episodes122,345 184,102 223,539 276,589 332,040
Acute Overnight Beds Current (58%) 3,289 3,992 5,223 6,769 7,061
Intermediate (70%) 3,308 4,328 5,609 5,850
Target (85%) 2,724 3,564 4,619 4,818
Sub Acute Overnight
EpisodesN/A 3,216 4,233 5,461 6,738
Sub Acute Overnight
Beds224 342 438 449 525
ICU beds 146 175 209 245 281
Emergency Bays N/A 789 987 1,182 1,379

Population density
Source Department of Planning and Economy (2005 Census), Strategy Analysis C43

Population growth, scenarios
Note HAAD and SCAD are collaborating to align figures with official SCAD estimates; Estimates presented here are for internal HAAD use only
Projections for Nationals are rounded to the nearest 2.5% variance between high and low, and those for Expatriates at 5%.
Source 2012 – 2022: SCAD population estimates; additional HAAD assumptions and analysis based on raw insurance data; 2030: UPC 2030 Plan C44
Population growth, scenarios
National Expatriate
Year High Low High
2013 491'300 635'532 2'117'000 2'233'500
2014 505'600 650'252 2'128'500 2'279'500
2015 519'600 664'832 2'140'000 2'341'500
2016 533'200 679'231 2'150'500 2'407'500
2017 546'500 693'452 2'160'500 2'466'500
2018 560'000 707'461 2'170'000 2'520'000
2019 572'500 721'261 2'179'000 2'570'000
2020 585'000 734'851 2'187'000 2'617'000
2021 597'500 748'227 2'195'000 2'660'000
2022 609'000 761'375 2'201'000 2'701'000
2023 620'500 774'282 2'206'000 2'739'0000.0
0.5
1.0
1.5
2.0
2.5
3.0
3.5
4.0
4.5
5.0
2013 2014 2015 2016 2017 2018 2019 2020 2021 2022 2023 2030
Po
pu
lati
on
(m
illi
on
s)
High
Low
UPC

Demand projections Clinical care volumes (outpatient, inpatient), Beds, Doctors and Nurses
Assumptions Outpatient weight is 1, Inpatient weight is 10 ALOS remains at the 2011 level of 5.7 in the High scenario and reduces to 5.0 in the Low scenario Bed occupancy remains at the 2011 level of 71% (SEHA figure) in the High scenario and increases to 80% in the Low scenario Outpatients per Doctor remains at the 2011 rate of 2'382 in the High scenario and increases by 10% in the Low scenario.
Outpatients per Nurse remains at the 2011 rate of 1'633 in the High and Low scenarios Churn will remain at the 2011 rate of 17% for Doctors and 11% for Nurses Notes Numbers have been rounded for clarity Source HAAD Demand Model 2011, HAAD Licensing Database C45
Additional capacity needs over 10 years
Current 2022 CAGR Absolute Annualised
2012 Low High Low High Low High Low High
Outpatients (m) 11 16 23 3.6 7.6 5 12 .4 .8
Inpatients (000's) 177 229 329 2.6 6.4 52 151 5 11 Including staff turnover
Beds 3,700 3,900 7,300 0.7 7.1 300 3,600 30 260 Low High
Doctors 5,600 7,100 10,300 2.5 6.4 1,600 4,800 140 350 1,200 1,700
Nurses 12,500 17,500 25,400 3.5 7.4 5,100 13,000 430 920 2,000 2,900

Demand projections based on WHO disease classification
Definition CAGR = Compound Annual Growth Rate 2011-2021 Notes Inpatient Encounters in thousands, Outpatient Encounters in millions Source HAAD Demand Model 2011, Categorization based on WHO classification of diagnoses ICD 9, modified to specify deliveries and RTAs C46
CAGR CAGRLow High Low High
2.6 3.7 0.0 0.0
2.0 4.6 1.5 4.8
1.0 2.0 3.2 4.1
1.5 5.5 4.2 7.3
7.1 15.7 9.0 17.1
1.5 4.3 -0.1 2.1
1.6 5.7 4.3 7.2
2.8 8.6 4.5 8.5
1.1 4.2 5.3 10.1
2.0 5.9 1.8 4.2
1.3 5.4 0.7 3.3
2.3 7.8 4.7 9.1
7.0 11.1 7.7 11.3
2.0 6.1 1.4 4.0
7.6 14.2 8.3 15.8
-0.1 3.8 3.1 6.0
4.6 12.1 11.4 18.8
1.5 9.4 4.9 9.5
3.1 4.9 3.9 6.3
1.7 4.9 3.2 5.9
1.8 7.4 4.2 7.6
0.0 0.0 2.9 5.3
1.9
.3
.6
.4
1.9
.5
.5
.3
.4
.5
.9
.2
.0
.0
.6
.4
.5
.0
.5
.2
.3
.3
.1
.3
.5
.0
.3
.3
.2
.1
.0
.5
.2
.0
.1
.2
.9
.3
.0
.2
.1
.1
.8
.0
.3
1.0
.4
.3
.4
.3
.1
.1
.7
.1
.0
.1
.2
1.2
.5
.0
.2
.1
.1
Outpatients
34
27
20
18
12
10
9
7
6
6
5
5
5
4
3
2
2
1
1
10
6
2
3
12
2
1
2
1
1
1
1
4
1
3
-0
1
0
0
0
0
-
5
9
2
10
28
4
5
7
2
3
3
4
4
3
5
1
2
2
0
0
0
-
Deliveries
Signs, symptoms & ill-defined
Maternal & Perinatal conditions
Digestive diseases
Cardiovascular diseases
Respiratory infections
Respiratory diseases
Genitourinary diseases
Endocrine disorders
Infectious & parasitic diseases
Occupational Injuries
Musculoskeletal diseases
Neuropsychiatric conditions
Other Injuries
Cancer
Skin diseases
Diabetes mellitus
Sense organ diseases
Congenital anomalies
Oral conditions
Nutritional deficiencies
RTA
Inpatients
.0
10 20 30 40 50 60
2012 2022 Low 2022 High
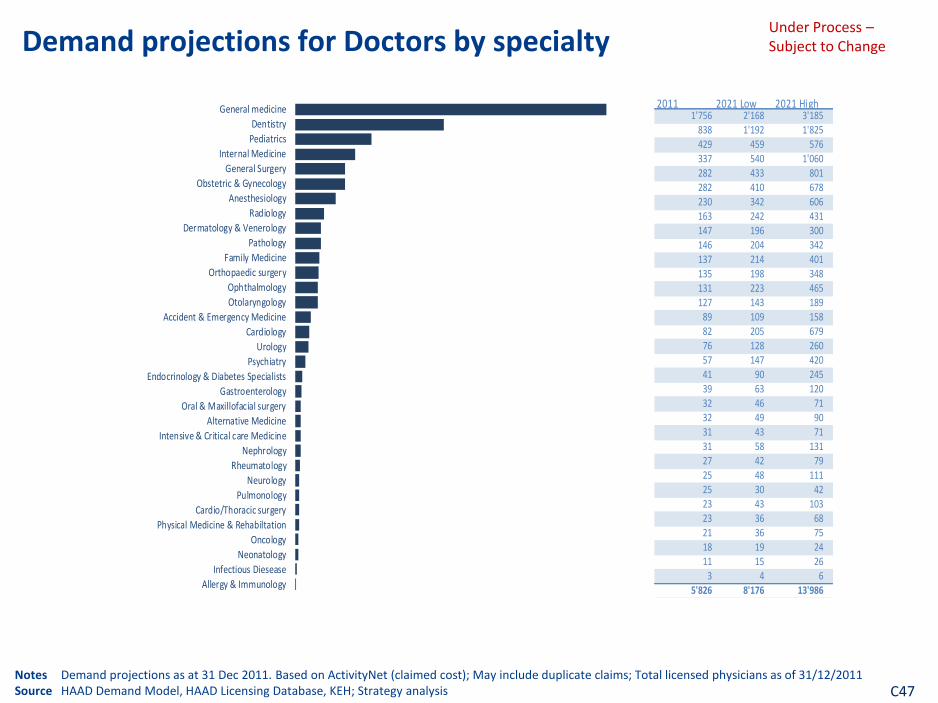
Demand projections for Doctors by specialty
Notes Demand projections as at 31 Dec 2011. Based on ActivityNet (claimed cost); May include duplicate claims; Total licensed physicians as of 31/12/2011 Source HAAD Demand Model, HAAD Licensing Database, KEH; Strategy analysis C47
General Medicine
Dentistry
Pediatrics
Internal Medicine
Obstetric & Gynecology
General Surgery
Anesthesiology
Radiology
Dermatology & Venerology
Pathology
Family Medicine
Orthopaedic surgery
Ophthalmology
Otolaryngology
Accident & Emergency Medicine
Cardiology
Urology
Psychiatry
Endocrinology & Diabetes Specialists
Gastroenterology
Oral & Maxillofacial surgery
Nephrology
Intensive & Critical care Medicine
Rheumatology
Neurology
Pulmonology
Physical Medicine & Rehabiltation
Cardio/Thoracic surgery
Oncology
Neonatology
Infectious Diesease
Allergy & Immunology
2011 2021 Low 2021 High
2011 2021 Low 2021 High1'756 2'168 3'185
838 1'192 1'825429 459 576337 540 1'060282 433 801282 410 678230 342 606163 242 431147 196 300146 204 342137 214 401135 198 348131 223 465127 143 189
89 109 15882 205 67976 128 26057 147 42041 90 24539 63 12032 46 7132 49 9031 43 7131 58 13127 42 7925 48 11125 30 4223 43 10323 36 6821 36 7518 19 2411 15 26
3 4 65'826 8'176 13'986
General medicine
Dentistry
Pediatrics
Internal Medicine
General Surgery
Obstetric & Gynecology
Anesthesiology
Radiology
Dermatology & Venerology
Pathology
Family Medicine
Orthopaedic surgery
Ophthalmology
Otolaryngology
Accident & Emergency Medicine
Cardiology
Urology
Psychiatry
Endocrinology & Diabetes Specialists
Gastroenterology
Oral & Maxillofacial surgery
Alternative Medicine
Intensive & Critical care Medicine
Nephrology
Rheumatology
Neurology
Pulmonology
Cardio/Thoracic surgery
Physical Medicine & Rehabiltation
Oncology
Neonatology
Infectious Diesease
Allergy & Immunology
Under Process – Subject to Change

Model of Care Capacity Gaps
Assumptions Recommendations
DRAFT
Patient self-care
Model of care How health services should be used
Source Institute of Medicine 2001 Crossing the Quality Chasm, Bodenheimer et al 2002 JAMA, Department of Health UK 2001 Reforming Emergency Care, Picker Institute, Strategy analysis 11
Remote support
Preventative
Screening
Check-up
Disease management
Non-emergency/elective
Outpatient Clinic
Elective Admission
Emergency
Ambulance
Emergency Admission .
Triage
Urgent Care Centre
ER
Including diagnostics
Population growth, scenarios
Note HAAD and SCAD are collaborating to align figures with official SCAD estimates; Estimates presented here are for internal HAAD use only
Projections for Nationals are rounded to the nearest 2.5% variance between high and low, and those for Expatriates at 5%.
Source SCAD population estimates; additional HAAD assumptions and analysis based on raw insurance data` 73
As at 31 December 2010 Draft
Population growth, Scenarios
National Expatriate
Year Low High
2011 411'200 1'945'000 2'045'000
2012 416'150 1'970'000 2'190'000
2013 422'200 2'060'000 2'350'000
2014 429'400 2'130'000 2'505'000
2015 437'800 2'175'000 2'675'000
2016 445'800 2'250'000 2'850'000
2017 453'600 2'310'000 3'045'000
2018 460'500 2'360'000 3'240'000
2019 467'600 2'400'000 3'400'000
2020 473'600 2'475'000 3'575'000
0.0
0.5
1.0
1.5
2.0
2.5
3.0
3.5
4.0
2010 2011 2012 2013 2014 2015 2016 2017 2018 2019 2020
Po
pu
lati
on
(mill
ion
s)
High
Low
DRAFT
For planning purposes, land must be available for hospitals, clinics and ambulance stations to serve anticipated population as per the following guidelines:
Land requirements Guidelines for urban planners
Notes 1Transient population includes staff and other non-residential visitors 2Clinics collectively refers to Clinics, Centers and Polyclinics3Appropriate facilities for co-location with Clinics include Hospitals, Ambulance Stations, Mosques, Neighbourhood Commercial Centres, Sport Facilities, Community/Cultural Centres, Pharmacies, Schools and Post Offices, 4Clinic GFA may be provided within larger commercial centre with adequate transport options and shared parking5 If residential population is less than 60,000 or transient population is less than 180,000, land provision for a hospital facility needs to be made on a site-based analysis which considers the accesibility of existing hospital facilities6Optimal hospital size is 200-600 beds7Appropriate facilities for co-location with Ambulance Stations include Clinics, Hospitals, Civil Defense Stations, Police Stations and Municipal Offices
Source HAAD Health Facility Community Guidelines 2009, Strategy analysis 5
Population (000’s people)
Land provision options Parking(spaces)
Minimum service requirement
Estimated Resources
Residential Transient1 Land area(m2 000’s)
Co-location GFA4
(m2 000’s)
Clinics2 4-5 12-15 6 ? 3 2.5 25 •Primary care•Pharmacy services (on-site or within 10 min walk)•Laboratory service
2 Physicians
8-12 24-36 7 ? 3 3 30 4-6 Physicians
12-30 36-90 8.5 ? 3 3.5 35 7-14 Physicians
30-40 90-120 12 ? 3 4.5 45 15-20 Physicians
Hospitals5 60-80 180-240 80 n/a n/a 3/bed •Emergency services•Laboratory services•Radiology services•Stand-alone building
180-240 Beds6
90-110 270-330 100 n/a n/a 3/bed 270-330 beds6
Ambulance Stations
10-16 30-48 3 ? 7 n/a 10 •Ambulance service (land /air) 1 Ambulance
16-40 48-120 4 ? 7 n/a 15 •Ambulance service (land /air) 2 Ambulances
OR OR OR
C48
Capacity Management
Capacity Masterplan
Note: Abu Dhabi and Al Gharbia populations based on SCAD 2005 census. Al Ain population based on 2008 UPC estimate.
Source: Population: SCAD, UPC 2030 plans. Clinicians and Facilities: Licensing database. Planned Facilities ; SEHA, UPC 2030 plans, HAAD Planning analysis.
Capacity Gap
Severe
Moderate
None
Population Facilities Clinicians Ratios 2030 Plan growth 2030 requirements 2030 planned Projects under way
Region District Gap now Type Tota
l
% N
atio
nal
Nat
ion
als
Tota
l
Ho
spit
als
Cli
nic
s
Ne
arb
y
ho
spit
al
Do
cto
rs
Nu
rse
s
De
nti
sts
Oth
er
Fac
ilit
ies
/10
00
0
Do
cto
rs
/10
00
Nu
rse
s
/10
00
Population Growth
Ho
spit
als
req
uir
ed
Cli
nic
req
uir
ed
Ho
spit
als
Cli
nic
s
Ho
spit
als
Cli
nic
s
20
30
Po
pu
lati
on
Abu Dhabi Desert Villages Rural 28,480 #NAME? 10,963 None 81,520 1 110,000
Al Falah Rural 4,028 #NAME? 1,996 None 95,972 1 1 100,000
Ghantoot District Rural 2,478 #NAME? - None 97,522 1 100,000
Abu Dhabi Island Urban 313,809 #NAME? 44,004 229 13 182 2,529 3,878 430 1,284 6.2 8.1 12.4 111,191 425,000
CBD/Financial Centre Urban 174,625 #NAME? 14,141 124 5 86 1,131 1,663 241 539 5.2 6.5 9.5 15,375 1 190,000
Musaffah Urban 141,268 #NAME? 2,256 36 31 161 194 21 68 2.2 1.1 1.4 (41,268) 1 1 3 100,000
Bani Yas Rural 47,245 #NAME? 27,267 43 37 162 106 57 73 7.8 3.4 2.2 22,755 4 70,000
Al Shahama Rural 37,831 #NAME? 16,361 10 10 45 47 14 24 2.6 1.2 1.2 72,169 1 1 1 110,000
Shamkhah Rural 15,839 #NAME? 10,674 None 1 114,161 1 130,000
Al Rahba Rural 15,315 #NAME? 13,038 1 1 132 325 5 89 0.7 8.6 21.2 94,685 1 110,000
New Port City Rural 11,740 #NAME? 4,565 None 1 138,260 2 150,000
Capital District South Urban 9,247 #NAME? 33 None 1 45,753 1 1 55,000
Bain Al Jesrain Urban 7,694 #NAME? 4,927 3 3 33 42 10 17 3.9 4.3 5.5 17,306 1 1 25,000
Khalifa City A Urban 5,317 #NAME? 2,703 11 1 10 78 74 17 75 20.7 14.7 13.9 64,683 1 1 6 70,000
Grand Mosque District Urban 5,257 #NAME? 1,837 None 1 114,743 1 1 120,000
Inner Islands Urban 2,804 #NAME? 480 1 2 4 3.6 0.7 1.4 17,196 1 20,000
Capital District North Urban 2,371 #NAME? 2,121 2 1 1 426 792 36 302 8.4 179.7 334.0 67,629 1 3 70,000
Al Mina Urban 1,070 #NAME? 53 7 4 87 103 25 62 37.4 81.3 96.3 98,930 100,000
Al Raha Urban 827 #NAME? 397 2 1 1 41 42 9 12 49.6 50.8 119,173 1 120,000
Yas Island Urban 776 #NAME? 1 None 99,224 100,000
Mohamed Bin Zayed City Urban 328 #NAME? 95 2 2 1 2 4 2 3.0 6.1 49,672 1 1 4 50,000
Saadiyat Urban 122 #NAME? None 119,878 - 120,000
Airport District Urban 98 #NAME? 32 6 4 8 11 5 11 81.6 112.2 49,902 1 50,000
Lulu Island Urban 75 #NAME? None 19,925 1 20,000
Capital District Urban #NAME? None 240,000 2 240,000
Mohamed Bin Zayed Centre Urban #NAME? None 80,000 1 80,000
South Hudayriat Island Rural #NAME? None 100,000 1 100,000
Marina Village Urban #NAME? 3 2 1 3 6 5,000 5,000
Al Suwwah Urban #NAME? None 30,000 1 1 30,000
Al Reem Urban #NAME? None 200,000 200,000
Al Ain Umm Ghaffa Rural 8,851 #NAME? 5,873 None 3,049 1 1 11,900
Nahel Rural 5,196 #NAME? 2,377 None 4,804 1 1 10,000
Industrial City Rural 48,803 #NAME? 18 8 5 14 5 1 5 1.0 0.3 0.1 30,937 1 1 79,740
Al Salamat/Al Yaher Urban 37,544 #NAME? 23,400 1 1 1 3 1 6 0.3 0.1 0.0 36,456 1 1 2 74,000
Al Dhahra Rural 4,958 #NAME? 715 None 1,042 1 1 6,000
Abu Krayyah Rural 4,108 #NAME? 655 None 892 1 1 5,000
Al Saad Rural 3,829 #NAME? 702 None 1,171 1 1 5,000
Al Araad Rural 3,791 #NAME? 139 None 209 1 4,000
Abu Samra Rural 1,942 #NAME? 286 None 558 1 2,500
Al Ain City Urban 343,002 #NAME? 100,298 186 7 148 1,733 2,864 318 968 4.5 5.1 8.3 364,298 3 8 707,300
Al Quaa Rural 12,512 #NAME? 4,912 1 1 8 13 1 3 0.8 0.6 1.0 10,488 1 1 23,000
Al Wagan Rural 11,865 #NAME? 3,330 1 1 17 29 1 4 0.8 1.4 2.4 18,135 1 1 1 30,000
Al Hayer Rural 11,484 #NAME? 2,570 3 3 25 34 4 3 2.6 2.2 3.0 20,516 1 2 32,000
Al Dhaher Rural 10,641 #NAME? 7,325 1 1 13 20 3 4 0.9 1.2 1.9 3,709 1 1 14,350
Remah Rural 8,187 #NAME? 683 1 1 6 9 2 1.2 0.7 1.1 1,313 1 1 9,500
Sweihan Rural 7,880 #NAME? 713 1 1 8 11 1 1 1.3 1.0 1.4 32,120 1 2 40,000
Al Khazna Rural 7,350 #NAME? 1,071 2 2 4 13 1 2.7 0.5 1.8 1,650 1 1 9,000
Mezyad Rural 6,407 #NAME? 3,809 None 1 1,993 1 1 8,400
Al Shwaib Rural 3,260 #NAME? 1,546 1 1 3 4 3.1 0.9 1.2 2,240 1 1 5,500
Al Fagah Rural 2,089 #NAME? 378 1 1 3 3 4.8 1.4 1.4 1,411 1 3,500
Western Liwa Rural 20,000 #NAME? 661 5 1 1 8 17 5 32 1.0 0.4 0.9 45,000 1 65,000
Madinat Zayed Rural 29,000 #NAME? 6,785 16 2 11 175 256 23 107 4.5 6.0 8.8 11,000 1 1 40,000
Ruwais Rural 16,000 #NAME? 1,270 4 1 3 50 100 7 14 2.5 3.1 6.3 114,000 1 130,000
Mirfa Rural 15,000 #NAME? 3,676 4 1 3 32 61 3 17 2.7 2.1 4.1 60,000 75,000
Ghayathi Rural 8,000 #NAME? 3,898 6 1 5 38 63 5 18 7.5 4.8 7.9 7,000 1 15,000
Sila'a Rural 5,000 #NAME? - 1 1 22 39 2 10 2.0 4.4 7.8 65,000 70,000
Delma Island Rural 5,000 #NAME? 2,139 1 1 23 25 2 10 2.0 4.6 5.0 5,000 1 10,000
Demand & Supply Projections
Current and projected demand, by Episodes and beds
C17
Notes :Sub Acute beds include: Rehabilitation, Palliative care, Maintenance, Older Persons and Psychogeriatric care; ICU beds excludePaediatrics, NICU, CCU, etc. Acute Overnight beds exclude day case beds. Sub acute numbers of beds adjustedSource: TAHPI, Health Facility briefing system, reference data is based on data extracted from the Australian Institute of Health and Welfare,supplemented by data from the USA inpatient sample and UK Hospital Episode Statistics Online (HES)Assumptions Projected bed numbers from 2016 onwards are based on ‘International Average’ ALOS and 75% occupancy for ICU beds.
Population growth based on: Abu Dhabi Urban Planning Council 2030 Plan projections, ‘Advantaged’ socio-economic classand with life expectancy >77years. Expatriate utilisation increases from 45% of UAE National utilisation to 55% of UAENational utilisation. Sub acute number of beds adjusted to meet international benchmark
Bed Occupancy 2011 Actual 2016 2021 2026 2031Acute Overnight
Episodes122,345 184,102 223,539 276,589 332,040
Acute Overnight Beds Current (58%) 3,289 3,992 5,223 6,769 7,061
Intermediate (70%) 3,308 4,328 5,609 5,850
Target (85%) 2,724 3,564 4,619 4,818
Sub Acute Overnight
EpisodesN/A 3,216 4,233 5,461 6,738
Sub Acute Overnight
Beds224 342 438 449 525
ICU beds 146 175 209 245 281
Emergency Bays N/A 789 987 1,182 1,379
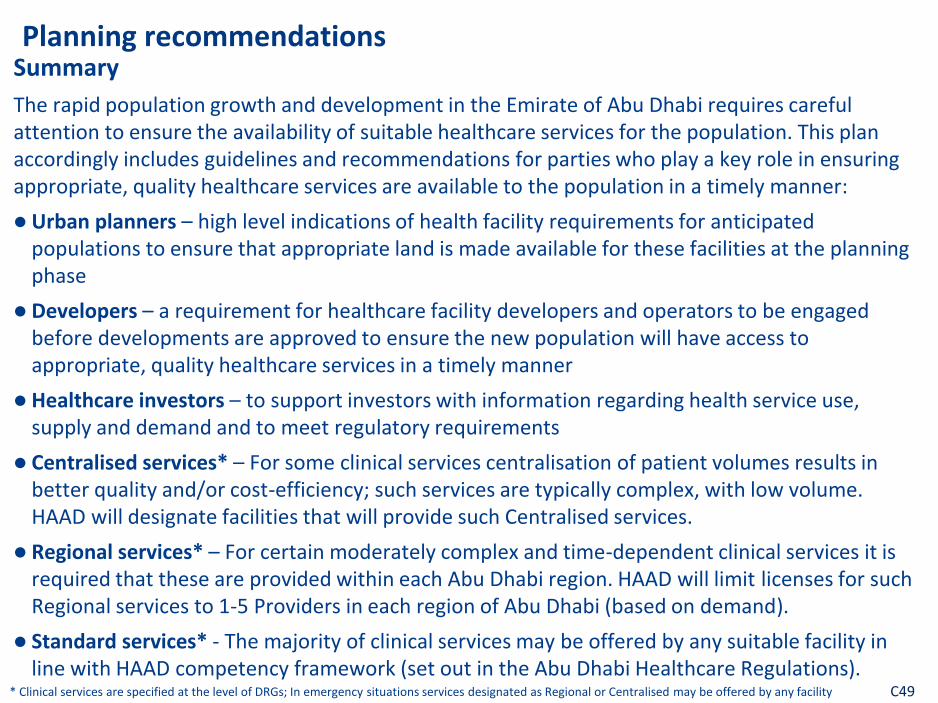
Summary
The rapid population growth and development in the Emirate of Abu Dhabi requires careful attention to ensure the availability of suitable healthcare services for the population. This plan accordingly includes guidelines and recommendations for parties who play a key role in ensuring appropriate, quality healthcare services are available to the population in a timely manner:
Urban planners – high level indications of health facility requirements for anticipated populations to ensure that appropriate land is made available for these facilities at the planning phase
Developers – a requirement for healthcare facility developers and operators to be engaged before developments are approved to ensure the new population will have access to appropriate, quality healthcare services in a timely manner
Healthcare investors – to support investors with information regarding health service use, supply and demand and to meet regulatory requirements
Centralised services* – For some clinical services centralisation of patient volumes results in better quality and/or cost-efficiency; such services are typically complex, with low volume. HAAD will designate facilities that will provide such Centralised services.
Regional services* – For certain moderately complex and time-dependent clinical services it is required that these are provided within each Abu Dhabi region. HAAD will limit licenses for such Regional services to 1-5 Providers in each region of Abu Dhabi (based on demand).
Standard services* - The majority of clinical services may be offered by any suitable facility in line with HAAD competency framework (set out in the Abu Dhabi Healthcare Regulations).
Planning recommendations
C49 * Clinical services are specified at the level of DRGs; In emergency situations services designated as Regional or Centralised may be offered by any facility

• Health facility developments must: — Meet HAAD licensing requirements (available at www.haad.ae). — Ensure any designated minimum service requirements set out in the Land
Requirements Guidelines for Urban Planners are met.
• From 2013 Providers intending to provide inpatient services, at DRG level, categorised as Centralised or Regional by HAAD must obtain HAAD approval and (re)licence1 prior to establishing services.
• Additional guidance regarding healthcare capacity and demand projections are available within this document, HAAD’s Health Statistics.
Facility recommendations for developers, investors, and healthcare Providers
1 HAAD is currently amending it’s Licensing process to require submission and approval of all intended services specified at DRG level. C50

• Developers for projects with intended residential populations of 4,000 or more must have engaged a developer and operator for the healthcare facilities within the development
• Developers should notify the Executive Council’s Social Development Sub-Committee of their intended plans (copying UPC) in the context of combining/sharing healthcare facilities with other social infrastructure, e.g., community centers
• Services must be designed and operated in accordance with the Abu Dhabi Healthcare Regulations (available at www.haad.ae)
Service recommendations for investors and developers
C51

For planning purposes, land must be available for hospitals, clinics and ambulance stations to serve anticipated population as per the following guidelines:
Notes 1Transient population includes staff and other non-residential visitors 2Clinics collectively refers to Clinics, Centers and Polyclinics 3Clinics may be co-located with other facilities including Mosques, Neighbourhood Commercial Centres, Sport Facilities, Community/Cultural Centres, Pharmacies, Schools and Post Offices. Ambulance Stations may be co-located with other facilities including Hospitals, Civil Defense Stations, Police Stations and Municipal Offices Where facilities are co-located, adequate transport options and shared parking must be made available.
4 If residential population is less than 60,000 or transient population is less than 180,000, land provision for a hospital facility needs to be made on a site-based analysis which considers the accessibility of existing hospital facilities 5Optimal hospital size is 200-600 beds 6GFA Ground Floor Area Source Strategy analysis C52
Population (000’s people)
Land provision options (m2 000’s)
Parking (spaces)
Minimum service requirement
Estimated Resources
Residential Transient1 Land area Co-located GFA3,6
Clinics2 4-5 12-15 6 2.5 25 •Primary care •Pharmacy services (on-site or within 10 min walk) •Laboratory service
2 Physicians
8-12 24-36 7 3 30 4-6 Physicians
12-30 36-90 8.5 3.5 35 7-14 Physicians
30-40 90-120 12 4.5 45 15-20 Physicians
Ambulance Stations
10-16 30-48 3 1.5 10 •Ambulance service (land /air) 1 Ambulance
16-40 48-120 4 2 15 •Ambulance service (land /air) 2 Ambulances
Hospitals4 60-90 180-270 40 n/a 3/bed •Emergency services •Laboratory services •Radiology services •Stand-alone building
180-270 Beds5
90-110 270-330 80 n/a 3/bed 270-330 beds5
OR OR
Recommendation for allocation of land and service provision

Healthcare services should be provided to meet the following access requirements in relation to routine/elective services and emergency services:
Access requirements
Note Alternative solutions such as air ambulance should be utilised to achieve emergency service access requirements in rural and/or densely populated urban areas
Source Department of Health UK, Strategy analysis
Routine/Elective Emergency services
Urban Primary care services within 20 minutes drive at maximum speed of 60 kph
Ambulance access within 15 minutes, if via land driving at maximum speed of 60 kph
Rural Primary care services within 20 minutes drive at maximum speed of 120 kph
Ambulance access within 19 minutes, if via land driving at maximum speed of 120 kph
C53

Facilities
Population served (000’s)
Land to be provided (m2 000’s)
1 5
1 10 50 5.5 GFA +12 Land plot
1 35
1 12 50 2 GFA + 3 Land plot
1 38
Development is for less than 60k residents, site analysis indicates that Al Rahba Hospital located nearby thus no need to provide hospital facility within development
Case example (planning recommendations)
Source Strategy analysis
Population (000’s people)
Land provision options (m2 000’s)
Residential Transient1 Land area Co-located GFA3
Clinics2 4-5 12-15 6 2.5
8-12 24-36 7 3
12-30 36-90 8.5 3.5
30-40 90-120 12 4.5
Ambulance Stations
10-16 30-48 3 1.5
16-40 48-120 4 2
Hospitals4 60-80 180-240 80 n/a
90-110 270-330 100 n/a
OR OR
Villa and associated community facilities and retail development located adjacent to Al Rahba
Anticipated residential population of 50,000 residents and transient (visitor) population expected to be less than 2,000
C54