Embed Size (px)
Citation preview
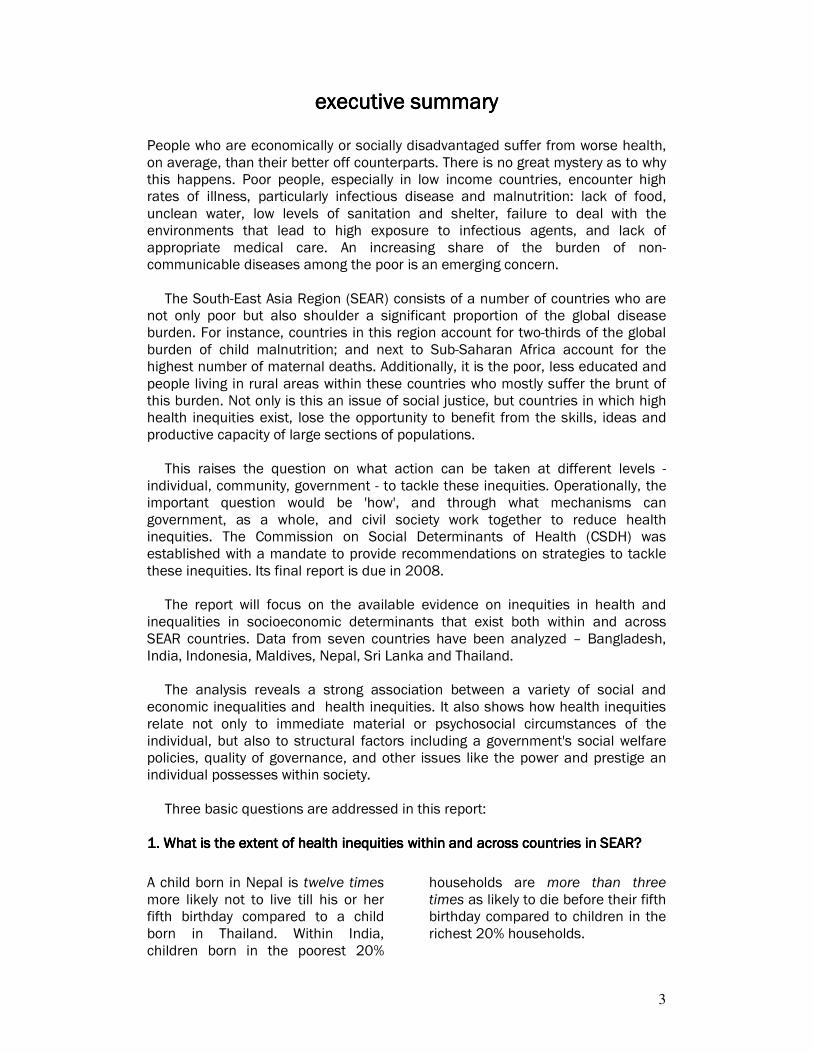
December 2007December 2007December 2007December 2007
Health Inequities in the South-East Asia Region
magnitude and trends
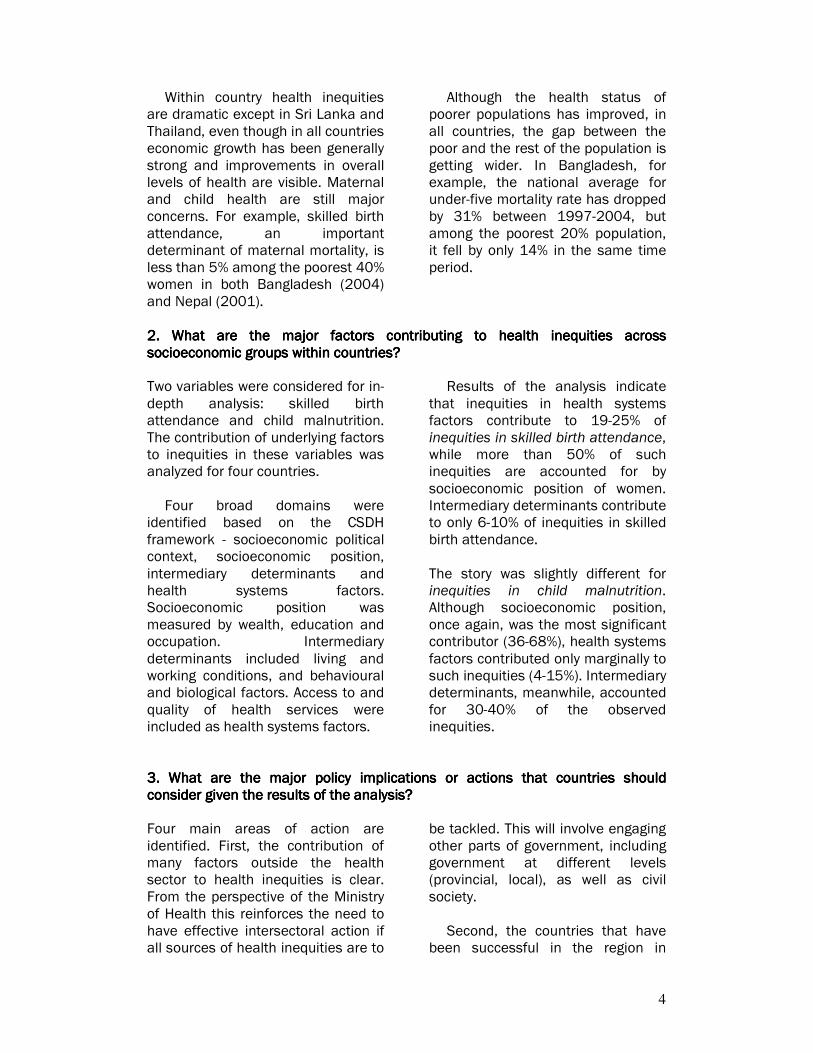
27%
18%
14%
12%
8%
8%
13% Wealth
Quality of antenatal care
Mother's education
Urban
Partner's education
Valid antenatal care
Other
what contributes to
health inequities
and
0
20
40
60
80
100
120
140
160
1997 2000 2004Under five mortality rate per 1,000 live births
Poorest 20% Q2 Q3 Q4 Richest 20%

2
This report was prepared for the World Health Organization's South-East Asia Regional Office (WHO-SEARO) in relation to enhancing the visibility of health inequities and their underlying determinants within the region. This work was made possible by support from U. Than Sein and Davison Munodawafa from WHO-SEARO. The analysis for this report was primarily conducted by Fazana Saleem-Ismail, Ravi P. Rannan Eliya and Chamikara Perera at the Institute for Health Policy in Colombo, Sri Lanka. The team also contributed to the writing of the report. Coordination, technical support, and writing of the report was undertaken by Amit Prasad, Ahmad Hosseinpoor, Jeanette Vega, Ritu Sadana, Nicole Valentine and Orielle Solar from the Department of Ethics, Equity, Trade and Human Rights at WHO Geneva (WHO/ETH). Valuable input to the report has been provided by David Evans and Phyllida Travis from WHO
Geneva.
3
executive summaryexecutive summaryexecutive summaryexecutive summary
People who are economically or socially disadvantaged suffer from worse health, on average, than their better off counterparts. There is no great mystery as to why this happens. Poor people, especially in low income countries, encounter high rates of illness, particularly infectious disease and malnutrition: lack of food, unclean water, low levels of sanitation and shelter, failure to deal with the environments that lead to high exposure to infectious agents, and lack of appropriate medical care. An increasing share of the burden of non-communicable diseases among the poor is an emerging concern.
The South-East Asia Region (SEAR) consists of a number of countries who are not only poor but also shoulder a significant proportion of the global disease burden. For instance, countries in this region account for two-thirds of the global burden of child malnutrition; and next to Sub-Saharan Africa account for the highest number of maternal deaths. Additionally, it is the poor, less educated and people living in rural areas within these countries who mostly suffer the brunt of this burden. Not only is this an issue of social justice, but countries in which high health inequities exist, lose the opportunity to benefit from the skills, ideas and productive capacity of large sections of populations.
This raises the question on what action can be taken at different levels -
individual, community, government - to tackle these inequities. Operationally, the important question would be 'how', and through what mechanisms can government, as a whole, and civil society work together to reduce health inequities. The Commission on Social Determinants of Health (CSDH) was established with a mandate to provide recommendations on strategies to tackle these inequities. Its final report is due in 2008.
The report will focus on the available evidence on inequities in health and
inequalities in socioeconomic determinants that exist both within and across SEAR countries. Data from seven countries have been analyzed – Bangladesh, India, Indonesia, Maldives, Nepal, Sri Lanka and Thailand.
The analysis reveals a strong association between a variety of social and economic inequalities and health inequities. It also shows how health inequities relate not only to immediate material or psychosocial circumstances of the individual, but also to structural factors including a government's social welfare policies, quality of governance, and other issues like the power and prestige an individual possesses within society.
Three basic questions are addressed in this report:
1. What is the extent of health inequities within and across countries in SEAR? 1. What is the extent of health inequities within and across countries in SEAR? 1. What is the extent of health inequities within and across countries in SEAR? 1. What is the extent of health inequities within and across countries in SEAR?
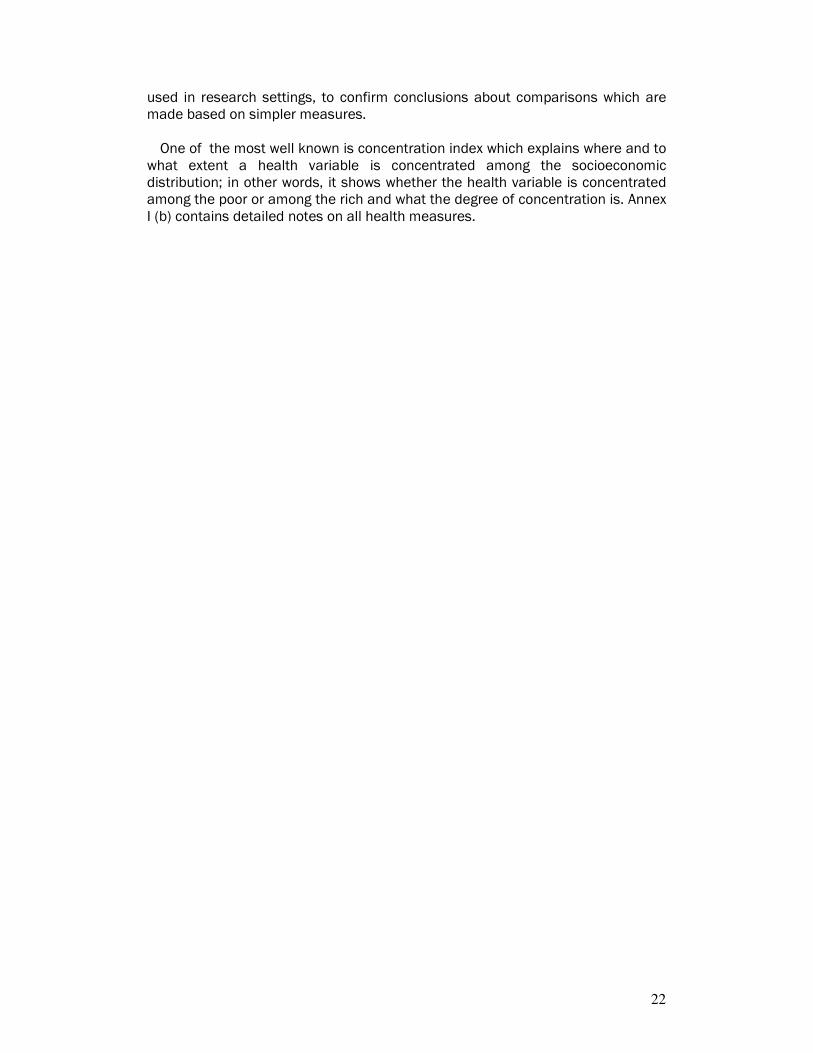
A child born in Nepal is twelve times more likely not to live till his or her fifth birthday compared to a child born in Thailand. Within India, children born in the poorest 20%
households are more than three times as likely to die before their fifth birthday compared to children in the richest 20% households.
4
Within country health inequities are dramatic except in Sri Lanka and Thailand, even though in all countries economic growth has been generally strong and improvements in overall levels of health are visible. Maternal and child health are still major concerns. For example, skilled birth attendance, an important determinant of maternal mortality, is less than 5% among the poorest 40% women in both Bangladesh (2004) and Nepal (2001).
Although the health status of poorer populations has improved, in all countries, the gap between the poor and the rest of the population is getting wider. In Bangladesh, for example, the national average for under-five mortality rate has dropped by 31% between 1997-2004, but among the poorest 20% population, it fell by only 14% in the same time period.
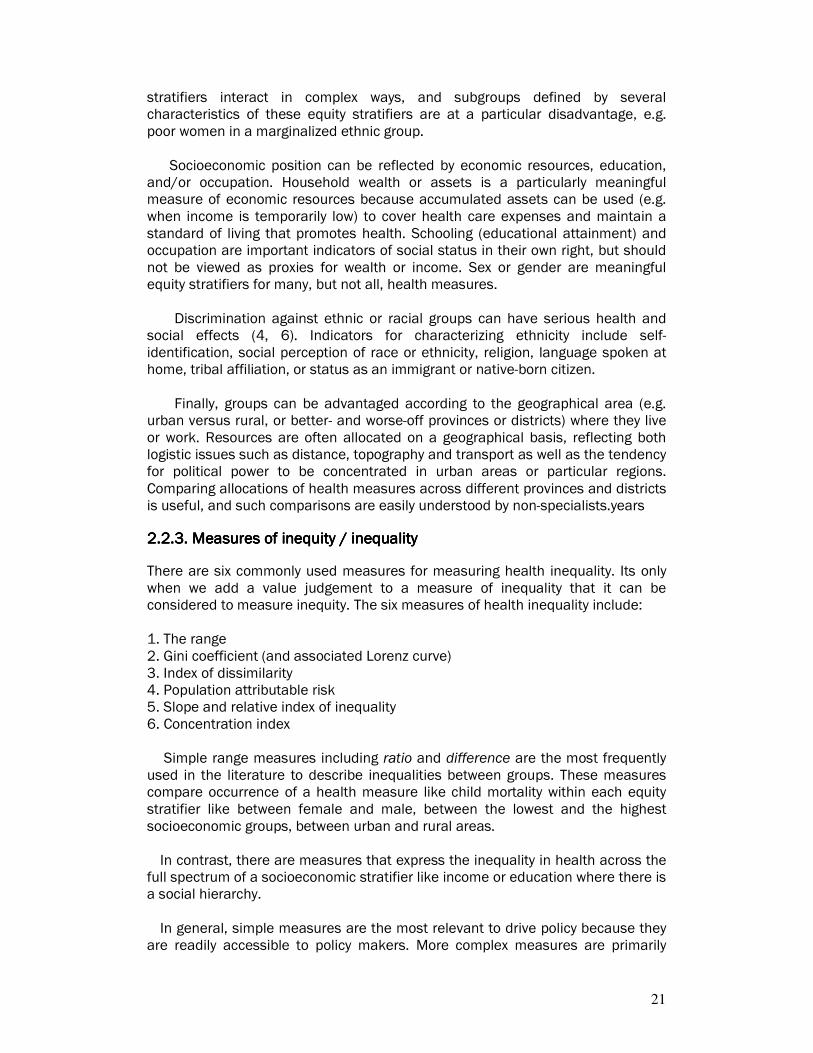
2222. What . What . What . What are the major factors contributing to health inequities across are the major factors contributing to health inequities across are the major factors contributing to health inequities across are the major factors contributing to health inequities across socioeconomic groups within countriessocioeconomic groups within countriessocioeconomic groups within countriessocioeconomic groups within countries???? Two variables were considered for in-depth analysis: skilled birth attendance and child malnutrition. The contribution of underlying factors to inequities in these variables was analyzed for four countries.
Four broad domains were identified based on the CSDH framework - socioeconomic political context, socioeconomic position, intermediary determinants and health systems factors. Socioeconomic position was measured by wealth, education and occupation. Intermediary determinants included living and working conditions, and behavioural and biological factors. Access to and quality of health services were included as health systems factors.
Results of the analysis indicate that inequities in health systems factors contribute to 19-25% of inequities in skilled birth attendance, while more than 50% of such inequities are accounted for by socioeconomic position of women. Intermediary determinants contribute to only 6-10% of inequities in skilled birth attendance.
The story was slightly different for inequities in child malnutrition. Although socioeconomic position, once again, was the most significant contributor (36-68%), health systems factors contributed only marginally to such inequities (4-15%). Intermediary determinants, meanwhile, accounted for 30-40% of the observed inequities.
3333. What . What . What . What are the major policy implications or actions that countrieare the major policy implications or actions that countrieare the major policy implications or actions that countrieare the major policy implications or actions that countries should s should s should s should consider given the results of the analysisconsider given the results of the analysisconsider given the results of the analysisconsider given the results of the analysis???? Four main areas of action are identified. First, the contribution of many factors outside the health sector to health inequities is clear. From the perspective of the Ministry of Health this reinforces the need to have effective intersectoral action if all sources of health inequities are to
be tackled. This will involve engaging other parts of government, including government at different levels (provincial, local), as well as civil society. Second, the countries that have been successful in the region in
5
eliminating health inequities have almost universal coverage of basic health services. For example, skilled birth attendance coverage in both Sri Lanka and Thailand is above 95% and even the poorest populations have more than 90% coverage. Third, the results reveal that poverty and food security are the most critical issues to address if child malnutrition is to be reduced. Recent debate in the region has focused on the importance of feeding practices, which is partly true, but household poverty appears to be more significant in determining the nutrition status of a child.
Fourth, much can be learned by increasing opportunities for exchange of information between countries. Sri Lanka and Thailand, and of late Maldives, have been successful in addressing a number of critical issues especially with respect to maternal and child health. Parts of India, Bangladesh and other countries too, have success stories to share about ways of improving health equity. Information exchange and dialogue would vastly improve the knowledge base available to policy makers in the SEAR countries given their similarities.
This report's analysis and recommendations have already been presented and discussed at the "Regional Consultation on Social Determinants of Health in South-East Asia" in Colombo, Sri Lanka in October 2007. Policy makers, ministry officials, academics, and civil society representatives were present from 9 of the 11 member countries1 of the South-East Asian Region of the World Health Organization. Participants at the consultation, among other issues, expressed enthusiasm in: 1111.... Increasing the visibility of health inequities by regularly monitoring health
indicators by equity stratifiers, and by conducting health equity analysis. 2222.... Building institutional mechanisms and frameworks for intersectoral action for
health to tackle health inequities. 3333.... Enhancing social participation by engaging civil society and documenting the
knowledge from their experiences.
1 The nine countries represented in this meeting included Bangladesh, Bhutan, India, Indonesia,
Maldives, Myanmar, Nepal, Sri Lanka and Thailand. Representatives from North Korea and Timor-
Leste, the other two WHO-SEAR countries, were not present.
6
TABLE OFTABLE OFTABLE OFTABLE OF CONTENTS CONTENTS CONTENTS CONTENTS
1. INTRODUCTION1. INTRODUCTION1. INTRODUCTION1. INTRODUCTION 10
1.1.1.1.1.1.1.1. OOOOBJECTIVESBJECTIVESBJECTIVESBJECTIVES 10 1.1.1. DESCRIBING THE MAGNITUDE OF HEALTH INEQUITIES 11 1.1.2. IDENTIFYING THE DETERMINANTS OF HEALTH INEQUITIES 11 1.2.1.2.1.2.1.2. CCCCOUNTRY CONTEXTOUNTRY CONTEXTOUNTRY CONTEXTOUNTRY CONTEXT 13 1.3.1.3.1.3.1.3. HHHHEALTH SITUATION IN CEALTH SITUATION IN CEALTH SITUATION IN CEALTH SITUATION IN COUNTRIESOUNTRIESOUNTRIESOUNTRIES 16
2. HEALTH INEQUITIES2. HEALTH INEQUITIES2. HEALTH INEQUITIES2. HEALTH INEQUITIES: CONCEPTS AND MEASU: CONCEPTS AND MEASU: CONCEPTS AND MEASU: CONCEPTS AND MEASUREMENTREMENTREMENTREMENT 19
2.1.2.1.2.1.2.1. HHHHEALTH INEQEALTH INEQEALTH INEQEALTH INEQUITIESUITIESUITIESUITIES,,,, INEQUALITIES AND SO INEQUALITIES AND SO INEQUALITIES AND SO INEQUALITIES AND SOCIAL JUSTICECIAL JUSTICECIAL JUSTICECIAL JUSTICE 19 2.2.2.2.2.2.2.2. MMMMEASUREMENT OF HEALTHEASUREMENT OF HEALTHEASUREMENT OF HEALTHEASUREMENT OF HEALTH INEQUITIES INEQUITIES INEQUITIES INEQUITIES 20 2.2.1. HEALTH MEASURES 20 2.2.2. EQUITY STRATIFIERS 20 2.2.3. MEASURES OF INEQUITY / INEQUALITY 21
3. METHODS3. METHODS3. METHODS3. METHODS 23
3.1.3.1.3.1.3.1. CCCCONCEPTUAL FRAMEWORKONCEPTUAL FRAMEWORKONCEPTUAL FRAMEWORKONCEPTUAL FRAMEWORK 23 3.2.3.2.3.2.3.2. DDDDATAATAATAATA 24 3.3.3.3.3.3.3.3. IIIINDICATORSNDICATORSNDICATORSNDICATORS 26 3.4.3.4.3.4.3.4. AAAANALYTICAL NALYTICAL NALYTICAL NALYTICAL AAAAPPROACHPPROACHPPROACHPPROACH 26 3.4.1. DESCRIPTIVE 26 3.4.2. TIME TRENDS 27 3.4.3. DECOMPOSITION OF SOCIO-ECONOMIC INEQUALITY 27 3.5.3.5.3.5.3.5. IIIINTERPRETATION APPROANTERPRETATION APPROANTERPRETATION APPROANTERPRETATION APPROACHCHCHCH 27
4. HEALTH INEQUITIES4. HEALTH INEQUITIES4. HEALTH INEQUITIES4. HEALTH INEQUITIES: MAGNITUDES AND TRE: MAGNITUDES AND TRE: MAGNITUDES AND TRE: MAGNITUDES AND TRENDSNDSNDSNDS 29
4.1.4.1.4.1.4.1. IIIINEQUITIES IN HEALTH NEQUITIES IN HEALTH NEQUITIES IN HEALTH NEQUITIES IN HEALTH OUTCOMES WITHIN AND OUTCOMES WITHIN AND OUTCOMES WITHIN AND OUTCOMES WITHIN AND ACROSS COUNTRIESACROSS COUNTRIESACROSS COUNTRIESACROSS COUNTRIES 29 4.1.1. INFANT MORTALITY 29 4.1.2. UNDER-FIVE MORTALITY 30 4.1.3. PREVALENCE OF STUNTING IN CHILDREN UNDER FIVE 31 4.1.4. PREVALENCE OF UNDERWEIGHT WOMEN 33 4.1.5. PREVALENCE OF OVERWEIGHT WOMEN 34 4.2.4.2.4.2.4.2. IIIINEQUITIES IN HEALTH NEQUITIES IN HEALTH NEQUITIES IN HEALTH NEQUITIES IN HEALTH SYSTEMS VARIABLES WISYSTEMS VARIABLES WISYSTEMS VARIABLES WISYSTEMS VARIABLES WITHIN AND ACROSS COUNTHIN AND ACROSS COUNTHIN AND ACROSS COUNTHIN AND ACROSS COUNTRIESTRIESTRIESTRIES 35 4.2.1. COVERAGE OF DPT3 VACCINATION 35 4.2.2. COVERAGE OF SKILLED BIRTH ATTENDANCE 37 4.2.3. USE OF MODERN CONTRACEPTION 38 4.3.4.3.4.3.4.3. IIIINEQUITIES IN KEY HEANEQUITIES IN KEY HEANEQUITIES IN KEY HEANEQUITIES IN KEY HEALTH DETERMINANTS WITLTH DETERMINANTS WITLTH DETERMINANTS WITLTH DETERMINANTS WITHIN AND ACROSS COUNTHIN AND ACROSS COUNTHIN AND ACROSS COUNTHIN AND ACROSS COUNTRIESRIESRIESRIES 40 4.3.1. EXPOSURE TO SAFE WATER 40 4.3.2. EXPOSURE TO SAFE SANITATION 41
5. IDENTIFYING DETER5. IDENTIFYING DETER5. IDENTIFYING DETER5. IDENTIFYING DETERMINANTS OF HEALTH INMINANTS OF HEALTH INMINANTS OF HEALTH INMINANTS OF HEALTH INEQUITIESEQUITIESEQUITIESEQUITIES 43
5.1.5.1.5.1.5.1. MMMMAIN CONTRIBUTORS TO AIN CONTRIBUTORS TO AIN CONTRIBUTORS TO AIN CONTRIBUTORS TO INEQUITIES IN SKILLEINEQUITIES IN SKILLEINEQUITIES IN SKILLEINEQUITIES IN SKILLED BIRTH AD BIRTH AD BIRTH AD BIRTH ATTENDANCETTENDANCETTENDANCETTENDANCE 44 5.2.5.2.5.2.5.2. MMMMAIN CONTRIBUTORS TO AIN CONTRIBUTORS TO AIN CONTRIBUTORS TO AIN CONTRIBUTORS TO INEQUITIES IN CHILDHINEQUITIES IN CHILDHINEQUITIES IN CHILDHINEQUITIES IN CHILDHOOD STUNTINGOOD STUNTINGOOD STUNTINGOOD STUNTING 46
7
6. DISCUSSION6. DISCUSSION6. DISCUSSION6. DISCUSSION 49
6.1.6.1.6.1.6.1. OOOOVERALL MAGNITUDE ANDVERALL MAGNITUDE ANDVERALL MAGNITUDE ANDVERALL MAGNITUDE AND TRENDS IN HEALTH IN TRENDS IN HEALTH IN TRENDS IN HEALTH IN TRENDS IN HEALTH INEQUITIESEQUITIESEQUITIESEQUITIES 49 6.2.6.2.6.2.6.2. KKKKEY DISCUSSION POINTSEY DISCUSSION POINTSEY DISCUSSION POINTSEY DISCUSSION POINTS FROM THE SKILLED BI FROM THE SKILLED BI FROM THE SKILLED BI FROM THE SKILLED BIRTH ATTENDANCE ANALYRTH ATTENDANCE ANALYRTH ATTENDANCE ANALYRTH ATTENDANCE ANALYSISSISSISSIS 49 6.3.6.3.6.3.6.3. KKKKEY DISCUSSION POINTSEY DISCUSSION POINTSEY DISCUSSION POINTSEY DISCUSSION POINTS FROM THE CHILD MALN FROM THE CHILD MALN FROM THE CHILD MALN FROM THE CHILD MALNUTRITION ANALYSISUTRITION ANALYSISUTRITION ANALYSISUTRITION ANALYSIS 50 6.4.6.4.6.4.6.4. LLLLIMITATIONS OF THE ANIMITATIONS OF THE ANIMITATIONS OF THE ANIMITATIONS OF THE ANALYSISALYSISALYSISALYSIS 50 6.5.6.5.6.5.6.5. KKKKEY IMPLICATIONS FOR EY IMPLICATIONS FOR EY IMPLICATIONS FOR EY IMPLICATIONS FOR POLICY AND ACTIONSPOLICY AND ACTIONSPOLICY AND ACTIONSPOLICY AND ACTIONS 51 6.5.1. THE ROLE OF THE HEALTH SECTOR 51 6.5.2. INTERSECTORAL ACTION FOR HEALTH 51 6.5.3. IMPROVING FOOD SECURITY AND REDUCING POVERTY 52 6.5.4. KNOWLEDGE EXCHANGE AND SHARING BETWEEN COUNTRIES 52
ANNEX I. TECHNICAL ANNEX I. TECHNICAL ANNEX I. TECHNICAL ANNEX I. TECHNICAL NOTES AND DEFINITIONNOTES AND DEFINITIONNOTES AND DEFINITIONNOTES AND DEFINITIONSSSS 53
(A)(A)(A)(A) HHHHOUSEHOLD WEALTOUSEHOLD WEALTOUSEHOLD WEALTOUSEHOLD WEALTH INDEXH INDEXH INDEXH INDEX 54 (B)(B)(B)(B) MMMMEASURES OF INEQUALITEASURES OF INEQUALITEASURES OF INEQUALITEASURES OF INEQUALITY IN HEALTHY IN HEALTHY IN HEALTHY IN HEALTH 55 B.1. The rangeB.1. The rangeB.1. The rangeB.1. The range 55 B.2. Gini coefficient (and associated Lorenz curve)B.2. Gini coefficient (and associated Lorenz curve)B.2. Gini coefficient (and associated Lorenz curve)B.2. Gini coefficient (and associated Lorenz curve) 55 B.3. Index oB.3. Index oB.3. Index oB.3. Index of dissimilarityf dissimilarityf dissimilarityf dissimilarity 56 B.4. Population attributable riskB.4. Population attributable riskB.4. Population attributable riskB.4. Population attributable risk 56 B.5. Slope and relative index of inequalityB.5. Slope and relative index of inequalityB.5. Slope and relative index of inequalityB.5. Slope and relative index of inequality 57 B.6. Concentration index and the concentration curveB.6. Concentration index and the concentration curveB.6. Concentration index and the concentration curveB.6. Concentration index and the concentration curve 57 (C)(C)(C)(C) DDDDECOMPOSITION ANALYSIECOMPOSITION ANALYSIECOMPOSITION ANALYSIECOMPOSITION ANALYSISSSS 58
ANNEX II. COUNTRY REANNEX II. COUNTRY REANNEX II. COUNTRY REANNEX II. COUNTRY REPORTSPORTSPORTSPORTS 60
BBBBANGLADESHANGLADESHANGLADESHANGLADESH 61 IIIINDIANDIANDIANDIA 72 IIIINDONESIANDONESIANDONESIANDONESIA 80 NNNNEPALEPALEPALEPAL 89 SSSSRI RI RI RI LLLLANKAANKAANKAANKA 100
STATISTICAL ANNEX I.STATISTICAL ANNEX I.STATISTICAL ANNEX I.STATISTICAL ANNEX I. INEQUITIES IN HEALT INEQUITIES IN HEALT INEQUITIES IN HEALT INEQUITIES IN HEALTH DETERMINANTS AND OH DETERMINANTS AND OH DETERMINANTS AND OH DETERMINANTS AND OUTCOMES BY UTCOMES BY UTCOMES BY UTCOMES BY EQUITY STRATIFIERSEQUITY STRATIFIERSEQUITY STRATIFIERSEQUITY STRATIFIERS 109
REFERENCESREFERENCESREFERENCESREFERENCES 121
8
List of TablesList of TablesList of TablesList of Tables
TABLE 1 SOCIOECONOMIC CONTEXT INDICATORS FOR SEAR COUNTRIES INCLUDED IN THIS REPORT .......................15 TABLE 2 SELECTED HEALTH OUTCOMES, HEALTH SYSTEMS AND HEALTH DETERMINANTS INDICATORS FOR SEAR
COUNTRIES.......................................................................................................................................17 TABLE 3: SURVEYS USED AS DATA SOURCES IN STUDY .....................................................................................25 TABLE 4: DEFINITIONS OF INDICATORS ANALYZED IN THE STUDY ........................................................................26 TABLE 5: MAJOR DETERMINANTS IDENTIFIED UNDER BROAD CATEGORIES OF THE FRAMEWORK .............................44 TABLE 6: PERCENTAGE CONTRIBUTION TO INEQUITIES IN SKILLED BIRTH ATTENDANCE OF SIX OF THE MOST COMMON
DETERMINANTS (THAT CONTRIBUTE POSITIVELY TO INEQUITIES) ACROSS THE FOUR COUNTRIES .....................46 TABLE 7: PERCENTAGE CONTRIBUTION TO INEQUITIES IN CHILDHOOD STUNTING OF SIX OF THE MOST COMMON
DETERMINANTS (THAT CONTRIBUTE POSITIVELY TO INEQUITIES) ACROSS THE FOUR COUNTRIES .....................48

9
10
1. INTRODUCTION1. INTRODUCTION1. INTRODUCTION1. INTRODUCTION Health inequities are found in all countries. The magnitude of these inequities, however, varies significantly between countries. South-East Asia is characterized by substantial health inequities both across and within countries. The region also lags most other regions in its overall health attainments.
Reducing health inequities matters for various critical reasons. First, health equity is a central dimension of overall equity and justice. It conditions the capabilities of individuals and groups to participate in and benefit from social and economic development. Second, good health is instrumental to enable people to participate in society, with potentially positive consequences for economic performance. Health inequities most adversely impact vulnerable and impoverished populations, thereby, further reducing their freedom to lead lives they have reason to value and contribute to social and economic development.
If health inequities are to be reduced systematically, then governments and policy makers will find it useful to understand better what drives these inequities. It is also necessary to understand in each case how important health sector interventions are, and also to be aware if interventions outside the health sector are necessary to reduce health inequities. The purpose of this report is to begin to do this, by examining some of these inequities and their determinants.
In subsequent sections of this report we will clarify the concepts and methods
used to develop the final messages, describe the magnitude and trends of health inequities in South-East Asian countries, identify the extent of contribution of determinants to health inequities, and develop key messages based on the results of the analysis. Although the report briefly discusses the main policy implications from the results it does not discuss the mechanisms or provide any tools for operationalizing the recommendations. This latter piece of work is beyond the scope of this report but is being addressed by the Commission on Social Determinants of Health.
Country indicators and analyses are presented from most recent publicly
available household survey data at the time the analysis was undertaken.
1.1. Objectives1.1. Objectives1.1. Objectives1.1. Objectives
There are multiple approaches to understanding the magnitude of health inequities and what contributes to them. This report will primarily focus on analyzing available quantitative data and applying new statistical methods to determine the magnitude of health inequities in South-East Asia, and unpack the contribution of factors to such inequities. The latter initiative will, in principle, assist policy makers in identifying priority areas for action with respect to reducing health inequities.
11
0
20
40
60
80
100
120
140
160
Poorest
20%
Q2 Q3 Q4 Richest
20%
Under five mortality rate
per 1,000 live births
Bangladesh 2004
India 1998
Indonesia 2003
Nepal 2001
Sri Lanka 2000
Thailand 2006
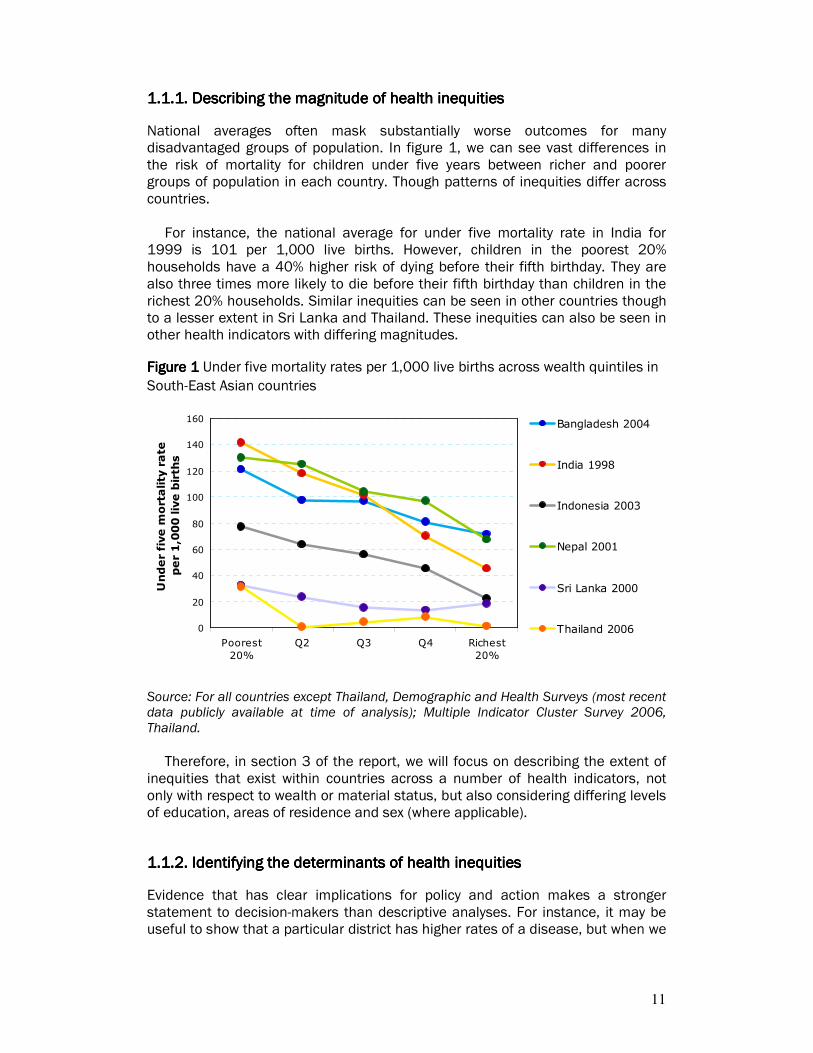
1.1.1. Describing the magnitude of health inequities1.1.1. Describing the magnitude of health inequities1.1.1. Describing the magnitude of health inequities1.1.1. Describing the magnitude of health inequities
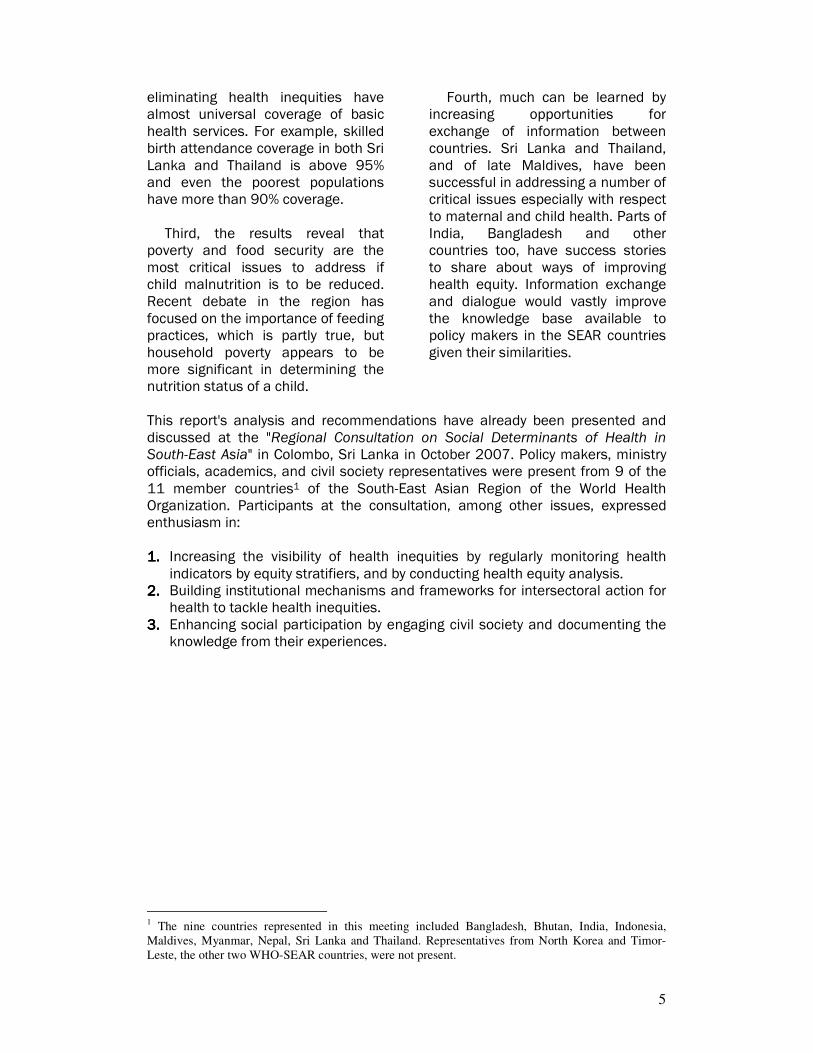
National averages often mask substantially worse outcomes for many disadvantaged groups of population. In figure 1, we can see vast differences in the risk of mortality for children under five years between richer and poorer groups of population in each country. Though patterns of inequities differ across countries.
For instance, the national average for under five mortality rate in India for 1999 is 101 per 1,000 live births. However, children in the poorest 20% households have a 40% higher risk of dying before their fifth birthday. They are also three times more likely to die before their fifth birthday than children in the richest 20% households. Similar inequities can be seen in other countries though to a lesser extent in Sri Lanka and Thailand. These inequities can also be seen in other health indicators with differing magnitudes.
Source: For all countries except Thailand, Demographic and Health Surveys (most recent data publicly available at time of analysis); Multiple Indicator Cluster Survey 2006, Thailand.
Therefore, in section 3 of the report, we will focus on describing the extent of
inequities that exist within countries across a number of health indicators, not only with respect to wealth or material status, but also considering differing levels of education, areas of residence and sex (where applicable).
1.1.2. Identifying the determinants of health inequities1.1.2. Identifying the determinants of health inequities1.1.2. Identifying the determinants of health inequities1.1.2. Identifying the determinants of health inequities
Evidence that has clear implications for policy and action makes a stronger statement to decision-makers than descriptive analyses. For instance, it may be useful to show that a particular district has higher rates of a disease, but when we
Figure Figure Figure Figure 1111 Under five mortality rates per 1,000 live births across wealth quintiles in
South-East Asian countries
12
can show who is affected, why, and what could be changed, the argument for action strengthens.
This can often be accomplished through simple analyses using existing information and disaggregating them by socioeconomic groups. Decomposition analysis, for instance, demonstrates pathways of health determinants, showing the importance of non-health sectors in both generating and addressing health concerns. Decomposition analyses often suggest that collaborative, intersectoral strategies are needed.
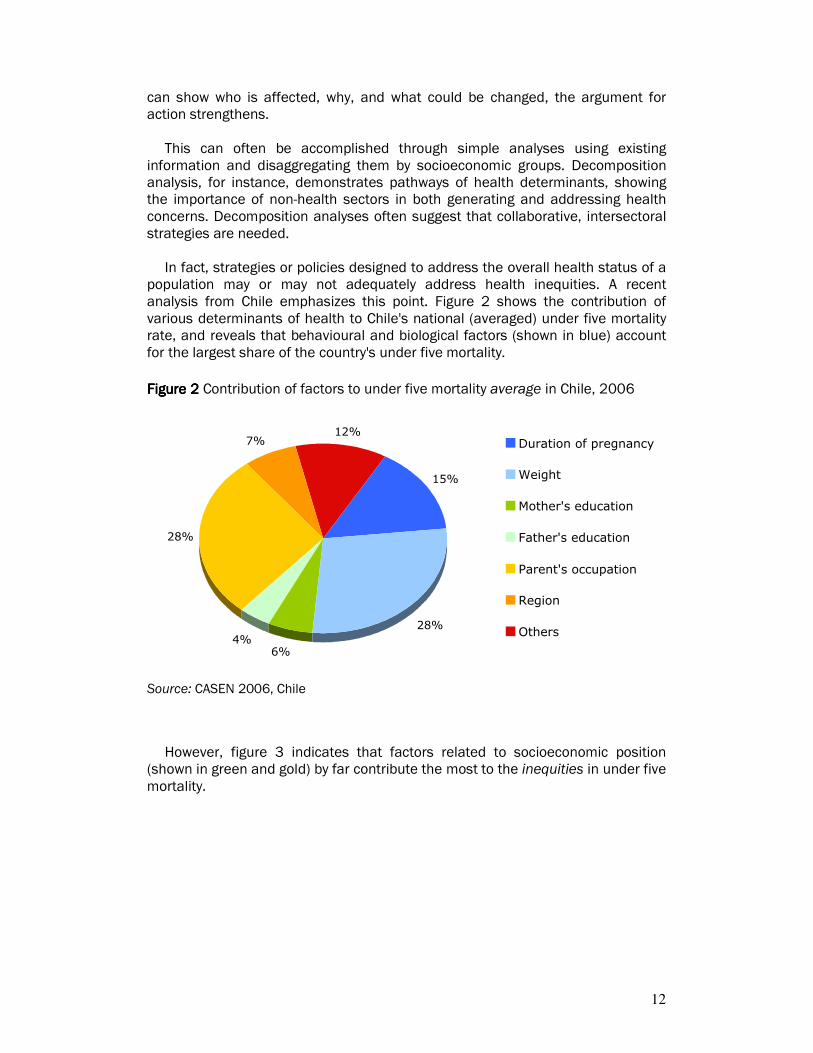
In fact, strategies or policies designed to address the overall health status of a
population may or may not adequately address health inequities. A recent analysis from Chile emphasizes this point. Figure 2 shows the contribution of various determinants of health to Chile's national (averaged) under five mortality rate, and reveals that behavioural and biological factors (shown in blue) account for the largest share of the country's under five mortality.
Source: CASEN 2006, Chile
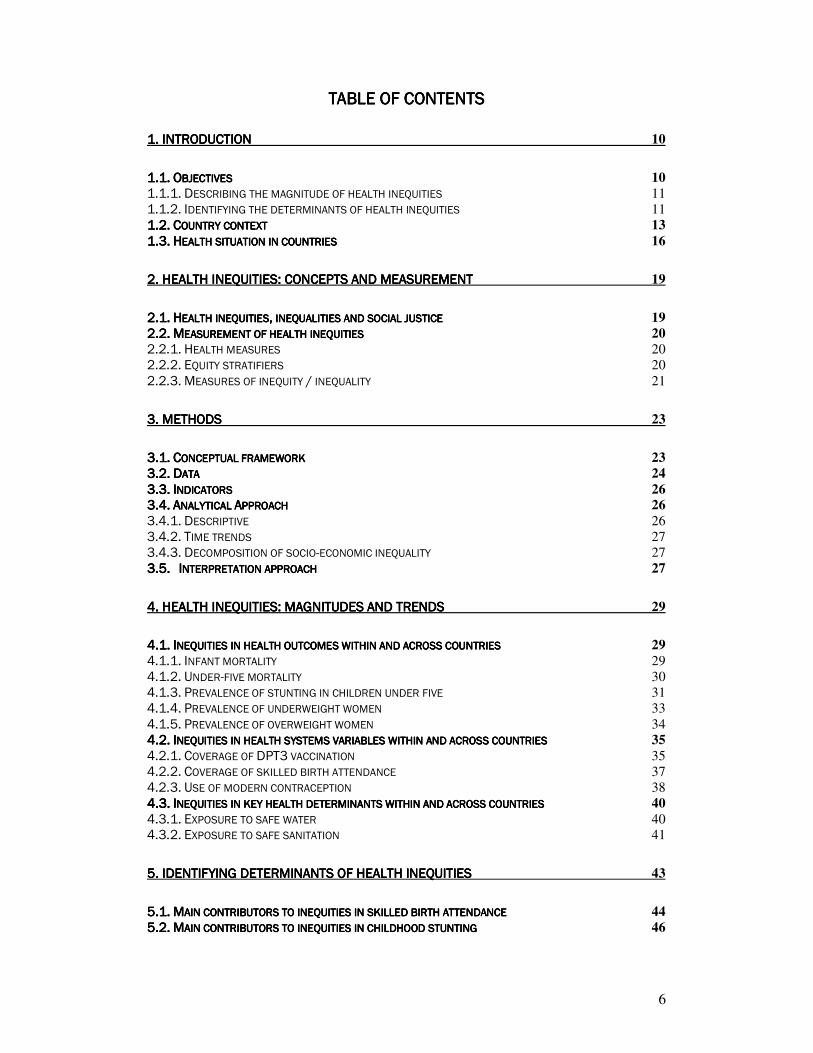
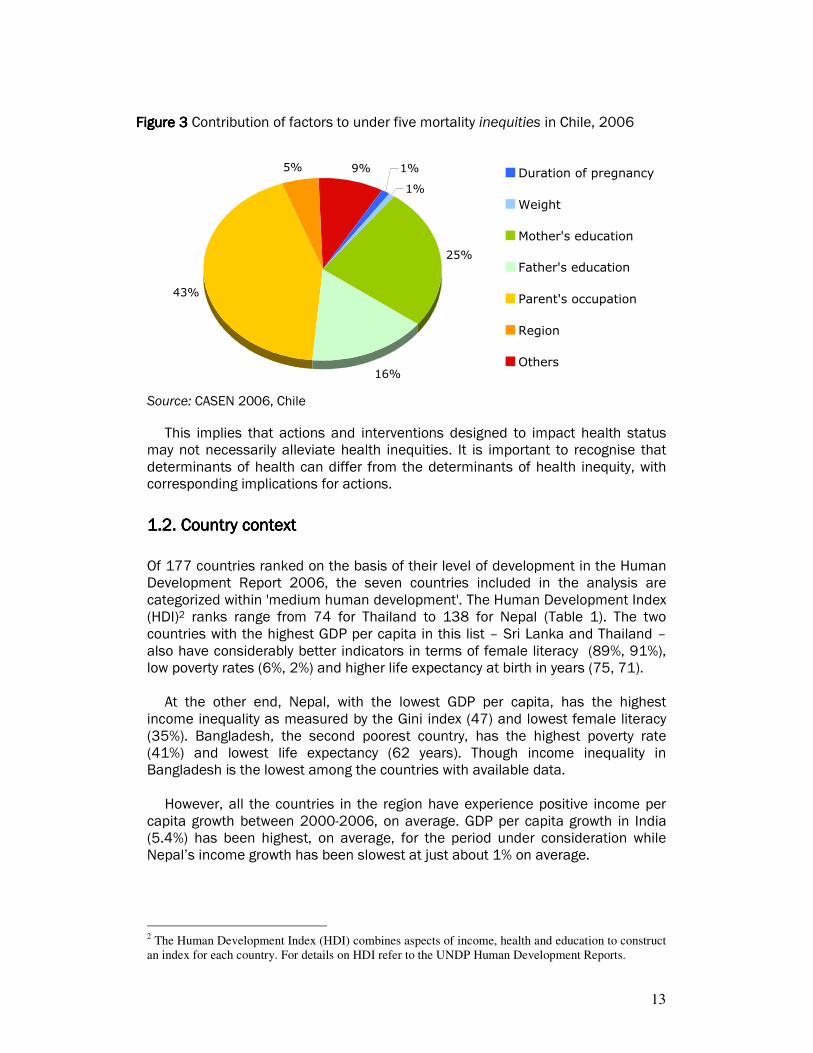
However, figure 3 indicates that factors related to socioeconomic position (shown in green and gold) by far contribute the most to the inequities in under five mortality.
15%
28%
6%4%
28%
7%12%
Duration of pregnancy
Weight
Mother's education
Father's education
Parent's occupation
Region
Others
Figure Figure Figure Figure 2222 Contribution of factors to under five mortality average in Chile, 2006
13
Source: CASEN 2006, Chile
This implies that actions and interventions designed to impact health status may not necessarily alleviate health inequities. It is important to recognise that determinants of health can differ from the determinants of health inequity, with corresponding implications for actions.
1.2. Country context1.2. Country context1.2. Country context1.2. Country context
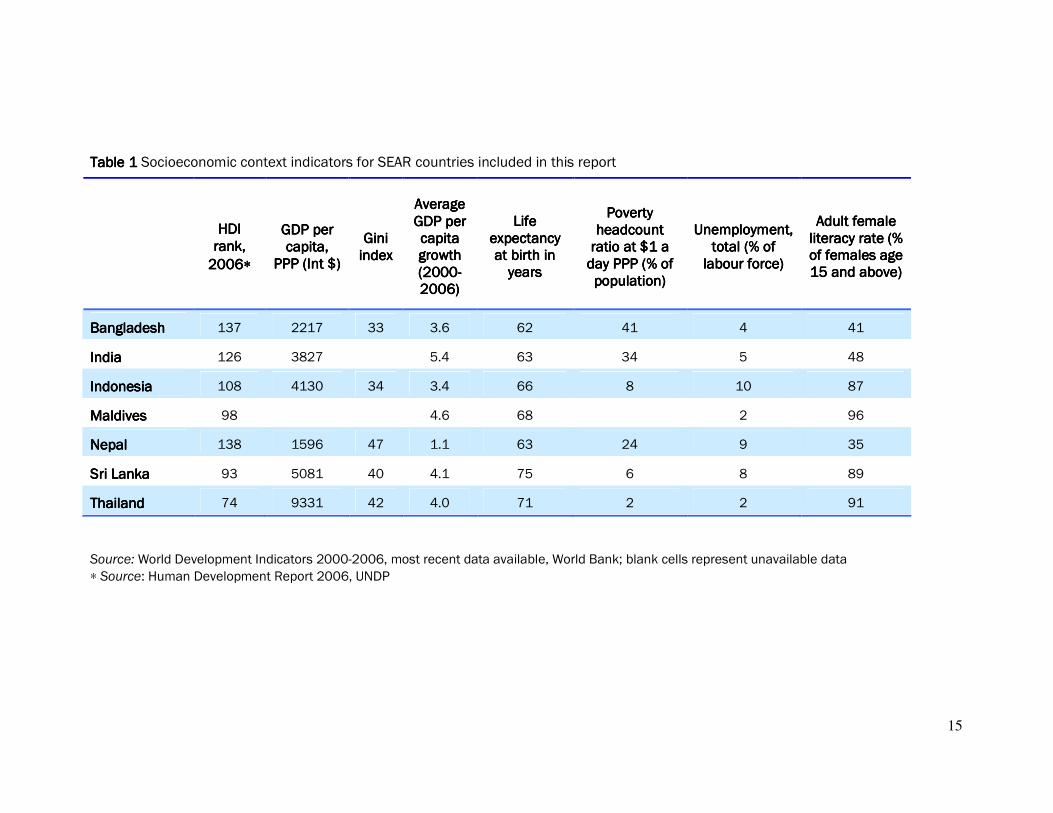
Of 177 countries ranked on the basis of their level of development in the Human Development Report 2006, the seven countries included in the analysis are categorized within 'medium human development'. The Human Development Index (HDI)2 ranks range from 74 for Thailand to 138 for Nepal (Table 1). The two countries with the highest GDP per capita in this list – Sri Lanka and Thailand – also have considerably better indicators in terms of female literacy (89%, 91%), low poverty rates (6%, 2%) and higher life expectancy at birth in years (75, 71).
At the other end, Nepal, with the lowest GDP per capita, has the highest income inequality as measured by the Gini index (47) and lowest female literacy (35%). Bangladesh, the second poorest country, has the highest poverty rate (41%) and lowest life expectancy (62 years). Though income inequality in Bangladesh is the lowest among the countries with available data. However, all the countries in the region have experience positive income per capita growth between 2000-2006, on average. GDP per capita growth in India (5.4%) has been highest, on average, for the period under consideration while Nepal’s income growth has been slowest at just about 1% on average.
2 The Human Development Index (HDI) combines aspects of income, health and education to construct
an index for each country. For details on HDI refer to the UNDP Human Development Reports.
1%
1%
25%
16%
43%
5% 9% Duration of pregnancy
Weight
Mother's education
Father's education
Parent's occupation
Region
Others
Figure Figure Figure Figure 3333 Contribution of factors to under five mortality inequities in Chile, 2006
14
Source: World Development Indicators 2000-2006, World Bank
Source: World Development Indicators 2000-2006
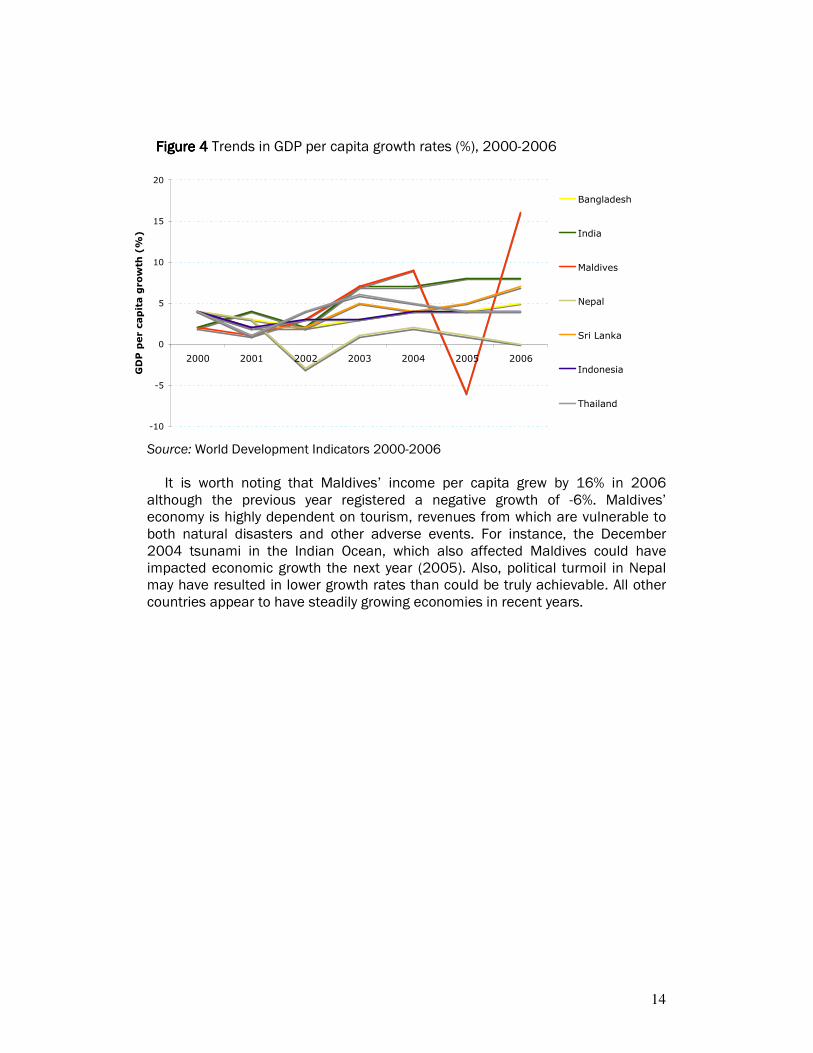
It is worth noting that Maldives’ income per capita grew by 16% in 2006
although the previous year registered a negative growth of -6%. Maldives’ economy is highly dependent on tourism, revenues from which are vulnerable to both natural disasters and other adverse events. For instance, the December 2004 tsunami in the Indian Ocean, which also affected Maldives could have impacted economic growth the next year (2005). Also, political turmoil in Nepal may have resulted in lower growth rates than could be truly achievable. All other countries appear to have steadily growing economies in recent years.
Figure Figure Figure Figure 4444 Trends in GDP per capita growth rates (%), 2000-2006
-10
-5
0
5
10
15
20
2000 2001 2002 2003 2004 2005 2006
GDP per capita growth (%)
Bangladesh
India
Maldives
Nepal
Sri Lanka
Indonesia
Thailand
15
Table Table Table Table 1111 Socioeconomic context indicators for SEAR countries included in this report
Source: World Development Indicators 2000-2006, most recent data available, World Bank; blank cells represent unavailable data
∗ Source: Human Development Report 2006, UNDP
HDI HDI HDI HDI rank, rank, rank, rank,
2006200620062006∗∗∗∗
GDP per GDP per GDP per GDP per capita, capita, capita, capita,
PPP (Int $)PPP (Int $)PPP (Int $)PPP (Int $)
Gini Gini Gini Gini indexindexindexindex
Average Average Average Average GDP per GDP per GDP per GDP per capita capita capita capita growth growth growth growth (2000(2000(2000(2000----2006)2006)2006)2006)
Life Life Life Life expeexpeexpeexpectancy ctancy ctancy ctancy at birth in at birth in at birth in at birth in yearsyearsyearsyears
Poverty Poverty Poverty Poverty headcount headcount headcount headcount ratio at $1 a ratio at $1 a ratio at $1 a ratio at $1 a day PPP (% of day PPP (% of day PPP (% of day PPP (% of population)population)population)population)
Unemployment, Unemployment, Unemployment, Unemployment, total (% of total (% of total (% of total (% of
labour force)labour force)labour force)labour force)
Adult female Adult female Adult female Adult female literacy rate (% literacy rate (% literacy rate (% literacy rate (% of females age of females age of females age of females age 15 and above)15 and above)15 and above)15 and above)
BangladeshBangladeshBangladeshBangladesh 137 2217 33 3.6 62 41 4 41
IndiaIndiaIndiaIndia 126 3827 5.4 63 34 5 48
InInInIndonesiadonesiadonesiadonesia 108 4130 34 3.4 66 8 10 87
MaldivesMaldivesMaldivesMaldives 98 4.6 68 2 96
NepalNepalNepalNepal 138 1596 47 1.1 63 24 9 35
Sri LankaSri LankaSri LankaSri Lanka 93 5081 40 4.1 75 6 8 89
ThailandThailandThailandThailand 74 9331 42 4.0 71 2 2 91
16
1.3. Health situation in countries1.3. Health situation in countries1.3. Health situation in countries1.3. Health situation in countries
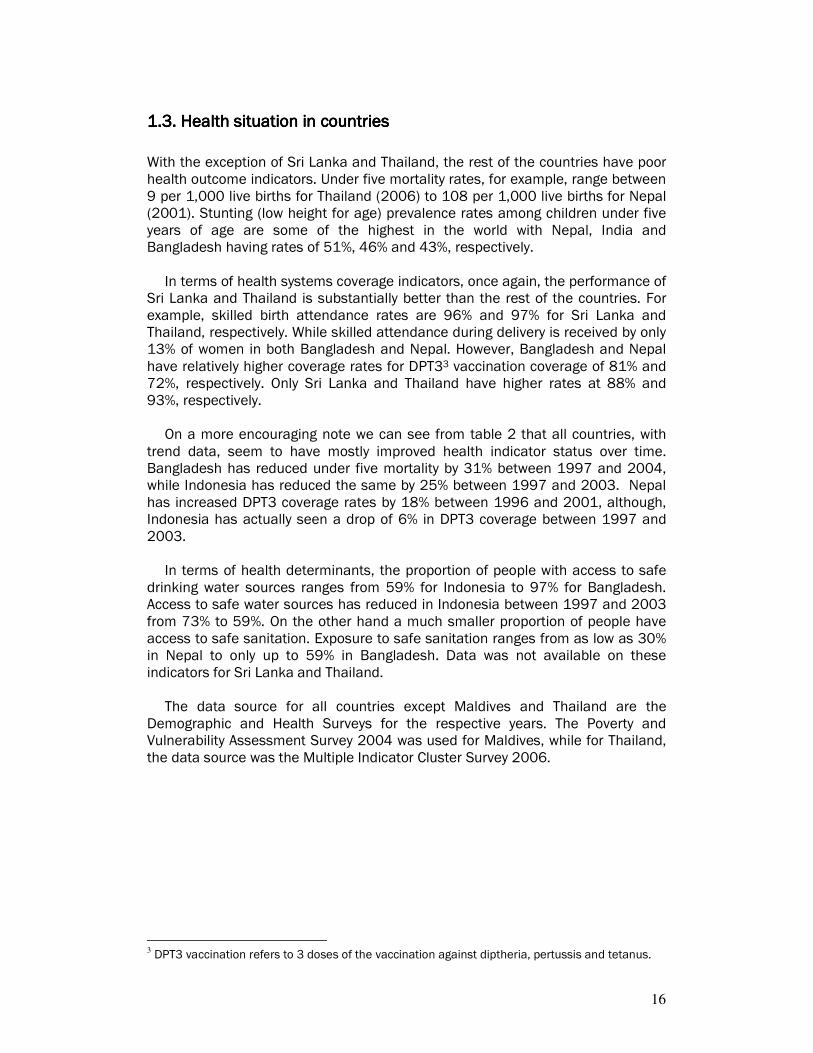
With the exception of Sri Lanka and Thailand, the rest of the countries have poor health outcome indicators. Under five mortality rates, for example, range between 9 per 1,000 live births for Thailand (2006) to 108 per 1,000 live births for Nepal (2001). Stunting (low height for age) prevalence rates among children under five years of age are some of the highest in the world with Nepal, India and Bangladesh having rates of 51%, 46% and 43%, respectively. In terms of health systems coverage indicators, once again, the performance of Sri Lanka and Thailand is substantially better than the rest of the countries. For example, skilled birth attendance rates are 96% and 97% for Sri Lanka and Thailand, respectively. While skilled attendance during delivery is received by only 13% of women in both Bangladesh and Nepal. However, Bangladesh and Nepal have relatively higher coverage rates for DPT33 vaccination coverage of 81% and 72%, respectively. Only Sri Lanka and Thailand have higher rates at 88% and 93%, respectively. On a more encouraging note we can see from table 2 that all countries, with trend data, seem to have mostly improved health indicator status over time. Bangladesh has reduced under five mortality by 31% between 1997 and 2004, while Indonesia has reduced the same by 25% between 1997 and 2003. Nepal has increased DPT3 coverage rates by 18% between 1996 and 2001, although, Indonesia has actually seen a drop of 6% in DPT3 coverage between 1997 and 2003. In terms of health determinants, the proportion of people with access to safe drinking water sources ranges from 59% for Indonesia to 97% for Bangladesh. Access to safe water sources has reduced in Indonesia between 1997 and 2003 from 73% to 59%. On the other hand a much smaller proportion of people have access to safe sanitation. Exposure to safe sanitation ranges from as low as 30% in Nepal to only up to 59% in Bangladesh. Data was not available on these indicators for Sri Lanka and Thailand. The data source for all countries except Maldives and Thailand are the Demographic and Health Surveys for the respective years. The Poverty and Vulnerability Assessment Survey 2004 was used for Maldives, while for Thailand, the data source was the Multiple Indicator Cluster Survey 2006.
3 DPT3 vaccination refers to 3 doses of the vaccination against diptheria, pertussis and tetanus.
17
Table Table Table Table 2222 Selected health outcomes, health systems and health determinants indicators for SEAR countries
SOUTH-EAST ASIAN REGION COUNTRIES
INDICATORS
BANGLADESH INDIA INDONESIA MALDIVES NEPAL SRI LANKA THAILAND
Health outcomesHealth outcomesHealth outcomesHealth outcomes 2004 2000 1997 1999 2003 1997 2004 2001 1996 2000 1993 2006
Infant mortality rate per 1,000 live births
65 80 90 73 42 52 77 93 19 25
Under five mortality rate per 1,000 live births
88 110 128 101 53 71 108 139 21 32 9
Prevalence of stunting in children under five years (%)
43 45 55 46 22 51 48 14 24 12
Prevalence of underweight women (%)
34 45 52 36 27 28 22
Prevalence of overweight women (%)
9 11 7 24
Health systemsHealth systemsHealth systemsHealth systems
Coverage of DPT3 vaccination (%) 81 72 69 55 58 64 72 54 88 87 93
Coverage of skilled birth attendance (%)
13 12 8 42 66 43 84 13 10 96 94 97
Current use of modern contraception (%)
47 43 42 43 57 55 34 35 26 50 44 73
Health determinantsHealth determinantsHealth determinantsHealth determinants
Exposure to safe water (%) 97 96 95 80 59 73 77 71
Exposure to safe sanitation (%) 59 54 43 33 54 50 30 16
18
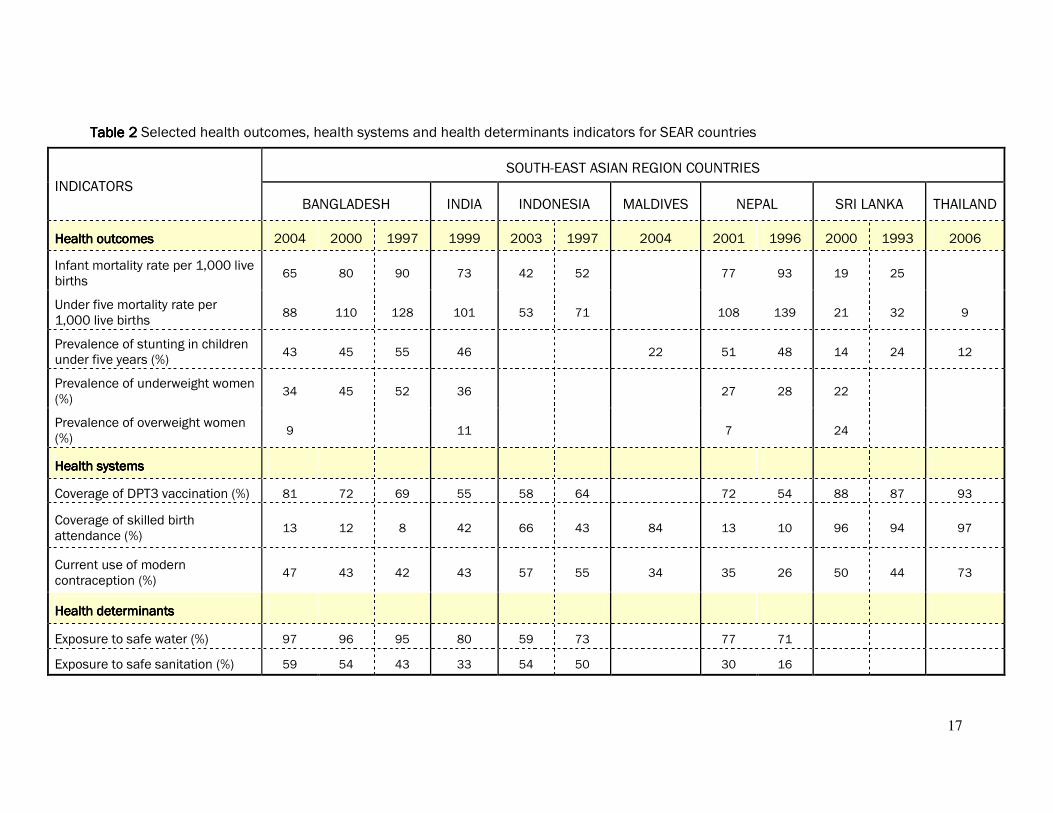
Figure 5Figure 5Figure 5Figure 5 Trends in government expenditure on health as percent of total government expenditure, 1999-2003
Source: World Health Report 2006, Statistical Annex
From the most recent trend data available on health expenditures it can be seen that countries in the region have accorded different levels of importance to health. Maldives has a steady level of government expenditure on health at 13-14% (as percent of total government expenditure) while Thailand has, between 2001-2003, increased the proportion of health spending from 10% to 13%. Though, there are other countries such as Nepal and India who have witnessed a slight drop in health expenditures (as a percent of total government spending). In 2003, of the countries shown here, India had the lowest percentage share of health spending as a percent of total government spending (3.9%).
0
2
4
6
8
10
12
14
16
1999 2000 2001 2002 2003
Government health expenditure as % of total
government expenditure
Bangladesh
India
Maldives
Nepal
Sri Lanka
Indonesia
Thailand
19
2. HEALTH INEQUITIES2. HEALTH INEQUITIES2. HEALTH INEQUITIES2. HEALTH INEQUITIES: CONCEPTS AND MEASU: CONCEPTS AND MEASU: CONCEPTS AND MEASU: CONCEPTS AND MEASUREMENTREMENTREMENTREMENT
2222.1. Health inequities, .1. Health inequities, .1. Health inequities, .1. Health inequities, inequalities and social justiceinequalities and social justiceinequalities and social justiceinequalities and social justice
There are dramatic differences in health attainment across population groups within countries. These differences in health occur along a number of axes of social stratification including socioeconomic, political, and cultural. Such inequalities are seen in both rich and poorer countries.
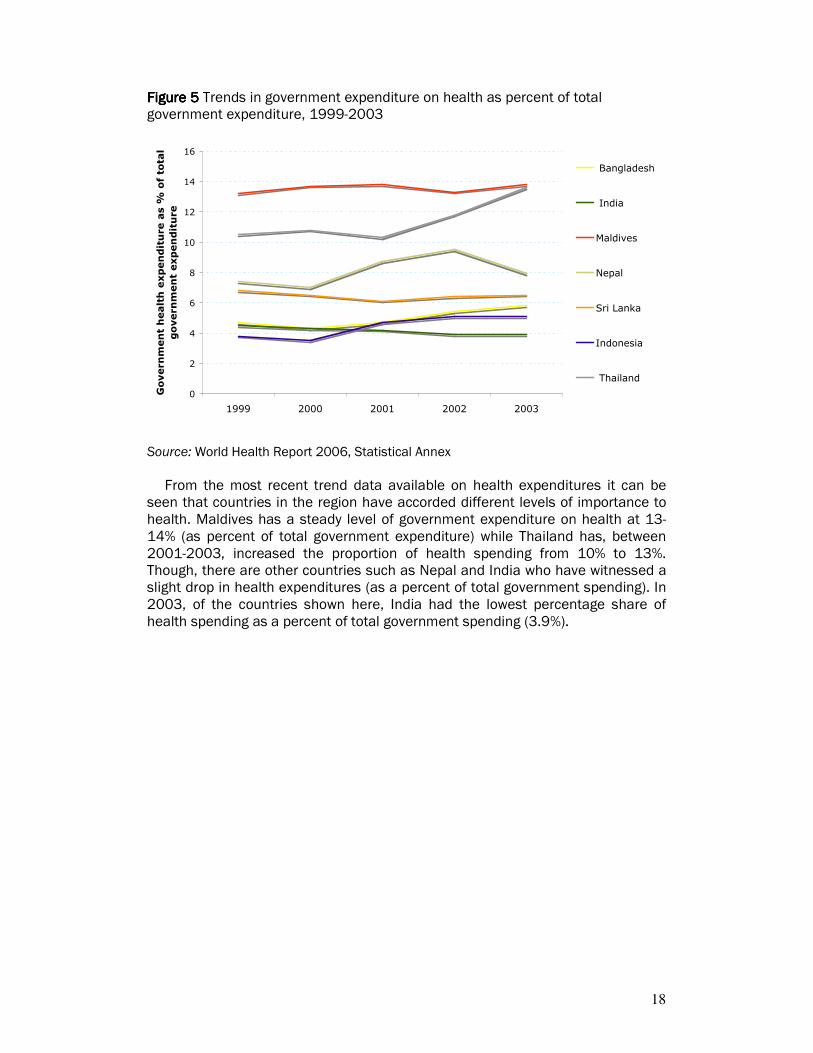
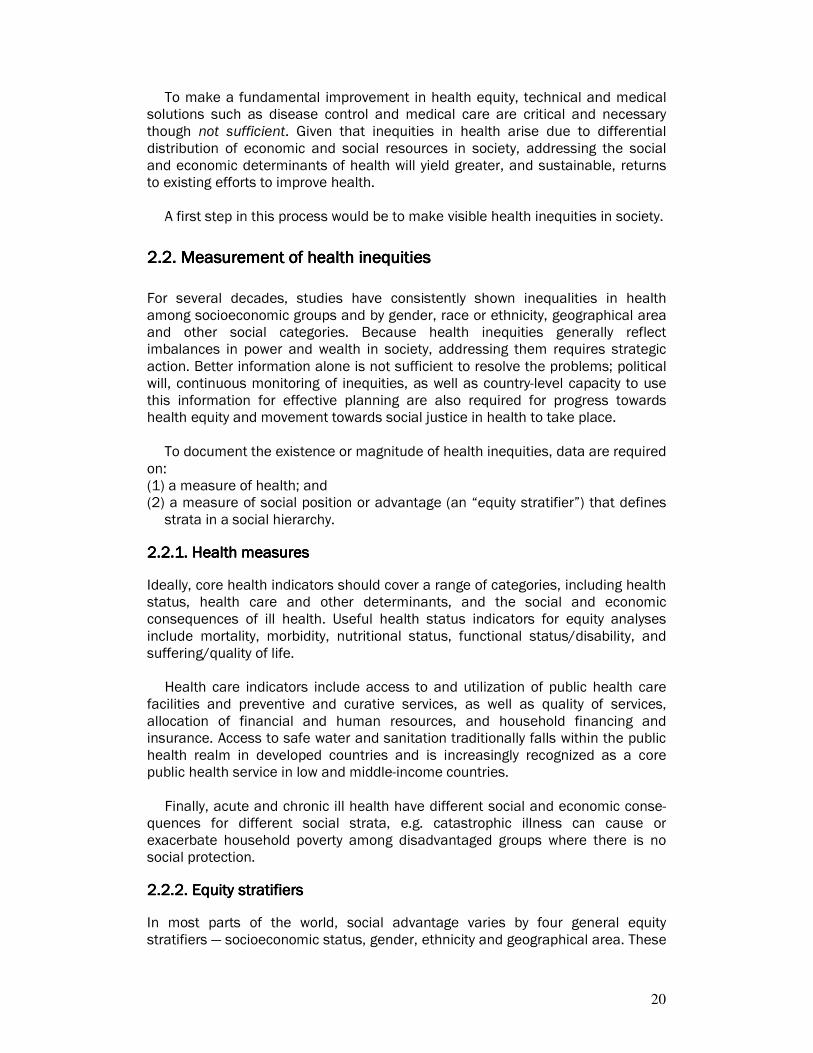
In general, the evidence shows that the lower an individual's socioeconomic position the worse their health. There is a social gradient in health that runs from top to bottom of the socioeconomic spectrum. Figure 6 illustrates this point for trends in under five mortality across wealth quintiles for Bangladesh. The figure shows that poorer groups have higher mortality rates for children under five across all three time periods, although, patterns of inequalities have changed over time. Figure 6 Figure 6 Figure 6 Figure 6 Trends in under five mortality rates for Bangladesh across wealth quintiles
0
20
40
60
80
100
120
140
160
1997 2000 2004Under five mortality rate per 1,000 live births
Poorest 20% Q2 Q3 Q4 Richest 20%
Source: Demographic and Health Surveys
Health inequities are unjust, unfair and avoidable inequalities in health achievement. Not all inequalities can, therefore, be considered to be inequitable. This can be illustrated by the difference between men's and women's health. Women, in general, live longer than men. This could be a consequence of biological sex differences in which case this inequality may not be classified as an 'inequity'. Conversely, though, if women's life expectancy is lower than men's it is likely that adverse social conditions act to reduce the natural longevity advantage of women. Such a scenario would be considered a gross inequity.
20
To make a fundamental improvement in health equity, technical and medical solutions such as disease control and medical care are critical and necessary though not sufficient. Given that inequities in health arise due to differential distribution of economic and social resources in society, addressing the social and economic determinants of health will yield greater, and sustainable, returns to existing efforts to improve health.
A first step in this process would be to make visible health inequities in society.
2222.2.2.2.2.... Measurement of health inequities Measurement of health inequities Measurement of health inequities Measurement of health inequities
For several decades, studies have consistently shown inequalities in health among socioeconomic groups and by gender, race or ethnicity, geographical area and other social categories. Because health inequities generally reflect imbalances in power and wealth in society, addressing them requires strategic action. Better information alone is not sufficient to resolve the problems; political will, continuous monitoring of inequities, as well as country-level capacity to use this information for effective planning are also required for progress towards health equity and movement towards social justice in health to take place.
To document the existence or magnitude of health inequities, data are required
on: (1) a measure of health; and (2) a measure of social position or advantage (an “equity stratifier”) that defines
strata in a social hierarchy.
2222.2.1. Health measures.2.1. Health measures.2.1. Health measures.2.1. Health measures
Ideally, core health indicators should cover a range of categories, including health status, health care and other determinants, and the social and economic consequences of ill health. Useful health status indicators for equity analyses include mortality, morbidity, nutritional status, functional status/disability, and suffering/quality of life.
Health care indicators include access to and utilization of public health care facilities and preventive and curative services, as well as quality of services, allocation of financial and human resources, and household financing and insurance. Access to safe water and sanitation traditionally falls within the public health realm in developed countries and is increasingly recognized as a core public health service in low and middle-income countries.
Finally, acute and chronic ill health have different social and economic conse-quences for different social strata, e.g. catastrophic illness can cause or exacerbate household poverty among disadvantaged groups where there is no social protection.
2.2.2.2.2.2.2.2.2222. . . . Equity stratifiersEquity stratifiersEquity stratifiersEquity stratifiers
In most parts of the world, social advantage varies by four general equity stratifiers — socioeconomic status, gender, ethnicity and geographical area. These
21
stratifiers interact in complex ways, and subgroups defined by several characteristics of these equity stratifiers are at a particular disadvantage, e.g. poor women in a marginalized ethnic group.
Socioeconomic position can be reflected by economic resources, education, and/or occupation. Household wealth or assets is a particularly meaningful measure of economic resources because accumulated assets can be used (e.g. when income is temporarily low) to cover health care expenses and maintain a standard of living that promotes health. Schooling (educational attainment) and occupation are important indicators of social status in their own right, but should not be viewed as proxies for wealth or income. Sex or gender are meaningful equity stratifiers for many, but not all, health measures.
Discrimination against ethnic or racial groups can have serious health and
social effects (4, 6). Indicators for characterizing ethnicity include self-identification, social perception of race or ethnicity, religion, language spoken at home, tribal affiliation, or status as an immigrant or native-born citizen.
Finally, groups can be advantaged according to the geographical area (e.g.
urban versus rural, or better- and worse-off provinces or districts) where they live or work. Resources are often allocated on a geographical basis, reflecting both logistic issues such as distance, topography and transport as well as the tendency for political power to be concentrated in urban areas or particular regions. Comparing allocations of health measures across different provinces and districts is useful, and such comparisons are easily understood by non-specialists.years
2.2.2.2.2.2.2.2.3333. . . . Measures of inequity / inequalityMeasures of inequity / inequalityMeasures of inequity / inequalityMeasures of inequity / inequality
There are six commonly used measures for measuring health inequality. Its only when we add a value judgement to a measure of inequality that it can be considered to measure inequity. The six measures of health inequality include: 1. The range 2. Gini coefficient (and associated Lorenz curve) 3. Index of dissimilarity 4. Population attributable risk 5. Slope and relative index of inequality 6. Concentration index Simple range measures including ratio and difference are the most frequently
used in the literature to describe inequalities between groups. These measures compare occurrence of a health measure like child mortality within each equity stratifier like between female and male, between the lowest and the highest socioeconomic groups, between urban and rural areas. In contrast, there are measures that express the inequality in health across the
full spectrum of a socioeconomic stratifier like income or education where there is a social hierarchy. In general, simple measures are the most relevant to drive policy because they
are readily accessible to policy makers. More complex measures are primarily
22
used in research settings, to confirm conclusions about comparisons which are made based on simpler measures. One of the most well known is concentration index which explains where and to
what extent a health variable is concentrated among the socioeconomic distribution; in other words, it shows whether the health variable is concentrated among the poor or among the rich and what the degree of concentration is. Annex I (b) contains detailed notes on all health measures.
23
3. METHODS3. METHODS3. METHODS3. METHODS This section briefly describes the specific methods used within this report to document health inequities and their contributing factors in 7 South-East Asian countries using publicly available household surveys; Demographic and Health Surveys and Multiple Indicator Cluster Surveys. This section covers the conceptual framework used to guide and interpret the analysis, the data sources, the indicators and their definitions, and the analytical approach used to estimate descriptive statistics and the approach to decompose what factors contribute to health inequities found.
3.1. Conceptual framework 3.1. Conceptual framework 3.1. Conceptual framework 3.1. Conceptual framework
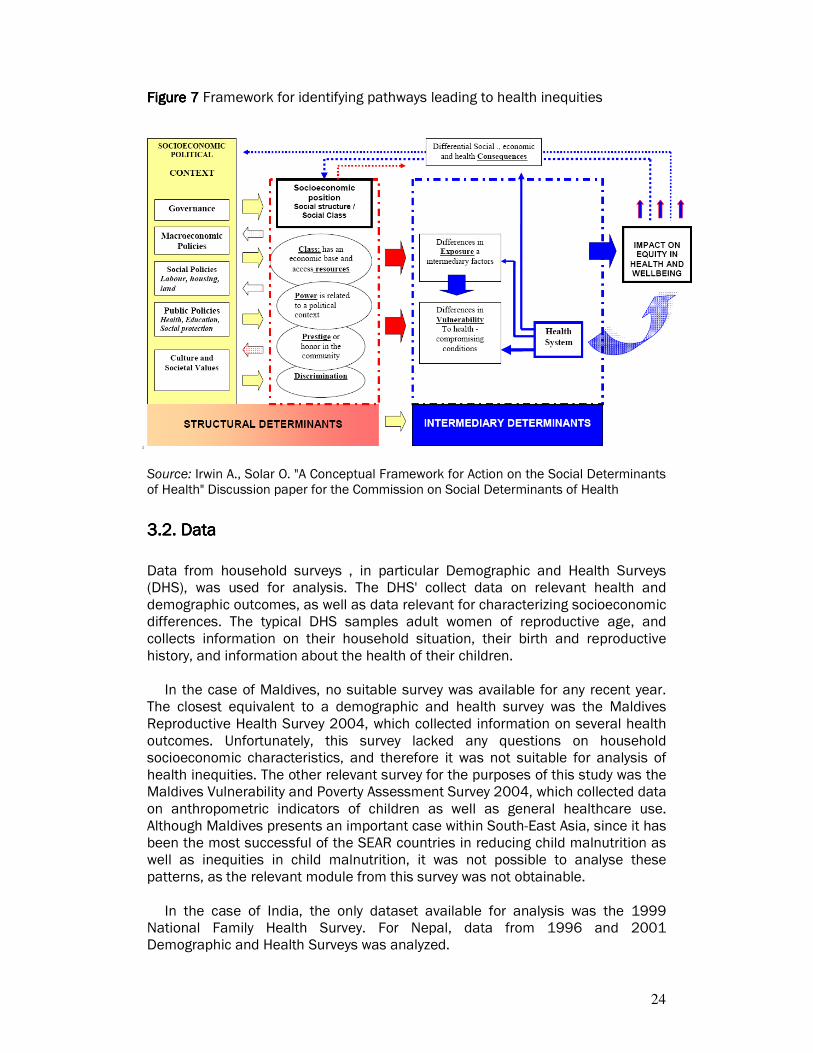
The conceptual framework used largely synthesizes models proposed by Dahlegren, Whitehead, Diederichsen, Hallqvist, etc., and were proposed for use by the Commission on Social Determinants of Health. This conceptual model illustrates the pathways by which social determinants of health affect health outcomes, makes explicit the linkages among different types of health determinants, and makes visible the ways social determinants contribute to health inequities among groups in society, given the increasing evidence of significant social stratification in health status (figure 4). This conceptual framework served as the departure point on how to "operationalize" or make concrete monitoring and assessment, with the initial purpose of describing levels and potentially linkages across components within national settings. The key components of the model are summarized here: 1111.... Socioeconomic-political context: this encompasses a broad set of structural,
cultural and functional aspects of a social system whose impact on individuals tends to elude quantification but which exert a powerful formative influence on patterns of social stratification and thus on people's health opportunities
2222.... Socioeconomic position: within each society, material and other resources are unequally distributed. This inequity can be portrayed as a system of social stratification or social hierarchy. People attain different positions in the social hierarchy according, mainly, to their social class, occupational status, educational achievement and income level. Their position in the social stratification system can be summarized as their socioeconomic position.
3333.... Intermediary determinants: intermediary factors flow from the configuration of underlying social stratification and, in turn, determine differences in exposure and vulnerability to health-compromising conditions. The main categories of intermediary determinants of health are: material circumstances; psychosocial circumstances; behavioral and/or biological factors; and the health system itself as a social determinant.
This framework was utilized to develop the analysis of the pathways to health
inequities and its determinants.
24
Figure 7Figure 7Figure 7Figure 7 Framework for identifying pathways leading to health inequities
Source: Irwin A., Solar O. "A Conceptual Framework for Action on the Social Determinants of Health" Discussion paper for the Commission on Social Determinants of Health
3.2. Data 3.2. Data 3.2. Data 3.2. Data
Data from household surveys , in particular Demographic and Health Surveys (DHS), was used for analysis. The DHS' collect data on relevant health and demographic outcomes, as well as data relevant for characterizing socioeconomic differences. The typical DHS samples adult women of reproductive age, and collects information on their household situation, their birth and reproductive history, and information about the health of their children.
In the case of Maldives, no suitable survey was available for any recent year. The closest equivalent to a demographic and health survey was the Maldives Reproductive Health Survey 2004, which collected information on several health outcomes. Unfortunately, this survey lacked any questions on household socioeconomic characteristics, and therefore it was not suitable for analysis of health inequities. The other relevant survey for the purposes of this study was the Maldives Vulnerability and Poverty Assessment Survey 2004, which collected data on anthropometric indicators of children as well as general healthcare use. Although Maldives presents an important case within South-East Asia, since it has been the most successful of the SEAR countries in reducing child malnutrition as well as inequities in child malnutrition, it was not possible to analyse these patterns, as the relevant module from this survey was not obtainable.
In the case of India, the only dataset available for analysis was the 1999
National Family Health Survey. For Nepal, data from 1996 and 2001 Demographic and Health Surveys was analyzed.
25
For India, a more recent version of the National Family Health Survey now exists (2005-06) but the data was not made publicly available at the time the analysis was undertaken. Data from the 2006 Nepal Demographic and Health Survey was also not publicly available at the time of analysis and, thus, has not been included.
Thailand does not conduct a demographic and health survey so the Multiple
Indicator Cluster Survey 2006 was used instead since it contains variables similar to those in the DHS. Countries that have demographic and health surveys collect similar information. However, some collect more data than others. For example, the number of factors used to determine the quality of antenatal care received varies from one country to another. Hence, this particular variable may not be directly comparable across countries. In addition, there are some important data limitations that should be noted. First, the most recent Sri Lankan survey does not sample people from the North-East region which comprises two of the country’s nine zones. Second, except for India, data on antenatal care are only collected for the mother’s last birth whereas much of the other information on child health and maternal care is collected for all births within the last five years. This limitation reduced the sample size for the in-depth decomposition analysis of stunting and skilled birth attendance.
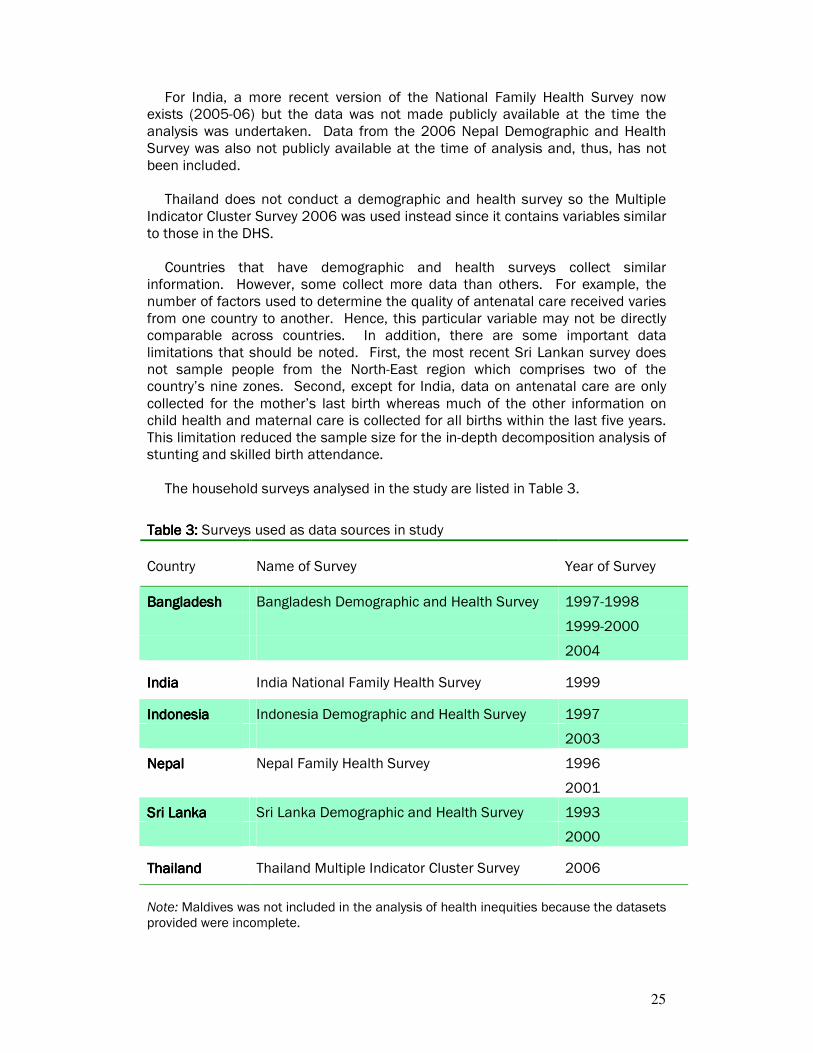
The household surveys analysed in the study are listed in Table 3.
Table Table Table Table 3333: : : : Surveys used as data sources in study
Country Name of Survey Year of Survey
BangladeshBangladeshBangladeshBangladesh Bangladesh Demographic and Health Survey 1997-1998
1999-2000
2004
IndiaIndiaIndiaIndia India National Family Health Survey 1999
IndonesiaIndonesiaIndonesiaIndonesia Indonesia Demographic and Health Survey 1997
2003
NepalNepalNepalNepal Nepal Family Health Survey 1996
2001
Sri LankaSri LankaSri LankaSri Lanka Sri Lanka Demographic and Health Survey 1993
2000
ThailandThailandThailandThailand Thailand Multiple Indicator Cluster Survey 2006
Note: Maldives was not included in the analysis of health inequities because the datasets provided were incomplete.
26
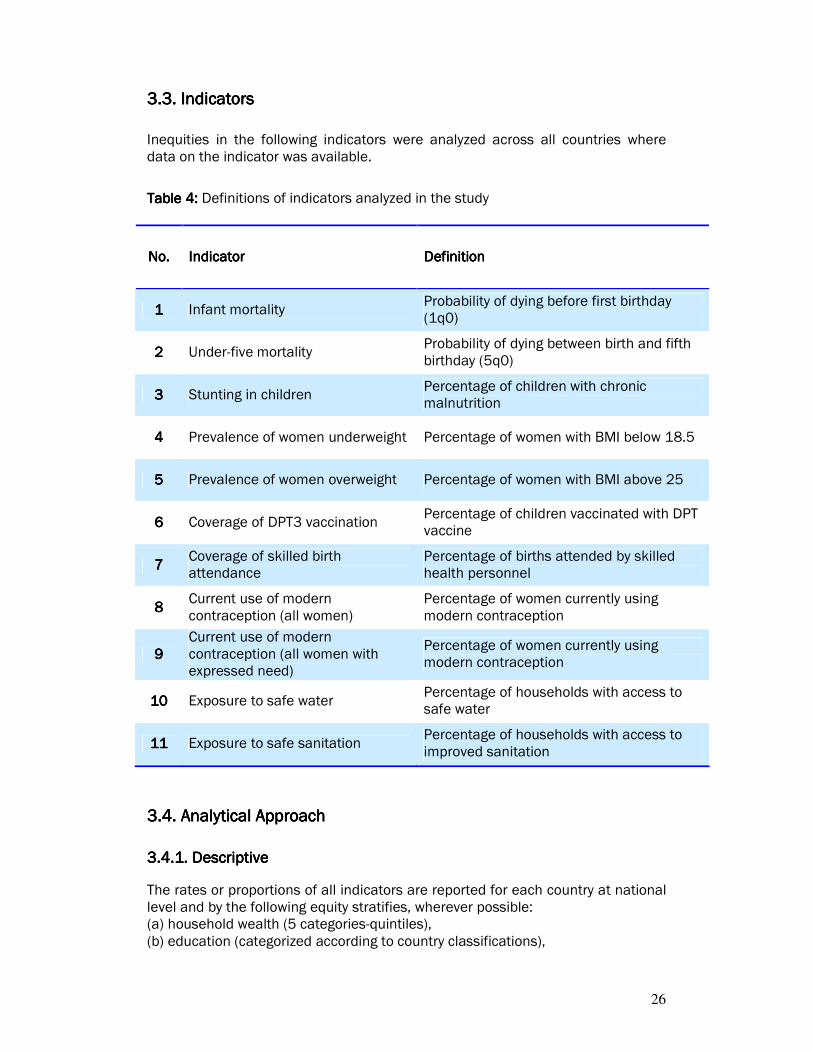
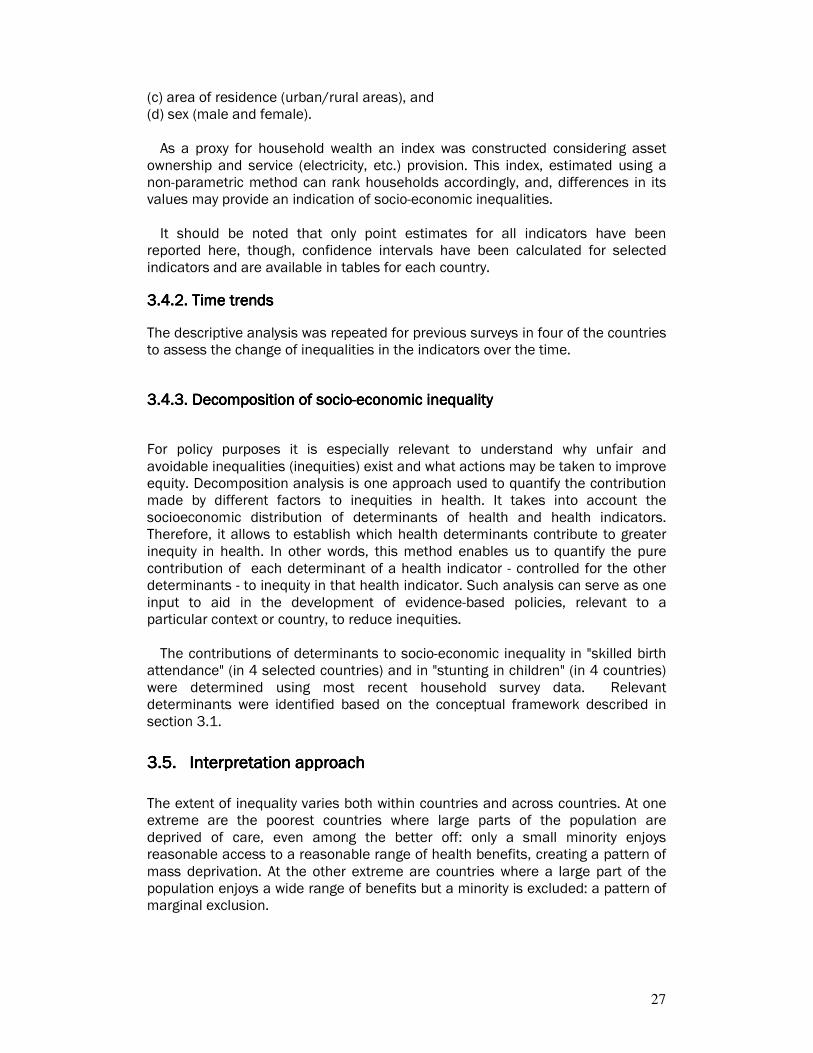
3.3. Indicators3.3. Indicators3.3. Indicators3.3. Indicators
Inequities in the following indicators were analyzed across all countries where data on the indicator was available.
Table Table Table Table 4444:::: Definitions of indicators analyzed in the study
No.No.No.No. IndicatorIndicatorIndicatorIndicator DefinitionDefinitionDefinitionDefinition
1111 Infant mortality Probability of dying before first birthday (1q0)
2222 Under-five mortality Probability of dying between birth and fifth birthday (5q0)
3333 Stunting in children Percentage of children with chronic malnutrition
4444 Prevalence of women underweight Percentage of women with BMI below 18.5
5555 Prevalence of women overweight Percentage of women with BMI above 25
6666 Coverage of DPT3 vaccination Percentage of children vaccinated with DPT vaccine
7777 Coverage of skilled birth attendance
Percentage of births attended by skilled health personnel
8888 Current use of modern contraception (all women)
Percentage of women currently using modern contraception
9999 Current use of modern contraception (all women with expressed need)
Percentage of women currently using modern contraception
10101010 Exposure to safe water Percentage of households with access to safe water
11111111 Exposure to safe sanitation Percentage of households with access to improved sanitation
3.4. Analytical Approach3.4. Analytical Approach3.4. Analytical Approach3.4. Analytical Approach
3.4.1. Descriptive3.4.1. Descriptive3.4.1. Descriptive3.4.1. Descriptive
The rates or proportions of all indicators are reported for each country at national level and by the following equity stratifies, wherever possible: (a) household wealth (5 categories-quintiles), (b) education (categorized according to country classifications),
27
(c) area of residence (urban/rural areas), and (d) sex (male and female). As a proxy for household wealth an index was constructed considering asset
ownership and service (electricity, etc.) provision. This index, estimated using a non-parametric method can rank households accordingly, and, differences in its values may provide an indication of socio-economic inequalities. It should be noted that only point estimates for all indicators have been
reported here, though, confidence intervals have been calculated for selected indicators and are available in tables for each country.
3333.4.2.4.2.4.2.4.2.... Time trends Time trends Time trends Time trends
The descriptive analysis was repeated for previous surveys in four of the countries to assess the change of inequalities in the indicators over the time.
3333.4.3.4.3.4.3.4.3.... Decomposition of socio Decomposition of socio Decomposition of socio Decomposition of socio----economic inequality economic inequality economic inequality economic inequality
For policy purposes it is especially relevant to understand why unfair and avoidable inequalities (inequities) exist and what actions may be taken to improve equity. Decomposition analysis is one approach used to quantify the contribution made by different factors to inequities in health. It takes into account the socioeconomic distribution of determinants of health and health indicators. Therefore, it allows to establish which health determinants contribute to greater inequity in health. In other words, this method enables us to quantify the pure contribution of each determinant of a health indicator - controlled for the other determinants - to inequity in that health indicator. Such analysis can serve as one input to aid in the development of evidence-based policies, relevant to a particular context or country, to reduce inequities.
The contributions of determinants to socio-economic inequality in "skilled birth
attendance" (in 4 selected countries) and in "stunting in children" (in 4 countries) were determined using most recent household survey data. Relevant determinants were identified based on the conceptual framework described in section 3.1.
3.53.53.53.5.... Interpretation approach Interpretation approach Interpretation approach Interpretation approach
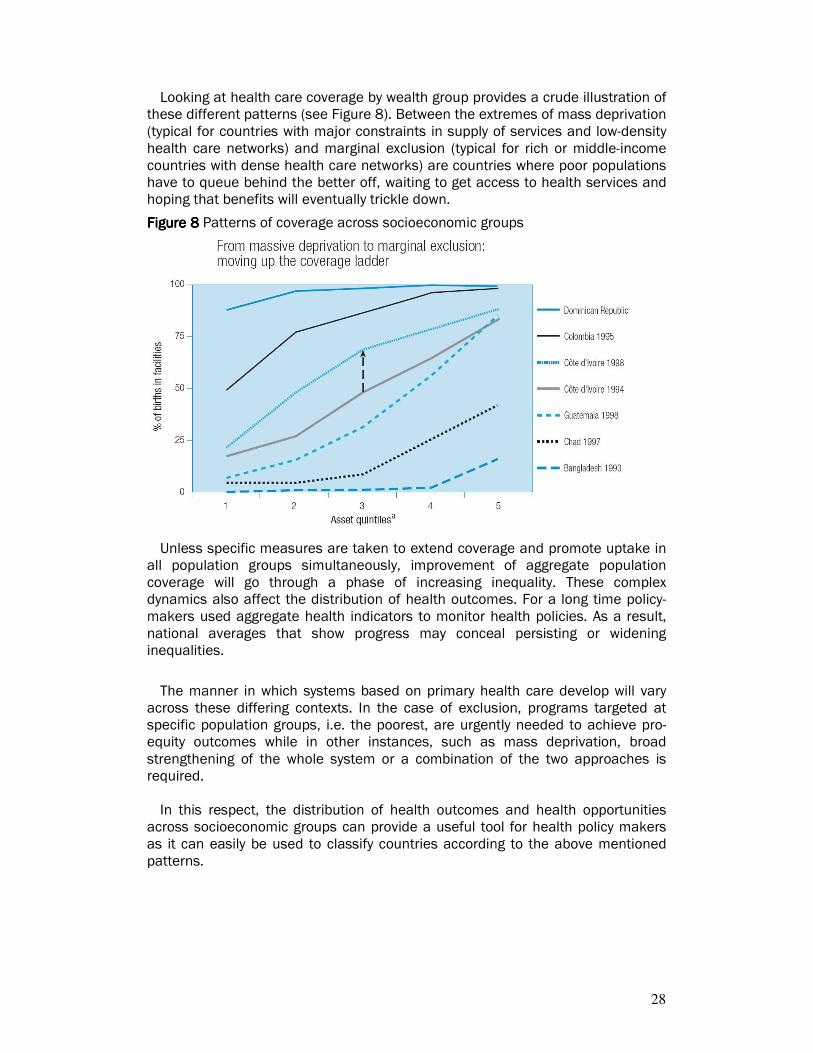
The extent of inequality varies both within countries and across countries. At one extreme are the poorest countries where large parts of the population are deprived of care, even among the better off: only a small minority enjoys reasonable access to a reasonable range of health benefits, creating a pattern of mass deprivation. At the other extreme are countries where a large part of the population enjoys a wide range of benefits but a minority is excluded: a pattern of marginal exclusion.
28
Looking at health care coverage by wealth group provides a crude illustration of these different patterns (see Figure 8). Between the extremes of mass deprivation (typical for countries with major constraints in supply of services and low-density health care networks) and marginal exclusion (typical for rich or middle-income countries with dense health care networks) are countries where poor populations have to queue behind the better off, waiting to get access to health services and hoping that benefits will eventually trickle down.
Figure 8Figure 8Figure 8Figure 8 Patterns of coverage across socioeconomic groups
Unless specific measures are taken to extend coverage and promote uptake in all population groups simultaneously, improvement of aggregate population coverage will go through a phase of increasing inequality. These complex dynamics also affect the distribution of health outcomes. For a long time policy-makers used aggregate health indicators to monitor health policies. As a result, national averages that show progress may conceal persisting or widening inequalities.
The manner in which systems based on primary health care develop will vary
across these differing contexts. In the case of exclusion, programs targeted at specific population groups, i.e. the poorest, are urgently needed to achieve pro-equity outcomes while in other instances, such as mass deprivation, broad strengthening of the whole system or a combination of the two approaches is required. In this respect, the distribution of health outcomes and health opportunities
across socioeconomic groups can provide a useful tool for health policy makers as it can easily be used to classify countries according to the above mentioned patterns.

29
4. HEALTH INEQUITIES4. HEALTH INEQUITIES4. HEALTH INEQUITIES4. HEALTH INEQUITIES: MAGNITUDES AND TRE: MAGNITUDES AND TRE: MAGNITUDES AND TRE: MAGNITUDES AND TRENDSNDSNDSNDS Substantial health-related inequities exist both within and across countries in South-East Asia. For this study, selected health outcome indicators were analysed including infant mortality rate, under-five mortality rate, prevalence of stunting in children under-five years of age, prevalence of underweight women and prevalence of overweight women. Health systems indicators studied were coverage of DPT3 vaccination, coverage of skilled birth attendance and current use of modern contraception. Differences in health outcomes and health systems indicators by urban/rural location, mother’s educational attainment, household wealth and child’s sex (where applicable) were analyzed using data from the DHS and DHS-type surveys and reports.
4.1. Inequities in health outcomes within and across countries4.1. Inequities in health outcomes within and across countries4.1. Inequities in health outcomes within and across countries4.1. Inequities in health outcomes within and across countries
4444....1111.1. Infant mortality.1. Infant mortality.1. Infant mortality.1. Infant mortality
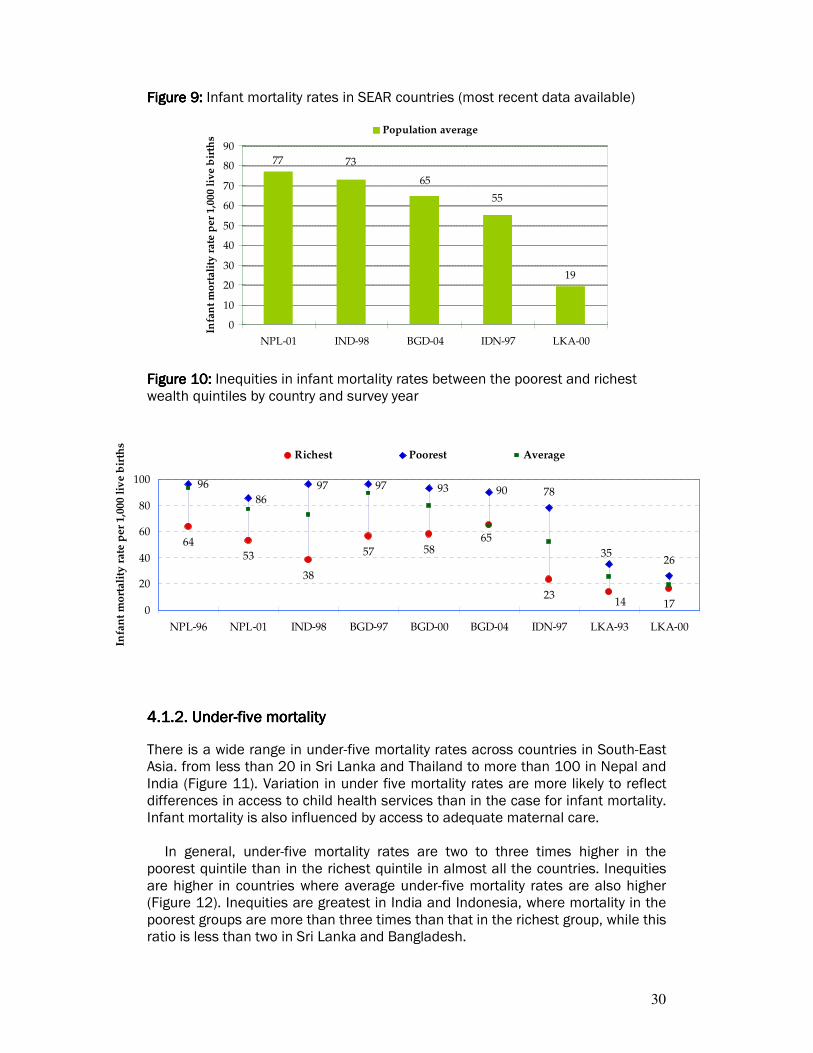
Reducing infant mortality is a key MDG. Infant mortality is defined as the probability of dying between birth and one year of age; the infant mortality rate is expressed as the number of infant deaths per 1,000 live births. In most of the studied countries, the infant mortality rate is estimated from the survey data for the five year period prior to the date of the relevant survey. Consequently, in countries with relatively good vital statistics (Maldives, Sri Lanka), the survey estimate may lag officially reported data.
In Bangladesh, Nepal and India, infant mortality rates exceed 65 deaths per 1,000 live births (Figure 9). However, the rate for Sri Lanka was significantly lower at 19 deaths per 1,000 live births, while the available data indicate that the infant mortality rate in Maldives is similar to that of Sri Lanka. In both Sri Lanka and Maldives there is greater access to maternal and child health services as evinced, for example, by their high rates of skilled birth attendance.
The difference in infant mortality rates between children in the poorest quintile
and those in the richest quintile are large for Bangladesh and Nepal, but even more substantial for India and Indonesia (Figure 10). The gap in infant mortality between the rich and the poor has narrowed marginally for Bangladesh and Indonesia, but to a larger extent for Sri Lanka. It should be noted, though, that in both Bangladesh and Sri Lanka the richest quintile has experienced a slight increase in infant mortality between the last two survey years. No assessment of inequities in infant mortality rates by income level could be made for the Maldives and Thailand due to unavailability of appropriate data. Differences in infant mortality rates by educational attainment and by urban/rural residence are high in India, Indonesia and Nepal but not as large for Bangladesh (Figure SA 7 and Figure SA 8).
30
6453
38
57 58
2317
78
26
14
65
9096
869397 97
35
0
20
40
60
80
100
NPL-96 NPL-01 IND-98 BGD-97 BGD-00 BGD-04 IDN-97 LKA-93 LKA-00
Infa
nt
mo
rta
lity
ra
te p
er
1,0
00
liv
e b
irth
s
Richest Poorest Average
Figure Figure Figure Figure 9999: : : : Infant mortality rates in SEAR countries (most recent data available)
77
19
55
65
73
0
10
20
30
40
50
60
70
80
90
NPL-01 IND-98 BGD-04 IDN-97 LKA-00
Infa
nt
mo
rta
lity
ra
te p
er
1,0
00
liv
e b
irth
s
Population average
Figure Figure Figure Figure 10101010:::: Inequities in infant mortality rates between the poorest and richest wealth quintiles by country and survey year
4444....1111.2. Under.2. Under.2. Under.2. Under----five mortalityfive mortalityfive mortalityfive mortality
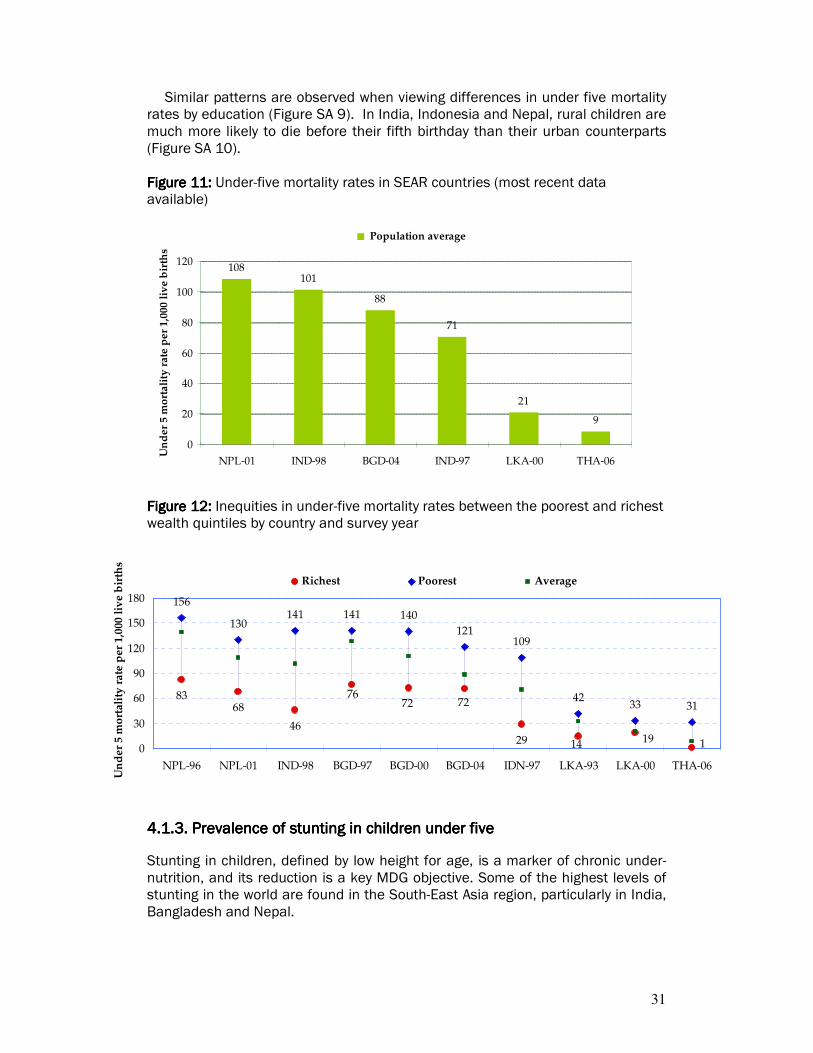
There is a wide range in under-five mortality rates across countries in South-East Asia. from less than 20 in Sri Lanka and Thailand to more than 100 in Nepal and India (Figure 11). Variation in under five mortality rates are more likely to reflect differences in access to child health services than in the case for infant mortality. Infant mortality is also influenced by access to adequate maternal care.
In general, under-five mortality rates are two to three times higher in the poorest quintile than in the richest quintile in almost all the countries. Inequities are higher in countries where average under-five mortality rates are also higher (Figure 12). Inequities are greatest in India and Indonesia, where mortality in the poorest groups are more than three times than that in the richest group, while this ratio is less than two in Sri Lanka and Bangladesh.
31
8368
4629
156
130141 141 140
121109
4233 31
19
7272
14 1
76
0
30
60
90
120
150
180
NPL-96 NPL-01 IND-98 BGD-97 BGD-00 BGD-04 IDN-97 LKA-93 LKA-00 THA-06
Un
de
r 5
mo
rtal
ity
ra
te p
er 1
,000
liv
e b
irth
s
Richest Poorest Average
Similar patterns are observed when viewing differences in under five mortality rates by education (Figure SA 9). In India, Indonesia and Nepal, rural children are much more likely to die before their fifth birthday than their urban counterparts (Figure SA 10). Figure 1Figure 1Figure 1Figure 11111: : : : Under-five mortality rates in SEAR countries (most recent data available)
108101
88
71
21
9
0
20
40
60
80
100
120
NPL-01 IND-98 BGD-04 IND-97 LKA-00 THA-06
Un
der
5 m
ort
ali
ty r
ate
per
1,0
00
liv
e b
irth
s
Population average
Figure 1Figure 1Figure 1Figure 12222: : : : Inequities in under-five mortality rates between the poorest and richest wealth quintiles by country and survey year
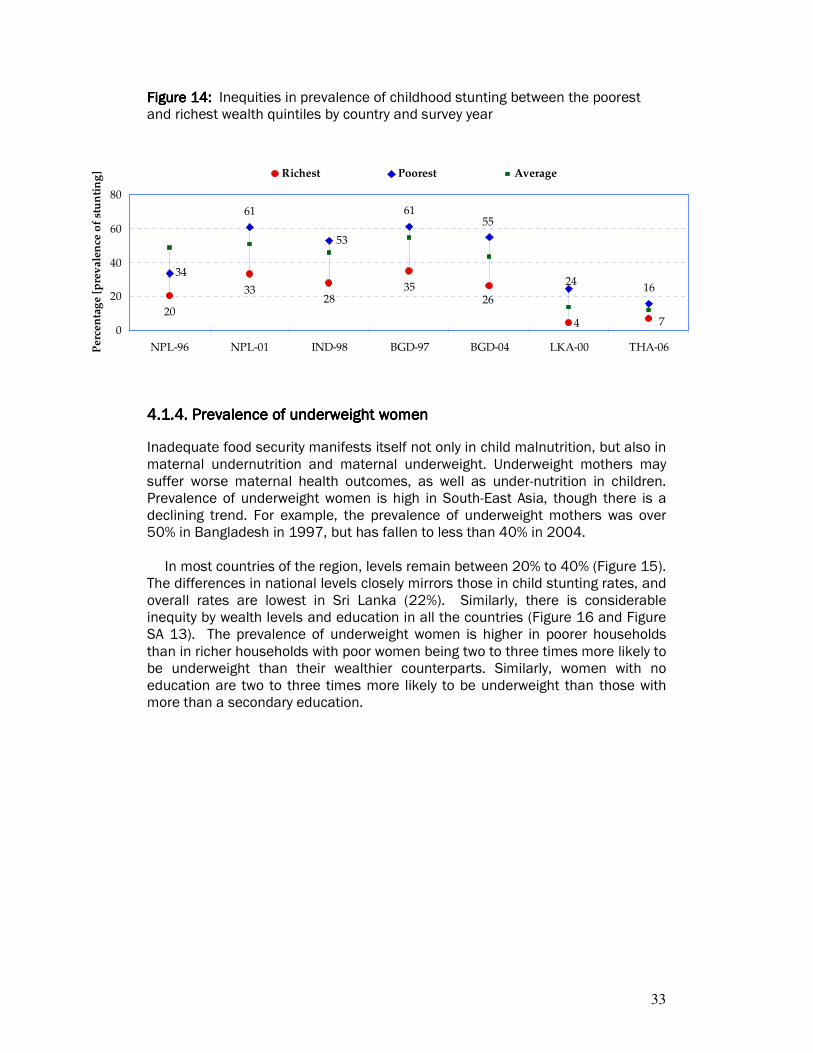
4444....1111.3. Prevalence of stunting in children under five.3. Prevalence of stunting in children under five.3. Prevalence of stunting in children under five.3. Prevalence of stunting in children under five
Stunting in children, defined by low height for age, is a marker of chronic under-nutrition, and its reduction is a key MDG objective. Some of the highest levels of stunting in the world are found in the South-East Asia region, particularly in India, Bangladesh and Nepal.
32
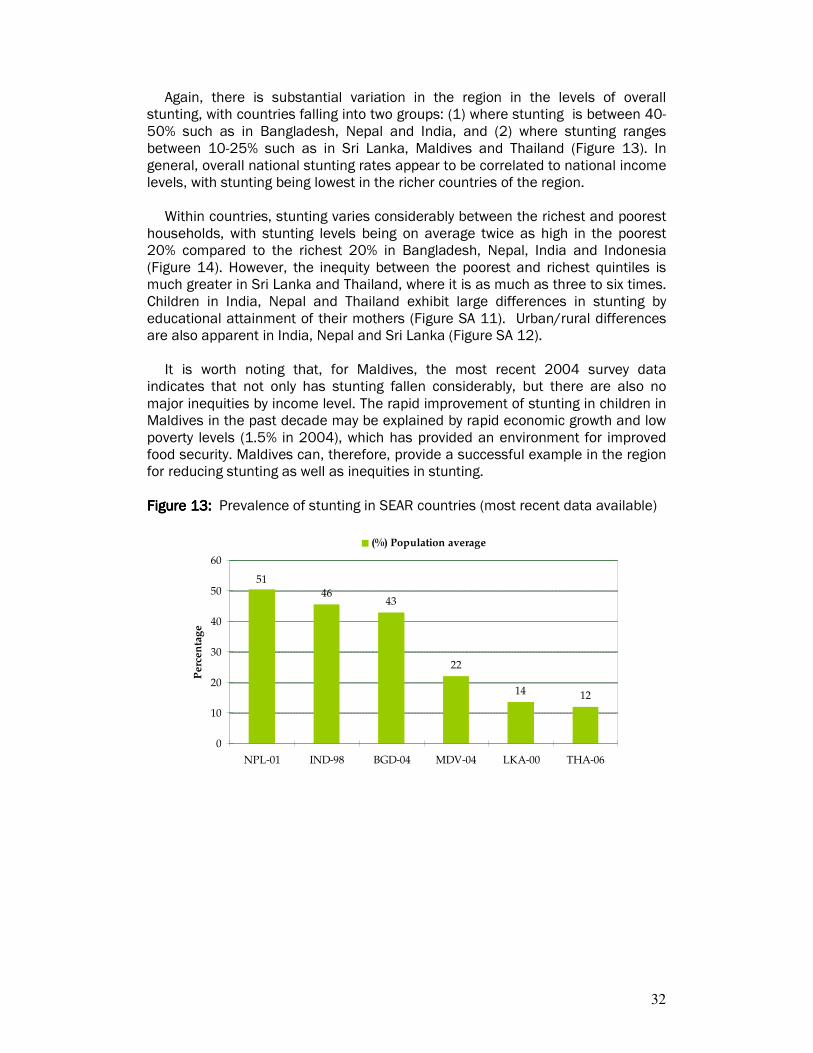
Again, there is substantial variation in the region in the levels of overall stunting, with countries falling into two groups: (1) where stunting is between 40-50% such as in Bangladesh, Nepal and India, and (2) where stunting ranges between 10-25% such as in Sri Lanka, Maldives and Thailand (Figure 13). In general, overall national stunting rates appear to be correlated to national income levels, with stunting being lowest in the richer countries of the region.
Within countries, stunting varies considerably between the richest and poorest
households, with stunting levels being on average twice as high in the poorest 20% compared to the richest 20% in Bangladesh, Nepal, India and Indonesia (Figure 14). However, the inequity between the poorest and richest quintiles is much greater in Sri Lanka and Thailand, where it is as much as three to six times. Children in India, Nepal and Thailand exhibit large differences in stunting by educational attainment of their mothers (Figure SA 11). Urban/rural differences are also apparent in India, Nepal and Sri Lanka (Figure SA 12).
It is worth noting that, for Maldives, the most recent 2004 survey data
indicates that not only has stunting fallen considerably, but there are also no major inequities by income level. The rapid improvement of stunting in children in Maldives in the past decade may be explained by rapid economic growth and low poverty levels (1.5% in 2004), which has provided an environment for improved food security. Maldives can, therefore, provide a successful example in the region for reducing stunting as well as inequities in stunting. Figure 1Figure 1Figure 1Figure 13333: : : : Prevalence of stunting in SEAR countries (most recent data available)
4643
22
14 12
51
0
10
20
30
40
50
60
NPL-01 IND-98 BGD-04 MDV-04 LKA-00 THA-06
Pe
rce
nta
ge
(%) Population average
33
20
3328
35
61 61
1626
74
55
3424
53
0
20
40
60
80
NPL-96 NPL-01 IND-98 BGD-97 BGD-04 LKA-00 THA-06Pe
rce
nta
ge
[p
rev
ale
nce
of
stu
nti
ng
] Richest Poorest Average
Figure 1Figure 1Figure 1Figure 14444: : : : Inequities in prevalence of childhood stunting between the poorest and richest wealth quintiles by country and survey year
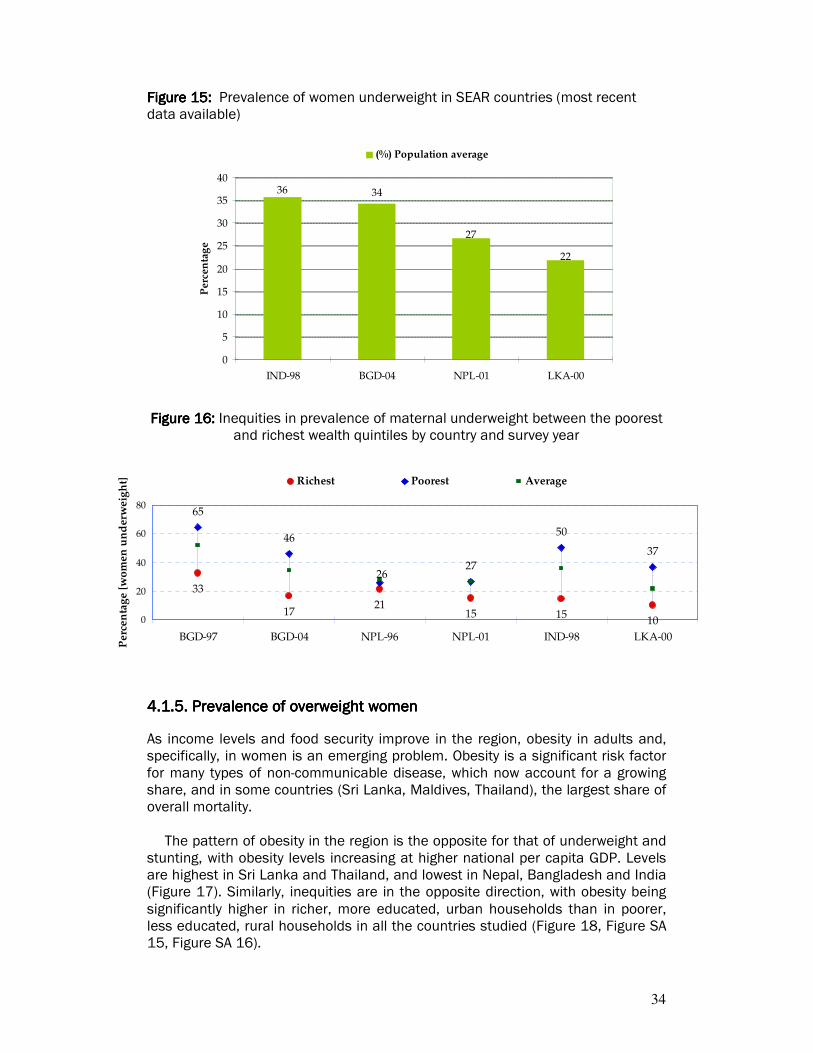
4444....1111.4. Prevalence of underweight women.4. Prevalence of underweight women.4. Prevalence of underweight women.4. Prevalence of underweight women
Inadequate food security manifests itself not only in child malnutrition, but also in maternal undernutrition and maternal underweight. Underweight mothers may suffer worse maternal health outcomes, as well as under-nutrition in children. Prevalence of underweight women is high in South-East Asia, though there is a declining trend. For example, the prevalence of underweight mothers was over 50% in Bangladesh in 1997, but has fallen to less than 40% in 2004.
In most countries of the region, levels remain between 20% to 40% (Figure 15). The differences in national levels closely mirrors those in child stunting rates, and overall rates are lowest in Sri Lanka (22%). Similarly, there is considerable inequity by wealth levels and education in all the countries (Figure 16 and Figure SA 13). The prevalence of underweight women is higher in poorer households than in richer households with poor women being two to three times more likely to be underweight than their wealthier counterparts. Similarly, women with no education are two to three times more likely to be underweight than those with more than a secondary education.
34
33
1721
15 1510
65
46
27
50
37
26
0
20
40
60
80
BGD-97 BGD-04 NPL-96 NPL-01 IND-98 LKA-00
Pe
rce
nta
ge
[w
om
en
un
der
we
igh
t] Richest Poorest Average
Figure 1Figure 1Figure 1Figure 15555: : : : Prevalence of women underweight in SEAR countries (most recent data available)
3436
22
27
0
5
10
15
20
25
30
35
40
IND-98 BGD-04 NPL-01 LKA-00
Perc
en
tag
e
(%) Population average
Figure 1Figure 1Figure 1Figure 16666: : : : Inequities in prevalence of maternal underweight between the poorest and richest wealth quintiles by country and survey year
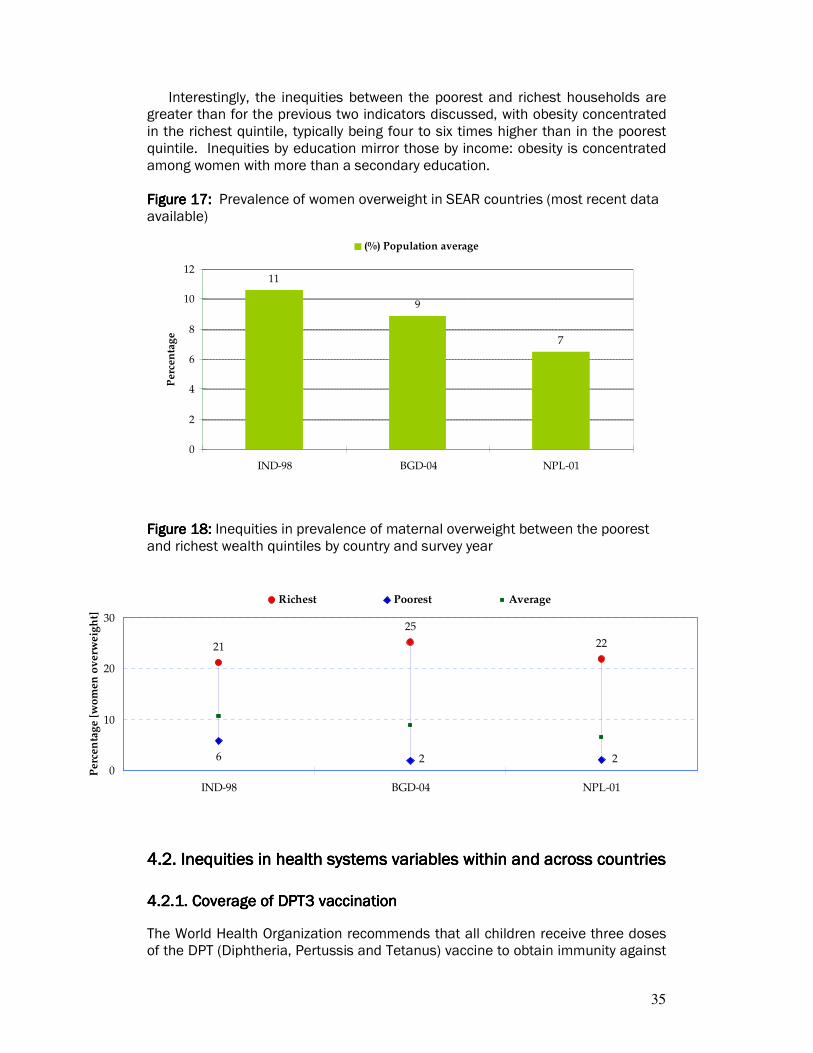
4444....1111.5. Prevalence of overweight women.5. Prevalence of overweight women.5. Prevalence of overweight women.5. Prevalence of overweight women
As income levels and food security improve in the region, obesity in adults and, specifically, in women is an emerging problem. Obesity is a significant risk factor for many types of non-communicable disease, which now account for a growing share, and in some countries (Sri Lanka, Maldives, Thailand), the largest share of overall mortality.
The pattern of obesity in the region is the opposite for that of underweight and stunting, with obesity levels increasing at higher national per capita GDP. Levels are highest in Sri Lanka and Thailand, and lowest in Nepal, Bangladesh and India (Figure 17). Similarly, inequities are in the opposite direction, with obesity being significantly higher in richer, more educated, urban households than in poorer, less educated, rural households in all the countries studied (Figure 18, Figure SA 15, Figure SA 16).
35
21
25
22
6 220
10
20
30
IND-98 BGD-04 NPL-01
Perc
en
tag
e [
wo
men
ov
erw
eig
ht]
Richest Poorest Average
Interestingly, the inequities between the poorest and richest households are greater than for the previous two indicators discussed, with obesity concentrated in the richest quintile, typically being four to six times higher than in the poorest quintile. Inequities by education mirror those by income: obesity is concentrated among women with more than a secondary education. Figure 1Figure 1Figure 1Figure 17777: : : : Prevalence of women overweight in SEAR countries (most recent data available)
11
9
7
0
2
4
6
8
10
12
IND-98 BGD-04 NPL-01
Pe
rce
nta
ge
(%) Population average
Figure 1Figure 1Figure 1Figure 18888:::: Inequities in prevalence of maternal overweight between the poorest and richest wealth quintiles by country and survey year
4.2. Inequities in health systems variables within and across countries 4.2. Inequities in health systems variables within and across countries 4.2. Inequities in health systems variables within and across countries 4.2. Inequities in health systems variables within and across countries
4444....2222.1. Coverage of DPT3 vaccination.1. Coverage of DPT3 vaccination.1. Coverage of DPT3 vaccination.1. Coverage of DPT3 vaccination
The World Health Organization recommends that all children receive three doses of the DPT (Diphtheria, Pertussis and Tetanus) vaccine to obtain immunity against
36
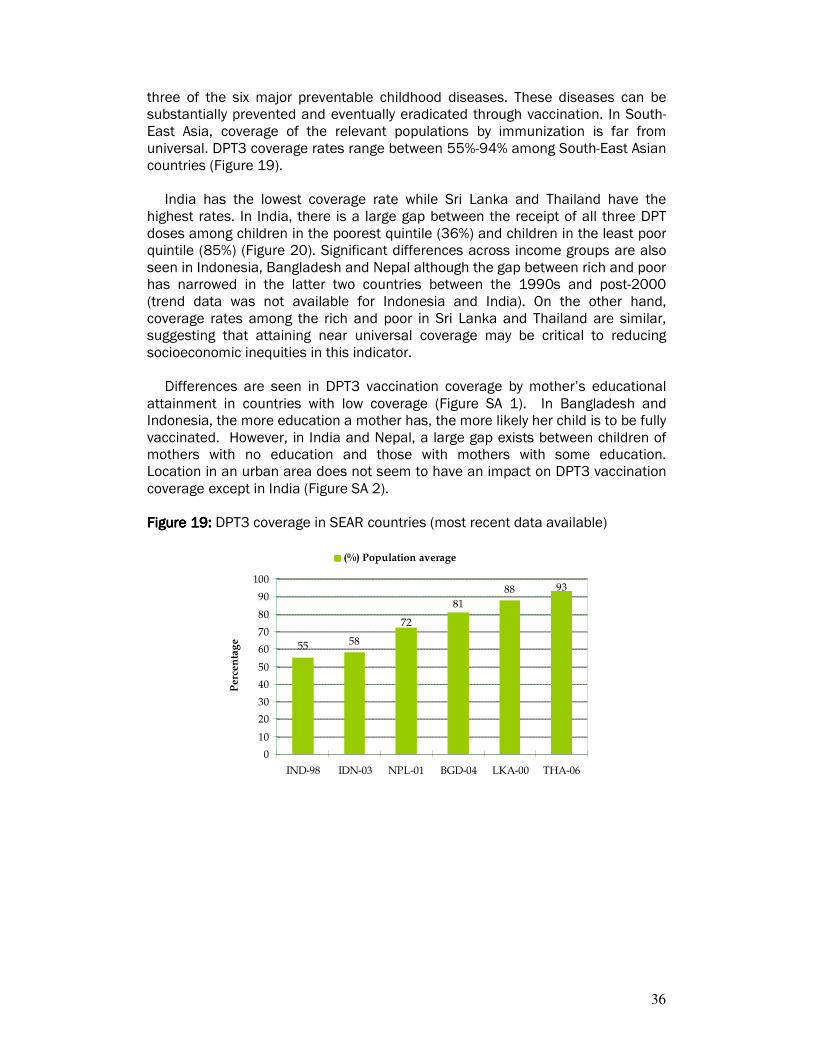
three of the six major preventable childhood diseases. These diseases can be substantially prevented and eventually eradicated through vaccination. In South-East Asia, coverage of the relevant populations by immunization is far from universal. DPT3 coverage rates range between 55%-94% among South-East Asian countries (Figure 19).
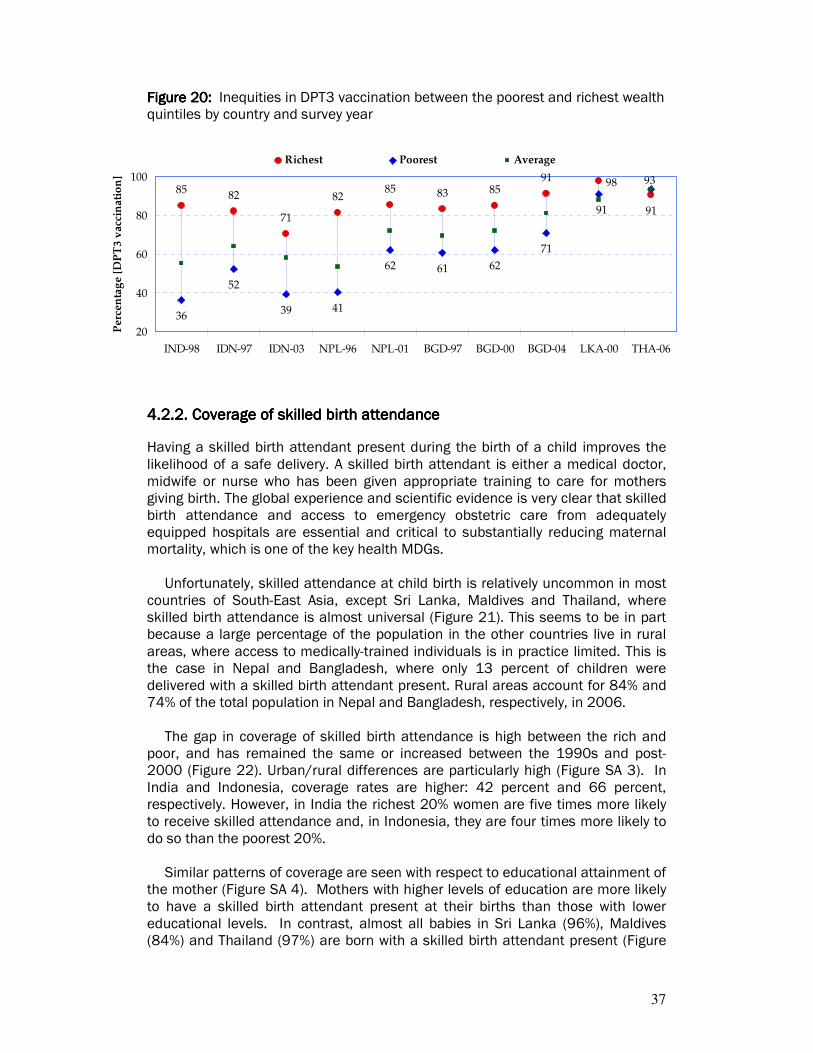
India has the lowest coverage rate while Sri Lanka and Thailand have the highest rates. In India, there is a large gap between the receipt of all three DPT doses among children in the poorest quintile (36%) and children in the least poor quintile (85%) (Figure 20). Significant differences across income groups are also seen in Indonesia, Bangladesh and Nepal although the gap between rich and poor has narrowed in the latter two countries between the 1990s and post-2000 (trend data was not available for Indonesia and India). On the other hand, coverage rates among the rich and poor in Sri Lanka and Thailand are similar, suggesting that attaining near universal coverage may be critical to reducing socioeconomic inequities in this indicator.
Differences are seen in DPT3 vaccination coverage by mother’s educational attainment in countries with low coverage (Figure SA 1). In Bangladesh and Indonesia, the more education a mother has, the more likely her child is to be fully vaccinated. However, in India and Nepal, a large gap exists between children of mothers with no education and those with mothers with some education. Location in an urban area does not seem to have an impact on DPT3 vaccination coverage except in India (Figure SA 2). Figure Figure Figure Figure 19191919: : : : DPT3 coverage in SEAR countries (most recent data available)
58
88
81
72
93
55
0
10
20
30
40
50
60
70
80
90
100
IND-98 IDN-03 NPL-01 BGD-04 LKA-00 THA-06
Perc
en
tag
e
(%) Population average
37
8582
71
8285 83 85
91
36
52
39 41
62 61 62
71
98
91
93
91
20
40
60
80
100
IND-98 IDN-97 IDN-03 NPL-96 NPL-01 BGD-97 BGD-00 BGD-04 LKA-00 THA-06
Pe
rce
nta
ge
[D
PT
3 v
acc
ina
tio
n]
Richest Poorest Average
Figure Figure Figure Figure 20202020: : : : Inequities in DPT3 vaccination between the poorest and richest wealth quintiles by country and survey year
4444....2222.2. Coverage of skilled birth attendance.2. Coverage of skilled birth attendance.2. Coverage of skilled birth attendance.2. Coverage of skilled birth attendance
Having a skilled birth attendant present during the birth of a child improves the likelihood of a safe delivery. A skilled birth attendant is either a medical doctor, midwife or nurse who has been given appropriate training to care for mothers giving birth. The global experience and scientific evidence is very clear that skilled birth attendance and access to emergency obstetric care from adequately equipped hospitals are essential and critical to substantially reducing maternal mortality, which is one of the key health MDGs.
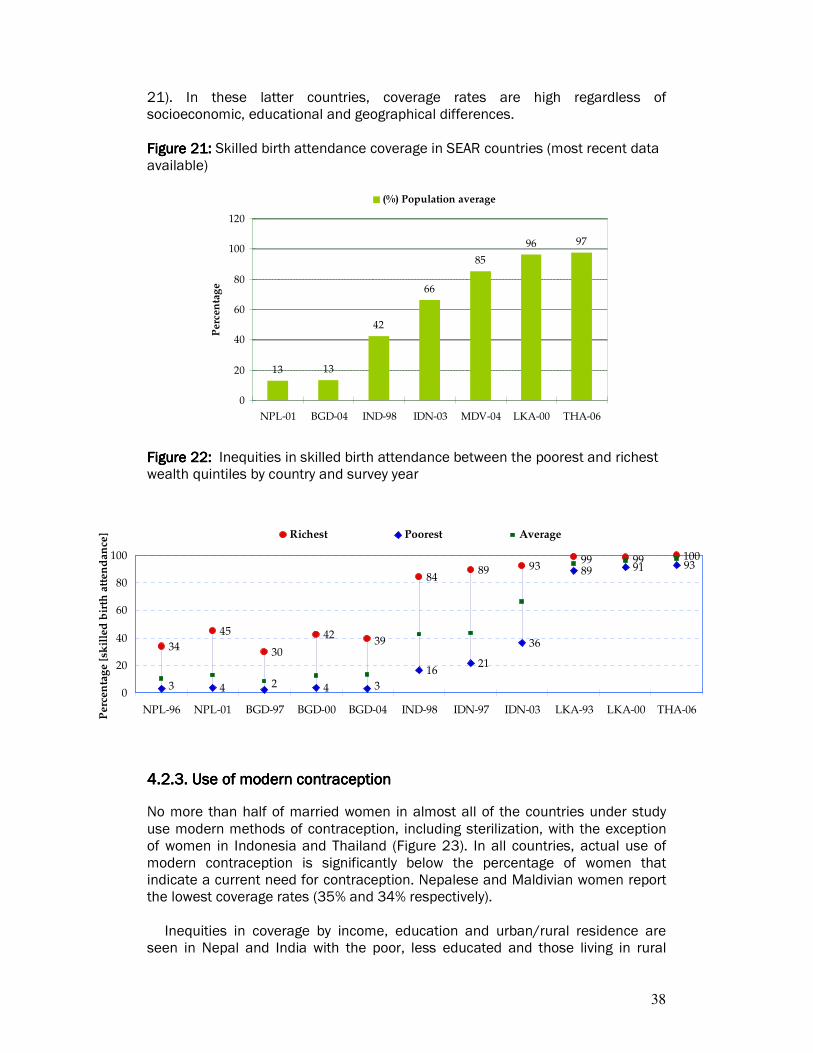
Unfortunately, skilled attendance at child birth is relatively uncommon in most countries of South-East Asia, except Sri Lanka, Maldives and Thailand, where skilled birth attendance is almost universal (Figure 21). This seems to be in part because a large percentage of the population in the other countries live in rural areas, where access to medically-trained individuals is in practice limited. This is the case in Nepal and Bangladesh, where only 13 percent of children were delivered with a skilled birth attendant present. Rural areas account for 84% and 74% of the total population in Nepal and Bangladesh, respectively, in 2006.
The gap in coverage of skilled birth attendance is high between the rich and
poor, and has remained the same or increased between the 1990s and post-2000 (Figure 22). Urban/rural differences are particularly high (Figure SA 3). In India and Indonesia, coverage rates are higher: 42 percent and 66 percent, respectively. However, in India the richest 20% women are five times more likely to receive skilled attendance and, in Indonesia, they are four times more likely to do so than the poorest 20%.
Similar patterns of coverage are seen with respect to educational attainment of the mother (Figure SA 4). Mothers with higher levels of education are more likely to have a skilled birth attendant present at their births than those with lower educational levels. In contrast, almost all babies in Sri Lanka (96%), Maldives (84%) and Thailand (97%) are born with a skilled birth attendant present (Figure
38
34
45
30
42
8489 93
4 4
1621
36
89 91 93
39
1009999
3 320
20
40
60
80
100
NPL-96 NPL-01 BGD-97 BGD-00 BGD-04 IND-98 IDN-97 IDN-03 LKA-93 LKA-00 THA-06
Perc
en
tag
e [
skil
led
bir
th a
tten
dan
ce] Richest Poorest Average
21). In these latter countries, coverage rates are high regardless of socioeconomic, educational and geographical differences.
Figure Figure Figure Figure 21212121: : : : Skilled birth attendance coverage in SEAR countries (most recent data available)
13 13
42
66
85
96 97
0
20
40
60
80
100
120
NPL-01 BGD-04 IND-98 IDN-03 MDV-04 LKA-00 THA-06
Per
cen
tag
e
(%) Population average
Figure Figure Figure Figure 22222222: : : : Inequities in skilled birth attendance between the poorest and richest wealth quintiles by country and survey year
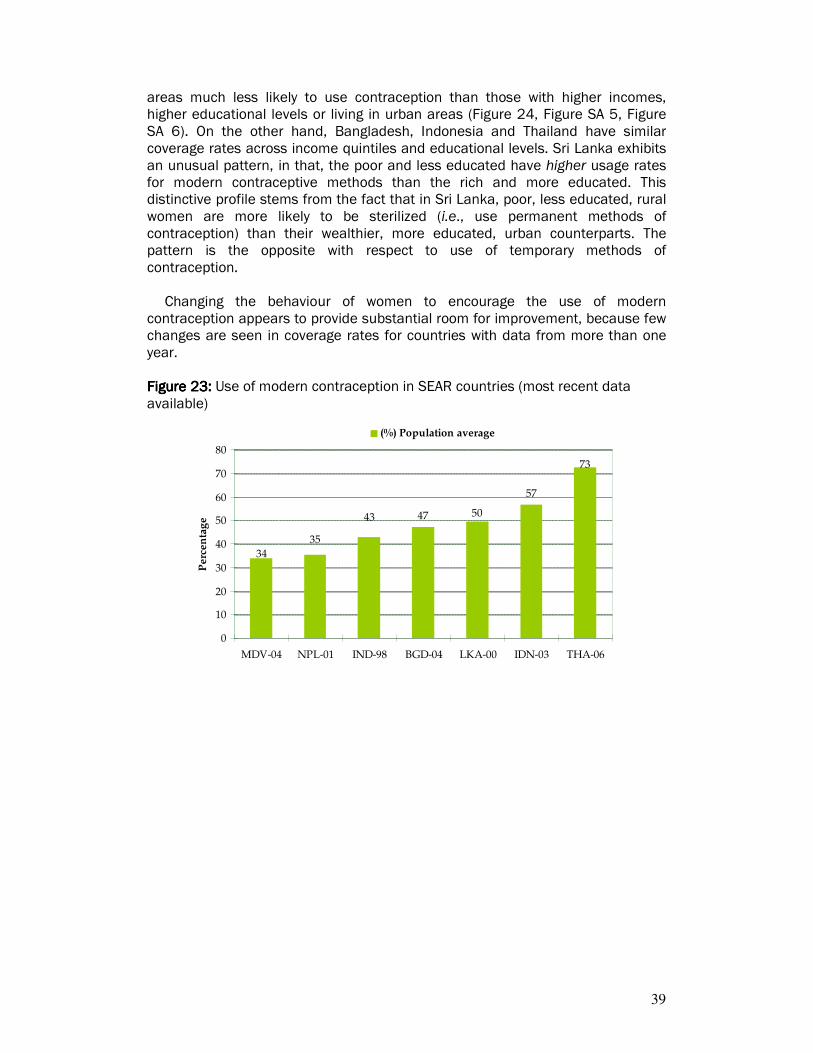
4444....2222.3. Use of modern contraception.3. Use of modern contraception.3. Use of modern contraception.3. Use of modern contraception
No more than half of married women in almost all of the countries under study use modern methods of contraception, including sterilization, with the exception of women in Indonesia and Thailand (Figure 23). In all countries, actual use of modern contraception is significantly below the percentage of women that indicate a current need for contraception. Nepalese and Maldivian women report the lowest coverage rates (35% and 34% respectively).
Inequities in coverage by income, education and urban/rural residence are seen in Nepal and India with the poor, less educated and those living in rural
39
areas much less likely to use contraception than those with higher incomes, higher educational levels or living in urban areas (Figure 24, Figure SA 5, Figure SA 6). On the other hand, Bangladesh, Indonesia and Thailand have similar coverage rates across income quintiles and educational levels. Sri Lanka exhibits an unusual pattern, in that, the poor and less educated have higher usage rates for modern contraceptive methods than the rich and more educated. This distinctive profile stems from the fact that in Sri Lanka, poor, less educated, rural women are more likely to be sterilized (i.e., use permanent methods of contraception) than their wealthier, more educated, urban counterparts. The pattern is the opposite with respect to use of temporary methods of contraception.
Changing the behaviour of women to encourage the use of modern
contraception appears to provide substantial room for improvement, because few changes are seen in coverage rates for countries with data from more than one year. Figure Figure Figure Figure 23232323: : : : Use of modern contraception in SEAR countries (most recent data available)
47
57
35
34
5043
73
0
10
20
30
40
50
60
70
80
MDV-04 NPL-01 IND-98 BGD-04 LKA-00 IDN-03 THA-06
Pe
rce
nta
ge
(%) Population average
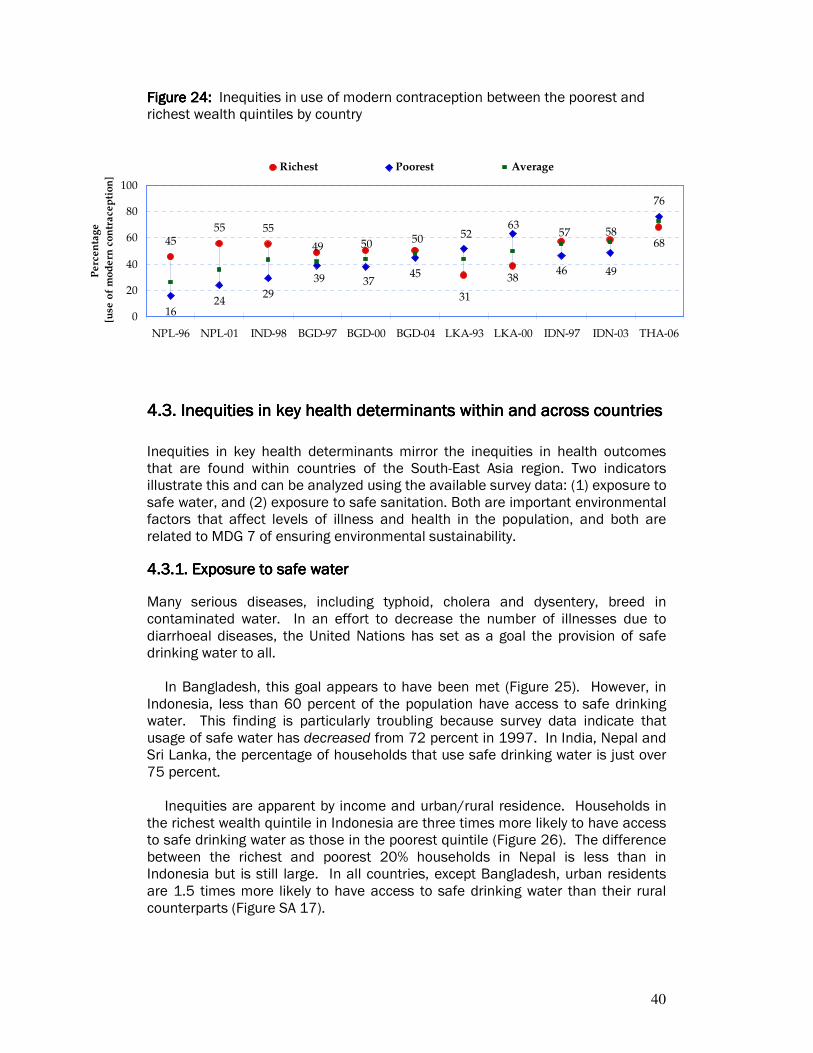
40
4555 55
1624
29 31
5049
585768
38
50 52
37394946
76
63
45
0
20
40
60
80
100
NPL-96 NPL-01 IND-98 BGD-97 BGD-00 BGD-04 LKA-93 LKA-00 IDN-97 IDN-03 THA-06
Pe
rce
nta
ge
[u
se o
f m
od
ern
co
ntr
ace
pti
on
]
Richest Poorest Average
Figure Figure Figure Figure 24242424: : : : Inequities in use of modern contraception between the poorest and richest wealth quintiles by country
4.34.34.34.3.... Inequities in key health determinants within and across countries Inequities in key health determinants within and across countries Inequities in key health determinants within and across countries Inequities in key health determinants within and across countries
Inequities in key health determinants mirror the inequities in health outcomes that are found within countries of the South-East Asia region. Two indicators illustrate this and can be analyzed using the available survey data: (1) exposure to safe water, and (2) exposure to safe sanitation. Both are important environmental factors that affect levels of illness and health in the population, and both are related to MDG 7 of ensuring environmental sustainability.
4444....3333.1. Exposure to safe water.1. Exposure to safe water.1. Exposure to safe water.1. Exposure to safe water
Many serious diseases, including typhoid, cholera and dysentery, breed in contaminated water. In an effort to decrease the number of illnesses due to diarrhoeal diseases, the United Nations has set as a goal the provision of safe drinking water to all.
In Bangladesh, this goal appears to have been met (Figure 25). However, in Indonesia, less than 60 percent of the population have access to safe drinking water. This finding is particularly troubling because survey data indicate that usage of safe water has decreased from 72 percent in 1997. In India, Nepal and Sri Lanka, the percentage of households that use safe drinking water is just over 75 percent.
Inequities are apparent by income and urban/rural residence. Households in
the richest wealth quintile in Indonesia are three times more likely to have access to safe drinking water as those in the poorest quintile (Figure 26). The difference between the richest and poorest 20% households in Nepal is less than in Indonesia but is still large. In all countries, except Bangladesh, urban residents are 1.5 times more likely to have access to safe drinking water than their rural counterparts (Figure SA 17).
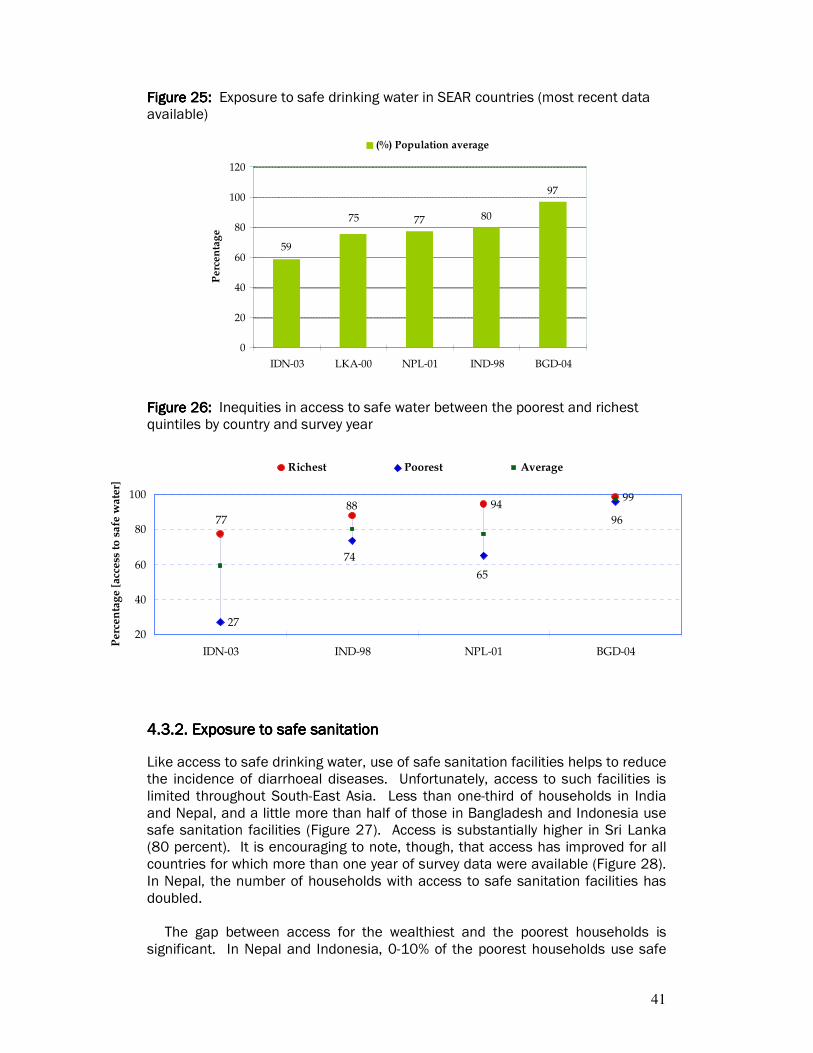
41
9499
27
7788
96
65
74
20
40
60
80
100
IDN-03 IND-98 NPL-01 BGD-04
Pe
rce
nta
ge
[ac
cess
to
sa
fe w
ate
r]
Richest Poorest Average
Figure Figure Figure Figure 25252525: : : : Exposure to safe drinking water in SEAR countries (most recent data available)
77 80
97
75
59
0
20
40
60
80
100
120
IDN-03 LKA-00 NPL-01 IND-98 BGD-04
Pe
rce
nta
ge
(%) Population average
Figure Figure Figure Figure 26262626: : : : Inequities in access to safe water between the poorest and richest quintiles by country and survey year
4444....3333.2. Exposure to safe sanitation.2. Exposure to safe sanitation.2. Exposure to safe sanitation.2. Exposure to safe sanitation
Like access to safe drinking water, use of safe sanitation facilities helps to reduce the incidence of diarrhoeal diseases. Unfortunately, access to such facilities is limited throughout South-East Asia. Less than one-third of households in India and Nepal, and a little more than half of those in Bangladesh and Indonesia use safe sanitation facilities (Figure 27). Access is substantially higher in Sri Lanka (80 percent). It is encouraging to note, though, that access has improved for all countries for which more than one year of survey data were available (Figure 28). In Nepal, the number of households with access to safe sanitation facilities has doubled.
The gap between access for the wealthiest and the poorest households is significant. In Nepal and Indonesia, 0-10% of the poorest households use safe
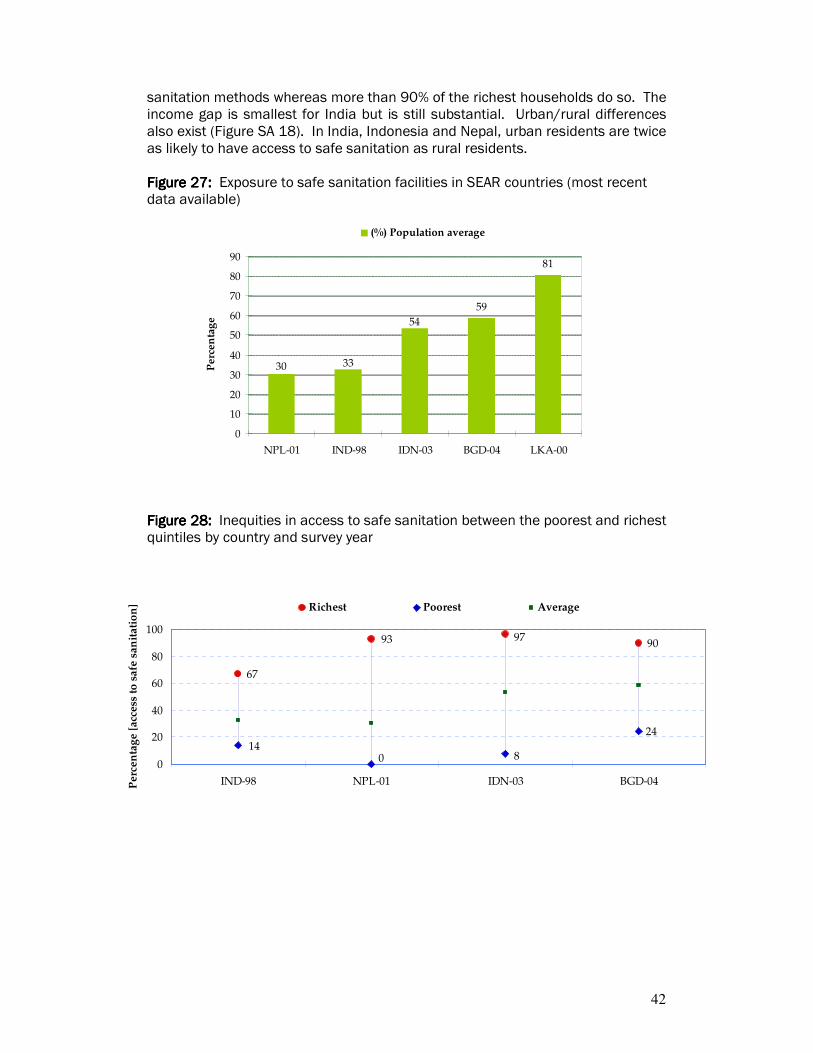
42
67
93 9790
24
140 8
0
20
40
60
80
100
IND-98 NPL-01 IDN-03 BGD-04Pe
rce
nta
ge
[a
cce
ss t
o s
afe
sa
nit
ati
on
] Richest Poorest Average
sanitation methods whereas more than 90% of the richest households do so. The income gap is smallest for India but is still substantial. Urban/rural differences also exist (Figure SA 18). In India, Indonesia and Nepal, urban residents are twice as likely to have access to safe sanitation as rural residents. Figure 2Figure 2Figure 2Figure 27777: : : : Exposure to safe sanitation facilities in SEAR countries (most recent data available)
59
81
54
3330
0
10
20
30
40
50
60
70
80
90
NPL-01 IND-98 IDN-03 BGD-04 LKA-00
Pe
rce
nta
ge
(%) Population average
Figure 2Figure 2Figure 2Figure 28888: : : : Inequities in access to safe sanitation between the poorest and richest quintiles by country and survey year
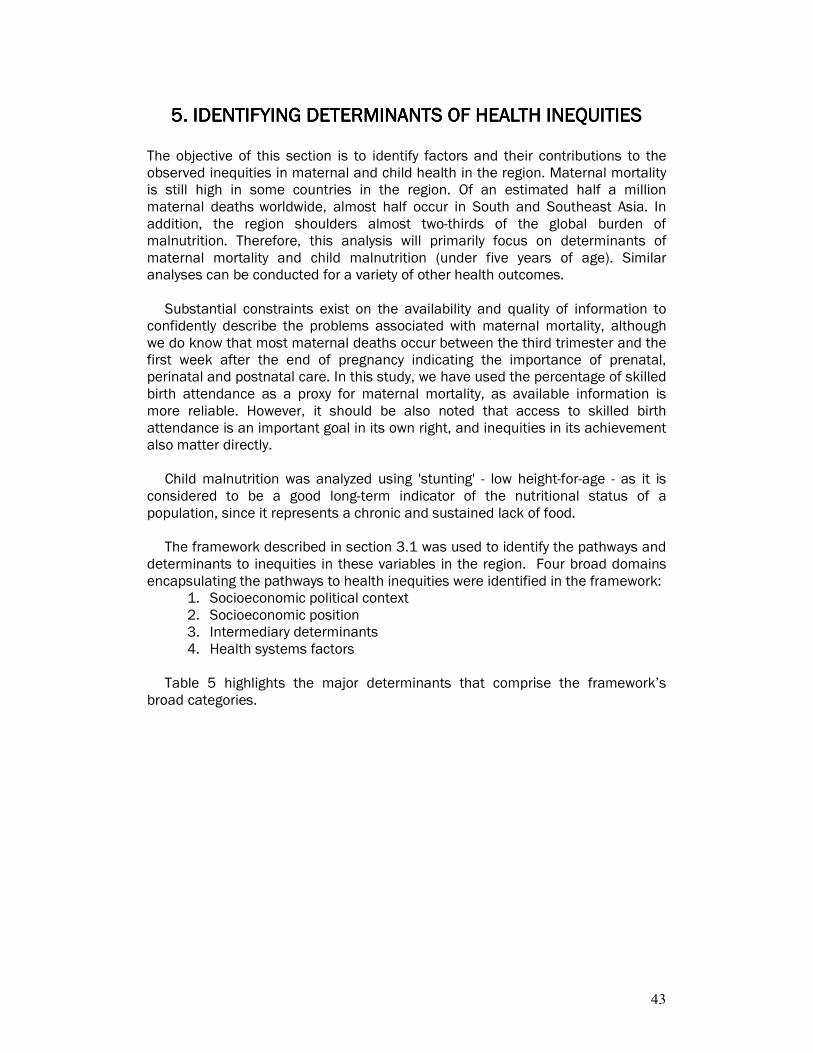
43
5555. IDENTIFYING DETERM. IDENTIFYING DETERM. IDENTIFYING DETERM. IDENTIFYING DETERMINANTS OF HEALTH INEINANTS OF HEALTH INEINANTS OF HEALTH INEINANTS OF HEALTH INEQUITIESQUITIESQUITIESQUITIES The objective of this section is to identify factors and their contributions to the observed inequities in maternal and child health in the region. Maternal mortality is still high in some countries in the region. Of an estimated half a million maternal deaths worldwide, almost half occur in South and Southeast Asia. In addition, the region shoulders almost two-thirds of the global burden of malnutrition. Therefore, this analysis will primarily focus on determinants of maternal mortality and child malnutrition (under five years of age). Similar analyses can be conducted for a variety of other health outcomes.
Substantial constraints exist on the availability and quality of information to confidently describe the problems associated with maternal mortality, although we do know that most maternal deaths occur between the third trimester and the first week after the end of pregnancy indicating the importance of prenatal, perinatal and postnatal care. In this study, we have used the percentage of skilled birth attendance as a proxy for maternal mortality, as available information is more reliable. However, it should be also noted that access to skilled birth attendance is an important goal in its own right, and inequities in its achievement also matter directly.
Child malnutrition was analyzed using 'stunting' - low height-for-age - as it is considered to be a good long-term indicator of the nutritional status of a population, since it represents a chronic and sustained lack of food.
The framework described in section 3.1 was used to identify the pathways and determinants to inequities in these variables in the region. Four broad domains encapsulating the pathways to health inequities were identified in the framework:
1. Socioeconomic political context 2. Socioeconomic position 3. Intermediary determinants 4. Health systems factors
Table 5 highlights the major determinants that comprise the framework’s
broad categories.
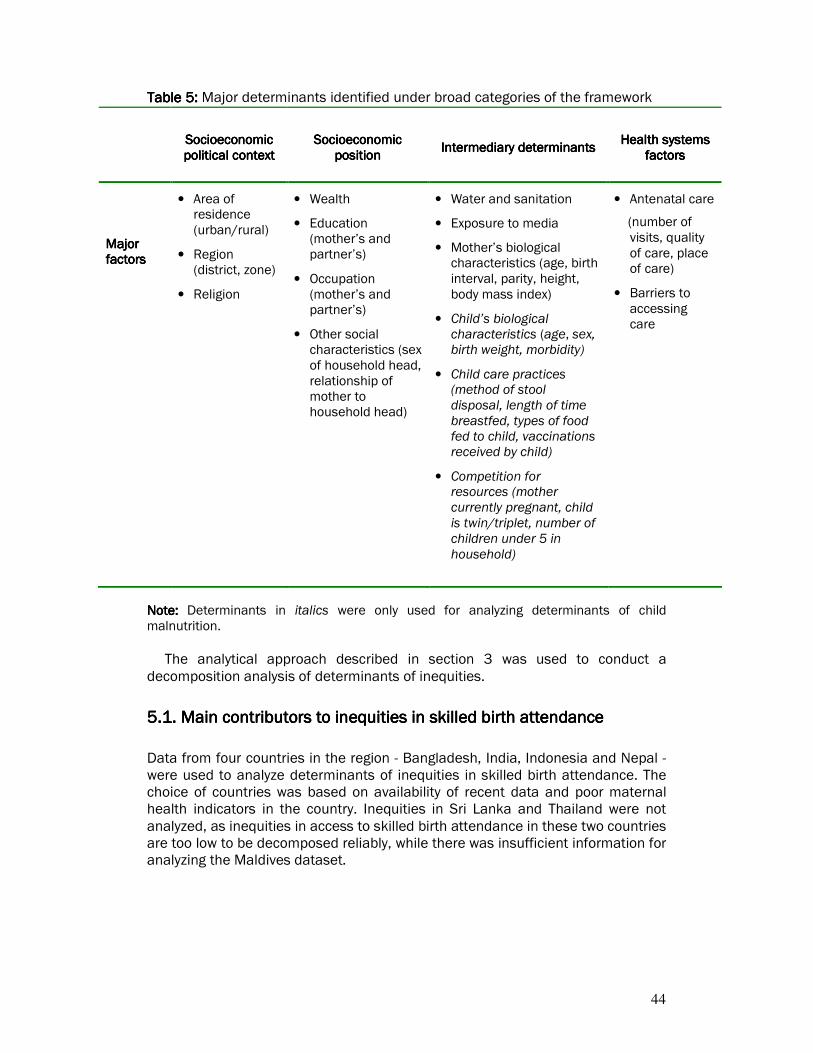
44
Table Table Table Table 5555: : : : Major determinants identified under broad categories of the framework
Socioeconomic Socioeconomic Socioeconomic Socioeconomic political contextpolitical contextpolitical contextpolitical context
Socioeconomic Socioeconomic Socioeconomic Socioeconomic positionpositionpositionposition
Intermediary deteIntermediary deteIntermediary deteIntermediary determinantsrminantsrminantsrminants Health systems Health systems Health systems Health systems
factorsfactorsfactorsfactors
Major Major Major Major factorsfactorsfactorsfactors
• Area of residence (urban/rural)
• Region (district, zone)
• Religion
• Wealth
• Education (mother’s and partner’s)
• Occupation (mother’s and partner’s)
• Other social characteristics (sex of household head, relationship of mother to household head)
• Water and sanitation
• Exposure to media
• Mother’s biological characteristics (age, birth interval, parity, height, body mass index)
• Child’s biological characteristics (age, sex, birth weight, morbidity)
• Child care practices (method of stool disposal, length of time breastfed, types of food fed to child, vaccinations received by child)
• Competition for resources (mother currently pregnant, child is twin/triplet, number of children under 5 in household)
• Antenatal care
(number of visits, quality of care, place of care)
• Barriers to accessing care
Note: Note: Note: Note: Determinants in italics were only used for analyzing determinants of child malnutrition.
The analytical approach described in section 3 was used to conduct a
decomposition analysis of determinants of inequities.
5555.1.1.1.1.... Main contributors to inequities in skilled birth attendance Main contributors to inequities in skilled birth attendance Main contributors to inequities in skilled birth attendance Main contributors to inequities in skilled birth attendance
Data from four countries in the region - Bangladesh, India, Indonesia and Nepal - were used to analyze determinants of inequities in skilled birth attendance. The choice of countries was based on availability of recent data and poor maternal health indicators in the country. Inequities in Sri Lanka and Thailand were not analyzed, as inequities in access to skilled birth attendance in these two countries are too low to be decomposed reliably, while there was insufficient information for analyzing the Maldives dataset.
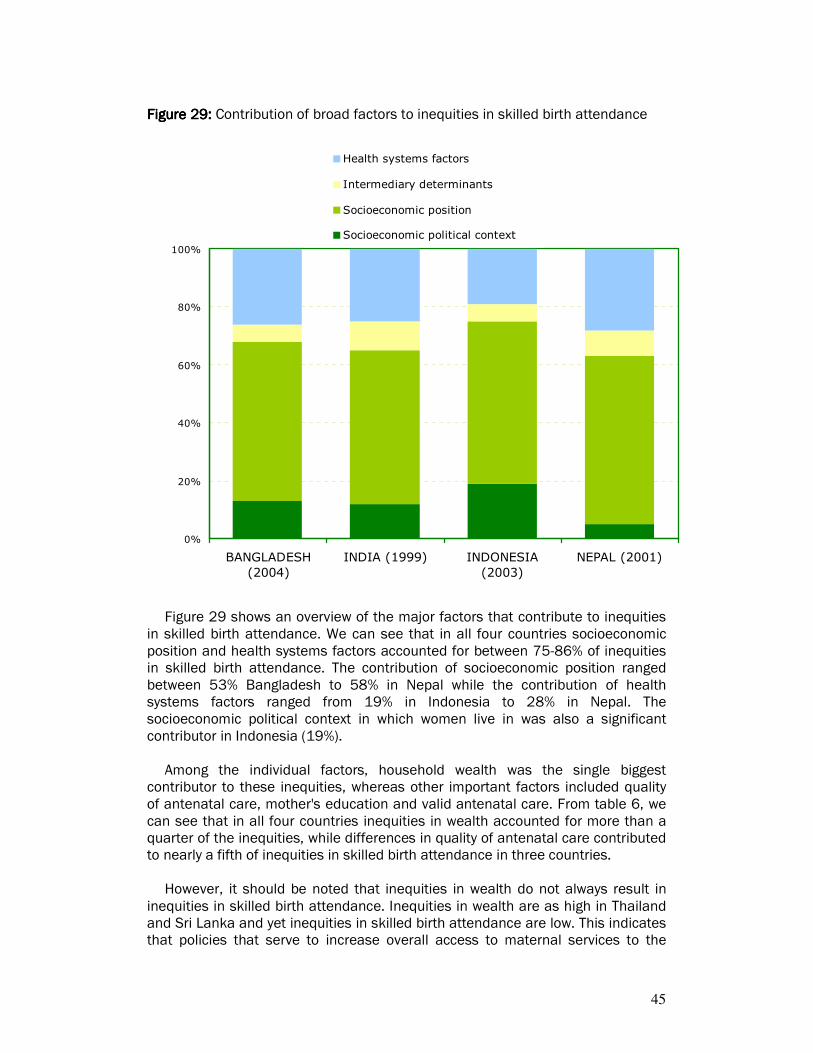
45
Figure 2Figure 2Figure 2Figure 29999: : : : Contribution of broad factors to inequities in skilled birth attendance
0%
20%
40%
60%
80%
100%
BANGLADESH
(2004)
INDIA (1999) INDONESIA
(2003)
NEPAL (2001)
Health systems factors
Intermediary determinants
Socioeconomic position
Socioeconomic political context
Figure 29 shows an overview of the major factors that contribute to inequities
in skilled birth attendance. We can see that in all four countries socioeconomic position and health systems factors accounted for between 75-86% of inequities in skilled birth attendance. The contribution of socioeconomic position ranged between 53% Bangladesh to 58% in Nepal while the contribution of health systems factors ranged from 19% in Indonesia to 28% in Nepal. The socioeconomic political context in which women live in was also a significant contributor in Indonesia (19%).
Among the individual factors, household wealth was the single biggest contributor to these inequities, whereas other important factors included quality of antenatal care, mother's education and valid antenatal care. From table 6, we can see that in all four countries inequities in wealth accounted for more than a quarter of the inequities, while differences in quality of antenatal care contributed to nearly a fifth of inequities in skilled birth attendance in three countries.
However, it should be noted that inequities in wealth do not always result in inequities in skilled birth attendance. Inequities in wealth are as high in Thailand and Sri Lanka and yet inequities in skilled birth attendance are low. This indicates that policies that serve to increase overall access to maternal services to the
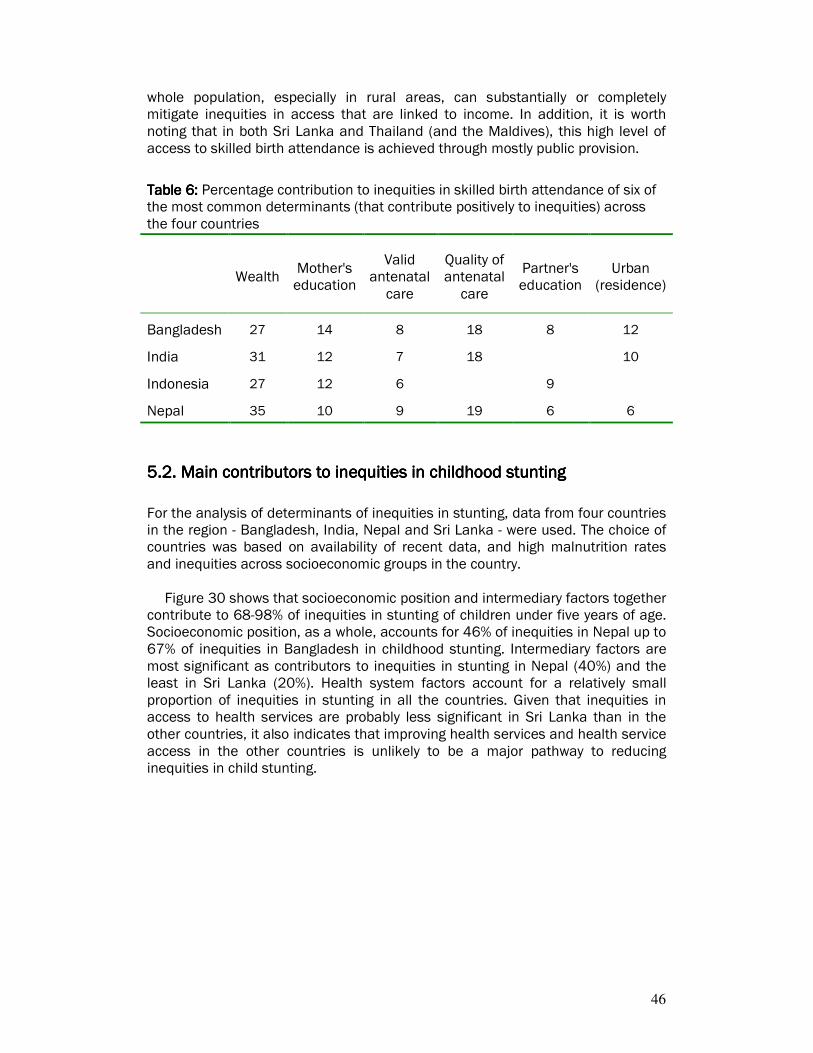
46
whole population, especially in rural areas, can substantially or completely mitigate inequities in access that are linked to income. In addition, it is worth noting that in both Sri Lanka and Thailand (and the Maldives), this high level of access to skilled birth attendance is achieved through mostly public provision.
Table Table Table Table 6666: : : : Percentage contribution to inequities in skilled birth attendance of six of the most common determinants (that contribute positively to inequities) across the four countries
Wealth Mother's education
Valid antenatal
care
Quality of antenatal
care
Partner's education
Urban (residence)
Bangladesh 27 14 8 18 8 12
India 31 12 7 18 10
Indonesia 27 12 6 9
Nepal 35 10 9 19 6 6
5555.2.2.2.2.... Main contributors to inequities in childhood stunting Main contributors to inequities in childhood stunting Main contributors to inequities in childhood stunting Main contributors to inequities in childhood stunting
For the analysis of determinants of inequities in stunting, data from four countries in the region - Bangladesh, India, Nepal and Sri Lanka - were used. The choice of countries was based on availability of recent data, and high malnutrition rates and inequities across socioeconomic groups in the country.
Figure 30 shows that socioeconomic position and intermediary factors together contribute to 68-98% of inequities in stunting of children under five years of age. Socioeconomic position, as a whole, accounts for 46% of inequities in Nepal up to 67% of inequities in Bangladesh in childhood stunting. Intermediary factors are most significant as contributors to inequities in stunting in Nepal (40%) and the least in Sri Lanka (20%). Health system factors account for a relatively small proportion of inequities in stunting in all the countries. Given that inequities in access to health services are probably less significant in Sri Lanka than in the other countries, it also indicates that improving health services and health service access in the other countries is unlikely to be a major pathway to reducing inequities in child stunting.
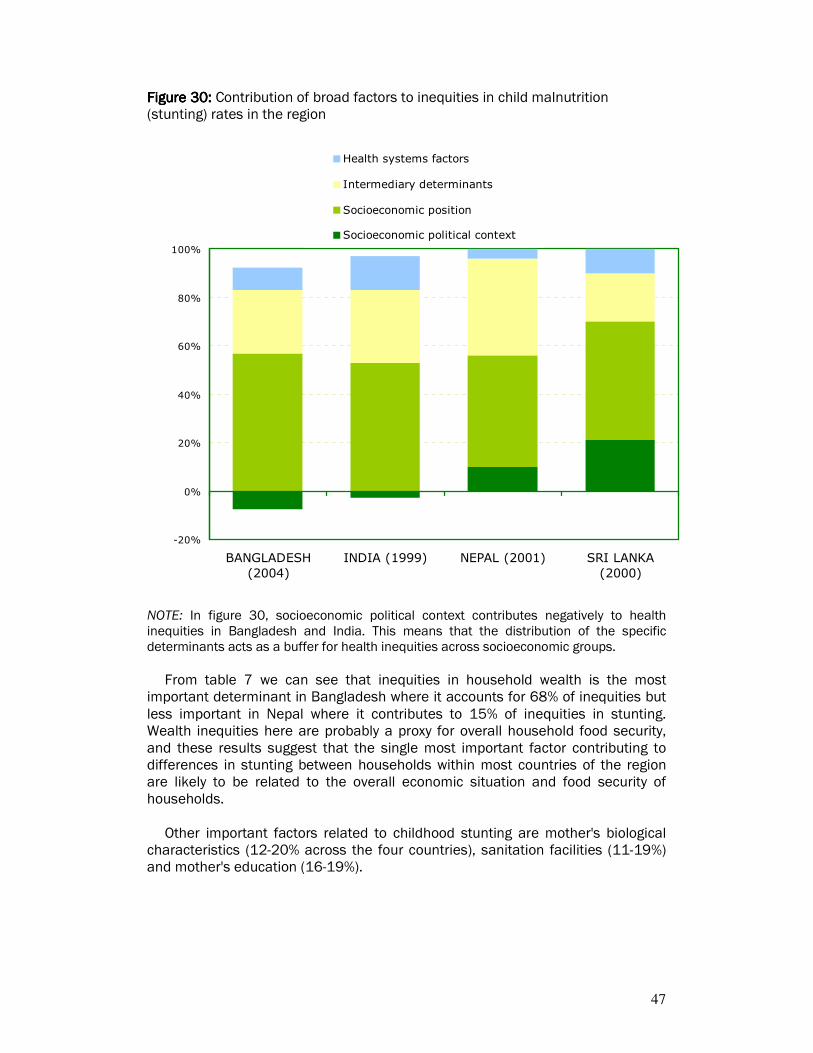
47
Figure Figure Figure Figure 30303030: : : : Contribution of broad factors to inequities in child malnutrition (stunting) rates in the region
-20%
0%
20%
40%
60%
80%
100%
BANGLADESH
(2004)
INDIA (1999) NEPAL (2001) SRI LANKA
(2000)
Health systems factors
Intermediary determinants
Socioeconomic position
Socioeconomic political context
NOTE: In figure 30, socioeconomic political context contributes negatively to health inequities in Bangladesh and India. This means that the distribution of the specific determinants acts as a buffer for health inequities across socioeconomic groups.
From table 7 we can see that inequities in household wealth is the most
important determinant in Bangladesh where it accounts for 68% of inequities but less important in Nepal where it contributes to 15% of inequities in stunting. Wealth inequities here are probably a proxy for overall household food security, and these results suggest that the single most important factor contributing to differences in stunting between households within most countries of the region are likely to be related to the overall economic situation and food security of households.
Other important factors related to childhood stunting are mother's biological characteristics (12-20% across the four countries), sanitation facilities (11-19%) and mother's education (16-19%).
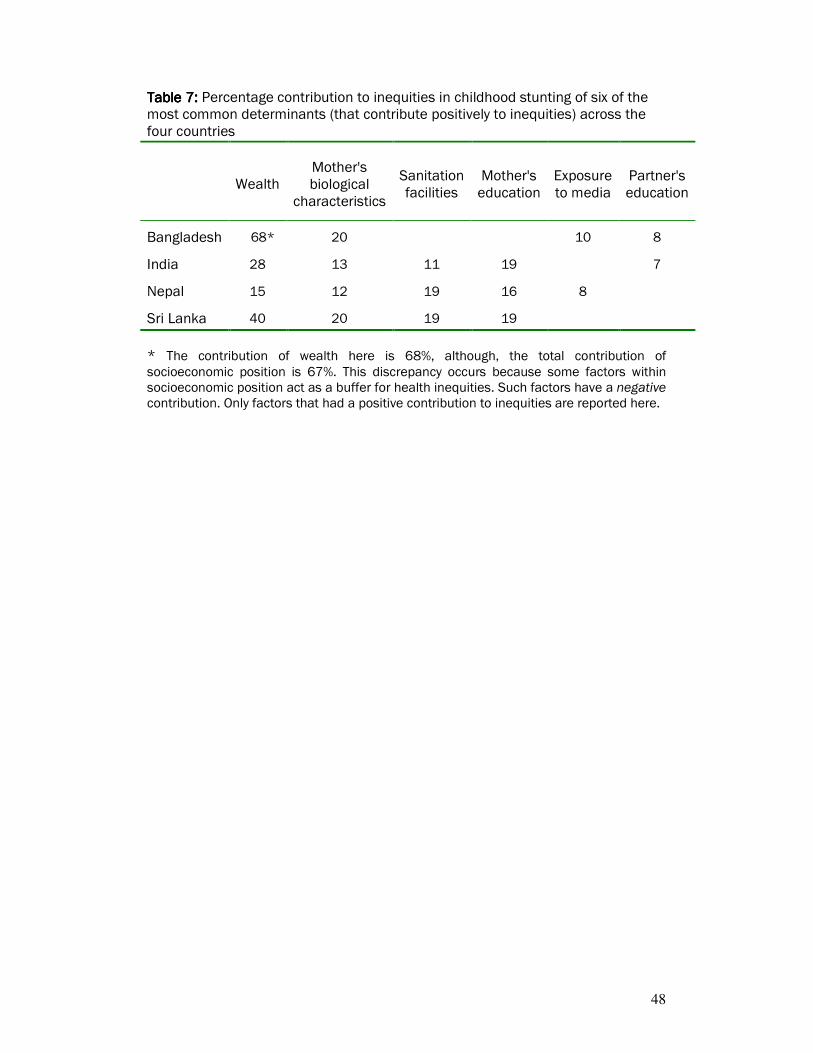
48
Table Table Table Table 7777: : : : Percentage contribution to inequities in childhood stunting of six of the most common determinants (that contribute positively to inequities) across the four countries
Wealth Mother's biological
characteristics
Sanitation facilities
Mother's education
Exposure to media
Partner's education
Bangladesh 68* 20 10 8
India 28 13 11 19 7
Nepal 15 12 19 16 8
Sri Lanka 40 20 19 19
* The contribution of wealth here is 68%, although, the total contribution of socioeconomic position is 67%. This discrepancy occurs because some factors within socioeconomic position act as a buffer for health inequities. Such factors have a negative contribution. Only factors that had a positive contribution to inequities are reported here.
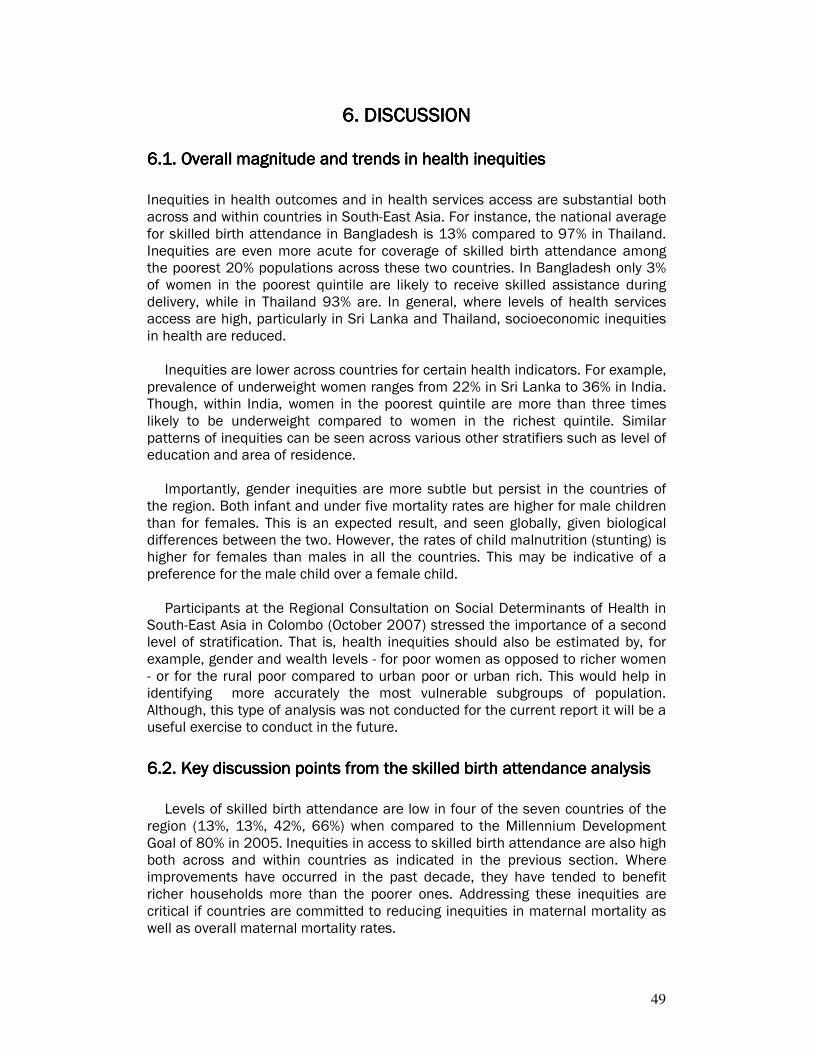
49
6. 6. 6. 6. DISCUSSIONDISCUSSIONDISCUSSIONDISCUSSION
6666.1.1.1.1.... Overall magnitude and trends in health inequitiesOverall magnitude and trends in health inequitiesOverall magnitude and trends in health inequitiesOverall magnitude and trends in health inequities
Inequities in health outcomes and in health services access are substantial both across and within countries in South-East Asia. For instance, the national average for skilled birth attendance in Bangladesh is 13% compared to 97% in Thailand. Inequities are even more acute for coverage of skilled birth attendance among the poorest 20% populations across these two countries. In Bangladesh only 3% of women in the poorest quintile are likely to receive skilled assistance during delivery, while in Thailand 93% are. In general, where levels of health services access are high, particularly in Sri Lanka and Thailand, socioeconomic inequities in health are reduced. Inequities are lower across countries for certain health indicators. For example, prevalence of underweight women ranges from 22% in Sri Lanka to 36% in India. Though, within India, women in the poorest quintile are more than three times likely to be underweight compared to women in the richest quintile. Similar patterns of inequities can be seen across various other stratifiers such as level of education and area of residence. Importantly, gender inequities are more subtle but persist in the countries of the region. Both infant and under five mortality rates are higher for male children than for females. This is an expected result, and seen globally, given biological differences between the two. However, the rates of child malnutrition (stunting) is higher for females than males in all the countries. This may be indicative of a preference for the male child over a female child. Participants at the Regional Consultation on Social Determinants of Health in South-East Asia in Colombo (October 2007) stressed the importance of a second level of stratification. That is, health inequities should also be estimated by, for example, gender and wealth levels - for poor women as opposed to richer women - or for the rural poor compared to urban poor or urban rich. This would help in identifying more accurately the most vulnerable subgroups of population. Although, this type of analysis was not conducted for the current report it will be a useful exercise to conduct in the future.
6666....2.2.2.2. Key Key Key Key discussion points discussion points discussion points discussion points from the skilled birthfrom the skilled birthfrom the skilled birthfrom the skilled birth attendance analysis attendance analysis attendance analysis attendance analysis
Levels of skilled birth attendance are low in four of the seven countries of the region (13%, 13%, 42%, 66%) when compared to the Millennium Development Goal of 80% in 2005. Inequities in access to skilled birth attendance are also high both across and within countries as indicated in the previous section. Where improvements have occurred in the past decade, they have tended to benefit richer households more than the poorer ones. Addressing these inequities are critical if countries are committed to reducing inequities in maternal mortality as well as overall maternal mortality rates.
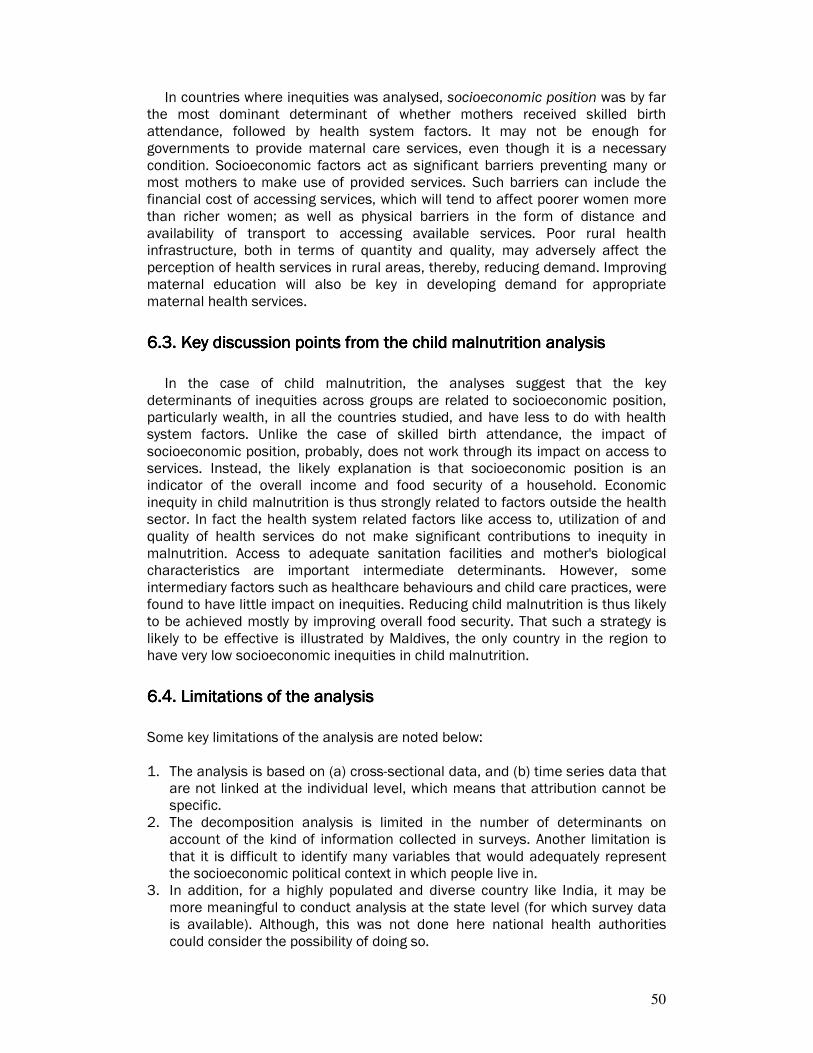
50
In countries where inequities was analysed, socioeconomic position was by far the most dominant determinant of whether mothers received skilled birth attendance, followed by health system factors. It may not be enough for governments to provide maternal care services, even though it is a necessary condition. Socioeconomic factors act as significant barriers preventing many or most mothers to make use of provided services. Such barriers can include the financial cost of accessing services, which will tend to affect poorer women more than richer women; as well as physical barriers in the form of distance and availability of transport to accessing available services. Poor rural health infrastructure, both in terms of quantity and quality, may adversely affect the perception of health services in rural areas, thereby, reducing demand. Improving maternal education will also be key in developing demand for appropriate maternal health services.
6666....3333.... Key Key Key Key discussion pointsdiscussion pointsdiscussion pointsdiscussion points from the child malnutrition analysis from the child malnutrition analysis from the child malnutrition analysis from the child malnutrition analysis
In the case of child malnutrition, the analyses suggest that the key determinants of inequities across groups are related to socioeconomic position, particularly wealth, in all the countries studied, and have less to do with health system factors. Unlike the case of skilled birth attendance, the impact of socioeconomic position, probably, does not work through its impact on access to services. Instead, the likely explanation is that socioeconomic position is an indicator of the overall income and food security of a household. Economic inequity in child malnutrition is thus strongly related to factors outside the health sector. In fact the health system related factors like access to, utilization of and quality of health services do not make significant contributions to inequity in malnutrition. Access to adequate sanitation facilities and mother's biological characteristics are important intermediate determinants. However, some intermediary factors such as healthcare behaviours and child care practices, were found to have little impact on inequities. Reducing child malnutrition is thus likely to be achieved mostly by improving overall food security. That such a strategy is likely to be effective is illustrated by Maldives, the only country in the region to have very low socioeconomic inequities in child malnutrition.
6666....4.4.4.4. Limitations of the analysisLimitations of the analysisLimitations of the analysisLimitations of the analysis
Some key limitations of the analysis are noted below: 1. The analysis is based on (a) cross-sectional data, and (b) time series data that
are not linked at the individual level, which means that attribution cannot be specific.
2. The decomposition analysis is limited in the number of determinants on account of the kind of information collected in surveys. Another limitation is that it is difficult to identify many variables that would adequately represent the socioeconomic political context in which people live in.
3. In addition, for a highly populated and diverse country like India, it may be more meaningful to conduct analysis at the state level (for which survey data is available). Although, this was not done here national health authorities could consider the possibility of doing so.
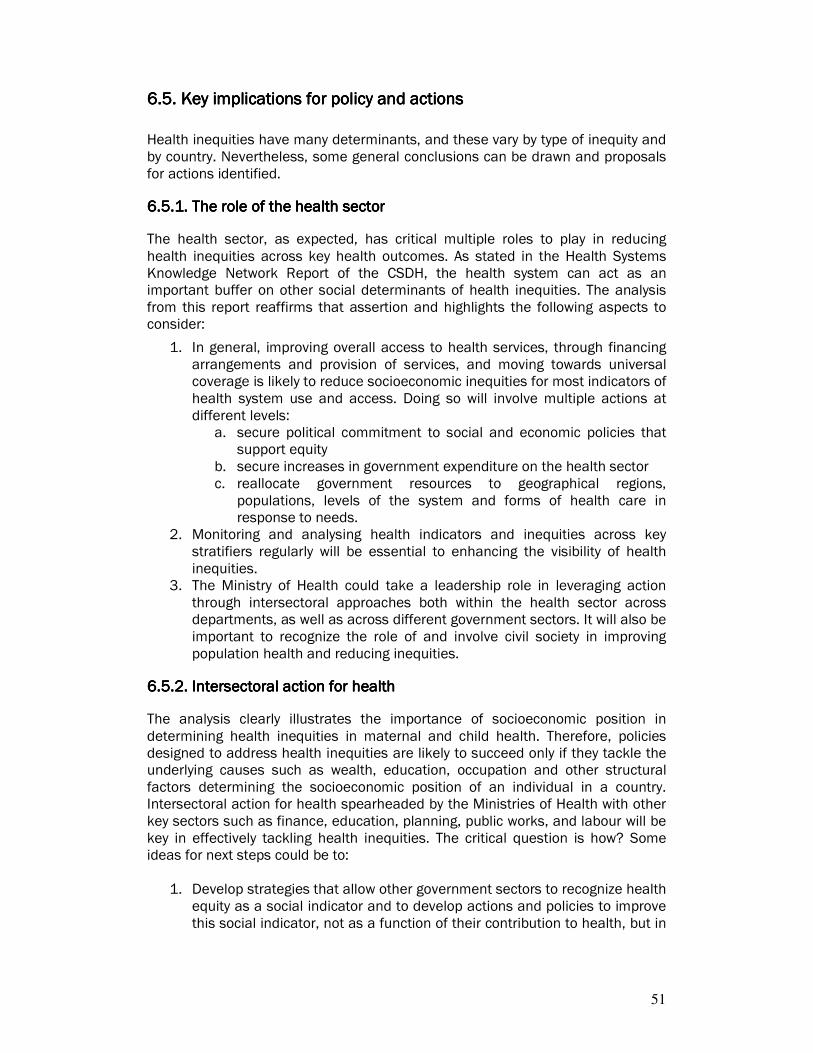
51
6666....5555.... Key iKey iKey iKey implicationsmplicationsmplicationsmplications for policy and actions for policy and actions for policy and actions for policy and actions
Health inequities have many determinants, and these vary by type of inequity and by country. Nevertheless, some general conclusions can be drawn and proposals for actions identified.
6.6.6.6.5555.1. The role of the health sector.1. The role of the health sector.1. The role of the health sector.1. The role of the health sector
The health sector, as expected, has critical multiple roles to play in reducing health inequities across key health outcomes. As stated in the Health Systems Knowledge Network Report of the CSDH, the health system can act as an important buffer on other social determinants of health inequities. The analysis from this report reaffirms that assertion and highlights the following aspects to consider:
1. In general, improving overall access to health services, through financing arrangements and provision of services, and moving towards universal coverage is likely to reduce socioeconomic inequities for most indicators of health system use and access. Doing so will involve multiple actions at different levels:
a. secure political commitment to social and economic policies that support equity
b. secure increases in government expenditure on the health sector c. reallocate government resources to geographical regions,
populations, levels of the system and forms of health care in response to needs.
2. Monitoring and analysing health indicators and inequities across key stratifiers regularly will be essential to enhancing the visibility of health inequities.
3. The Ministry of Health could take a leadership role in leveraging action through intersectoral approaches both within the health sector across departments, as well as across different government sectors. It will also be important to recognize the role of and involve civil society in improving population health and reducing inequities.
6.6.6.6.5555....2222. . . . Intersectoral action for health Intersectoral action for health Intersectoral action for health Intersectoral action for health
The analysis clearly illustrates the importance of socioeconomic position in determining health inequities in maternal and child health. Therefore, policies designed to address health inequities are likely to succeed only if they tackle the underlying causes such as wealth, education, occupation and other structural factors determining the socioeconomic position of an individual in a country. Intersectoral action for health spearheaded by the Ministries of Health with other key sectors such as finance, education, planning, public works, and labour will be key in effectively tackling health inequities. The critical question is how? Some ideas for next steps could be to:
1. Develop strategies that allow other government sectors to recognize health equity as a social indicator and to develop actions and policies to improve this social indicator, not as a function of their contribution to health, but in
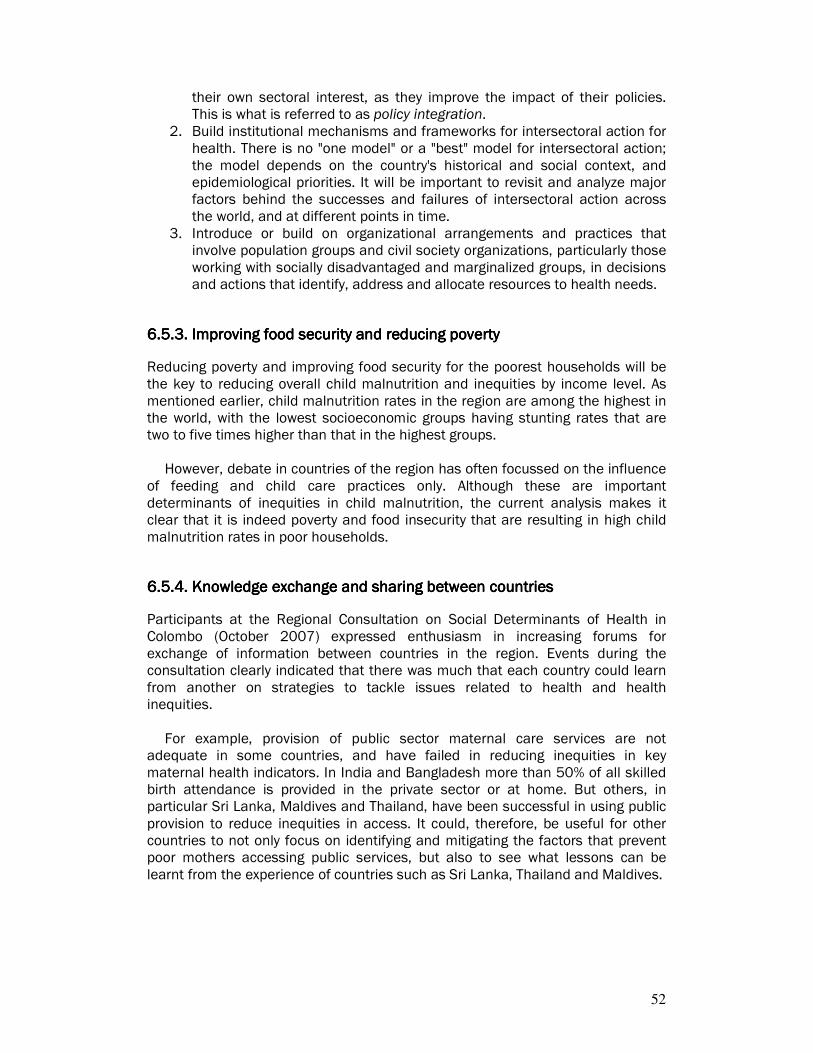
52
their own sectoral interest, as they improve the impact of their policies. This is what is referred to as policy integration.
2. Build institutional mechanisms and frameworks for intersectoral action for health. There is no "one model" or a "best" model for intersectoral action; the model depends on the country's historical and social context, and epidemiological priorities. It will be important to revisit and analyze major factors behind the successes and failures of intersectoral action across the world, and at different points in time.
3. Introduce or build on organizational arrangements and practices that involve population groups and civil society organizations, particularly those working with socially disadvantaged and marginalized groups, in decisions and actions that identify, address and allocate resources to health needs.
6.6.6.6.5555....3333. . . . Improving food security and reducing poverty Improving food security and reducing poverty Improving food security and reducing poverty Improving food security and reducing poverty
Reducing poverty and improving food security for the poorest households will be the key to reducing overall child malnutrition and inequities by income level. As mentioned earlier, child malnutrition rates in the region are among the highest in the world, with the lowest socioeconomic groups having stunting rates that are two to five times higher than that in the highest groups. However, debate in countries of the region has often focussed on the influence of feeding and child care practices only. Although these are important determinants of inequities in child malnutrition, the current analysis makes it clear that it is indeed poverty and food insecurity that are resulting in high child malnutrition rates in poor households.
6.5.4. Knowledge 6.5.4. Knowledge 6.5.4. Knowledge 6.5.4. Knowledge exchange and exchange and exchange and exchange and sharing sharing sharing sharing betweenbetweenbetweenbetween countries countries countries countries
Participants at the Regional Consultation on Social Determinants of Health in Colombo (October 2007) expressed enthusiasm in increasing forums for exchange of information between countries in the region. Events during the consultation clearly indicated that there was much that each country could learn from another on strategies to tackle issues related to health and health inequities.
For example, provision of public sector maternal care services are not adequate in some countries, and have failed in reducing inequities in key maternal health indicators. In India and Bangladesh more than 50% of all skilled birth attendance is provided in the private sector or at home. But others, in particular Sri Lanka, Maldives and Thailand, have been successful in using public provision to reduce inequities in access. It could, therefore, be useful for other countries to not only focus on identifying and mitigating the factors that prevent poor mothers accessing public services, but also to see what lessons can be learnt from the experience of countries such as Sri Lanka, Thailand and Maldives.

53
ANNEX I. TECHNICAL ANNEX I. TECHNICAL ANNEX I. TECHNICAL ANNEX I. TECHNICAL NOTES AND DEFINITIONNOTES AND DEFINITIONNOTES AND DEFINITIONNOTES AND DEFINITIONSSSS
54
((((AAAA) Household wealth index) Household wealth index) Household wealth index) Household wealth index
Given that the Demographic and Health Surveys do not collect data on self-reported income and expenditure, but provide information on ownership of asset indicator variables, this study focused on creating a non-monetary economic index. Principal components analysis (PCA) and dichotomous hierarchical ordered probit (DIHOPIT) model are two statistical methods that may be employed to develop an index of long-run economic status of household. Principal components analysis Principal components analysis is a technique for extracting from a large number of variables those few orthogonal linear combinations of the variables that best capture the common information. Intuitively, the first principal component is the linear index of all the variables that captures the largest amount of information that is common to all of the variables. The result of principal components is an asset index for each household (Aj)
based on the formula:
( )iiji
N
i
ij saafA /*1
−=∑=
where fi is the “scoring factor” for ith asset as determined by the procedure, aji is the jth household’s value for the ith asset and ai and si are the mean and standard deviation of ith asset variable over all households. The crucial assumption - and it is just an assumption - is that household long-
run wealth is what causes the most common variation in asset variables. Scoring factor is the “weight’ assigned to each variable (normalized by its mean and standard deviation) in the linear combination of the variables that constitute the first principal component. Dichotomous hierarchical ordered probit model The method assumes that long-run wealth is not directly observed; i.e. it’s a latent variable. What is observed are so-called indicator variables including a series of assets, housing dwellings and services for each household. This method is based on the premise that wealthier households are more likely to own any given set of indicator variables. However, the level of economic status at which a household becomes more likely to own a given indicator variable is assumed to vary by the indicator variable. As long as the assets are normal goods - in that higher levels of economic status lead to higher proportions of observed ownership - the method can use the information content in a set of indicator variables owned by a given household to estimate an economic status index for that household. This method also allows for using socio-demographic predictors of economic status - such as household head’s education, age and sex; and rural/urban residence - to be incorporated in the estimation process.
55
((((BBBB) Measures of inequality in health) Measures of inequality in health) Measures of inequality in health) Measures of inequality in health
BBBB.1. The range.1. The range.1. The range.1. The range
Range measures including rate ratios (RR) and rate differences (RD) and are the most frequently used in the literature of health inequality. These measures compare the range in rates of illness/mortality between
the least healthy and the healthiest groups or between the lowest and the highest socioeconomic groups. While the RR is unitless, independent of average level and scale, the RD depends on both average level and scale. A conceptually similar approach is apparent in some measures of
socioeconomic inequalities in health distribution. If individuals are ranked according to their income, then for each decile or quintile of individuals, their health status can be estimated. The ratio of the health status of the lowest income quintile to the highest income quintile, a variation on the RR is called low to high ratio. The defects of range measures are obvious. First, they don’t address the
entire social gradient in health, that is, they fail to measure the extent of inequality across the entire socioeconomic spectrum. The gap between the top and the bottom groups may, for example, remain unchanged, but the extent of inequality between the intermediate groups may be reducing (or increasing). Second, they overlook the sizes of the groups being compared. This problem can cause misleading results when comparisons are performed overtime or across countries. Yet they have the merit of being a readily interpretable and usable measure of the relative gap in health between the poor and the rich.
BBBB....2222. . . . Gini coefficient (and associated Lorenz curve)Gini coefficient (and associated Lorenz curve)Gini coefficient (and associated Lorenz curve)Gini coefficient (and associated Lorenz curve)
The Lorenz curve plots the cumulative percentage of a health variable against the cumulative percentage of the sample, ranked by their health, starting with the sickest person and ending with the healthiest. If health is equally distributed, the Lorenz curve coincides with the diagonal. Otherwise it lies under the diagonal. The further the curve is from the diagonal, the greater the degree of inequality. The Gini coefficient is defined with reference to the Lorenz curve. The Gini
coefficient, denoted by G, is defined as twice the area between the Lorenz curve and the diagonal. It ranges from 0 (when there is no inequality) to 1 (when all the population’s health is concentrated in the hands of one person). The Lorenz curve has the merit of reflecting the experiences of all people
and not just those in top and bottom groups. In addition, since it does not involve stratifying the population by social class, it allows one to side-step all the problems associated with classifying people by social class including the problem of changing class sizes.
56
But there is still a big problem that is this measure doesn’t address “To what extent are there health inequalities that are systematically related to socioeconomic status?” Any change in the distribution of health which keeps the mean level of health the same but involves a sick person getting healthier and a health person getting sicker reduces health inequality irrespective of the socioeconomic status of the persons concerned. Whether this insensitivity of the Lorenz curve to the socioeconomic dimension of health inequalities is a defect depends clearly on the question one is looking for. It clearly is a defect if one takes the view that what is interesting and indeed worrying about health inequalities is not that they exist, but that they mirror inequalities in socioeconomic status.
BBBB....3333. . . . Index of dissimilarityIndex of dissimilarityIndex of dissimilarityIndex of dissimilarity
Suppose there are j=1,…,J socioeconomic groups. Then the index of dissimilarity (ID) is:
∑ −=j jpjh SSID
2
1
where Sjh is the jth group’s share of the population’s health and Sjp is the jth group’s population share. It can be interpreted as follows: the percentage of all cases (e.g. ill
individuals or deaths) that has to be redistributed to obtain the morbidity or mortality rate for all socioeconomic groups. The ID is larger if the groups with the highest and the lowest rates are larger. The index of dissimilarity suffers from the same shortcoming as the pseudo-
Lorenz curve. It is insensitive to the socioeconomic dimension of inequalities in health. What matters in the ID is simply how each socioeconomic group’s share of the population’s health compares with its population share, not how this disparity compares with the socioeconomic group’s socioeconomic status.
BBBB....4444.... Population attributable riskPopulation attributable riskPopulation attributable riskPopulation attributable risk
Although population attributable risk (PAR) is part of the repertoire of epidemiology, its application to the study of health inequalities is fairly recent. This measure can be interpreted as the proportional reduction in overall morbidity or mortality rates that would occur in the hypothetical case that everyone experiences the rates of the highest socioeconomic group, expressed as the percentage of the overall rate. The PAR not only reflects the morbidity or mortality rates of lower socioeconomic groups (as compared to highest socioeconomic group) but also their population size: the larger the groups with the high rates, the larger the potential reduction in overall rate is.
57
BBBB....5555.... Slope and relative index of inequality Slope and relative index of inequality Slope and relative index of inequality Slope and relative index of inequality
Unlike the Lorenz curve, and the ID, the slope index of inequality (SII) and its relative version - the relative index of inequality (RII) - do reflect the socioeconomic dimension to health inequalities. The approach involves calculating the mean health status of each socioeconomic group and then ranking groups by their socioeconomic status (not by their health). The slope index of inequality is calculated as the slope of the weighted least
squares (WLS) regression line showing the relationship between health status and the rank ordering, Rj, of the groups in the socioeconomic hierarchy. It can be interpreted as the absolute effect on health of moving from the lowest socioeconomic group through to the highest. The SII avoids the defect of the range measures: it reflects the experiences
of the entire population and it is sensitive to the distribution of the population across socioeconomic groups. Moreover, because it ranks socioeconomic groups by socioeconomic status rather than by health, the SII reflects the socioeconomic dimension to inequalities in health. One additional noteworthy feature of the SII is its sensitivity to the mean
health status of the population. Suppose that everyone’s health doubled, the SII would double. Whether inequity has doubled is a moot point: relative differences have remained the same, but absolute differences have widened. If it is the former that are regarded as important, the SII might be divided by the mean level of health, in which case a doubling of everyone’s health would leave the resultant index unaffected. This is referred to as relative index of inequality.
BBBB....6666.... Concentration index and the concentration curve Concentration index and the concentration curve Concentration index and the concentration curve Concentration index and the concentration curve
The concentration curve plots the cumulative percentage of the health variable against the cumulative percentage of the sample, ranked by their socioeconomic status, beginning with the most disadvantaged, and ending with the least disadvantaged. The concentration index is defined with reference to the concentration
curve. The health concentration index, denoted by C, is defined as twice the area between the concentration curve and the line of equality. So, in the case where there is no socioeconomic inequality, the concentration index is zero. The value of the concentration index can vary between –1 and +1. Its negative values imply that a variable is concentrated among disadvantaged people while the opposite is true for its positive values. When there is no equality, the concentration index will be zero. If the health variable is "bad", such as infant death, a negative value of the concentration index means it is higher among the most disadvantaged. The concentration index is a measure of relative inequality, so that a
doubling of everyone's health leaves the concentration index unchanged
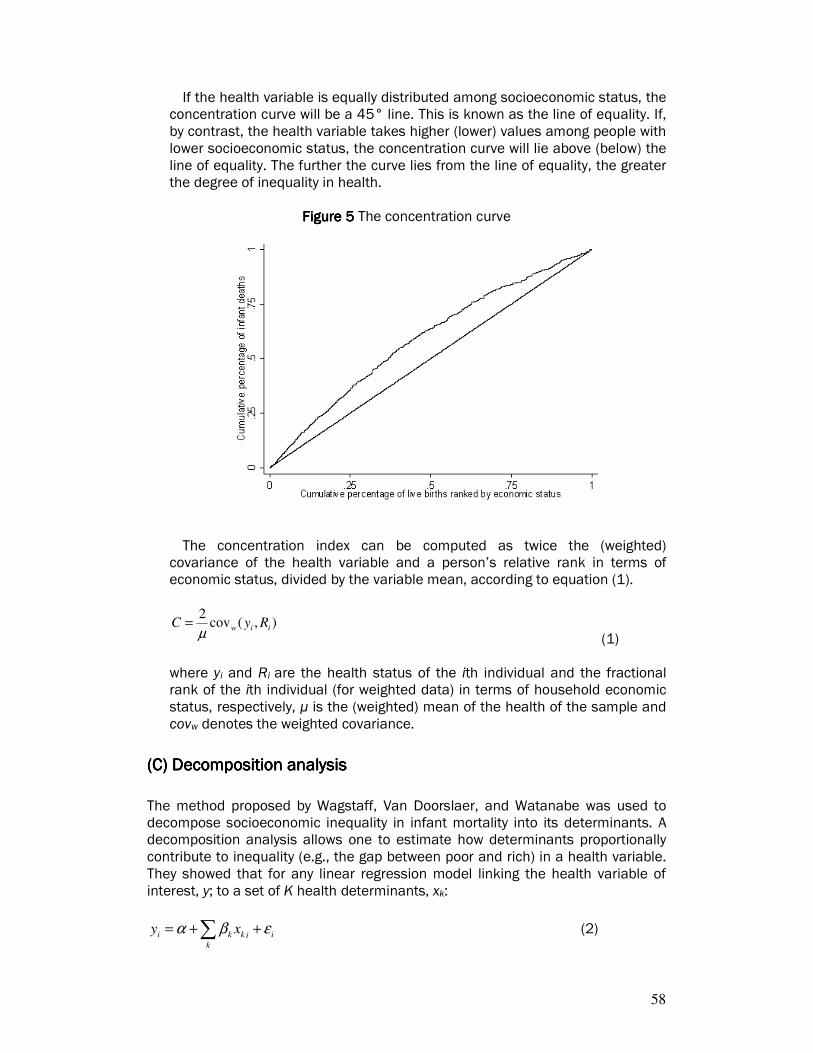
58
If the health variable is equally distributed among socioeconomic status, the concentration curve will be a 45° line. This is known as the line of equality. If, by contrast, the health variable takes higher (lower) values among people with lower socioeconomic status, the concentration curve will lie above (below) the line of equality. The further the curve lies from the line of equality, the greater the degree of inequality in health.
Figure Figure Figure Figure 5555 The concentration curve
The concentration index can be computed as twice the (weighted)
covariance of the health variable and a person’s relative rank in terms of economic status, divided by the variable mean, according to equation (1).
),(cov2
iiw RyCµ
= (1)
where yi and Ri are the health status of the ith individual and the fractional rank of the ith individual (for weighted data) in terms of household economic status, respectively, µ is the (weighted) mean of the health of the sample and covw denotes the weighted covariance.
((((CCCC) Decomposition analysis) Decomposition analysis) Decomposition analysis) Decomposition analysis
The method proposed by Wagstaff, Van Doorslaer, and Watanabe was used to decompose socioeconomic inequality in infant mortality into its determinants. A decomposition analysis allows one to estimate how determinants proportionally contribute to inequality (e.g., the gap between poor and rich) in a health variable. They showed that for any linear regression model linking the health variable of interest, y; to a set of K health determinants, xk:
i
kikki xy εβα ++= ∑ (2)
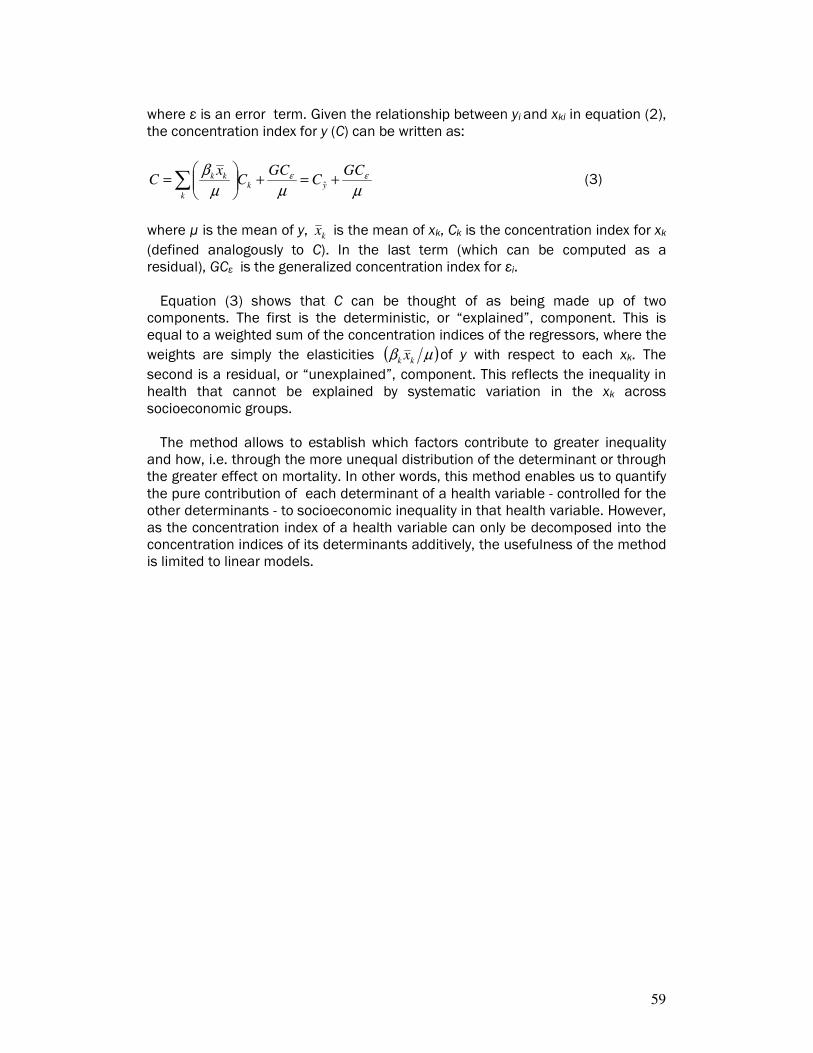
59
where ε is an error term. Given the relationship between yi and xki in equation (2), the concentration index for y (C) can be written as:
µµµ
β εε GCC
GCC
xC y
k
kkk +=+
=∑ ˆ (3)
where µ is the mean of y, kx is the mean of xk, Ck is the concentration index for xk
(defined analogously to C). In the last term (which can be computed as a residual), GCε is the generalized concentration index for εi. Equation (3) shows that C can be thought of as being made up of two
components. The first is the deterministic, or “explained”, component. This is equal to a weighted sum of the concentration indices of the regressors, where the
weights are simply the elasticities ( )µβ kk x of y with respect to each xk. The
second is a residual, or “unexplained”, component. This reflects the inequality in health that cannot be explained by systematic variation in the xk across socioeconomic groups. The method allows to establish which factors contribute to greater inequality
and how, i.e. through the more unequal distribution of the determinant or through the greater effect on mortality. In other words, this method enables us to quantify the pure contribution of each determinant of a health variable - controlled for the other determinants - to socioeconomic inequality in that health variable. However, as the concentration index of a health variable can only be decomposed into the concentration indices of its determinants additively, the usefulness of the method is limited to linear models.

60
ANNEX II. COUNTRY REANNEX II. COUNTRY REANNEX II. COUNTRY REANNEX II. COUNTRY REPORTSPORTSPORTSPORTS

61
BangladeshBangladeshBangladeshBangladesh
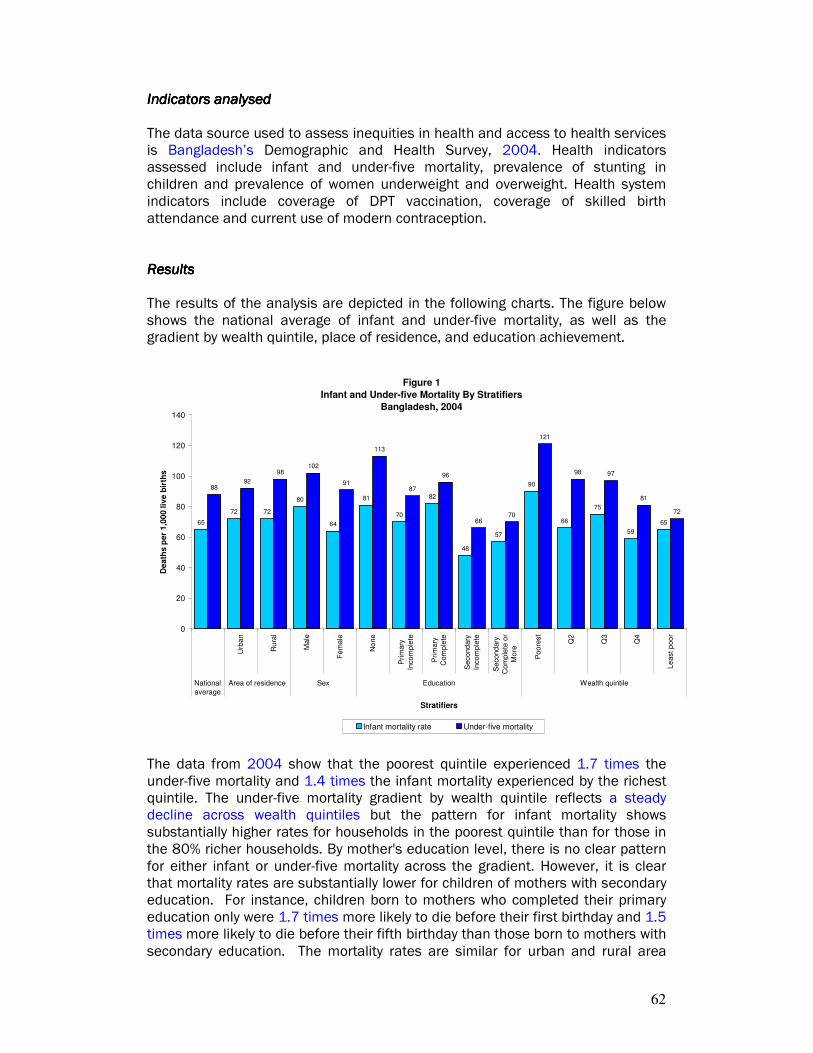
62
Indicators analysedIndicators analysedIndicators analysedIndicators analysed The data source used to assess inequities in health and access to health services is Bangladesh’s Demographic and Health Survey, 2004. Health indicators assessed include infant and under-five mortality, prevalence of stunting in children and prevalence of women underweight and overweight. Health system indicators include coverage of DPT vaccination, coverage of skilled birth attendance and current use of modern contraception. ResultsResultsResultsResults The results of the analysis are depicted in the following charts. The figure below shows the national average of infant and under-five mortality, as well as the gradient by wealth quintile, place of residence, and education achievement.
Figure 1
Infant and Under-five Mortality By Stratifiers
Bangladesh, 2004
65
72 72
80
64
81
70
82
48
57
90
66
75
59
65
8892
98102
91
113
87
96
6670
121
98 97
81
72
0
20
40
60
80
100
120
140
Urb
an
Ru
ral
Male
Fe
male
No
ne
Pri
mary
Incom
ple
te
Prim
ary
Com
ple
te
Se
cond
ary
Incom
ple
te
Se
cond
ary
Com
ple
te o
r
Mo
re
Poo
rest
Q2
Q3
Q4
Le
ast p
oo
r
National
average
Area of residence Sex Education Wealth quintile
Stratifiers
De
ath
s p
er
1,0
00 l
ive
bir
ths
Infant mortality rate Under-five mortality
The data from 2004 show that the poorest quintile experienced 1.7 times the under-five mortality and 1.4 times the infant mortality experienced by the richest quintile. The under-five mortality gradient by wealth quintile reflects a steady decline across wealth quintiles but the pattern for infant mortality shows substantially higher rates for households in the poorest quintile than for those in the 80% richer households. By mother's education level, there is no clear pattern for either infant or under-five mortality across the gradient. However, it is clear that mortality rates are substantially lower for children of mothers with secondary education. For instance, children born to mothers who completed their primary education only were 1.7 times more likely to die before their first birthday and 1.5 times more likely to die before their fifth birthday than those born to mothers with secondary education. The mortality rates are similar for urban and rural area
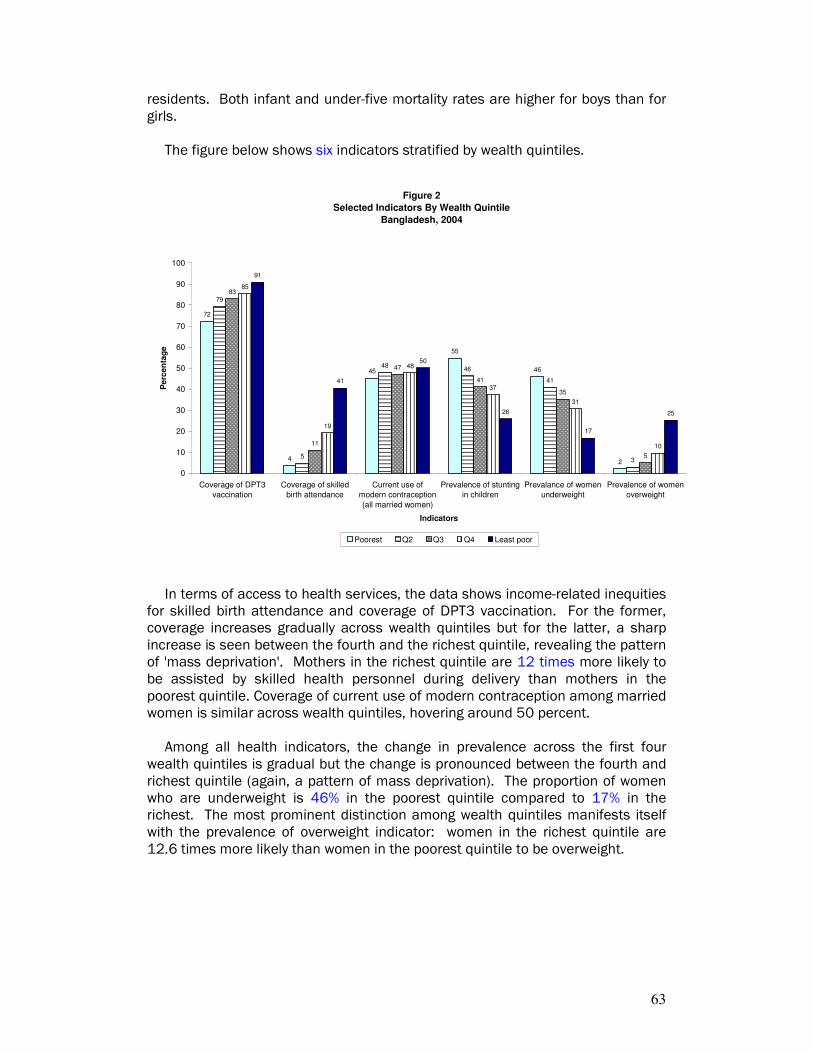
63
residents. Both infant and under-five mortality rates are higher for boys than for girls.
The figure below shows six indicators stratified by wealth quintiles.
Figure 2
Selected Indicators By Wealth Quintile
Bangladesh, 2004
72
4
45
55
46
2
79
5
4846
41
3
83
11
47
41
35
5
85
19
48
37
31
10
91
41
50
26
17
25
0
10
20
30
40
50
60
70
80
90
100
Coverage of DPT3
vaccination
Coverage of skilled
birth attendance
Current use of
modern contraception
(all married women)
Prevalence of stunting
in children
Prevalance of women
underweight
Prevalence of women
overweight
Indicators
Pe
rce
nta
ge
Poorest Q2 Q3 Q4 Least poor
In terms of access to health services, the data shows income-related inequities for skilled birth attendance and coverage of DPT3 vaccination. For the former, coverage increases gradually across wealth quintiles but for the latter, a sharp increase is seen between the fourth and the richest quintile, revealing the pattern of 'mass deprivation'. Mothers in the richest quintile are 12 times more likely to be assisted by skilled health personnel during delivery than mothers in the poorest quintile. Coverage of current use of modern contraception among married women is similar across wealth quintiles, hovering around 50 percent.
Among all health indicators, the change in prevalence across the first four wealth quintiles is gradual but the change is pronounced between the fourth and richest quintile (again, a pattern of mass deprivation). The proportion of women who are underweight is 46% in the poorest quintile compared to 17% in the richest. The most prominent distinction among wealth quintiles manifests itself with the prevalence of overweight indicator: women in the richest quintile are 12.6 times more likely than women in the poorest quintile to be overweight.
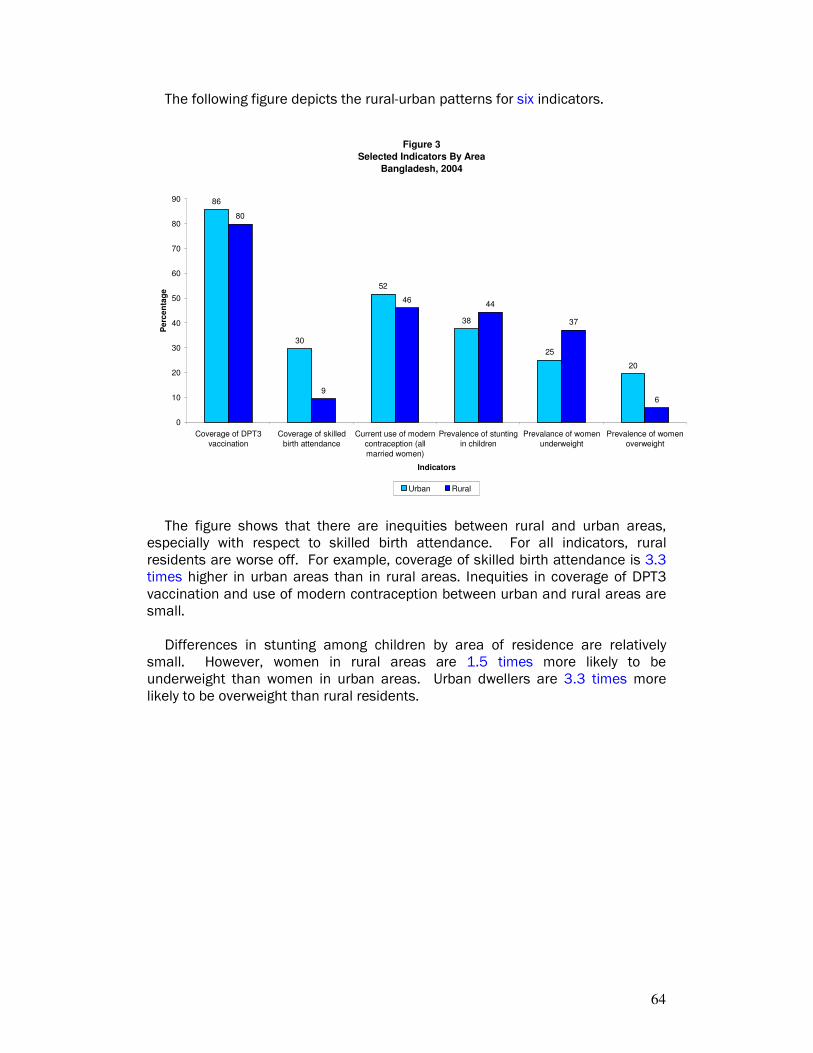
64
The following figure depicts the rural-urban patterns for six indicators.
Figure 3
Selected Indicators By Area
Bangladesh, 2004
86
30
52
38
25
20
80
9
4644
37
6
0
10
20
30
40
50
60
70
80
90
Coverage of DPT3
vaccination
Coverage of skilled
birth attendance
Current use of modern
contraception (all
married women)
Prevalence of stunting
in children
Prevalance of women
underweight
Prevalence of women
overweight
Indicators
Pe
rce
nta
ge
Urban Rural
The figure shows that there are inequities between rural and urban areas, especially with respect to skilled birth attendance. For all indicators, rural residents are worse off. For example, coverage of skilled birth attendance is 3.3 times higher in urban areas than in rural areas. Inequities in coverage of DPT3 vaccination and use of modern contraception between urban and rural areas are small.
Differences in stunting among children by area of residence are relatively small. However, women in rural areas are 1.5 times more likely to be underweight than women in urban areas. Urban dwellers are 3.3 times more likely to be overweight than rural residents.
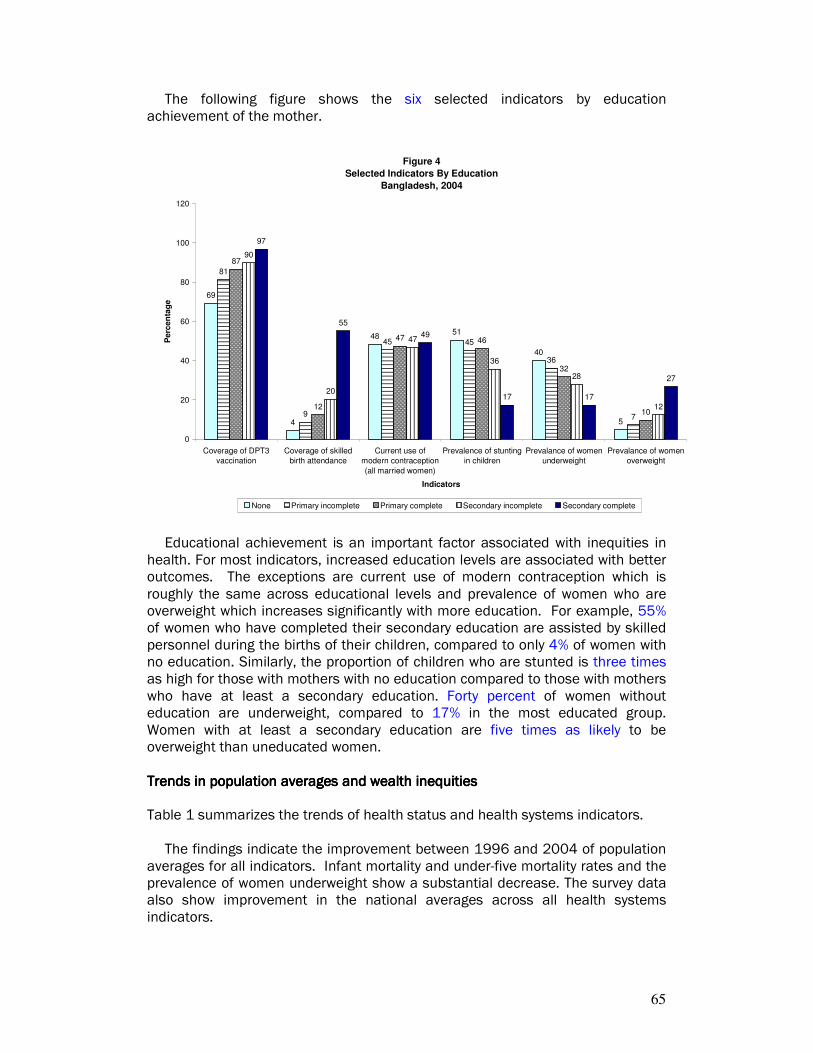
65
The following figure shows the six selected indicators by education achievement of the mother.
Figure 4
Selected Indicators By Education
Bangladesh, 2004
69
4
4851
40
5
81
9
45 45
36
7
87
12
47 46
32
10
90
20
47
36
28
12
97
55
49
17 17
27
0
20
40
60
80
100
120
Coverage of DPT3
vaccination
Coverage of skilled
birth attendance
Current use of
modern contraception
(all married women)
Prevalence of stunting
in children
Prevalance of women
underweight
Prevalance of women
overweight
Indicators
Pe
rce
nta
ge
None Primary incomplete Primary complete Secondary incomplete Secondary complete
Educational achievement is an important factor associated with inequities in health. For most indicators, increased education levels are associated with better outcomes. The exceptions are current use of modern contraception which is roughly the same across educational levels and prevalence of women who are overweight which increases significantly with more education. For example, 55% of women who have completed their secondary education are assisted by skilled personnel during the births of their children, compared to only 4% of women with no education. Similarly, the proportion of children who are stunted is three times as high for those with mothers with no education compared to those with mothers who have at least a secondary education. Forty percent of women without education are underweight, compared to 17% in the most educated group. Women with at least a secondary education are five times as likely to be overweight than uneducated women.
Trends in population averages and wealth Trends in population averages and wealth Trends in population averages and wealth Trends in population averages and wealth inequitiesinequitiesinequitiesinequities Table 1 summarizes the trends of health status and health systems indicators.
The findings indicate the improvement between 1996 and 2004 of population averages for all indicators. Infant mortality and under-five mortality rates and the prevalence of women underweight show a substantial decrease. The survey data also show improvement in the national averages across all health systems indicators.

66
Table 1 - Trends in population averages and household wealth inequities for selected health and health care indicators
Population average Ratio*
Indicator 1996-1997
1999-2000
2004 1996-1997
1999-2000
2004
Health indicatorsHealth indicatorsHealth indicatorsHealth indicators
Infant mortality rate 89.6 79.6 65.0 1.7 1.6 1.4
Under-five mortality rate 127.8 110.0 88.0 1.9 1.9 1.7
Stunting in under-five children 54.6 44.7 43.0 1.8 2.1
Prevalence of underweight in women 52.0 45.4 34.3 2.0 2.8
Health systemsHealth systemsHealth systemsHealth systems
DPT3 coverage 69.3
72.1 81.0
1.4 1.4 1.3
Delivery by skilled birth attendants
8.0 12.1 13.4 16.6 12.0 11.9
Contraceptive prevalence rate (all married women)
41.6 43.4 47.3 1.3 1.3 1.1
* Poorest to richest ratio is used for infant mortality rate, under-five mortality rate, stunting
in under-five children and prevalence of underweight in women, while richest to poorest ratio is used for DPT3 coverage, delivery by skilled birth attendants and contraceptive prevalence rate. This provides a consistent way to interpret ratios, as health outcomes indicators are expressed in negative terms (e.g., lower infant mortality is better), whereas health system process indicators are expressed in positive terms (e.g., higher DPT3 coverage is better).
However, the different indicators present different patterns in terms of inequity trends over the 8-year time period. The relative gap in stunting in under-five children shows a slight increase in inequity, whereas prevalence of women underweight shows a marked increase. All health systems indicators exhibit a reduction in inequity. Table 2 summarizes trends in both population averages and relative gaps, and
whether each is improving or worsening. Four cells, A-D, provide a framework to interpret the results over time, as inputs to health policies (6).
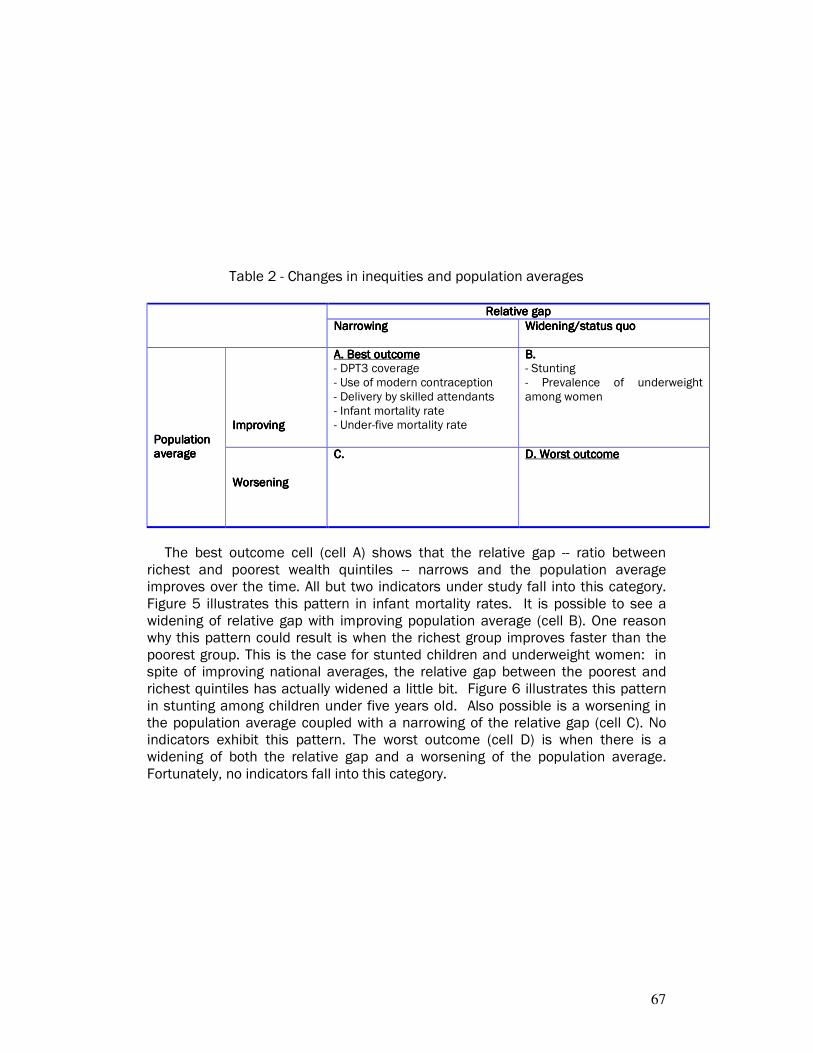
67
Table 2 - Changes in inequities and population averages
Relative gapRelative gapRelative gapRelative gap
NarrowingNarrowingNarrowingNarrowing Widening/status quoWidening/status quoWidening/status quoWidening/status quo
ImprovingImprovingImprovingImproving
A. Best outcomeA. Best outcomeA. Best outcomeA. Best outcome - DPT3 coverage - Use of modern contraception - Delivery by skilled attendants - Infant mortality rate - Under-five mortality rate
B. B. B. B. - Stunting - Prevalence of underweight among women
Population Population Population Population averageaverageaverageaverage
WorseningWorseningWorseningWorsening
C.C.C.C.
D. Worst outcomeD. Worst outcomeD. Worst outcomeD. Worst outcome
The best outcome cell (cell A) shows that the relative gap -- ratio between
richest and poorest wealth quintiles -- narrows and the population average improves over the time. All but two indicators under study fall into this category. Figure 5 illustrates this pattern in infant mortality rates. It is possible to see a widening of relative gap with improving population average (cell B). One reason why this pattern could result is when the richest group improves faster than the poorest group. This is the case for stunted children and underweight women: in spite of improving national averages, the relative gap between the poorest and richest quintiles has actually widened a little bit. Figure 6 illustrates this pattern in stunting among children under five years old. Also possible is a worsening in the population average coupled with a narrowing of the relative gap (cell C). No indicators exhibit this pattern. The worst outcome (cell D) is when there is a widening of both the relative gap and a worsening of the population average. Fortunately, no indicators fall into this category.
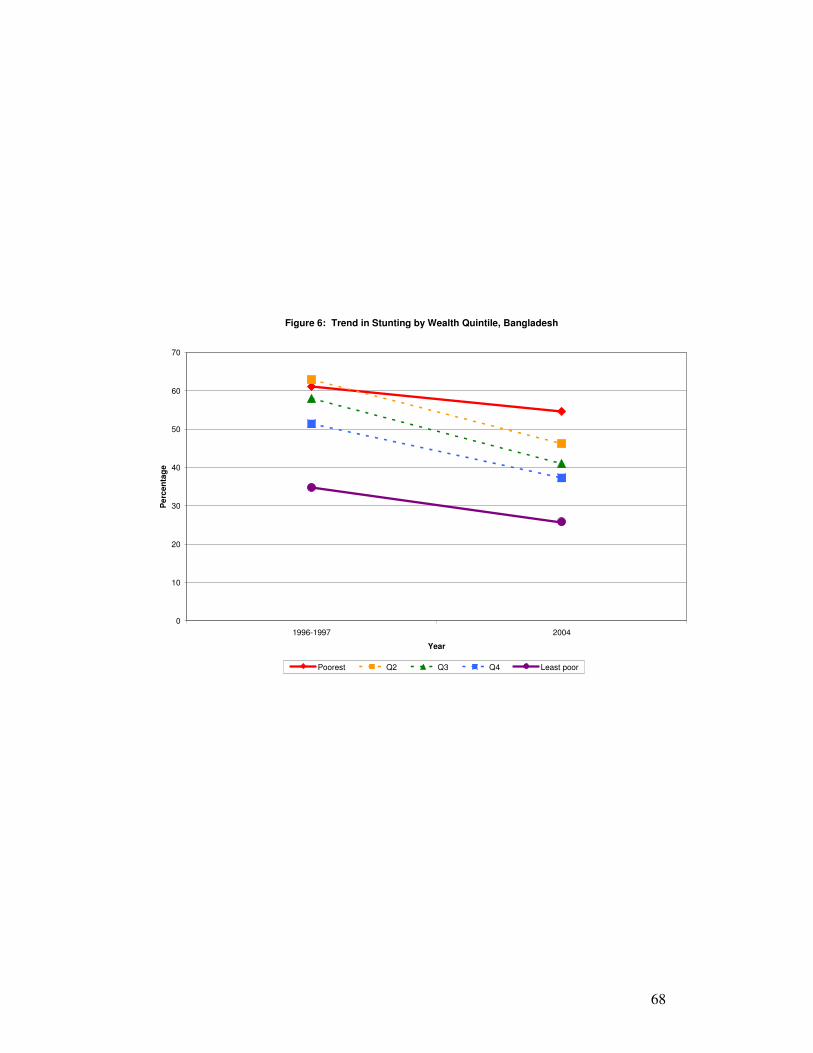
68
Figure 6: Trend in Stunting by Wealth Quintile, Bangladesh
0
10
20
30
40
50
60
70
1996-1997 2004
Year
Pe
rce
nta
ge
Poorest Q2 Q3 Q4 Least poor
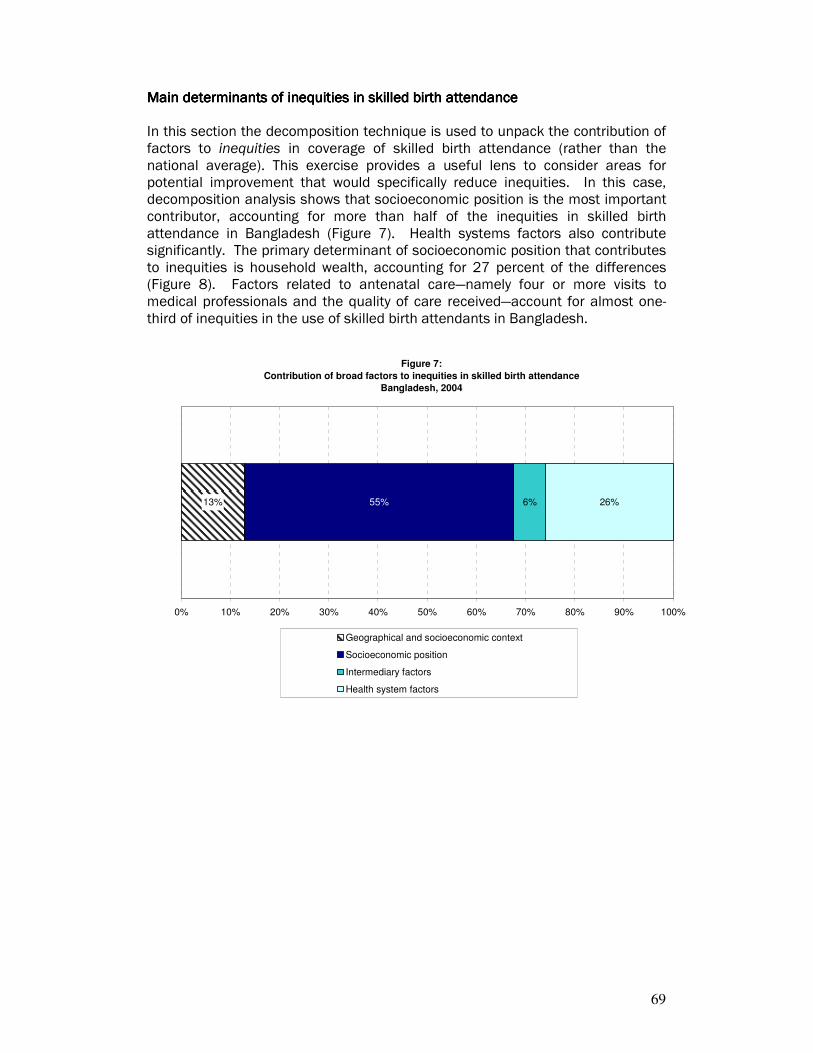
69
Main determinants of inequities in skilled birth attendanceMain determinants of inequities in skilled birth attendanceMain determinants of inequities in skilled birth attendanceMain determinants of inequities in skilled birth attendance In this section the decomposition technique is used to unpack the contribution of factors to inequities in coverage of skilled birth attendance (rather than the national average). This exercise provides a useful lens to consider areas for potential improvement that would specifically reduce inequities. In this case, decomposition analysis shows that socioeconomic position is the most important contributor, accounting for more than half of the inequities in skilled birth attendance in Bangladesh (Figure 7). Health systems factors also contribute significantly. The primary determinant of socioeconomic position that contributes to inequities is household wealth, accounting for 27 percent of the differences (Figure 8). Factors related to antenatal care—namely four or more visits to medical professionals and the quality of care received—account for almost one-third of inequities in the use of skilled birth attendants in Bangladesh.
Figure 7:
Contribution of broad factors to inequities in skilled birth attendance
Bangladesh, 2004
13% 6% 26%55%
0% 10% 20% 30% 40% 50% 60% 70% 80% 90% 100%
Geographical and socioeconomic context
Socioeconomic position
Intermediary factors
Health system factors
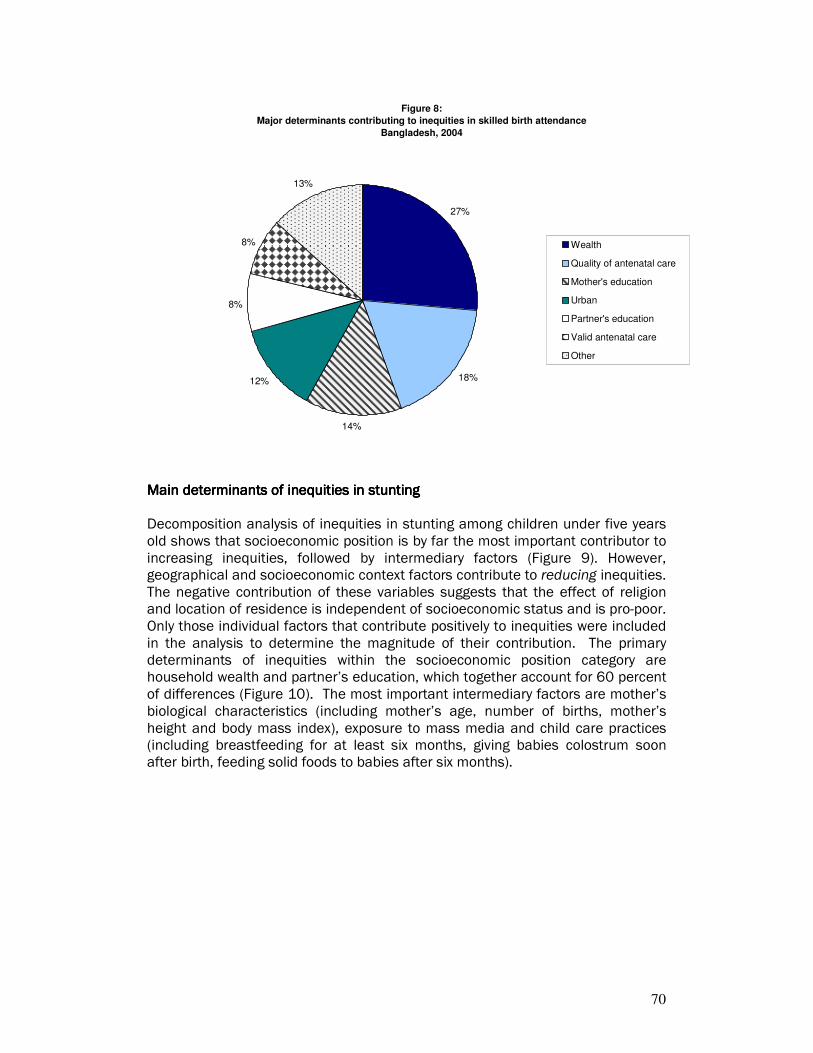
70
Figure 8:
Major determinants contributing to inequities in skilled birth attendance
Bangladesh, 2004
27%
18%
14%
12%
8%
8%
13%
Wealth
Quality of antenatal care
Mother's education
Urban
Partner's education
Valid antenatal care
Other
Main determinants of inequities in stuntingMain determinants of inequities in stuntingMain determinants of inequities in stuntingMain determinants of inequities in stunting Decomposition analysis of inequities in stunting among children under five years old shows that socioeconomic position is by far the most important contributor to increasing inequities, followed by intermediary factors (Figure 9). However, geographical and socioeconomic context factors contribute to reducing inequities. The negative contribution of these variables suggests that the effect of religion and location of residence is independent of socioeconomic status and is pro-poor. Only those individual factors that contribute positively to inequities were included in the analysis to determine the magnitude of their contribution. The primary determinants of inequities within the socioeconomic position category are household wealth and partner’s education, which together account for 60 percent of differences (Figure 10). The most important intermediary factors are mother’s biological characteristics (including mother’s age, number of births, mother’s height and body mass index), exposure to mass media and child care practices (including breastfeeding for at least six months, giving babies colostrum soon after birth, feeding solid foods to babies after six months).
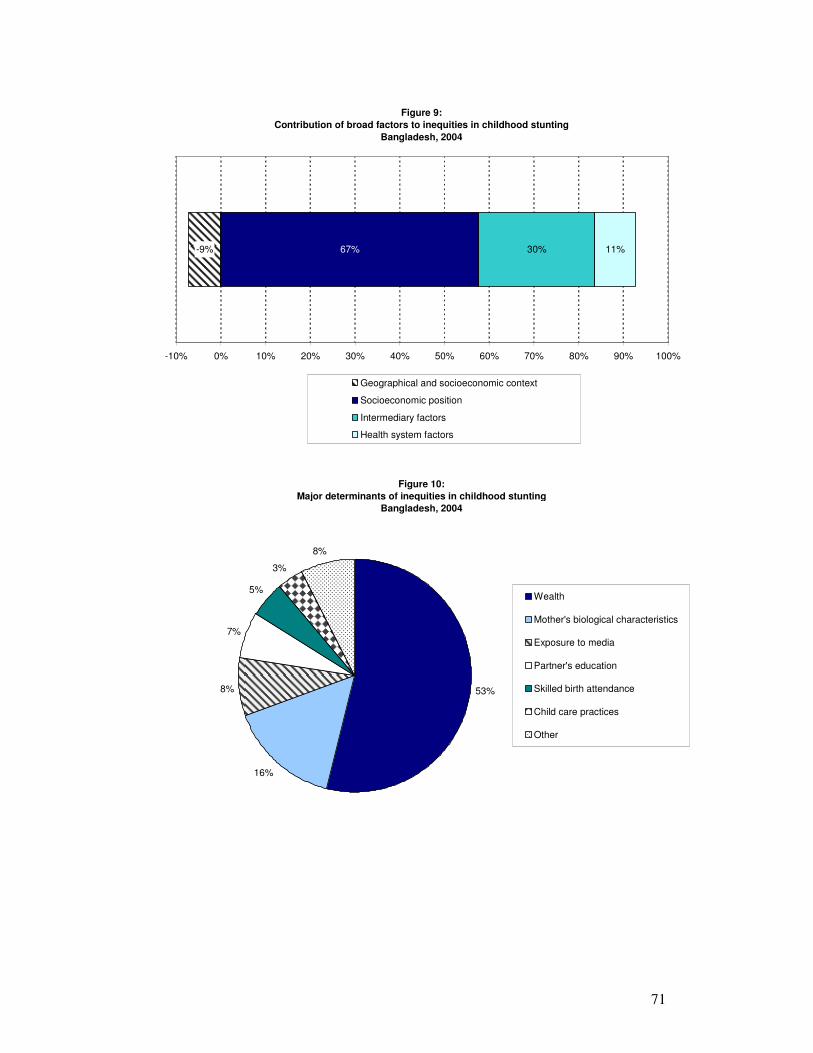
71
Figure 9:
Contribution of broad factors to inequities in childhood stunting
Bangladesh, 2004
-9% 67% 30% 11%
-10% 0% 10% 20% 30% 40% 50% 60% 70% 80% 90% 100%
Geographical and socioeconomic context
Socioeconomic position
Intermediary factors
Health system factors
Figure 10:
Major determinants of inequities in childhood stunting
Bangladesh, 2004
53%
16%
8%
7%
5%
3%
8%
Wealth
Mother's biological characteristics
Exposure to media
Partner's education
Skilled birth attendance
Child care practices
Other

72
IndiaIndiaIndiaIndia
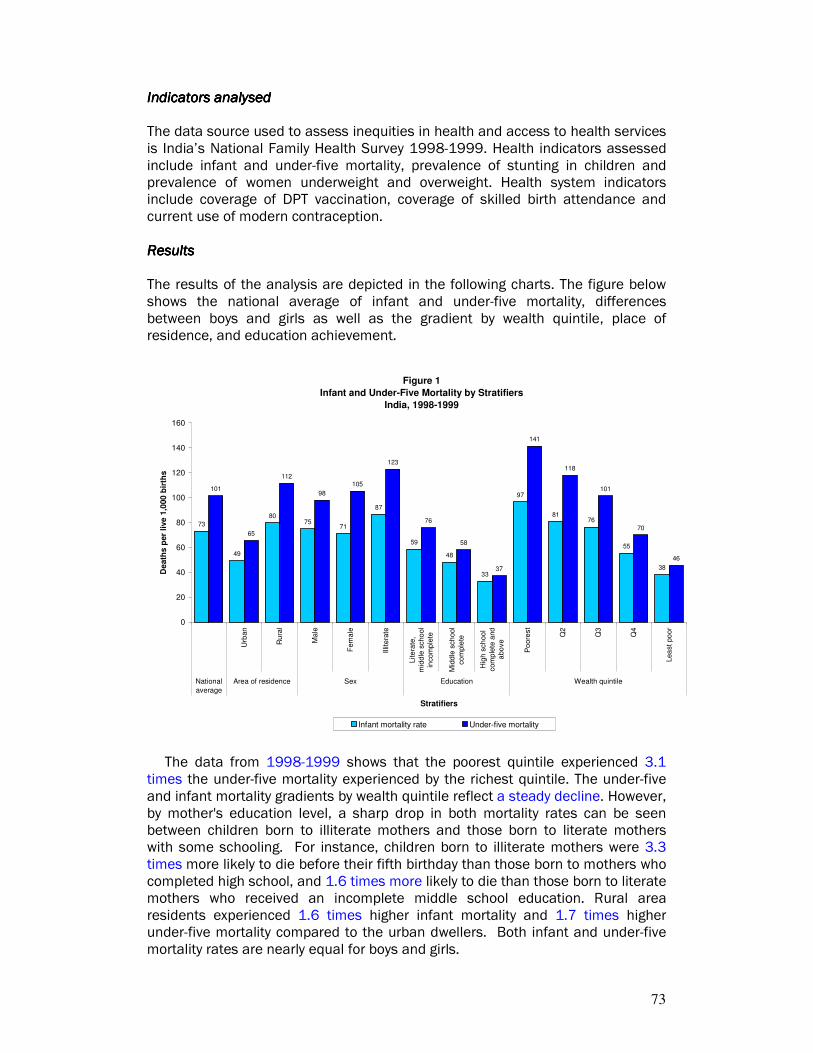
73
IndIndIndIndicators analysedicators analysedicators analysedicators analysed The data source used to assess inequities in health and access to health services is India’s National Family Health Survey 1998-1999. Health indicators assessed include infant and under-five mortality, prevalence of stunting in children and prevalence of women underweight and overweight. Health system indicators include coverage of DPT vaccination, coverage of skilled birth attendance and current use of modern contraception. ResultsResultsResultsResults The results of the analysis are depicted in the following charts. The figure below shows the national average of infant and under-five mortality, differences between boys and girls as well as the gradient by wealth quintile, place of residence, and education achievement.
Figure 1
Infant and Under-Five Mortality by Stratifiers
India, 1998-1999
73
49
8075
71
87
59
48
33
97
8176
55
38
101
65
112
98
105
123
76
58
37
141
118
101
70
46
0
20
40
60
80
100
120
140
160
Urb
an
Ru
ral
Ma
le
Fem
ale
Illit
era
te
Lite
rate
,
mid
dle
scho
ol
incom
ple
te
Mid
dle
sch
ool
co
mple
te
Hig
h s
ch
oo
l
com
ple
te a
nd
abo
ve
Po
ore
st
Q2
Q3
Q4
Lea
st po
or
National
average
Area of residence Sex Education Wealth quintile
Stratifiers
De
ath
s p
er
live
1,0
00
bir
ths
Infant mortality rate Under-five mortality
The data from 1998-1999 shows that the poorest quintile experienced 3.1 times the under-five mortality experienced by the richest quintile. The under-five and infant mortality gradients by wealth quintile reflect a steady decline. However, by mother's education level, a sharp drop in both mortality rates can be seen between children born to illiterate mothers and those born to literate mothers with some schooling. For instance, children born to illiterate mothers were 3.3 times more likely to die before their fifth birthday than those born to mothers who completed high school, and 1.6 times more likely to die than those born to literate mothers who received an incomplete middle school education. Rural area residents experienced 1.6 times higher infant mortality and 1.7 times higher under-five mortality compared to the urban dwellers. Both infant and under-five mortality rates are nearly equal for boys and girls.
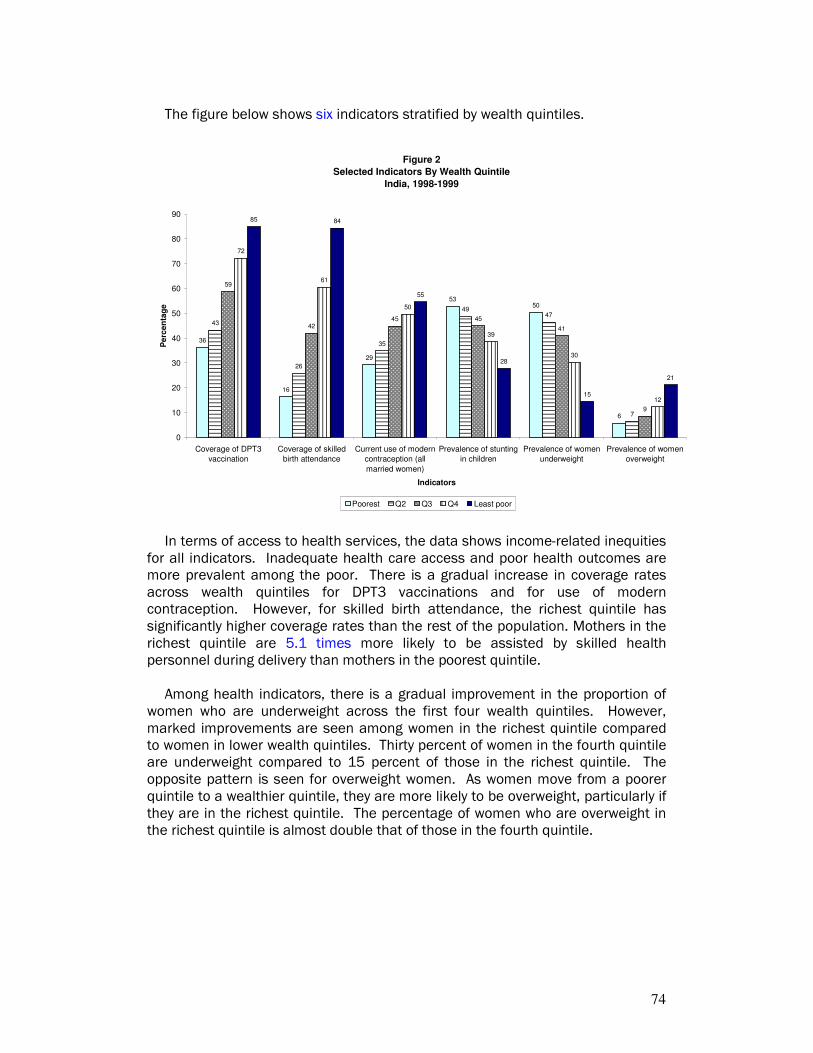
74
The figure below shows six indicators stratified by wealth quintiles.
Figure 2
Selected Indicators By Wealth Quintile
India, 1998-1999
36
16
29
5350
6
43
26
35
4947
7
59
4245 45
41
9
72
61
50
39
30
12
85 84
55
28
15
21
0
10
20
30
40
50
60
70
80
90
Coverage of DPT3
vaccination
Coverage of skilled
birth attendance
Current use of modern
contraception (all
married women)
Prevalence of stunting
in children
Prevalence of women
underweight
Prevalence of women
overweight
Indicators
Pe
rce
nta
ge
Poorest Q2 Q3 Q4 Least poor
In terms of access to health services, the data shows income-related inequities for all indicators. Inadequate health care access and poor health outcomes are more prevalent among the poor. There is a gradual increase in coverage rates across wealth quintiles for DPT3 vaccinations and for use of modern contraception. However, for skilled birth attendance, the richest quintile has significantly higher coverage rates than the rest of the population. Mothers in the richest quintile are 5.1 times more likely to be assisted by skilled health personnel during delivery than mothers in the poorest quintile.
Among health indicators, there is a gradual improvement in the proportion of women who are underweight across the first four wealth quintiles. However, marked improvements are seen among women in the richest quintile compared to women in lower wealth quintiles. Thirty percent of women in the fourth quintile are underweight compared to 15 percent of those in the richest quintile. The opposite pattern is seen for overweight women. As women move from a poorer quintile to a wealthier quintile, they are more likely to be overweight, particularly if they are in the richest quintile. The percentage of women who are overweight in the richest quintile is almost double that of those in the fourth quintile.
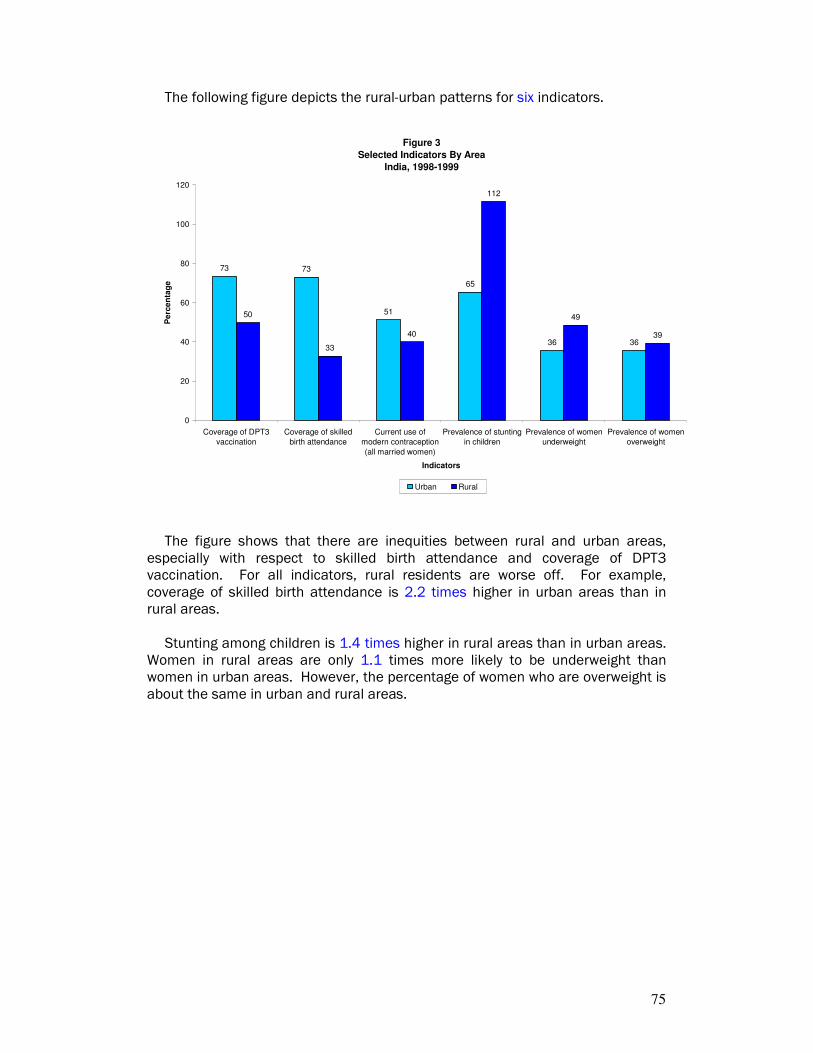
75
The following figure depicts the rural-urban patterns for six indicators.
Figure 3
Selected Indicators By Area
India, 1998-1999
73 73
51
65
36 36
50
33
40
112
49
39
0
20
40
60
80
100
120
Coverage of DPT3
vaccination
Coverage of skilled
birth attendance
Current use of
modern contraception
(all married women)
Prevalence of stunting
in children
Prevalence of women
underweight
Prevalence of women
overweight
Indicators
Pe
rce
nta
ge
Urban Rural
The figure shows that there are inequities between rural and urban areas,
especially with respect to skilled birth attendance and coverage of DPT3 vaccination. For all indicators, rural residents are worse off. For example, coverage of skilled birth attendance is 2.2 times higher in urban areas than in rural areas.
Stunting among children is 1.4 times higher in rural areas than in urban areas. Women in rural areas are only 1.1 times more likely to be underweight than women in urban areas. However, the percentage of women who are overweight is about the same in urban and rural areas.
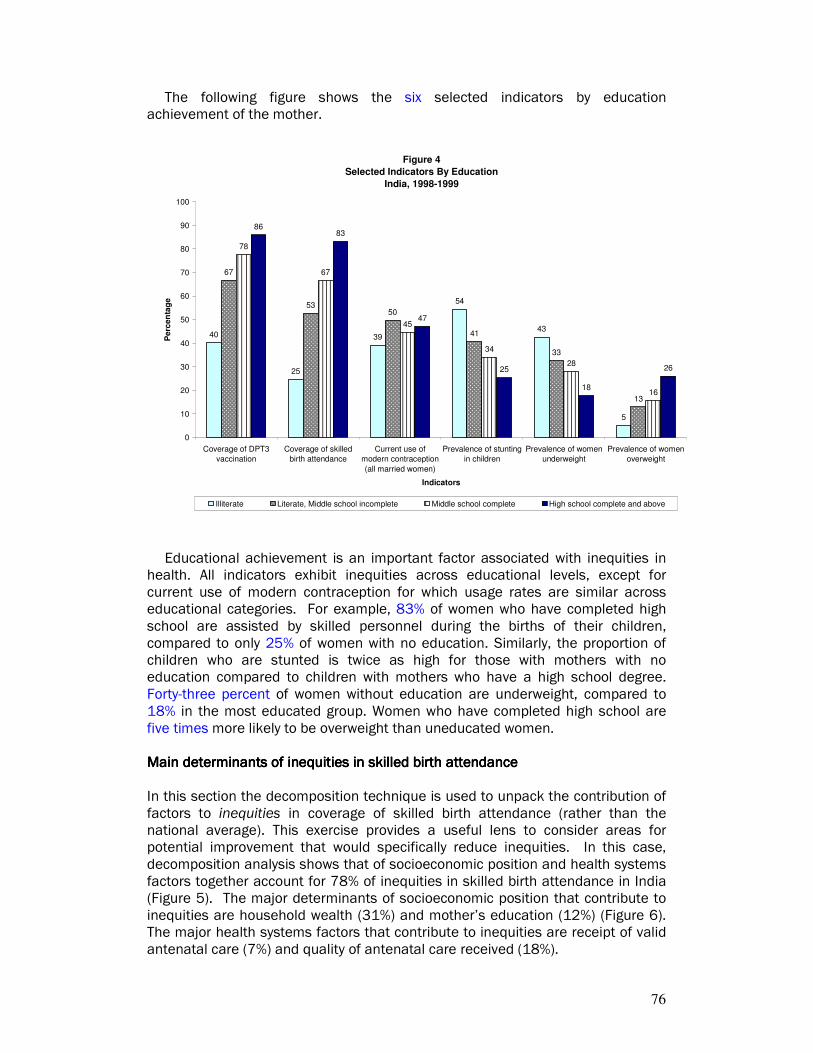
76
The following figure shows the six selected indicators by education achievement of the mother.
Figure 4
Selected Indicators By Education
India, 1998-1999
40
25
39
54
43
5
67
5350
41
33
13
78
67
45
34
28
16
8683
47
25
18
26
0
10
20
30
40
50
60
70
80
90
100
Coverage of DPT3
vaccination
Coverage of skilled
birth attendance
Current use of
modern contraception
(all married women)
Prevalence of stunting
in children
Prevalence of women
underweight
Prevalence of women
overweight
Indicators
Pe
rce
nta
ge
Illiterate Literate, Middle school incomplete Middle school complete High school complete and above
Educational achievement is an important factor associated with inequities in health. All indicators exhibit inequities across educational levels, except for current use of modern contraception for which usage rates are similar across educational categories. For example, 83% of women who have completed high school are assisted by skilled personnel during the births of their children, compared to only 25% of women with no education. Similarly, the proportion of children who are stunted is twice as high for those with mothers with no education compared to children with mothers who have a high school degree. Forty-three percent of women without education are underweight, compared to 18% in the most educated group. Women who have completed high school are five times more likely to be overweight than uneducated women. Main determinants of inequities in skilled birth attendanceMain determinants of inequities in skilled birth attendanceMain determinants of inequities in skilled birth attendanceMain determinants of inequities in skilled birth attendance In this section the decomposition technique is used to unpack the contribution of factors to inequities in coverage of skilled birth attendance (rather than the national average). This exercise provides a useful lens to consider areas for potential improvement that would specifically reduce inequities. In this case, decomposition analysis shows that of socioeconomic position and health systems factors together account for 78% of inequities in skilled birth attendance in India (Figure 5). The major determinants of socioeconomic position that contribute to inequities are household wealth (31%) and mother’s education (12%) (Figure 6). The major health systems factors that contribute to inequities are receipt of valid antenatal care (7%) and quality of antenatal care received (18%).
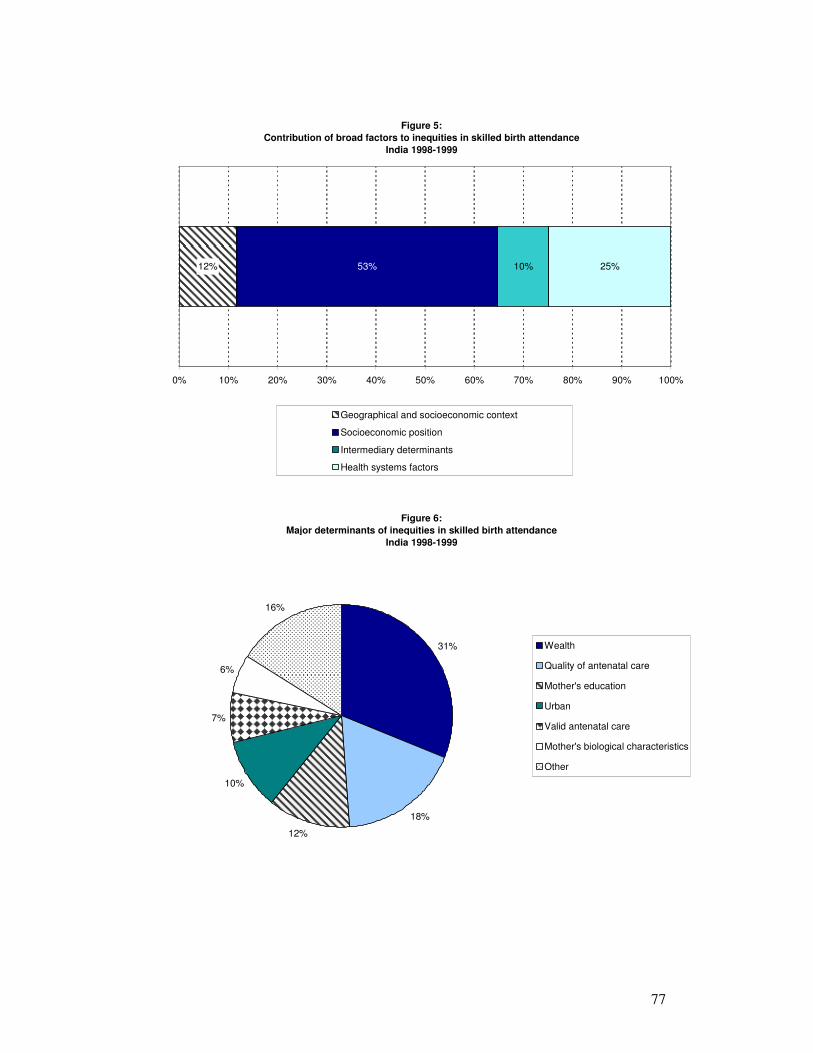
77
Figure 5:
Contribution of broad factors to inequities in skilled birth attendance
India 1998-1999
12% 53% 10% 25%
0% 10% 20% 30% 40% 50% 60% 70% 80% 90% 100%
Geographical and socioeconomic context
Socioeconomic position
Intermediary determinants
Health systems factors
Figure 6:
Major determinants of inequities in skilled birth attendance
India 1998-1999
31%
18%
12%
10%
7%
6%
16%
Wealth
Quality of antenatal care
Mother's education
Urban
Valid antenatal care
Mother's biological characteristics
Other
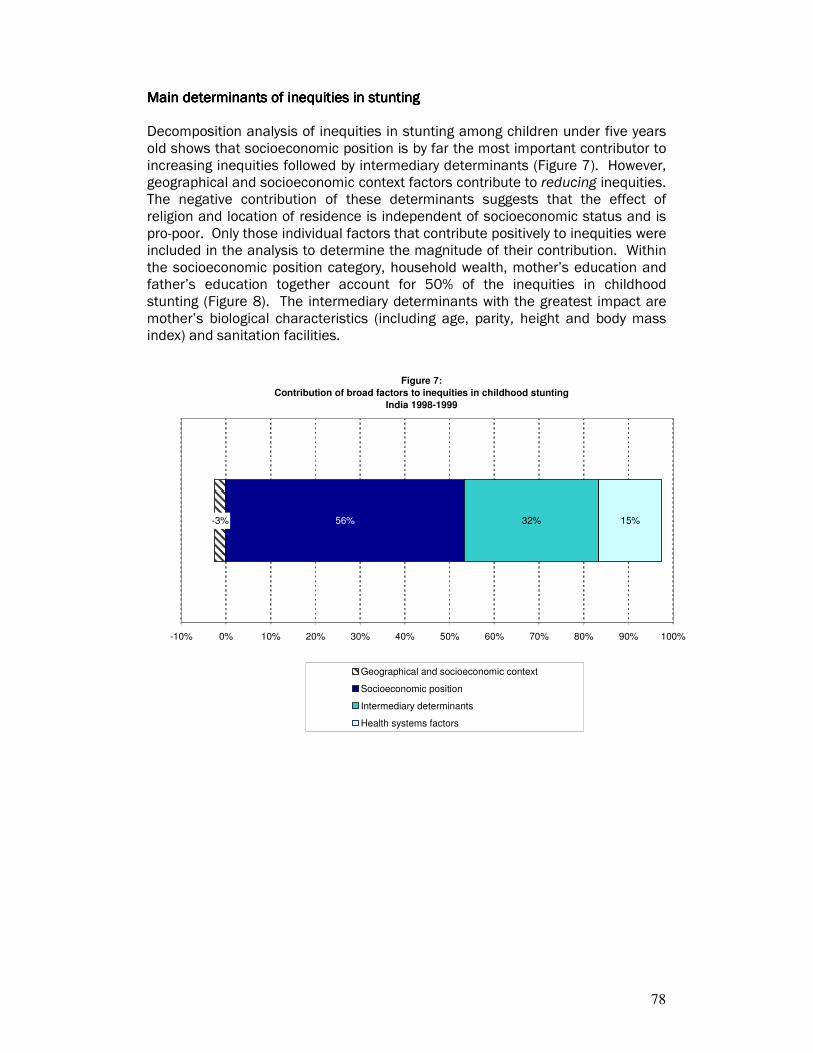
78
Main determinants of inequities in stuntingMain determinants of inequities in stuntingMain determinants of inequities in stuntingMain determinants of inequities in stunting Decomposition analysis of inequities in stunting among children under five years old shows that socioeconomic position is by far the most important contributor to increasing inequities followed by intermediary determinants (Figure 7). However, geographical and socioeconomic context factors contribute to reducing inequities. The negative contribution of these determinants suggests that the effect of religion and location of residence is independent of socioeconomic status and is pro-poor. Only those individual factors that contribute positively to inequities were included in the analysis to determine the magnitude of their contribution. Within the socioeconomic position category, household wealth, mother’s education and father’s education together account for 50% of the inequities in childhood stunting (Figure 8). The intermediary determinants with the greatest impact are mother’s biological characteristics (including age, parity, height and body mass index) and sanitation facilities.
Figure 7:
Contribution of broad factors to inequities in childhood stunting
India 1998-1999
-3% 56% 32% 15%
-10% 0% 10% 20% 30% 40% 50% 60% 70% 80% 90% 100%
Geographical and socioeconomic context
Socioeconomic position
Intermediary determinants
Health systems factors
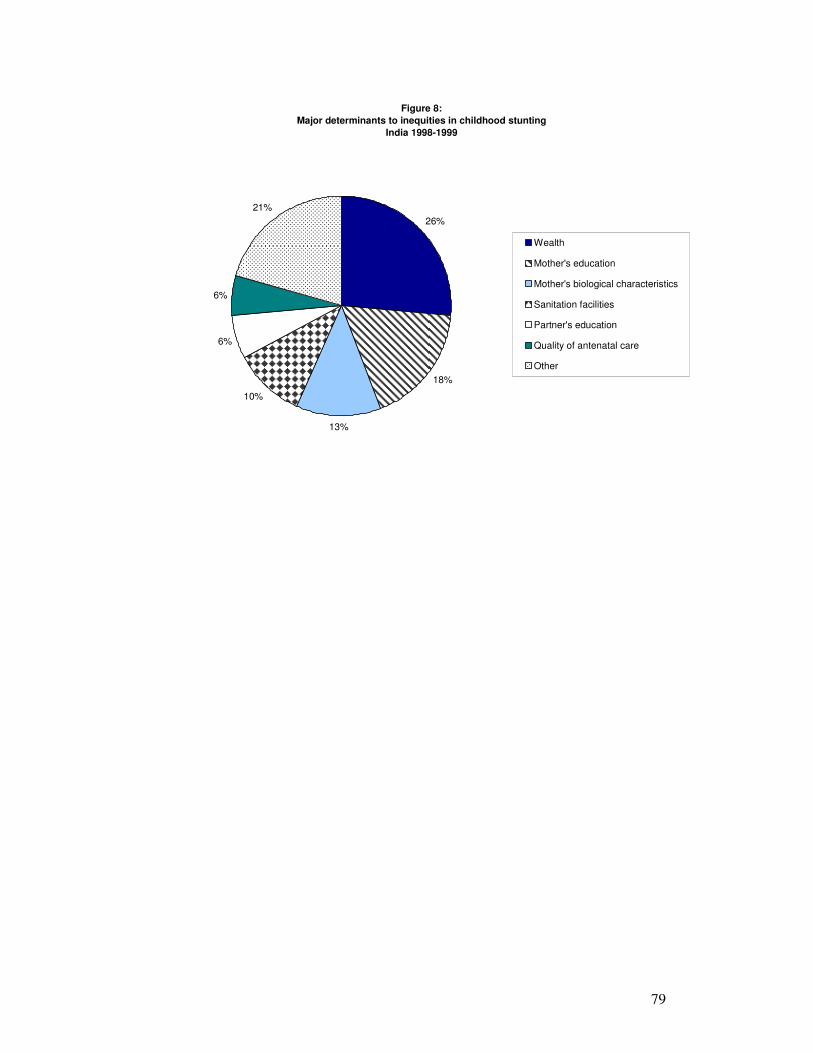
79
Figure 8:
Major determinants to inequities in childhood stunting
India 1998-1999
26%
18%
13%
10%
6%
6%
21%
Wealth
Mother's education
Mother's biological characteristics
Sanitation facilities
Partner's education
Quality of antenatal care
Other

80
IndonesiaIndonesiaIndonesiaIndonesia
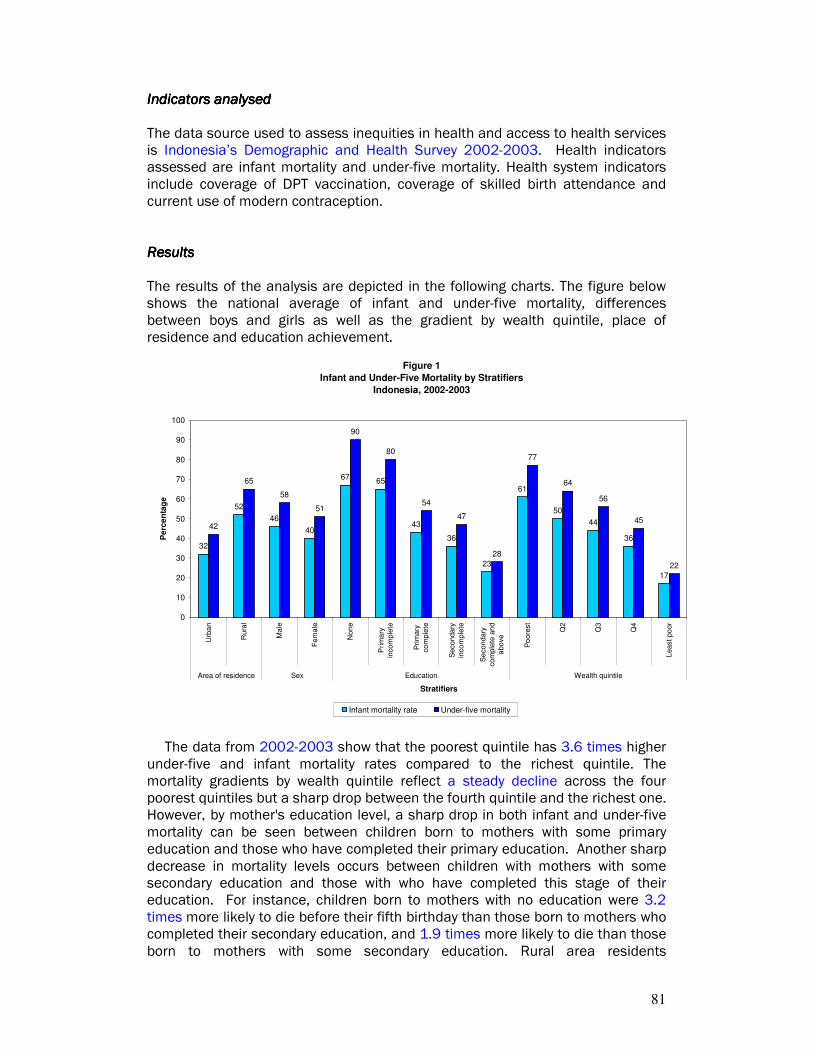
81
IIIIndicators analysedndicators analysedndicators analysedndicators analysed The data source used to assess inequities in health and access to health services is Indonesia’s Demographic and Health Survey 2002-2003. Health indicators assessed are infant mortality and under-five mortality. Health system indicators include coverage of DPT vaccination, coverage of skilled birth attendance and current use of modern contraception. ResultsResultsResultsResults The results of the analysis are depicted in the following charts. The figure below shows the national average of infant and under-five mortality, differences between boys and girls as well as the gradient by wealth quintile, place of residence and education achievement.
Figure 1
Infant and Under-Five Mortality by Stratifiers
Indonesia, 2002-2003
32
52
46
40
6765
43
36
23
61
50
44
36
17
42
65
58
51
90
80
54
47
28
77
64
56
45
22
0
10
20
30
40
50
60
70
80
90
100
Urb
an
Rura
l
Ma
le
Fem
ale
Non
e
Prim
ary
inco
mple
te
Pri
mary
co
mple
te
Seco
nda
ry
inco
mple
te
Se
cond
ary
com
ple
te a
nd
above
Po
ore
st
Q2
Q3
Q4
Least
po
or
Area of residence Sex Education Wealth quintile
Stratifiers
Pe
rce
nta
ge
Infant mortality rate Under-five mortality
The data from 2002-2003 show that the poorest quintile has 3.6 times higher under-five and infant mortality rates compared to the richest quintile. The mortality gradients by wealth quintile reflect a steady decline across the four poorest quintiles but a sharp drop between the fourth quintile and the richest one. However, by mother's education level, a sharp drop in both infant and under-five mortality can be seen between children born to mothers with some primary education and those who have completed their primary education. Another sharp decrease in mortality levels occurs between children with mothers with some secondary education and those with who have completed this stage of their education. For instance, children born to mothers with no education were 3.2 times more likely to die before their fifth birthday than those born to mothers who completed their secondary education, and 1.9 times more likely to die than those born to mothers with some secondary education. Rural area residents
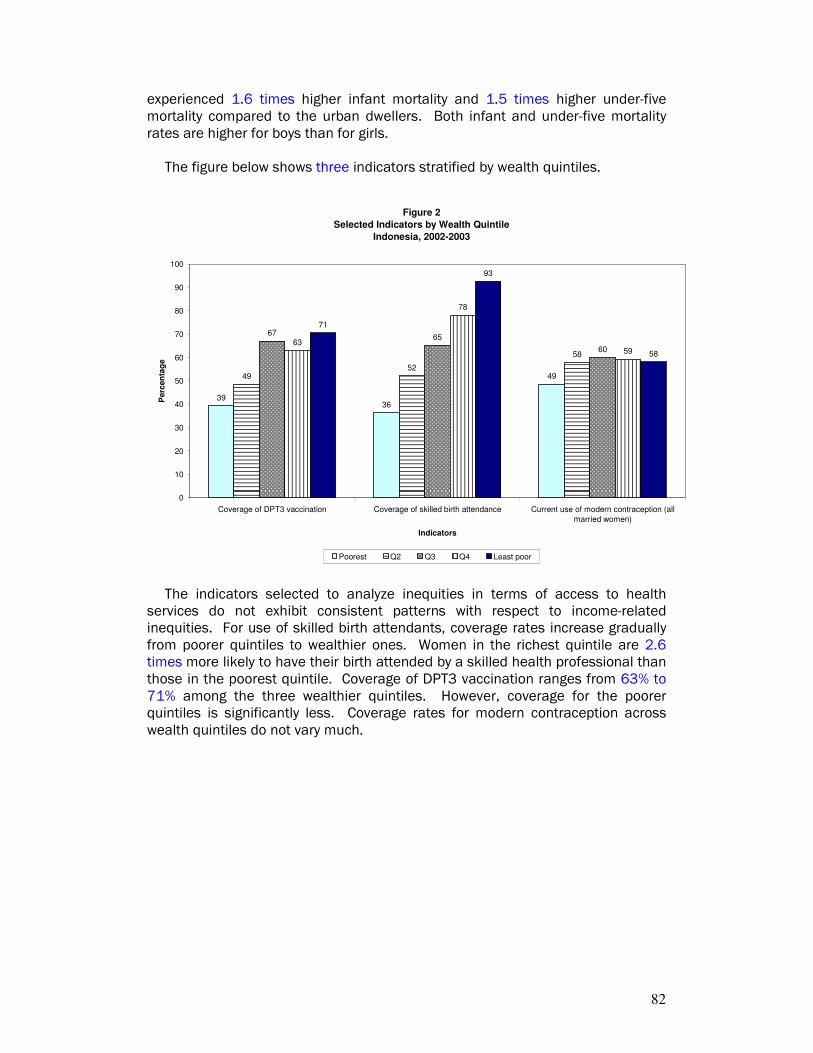
82
experienced 1.6 times higher infant mortality and 1.5 times higher under-five mortality compared to the urban dwellers. Both infant and under-five mortality rates are higher for boys than for girls.
The figure below shows three indicators stratified by wealth quintiles.
Figure 2
Selected Indicators by Wealth Quintile
Indonesia, 2002-2003
3936
494952
58
6765
6063
78
59
71
93
58
0
10
20
30
40
50
60
70
80
90
100
Coverage of DPT3 vaccination Coverage of skilled birth attendance Current use of modern contraception (all
married women)
Indicators
Perc
en
tag
e
Poorest Q2 Q3 Q4 Least poor
The indicators selected to analyze inequities in terms of access to health services do not exhibit consistent patterns with respect to income-related inequities. For use of skilled birth attendants, coverage rates increase gradually from poorer quintiles to wealthier ones. Women in the richest quintile are 2.6 times more likely to have their birth attended by a skilled health professional than those in the poorest quintile. Coverage of DPT3 vaccination ranges from 63% to 71% among the three wealthier quintiles. However, coverage for the poorer quintiles is significantly less. Coverage rates for modern contraception across wealth quintiles do not vary much.
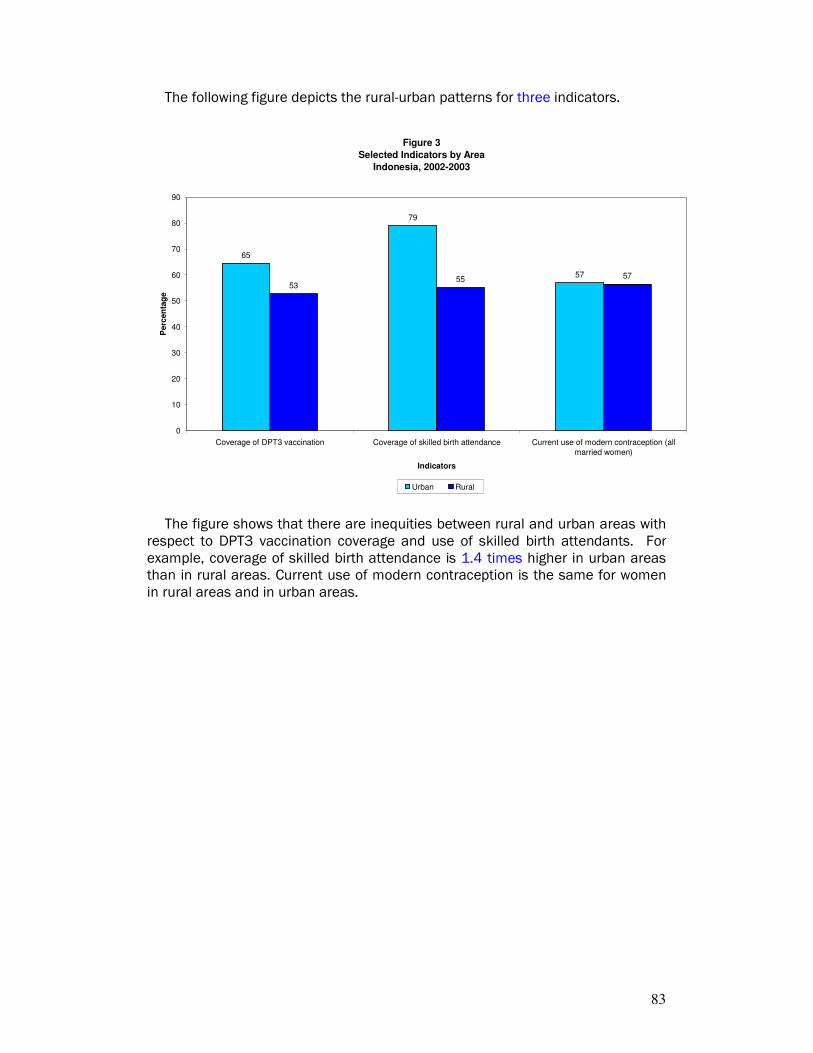
83
The following figure depicts the rural-urban patterns for three indicators.
Figure 3
Selected Indicators by Area
Indonesia, 2002-2003
65
79
57
5355 57
0
10
20
30
40
50
60
70
80
90
Coverage of DPT3 vaccination Coverage of skilled birth attendance Current use of modern contraception (all
married women)
Indicators
Pe
rcen
tag
e
Urban Rural
The figure shows that there are inequities between rural and urban areas with respect to DPT3 vaccination coverage and use of skilled birth attendants. For example, coverage of skilled birth attendance is 1.4 times higher in urban areas than in rural areas. Current use of modern contraception is the same for women in rural areas and in urban areas.
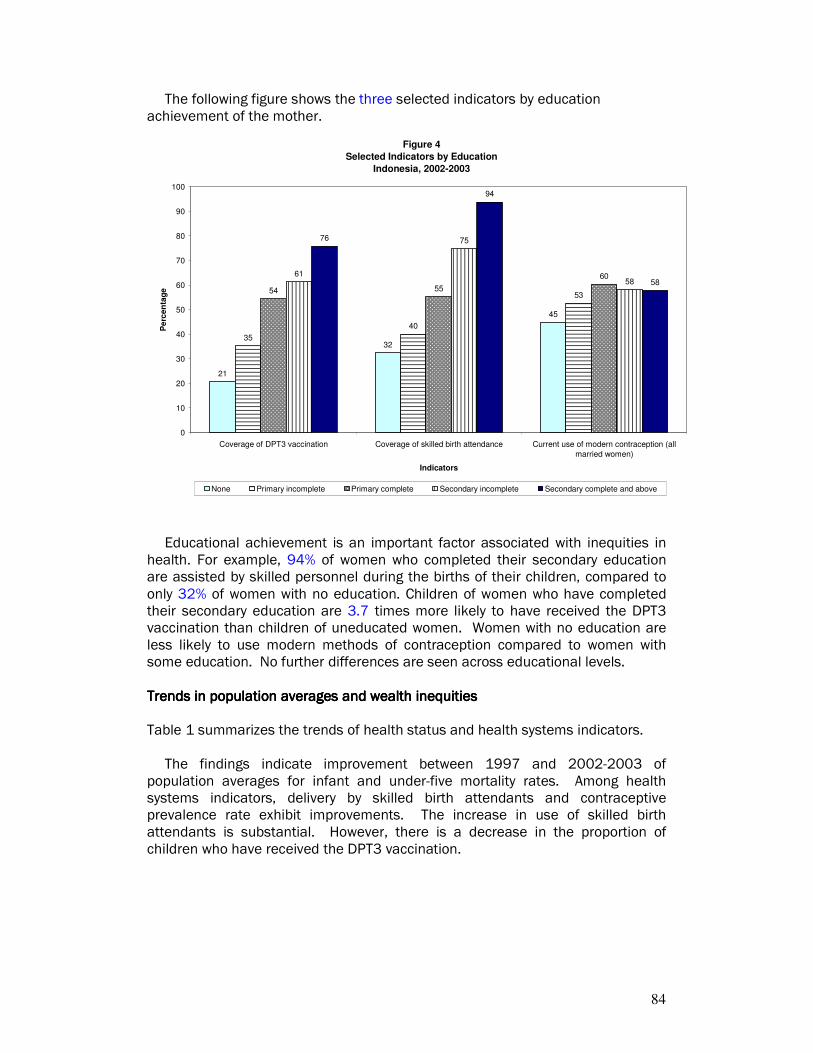
84
The following figure shows the three selected indicators by education achievement of the mother.
Figure 4
Selected Indicators by Education
Indonesia, 2002-2003
21
32
45
35
40
5354 55
6061
75
58
76
94
58
0
10
20
30
40
50
60
70
80
90
100
Coverage of DPT3 vaccination Coverage of skilled birth attendance Current use of modern contraception (all
married women)
Indicators
Pe
rce
nta
ge
None Primary incomplete Primary complete Secondary incomplete Secondary complete and above
Educational achievement is an important factor associated with inequities in health. For example, 94% of women who completed their secondary education are assisted by skilled personnel during the births of their children, compared to only 32% of women with no education. Children of women who have completed their secondary education are 3.7 times more likely to have received the DPT3 vaccination than children of uneducated women. Women with no education are less likely to use modern methods of contraception compared to women with some education. No further differences are seen across educational levels. Trends in population averages and wealTrends in population averages and wealTrends in population averages and wealTrends in population averages and wealth th th th inequitiesinequitiesinequitiesinequities Table 1 summarizes the trends of health status and health systems indicators.
The findings indicate improvement between 1997 and 2002-2003 of population averages for infant and under-five mortality rates. Among health systems indicators, delivery by skilled birth attendants and contraceptive prevalence rate exhibit improvements. The increase in use of skilled birth attendants is substantial. However, there is a decrease in the proportion of children who have received the DPT3 vaccination.
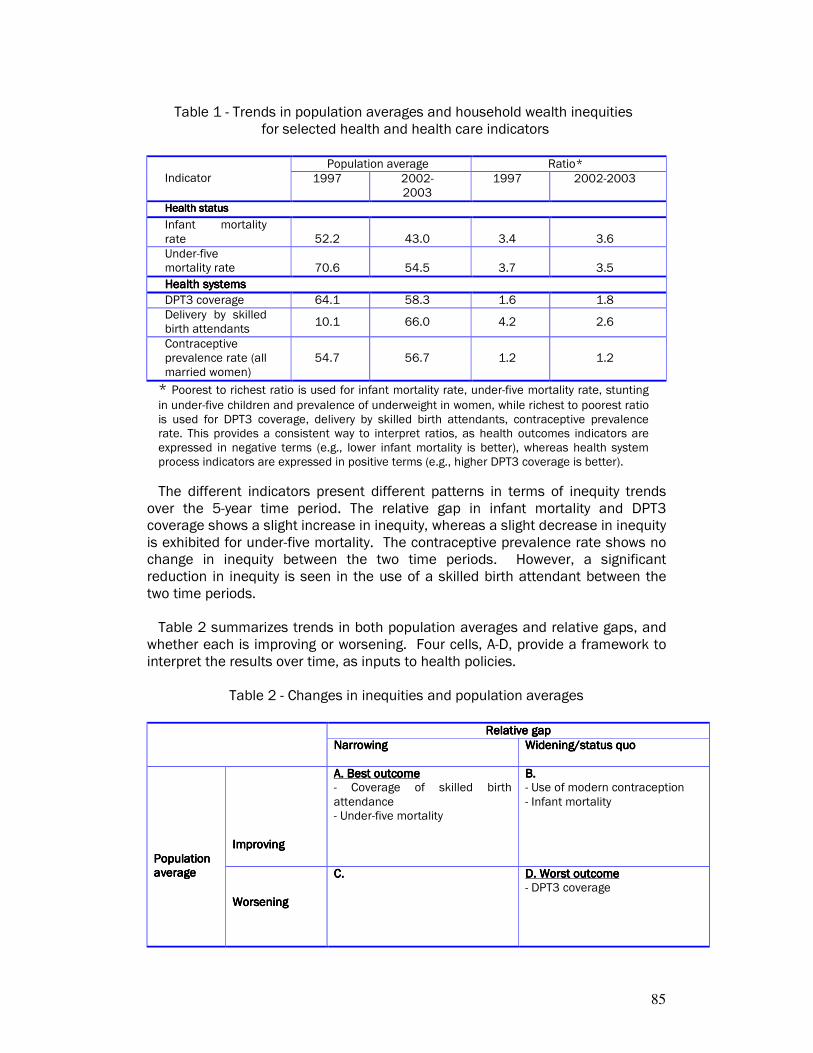
85
Table 1 - Trends in population averages and household wealth inequities for selected health and health care indicators
Population average Ratio*
Indicator 1997 2002-2003
1997 2002-2003
Health statusHealth statusHealth statusHealth status
Infant mortality rate 52.2 43.0 3.4 3.6
Under-five mortality rate 70.6 54.5 3.7 3.5
Health systemsHealth systemsHealth systemsHealth systems
DPT3 coverage 64.1 58.3 1.6 1.8
Delivery by skilled birth attendants
10.1 66.0 4.2 2.6
Contraceptive prevalence rate (all married women)
54.7 56.7 1.2 1.2
* Poorest to richest ratio is used for infant mortality rate, under-five mortality rate, stunting
in under-five children and prevalence of underweight in women, while richest to poorest ratio is used for DPT3 coverage, delivery by skilled birth attendants, contraceptive prevalence rate. This provides a consistent way to interpret ratios, as health outcomes indicators are expressed in negative terms (e.g., lower infant mortality is better), whereas health system process indicators are expressed in positive terms (e.g., higher DPT3 coverage is better).
The different indicators present different patterns in terms of inequity trends over the 5-year time period. The relative gap in infant mortality and DPT3 coverage shows a slight increase in inequity, whereas a slight decrease in inequity is exhibited for under-five mortality. The contraceptive prevalence rate shows no change in inequity between the two time periods. However, a significant reduction in inequity is seen in the use of a skilled birth attendant between the two time periods. Table 2 summarizes trends in both population averages and relative gaps, and
whether each is improving or worsening. Four cells, A-D, provide a framework to interpret the results over time, as inputs to health policies.
Table 2 - Changes in inequities and population averages
Relative gapRelative gapRelative gapRelative gap
NarrowingNarrowingNarrowingNarrowing Widening/status quoWidening/status quoWidening/status quoWidening/status quo
ImprovingImprovingImprovingImproving
A. Best outcomeA. Best outcomeA. Best outcomeA. Best outcome - Coverage of skilled birth attendance - Under-five mortality
B. B. B. B. - Use of modern contraception - Infant mortality
Population Population Population Population averageaverageaverageaverage
WorseninWorseninWorseninWorseningggg
C.C.C.C.
D. Worst outcomeD. Worst outcomeD. Worst outcomeD. Worst outcome - DPT3 coverage
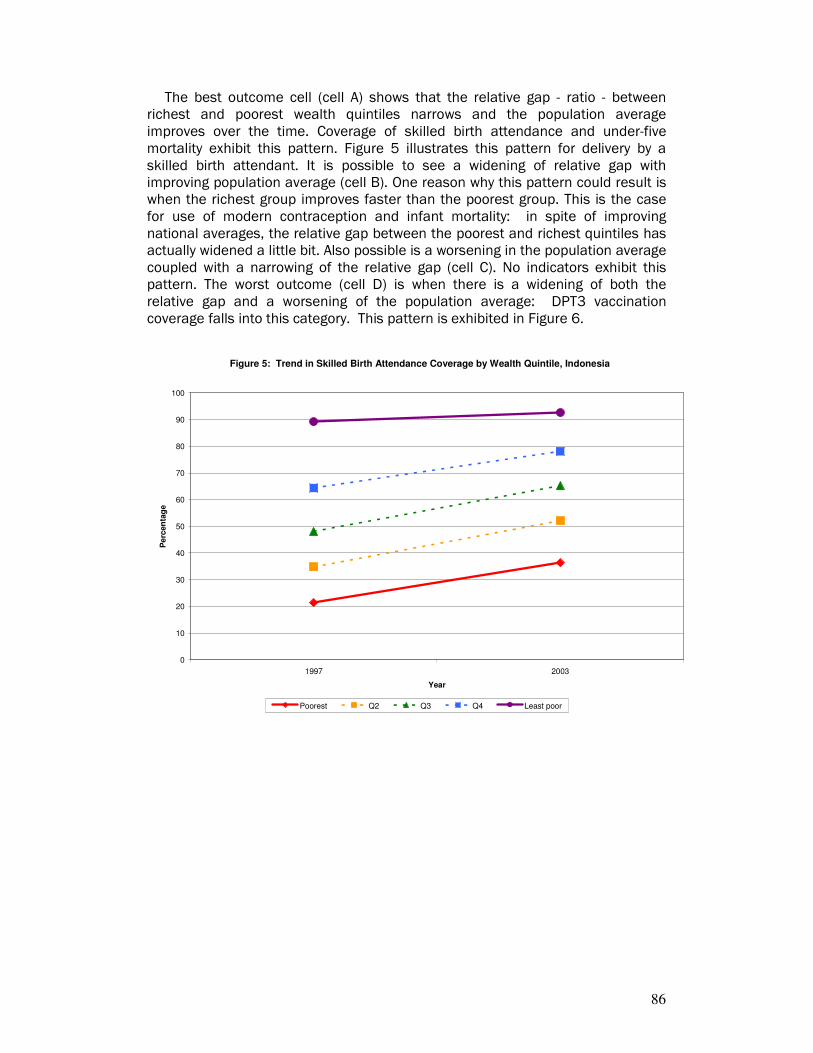
86
The best outcome cell (cell A) shows that the relative gap - ratio - between richest and poorest wealth quintiles narrows and the population average improves over the time. Coverage of skilled birth attendance and under-five mortality exhibit this pattern. Figure 5 illustrates this pattern for delivery by a skilled birth attendant. It is possible to see a widening of relative gap with improving population average (cell B). One reason why this pattern could result is when the richest group improves faster than the poorest group. This is the case for use of modern contraception and infant mortality: in spite of improving national averages, the relative gap between the poorest and richest quintiles has actually widened a little bit. Also possible is a worsening in the population average coupled with a narrowing of the relative gap (cell C). No indicators exhibit this pattern. The worst outcome (cell D) is when there is a widening of both the relative gap and a worsening of the population average: DPT3 vaccination coverage falls into this category. This pattern is exhibited in Figure 6.
Figure 5: Trend in Skilled Birth Attendance Coverage by Wealth Quintile, Indonesia
0
10
20
30
40
50
60
70
80
90
100
1997 2003
Year
Pe
rcen
tag
e
Poorest Q2 Q3 Q4 Least poor
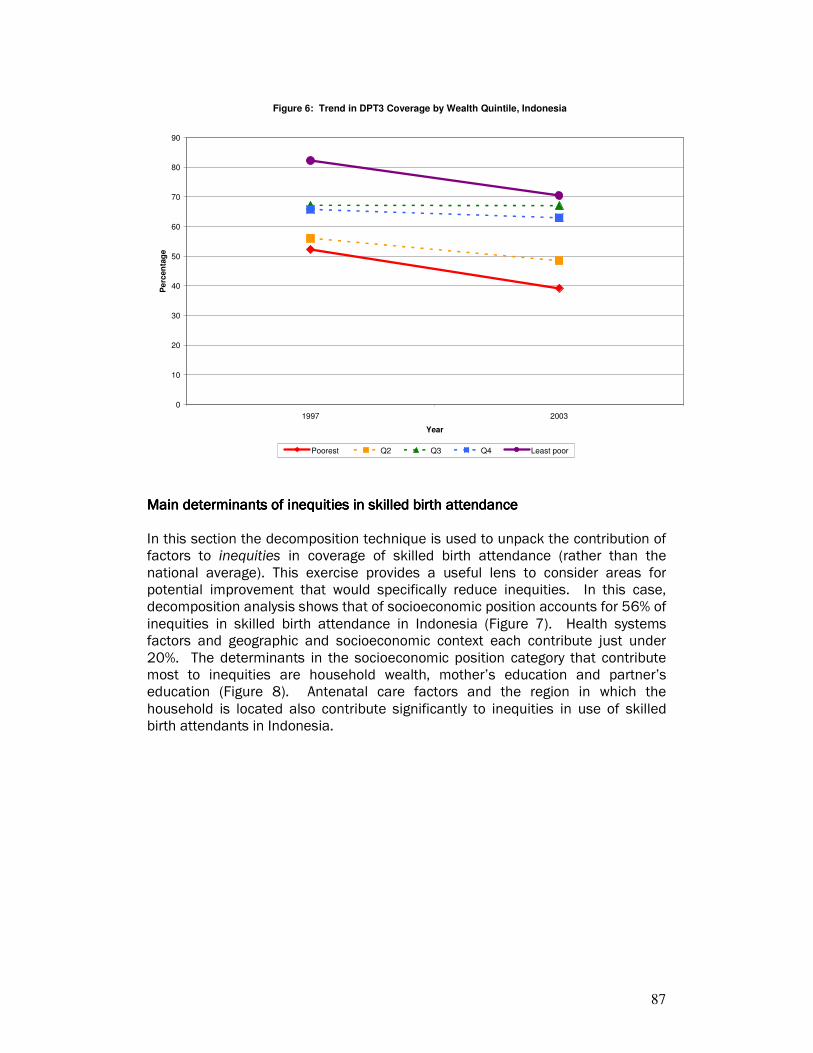
87
Figure 6: Trend in DPT3 Coverage by Wealth Quintile, Indonesia
0
10
20
30
40
50
60
70
80
90
1997 2003
Year
Pe
rcen
tag
e
Poorest Q2 Q3 Q4 Least poor
Main determinants of inequities in skilled birth attendanceMain determinants of inequities in skilled birth attendanceMain determinants of inequities in skilled birth attendanceMain determinants of inequities in skilled birth attendance In this section the decomposition technique is used to unpack the contribution of factors to inequities in coverage of skilled birth attendance (rather than the national average). This exercise provides a useful lens to consider areas for potential improvement that would specifically reduce inequities. In this case, decomposition analysis shows that of socioeconomic position accounts for 56% of inequities in skilled birth attendance in Indonesia (Figure 7). Health systems factors and geographic and socioeconomic context each contribute just under 20%. The determinants in the socioeconomic position category that contribute most to inequities are household wealth, mother’s education and partner’s education (Figure 8). Antenatal care factors and the region in which the household is located also contribute significantly to inequities in use of skilled birth attendants in Indonesia.
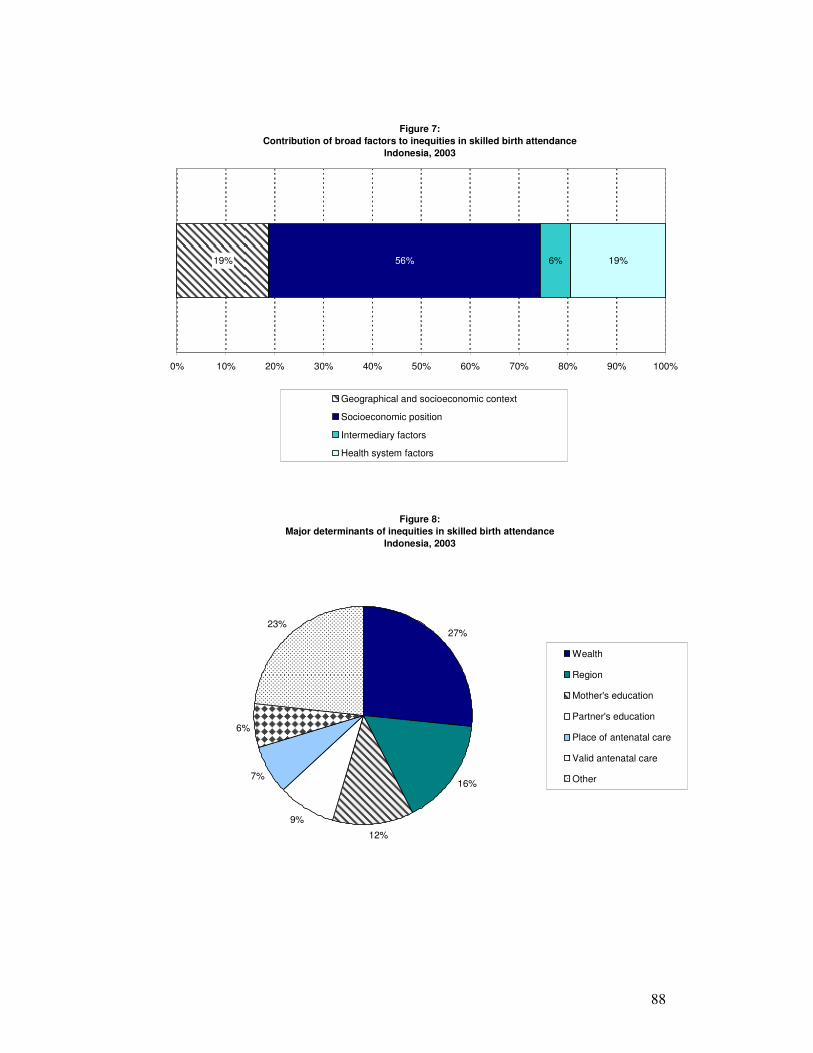
88
Figure 7:
Contribution of broad factors to inequities in skilled birth attendance
Indonesia, 2003
19% 56% 6% 19%
0% 10% 20% 30% 40% 50% 60% 70% 80% 90% 100%
Geographical and socioeconomic context
Socioeconomic position
Intermediary factors
Health system factors
Figure 8:
Major determinants of inequities in skilled birth attendance
Indonesia, 2003
27%
16%
12%
9%
7%
6%
23%
Wealth
Region
Mother's education
Partner's education
Place of antenatal care
Valid antenatal care
Other

89
NepalNepalNepalNepal
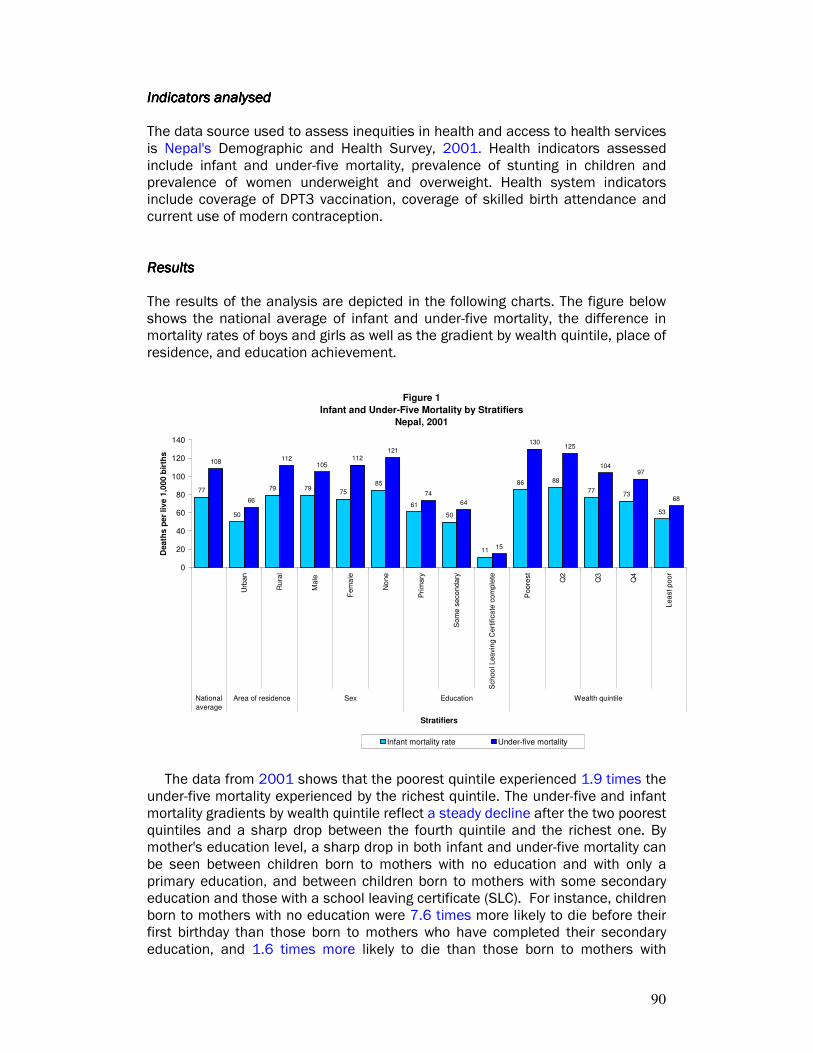
90
Indicators analysedIndicators analysedIndicators analysedIndicators analysed The data source used to assess inequities in health and access to health services is Nepal's Demographic and Health Survey, 2001. Health indicators assessed include infant and under-five mortality, prevalence of stunting in children and prevalence of women underweight and overweight. Health system indicators include coverage of DPT3 vaccination, coverage of skilled birth attendance and current use of modern contraception. ResultsResultsResultsResults The results of the analysis are depicted in the following charts. The figure below shows the national average of infant and under-five mortality, the difference in mortality rates of boys and girls as well as the gradient by wealth quintile, place of residence, and education achievement.
Figure 1
Infant and Under-Five Mortality by Stratifiers
Nepal, 2001
77
50
79 7975
85
61
50
11
86 88
7773
53
108
66
112105
112121
74
64
15
130125
10497
68
0
20
40
60
80
100
120
140
Urb
an
Ru
ral
Male
Fem
ale
No
ne
Pri
mary
Som
e s
eco
nd
ary
Sch
oo
l Lea
vin
g C
ert
ific
ate
com
ple
te
Poore
st
Q2
Q3
Q4
Lea
st p
oor
National
average
Area of residence Sex Education Wealth quintile
Stratifiers
Dea
ths
pe
r li
ve
1,0
00
bir
ths
Infant mortality rate Under-five mortality
The data from 2001 shows that the poorest quintile experienced 1.9 times the under-five mortality experienced by the richest quintile. The under-five and infant mortality gradients by wealth quintile reflect a steady decline after the two poorest quintiles and a sharp drop between the fourth quintile and the richest one. By mother's education level, a sharp drop in both infant and under-five mortality can be seen between children born to mothers with no education and with only a primary education, and between children born to mothers with some secondary education and those with a school leaving certificate (SLC). For instance, children born to mothers with no education were 7.6 times more likely to die before their first birthday than those born to mothers who have completed their secondary education, and 1.6 times more likely to die than those born to mothers with
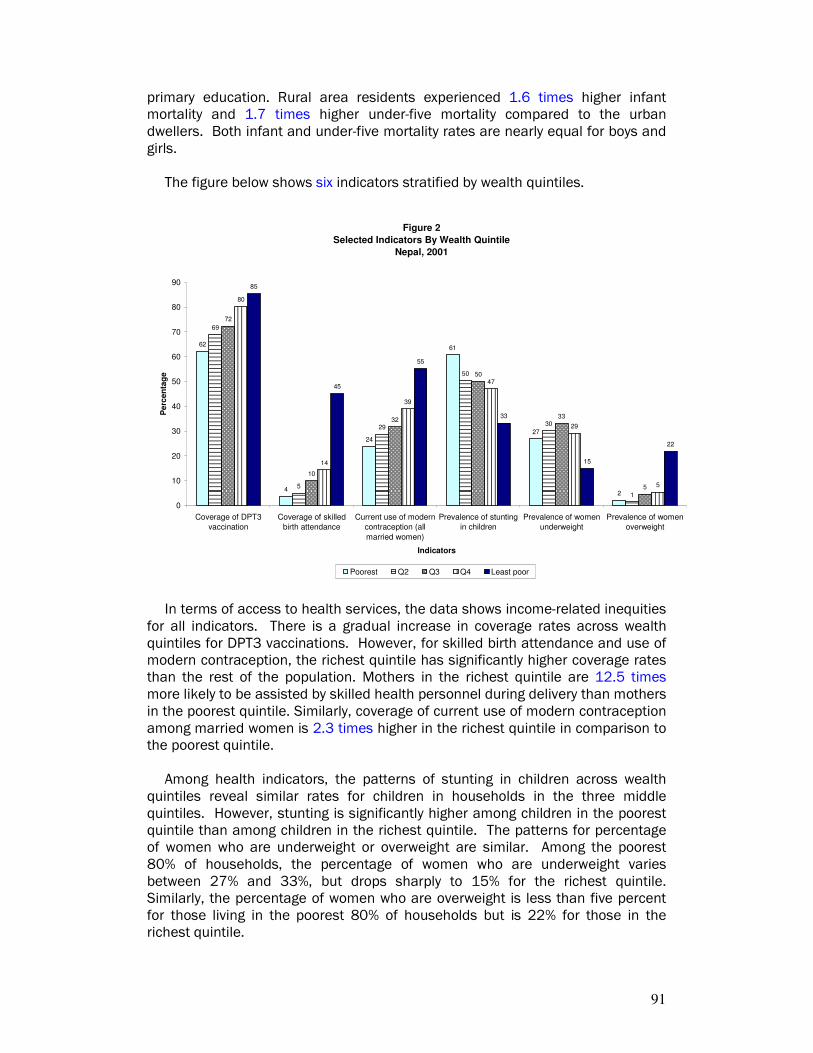
91
primary education. Rural area residents experienced 1.6 times higher infant mortality and 1.7 times higher under-five mortality compared to the urban dwellers. Both infant and under-five mortality rates are nearly equal for boys and girls.
The figure below shows six indicators stratified by wealth quintiles.
Figure 2
Selected Indicators By Wealth Quintile
Nepal, 2001
62
4
24
61
27
2
69
5
29
50
30
1
72
10
32
50
33
5
80
14
39
47
29
5
85
45
55
33
15
22
0
10
20
30
40
50
60
70
80
90
Coverage of DPT3
vaccination
Coverage of skilled
birth attendance
Current use of modern
contraception (all
married women)
Prevalence of stunting
in children
Prevalence of women
underweight
Prevalence of women
overweight
Indicators
Pe
rce
nta
ge
Poorest Q2 Q3 Q4 Least poor
In terms of access to health services, the data shows income-related inequities for all indicators. There is a gradual increase in coverage rates across wealth quintiles for DPT3 vaccinations. However, for skilled birth attendance and use of modern contraception, the richest quintile has significantly higher coverage rates than the rest of the population. Mothers in the richest quintile are 12.5 times more likely to be assisted by skilled health personnel during delivery than mothers in the poorest quintile. Similarly, coverage of current use of modern contraception among married women is 2.3 times higher in the richest quintile in comparison to the poorest quintile.
Among health indicators, the patterns of stunting in children across wealth quintiles reveal similar rates for children in households in the three middle quintiles. However, stunting is significantly higher among children in the poorest quintile than among children in the richest quintile. The patterns for percentage of women who are underweight or overweight are similar. Among the poorest 80% of households, the percentage of women who are underweight varies between 27% and 33%, but drops sharply to 15% for the richest quintile. Similarly, the percentage of women who are overweight is less than five percent for those living in the poorest 80% of households but is 22% for those in the richest quintile.
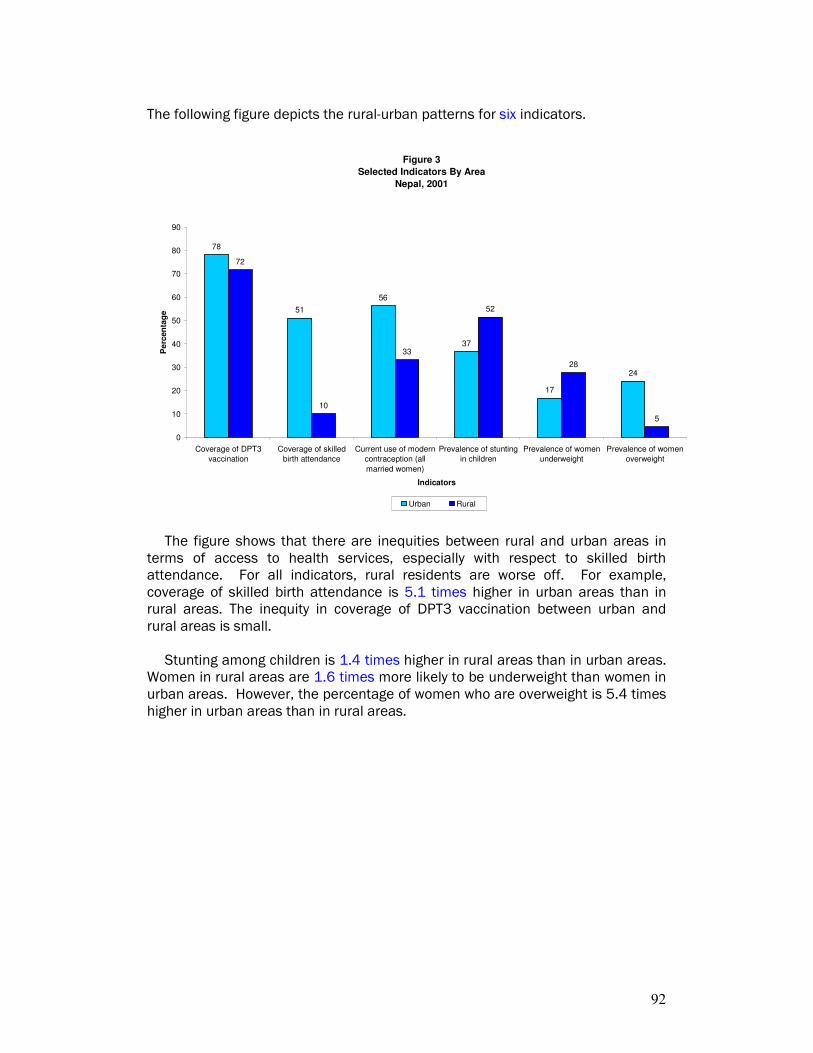
92
The following figure depicts the rural-urban patterns for six indicators.
Figure 3
Selected Indicators By Area
Nepal, 2001
78
51
56
37
17
24
72
10
33
52
28
5
0
10
20
30
40
50
60
70
80
90
Coverage of DPT3
vaccination
Coverage of skilled
birth attendance
Current use of modern
contraception (all
married women)
Prevalence of stunting
in children
Prevalence of women
underweight
Prevalence of women
overweight
Indicators
Pe
rcen
tag
e
Urban Rural
The figure shows that there are inequities between rural and urban areas in terms of access to health services, especially with respect to skilled birth attendance. For all indicators, rural residents are worse off. For example, coverage of skilled birth attendance is 5.1 times higher in urban areas than in rural areas. The inequity in coverage of DPT3 vaccination between urban and rural areas is small.
Stunting among children is 1.4 times higher in rural areas than in urban areas. Women in rural areas are 1.6 times more likely to be underweight than women in urban areas. However, the percentage of women who are overweight is 5.4 times higher in urban areas than in rural areas.
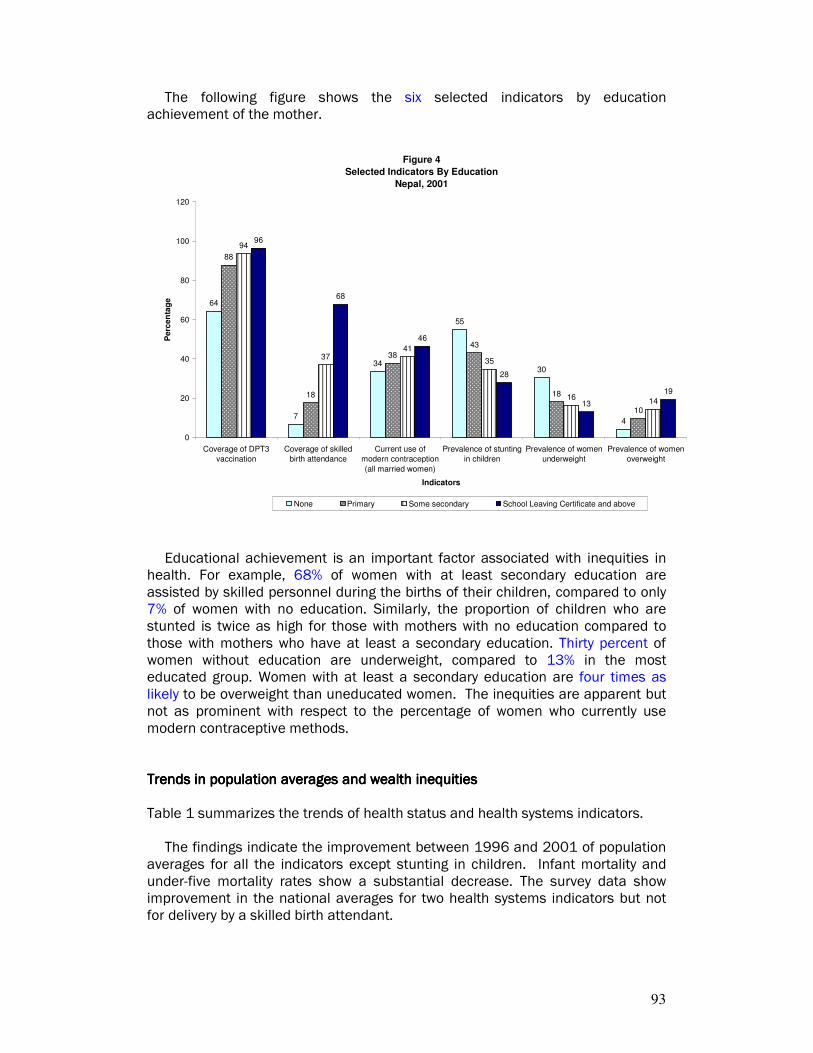
93
The following figure shows the six selected indicators by education achievement of the mother.
Figure 4
Selected Indicators By Education
Nepal, 2001
64
7
34
55
30
4
88
18
38
43
18
10
94
3741
35
1614
96
68
46
28
13
19
0
20
40
60
80
100
120
Coverage of DPT3
vaccination
Coverage of skilled
birth attendance
Current use of
modern contraception
(all married women)
Prevalence of stunting
in children
Prevalence of women
underweight
Prevalence of women
overweight
Indicators
Pe
rce
nta
ge
None Primary Some secondary School Leaving Certificate and above
Educational achievement is an important factor associated with inequities in health. For example, 68% of women with at least secondary education are assisted by skilled personnel during the births of their children, compared to only 7% of women with no education. Similarly, the proportion of children who are stunted is twice as high for those with mothers with no education compared to those with mothers who have at least a secondary education. Thirty percent of women without education are underweight, compared to 13% in the most educated group. Women with at least a secondary education are four times as likely to be overweight than uneducated women. The inequities are apparent but not as prominent with respect to the percentage of women who currently use modern contraceptive methods. Trends in population averages and wealth Trends in population averages and wealth Trends in population averages and wealth Trends in population averages and wealth inequitiesinequitiesinequitiesinequities Table 1 summarizes the trends of health status and health systems indicators.
The findings indicate the improvement between 1996 and 2001 of population averages for all the indicators except stunting in children. Infant mortality and under-five mortality rates show a substantial decrease. The survey data show improvement in the national averages for two health systems indicators but not for delivery by a skilled birth attendant.
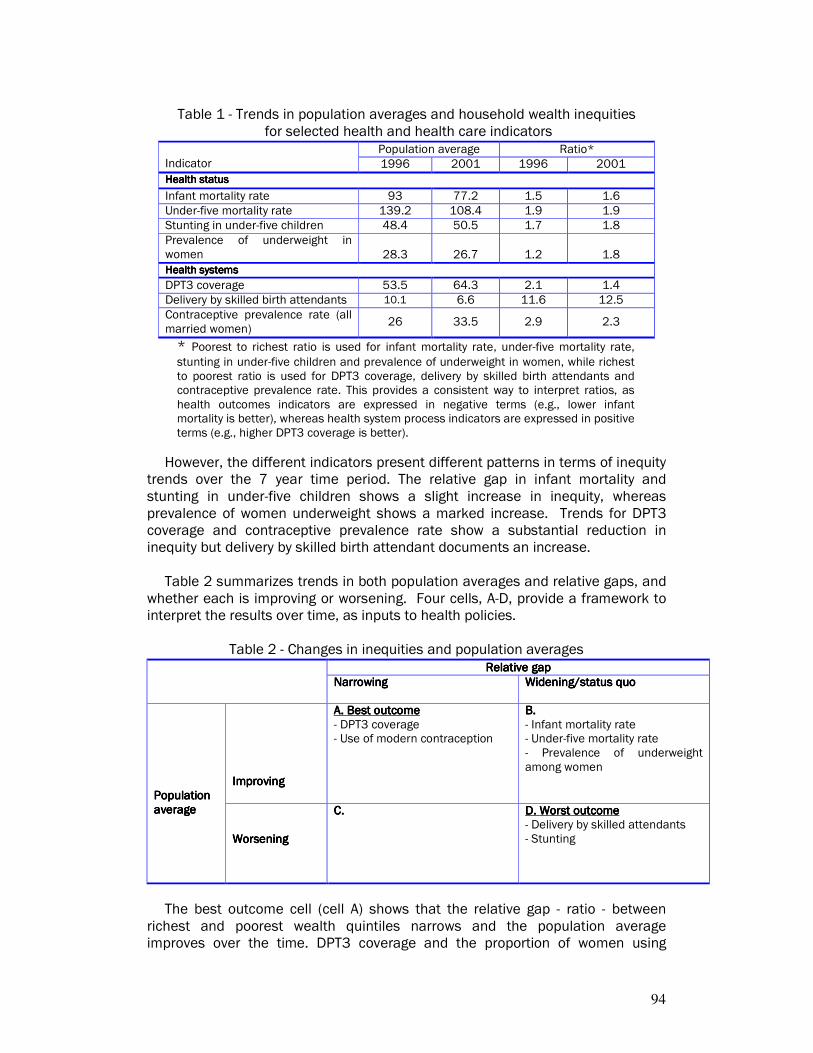
94
Table 1 - Trends in population averages and household wealth inequities
for selected health and health care indicators Population average Ratio*
Indicator 1996 2001 1996 2001
Health statusHealth statusHealth statusHealth status
Infant mortality rate 93 77.2 1.5 1.6
Under-five mortality rate 139.2 108.4 1.9 1.9
Stunting in under-five children 48.4 50.5 1.7 1.8
Prevalence of underweight in women 28.3 26.7 1.2 1.8
Health systemsHealth systemsHealth systemsHealth systems
DPT3 coverage 53.5 64.3 2.1 1.4
Delivery by skilled birth attendants 10.1 6.6 11.6 12.5
Contraceptive prevalence rate (all married women)
26 33.5 2.9 2.3
* Poorest to richest ratio is used for infant mortality rate, under-five mortality rate,
stunting in under-five children and prevalence of underweight in women, while richest to poorest ratio is used for DPT3 coverage, delivery by skilled birth attendants and contraceptive prevalence rate. This provides a consistent way to interpret ratios, as health outcomes indicators are expressed in negative terms (e.g., lower infant mortality is better), whereas health system process indicators are expressed in positive terms (e.g., higher DPT3 coverage is better).
However, the different indicators present different patterns in terms of inequity trends over the 7 year time period. The relative gap in infant mortality and stunting in under-five children shows a slight increase in inequity, whereas prevalence of women underweight shows a marked increase. Trends for DPT3 coverage and contraceptive prevalence rate show a substantial reduction in inequity but delivery by skilled birth attendant documents an increase.
Table 2 summarizes trends in both population averages and relative gaps, and whether each is improving or worsening. Four cells, A-D, provide a framework to interpret the results over time, as inputs to health policies.
Table 2 - Changes in inequities and population averages
Relative gapRelative gapRelative gapRelative gap
NarrowingNarrowingNarrowingNarrowing Widening/status quoWidening/status quoWidening/status quoWidening/status quo
ImprovingImprovingImprovingImproving
A. Best outcomeA. Best outcomeA. Best outcomeA. Best outcome - DPT3 coverage - Use of modern contraception
B. B. B. B. - Infant mortality rate - Under-five mortality rate - Prevalence of underweight among women
Population Population Population Population averageaverageaverageaverage
WorseningWorseningWorseningWorsening
C.C.C.C.
D. Worst outcomeD. Worst outcomeD. Worst outcomeD. Worst outcome - Delivery by skilled attendants - Stunting
The best outcome cell (cell A) shows that the relative gap - ratio - between
richest and poorest wealth quintiles narrows and the population average improves over the time. DPT3 coverage and the proportion of women using
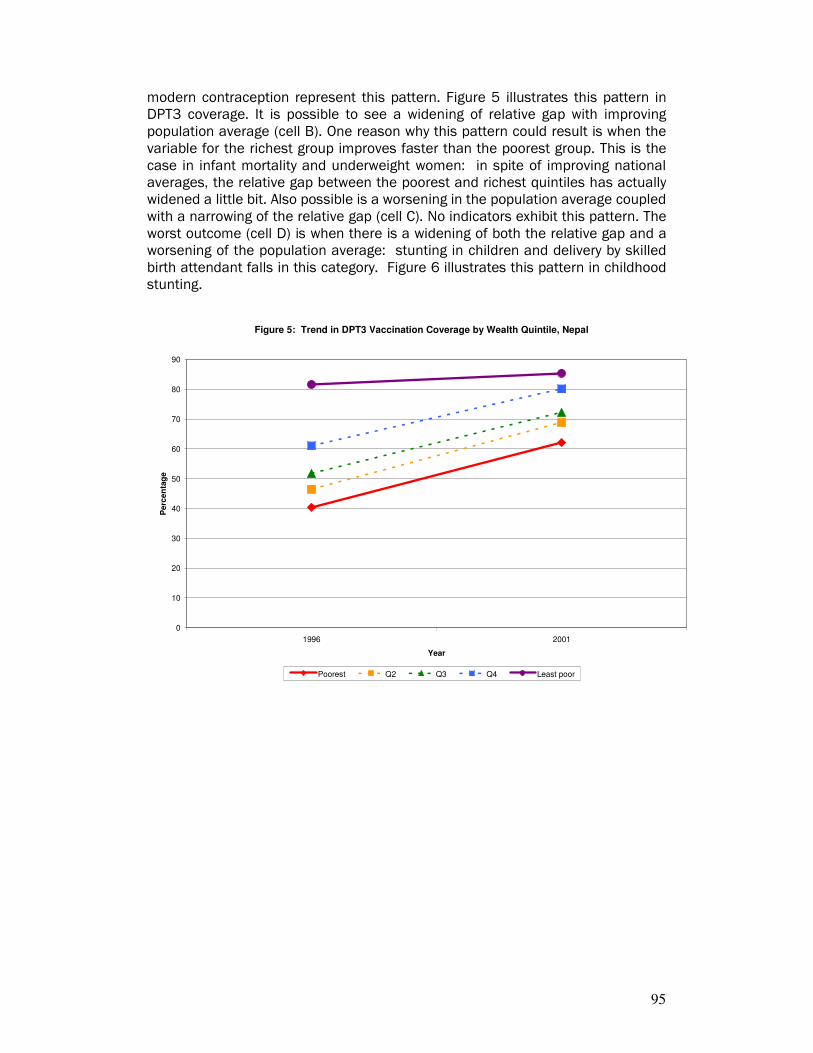
95
modern contraception represent this pattern. Figure 5 illustrates this pattern in DPT3 coverage. It is possible to see a widening of relative gap with improving population average (cell B). One reason why this pattern could result is when the variable for the richest group improves faster than the poorest group. This is the case in infant mortality and underweight women: in spite of improving national averages, the relative gap between the poorest and richest quintiles has actually widened a little bit. Also possible is a worsening in the population average coupled with a narrowing of the relative gap (cell C). No indicators exhibit this pattern. The worst outcome (cell D) is when there is a widening of both the relative gap and a worsening of the population average: stunting in children and delivery by skilled birth attendant falls in this category. Figure 6 illustrates this pattern in childhood stunting.
Figure 5: Trend in DPT3 Vaccination Coverage by Wealth Quintile, Nepal
0
10
20
30
40
50
60
70
80
90
1996 2001
Year
Pe
rce
nta
ge
Poorest Q2 Q3 Q4 Least poor
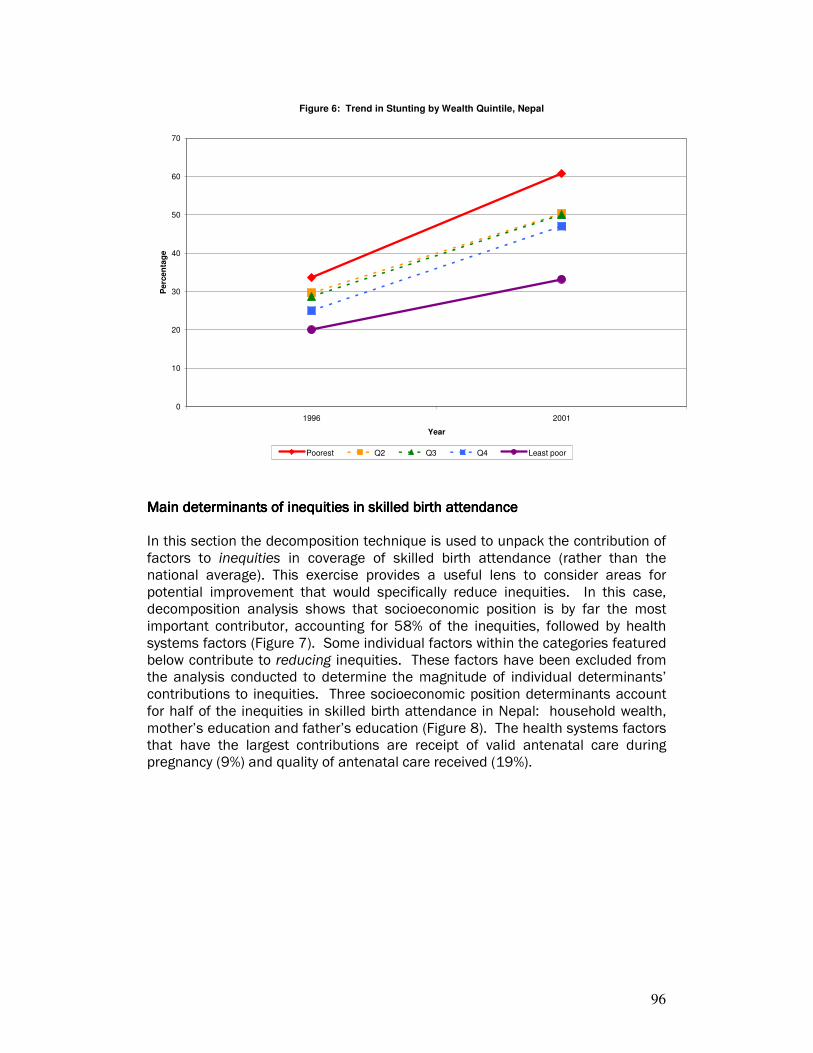
96
Figure 6: Trend in Stunting by Wealth Quintile, Nepal
0
10
20
30
40
50
60
70
1996 2001
Year
Pe
rce
nta
ge
Poorest Q2 Q3 Q4 Least poor
Main determinants of inequities in skilled birth attendanceMain determinants of inequities in skilled birth attendanceMain determinants of inequities in skilled birth attendanceMain determinants of inequities in skilled birth attendance In this section the decomposition technique is used to unpack the contribution of factors to inequities in coverage of skilled birth attendance (rather than the national average). This exercise provides a useful lens to consider areas for potential improvement that would specifically reduce inequities. In this case, decomposition analysis shows that socioeconomic position is by far the most important contributor, accounting for 58% of the inequities, followed by health systems factors (Figure 7). Some individual factors within the categories featured below contribute to reducing inequities. These factors have been excluded from the analysis conducted to determine the magnitude of individual determinants’ contributions to inequities. Three socioeconomic position determinants account for half of the inequities in skilled birth attendance in Nepal: household wealth, mother’s education and father’s education (Figure 8). The health systems factors that have the largest contributions are receipt of valid antenatal care during pregnancy (9%) and quality of antenatal care received (19%).
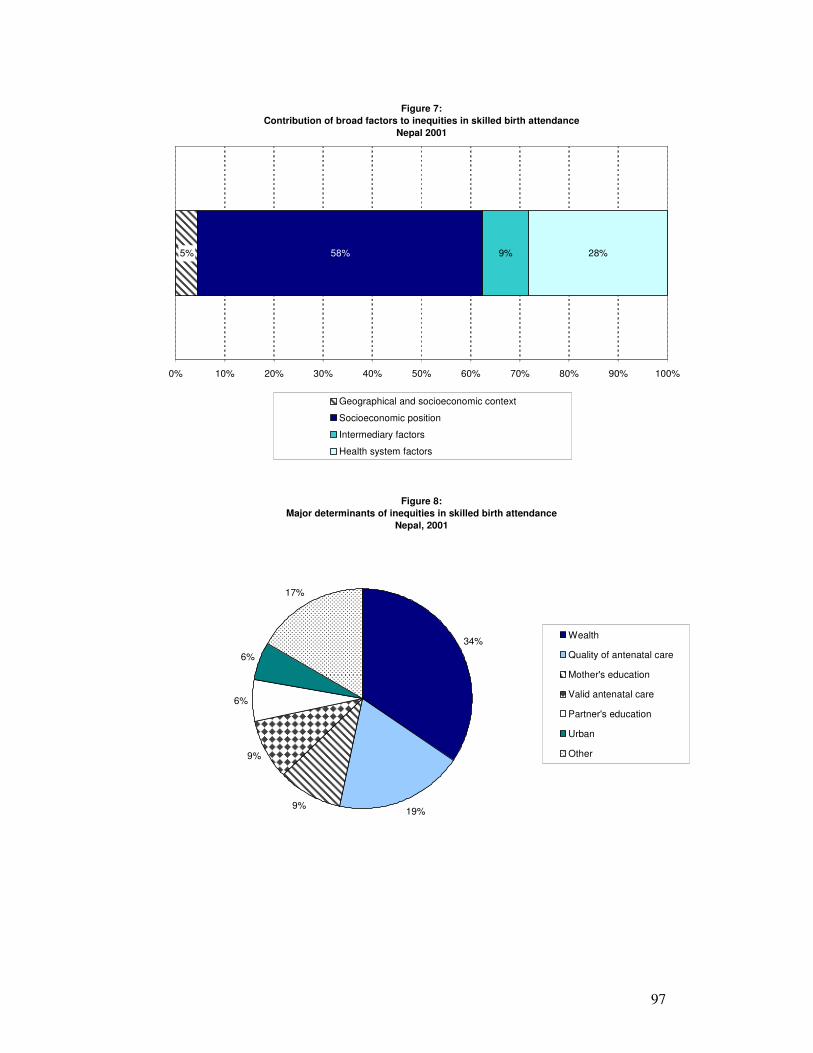
97
Figure 7:
Contribution of broad factors to inequities in skilled birth attendance
Nepal 2001
5% 58% 9% 28%
0% 10% 20% 30% 40% 50% 60% 70% 80% 90% 100%
Geographical and socioeconomic context
Socioeconomic position
Intermediary factors
Health system factors
Figure 8:
Major determinants of inequities in skilled birth attendance
Nepal, 2001
34%
19%9%
9%
6%
6%
17%
Wealth
Quality of antenatal care
Mother's education
Valid antenatal care
Partner's education
Urban
Other
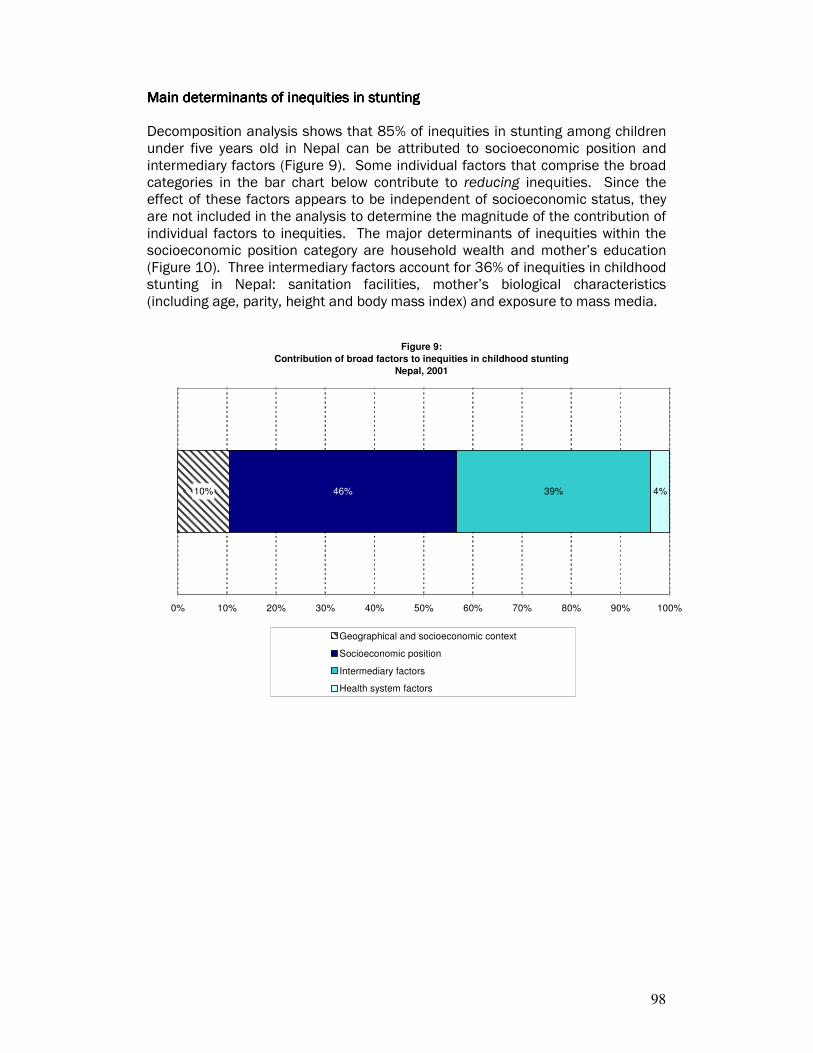
98
Main determinants of inequities in stuntingMain determinants of inequities in stuntingMain determinants of inequities in stuntingMain determinants of inequities in stunting Decomposition analysis shows that 85% of inequities in stunting among children under five years old in Nepal can be attributed to socioeconomic position and intermediary factors (Figure 9). Some individual factors that comprise the broad categories in the bar chart below contribute to reducing inequities. Since the effect of these factors appears to be independent of socioeconomic status, they are not included in the analysis to determine the magnitude of the contribution of individual factors to inequities. The major determinants of inequities within the socioeconomic position category are household wealth and mother’s education (Figure 10). Three intermediary factors account for 36% of inequities in childhood stunting in Nepal: sanitation facilities, mother’s biological characteristics (including age, parity, height and body mass index) and exposure to mass media.
Figure 9:
Contribution of broad factors to inequities in childhood stunting
Nepal, 2001
10% 46% 39% 4%
0% 10% 20% 30% 40% 50% 60% 70% 80% 90% 100%
Geographical and socioeconomic context
Socioeconomic position
Intermediary factors
Health system factors
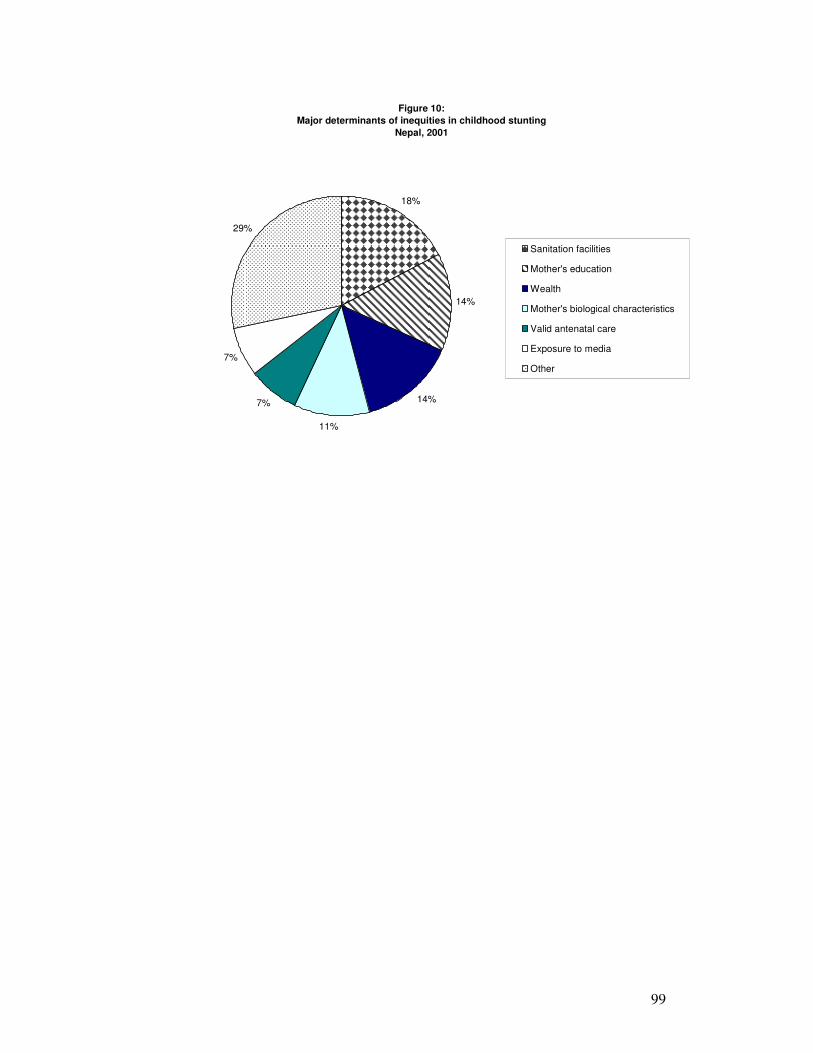
99
Figure 10:
Major determinants of inequities in childhood stunting
Nepal, 2001
18%
14%
14%
11%
7%
7%
29%
Sanitation facilities
Mother's education
Wealth
Mother's biological characteristics
Valid antenatal care
Exposure to media
Other

100
Sri LankaSri LankaSri LankaSri Lanka
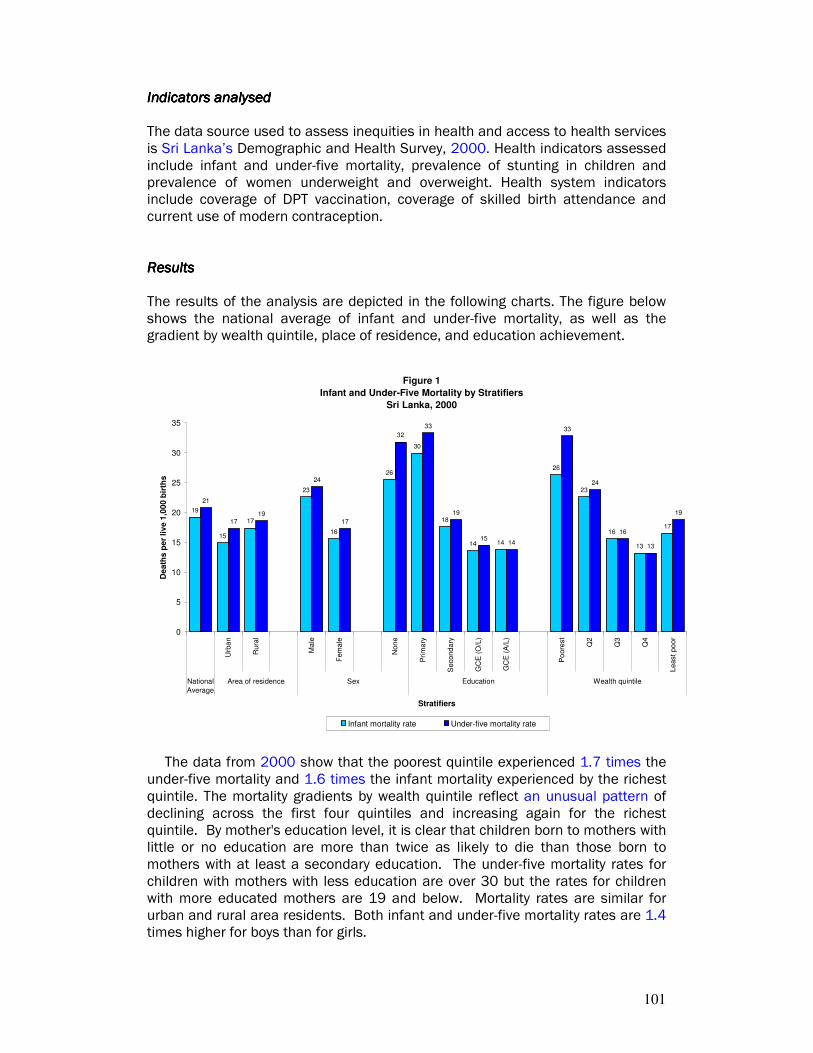
101
Indicators analysedIndicators analysedIndicators analysedIndicators analysed The data source used to assess inequities in health and access to health services is Sri Lanka’s Demographic and Health Survey, 2000. Health indicators assessed include infant and under-five mortality, prevalence of stunting in children and prevalence of women underweight and overweight. Health system indicators include coverage of DPT vaccination, coverage of skilled birth attendance and current use of modern contraception. ResultsResultsResultsResults The results of the analysis are depicted in the following charts. The figure below shows the national average of infant and under-five mortality, as well as the gradient by wealth quintile, place of residence, and education achievement.
Figure 1
Infant and Under-Five Mortality by Stratifiers
Sri Lanka, 2000
19
15
17
23
16
26
30
18
14 14
26
23
16
13
17
21
17
19
24
17
32
33
19
1514
33
24
16
13
19
0
5
10
15
20
25
30
35
Urb
an
Rura
l
Ma
le
Fem
ale
Non
e
Prim
ary
Secon
da
ry
GC
E (
O/L
)
GC
E (
A/L
)
Po
ore
st
Q2
Q3
Q4
Least
po
or
National
Average
Area of residence Sex Education Wealth quintile
Stratifiers
De
ath
s p
er
liv
e 1
,00
0 b
irth
s
Infant mortality rate Under-five mortality rate
The data from 2000 show that the poorest quintile experienced 1.7 times the under-five mortality and 1.6 times the infant mortality experienced by the richest quintile. The mortality gradients by wealth quintile reflect an unusual pattern of declining across the first four quintiles and increasing again for the richest quintile. By mother's education level, it is clear that children born to mothers with little or no education are more than twice as likely to die than those born to mothers with at least a secondary education. The under-five mortality rates for children with mothers with less education are over 30 but the rates for children with more educated mothers are 19 and below. Mortality rates are similar for urban and rural area residents. Both infant and under-five mortality rates are 1.4 times higher for boys than for girls.
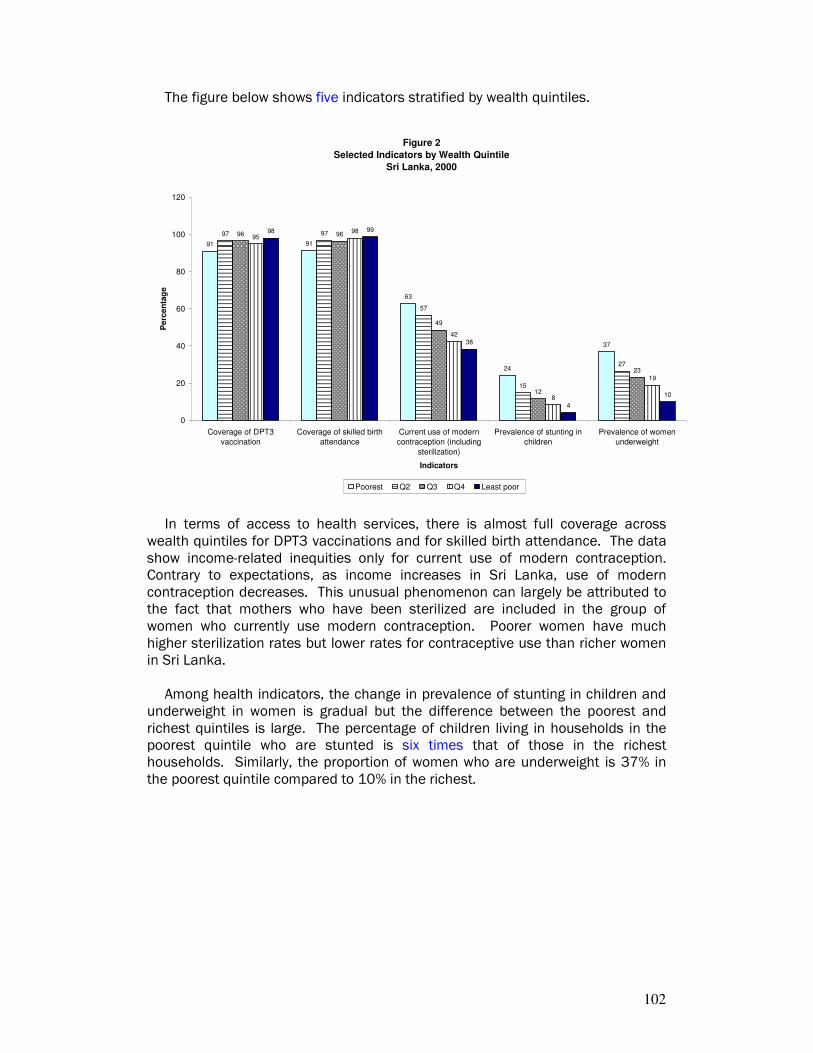
102
The figure below shows five indicators stratified by wealth quintiles.
Figure 2
Selected Indicators by Wealth Quintile
Sri Lanka, 2000
91 91
63
24
37
97 97
57
15
27
96 96
49
12
23
9598
42
8
19
98 99
38
4
10
0
20
40
60
80
100
120
Coverage of DPT3
vaccination
Coverage of skilled birth
attendance
Current use of modern
contraception (including
sterilization)
Prevalence of stunting in
children
Prevalence of women
underweight
Indicators
Pe
rce
nta
ge
Poorest Q2 Q3 Q4 Least poor
In terms of access to health services, there is almost full coverage across wealth quintiles for DPT3 vaccinations and for skilled birth attendance. The data show income-related inequities only for current use of modern contraception. Contrary to expectations, as income increases in Sri Lanka, use of modern contraception decreases. This unusual phenomenon can largely be attributed to the fact that mothers who have been sterilized are included in the group of women who currently use modern contraception. Poorer women have much higher sterilization rates but lower rates for contraceptive use than richer women in Sri Lanka.
Among health indicators, the change in prevalence of stunting in children and underweight in women is gradual but the difference between the poorest and richest quintiles is large. The percentage of children living in households in the poorest quintile who are stunted is six times that of those in the richest households. Similarly, the proportion of women who are underweight is 37% in the poorest quintile compared to 10% in the richest.
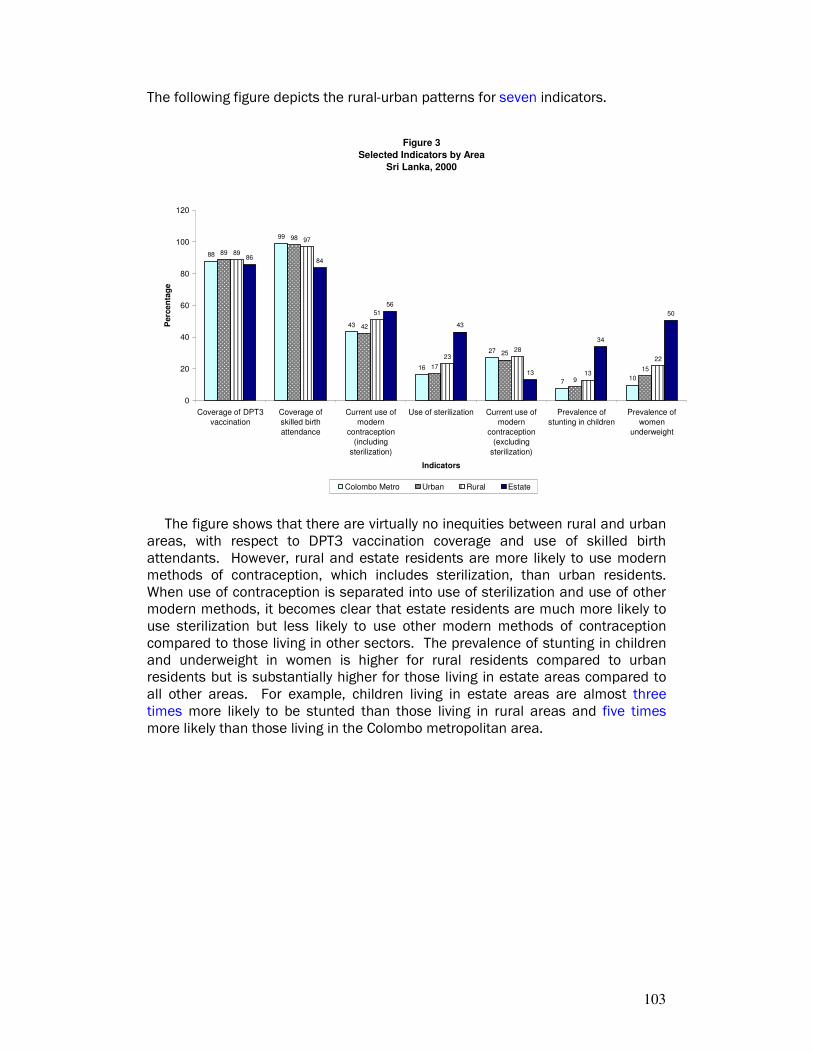
103
The following figure depicts the rural-urban patterns for seven indicators.
Figure 3
Selected Indicators by Area
Sri Lanka, 2000
88
99
43
16
27
710
89
98
42
17
25
9
15
89
97
51
2328
13
22
8684
56
43
13
34
50
0
20
40
60
80
100
120
Coverage of DPT3
vaccination
Coverage of
skilled birth
attendance
Current use of
modern
contraception
(including
sterilization)
Use of sterilization Current use of
modern
contraception
(excluding
sterilization)
Prevalence of
stunting in children
Prevalence of
women
underweight
Indicators
Perc
en
tag
e
Colombo Metro Urban Rural Estate
The figure shows that there are virtually no inequities between rural and urban areas, with respect to DPT3 vaccination coverage and use of skilled birth attendants. However, rural and estate residents are more likely to use modern methods of contraception, which includes sterilization, than urban residents. When use of contraception is separated into use of sterilization and use of other modern methods, it becomes clear that estate residents are much more likely to use sterilization but less likely to use other modern methods of contraception compared to those living in other sectors. The prevalence of stunting in children and underweight in women is higher for rural residents compared to urban residents but is substantially higher for those living in estate areas compared to all other areas. For example, children living in estate areas are almost three times more likely to be stunted than those living in rural areas and five times more likely than those living in the Colombo metropolitan area.

104
The following figure shows the seven selected indicators by education achievement of the mother.
Figure 4
Selected Indicators by Education
Sri Lanka, 2000
8683
65
50
15
3638
8891
62
45
17
24
31
89
97
52
23
29
13
20
89
98
39
9
30
10
17
85
98
34
5
28
5
13
0
20
40
60
80
100
120
Coverage of DPT3
vaccination
Coverage of skilled
birth attendance
Current use of
modern
contraception
(including
sterilization)
Use of sterilization Current use of
modern
contraception
(excluding
sterilization)
Prevalence of
stunting in children
Prevalence of
women
underweight
Indicators
Pe
rce
nta
ge
None Primary Secondary + GCE (O/L) GCE (A/L)
Educational achievement is generally an important factor associated with inequities in health outcomes. However, for use of health systems in Sri Lanka, it is not as great a determinant. There are few differences across education categories with respect to DPT3 vaccination coverage and use of skilled birth attendants. However, there is a gradual decrease in use of modern contraception as the level of education attained increases. Women with no education are 1.9 times more likely to use modern contraception than women who have completed their G.C.E. (A/L). Again, this counterintuitive finding is due to the fact that less educated women are more likely to be sterilized. Women with a secondary education are half as likely to be sterilized but twice as likely to use other modern methods of contraception as less educated women. Although the poor are actually less likely to use short-term contraceptive methods, the sterilization gap dominates the calculations of percentage of women who use modern contraception.
Inequities in health outcomes are strongly related to educational attainment. Children of mothers with no education are 7 times more likely to be stunted than those whose mothers have completed their G.C.E. (A/L). Similarly, 38% of uneducated women are underweight compared to 13% of the most educated women.
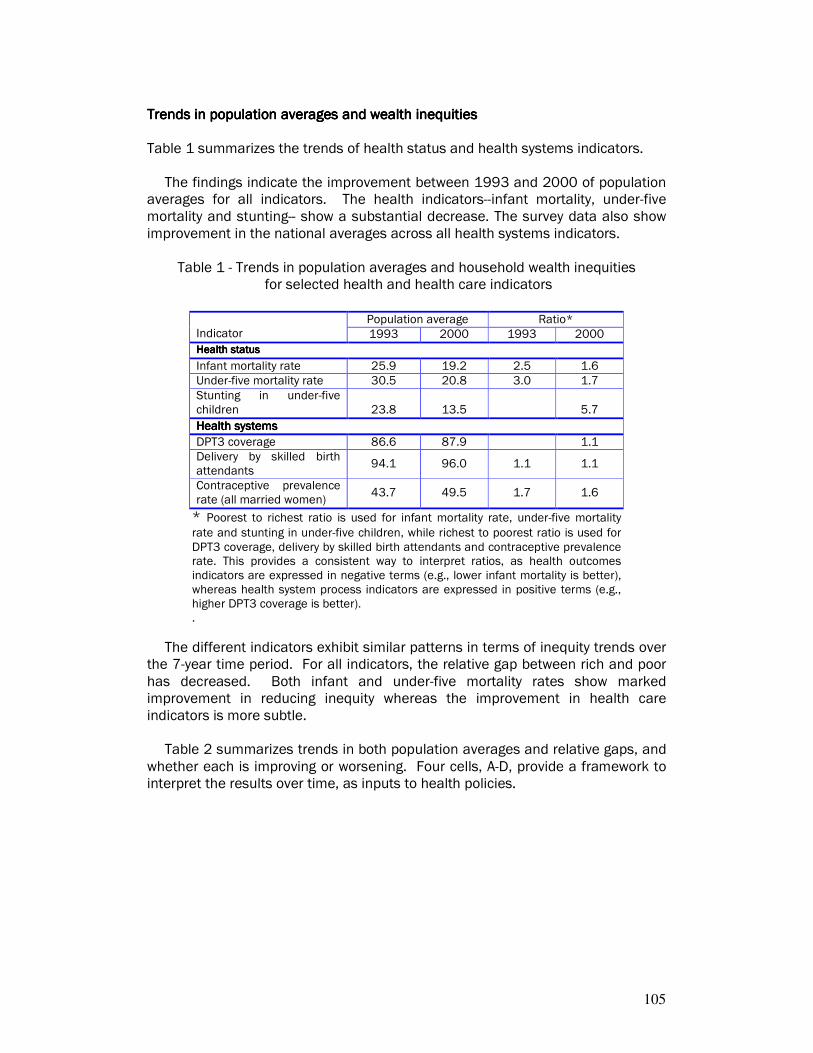
105
Trends in population averages and wealth Trends in population averages and wealth Trends in population averages and wealth Trends in population averages and wealth inequitiesinequitiesinequitiesinequities Table 1 summarizes the trends of health status and health systems indicators.
The findings indicate the improvement between 1993 and 2000 of population averages for all indicators. The health indicators--infant mortality, under-five mortality and stunting-- show a substantial decrease. The survey data also show improvement in the national averages across all health systems indicators.
Table 1 - Trends in population averages and household wealth inequities for selected health and health care indicators
Population average Ratio*
Indicator 1993 2000 1993 2000
Health statusHealth statusHealth statusHealth status
Infant mortality rate 25.9 19.2 2.5 1.6
Under-five mortality rate 30.5 20.8 3.0 1.7
Stunting in under-five children 23.8 13.5 5.7
Health systemsHealth systemsHealth systemsHealth systems
DPT3 coverage 86.6 87.9 1.1
Delivery by skilled birth attendants
94.1 96.0 1.1 1.1
Contraceptive prevalence rate (all married women)
43.7 49.5 1.7 1.6
* Poorest to richest ratio is used for infant mortality rate, under-five mortality
rate and stunting in under-five children, while richest to poorest ratio is used for DPT3 coverage, delivery by skilled birth attendants and contraceptive prevalence rate. This provides a consistent way to interpret ratios, as health outcomes indicators are expressed in negative terms (e.g., lower infant mortality is better), whereas health system process indicators are expressed in positive terms (e.g., higher DPT3 coverage is better). .
The different indicators exhibit similar patterns in terms of inequity trends over the 7-year time period. For all indicators, the relative gap between rich and poor has decreased. Both infant and under-five mortality rates show marked improvement in reducing inequity whereas the improvement in health care indicators is more subtle.
Table 2 summarizes trends in both population averages and relative gaps, and whether each is improving or worsening. Four cells, A-D, provide a framework to interpret the results over time, as inputs to health policies.
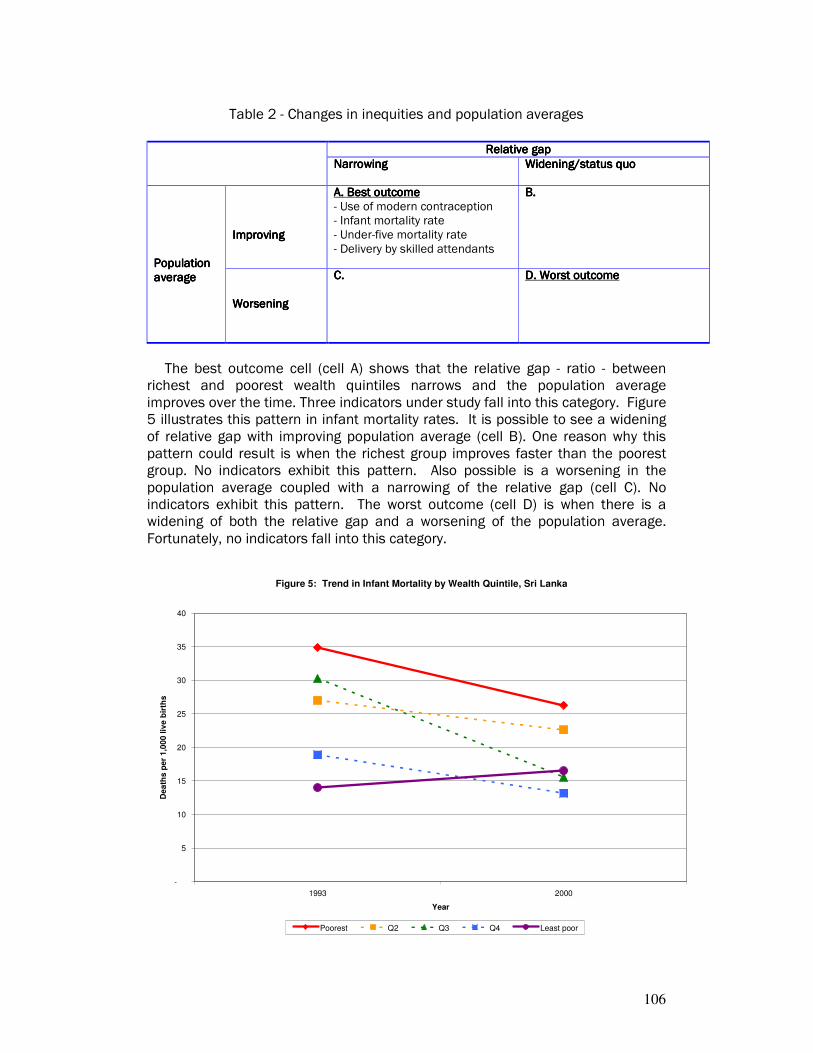
106
Table 2 - Changes in inequities and population averages
Relative gapRelative gapRelative gapRelative gap
NarrowingNarrowingNarrowingNarrowing Widening/status quoWidening/status quoWidening/status quoWidening/status quo
ImprovingImprovingImprovingImproving
A. Best outcomeA. Best outcomeA. Best outcomeA. Best outcome - Use of modern contraception - Infant mortality rate - Under-five mortality rate - Delivery by skilled attendants
B. B. B. B.
Population Population Population Population averageaverageaverageaverage
WorseningWorseningWorseningWorsening
C.C.C.C.
D. Worst outcomeD. Worst outcomeD. Worst outcomeD. Worst outcome
The best outcome cell (cell A) shows that the relative gap - ratio - between
richest and poorest wealth quintiles narrows and the population average improves over the time. Three indicators under study fall into this category. Figure 5 illustrates this pattern in infant mortality rates. It is possible to see a widening of relative gap with improving population average (cell B). One reason why this pattern could result is when the richest group improves faster than the poorest group. No indicators exhibit this pattern. Also possible is a worsening in the population average coupled with a narrowing of the relative gap (cell C). No indicators exhibit this pattern. The worst outcome (cell D) is when there is a widening of both the relative gap and a worsening of the population average. Fortunately, no indicators fall into this category.
Figure 5: Trend in Infant Mortality by Wealth Quintile, Sri Lanka
-
5
10
15
20
25
30
35
40
1993 2000
Year
De
ath
s p
er
1,0
00
liv
e b
irth
s
Poorest Q2 Q3 Q4 Least poor
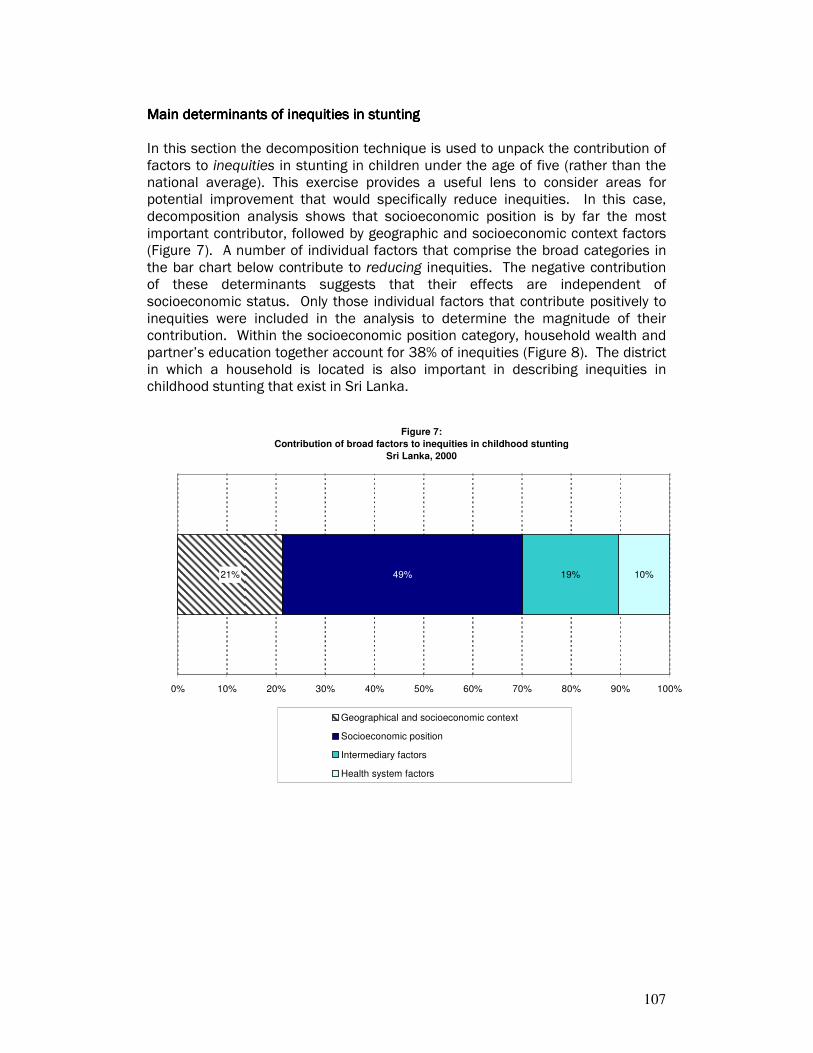
107
Main determinants of inequities in stuntingMain determinants of inequities in stuntingMain determinants of inequities in stuntingMain determinants of inequities in stunting In this section the decomposition technique is used to unpack the contribution of factors to inequities in stunting in children under the age of five (rather than the national average). This exercise provides a useful lens to consider areas for potential improvement that would specifically reduce inequities. In this case, decomposition analysis shows that socioeconomic position is by far the most important contributor, followed by geographic and socioeconomic context factors (Figure 7). A number of individual factors that comprise the broad categories in the bar chart below contribute to reducing inequities. The negative contribution of these determinants suggests that their effects are independent of socioeconomic status. Only those individual factors that contribute positively to inequities were included in the analysis to determine the magnitude of their contribution. Within the socioeconomic position category, household wealth and partner’s education together account for 38% of inequities (Figure 8). The district in which a household is located is also important in describing inequities in childhood stunting that exist in Sri Lanka.
Figure 7:
Contribution of broad factors to inequities in childhood stunting
Sri Lanka, 2000
21% 49% 19% 10%
0% 10% 20% 30% 40% 50% 60% 70% 80% 90% 100%
Geographical and socioeconomic context
Socioeconomic position
Intermediary factors
Health system factors
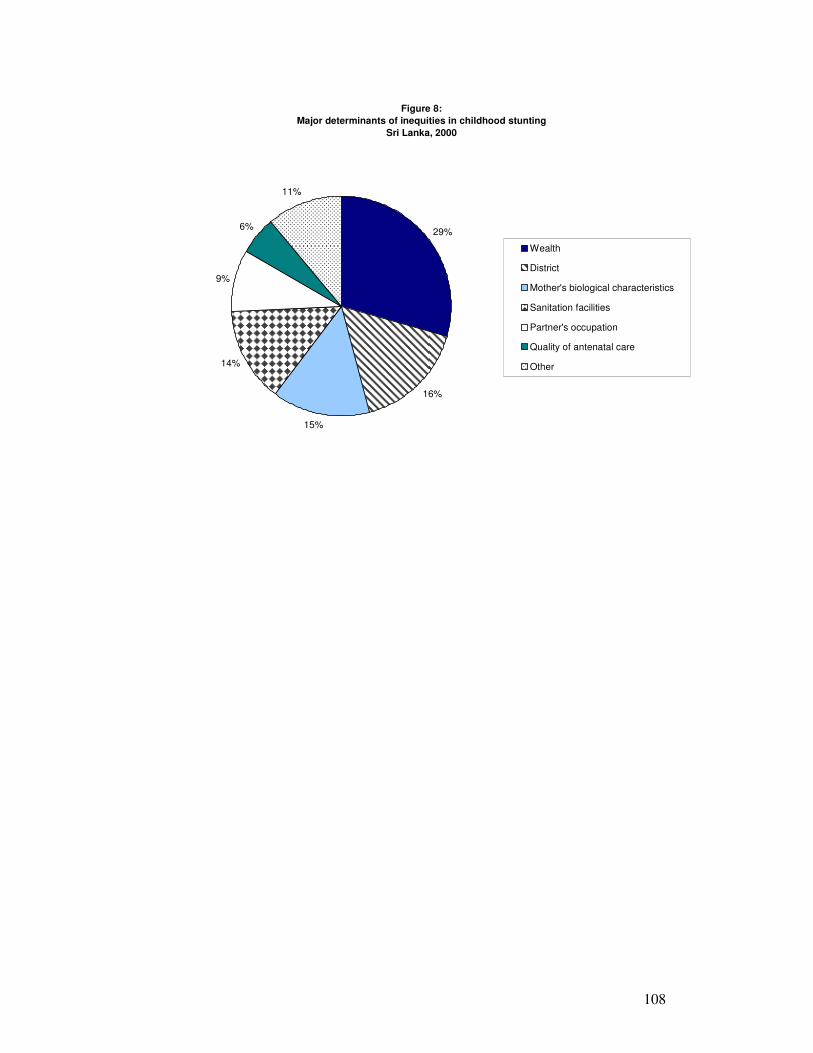
108
Figure 8:
Major determinants of inequities in childhood stunting
Sri Lanka, 2000
29%
16%
15%
14%
9%
6%
11%
Wealth
District
Mother's biological characteristics
Sanitation facilities
Partner's occupation
Quality of antenatal care
Other

109
STATISTICAL ANNEXSTATISTICAL ANNEXSTATISTICAL ANNEXSTATISTICAL ANNEX I I I I. INEQUITIES IN HEAL. INEQUITIES IN HEAL. INEQUITIES IN HEAL. INEQUITIES IN HEALTH DETERMINANTS AND TH DETERMINANTS AND TH DETERMINANTS AND TH DETERMINANTS AND OUTCOMES BY OUTCOMES BY OUTCOMES BY OUTCOMES BY EQUITY STRATIFIERSEQUITY STRATIFIERSEQUITY STRATIFIERSEQUITY STRATIFIERS
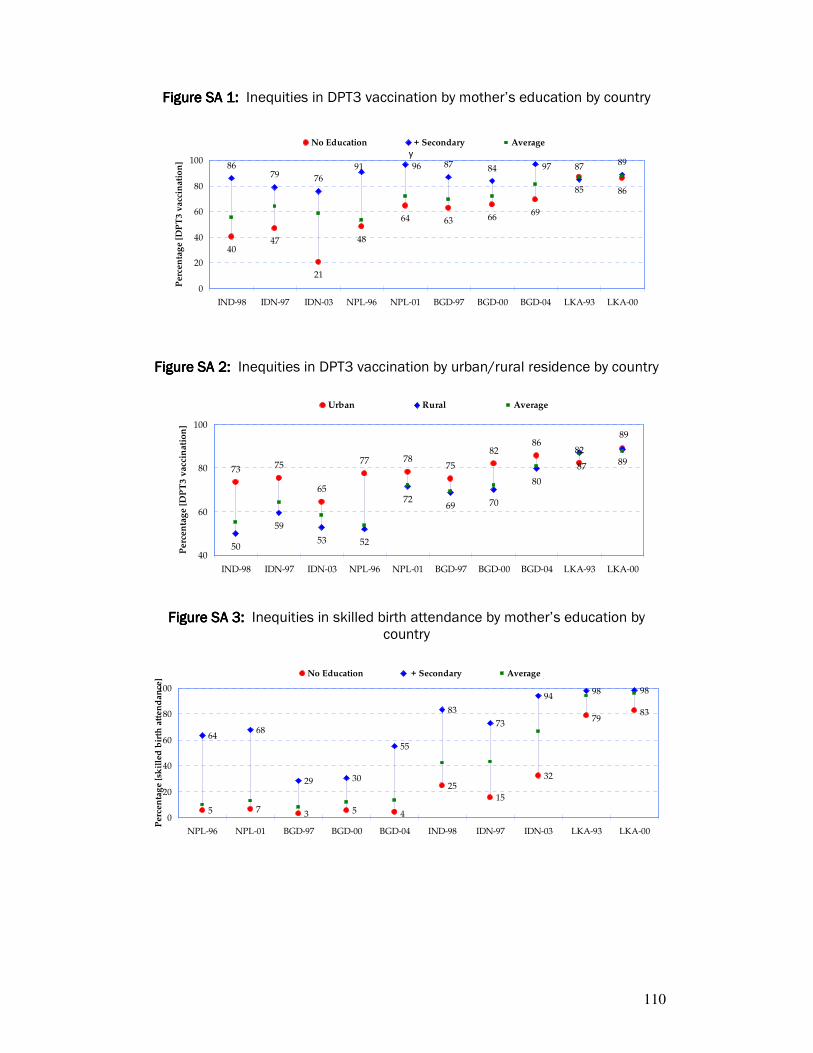
110
Figure SA 1: Figure SA 1: Figure SA 1: Figure SA 1: Inequities in DPT3 vaccination by mother’s education by country
4047
21
48
64 63 6669
8679 76
87 84
8685
87 8991 96 97
0
20
40
60
80
100
IND-98 IDN-97 IDN-03 NPL-96 NPL-01 BGD-97 BGD-00 BGD-04 LKA-93 LKA-00
Perc
en
tag
e [
DP
T3
va
ccin
ati
on
]
No Education + Secondary Average
y
Figure SA 2: Figure SA 2: Figure SA 2: Figure SA 2: Inequities in DPT3 vaccination by urban/rural residence by country
73 75
65
77 7875
8286
82
50
59
53 52
7269 70
80
89
89
87
40
60
80
100
IND-98 IDN-97 IDN-03 NPL-96 NPL-01 BGD-97 BGD-00 BGD-04 LKA-93 LKA-00
Pe
rce
nta
ge
[D
PT
3 v
acc
ina
tio
n]
Urban Rural Average
Figure SA 3: Figure SA 3: Figure SA 3: Figure SA 3: Inequities in skilled birth attendance by mother’s education by
country
5 7 3 5
25
15
32
6468
29 30
55
83
73
9498 98
7983
40
20
40
60
80
100
NPL-96 NPL-01 BGD-97 BGD-00 BGD-04 IND-98 IDN-97 IDN-03 LKA-93 LKA-00
Perc
en
tag
e [
skil
led
bir
th a
tten
dan
ce]
No Education + Secondary Average
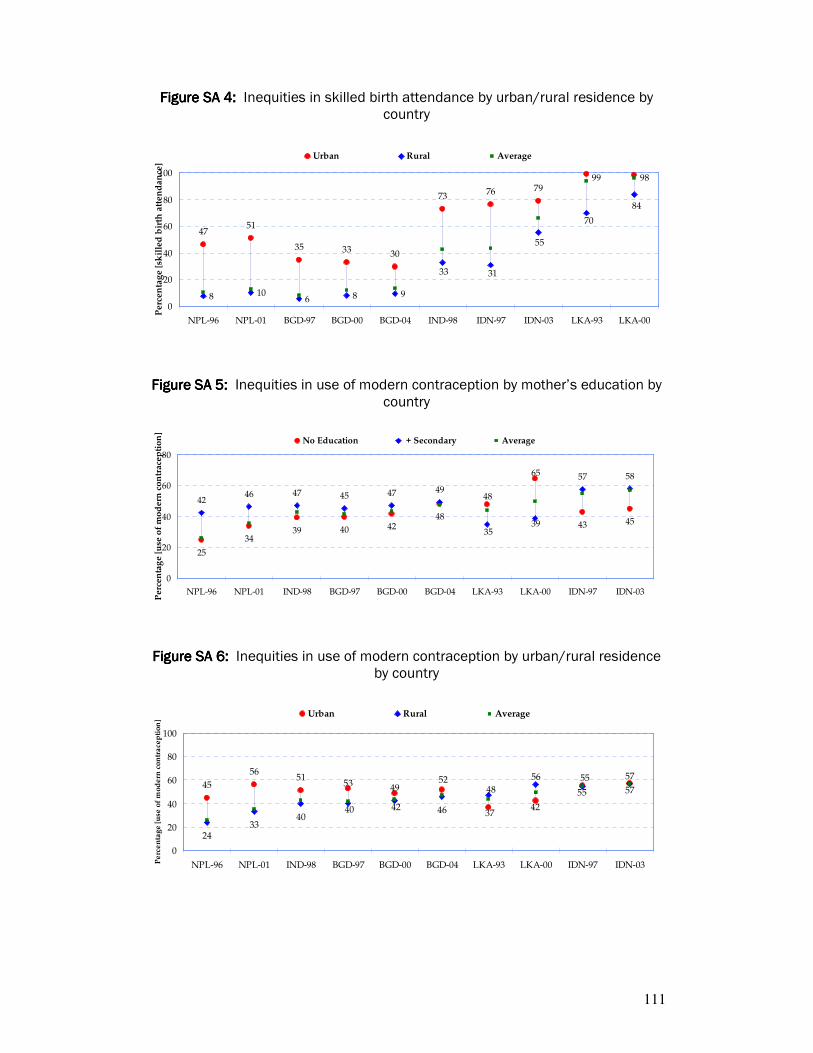
111
Figure SA 4: Figure SA 4: Figure SA 4: Figure SA 4: Inequities in skilled birth attendance by urban/rural residence by country
4751
35 33
73 76 79
8 106 8 9
99 98
30
33 31
55
70
84
0
20
40
60
80
100
NPL-96 NPL-01 BGD-97 BGD-00 BGD-04 IND-98 IDN-97 IDN-03 LKA-93 LKA-00
Pe
rce
nta
ge
[sk
ille
d b
irth
att
en
da
nce
]Urban Rural Average
Figure SAFigure SAFigure SAFigure SA 5: 5: 5: 5: Inequities in use of modern contraception by mother’s education by country
25
3439
4246 47
48
65
43 4540 42
4849
39
57 58
45 47
35
0
20
40
60
80
NPL-96 NPL-01 IND-98 BGD-97 BGD-00 BGD-04 LKA-93 LKA-00 IDN-97 IDN-03
Pe
rce
nta
ge
[u
se o
f m
od
ern
co
ntr
ace
pti
on
]
No Education + Secondary Average
Figure SAFigure SAFigure SAFigure SA 6: 6: 6: 6: Inequities in use of modern contraception by urban/rural residence by country
45
5651
2433
40
52
42
55 5753 49
3746
56
55 57
40 42
48
0
20
40
60
80
100
NPL-96 NPL-01 IND-98 BGD-97 BGD-00 BGD-04 LKA-93 LKA-00 IDN-97 IDN-03Pe
rce
nta
ge
[u
se o
f m
od
ern
co
ntr
ace
pti
on
]
Urban Rural Average
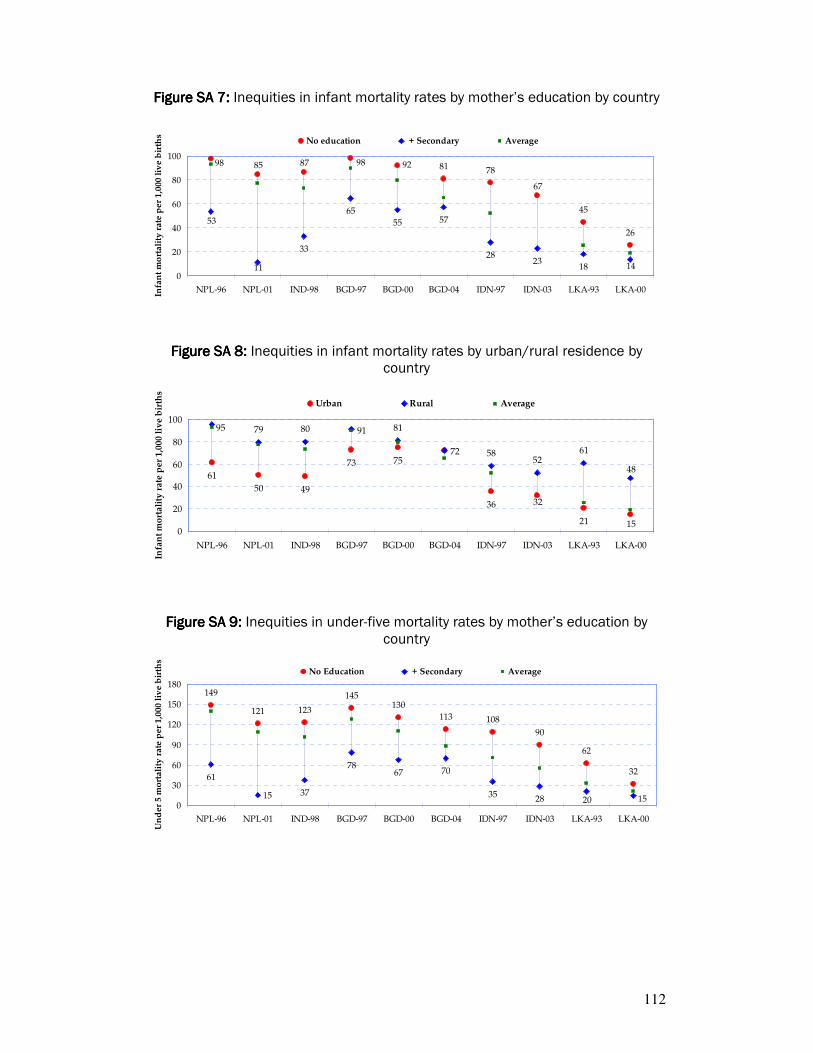
112
Figure SAFigure SAFigure SAFigure SA 7: 7: 7: 7: Inequities in infant mortality rates by mother’s education by country
81 78
45
26
33
6557
2823
18
67
85 87 929898
14
53
11
55
0
20
40
60
80
100
NPL-96 NPL-01 IND-98 BGD-97 BGD-00 BGD-04 IDN-97 IDN-03 LKA-93 LKA-00
Infa
nt
mo
rta
lity
ra
te p
er
1,0
00
liv
e b
irth
s
No education + Secondary Average
Figure SAFigure SAFigure SAFigure SA 8: 8: 8: 8: Inequities in infant mortality rates by urban/rural residence by country
61
50 49
73 75
36
21
80
5852
6172
15
32
95 79 8191
48
0
20
40
60
80
100
NPL-96 NPL-01 IND-98 BGD-97 BGD-00 BGD-04 IDN-97 IDN-03 LKA-93 LKA-00
Infa
nt
mo
rta
lity
ra
te p
er
1,0
00
liv
e b
irth
s
Urban Rural Average
Figure SAFigure SAFigure SAFigure SA 9:9:9:9: Inequities in under-five mortality rates by mother’s education by country
149
121 123130
113 108
90
62
61
37
7867 70
35 28
32
145
1520150
30
60
90
120
150
180
NPL-96 NPL-01 IND-98 BGD-97 BGD-00 BGD-04 IDN-97 IDN-03 LKA-93 LKA-00
Un
de
r 5
mo
rta
lity
ra
te p
er
1,0
00
liv
e b
irth
s
No Education + Secondary Average
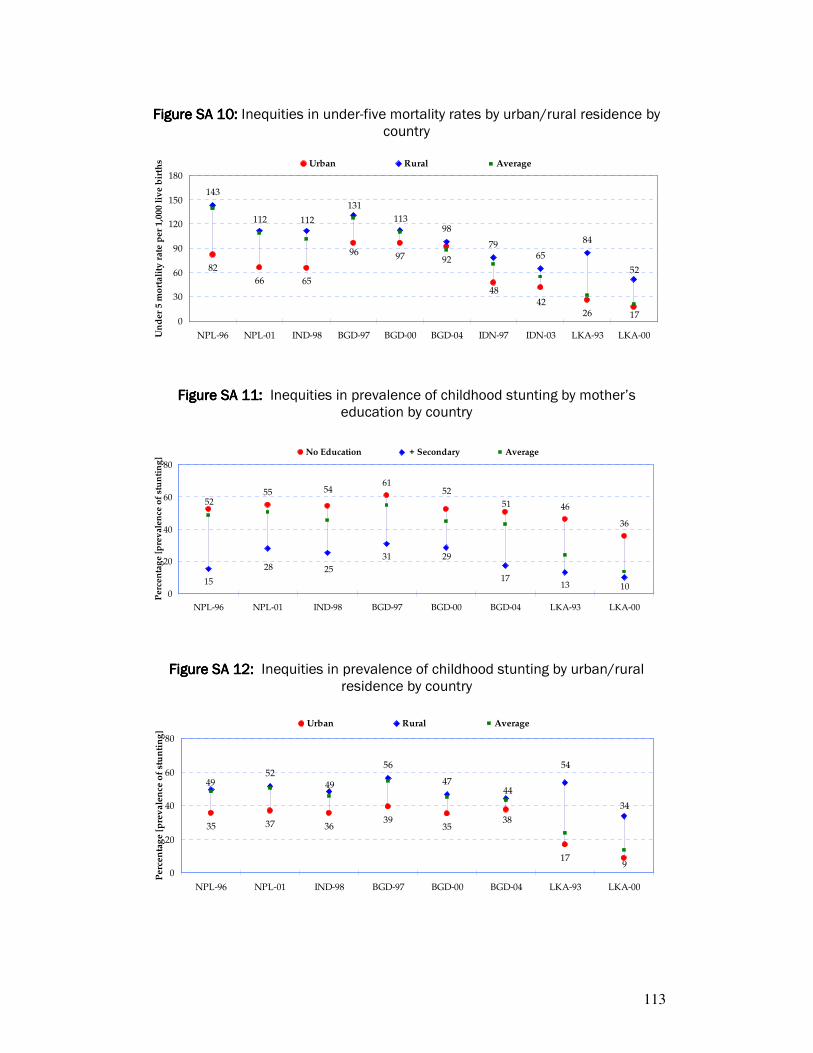
113
Figure SAFigure SAFigure SAFigure SA 10: 10: 10: 10: Inequities in under-five mortality rates by urban/rural residence by
country
82
66 65
97 92
26
143
98
7965
84
4248
17
96
131
112112 113
52
0
30
60
90
120
150
180
NPL-96 NPL-01 IND-98 BGD-97 BGD-00 BGD-04 IDN-97 IDN-03 LKA-93 LKA-00Un
der
5 m
ort
ali
ty r
ate
per
1,0
00 l
ive b
irth
s Urban Rural Average
Figure SA 11: Figure SA 11: Figure SA 11: Figure SA 11: Inequities in prevalence of childhood stunting by mother’s education by country
5561
46
31
13
5254
52
36
51
2829
1015 17
25
0
20
40
60
80
NPL-96 NPL-01 IND-98 BGD-97 BGD-00 BGD-04 LKA-93 LKA-00
Perc
en
tag
e [
pre
vale
nce
of
stu
nti
ng
]
No Education + Secondary Average
Figure SA 12: Figure SA 12: Figure SA 12: Figure SA 12: Inequities in prevalence of childhood stunting by urban/rural residence by country
35 37 3639
35
17
5256
47
38
9
4944
49
34
54
0
20
40
60
80
NPL-96 NPL-01 IND-98 BGD-97 BGD-00 BGD-04 LKA-93 LKA-00
Perc
en
tag
e [
pre
va
len
ce o
f st
un
tin
g]
Urban Rural Average
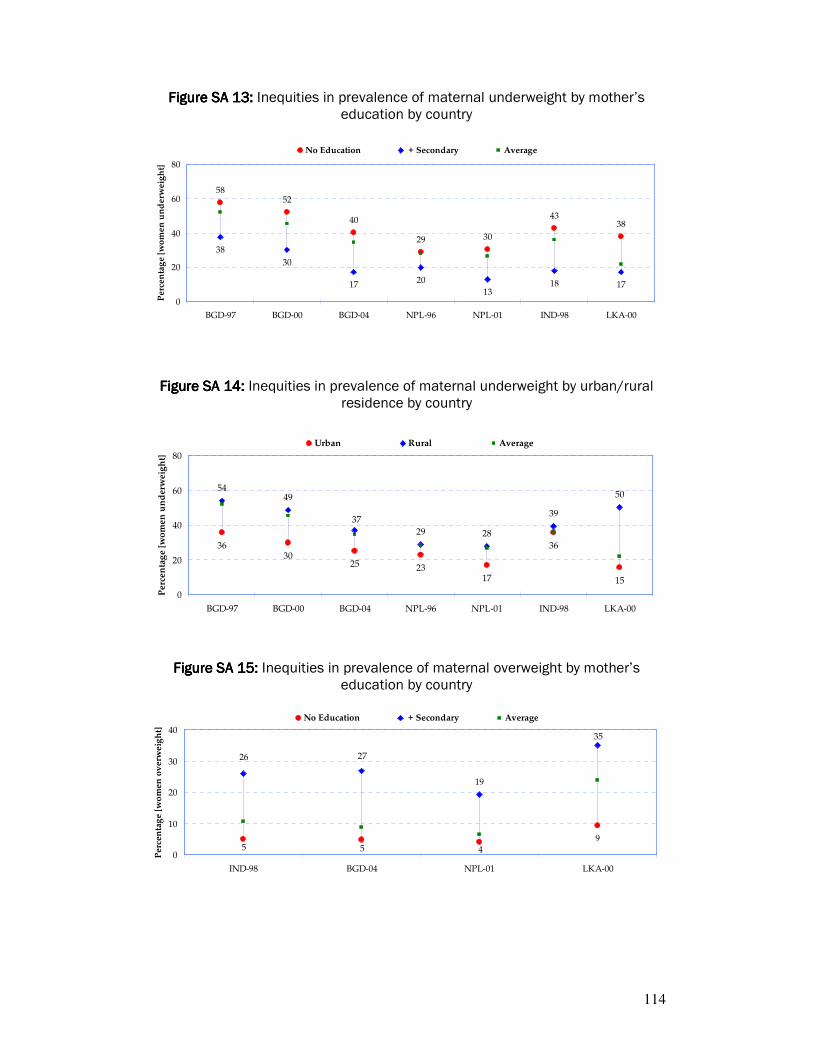
114
Figure SAFigure SAFigure SAFigure SA 13: 13: 13: 13: Inequities in prevalence of maternal underweight by mother’s education by country
5852
40
29 30
4338
38
30
20
1318 1717
0
20
40
60
80
BGD-97 BGD-00 BGD-04 NPL-96 NPL-01 IND-98 LKA-00
Pe
rce
nta
ge
[wo
me
n u
nd
erw
eig
ht]
No Education + Secondary Average
Figure SA 14: Figure SA 14: Figure SA 14: Figure SA 14: Inequities in prevalence of maternal underweight by urban/rural residence by country
3630
25 2317
36
15
5449
29 28
39
50
37
0
20
40
60
80
BGD-97 BGD-00 BGD-04 NPL-96 NPL-01 IND-98 LKA-00
Pe
rce
nta
ge
[wo
me
n u
nd
erw
eig
ht]
Urban Rural Average
Figure SAFigure SAFigure SAFigure SA 15: 15: 15: 15: Inequities in prevalence of maternal overweight by mother’s education by country
95 5 4
35
26
19
27
0
10
20
30
40
IND-98 BGD-04 NPL-01 LKA-00
Perc
en
tag
e [
wo
men
ov
erw
eig
ht]
No Education + Secondary Average
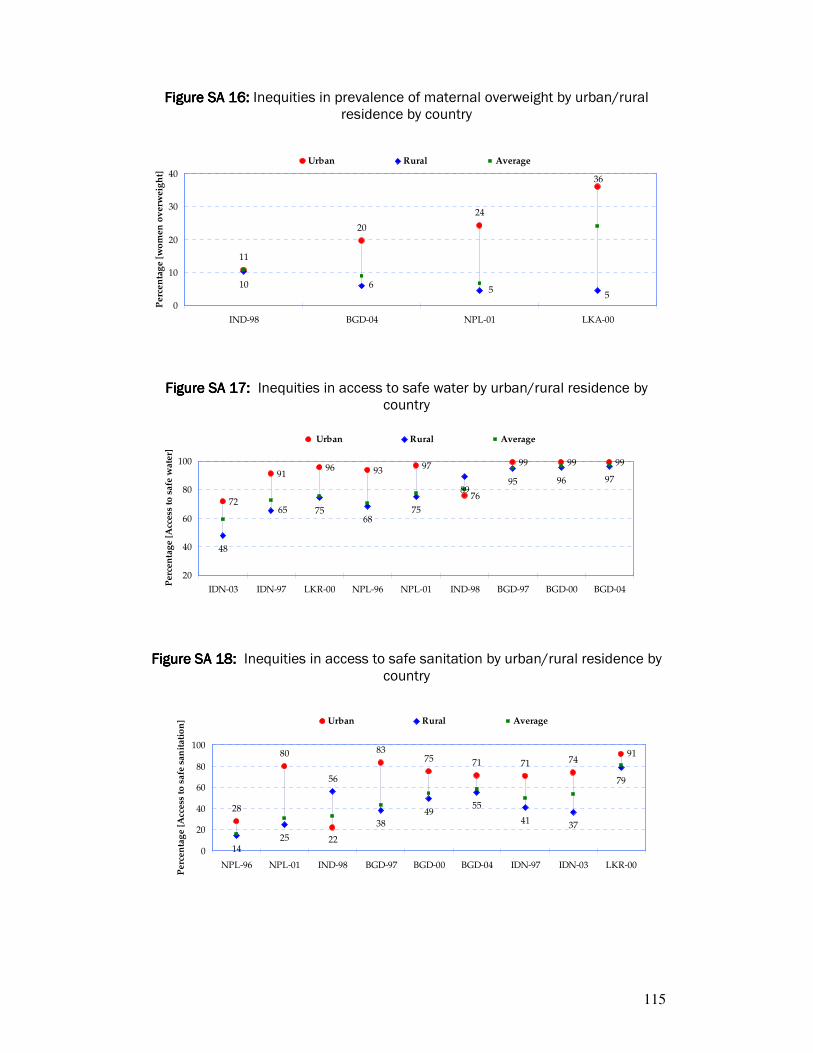
115
Figure SAFigure SAFigure SAFigure SA 16: 16: 16: 16: Inequities in prevalence of maternal overweight by urban/rural residence by country
11
20
24
10
36
55
6
0
10
20
30
40
IND-98 BGD-04 NPL-01 LKA-00
Pe
rce
nta
ge
[w
om
en
ov
erw
eig
ht]
Urban Rural Average
Figure SA 17: Figure SA 17: Figure SA 17: Figure SA 17: Inequities in access to safe water by urban/rural residence by
country
96 93 97
76
99 99 99
48
75
8995 96
72
91
687565
97
20
40
60
80
100
IDN-03 IDN-97 LKR-00 NPL-96 NPL-01 IND-98 BGD-97 BGD-00 BGD-04
Pe
rce
nta
ge
[A
cce
ss t
o s
afe
wa
ter]
Urban Rural Average
Figure SA 18: Figure SA 18: Figure SA 18: Figure SA 18: Inequities in access to safe sanitation by urban/rural residence by country
75 71 71 74
4955
41 37
9183
22
80
28
7956
2514
38
0
20
40
60
80
100
NPL-96 NPL-01 IND-98 BGD-97 BGD-00 BGD-04 IDN-97 IDN-03 LKR-00
Pe
rce
nta
ge
[A
cce
ss t
o s
afe
sa
nit
ati
on
] Urban Rural Average
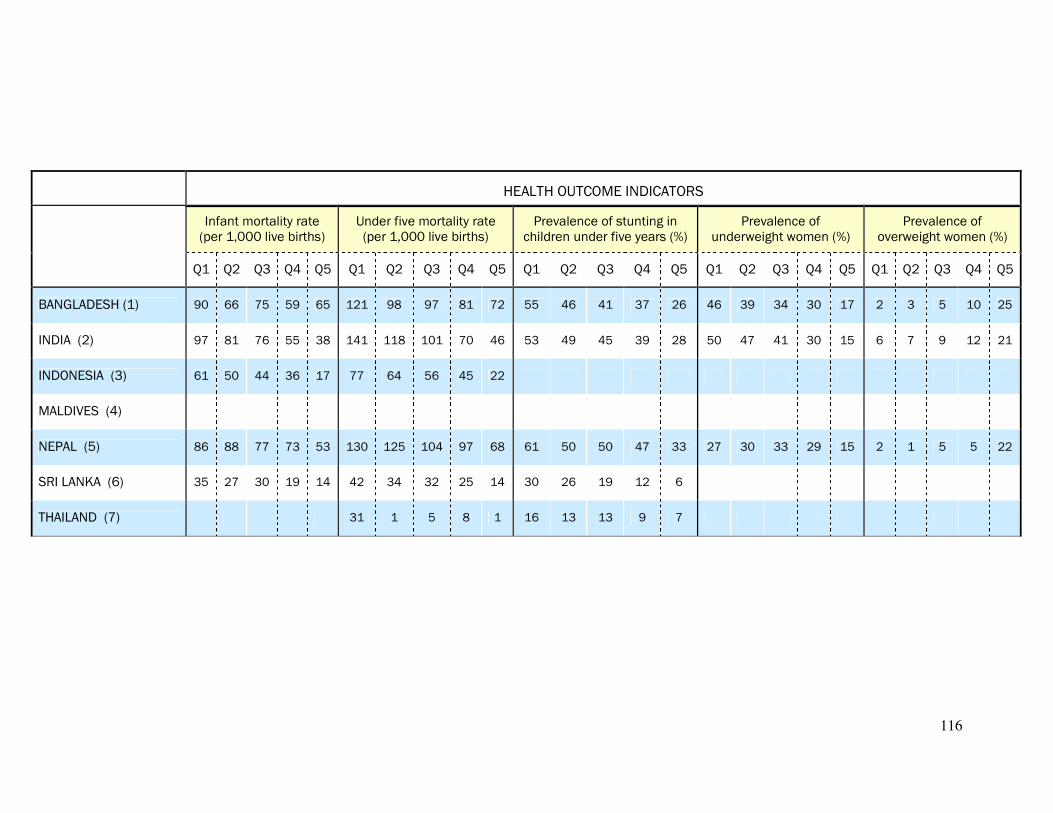
116
HEALTH OUTCOME INDICATORS
Infant mortality rate (per 1,000 live births)
Under five mortality rate (per 1,000 live births)
Prevalence of stunting in children under five years (%)
Prevalence of underweight women (%)
Prevalence of overweight women (%)
Q1 Q2 Q3 Q4 Q5 Q1 Q2 Q3 Q4 Q5 Q1 Q2 Q3 Q4 Q5 Q1 Q2 Q3 Q4 Q5 Q1 Q2 Q3 Q4 Q5
BANGLADESH (1) 90 66 75 59 65 121 98 97 81 72 55 46 41 37 26 46 39 34 30 17 2 3 5 10 25
INDIA (2) 97 81 76 55 38 141 118 101 70 46 53 49 45 39 28 50 47 41 30 15 6 7 9 12 21
INDONESIA (3) 61 50 44 36 17 77 64 56 45 22
MALDIVES (4)
NEPAL (5) 86 88 77 73 53 130 125 104 97 68 61 50 50 47 33 27 30 33 29 15 2 1 5 5 22
SRI LANKA (6) 35 27 30 19 14 42 34 32 25 14 30 26 19 12 6
THAILAND (7) 31 1 5 8 1 16 13 13 9 7
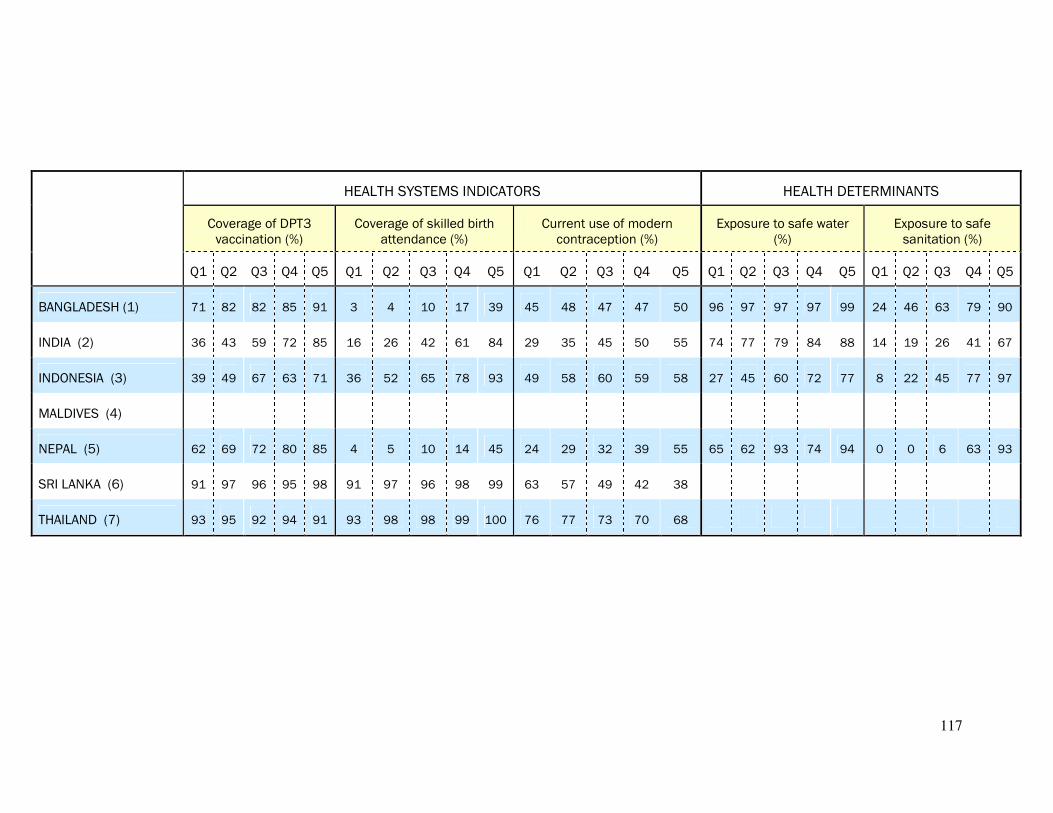
117
HEALTH SYSTEMS INDICATORS HEALTH DETERMINANTS
Coverage of DPT3 vaccination (%)
Coverage of skilled birth attendance (%)
Current use of modern contraception (%)
Exposure to safe water (%)
Exposure to safe sanitation (%)
Q1 Q2 Q3 Q4 Q5 Q1 Q2 Q3 Q4 Q5 Q1 Q2 Q3 Q4 Q5 Q1 Q2 Q3 Q4 Q5 Q1 Q2 Q3 Q4 Q5
BANGLADESH (1) 71 82 82 85 91 3 4 10 17 39 45 48 47 47 50 96 97 97 97 99 24 46 63 79 90
INDIA (2) 36 43 59 72 85 16 26 42 61 84 29 35 45 50 55 74 77 79 84 88 14 19 26 41 67
INDONESIA (3) 39 49 67 63 71 36 52 65 78 93 49 58 60 59 58 27 45 60 72 77 8 22 45 77 97
MALDIVES (4)
NEPAL (5) 62 69 72 80 85 4 5 10 14 45 24 29 32 39 55 65 62 93 74 94 0 0 6 63 93
SRI LANKA (6) 91 97 96 95 98 91 97 96 98 99 63 57 49 42 38
THAILAND (7) 93 95 92 94 91 93 98 98 99 100 76 77 73 70 68
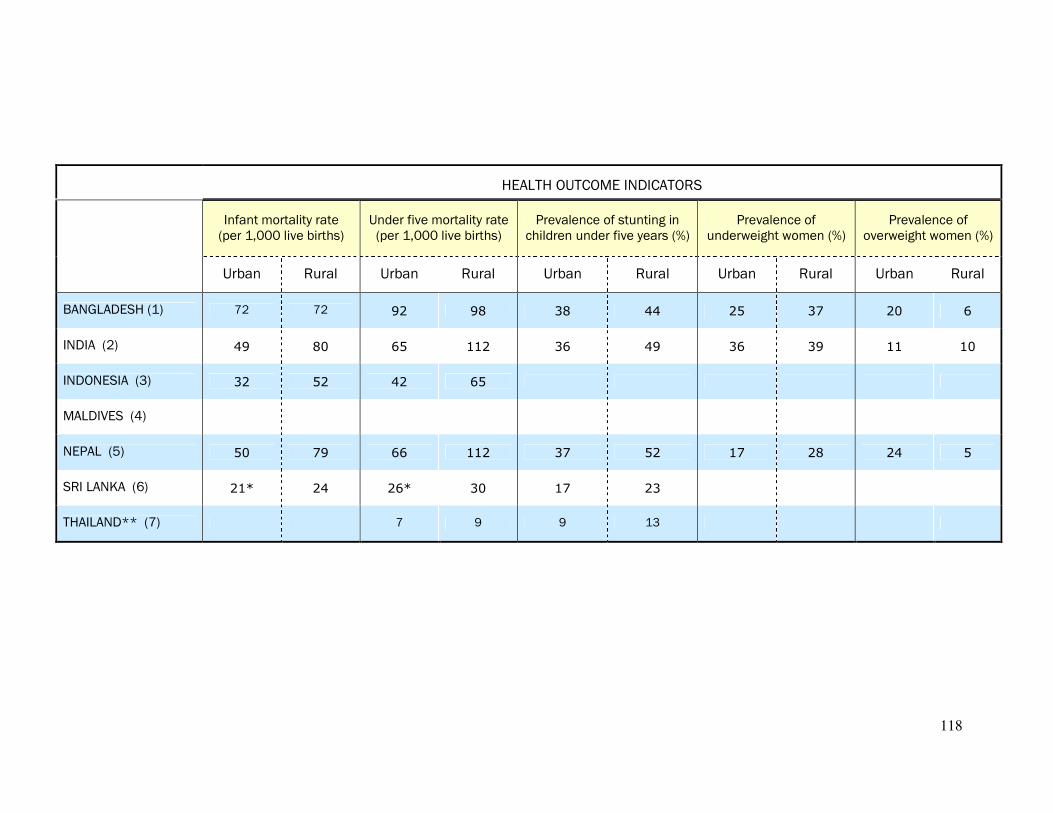
118
HEALTH OUTCOME INDICATORS
Infant mortality rate (per 1,000 live births)
Under five mortality rate (per 1,000 live births)
Prevalence of stunting in children under five years (%)
Prevalence of underweight women (%)
Prevalence of overweight women (%)
Urban Rural Urban Rural Urban Rural Urban Rural Urban Rural
BANGLADESH (1) 72 72 92 98 38 44 25 37 20 6
INDIA (2) 49 80 65 112 36 49 36 39 11 10
INDONESIA (3) 32 52 42 65
MALDIVES (4)
NEPAL (5) 50 79 66 112 37 52 17 28 24 5
SRI LANKA (6) 21* 24 26* 30 17 23
THAILAND** (7) 7 9 9 13
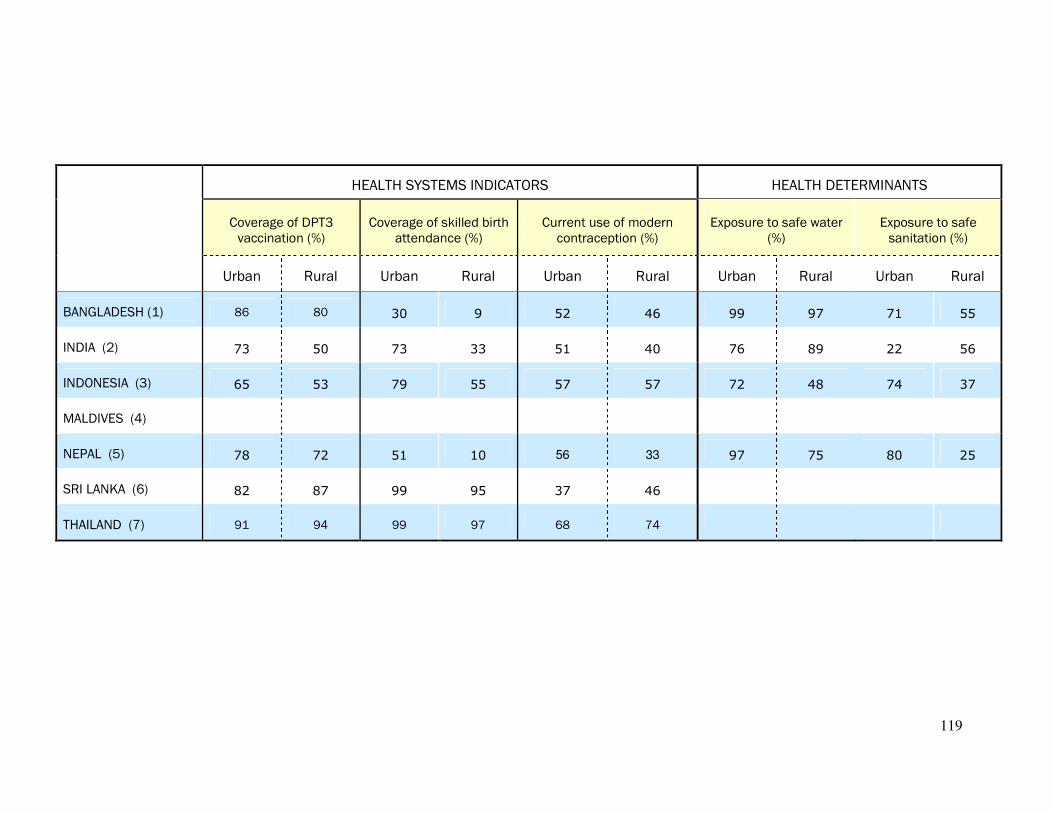
119
HEALTH SYSTEMS INDICATORS HEALTH DETERMINANTS
Coverage of DPT3 vaccination (%)
Coverage of skilled birth attendance (%)
Current use of modern contraception (%)
Exposure to safe water (%)
Exposure to safe sanitation (%)
Urban Rural Urban Rural Urban Rural Urban Rural Urban Rural
BANGLADESH (1) 86 80 30 9 52 46 99 97 71 55
INDIA (2) 73 50 73 33 51 40 76 89 22 56
INDONESIA (3) 65 53 79 55 57 57 72 48 74 37
MALDIVES (4)
NEPAL (5) 78 72 51 10 56 33 97 75 80 25
SRI LANKA (6) 82 87 99 95 37 46
THAILAND (7) 91 94 99 97 68 74
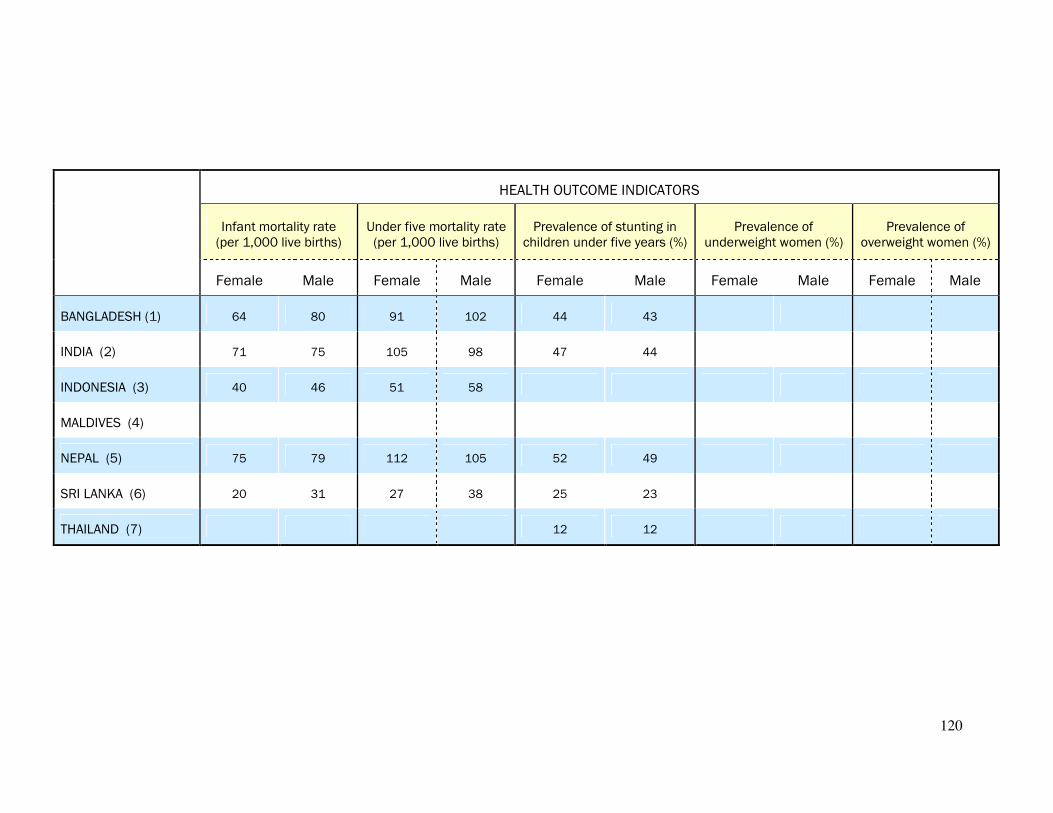
120
HEALTH OUTCOME INDICATORS
Infant mortality rate (per 1,000 live births)
Under five mortality rate (per 1,000 live births)
Prevalence of stunting in children under five years (%)
Prevalence of underweight women (%)
Prevalence of overweight women (%)
Female Male Female Male Female Male Female Male Female Male
BANGLADESH (1) 64 80 91 102 44 43
INDIA (2) 71 75 105 98 47 44
INDONESIA (3) 40 46 51 58
MALDIVES (4)
NEPAL (5) 75 79 112 105 52 49
SRI LANKA (6) 20 31 27 38 25 23
THAILAND (7) 12 12
121
REFERENCEREFERENCEREFERENCEREFERENCESSSS 1.1.1.1. Anand S, Diderichsen F, Evans T, Shkolnikov VM, Wirth M. Measuring disparities in health: methods and indicators In Evans T, Whitehead M, Diderichsen F, Bhuiya A, Wirth M eds. Challenging inequities in health: from ethics to action. Oxford University Press, New York, 2001. 2.2.2.2. World Health Organization: Technical consultation on the measurement of health inequalities- Background Paper, 2001. 3.3.3.3. Wagstaff A, Paci P, van Doorslaer E. On the measurement of inequalities in health. Social Science and Medicine, 1991; 33: 545-557. 4.4.4.4. Mackenbach JP, Kunst AE. Measuring the magnitude of socio-economic inequalities in health: an overview of available measures illustrated with two examples from Europe. Social Science & Medicine, 1997; 44(6): 757-71. 5.5.5.5. Filmer D, Pritchett LH. Estimating wealth effects without expenditure data-or tears: an application to educational enrollments in states of India. Demography, 2001; 38(1): 115-32. 6.6.6.6. Ferguson B, Murray CJL, Tandon A, Gakidou E. Estimating permanent income using asset and indicator variables. In Murray CJL, Evans DB, eds. Health systems performance assessment: debate, new methods, and new empiricism, World Health Organization, 2003. 7.7.7.7. Houweling TAJ, Kunst AE, Mackenbach JP. Measuring health inequality among children in developing countries: does the choice of the indicator of economic status matter? International Journal for Equity in Health 2003; 2(8). 8.8.8.8. Kakwani NC, Wagstaff A, Van Doorslaer E, Socioeconomic inequalities in health: Measurement, computation and statistical inference. Journal of Econometrics, 1997; 77777777(1): 87-104. 9.9.9.9. Quantitative Techniques for Health Equity Analysis—Technical Note #6, World Bank. (http://siteresources.worldbank.org/INTPAH/Resources/Publications/Quantitative-Techniques/health_eq_tn06.pdf). 10.10.10.10. Quantitative Techniques for Health Equity Analysis—Technical Note #7, World Bank. (http://siteresources.worldbank.org/INTPAH/Resources/Publications/Quantitative-Techniques/health_eq_tn07.pdf). 11.11.11.11. Wagstaff A, Van Doorslaer E, Watanabe N. On decomposing the causes of health sector inequalities with an application to malnutrition inequalities in Vietnam. Journal of Econometrics, 2003; 112(1): 207–223.
122
12.12.12.12. Hosseinpoor AR, Van Doorslaer E, Speybroeck N, Naghavi M, Mohammad K, Majdzadeh R, Delavar B, Jamshidi H, Vega J. Decomposing socioeconomic inequality in infant mortality in Iran. International Journal of Epidemiology. 2006;35(5):1211-9. 13. 13. 13. 13. Bhutta Z. et al."Maternal and child health: is South Asia ready for change?" BMJ 2004;328:816-819 (3 April), doi:10.1136/bmj.328.7443.816. 14.14.14.14. Minujin A, Delamonica E (2003). Mind the Gap: Widening child mortality inequities. Journal of Human Development, 4(3): 397-418. 11115555.... Commission on Social Determinants of Health "Achieving Health Equity: from root causes to fair outcomes", Interim Statement, 2007. 11116666.... Gilson L., Doherty J., Loewenson R., Francis V. "Knowledge Network on Health Systems, WHO Commission on the Social Determinants of Health, Final Report", July 2007. 17.17.17.17. Benach J., Muntaner C., Santana V. "Employment Conditions and Health Inequalities Final Report to the WHO Commission on Social Determinants of Health (CSDH)", July 2007. 18.18.18.18. Irwin L., Siddiqi A., Hertzman C. "Early Child Development: A Powerful Equalizer", Final report of the Knowledge Network on Early Child Development to the WHO Commission on the Social Determinants of Health, June 2007. 11119999.... Wagstaff A. Socio-eonomic inequalities in child mortality: Comparison across nine developing countries. Bulletin of the World Health Organization, 2000, 78: 19–29. 20202020.... Van Doorslaer E, Wagstaff A, Bleichrodt H et al. Income-related inequalities in health: Some international comparisons. Journal of Health Economics, 1997; 16: 93–112.
21.21.21.21. Evans T, Irwin A, Vega J. Health research, poverty and equity. In The Global Forum Update on Research for Health, 2005.