Embed Size (px)
Citation preview

Leah Hendey
December 2017
The Washington, DC, region is increasingly diverse and prosperous, offering many
opportunities to its residents. Yet, decades of systemic racism and discriminatory
policies and practices have produced significant inequities in education, income,
employment, and housing for people of color—the majority of the population in the
region. These inequities are not confined to one particular jurisdiction, they exist
within all jurisdictions in the DC region.
A DC region with greater inclusion will expand the economy and increase the skills and training of
the workforce.1 For example, if the DC region were equitable there would be 194,000 more Hispanics,
161,000 more blacks, and 29,000 more Asians or Pacific Islanders with at least some college education.
That is more people than live in Alexandria and Arlington, Virginia, combined. To make progress, this
brief calls attention to and defines the inequities and shows what equity would mean for residents of
color across the DC region.
This brief was originally developed as an internal memorandum for the Consumer Health
Foundation and the Meyer Foundation to inform their strategic thinking and investments and share
with grantees. It describes the major highlights on demographics, education, income, employment,
housing, and mobility from the tables posted here: https://www.urban.org/research/publication/racial-
inequities-washington-dc-region-2011-15.
W A S H I N G T O N A R E A R E S E A R C H I N I T I A T V E
Racial Inequities in the
Washington, DC, Region 2011–15

2 R A C I A L I N E Q U I T I E S I N T H E W A S H I N G T O N , D C , R E G I O N : 2 0 1 1–1 5
Methodology
We present the methodology first to make it easier to understand what follows. There are important
caveats to be aware of when interpreting the data. For the purposes of this brief and the accompanying
tables, the DC region includes the following jurisdictions (figure 1):
District of Columbia
Montgomery and Prince George's counties in Maryland
Arlington, Fairfax, Loudoun, and Prince William counties and Alexandria, Fairfax, Falls Church,
Manassas, and Manassas Park cities, in Virginia.
For all rates and percentages, the statistic presented is the rate across all the jurisdictions in the
region. For the equity gaps presented, the numbers represent the sum of the gaps across all
jurisdictions. The gaps may not add across the jurisdictions due to rounding in the tables or charts.
FIGURE 1
Jurisdictions Included in the DC Region
Sources: OpenStreetMap and contributors CC-BY-SA and US Census Bureau TIGER/Line Shapefiles, 2016.

R A C I A L I N E Q U I T I E S I N T H E W A S H I N G T O N , D C , R E G I O N : 2 0 1 1–1 5 3
Categorizing the Population by Race and Ethnicity
Race and ethnic population groups used in this brief are not mutually exclusive because of the
tabulations available in the American Community Survey. Further breakouts by nationality are also not
available, and the categories we use may mask some of these differences. We use the following
categorization:
White (non-Hispanic)
Black (and no other race, regardless of ethnicity)
Hispanic (of any race, including those who identify as Latino)
Asian or Pacific Islander (those who identified either as Asian or Native Hawaiian and other
Pacific Islander and no other race, regardless of ethnicity)
American Indian, Alaskan Native, other or multiple races (all regardless of ethnicity)
Because the groups are not mutually exclusive percentages will not total to 100. In the above
categories, Hispanics can also appear in the black, Asian, Pacific Islander, American Indian, Alaskan
Native, other, or multiple race groups. Though there are inequities that American Indian, Alaskan
Native, and other or those who identify as multiracial face, the American Community Survey does not
have sufficient sample sizes to break out the data for these groups.
Though it is more limited because of the tabulations the American Community Survey provides, we
have also included some information on the foreign-born population the DC region. The foreign-born
population includes all people born outside the US who would not be considered “native” (those born in
Puerto Rico, other US island areas or born abroad of American parents are considered native).
Calculation of Equity Gaps
One method to explore what an equitable region would look like is to close the equity gaps between
whites and other racial or ethnic groups. For example, in Montgomery County the poverty rate for
whites was 4 percent, compared with 11 percent for blacks. We calculated the additional number of
black residents in Montgomery County who would leave poverty if the black poverty rate was equal to
4 percent. The equity gaps for each jurisdiction were calculated independently from each other. Equity
gaps for each racial or ethnic group should not be added together as there may be some overlap between
the Hispanic population and the black and Asian or Pacific Islander populations. The gaps are
presented as rounded to the nearest 100 people or to the nearest 10 people if less than 100.
In this brief, the regional equity gap numbers represent the sum of the gaps across all jurisdictions.
The gaps may not add across the jurisdictions due to rounding in the tables or charts.

4 R A C I A L I N E Q U I T I E S I N T H E W A S H I N G T O N , D C , R E G I O N : 2 0 1 1–1 5
Margins of Error
The numbers and percentages in this brief and the accompanying tables are estimates based on the
five-year 2011–15 American Community Survey. Because they are survey estimates and have margins
of error associated with them, readers should use caution when comparing numbers. The margins of
error have been provided for each indicator in the accompanying tables.
We emphasize only estimates where the margins of error were small and the estimates are
reliable. But when one looks at small subpopulations, the margins of error are likely to be relatively
large and the estimates less reliable. We suppressed the data where we did not consider the estimates
reliable.2 The equity gaps were also not calculated if an estimate for a group in a jurisdiction was not
statistically significantly different than the jurisdiction’s white estimate.
We focus on highlighting jurisdictions where the margins of error around estimates are smaller.
This generally means that we will discuss fewer estimates for the smaller independent cities in Virginia
because those estimates, especially for groups with low representation in the population, had large
margins of error even if they were not large enough to warrant suppression. For example, in the
education section, there was no disparity in the share of adults with high school degrees between
whites and blacks in Prince George’s County. The estimates are not the same (93 versus 92 percent),
but the margins of error are small (1.6 and 0.9 percentage points), and we concluded that the
difference between those estimates was not statistically significant. The difference on the same
indicator between whites (100 percent) and blacks (86 percent) in Falls Church was also not
statistically significant, in this case because the margin of error for the black estimate was large (26.1
percentage points). We do not discuss this lack of significant difference and do not view it as sign of no
disparity, rather we cannot determine whether a difference exists. Often where margins of error were
large, the population of interest represented only a small share of the overall population (blacks
represented only 2 percent of the Falls Church population). See the demographics worksheet in the
online tables for the share of population in each group.
Demographics
The DC region had nearly 5 million residents in 2011–15. The counties and independent cities in the
region ranged in size from 1.12 million residents (about 23 percent of the region’s population) in
Fairfax County to roughly 13,000 residents in Falls Church City. Three of every four residents in the
DC region live either in the District of Columbia or in Montgomery, Prince George’s, or Fairfax
counties.
Race and Ethnicity
People of color, including those identifying as black, Hispanic, Asian, Pacific Islander or American
Indian, made up more than half of the region’s population (57 percent). Whites were the largest
population group (43 percent), followed by blacks (27 percent), Hispanics (16 percent), and Asians or
R A C I A L I N E Q U I T I E S I N T H E W A S H I N G T O N , D C , R E G I O N : 2 0 1 1–1 5 5
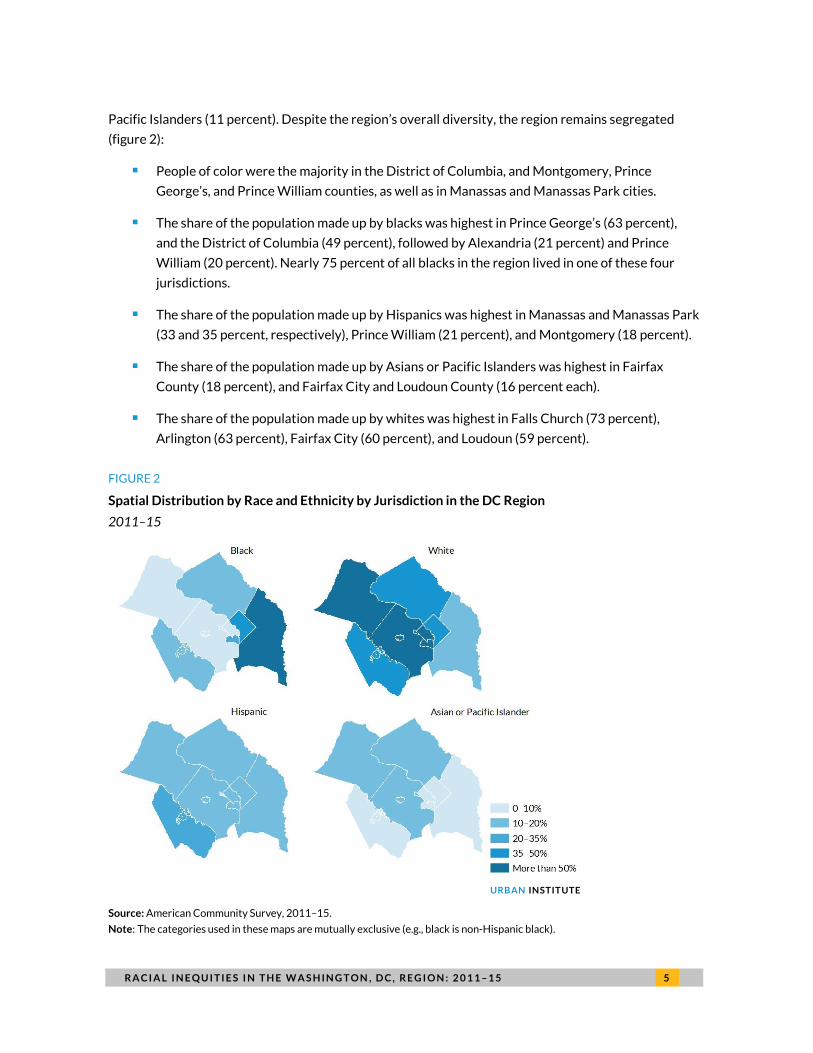
Pacific Islanders (11 percent). Despite the region’s overall diversity, the region remains segregated
(figure 2):
People of color were the majority in the District of Columbia, and Montgomery, Prince
George’s, and Prince William counties, as well as in Manassas and Manassas Park cities.
The share of the population made up by blacks was highest in Prince George’s (63 percent),
and the District of Columbia (49 percent), followed by Alexandria (21 percent) and Prince
William (20 percent). Nearly 75 percent of all blacks in the region lived in one of these four
jurisdictions.
The share of the population made up by Hispanics was highest in Manassas and Manassas Park
(33 and 35 percent, respectively), Prince William (21 percent), and Montgomery (18 percent).
The share of the population made up by Asians or Pacific Islanders was highest in Fairfax
County (18 percent), and Fairfax City and Loudoun County (16 percent each).
The share of the population made up by whites was highest in Falls Church (73 percent),
Arlington (63 percent), Fairfax City (60 percent), and Loudoun (59 percent).
FIGURE 2
Spatial Distribution by Race and Ethnicity by Jurisdiction in the DC Region
2011–15
URBAN INSTITUTE
Source: American Community Survey, 2011–15.
Note: The categories used in these maps are mutually exclusive (e.g., black is non-Hispanic black).

6 R A C I A L I N E Q U I T I E S I N T H E W A S H I N G T O N , D C , R E G I O N : 2 0 1 1–1 5
Age Distribution
In the DC region, just under half of the population was younger than 35, adults ages 35 to 64
represented 41 percent of the population, and adults age 65 and older 11 percent. The western-most
jurisdictions in the region (Loudoun, Prince William, Manassas, and Manassas Park) had the largest
proportions of children at 27–30 percent compared with 23 percent overall in the region. Children
represented a larger share of the black and Hispanic populations regionally (24 and 31 percent,
respectively) compared with whites (19 percent) and Asians or Pacific Islanders (21 percent). In the
region, a higher proportion of whites was age 65 and older (14 percent) than other racial and ethnic
groups. Only a small share of Hispanics in the region was age 65 and older (4 percent).
Foreign-Born Population
One out of four people in the DC region was an immigrant (considered foreign born). The share of the
population who were immigrants ranged from 14 percent in the District of Columbia to 33 percent in
Montgomery County (figure 3). About 70 percent of Asians or Pacific Islanders and more than half of
all Hispanics in the region were immigrants. In contrast, only 16 percent of blacks and 9 percent of
whites were immigrants. Larger proportions of the black population in Alexandria (38 percent),
Montgomery (35 percent), Fairfax County (28 percent), and Arlington (27 percent) were immigrants,
compared with the District (7 percent) and Prince George’s (12 percent).
FIGURE 3
Share of Population That Is Foreign Born by Jurisdiction
2011–15
URBAN INSTITUTE
Source: American Community Survey, 2011–15.
14
18
21
22
23
23
25
27
27
27
30
32
33
District of Columbia
Falls Church
Prince George's
Prince William
Arlington
Loudoun
Region
Fairfax City
Alexandria
Manassas
Fairfax
Manassas Park
Montgomery
Percent

R A C I A L I N E Q U I T I E S I N T H E W A S H I N G T O N , D C , R E G I O N : 2 0 1 1–1 5 7
Educational Attainment
The DC region has high rates of educational attainment. Ninety percent of adults age 25 and older had
a high school diploma or GED, and 73 percent had at least some college education. Nationally, 87
percent of adults had a high school degree, and only 59 percent had at least some college.
However, substantial inequities exist across racial and ethnic groups in the region. Nearly all white
adults (98 percent) had a high school degree compared with 91 percent of Asians or Pacific Islanders,
90 percent of blacks, and only 65 percent of Hispanics. Seventy-nine percent of immigrants had a high
school degree.
The share of blacks with a high school degree ranged from 84 percent in the District of Columbia
to 93 percent in Loudoun and Prince William counties. There was a similar pattern for attainment of at
least some college education. The inequity between blacks and whites in the attainment of a high
school degree was largest in the District of Columbia, where 99 percent of whites had one compared
with 84 percent of blacks. There were no statistically significant differences between blacks and
whites in Prince George’s or Prince William counties. There were, however, significant differences
between whites and blacks in these counties on share of adults with some college. A smaller share of
blacks in the two counties had some college (64 and 71 percent, respectively) than whites (69 and 76
percent, respectively).
The share of Hispanics in the region with a high school degree ranged from 44 percent in Prince
George’s to 75 percent in Loudoun. The inequity between whites and Hispanics was largest in Prince
George’s, where 93 percent of whites had a high school degree. The inequities were smallest between
whites and Hispanics in Manassas Park (88 versus 67 percent) and Loudoun (98 versus 75 percent).
There were similar patterns across jurisdictions for the share of Hispanic adults with some college
education, ranging from 23 percent in Prince George’s to 50 percent in Loudoun.
The share of Asians or Pacific Islanders with a high school degree ranged from 80 percent in
Manassas to 94 percent in Alexandria. These jurisdictions also represented the smallest (Alexandria)
and largest (Manassas) inequities between whites and Asians or Pacific Islanders. The share of Asians
or Pacific Islanders with at least some college was also lowest in Manassas (64 percent). Loudoun and
the District of Columbia had the highest shares (85 percent each) of Asian or Pacific Islanders with
some college. Interestingly, though there was no disparity between whites and Asians in Loudoun, the
District of Columbia has the largest inequity in the region, with 97 percent of whites having some
college.
The share of immigrants with a high school degree ranged from 64 percent in Manassas to 86
percent in Loudoun. Fairfax City had the smallest disparity between immigrants and whites and
Manassas had the largest. The share of immigrants with at least some college education followed a
similar pattern across jurisdictions. However, inequities between whites and immigrants were larger
on this measure in the District of Columbia (97 percent versus 65 percent) and the smallest in Loudoun
(85 percent versus 71 percent).

8 R A C I A L I N E Q U I T I E S I N T H E W A S H I N G T O N , D C , R E G I O N : 2 0 1 1–1 5
In an equitable DC region, 188,100 more immigrants and nearly 150,000 additional Hispanics
would have a high school degree, as well as 48,000 more blacks and 25,000 more Asians or Pacific
Islanders (figure 4). There would also be 194,000 more Hispanics, 161,000 more blacks, and 29,000
more Asians or Pacific Islanders, with at least some college education; that is more people than live in
Alexandria and Arlington combined. An additional 255,000 immigrants adults would have at least
some college in an equitable DC region.
FIGURE 4
Increase in the Number of Adults with Higher Educational Attainment with Equity in the DC Region
2011–15
URBAN INSTITUTE
Source: American Community Survey, 2011–15.
In an equitable DC region, 188,100 more immigrants and nearly 150,000 additional
Hispanics would have a high school degree, as well as 48,000 more blacks and 25,000 more
Asians or Pacific Islanders.
48,100
149,500
25,300
188,100
0
50,000
100,000
150,000
200,000
250,000
300,000
Black Hispanic Asian or Pacific Islander Foreign born
High school degree Some college

R A C I A L I N E Q U I T I E S I N T H E W A S H I N G T O N , D C , R E G I O N : 2 0 1 1–1 5 9
Income
Among households, which include both families and households where single adults or nonrelated
people live together, the average household income in the DC region was $123,000 and ranged from
$88,000 in Manassas Park to $165,000 in Falls Church. By race, the average income for households
headed by whites ($152,500) was 82 percent higher than that for blacks ($83,900), 74 percent higher
than that for Hispanics ($87,500), and 20 percent higher than that for Asian or Pacific Islander
households (figure 5). Income inequities between whites and blacks were largest in the District of
Columbia ($102,000 difference) and smallest in Prince George’s ($10,000). Inequities between whites
and Hispanics were largest in Montgomery ($72,000 difference) and smallest in Manassas Park
($24,000). No significant disparity existed between whites and Asians or Pacific Islanders in Loudoun,
but in the District of Columbia income inequity was more than $55,000 between these groups.
FIGURE 5
Average Household Income in 2015 dollars
2011–15
URBAN INSTITUTE
Source: American Community Survey, 2011–15.
According to the Massachusetts Institute of Technology Living Wage Calculator, the living wage in
the Washington, DC,-Arlington-Alexandria metropolitan area, which would enable a full-time worker
to provide for a family with two children, was approximately $40.92/hour, or about $85,000 in annual
income.3 But many families in this region struggled to earn that living wage. One in three families in the
region had an annual income of less than $75,000, including nearly one in two families in Manassas and
$152,500
$83,900
$87,500
$126,700
White
Black
Hispanic
Asian or Pacific Islander

1 0 R A C I A L I N E Q U I T I E S I N T H E W A S H I N G T O N , D C , R E G I O N : 2 0 1 1–1 5
Manassas Park.4 Only 16 percent of families headed by whites had incomes below $75,000, compared
with 48 percent of black families and 59 percent of Hispanic families.
As with average household income, the income inequities between white and black families with
incomes below $75,000 were smallest in Prince George’s (30 versus 41 percent) and largest in the
District of Columbia (67 versus 9 percent) (figure 6). For white and Hispanic families, the inequities
were largest in Alexandria and the District (47 to 52 percentage points) and smallest in Prince William
(35 percentage points). There was not a significant disparity in families with incomes below $75,000 in
Loudoun between white families and Asian or Pacific Islander families but large inequities existed in
Arlington (12 versus 46 percent). In an equitable DC region, an additional 82,400 black families,
63,500 Hispanic families, and 18,000 Asian or Pacific Islander families would have annual incomes
above $75,000.
FIGURE 6
Share of Families with Annual Income below $75,000 in 2015 Dollars
2011–15
URBAN INSTITUTE
Source: American Community Survey, 2011–15.
0 10 20 30 40 50 60 70 80 90 100
Region
District of Columbia
Montgomery
Prince George's
Alexandria
Arlington
Fairfax
Loudoun
Prince William
White Black Hispanic Asian or Pacific Islander
Percent
R A C I A L I N E Q U I T I E S I N T H E W A S H I N G T O N , D C , R E G I O N : 2 0 1 1–1 5 1 1
Twenty-one percent of families in the region had annual incomes above $200,000, ranging from 38
percent of families in Falls Church to 7 percent of families in Manassas and Manassas Park. Nearly 1 in
3 white families had annual incomes at this level, compared with 1 in 5 Asian or Pacific Islander
families, and less than 1 in 10 black or Hispanic families. The District of Columbia had the highest and
Prince George’s the lowest inequities in the shares of white families with incomes over $200,000
compared with black families or Hispanic families.
The poverty rate in the DC region was 8 percent and ranged from 4 percent for whites to 13
percent for blacks and Hispanics. By jurisdiction, it ranged from 3 percent in Falls Church to 18 percent
in the District of Columbia. In an equitable DC region, there would be 91,600 more blacks above the
federal poverty level, along with 62,500 more Hispanics and 14,600 more Asians or Pacific Islanders.
There would also be 69,500 more immigrants above the poverty level.
In an equitable DC region, an additional 82,400 black families, 63,500 Hispanic families,
and 18,000 Asian or Pacific Islander families would have annual incomes above $75,000.
The child poverty rate for the DC region was 11 percent. The District of Columbia stood out with
27 percent of children living in poverty, compared with less than 14 percent in every other jurisdiction.
There were also substantial inequities in child poverty between racial and ethnic groups, with rates
ranging from 3 percent for white children to 19 percent for black children in the region. For
jurisdictions where child poverty could be measured, only in Loudoun (6 percent) was the poverty rate
for black children under 10 percent. For Hispanics, no jurisdiction had a child poverty rate below 10
percent; they ranged from 14 percent in Montgomery, Fairfax, and Loudoun to 27 percent in Arlington.
The child poverty rate for Asian or Pacific Islanders (6 percent) was a little higher than that for whites
and was relatively low across jurisdictions.
Employment
Seventy-five percent of the region’s population ages 16 to 64 were employed. Whites had the highest
employment rates for this age group (79 percent) followed by Hispanics (77 percent), Asian or Pacific
Islanders (74 percent), and blacks (70 percent). In many jurisdictions, there were not significant
differences between whites and other groups on employment rates for this age group.
When looking at the population age 16 and older in the labor force, the unemployment rate in the
region in 2011–15 was 6.4 percent. Unemployment was lowest in Arlington (3.7 percent) and highest
in the District of Columbia (9.6 percent). However, unemployment for blacks (10.9 percent) was nearly
three times that of whites (3.8 percent).
1 2 R A C I A L I N E Q U I T I E S I N T H E W A S H I N G T O N , D C , R E G I O N : 2 0 1 1–1 5
The unemployment rates for blacks ranged from 5.9 percent in Loudoun to 17.9 in the District of
Columbia. Inequities in the unemployment rates between whites and blacks were lowest in Prince
George’s and Prince William and highest in the District of Columbia. The unemployment rates for
Hispanics ranged from 4.3 percent in Loudoun to 8.4 percent in the District of Columbia. There were
no significant differences between whites and Hispanics in Prince George’s, Loudoun and Manassas.
The largest inequities for Hispanics were in the District of Columbia and Arlington. The unemployment
rates for Asians or Pacific Islanders ranged from 2.3 percent in the District of Columbia to 6.1 percent
in Prince George’s. There were fewer inequities on unemployment between whites and Asians or
Pacific Islanders, but they were clearly present in Arlington and Fairfax. In an equitable DC region,
46,400 more blacks, 10,300 more Hispanics, and 2,100 more Asians or Pacific Islanders would be
employed.
Across racial and ethnic groups, there was not much variation in the share of the population age 16
and older who were employed and working full time (51 percent in the region). However, of those
working full time, there were substantial inequities in the share of the population who earned less than
$35,000 annually, which was less than half the income needed to earn a living wage in the DC region
(figure 7). Nearly 5 in 10 Hispanics working full-time earned less than $35,000, compared with more
than 2 in 10 blacks, 2 in 10 Asians or Pacific Islanders, and only 1 in 10 whites. In an equitable DC
region, 110,000 fewer Hispanics, 65,000 fewer blacks, and 23,000 fewer Asians or Pacific Islanders
working full time would earn less than $35,000.
There were similar inequities for those working full time and earning less than $75,000 annually.
More than 8 in 10 Hispanics, 7 in 10 blacks, and more than 5 in 10 Asians or Pacific Islanders working
full time earned less than $75,000 compared with a little more than 4 in 10 whites. In an equitable DC
region, about 114,000 fewer Hispanics, 96,000 fewer blacks, and 26,000 fewer Asians or Pacific
Islanders working full time would earn less than $75,000.

R A C I A L I N E Q U I T I E S I N T H E W A S H I N G T O N , D C , R E G I O N : 2 0 1 1–1 5 1 3
FIGURE 7
Share of the Population Working Full Time with Earnings below $35,000
2011–15
URBAN INSTITUTE
Source: American Community Survey, 2011–15.
In an equitable DC region, 46,400 more blacks, 10,300 more Hispanics, and 2,100 more
Asians or Pacific Islanders would be employed.
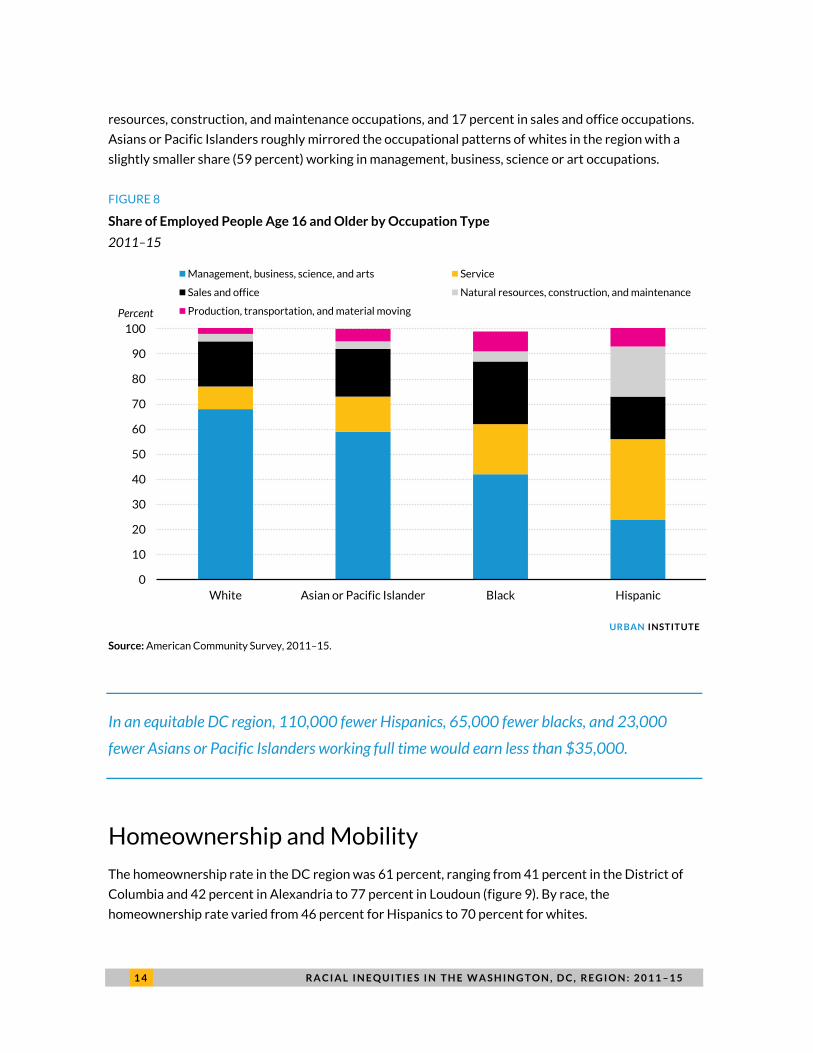
Some of the inequities in earnings may be attributable to occupational differences. Most whites
worked in management, business, science or art occupations (68 percent), which tend to require more
advanced skills or training and pay higher wages than sales and office (18 percent) and service (9
percent) occupations (figure 8). In contrast, 48 percent of blacks were in management, business,
science or art occupations, with higher shares in sales and office occupations (25 percent) and service
occupations (20 percent). Less than 25 percent of Hispanics worked in management, business, science
or art occupations, but nearly 30 percent worked in service occupations, 20 percent in natural
0 10 20 30 40 50 60
Region
District of Columbia
Montgomery
Prince George's
Alexandria
Arlington
Fairfax
Loudoun
Prince William
White Black Hispanic Asian or Pacific Islander
Percent
1 4 R A C I A L I N E Q U I T I E S I N T H E W A S H I N G T O N , D C , R E G I O N : 2 0 1 1–1 5
resources, construction, and maintenance occupations, and 17 percent in sales and office occupations.
Asians or Pacific Islanders roughly mirrored the occupational patterns of whites in the region with a
slightly smaller share (59 percent) working in management, business, science or art occupations.
FIGURE 8
Share of Employed People Age 16 and Older by Occupation Type
2011–15
URBAN INSTITUTE
Source: American Community Survey, 2011–15.
In an equitable DC region, 110,000 fewer Hispanics, 65,000 fewer blacks, and 23,000
fewer Asians or Pacific Islanders working full time would earn less than $35,000.
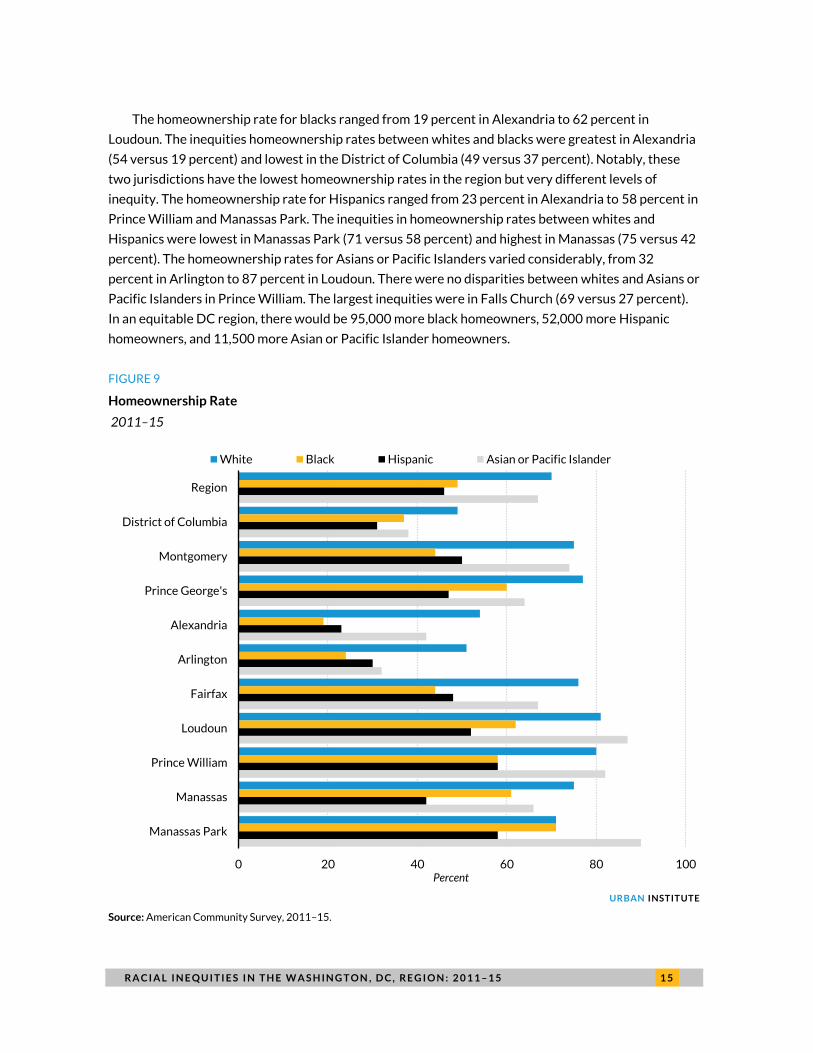
Homeownership and Mobility
The homeownership rate in the DC region was 61 percent, ranging from 41 percent in the District of
Columbia and 42 percent in Alexandria to 77 percent in Loudoun (figure 9). By race, the
homeownership rate varied from 46 percent for Hispanics to 70 percent for whites.
0
10
20
30
40
50
60
70
80
90
100
White Asian or Pacific Islander Black Hispanic
Management, business, science, and arts Service
Sales and office Natural resources, construction, and maintenance
Production, transportation, and material movingPercent
R A C I A L I N E Q U I T I E S I N T H E W A S H I N G T O N , D C , R E G I O N : 2 0 1 1–1 5 1 5
The homeownership rate for blacks ranged from 19 percent in Alexandria to 62 percent in
Loudoun. The inequities homeownership rates between whites and blacks were greatest in Alexandria
(54 versus 19 percent) and lowest in the District of Columbia (49 versus 37 percent). Notably, these
two jurisdictions have the lowest homeownership rates in the region but very different levels of
inequity. The homeownership rate for Hispanics ranged from 23 percent in Alexandria to 58 percent in
Prince William and Manassas Park. The inequities in homeownership rates between whites and
Hispanics were lowest in Manassas Park (71 versus 58 percent) and highest in Manassas (75 versus 42
percent). The homeownership rates for Asians or Pacific Islanders varied considerably, from 32
percent in Arlington to 87 percent in Loudoun. There were no disparities between whites and Asians or
Pacific Islanders in Prince William. The largest inequities were in Falls Church (69 versus 27 percent).
In an equitable DC region, there would be 95,000 more black homeowners, 52,000 more Hispanic
homeowners, and 11,500 more Asian or Pacific Islander homeowners.
FIGURE 9
Homeownership Rate
2011–15
URBAN INSTITUTE
Source: American Community Survey, 2011–15.
0 20 40 60 80 100
Region
District of Columbia
Montgomery
Prince George's
Alexandria
Arlington
Fairfax
Loudoun
Prince William
Manassas
Manassas Park
White Black Hispanic Asian or Pacific Islander
Percent

1 6 R A C I A L I N E Q U I T I E S I N T H E W A S H I N G T O N , D C , R E G I O N : 2 0 1 1–1 5
Overall, the mobility rate (percentage of the population who moved in the last year) in the DC
region was 16 percent. Nationally, about 15 percent of the population moved in the last year.
Alexandria, Arlington, and the District of Columbia had the highest mobility rates in the region (20–22
percent). These jurisdictions also had the highest share of renters (41–44 percent). Not surprisingly,
jurisdictions with high homeownership rates tended to have lower mobility rates, like Loudoun (77
percent homeowners and 13 percent mobility rate). Overall, whites (12 percent) in the region had
lower mobility rates than any other groups (16 percent). Variation within racial or ethnic group by
jurisdiction was also associated with the rate of homeownership.
Of those who moved in the region (16 percent), about half moved into their current jurisdiction
from somewhere else, such as a different county (within or outside the region), state, or abroad (8
percent). This ranged from more than 9 in 10 who moved in Falls Church and were moving from
another county to only 4 in 10 in Prince George’s who moved and were moving from another county.
Of blacks and Hispanics who moved, they were less likely to move from another county than whites.
In an equitable DC region, there would be 95,000 more black homeowners, 52,000 more
Hispanic homeowners, and 11,500 more Asian or Pacific Islander homeowners.
Conclusion
The inequities discussed in this brief are the result of discrimination and deliberate policies and
practices. People of color, and blacks in particular, in the District of Columbia and Washington, DC,
region have faced centuries of systemic racism, from slavery and Jim Crow laws to resegregation of the
federal civil service during the Woodrow Wilson administration, from redlining in the home mortgage
market following World War II to predatory lending practices during the foreclosure crisis (see
Kijakazi et al. 2016 for comprehensive and thoughtful discussion of this history in DC). This brief
provides a starting point for discussions that need to take place in every jurisdiction in the region to
identify and change policies and practices that are contributing to these inequities. These discussions
need to occur in city or county council chambers, agency headquarters, corporate and philanthropic
boardrooms, and nonprofit staff meetings.
There are good examples already of leaders beginning this process. The Consumer Health and
Meyer Foundations have sponsored this work and the feature “A Vision for an Equitable DC”5 and
shared the data with community stakeholders and their grantees. The Washington Regional
Association of Grantmakers has established a learning series for philanthropy called “Putting Racism
on the Table.”6 Fairfax County board of supervisors and the school board jointly adopted a “One
Fairfax” policy to address social and racial equity, and Fairfax County is a member of the Government
R A C I A L I N E Q U I T I E S I N T H E W A S H I N G T O N , D C , R E G I O N : 2 0 1 1–1 5 1 7
Alliance on Race and Equity.7 And the nonprofit, Building Bridges Across the River (THEARC 2015)
worked with stakeholders to develop an equitable development plan that has attracted funding from
corporations like JPMorgan Chase.8 Making progress on addressing these inequities will require
intentional focus, collaboration across sectors, and innovative thinking change policies and practices
necessary to reduce poverty and increase employment and education for hundreds of thousands of
people of color in the DC region who deserve the opportunity to reach their full potential.
Notes
1. See, for example, “GDP Gains with Racial Equity,” National Equity Atlas, accessed December 4, 2017, http://nationalequityatlas.org/indicators/GDP_gains_with_racial_equity/7426/Washington-Arlington-Alexandria,_DC-VA-MD-WV_Metro_Area/false/.
2. Estimates have been suppressed if the Coefficient of Variation for the estimate was greater than 30 percent (US Census Bureau 2009).
3. These represent the living wage in 2015. See “Living Wage Calculator for Washington-Arlington-Alexandria, DC,” Massachusetts Institute of Technology, accessed September 24, 2017, http://livingwage.mit.edu/metros/47900.
4. Earnings are discussed in the employment section; the income section focuses on all income for a family. The American Community Survey tabulations do not break out income at $85,000, so we have used $75,000 as the closest proxy.
5. Leah Hendey and Serena Lei, “A Vision for an Equitable DC,” Urban Institute, December 12, 2016, https://www.urban.org/features/vision-equitable-dc.
6. “Putting Racism on the Table Learning Series,” Washington Regional Association of Grantmakers, accessed December 26, 2017, https://www.washingtongrantmakers.org/putting-racism-table-learning-series.
7. “Core Member: Fairfax County, Virginia,” Government Alliance on Race and Equity, accessed December 26, 2017, http://www.racialequityalliance.org/jurisdictions/fairfax-county-virginia/.
8. Jonathan O’Connell, “Big Philanthropists Flock to DC’s Bridge Park Project to Battle Gentrification,” Washington Post, September 25, 2017, https://www.washingtonpost.com/news/digger/wp/2017/09/25/big-philanthropists-flock-to-d-c-s-bridge-park-project-to-battle-gentrification/?utm_term=.5481dc8a30f4.
References
THEARC (Town Hall Education Arts Recreation Center). 2015. 11th Street Bridge Park: Equitable Development Plan. Washington, DC: THEARC.
Kijakazi, Kilolo, Rachel Marie Brooks Atkins, Mark Paul, Anne E. Price, Darrick Hamilton, and William A. Darity Jr. 2016. The Color of Wealth in the Nation’s Capital. Washington, DC: Urban Institute, The New School, Insight Center for Community Economic Development.
US Census Bureau. 2009. A Compass for Understanding and Using American Community Survey Data: What Researchers Need to Know. Washington, DC: US Government Printing Office.

1 8 R A C I A L I N E Q U I T I E S I N T H E W A S H I N G T O N , D C , R E G I O N : 2 0 1 1–1 5
About the Author
Leah Hendey is a senior research associate in the Metropolitan Housing and
Communities Policy Center at the Urban Institute, where she focuses on housing
policy and on policy to improve neighborhoods. Experienced in working with national
and local administrative datasets, she has been involved in Urban’s work with the
National Neighborhood Indicators Partnership and is its deputy director. Leah has led
Urban’s efforts to describe the racial inequities in the District of Columbia and the
Washington, DC, region.
Acknowledgments
This brief was funded by the Consumer Health Foundation and the Meyer Foundation. We are grateful
to them and to all our funders, who make it possible for Urban to advance its mission.
The views expressed are those of the author and should not be attributed to the Urban Institute,
its trustees, or its funders. Funders do not determine research findings or the insights and
recommendations of Urban experts. Further information on the Urban Institute’s funding principles is
available at www.urban.org/support.
ABOUT THE URBAN INST ITUTE The nonprofit Urban Institute is dedicated to elevating the debate on social and economic policy. For nearly five decades, Urban scholars have conducted research and offered evidence-based solutions that improve lives and strengthen communities across a rapidly urbanizing world. Their objective research helps expand opportunities for all, reduce hardship among the most vulnerable, and strengthen the effectiveness of the public sector.
Copyright © December 2017. Consumer Health Foundation, the Eugene and Agnes Meyer Foundation, and Urban Institute. Permission is granted for reproduction of this file, with attribution to the Urban Institute.
2100 M Street NW Washington, DC 20037
www.urban.org