Embed Size (px)
Citation preview

H E A L T HE F F E C T SINSTITUT E
R E S E A R C H R E P O R T
Charlestown Navy Yard
120 Second Avenue
Boston MA 02129-4533 USA
+1-617-886-9330
www.healtheffects.org
H E A L T HE F F E C T SINSTITUT E
R E S E A R C HR E P O R T
Number 113February 2003
Number 113
February 2003
Benzene Metabolism in Rodents at Doses Relevant to Human Exposure from Urban AirKenneth W Turteltaub and Chitra Mani
Includes a Commentary by the Institute’s Health Review Committee
fold line

H E A L T HE F F E C T SI N S T I T U T E
The Health Effects Institute, established
in 1980, is an independent and unbiased
source of information on the health
effects of motor vehicle emissions. HEI
studies all major pollutants, including
regulated pollutants (such as carbon
monoxide, ozone, nitrogen dioxide, and
particulate matter) and unregulated
pollutants (such as diesel engine exhaust,
methanol, and aldehydes). To date, HEI
has supported more than 200 projects at
institutions in North America and Europe
and has published over 130 research
reports.
Typically, HEI receives half its funds
from the US Environmental Protection
Agency and half from 28 manufacturers
and marketers of motor vehicles and
engines in the United States.
Occasionally, funds from other public
and private organizations either support
special projects or provide resources for
a portion of an HEI study. Regardless of
funding sources, HEI exercises complete
autonomy in setting its research
priorities and in reaching its
conclusions. An independent Board of
Directors governs HEI. The Institute’s
Health Research and Health Review
Committees serve complementary
scientific purposes and draw
distinguished scientists as members.
The results of HEI-funded studies are
made available as Research Reports,
which contain both the Investigators’
Report and the Review Committee’s
evaluation of the work’s scientific quality
and regulatory relevance.
Mark J Utell ChairProfessor of Medicine and Environmental Medicine, University of Rochester
Melvyn C BranchJoseph Negler Professor of Engineering, Mechanical EngineeringDepartment, University of Colorado
Kenneth L DemerjianProfessor and Director, Atmospheric Sciences Research Center,University at Albany, State University of New York
Peter B FarmerProfessor and Section Head, Medical Research Council Toxicology Unit,University of Leicester
Helmut GreimProfessor, Institute of Toxicology and Environmental Hygiene, TechnicalUniversity of Munich
Rogene HendersonSenior Scientist and Deputy Director, National EnvironmentalRespiratory Center, Lovelace Respiratory Research Institute
Stephen I RennardLarson Professor, Department of Internal Medicine, University ofNebraska Medical Center
Howard RocketteProfessor and Chair, Department of Biostatistics, Graduate School ofPublic Health, University of Pittsburgh
Jonathan M SametProfessor and Chairman, Department of Epidemiology, BloombergSchool of Public Health, Johns Hopkins University
Frank E SpeizerEdward H Kass Professor of Medicine, Channing Laboratory, HarvardMedical School and Department of Medicine, Brigham and Women’sHospital
Clarice R WeinbergChief, Biostatistics Branch, Environmental Diseases and MedicineProgram, National Institute of Environmental Health Sciences
BOARD OF DIRECTORS
HEALTH RESEARCH COMMITTEE
HEALTH REVIEW COMMITTEE
OFFICERS & STAFFDaniel S Greenbaum PresidentRobert M O’Keefe Vice PresidentJane Warren Director of ScienceSally Edwards Director of PublicationsJacqueline C Rutledge Director of Finance and AdministrationRichard M Cooper Corporate SecretaryCristina I Cann Staff ScientistAaron J Cohen Principal ScientistMaria G Costantini Principal Scientist
Debra A Kaden Senior ScientistGeoffrey H Sunshine Senior ScientistAnnemoon MM van Erp Staff ScientistTerésa Fasulo Senior Administrative AssistantGail A Hamblett Office and Contracts ManagerL Virgi Hepner Senior Science EditorJenny Lamont Science EditorFrancine Marmenout Senior Executive AssistantTeresina McGuire Accounting Assistant
Daniel C Tosteson ChairProfessor of Cell Biology, Dean Emeritus, Harvard Medical School
Ross AndersonProfessor and Head, Department of Public Health Sciences, St George’s Hospital Medical School, London University
John C Bailar IIIProfessor Emeritus, The University of Chicago
John R HoidalProfessor of Medicine and Chief of Pulmonary/Critical Medicine,University of Utah
Thomas W KenslerProfessor, Division of Toxicological Sciences, Department ofEnvironmental Sciences, Johns Hopkins University
Brian LeadererProfessor, Department of Epidemiology and Public Health, YaleUniversity School of Medicine
Thomas A LouisProfessor, Department of Biostatistics, Bloomberg School of PublicHealth, Johns Hopkins University
Edo D PellizzariVice President for Analytical and Chemical Sciences, ResearchTriangle Institute
Nancy ReidProfessor and Chair, Department of Statistics, University of Toronto
William N RomProfessor of Medicine and Environmental Medicine and Chief ofPulmonary and Critical Care Medicine, New York UniversityMedical Center
Sverre VedalProfessor, University of Colorado School of Medicine; Senior Faculty,National Jewish Medical and Research Center
Richard F Celeste ChairPresident, Colorado College
Donald Kennedy Vice ChairEditor-in-Chief, Science; President (Emeritus) and Bing Professor ofBiological Sciences, Stanford University
Archibald Cox Chair Emeritus Carl M Loeb University Professor (Emeritus), Harvard Law School
Purnell W ChoppinPresident Emeritus, Howard Hughes Medical Institute
Alice HuangSenior Councilor for External Relations, California Institute of Technology
Richard B StewartUniversity Professor, New York University School of Law, and Director,New York University Center on Environmental and Land Use Law
Robert M WhitePresident (Emeritus), National Academy of Engineering, and SeniorFellow, University Corporation for Atmospheric Research
fold line

Synopsis of Research Report 113S T A T E M E N T
This Statement, prepared by the Health Effects Institute, summarizes a research project funded by HEI and conducted by Drs Kenneth W Tur-teltaub and Chitra Mani at Lawrence Livermore National Laboratory, Livermore CA, and the University of California, San Francisco CA. The fol-lowing Research Report contains both the detailed Investigators’ Report and a Commentary on the study prepared by the Institute’s HealthReview Committee.
Benzene Metabolism in Rodents at Doses Relevant to Human Exposure
Human exposure to high levels of benzene is associ-ated with development of leukemia and other blooddisorders, but the effects of exposure to low levels ofbenzene are not well understood. In the 1990s, HEIinitiated its Air Toxics Research Program to addressuncertainties about health effects of ambient levels ofbenzene and other air toxics derived from mobile andother sources. One of the program’s goals was todevelop methods sensitive enough to measure ben-zene metabolism at low exposure levels. Such sensi-tivity is important because one or more benzenemetabolites are thought to be responsible for benzene’stoxic effects. In addition, understanding benzenemetabolism at low exposure levels is critical to ben-zene risk assessment because the shape of the dose-response curve at low concentrations is not yetresolved.
APPROACH
HEI funded Dr Kenneth Turteltaub to investigatebenzene metabolism in rodents over a hundred mil-lion–fold dose range. This range encompassed concen-trations close to those of human ambient exposure,generally 1 to 10 parts per billion. Turteltaub and hiscolleague, Chitra Mani, administered radioactive ben-zene to mice and rats and subsequently analyzed bonemarrow, liver, urine, and plasma from these animals. Inmost experiments, the investigators injected animalsintraperitoneally with radioactive benzene, but insome experiments they exposed animals to 14C-labeledbenzene via inhalation. After exposure, the investiga-tors coupled high-performance liquid chromatography(HPLC; to separate benzene metabolites) with the noveland sensitive technique accelerator mass spectrometry(to measure 14C) in order to measure low levels ofmetabolites. Accelerator mass spectrometry was devel-oped by nuclear physicists to measure low levels (10−15
to 10−18 molar) of long-lived isotopes such as 14C.
RESULTS AND INTERPRETATION
In this innovative study of benzene metabolism,Turteltaub and Mani detected dose-dependent forma-tion of benzene metabolites in plasma, bone marrow,and liver of mice over a wide range of doses (5 ng/kgto 500 mg/kg). Benzene metabolites, including DNAand protein adducts, were detected at levels 100times lower than had been found in previous studies.
Even at low benzene exposure concentrations, theinvestigators detected higher levels of benzene metabo-lites in mouse and rat bone marrow and liver than inplasma. This finding indicates that benzene reaches tis-sues and is metabolized there, even at levels close tothose to which humans are exposed in ambient air. Inaddition, Turteltaub and Mani found that the levels ofDNA and protein adducts detected in bone marrow andliver in different rodents generally correlated well withthe ability of benzene to induce tumors in that speciesor strain. This result suggests that the formation ofadducts may be an early marker of benzene carcinoge-nicity.
All doses of benzene produced a similar pattern ofmetabolites in mouse urine, suggesting that the patternof benzene metabolism is similar at widely disparateconcentrations. This finding is of interest becauseother studies have suggested that the pattern of ben-zene metabolites differs depending on the benzeneconcentration to which animals are exposed. Such dif-ferences in metabolism of benzene could affect theshape of the exposure-response curve. However, Tur-teltaub and Mani’s results are difficult to compare withprevious studies: Although the current study hasgreater intrinsic analytic sensitivity than previousstudies, it did not detect a metabolite previously foundin the urine of rodents exposed to benzene.
Although results of the current study show thepotential of accelerator mass spectrometry coupledwith HPLC, they also illustrate the drawbacks. First,

Research Report 113
Copyright © 2003 Health Effects Institute, Boston MA USA. Cameographics, Union ME, Compositor. Printed at Capital City Press, Montpelier VT.Library of Congress Catalog Number for the HEI Report Series: WA 754 R432.The paper in this publication meets the minimum standard requirements of the ANSI Standard Z39.48-1984 (Permanence of Paper) effectivewith Report 21 in December 1988; and effective with Report 92 in 1999 the paper is recycled from at least 30% postconsumer waste with Reports25, 26, 32, 51, 65 Parts IV, VIII, and IX, 91 and 105 excepted. These excepted Reports are printed on acid-free coated paper.
in the current study, urine from mice exposed to radio-active benzene contained a large peak of radioactivitythat could not be identified by HPLC. The investiga-tors did not look for this material in plasma or bonemarrow; thus, the peak might also have been presentin samples from these tissues, with an uncertainimpact on the results. This unidentified radioactivematerial may be a contaminant of the radioactive mate-rial used in the assays, a previously unidentifiedmetabolite, or the decomposition product of a knownbenzene metabolite.
Second, the technique requires administering radio-labeled benzene to the study animals. Although themethod uses extremely low levels of radioactive ben-zene, such an approach is not broadly applicable forcontrolled exposure studies with humans because ben-zene is classified as a known human carcinogen. Third,this study indicates the potential influence on resultsof varying methods of biomarker collection, storage,and processing. In the current study, glucuronidase
inhibitors were not added to urine samples, whichpossibly resulted in the degradation of a major metab-olite, hydroquinone glucuronide, that was detected inother studies of benzene metabolism.
Even given these challenges, Turteltaub and Maniprovided important information about benzenemetabolism at the lowest end (5–500 ng/kg bodyweight) of the range of benzene doses tested: the dose-response curve for metabolite formation was flatterthan that of higher benzene doses but was above zero.This result indicates that metabolism of benzene toactivated metabolites occurs even at very low doses. Itfurther suggests, but does not show conclusively, thatthe dose-response curve for benzene in mice lacks anobvious threshold at the lowest exposure levels evalu-ated. This finding may have important ramificationsfor understanding the human response to low-levelbenzene exposures. Further studies are required toresolve the shape of the dose-response curve forhumans at these low benzene levels.

CONTENTSResearch Report 113
H E A L T HE F F E C T SINSTITUT E Benzene Metabolism in Rodents at Doses Relevant to
Human Exposure from Urban AirKenneth W Turteltaub and Chitra Mani
Molecular and Structural Biology Program/Center for Accelerator Mass Spectrometry, Lawrence Livermore National Laboratory, Livermore, California, and Department of Pharmaceutical Chemistry, University of California, San Francisco, California
HEI STATEMENT This Statement is a nontechnical summary of the Investigators’ Report and the Health Review Committee’s Commentary.
INVESTIGATORS’ REPORTWhen an HEI-funded study is completed, the investigators submit a final report. The Investigators’ Report is first examined by three ouside technical reviewers and a biostatistician. The report and the reviewers’ comments are then evaluated by members of the HEI Health Review Committee, who had no role in selecting or managing the project. During the review process, the investigators have an opportunity to exchange comments with the Review Committee and, if necessary, revise the report.
Abstract . . . . . . . . . . . . . . . . . . . . . . . . . . . . . . . . . . . . . . 1Introduction . . . . . . . . . . . . . . . . . . . . . . . . . . . . . . . . . . 2Specific Aims . . . . . . . . . . . . . . . . . . . . . . . . . . . . . . . . .4Methods and Study Design . . . . . . . . . . . . . . . . . . . . . 4
Chemicals and Metabolite Standards. . . . . . . . . .4Animals . . . . . . . . . . . . . . . . . . . . . . . . . . . . . . . . . . . . 5 Benzene Administration . . . . . . . . . . . . . . . . . . . . . 5Sample Collection and HPLC Analysis . . . . . . . . . 6Isolation of DNA from Tissue Samples. . . . . . . . . 7Isolation of Protein from Tissue Samples . . . . . . 7AMS Analysis . . . . . . . . . . . . . . . . . . . . . . . . . . . . . . . 7Statistical Methods and Data Analysis . . . . . . . . . 8
Results . . . . . . . . . . . . . . . . . . . . . . . . . . . . . . . . . . . . . . . 9Benzene Metabolism at Low Doses in
B6C3F1 Mice . . . . . . . . . . . . . . . . . . . . . . . . . . . . . . 9Relation Between Dose and Macro-
molecular Adduct Formation in B6C3F1 Mice . . . . . . . . . . . . . . . . . . . . . . . . . . . . .11
Macromolecular Adduct Levels Among Rats and Mice by AUC . . . . . . . . . . . . . . . . . . . . .13
Macromolecular Adducts in Rats and B6C3F1 Mice After Low-Dose Benzene Inhalation . . . . . . . . . . . . . . . . . . . . . . .15
Discussion . . . . . . . . . . . . . . . . . . . . . . . . . . . . . . . . . . 18Metabolism of Benzene to Reactive
Intermediates in B6C3F1 Mice. . . . . . . . . . . . . . 18Distribution of Reactive Benzene
Metabolites Among Liver, Bone Marrow, and Urine in B6C3F1 Mice . . . . . . . . . 19
Relation Between Metabolite Levels and Macromolecular Adduct Formation in B6C3F1 Mice . . . . . . . . . . . . . . . . . . . . . . . . . . . 20
Relation Between Macromolecular Adduct Levels and Toxicity in Rodents . . . . . . 20
Inhalation Versus IP Exposure to Benzene . . . . . . . . . . . . . . . . . . . . . . . . . . . . . . . 21
Summary . . . . . . . . . . . . . . . . . . . . . . . . . . . . . . . . . 21Implications of Findings . . . . . . . . . . . . . . . . . . . . . . 21Acknowledgments. . . . . . . . . . . . . . . . . . . . . . . . . . . . 22References . . . . . . . . . . . . . . . . . . . . . . . . . . . . . . . . . . 22Appendix Available on Request . . . . . . . . . . . . . . . . 26About the Authors . . . . . . . . . . . . . . . . . . . . . . . . . . . . 26Other Publications Resulting from
This Research. . . . . . . . . . . . . . . . . . . . . . . . . . . . . . . 26Abbreviations and Other Terms. . . . . . . . . . . . . . . . 26
Continued

Research Report 113
COMMENTARY Health Review CommitteeThe Commentary about the Investigators’ Report is prepared by the HEI Health Review Committee and Staff. Its purpose is to place the study into a broader scientific context, to point out its strengths and lim-itations, and to discuss remaining uncertainties and implications of the findings for public health.
Introduction. . . . . . . . . . . . . . . . . . . . . . . . . . . . . . . . . 27Scientific Background . . . . . . . . . . . . . . . . . . . . . . . . 27
Benzene Metabolism and Mechanism of Toxic Effects . . . . . . . . . . . . . . . . . . . . . . . . . . . 27
Assessment of Risk. . . . . . . . . . . . . . . . . . . . . . . . . 28Technical Evaluation . . . . . . . . . . . . . . . . . . . . . . . . . 29
Aims . . . . . . . . . . . . . . . . . . . . . . . . . . . . . . . . . . . . . 29
Methods . . . . . . . . . . . . . . . . . . . . . . . . . . . . . . . . . . 29Results . . . . . . . . . . . . . . . . . . . . . . . . . . . . . . . . . . . 30
Discussion . . . . . . . . . . . . . . . . . . . . . . . . . . . . . . . . . . 32Summary and Conclusions . . . . . . . . . . . . . . . . . . . 33Acknowledgments . . . . . . . . . . . . . . . . . . . . . . . . . . . 33References . . . . . . . . . . . . . . . . . . . . . . . . . . . . . . . . . . 34
RELATED HEI PUBLICATIONS
Publishing History: This document was posted as a preprint on www.healtheffects.org and then finalized for print.
Citation for whole document:
Turteltaub KW, Mani C. 2003. Benzene Metabolism in Rodents at Doses Relevant to Human Exposure from Urban Air. Research Report 113. Health Effects Institute, Boston MA.
When specifying a section of this report, cite it as a chapter of the whole document.

Health Effects Institute Research Report 113 © 2003 1
INVESTIGATORS’ REPORT
Benzene Metabolism in Rodents at Doses Relevant to Human Exposure from Urban Air
Kenneth W Turteltaub and Chitra Mani
ABSTRACT
Benzene is both an environmental pollutant and a com-ponent of cigarette smoke, gasoline, and automotive emis-sions. Although occupational exposure to benzene has beenshown to cause blood disorders and cancer in humans, thepotential health effects resulting from exposure to lowlevels of benzene are not known. The goals of this projectwere to determine how well benzene is metabolized and toassess its binding to macromolecules in rodents at dosesmore closely mimicking human environmental exposure.
To determine whether genotoxic metabolites of benzeneare produced at environmental exposure levels, variousdoses of 14C-benzene were given intraperitoneally to maleB6C3F1 mice at doses from 5 ng/kg to 500 mg/kg bodyweight. Samples of urine, plasma, liver, and bone marrowwere taken at selected times up to 48 hours after exposure.Individual benzene metabolites in the samples were mea-sured by accelerator mass spectrometry (AMS*). Metabo-lites were quantified by determining the area under thecurve (AUC) for 24 to 48 hours. The major metabolites foundin urine were an unidentified radiolabeled metabolite,phenyl sulfate, phenyl glucuronide, and muconic acid (anindicator of muconaldehyde formation). The major metabo-lites found in plasma, liver, and bone marrow samples weremuconic acid and hydroquinone. Only liver showed a doseresponse for hydroquinone and muconic acid.
The kinetics of both DNA and protein adduct formationwere assessed over 48 hours at a 14C-benzene dose of5 µg/kg body weight. A dose-response study was then con-ducted using 14C-benzene doses from 5 ng/kg to 500 mg/kgbody weight in B6C3F1 mice. Adduct levels were deter-mined by AMS in liver and bone marrow. DNA and pro-tein adducts in liver reached maximum levels 30 minutesafter benzene administration, whereas those in bonemarrow reached maximum levels after six hours. Both pro-tein and DNA adduct AUCs were greater in bone marrowthan in liver. Dose-response assessments at both 1 and12 hours showed that DNA and protein adducts in liverand bone marrow were dose dependent over doses span-ning eight orders of magnitude. Consistent with the ben-zene metabolism data, these data show that reactive formsof benzene were present in liver and bone marrow afterexposure to human-relevant benzene levels. Thus, at lowdoses, benzene was absorbed and metabolized into reac-tive intermediates capable of binding to DNA and protein.
The relation between benzene metabolism and macro-molecular binding was examined by comparing benzenemacromolecular adduct formation among strains of malemice (B6C3F1, DBA/2, and C57BL/6) and male rats. Theseanimals have been reported to have different metaboliccapacities for benzene and also different tumorigenic andcytotoxic responses to benzene exposure. We hypothe-sized that differences in the capacity to metabolize ben-zene affect macromolecular adduct formation and that theamount of macromolecular damage is related to benzene’sability to cause cancer and other blood disorders. 14C-ben-zene was administered intraperitoneally to all rodents(5 µg/kg body weight) and adduct levels were determinedby AMS at selected time points up to 48 hours after expo-sure. AUCs for protein and DNA adducts in bone marrow,the primary target organ for benzene toxicity, decreased inthe following order: B6C3F1, DBA/2, C57BL/6, and rats.Similarly, adduct AUCs in liver were greater in B6C3F1mice than in rats although the trend was less clear for theDBA/2 and C57BL/6 mouse strains. The results of this workare consistent with previously published work showing
* A list of abbreviations and other terms appears at the end of the Investiga-tors’ Report.
This Investigators’ Report is one part of Health Effects Institute ResearchReport 113, which also includes a Commentary by the Health Review Com-mittee and an HEI Statement about the research project. Correspondence con-cerning the Investigators’ Report may be addressed to Kenneth W Turteltaub,BBR–Program, 7000 East Avenue, PO Box 808, L-452, Livermore CA 94554.
Although this document was produced with partial funding by the UnitedStates Environmental Protection Agency under Assistance AwardR82811201 to the Health Effects Institute, it has not been subjected to theAgency’s peer and administrative review and therefore may not necessarilyreflect the views of the Agency, and no official endorsement by it should beinferred. The contents of this document also have not been reviewed by pri-vate party institutions, including those that support the Health Effects Insti-tute; therefore, it may not reflect the views or policies of these parties, andno endorsement by them should be inferred.

2
Benzene Metabolism at Doses Relevant to Human Exposure
that the ability to metabolize benzene follows a similar pat-tern with these animals and is consistent with the tumorige-nicity of benzene in mice and rats. Thus, our data suggestthat benzene toxicity is related to the ability to producemacromolecular adducts.
Preliminary studies were conducted to assess adductdosimetry after low-dose inhalation of benzene. Inhalationmethods were developed to administer a nominal bodyburden of 5 µg benzene/kg body weight. Then, 14C-ben-zene was administered to B6C3F1 mice and rats by bothintraperitoneal (IP) administration and by inhalation, andDNA and protein adducts in liver and bone marrow wereanalyzed by AMS. AUCs for adduct levels were greaterafter IP benzene administration than after inhalation ofbenzene. Adduct levels were greater in DNA from B6C3F1mouse bone marrow than in DNA from liver regardless ofexposure route. Collectively, these data show that theinternally reactive dose was greater when benzene expo-sure was by IP administration.
In summary, the results suggest that benzene is metabo-lized to reactive forms capable of binding both protein andDNA in target and nontarget organs of rats and mice at dosesencountered by humans through environmental exposure.Macromolecular binding was dose-dependent at low dosesof benzene and reflected benzene toxicity, based on its car-cinogenicity and ability to cause other blood-related disor-ders. These data are consistent with macromolecularadducts being indicative of benzene exposure and benzenetoxicity although much more research is needed to validatethis point. Additionally, benzene metabolism varies amongspecies and among strains within a species of rodent. Thusdata are needed in humans to understand how to use therodent data in risk assessment and ultimately to determinewhether macromolecular adducts are a useful indicator ofexposure and a useful predictor of risk.
INTRODUCTION
Benzene is a well-known industrial chemical and pol-lutant that is distributed widely in the environment viafossil fuel combustion, motor vehicle exhaust, forest fires,and other combustion processes. Other common sources ofexposure include tobacco smoke and volatilization duringthe fueling of automobiles (Wallace et al 1984; Wallace1989). Benzene is also used industrially as a solvent and asa raw material for chemical synthesis.
A variety of studies have been conducted to estimatehuman exposure to benzene from environmental andoccupational sources (Wallace 1984; Smith 1996; Wallace1996; Cocheo et al 2000). Major environmental sources of
exposure are active and passive smoking, auto exhaust,and driving or riding in automobiles. These studies indi-cate that benzene concentrations in outdoor air range fromless than 5 µg/m3 to 20 µg/m3, depending on location andtime of day. Personal exposures, based on sampling of theair microenvironments surrounding study participants,are estimated to range between 6 and 29 µg/m3. Exposurevia indoor air is estimated to be 2 to 8 µg/m3, and exposurewhile driving automobiles averages about 10 to 40 µg/m3.After active smoking, some of the highest exposures occurwhile filling automobile gasoline tanks during which inha-lation doses are estimated at 80 to 100 µg/person per tank-filled. Body burden estimates from ambient exposures,based on benzene concentration in blood measured in 900randomly selected people, are 15 to 1800 ng/L blood, witha mean of 131 ng/L. Wallace and colleagues (1984) suggestthat the average person living in an urban environmentinhales 0.6 mg benzene a day.
Filling station attendants reportedly are exposed toapproximately 0.53 mg/m3 benzene per year, with ben-zene/air concentrations of 0.003 to 0.6 ppm in the imme-diate microenvironment (Carere et al 1995; Nillson et al1996). Mean exposures for benzene plant and cokeryworkers have been reported to be 0.9 cm3/m3 time-weighted average (2.9 mg/m3); and the highest individualvalue was 15 cm3/m3 time-weighted average (49 mg/m3)(Kivistö et al 1997). Reported occupational exposures tobenzene in 30 other job categories range between 3 and68.7 mg/m3 with air concentrations of 0.003 to 8.20 ppm(Tompa et al 1994).
Thus, ambient human exposure to benzene can rangewidely depending on location and activity but is generallywithin 2 to 30 µg/m3 with body burdens of a few hundrednanograms per liter blood per person. People exposed occu-pationally to benzene may receive exposures 100 to1000 times greater than ambient exposures. Smoking, whichprovides the greatest environmental exposure to benzene,results in body burdens 5 to 10 times those of nonsmokers.
Exposure to benzene is a health concern. Benzene is amultiorgan carcinogen in mice (Snyder and Kocsis 1975;Maltoni et al 1983; Huff et al 1989; Maltoni et al 1989;Snyder and Kalf 1994). In humans, exposure to high levelsof benzene, such as those in occupational settings, leads toblood disorders in humans such as pancytopenia (Gold-stein 1977) and leukemia (Aksoy and Erdem 1978; Cron-kite et al 1984). Regulations limit the maximumpermissible occupational benzene exposure to 1 ppm inair averaged over eight hours of work with a 40-hour workweek (US Occupational Health and Safety Administration1987; Rinsky et al 1989; American Conference of Govern-mental Industrial Hygienists 1999).

3
KW Turteltaub and C Mani
Because benzene exposure is unavoidable and presentshealth risks at occupational doses, understanding whatrisks benzene may present at the lower doses people receivein the environment is important. Molecular markers of ben-zene-induced biological damage would help determine thisrisk. Benzene toxicity (indicated by blood disorders andcancer) is generally believed, although not proven, to resultfrom metabolism of benzene to reactive intermediates (seeFigure 1 for pathways) that then interact with DNA or pro-tein. Large differences have been found in benzene toxicityamong various animal models (US Department of Healthand Human Services 1986; Sabourin et al 1988a, 1992), andthese differences may be due to differences in the ability tometabolize benzene (metabolic capacity). Differences among
humans in benzene metabolism correlate with incidence ofnonlymphocytic leukemia and related myelodysplastic syn-dromes (Rothman et al 1997). Several studies have sug-gested that the dihydroxylated metabolites of benzene(hydroquinone and catechol), as well as muconaldehyde,are toxic (Snyder and Kalf 1994; Snyder and Hedli 1996).These metabolites may lead to formation of macromolecularadducts, which represent the amount of carcinogen that hasbecome metabolically activated and subsequently hasbound covalently to DNA and protein. Benzene may alsostimulate production of reactive oxygen or nitrogen speciesthat, both alone and in combination with specific benzenemetabolites, damage DNA and protein (Eastmond et al 1987;Laskin et al 1987; Kolachana et al 1993; Tuo et al 1999).
Figure 1. Important pathways of benzene metabolism in rodents. Most benzene is oxidized to phenol and conjugated to glucuronide or sulfates (thispathway is indicated by bold arrows). Pathways leading to the formation of muconaldehyde and phenylmercapturic acid are also shown.

4
Benzene Metabolism at Doses Relevant to Human Exposure
Thus, we hypothesize that differences in the metabo-lism of benzene and in the resulting levels of macromolec-ular adducts will indicate the potential for overt toxicitysuch as development of cancer. Importantly for thishypothesis, both metabolites and macromolecular adductscan be quantitatively measured and characterized prior todevelopment of tumors and thus may be early indicators ofboth exposure and risk. Studying these endpoints after low-dose benzene exposure should help determine whetherbenzene can present a health risk at its current environ-mental exposure levels and whether its metabolites andadducts can be used to estimate exposure or risk in humans.
At present, very little is known about the health risksposed by benzene in urban air (Cronkite 1987; Cronkite etal 1989; Huff et al 1989; Sabourin et al 1989; Snyder et al1993). DNA adducts have been found in rodents afteradministration of benzene (Snyder et al 1978; Arfellini etal 1985; Bauer et al 1989; Mazzullo et al 1989; Bodell et al1994; Pathak et al 1995; Levay et al 1996; Creek et al 1997),and one benzene DNA adduct has been characterized(Pongracz and Bodell 1996). Benzene has also been shownto form protein adducts in tissues and adducts withalbumin and hemoglobin in blood (Mazullo et al 1989; Sunet al 1990; Creek et al 1997; Yeowell-O’Connell et al 1998).However, the relations among metabolism, adduct forma-tion, and susceptibility, especially at low doses of benzene,are currently unknown.
Conducting such low-dose studies has historicallybeen difficult due to limitations in the available analyticmethods. We believe, however, that such studies are pos-sible using radioisotope-labeled benzene and the ultra-sensitive AMS. This method for analysis of isotope ratioscan measure 14C into the low attomole (10�18 mol) rangewith precision of greater than 5% (Turteltaub et al 1993;Turteltaub and Vogel 1995; Vogel et al 1995).
SPECIFIC AIMS
The purpose of this study was to explore the use of AMSto assess benzene dosimetry in rodents after doses relevantto human ambient exposure. We also intended to studywhether metabolite or adduct levels can be used to distin-guish between exposure groups and animal models withdifferent biological responses to benzene challenge. Thiswork assumed that benzene toxicity requires metabolismto reactive intermediates that bind macromolecules andthat differences in adduct levels represent differences inthe kinetics and metabolism of benzene.
The specific objectives were to:
1. Determine how dose influences benzene metabolism
by measuring metabolite profiles in male B6C3F1mice after administering IP benzene (5 ng/kg to500 mg/kg body weight) , placing particularemphasis on the metabolites that may be markers ofbenzene bioactivation (hydroquinone, muconic acid,catechol, and phenol).
2. Investigate how benzene metabolism leads to macro-molecule damage at doses directly relevant tohumans by comparing metabolite profiles with mac-romolecular adduct levels in bone marrow of maleB6C3F1 mice.
3. Compare the formation of benzene macromolecularadducts among different types of rodents (threemouse strains and rat) after exposure to low doses ofbenzene.
4. Begin developing methods for conducting low-doseinhalation studies in combination with AMS.
METHODS AND STUDY DESIGN
CHEMICALS AND METABOLITE STANDARDS
[U-14C]-benzene (58.3 mCi/mmol; 99% radiopure) wasobtained from Sigma Chemical Company (St Louis MO).Radiopurity was determined by high-performance liquidchromatography (HPLC; model 1084B, Hewlett-Packard,Palo Alto CA) equipped with a C-18 column (10 mminternal diameter × 25 cm; Rainin, Emeryville CA). Theanalysis was carried out isocratically (70% [vol/vol] meth-anol/30% [vol/vol] water) at a flow rate of 1 mL/min.Metabolites were detected by ultraviolet (UV) absorptionat 254 nm and liquid scintillation counting of fractionscollected at one-minute intervals. Under these conditions,benzene eluted at approximately seven minutes and nocontaminant peaks were observed.
Benzene (used to dilute the specific activity of 14C-ben-zene) was obtained from Aldrich Chemical Company (Mil-waukee WI). Ribonuclease (RNase) A (enzyme classificationnumber [EC] 3.1.27.5), RNase T1 (EC 3.1.27.3), proteinase K(EC 3.4.21.14), 3-(N-morpholino)propanesulfonic acid(MOPS), urea, and Triton-X 100 were obtained from Sigma.Tributyrin was obtained from ICN Biochemicals (ClevelandOH). Protein assay reagent and dithiothreitol (DTT) wereobtained from Pierce (Rockford IL). All other chemicalswere analytic grade.
Catechol, hydroquinone, muconic acid, and phenol, allgreater than 99% pure, were obtained from Sigma. Hydro-quinone sulfate, phenyl glucuronide, and phenyl sulfatewere obtained from Dr William Bechtold at the LovelaceRespiratory Research Institute (Albuquerque NM).

5
KW Turteltaub and C Mani
ANIMALS
Male B6C3F1, DBA/2, and C57BL/6 mice (30 g) and maleFischer rats (200 g; F344/Sim) were from Simonsen Labora-tories (Gilroy CA). These animals were selected because oftheir previous use in tumor and genotoxicity studies andbecause published data suggest that they differ in suscepti-bility to benzene toxicity. Prior to the study, all protocolsutilizing animals were reviewed and approved by the Insti-tutional Animal Care and Use Committees at the LawrenceLivermore National Laboratory and the Lovelace Respira-tory Research Institute. Before use, animals were acclima-tized for a minimum of one week in an animal care facilityaccredited by the Association for Assessment and Accredi-tation of Laboratory Animal Care. Animals were housed,three per cage, in filter-top, polycarbonate cages with hard-wood-chip bedding. They were given water and food adlibitum, kept on a 12-hour light/dark cycle, and maintainedat approximately 22°C throughout the study.
BENZENE ADMINISTRATION
Two different routes of exposure were used in thisproject: IP and inhalation. All dose-response studies werecarried out by IP administration. The toxicokinetics studieswere carried out using both the IP and inhalation routes.
IP Administration
For dose-response studies, appropriate doses (see Fig-ures 3, 4, and 6) were obtained by diluting the specificactivity of radiolabeled benzene with unlabeled benzeneso that each animal received 0.1 µCi of 14C-benzene incorn oil (200 µL/animal). Control animals were given cornoil only. For the toxicokinetic studies using the IP route,animals were treated with 5 µg 14C-benzene per kg bodyweight in corn oil (200 µL/animal) and killed by carbondioxide (CO2) asphyxiation at intervals from 0 to 48 hoursafterward (see Tables 5 and 6 for time points). Dosing solu-tions were used within two weeks of preparation.
Inhalation Exposure: Rats
Inhalation exposure of rats was carried out at the Love-lace Respiratory Research Institute using methodsreported by Sabourin and colleagues (1987) under thesupervision of Dr Janet Benson. Briefly, a J-tube vapor gen-erator was used to produce 14C-benzene vapor. The ben-zene exposure concentration was continuously monitoredby infrared spectroscopy (Foxboro Miran, Wilkes Scien-tific, Norwalk CT).
To determine the toxicokinetics of benzene inhalationexposure, rats were exposed by nose only to 0.1 ppm 14C-
benzene (0.09 µCi/animal), delivered at a rate of 0.2 L/minfor 20 minutes, which resulted in a nominal delivereddose of 5 µg/kg body weight (see calculations below).
The concentration of benzene in air was determinedusing the following general formula:
mg/m3 = [ppm] × [Molecular Weight/22.4] (1) × [P/P0] × [T0/T](1)
Thus, assuming a barometric pressure (P) of 620 mm Hg(Albuquerque NM) and an exposure chamber temperature(T) of 293 kelvin (20°C) while T0 is 273 kelvin (0°C) and P0is partial pressure of 760 mm Hg, the equation becomes
mg/m3 = µg/L
= 0.1 × [78/22.4] × [620/760] × [273/293]
= 0.26 µg/L Benzene in Air.
The delivered benzene dose was then determined usingformula (2):
Body Burden = 0.26 µg/L × 0.2 L/min
× 20 min/rat (2)
= 0.0052 µg/rat
= 5 µg/kg for a 200g rat.
After exposure, the rats were housed in polycarbonatechambers in a negative airflow unit. At 0, 0.5, 1, 3, 12 and24 hours after the end of the exposure, three animals pertime point were killed by CO2 asphyxiation and their tis-sues collected for analysis by AMS.
Inhalation Exposure: Mice
The inhalation chamber at the Lovelace RespiratoryResearch Institute was not equipped to deliver the 5 µg/kgdose of benzene by nose-only exposure to mice due to thelow body weight. Therefore, an inhalation chamber wasconstructed in Livermore, California, for this purpose:using a 4-L glass jar, 3 holes were made in the lid forinserting mice. Each hole was fitted with a 50-mL centri-fuge tube with another hole cut at the bottom large enoughto restrain one mouse for nose-only inhalation. This setuppositioned the nose a few millimeters into the jar. A fourthhole in the lid housed a small injection port into which agas-tight syringe was inserted for delivery of 14C-benzeneand for sampling the benzene concentration in the air.
To facilitate benzene evaporation, the inhalationchamber was heated to 50°C from the bottom with an

6
Benzene Metabolism at Doses Relevant to Human Exposure
infrared lamp. The lamp was turned off just before ben-zene injection: 40 µL of a 0.07% 14C-benzene solution inwater was injected into the chamber and allowed to equil-ibrate for two minutes. Preliminary studies showed that anaverage of 50% (30% to 70%) of the benzene volatilized,giving a nominal benzene concentration of 0.1 ppm in thechamber at standard temperature and pressure (STP) usingthis method. The volatilized fraction was constant for upto six minutes. This was verified by sampling the chamberair with a gas-tight syringe and analyzing its contents byliquid scintillation counting after bubbling into ethanol.The concentration of the benzene placed in the glass jarwas adjusted to correct for the volatilized fraction. Ani-mals were exposed to 0.1 ppm benzene in air for 2.5 min-utes, which attained a nominal body burden for benzeneequivalent to 5 µg/kg body weight, assuming a 30 g mouseand a minute volume of 0.04 L.
The concentration of benzene in air was determined asdescribed in equations (1) and (2), assuming a barometricpressure of 760 mm Hg (Livermore CA) and an exposurechamber temperature of 293 kelvin (20°C):
From equation (1):
mg/m3 = µg/L
= 0.1 ppm × [78/22.4]
× [760/760] × [273/293]
= 1.6 µg/L Benzene in Air.
From equation (2):
Body Burden = 1.6 µg/L × 0.04 L/min × 2.5 min/mouse
= 0.006 µg/mouse
= 5 µg/kg for a 30g mouse.
After the inhalation procedure, animals were returnedto their cages and were kept in negative airflow units. Atspecific time points after the exposure (see Figures 8 and 9,Tables 5 and 6), animals were killed by CO2 asphyxiationand their tissues collected for analysis.
For these time-course studies, historical data on the 14Ccontent in unexposed animals was used as background.The natural amount of radiocarbon in all biological mate-rial is constant in these animals due to their age andgrowth conditions and generally varies by less than 10%.
SAMPLE COLLECTION AND HPLC ANALYSIS
Plasma and Tissue Metabolites
Blood was drawn by cardiac puncture and placed intovials containing 25 units of heparin. Plasma was separatedfrom whole blood by centrifugation at 3000g for 10 minutes.
The plasma was removed, frozen in liquid nitrogen, andstored at −35°C until metabolite analysis. Liver was immedi-ately placed on dry ice and stored at −35°C until use. Bonemarrow was collected by flushing each femur and humeruswith approximately 1 mL of phosphate-buffered saline(PBS), pH 7.4, as previously reported (Creek et al 1997). Tis-sues were usually stored for less than two weeks.
For extraction of metabolites, plasma (100 µL), liver (100mg) and bone marrow from one femur and one humeruswere homogenized using a handheld, motorized homoge-nizer in 0.5 mL of buffer (0.1 M sodium ascorbate, 25 mMsodium phosphate, 30 mM (+)D-saccharic acid-1,4-lactone;pH 7.0). PNPG (p-nitrophenyl glucuronide) was used as aninternal standard to determine extraction efficiency. Eachhomogenate was transferred to disposable glass tubes and3.5 mL of ethyl acetate containing benzene metabolite stan-dards was added (Sabourin et al 1988a). The ethyl acetatestandard solution contained 1.3 mL benzene, 85 mg phenol,63 mg catechol, 630 mg hydroquinone, and an antioxidant(10 g butylated hydroxytoluene) in 500 mL of ethyl acetatepurged with nitrogen. Each homogenate plus ethyl acetatewas centrifuged for 15 minutes at 3000g to separate theaqueous and organic phases.
Each aqueous layer was extracted twice with onevolume of cold ethyl acetate, and the ethyl acetate frac-tions were pooled. An equal volume of methanol wasadded to the aqueous solution and the solution was kepton ice for 20 minutes to precipitate protein. The precipi-tate was pelleted by centri fugation at 3000g for15 minutes. To remove methanol, which interferes withHPLC analysis, each aqueous fraction was then evaporatedunder nitrogen to one half its volume.
Individual metabolites were separated and quantitatedby HPLC (as reported by Sabourin et al 1988a). Data werenormalized to the recoveries of the internal standard andwere expressed as femtomoles of [14C]-labeled metaboliteper milliliter HPLC eluent (Bechtold et al 1988). Ethyl-acetate tissue extracts were analyzed using a RaininHPLC system equipped with a C-18 phenomenex-DBsemipreparatory column (250 × 10 mm, pore size 8 µm).Mobile phases were acetonitrile (hereafter called solventA) and 10 mM KH2PO4 buffer (hereafter called solvent B)with uncorrected pHs. Samples were injected after thecolumn was equilibrated at 100% solvent A. The compo-sition of the solvents was changed using a linear gradientfrom 0% to 10% solvent B over 5 minutes. From 5 to30 minutes, the solvent composition was modified from10% solvent B to 100% solvent B and then held isocraticfor an additional 10 minutes. Metabolite detection andquantification was carried out as described for urinarymetabolites below.

7
KW Turteltaub and C Mani
Urinary Metabolites
Urine was collected for 24 hours after exposure into vialscontaining 2% ascorbic acid to prevent oxidation of metab-olites. These samples were stored in the dark at −35°C untilanalyzed. Urine samples were each centrifuged at 600g for15 minutes to remove particulates. Urinary benzene metab-olites were then analyzed by HPLC as follows: A maximumof 10 disintegrations per minute of [14C]-containing urinewas injected onto an Econosphere C18 HPLC column (10-µm particle size, 250 mm length, 4.6 mm internal diameter;Alltech, Deerfield IL) equipped with a Brownlee C-18 guardcartridge (10-µm particle size). The metabolites were sepa-rated using a Rainin binary system with solvents A and B asdescribed in Sabourin and colleagues (1988b). Two differentconcentrations of tetrabutylammonium hydrogen sulfate(TBAHS) solution, 50 mM TBAHS in deionized water and35 mM TBAHS in methanol, were prepared. Solvent A con-tained 90% aqueous TBAHS and 10% methanolic TBAHS;solvent B contained 20% aqueous TBAHS and 80% metha-nolic TBAHS. Separation was carried out with a linear gra-dient starting at 0% solvent B for five minutes to 50%solvent B over 30 minutes, with a flow rate of 1 mL/minute.Metabolites were detected by UV absorption at 265 nmusing a 1050 diode array detector (Hewlett-Packard). HPLCfractions were collected at one-minute intervals and 300-µLaliquots of each fraction were dried in a vacuum centrifugeand prepared for AMS analysis using previously publishedmethods (Turteltaub et al 1993).
ISOLATION OF DNA FROM TISSUE SAMPLES
DNA was isolated as previously reported (Creek et al1997). Briefly, approximately 100 mg of pulverized liver orbone marrow from one femur and one humerus were solu-bilized overnight in 4 to 5 mL freshly made lysis buffercontaining 4 M urea, 10 mM Tris-HCl (pH 8.0), 1% Triton-X100, 10 mM DTT, 100 mM NaCl, and 800 µg/mL pro-teinase K at 37°C in a shaking water bath. Samples werethen centrifuged to remove undigested tissue. RNase A(0.5 mg/mL final concentration) and RNase T1 (2500 unitsfinal concentration) were added to the supernatant andincubated for 30 to 60 minutes at 37°C to digest RNA. Thesamples were then loaded onto anion exchange columns(QIAGEN 500, QIAGEN, Chattsworth CA).The columnshad been preequilibrated with loading buffer (750 mMNaCl, 50 mM MOPS, 15% ethyl alcohol [EtOH],and 0.15%Triton X100; pH 7.0), washed three times with washingbuffer (1 M NaCl, 50 mM MOPS, and 15% EtOH; pH 7.0),and eluted in elution buffer (125 mM NaCl, 50 mM MOPS,and 15% EtOH; pH 8.0). To precipitate DNA, samples weremixed with one volume ice-cold isopropyl alcohol, were
stored for at least 12 hours at −20°C, and were centrifugedat 3000 rpm for 3 to 4 hours at 4°C. This procedure yieldedabout 100 µg of DNA with an A260/A280 ratio of 1.7 to 1.9per 100 mg tissue. DNA concentrations were determinedby UV absorption at 260 nm, assuming that an A260 of 1.0represents 50 µg/mL DNA.
ISOLATION OF PROTEIN FROM TISSUE SAMPLES
Approximately 100 mg liver or bone marrow from onefemur and one humerus was pulverized and lysed with theprocedure used for DNA isolation without the added pro-teinase K. After centrifugation, all unsolubilized tissuewas removed by decanting the supernatant. Perchloricacid (PCA; 70% vol/vol) was added to the supernatant togive a final concentration of 5% PCA. The samples werecentrifuged at 1800g for 15 minutes at room temperature,and the pellet was resuspended in 1 to 2 mL of ice-cold 5%PCA. The precipitate was then pelleted by centrifugation at1800g and washed twice with 50% (vol/vol) methanol andonce with 50% (vol/vol) ethanol/ether. The resulting pelletwas allowed to air dry and was resuspended in 0.1 M potas-sium hydroxide (KOH). The protein content of the extractwas determined using the Bradford microassay (Pierce Co,Rockford IL) according to the manufacturer’s instructionsand with bovine serum albumin as the standard.
AMS ANALYSIS
AMS was used to determine the radiocarbon content ofsamples, DNA extracts, protein extracts, and metabolitefractions. Protein isolates and HPLC fractions from theurine metabolite analysis were prepared. Two milligramsof a carbon carrier, tributyrin, was added to each DNAextract and HPLC fraction from liver, plasma and bonemarrow in order to provide the necessary carbon contentfor efficient sample handling. Each sample was placed in aclean quartz tube (6 mm × 30 mm, 4 mm internal diameter)that had been previously baked at 600°C. To avoid contam-ination through handling, exchange of volatiles, and aero-sols, each quartz tube was placed inside the inner of twonested borosilicate glass culture tubes (10 mm × 75 mmand 12 mm × 100 mm) and covered with glass fiber filterpaper (GF/A, 21 mm, Whatman, Springfield Mill, Kent,UK). Samples in the tubes were then dried in a vacuumcentrifuge. The borosilicate tubes containing samples werehandled only with gloves.
The dried samples were then converted to graphiteusing a two-step process (Vogel 1992). Briefly, the samplesin the quartz tubes were removed from the borosilicatetubes with clean forceps and placed into new quartz tubes(6 mm × 50 mm), evacuated, and oxidized to CO2 by

8
Benzene Metabolism at Doses Relevant to Human Exposure
heating at 900°C for four hours in the presence of copperoxide. The CO2 was then cryogenically transferred to asecond 6 × 50 mm quartz tube under vacuum, using a Nal-gene “Y” connector, and was reduced to filamentousgraphite in the presence of cobalt at 900°C. The resultinggraphite on cobalt was placed in the ion source of the spec-trometer and analyzed using previously published proto-cols (Turteltaub et al 1993).
AMS measures the ratio of a rare isotope relative to astable isotope. For 14C-benzene analysis, we measured theconcentrations of 14C relative to 13C and normalized to the14C/12C ratio of 1950 carbon using the Australian NationalUniversity sugar reference standard (Vogel et al 1995). Theratios are converted to mass of 14C-benzene based on thespecific activity of the benzene after subtracting the nat-ural radiocarbon contributed from the sample and tribu-tyrin carrier (when added). Carbon content of the sampleswas determined using a C/N/S analyzer (Carlo-ErbaNA1500, series 2, CE Elantech, Lakewood NJ). Accordingto this analysis, tributyrin, DNA, and protein contained59.6%, 29%, and 31% carbon, respectively. Radiocarbonis a cosmogenic isotope that is present in all biologicalmaterial. Present-day natural levels (background) of 14C inliving biological materials is 112 ± 5 amol/g carbon. Tribu-tyrin, based on analysis of over 500 samples, contains 15 ±2 amol 14C/mg tributryin. AMS measures radiocarbon con-tent only and gives no information on the origin or sourceof the radiocarbon. All radiocarbon data are therefore col-lectively termed benzene equivalents.
All samples were counted to 10,000 total counts (1%counting error). Each sample was also analyzed up toseven times or until the measurement coefficient of varia-tion of the intrasample measurement was within 5%,whichever came first. In no case did the intrasample mea-surement variability exceed 5%. Up to three replicate ani-mals were used at each time point. The mean radiocarboncontent of tributyrin, which was used to increase thecarbon content of some samples, was determined by pre-paring and analyzing at least three independent samplesper set of experimental samples.
STATISTICAL METHODS AND DATA ANALYSIS
All analyses were performed using S-PLUS 2000 (DataAnalysis Products Division, Mathsoft, Seattle WA).
Dose-Response Analyses
The logarithm of the response was used as the depen-dent variable. Taking logarithms stabilized the varianceacross the several orders of magnitude in response fromlow to high doses. Also, due to the large range of dosesconsidered, the logarithm of dose was used as the indepen-dent variable, rather than the dose itself.
For dose response curves for plasma, liver, and marrowand four metabolites (catechol, hydroquinone, muconicacid, and phenol), only three distinct doses were available.Consequently, we ran simple linear regressions of the log-arithm of response on the logarithm of dose. Confidenceintervals for parameters were simple point-wise confi-dence intervals. That is, we did not adjust for multipletesting in this case because a prescribed set of tests was notspecified in advance.
AUC Calculations
In all cases, integrals of estimated functions of responseversus hours after exposure were themselves estimated by:
1. using generalized least squares (GLS) to estimate theaverage response at each time point where therewere data,
2. using error estimates per time point from the GLS fitto estimate the precision of each estimated response,
3. using the trapezoidal rule to estimate the integral,and
4. combining the error estimates per time point to esti-mate the standard error in the trapezoidal rule esti-mate.
GLS (rather than ordinary least squares) was usedbecause the observed variation in error at each time pointwas great. GLS procedures permit more precise fits in situ-ations like these, as long as a parametric relation betweenthe mean and variance can be assumed. Because the log-transformed data showed approximately constant variancewithin each set of time-course data, the nontransformeddata should have a variance that, to first order, would beproportional to the mean. In addition, for these experi-ments, only a small number of animals (two or three) wereused at each time point. Hence, standard error estimatesfor the mean value per time point based on the empiricalstandard deviation of the two or three data points wouldbe extremely unreliable. The only way to obtain reliableestimates of standard errors for average concentrations ateach time point, which are needed to obtain standarderrors for the AUCs, was to make reasonable assumptionsabout the relation between mean and variance and to useGLS to estimate parameters of the mean-variance relation.For these data, the variance was assumed to be propor-tional to a power of the mean, and the exponent and con-stant of proportionality were estimated along with themeans. We used the S-PLUS GLS program for estimation(Pinheiro and Bates 2000).
The trapezoidal rule for estimating an AUC, along withprocedures for estimating its standard error, are fullydescribed in reports by Bailer (1988) and Bailer and Piegorsch

9
KW Turteltaub and C Mani
(1990). Generally, suppose we want to estimate the areaunder an unknown concentration function f(t) constrainedsuch that f(0) = 0. We have a set of n time (t)-concentration(c) pairs (t1, c1), (t2, c2), …, (tn, cn), where 0 < t1 < t2 < … < tn,and ci is measured with variance (v) vi. The trapezoidal ruledefines a simple set of weights (w) w1, w2, …, wn; the areaunder f from 0 to tn can be estimated as w1c1 + … + wncn.The variance of that estimate is given by w1
2v1 + … + wn2vn.
For the species comparison only, data were availablethat allowed calculation of a possible background effect orbias due to 14C from sources other than the labeled ben-zene. These AUC estimates were corrected for backgroundeffect by subtracting the minimum observed value in adata series from each point in the series and then applyingthe algorithm to these adjusted data. (Whenever the min-imum observed value in a series was less than zero, noadjustment was performed.) The adjustment was carriedout to evaluate the effects of possible biases introduced bysample preparation or AMS measurement. For theseexperiments, sample preparation and measurement werenot randomized. Rather, samples for the rat or each strainof mouse were prepared at the same time and measuredconsecutively. Hence, systematic differences between dataseries could be due in part to biases introduced duringthese processes. Estimating the AUC that is above a max-imal positive baseline provides a simple alternate statisticthat can be used in comparisons. Both the unadjusted andadjusted AUCs are presented in the tables.
Multicomparison Analyses
The AUCs for the IP experiments were calculated out to48 hours. Inhalation data, however, were available onlyout to 24 hours. Consequently, the IP AUCs were also cal-culated only out to 24 hours before comparison to inhala-tion AUCs. The asymptotic confidence intervals for thedifference between inhalation and IP AUCs were adjustedto account for the eight comparisons (two tissues × twoadducts × two species) in the inhalation versus IP anal-yses. The adjustment method used was Sidak’s method, asdescribed in the S-PLUS User’s Guide (Mathsoft 1999).
Z tests were used to test for differences among estimatedAUCs for bone marrow DNA adducts, as well as for differ-ences among estimated AUCs for liver macromolecularadducts. The standard error of the difference between twomeans was estimated as the square root of the sum of thesquared standard errors for the two means being com-pared. Test significance thresholds were also adjusted formultiple comparisons using the Sidak method.
RESULTS
BENZENE METABOLISM AT LOW DOSES IN B6C3F1 MICE
Metabolite Analysis by HPLC
An example of the distribution of radiocarbon across anHPLC separation of urine from a B6C3F1 mouse is shownin Figure 2. The radiocarbon levels in the HPLC fractionscollected at one-minute intervals are shown as a histogram,and the UV absorption of the fractions at 265 nm is shownas a continuous trace (gray). The UV trace indicates theretention time for the authentic metabolite internal stan-dards, which were added into the urine samples beforeHPLC separation. The radiocarbon profile correspondedwell with retention of the authentic standards although onemajor radiolabeled peak eluting at eight minutes did notcorrespond to any standards and its identity is presentlyunknown. All the major metabolites of benzene are wellresolved and detectable to levels as low as a few attogramsbenzene equivalents per milliliter urine, assuming the limitof detection was a signal-to-noise ratio of three.
Dose-Dependence of IP Benzene Metabolism
Benzene metabolites in urine of B6C3F1 mice werequantified by HPLC-AMS after administering doses of50 ng/kg to 500 mg/kg body weight. Because metaboliteswere difficult to identify and quantify below a dose of
Figure 2. HPLC-AMS chromatogram of urine collected over 24 hours froma B6C3F1 mouse administered 5 µg 14C-benzene per kg body weight.Phenol (not shown) eluted in fraction 33 (at 33.3 minutes) using this HPLCsystem. The solid line represents the UV trace of standards (labeled byname). Bars represent the radiocarbon content of each HPLC fraction.

10
Benzene Metabolism at Doses Relevant to Human Exposure
5 ng/kg body weight, all dose-response studies usingurine were conducted using doses above 5 ng/kg bodyweight. Three major radiocarbon peaks were detected atall doses analyzed: phenyl sulfate, muconic acid, and theuncharacterized peak described earlier. In addition, twominor metabolites corresponding to phenyl glucuronideand hydroquinone sulfate were observed at all doses(Figure 3). Free catechol and free hydroquinone were alsodetected at low levels but were not dose dependent(shown in Appendix A). Radioisotope levels in urine cor-responding to the elution of phenol were very low andwere detected above background only at the highest doses.
Although the amounts of the three major metabolitesdetected (phenyl sulfate, muconic acid, and the uncharac-terized peak) were dose dependent, their responses tendedto follow an S-shape with the curves flattening at higherdoses. The detected amount of each metabolite relative toone another remained in the same order over the entiredose range with the unidentified metabolite ≥ phenyl sul-fate > muconic acid ≥ phenyl glucuronide > hydroquinonesulfate. These relations are based on the average value ofeach data point at the lower asymptote.
Figure 4 illustrates the dose response for benzene metab-olites in liver, bone marrow, and plasma one hour after
exposure to doses of 5 ng, 50 ng, and 5 µg benzene per kgbody weight. Because of their postulated role in benzenetoxicity, only muconic acid, hydroquinone, catechol, andphenol were analyzed in these samples. The best linear fitsfor the log-transformed dose-response data are shown. In
Figure 3. Dose response for five metabolites in urine from B6C3F1 mice.Geometric means of 14C in HPLC fractions are plotted against adminis-tered dose. Curves were generated by interpolating between the means.
Figure 4. Dose response for four metabolites (catechol, hydroquinone, muconic acid, and phenol) in plasma, liver and bonemarrow from B6C3F1 mice. Each metabolite was quantitated by analyzing the radiocarbon content in HPLC fractions corre-sponding to elution time for well-characterized standards. Separate linear fits of log response on log dose were performed for eachcombination of tissue and metabolite. Lines show the estimated mean metabolite at each log dose.

11
KW Turteltaub and C Mani
the liver, muconic acid, catechol, and hydroquinone for-mation were dose dependent, but phenol formation wasnot. Estimates of the linear regression slopes and their95% confidence intervals are given in Table 1. In plasmaand bone marrow, none of the metabolites were found tobe dose dependent. This finding may have been due inpart to the low levels of metabolite found and the difficultyin distinguishing between doses.
Toxicokinetics of Low-Dose Benzene Metabolism
The kinetics of metabolite formation and clearance inplasma, liver, and bone marrow at 0 to 48 hours after IPadministration of 14C-benzene at a dose of 5 µg/kg bodyweight to B6C3F1 mice are shown in Figure 5. The data aregeometric means over time for four different metabolites(hydroquinone, catechol, phenol, and muconic acid); theAUC values for each plot are given in Table 2.
The AUCs demonstrate that of those tested hydroquinoneand muconic acid are the major metabolites found in liverand bone marrow. Hydroquinone was the primary metabo-lite found in liver and plasma; muconic acid was the mostprevalent metabolite in bone marrow. Phenol and catechol
were present in lower amounts in all tissues. As evidencedby the low R2 values and large confidence intervals for themetabolite levels, the AUC data varied considerably. Thisvariation was consistently found for all metabolite analysescarried out in this study. The reasons are unknown butlikely due to animal to animal variation and artifacts relatedto collection of HPLC peaks, (such as variation in isotopelevels eluting with time, isotope memory in the hardware,and methods used to identify and collect peaks). Other fac-tors include error in pipetting, weighing tissues, dosing ani-mals, and extracting samples. Further work is necessary tounderstand the sources of this variation. Because eachsample was measured repeatedly and intrasample variationnever exceeded 5%, the cause is probably not variation inmeasurement of isotope levels by AMS.
RELATION BETWEEN DOSE AND MACROMOLECULAR ADDUCT FORMATION IN B6C3F1 MICE
Both DNA and protein adducts from B6C3F1 mice werequantitated over a dose range of 5 ng/kg to 500 mg/kg bodyweight. Samples were collected both 1 and 12 hours afterdose administration. Two time points were used because a
Table 1. Estimates of Linear Regression of Log Metabolite Responsea on Log Benzene Doseb for Plasma, Bone Marrow, and Liver 1 Hour After Exposure of B6C3F1 Mice
Slope Estimates
� SE
95% Confidence
IntervalP
Value R2
PlasmaMuconic acid 1.08 � 0.11 �0.13, 0.37 0.30 0.15Hydroquinone 0.71 � 0.11 �0.36, 0.16 0.39 0.13Catechol �0.04 � 0.11 �0.31, 0.23 0.72 0.02Phenol �0.05 � 0.10 �0.28, 0.18 0.64 0.03
Bone MarrowMuconic acid 0.07 � 0.12 �0.22, 0.35 0.60 0.04Hydroquinone 0.07 � 0.10 �0.16, 0.31 0.48 0.09Catechol 0.03 � 0.11 �0.24, 0.30 0.80 0.01Phenol �0.09 � 0.09 �0.33, 0.14 0.36 0.17
LiverMuconic acid 1.08 � 0.08 0.88, 1.28 0.00 0.96Hydroquinone 0.71 � 0.07 0.54, 0.87 0.00 0.94Catechol 0.35 � 0.09 0.14, 0.57 0.01 0.68Phenol 0.11 � 0.06 �0.04, 0.26 0.12 0.31
a Metabolite data are femtomoles 14C per milliliter HPLC fraction; see Figure 4.
b Mice were administered IP doses between 5, 50, and 5000 ng benzene/kg body weight.
Table 2. AUC Valuesa for Kinetics of Metabolitesb in Plasma, Liver, and Bone Marrow After IP Exposure to Benzenec of B6C3F1 Mice
AUC Estimate � SE
95% Confidence Interval R2
PlasmaMuconic Acid 0.56 � 0.13 0.18, 0.93 0.40Hydroquinone 1.82 � 0.49 0.42, 3.23 0.30Catechol 0.27 � 0.12 �0.08, 0.62 0.28Phenol 0.26 � 0.08 0.02, 0.50 0.38
LiverMuconic acid 55.90 � 15.18 12.44, 99.36 0.59Hydroquinone 148.97 � 22.98 83.16, 214.79 0.81Catechol 2.14 � 0.65 0.29, 4.00 0.31Phenol 3.01 � 0.58 1.34, 4.68 0.73
Bone MarrowMuconic acid 15.69 � 2.17 9.47, 21.90 0.46Hydroquinone 6.08 � 1.08 2.99, 9.17 0.51Catechol 1.16 � 0.32 0.26, 2.06 0.28Phenol 2.82 � 0.39 1.71, 3.93 0.24
a AUC values are the trapezoidal rule approximation to the AUC.b Metabolite data are femtomoles 14C per milliliter HPLC fraction; see
Figure 5.c Administered dose was 5 µg benzene/kg body weight.

12
Benzene Metabolism at Doses Relevant to Human Exposure
Figure 5. Kinetics of benzene metabolites in plasma, liver and bone marrow of B6C3F1 mice. Log-transformed geometric means of metabolite concentra-tions are shown relative to log hours (0 to 48) after exposure to 5 µg benzene/kg body weight. Individual data points are also shown. Metabolites werequantified by measuring the amount of radiocarbon in HPLC fractions corresponding to the elution of well-characterized standards. Curves were gener-ated by interpolating between the means. (+ Data Point, � Geometric Mean)
Figure 6. Benzene macromolecular adducts in liver and bone marrow of B6C3F1 mice at 1 hour (�) and 12 hours (�) after exposure. Curves were generatedby interpolating between the geometric means.

13
KW Turteltaub and C Mani
preliminary study by Creek and colleagues (1997) sug-gested that the kinetics of adduct formation between liverand bone marrow. In that study, adduct levels in liverreached maximal concentrations within a few hours ofexposure while bone marrow adducts did not reach max-imal concentrations until 6 to 12 hours after exposure.
Figure 6 shows the dose response of both DNA and pro-tein adduct formation in liver and bone marrow over a doserange of 8 orders of magnitude, including doses relevant forhuman nonoccupational exposure to benzene. The data arelog transformations of the adduct levels (picogram benzeneequivalents per gram macromolecule) and doses (nano-grams benzene per kilogram body weight) at 1 and 12 hoursafter exposure. Similar to the metabolite levels in urine,plasma, and tissues, protein and DNA adduct levels at bothtime points depended on dose level. Adduct levels for bothprotein and DNA in liver appeared to plateau at doseshigher than 50 mg/kg body weight and tended to be higher1 hour after exposure. In bone marrow, adduct levels wereequivalent at both time points for protein and higher at12 hours after exposure for DNA. This trend is clearly shown
by comparing the confidence intervals for the differencebetween 1 hour and 12 hours after exposure (Figure 7).
MACROMOLECULAR ADDUCT LEVELS AMONG RATS AND MICE BY AUC
B6C3F1 mice, DBA/2 mice, C57BL/6 mice, and rats wereadministered 5 µg benzene/kg body weight intraperito-neally, and adduct levels were determined at various timesafterward. Mean DNA and protein adduct data for bonemarrow and liver are shown in Tables 3 and 4. Figure 8shows the kinetics of DNA adducts in B6C3F1 mice andrats. Consistent with previous work (Creek et al 1997),DNA and protein adducts in liver from all the mousestrains were detectable immediately after benzene admin-istration and reached peak levels within 0.5 to 1 hour. Incontrast, liver DNA and protein adduct levels in the ratcontinued to increase until 6 to 12 hours after exposurewhile bone marrow adduct kinetics were similar for the
Figure 7. Differences between log 14C-benzene equivalents bound at1 hour and 12 hours as a function of dose in liver and bone marrow.Means are for DNA and protein adducts in liver and bone marrow. Circlesrepresent the mean response at 1 hour minus the mean response at12 hours for a given dose (milligrams benzene per kilogram body weight),tissue, and adduct. Lines represent individual 95% confidence intervalsfor the differences in means.
Figure 8. DNA adduct kinetics in B6C3F1 mice and rats after IP expo-sure to benzene (5 µg/kg body weight). Geometric means of 14C-benzeneequivalents bound to liver and bone marrow DNA (picograms benzeneper gram DNA) are shown over time in B6C3F1 mice and rats are shown.Curves were generated by interpolating between the geometric means.Weighted averages for each time point were used to calculate the AUCs.(The curves are different from the curves used in the paper by Mani andcolleagues [1998].)

14
Benzene Metabolism at Doses Relevant to Human Exposure
rats and mice. In all cases, levels of protein adducts in bothliver and bone marrow were 10-fold to 20-fold higher thanlevels of DNA adducts.
Adduct levels measured at 0 to 48 hours after dosingwere used to calculate AUCs. These DNA and proteinadduct AUCs are estimates of the total reactive dose toeach tissue and were used to compare the adduct levelsbetween strains of mice and between mice and rats. Themodel used had an R2 between 0.3 and 0.9, depending onthe sample group. The data for 0.08 hours actually repre-sents samplings immediately after dose administrationand are thus an estimate of the lag time between doseadministration and death. Although the lag varied amonganimals, it never exceeded five minutes.
Significant differences (P < 0.05) in estimated AUCs forbone marrow DNA adducts were detected among the animalspecies and strains sampled (Table 3). Without backgroundsubtraction, time-integrated DNA adduct levels in bone
marrow were greatest in the B6C3F1 mouse, followed by theDBA/2 mouse, C57BL/6 mouse, and rat (Table 3). Withbackground subtraction, the AUC values for B6C3F1 andDBA/2 mice were indistinguishable. Adjusted and nonad-justed AUCs for bone marrow DNA and protein adductswere on average seven and four times greater, respectively,in the B6C3F1 mouse than in the rat. In general, mean AUCsof bone marrow protein adducts were approximately 3 to 10times greater than mean DNA adduct AUCs, depending onthe strain and species analyzed.
Liver macromolecular adducts presented a less clear pic-ture than the bone marrow adducts (Table 4). Again, esti-mated AUCs for both protein and DNA adducts showedsignificant differences (P < 0.05) among the animal spe-cies and strains sampled, but the ordering differeddepending on macromolecule assessed and whether anadjustment is made for the overall background observed inthe experimental series. Mean AUCs of liver protein
Table 3. Meansa and Estimated AUCs for Adductsb in Bone Marrow After IP Administration of Benzenec
Protein DNA
B6C3F1 DBA/2 C57BL/6 Rat B6C3F1 DBA/2 C57BL/6 Rat
Time (hours)d
< 0.08 422 54 16 17 53 19 30 10.5 923 348 282 10 46 �11 76 11 829 374 268 34 68 34 22 153 822 375 298 221 109 125 109 16
6 834 499 333 242 137 43 74 2812 1,122 644 338 291 233 150 76 3418 129
24 824 342 279 166 111 124 108 1736 10848 688 293 157 159 88 56 68 9
AUC Data
AUCe 40,560 19,291 12,659 9,217 6,008 4,793 4,122 891AUC �backgroundf 21,910 17,783 12,170 9,121 4,655 4,793 4,122 891SEg 1,656 1,985 617 981 427 1,050 1,005 86R2 h 0.91 0.64 0.89 0.82 0.75 0.52 0.29 0.82
a Most means are of three samples, some are of two samples. B6C3F1 at 24 hours is represented by a single sample.b Picograms 14C-benzene adduct per gram DNA or protein.c 5 µg benzene/kg body weight.d Data for <0.08 hours represent a sample taken within five minutes after IP administration of benzene. The other sampling times represent nominal
sampling times. Actual sampling times varied up to five minutes.e AUC values are the trapezoidal rule approximation to the AUC. f Values are the trapezoidal rule approximation to the AUC above the minimum value observed for that curve. Data <0 were replaced by 0.g SE represents the standard error in estimating the trapezoidal rule approximation to the AUC. h R2 represents the proportion of the variance among rodents eliminated by fitting the AUC data to the model.

15
KW Turteltaub and C Mani
adducts, with and without background subtraction, weregreatest for the B6C3F1 mouse, followed by the DBA/2mouse, rat, and C57BL/6 mouse (Table 4). This trend wasnearly identical for bone marrow adduct AUCs (Table 3),except that the rat AUC was higher than the C57BL/6 mouseAUC. Without the background subtraction, AUCs of liverDNA adduct were greatest in the DBA/2 mouse followed byB6C3F1 mouse, rat, and C57BL/6 mouse. AUCs of theB6C3F1 mouse liver DNA adducts were approximately two-fold greater on average than that of the rat, whereas AUCs forthe rat and C57BL/6 mouse were similar. With backgroundsubtracted, however, AUCs of liver DNA adducts wereordered identically among the mouse strains as for liver pro-tein adducts and bone marrow protein and DNA adducts (ie,B6C3F1 > DBA/2 > C57BL/6). In this case, however, the ratAUC was between B6C3F1 and DBA/2, rather than betweenDBA/2 and C57BL/6. The difference in ordering may havebeen due to scatter among individual data points given the
dose used (5 µg benzene/kg body weight).
MACROMOLECULAR ADDUCTS IN RATS AND B6C3F1 MICE AFTER LOW-DOSE BENZENE INHALATION
Administration of benzene has been carried out using avariety of exposure routes, principally IP and oral. In con-trast, environmental exposure can occur not only orally, butalso via inhalation. Thus, a preliminary study was designedto compare the kinetics of adduct formation and clearancein rodents using an IP and inhalation body burden. Addi-tionally, this work initiated the development of methods ofutilizing AMS to conduct low-dose inhalation studies.
In this study, we delivered radiolabeled benzene at anairborne concentration calculated to give a nominalinternal dose equivalent to a single dose of 5 µg benzeneper kg body weight. Rats were exposed nose-only to0.1 ppm benzene for 20 minutes and B6C3F1 mice to
Table 4. Meansa and Estimated AUCs for Adductsb in Liver After IP Administration of Benzenec
Protein DNA
B6C3F1 DBA/2 C57BL/6 Rat B6C3F1 DBA/2 C57BL/6 Rat
Time (Hours)d
< 0.08 2 8 0 2 3 110 3 10.5 2,442 2,004 1,662 148 166 258 41 91 1,639 1,647 668 323 98 204 34 23
3 1,025 1,238 251 450 106 153 27 376 1,005 1,205 189 592 63 153 27 42
12 1,048 429 203 609 68 138 33 54
18 715 5724 1,043 410 202 479 59 128 28 3936 396 4348 293 320 174 279 58 136 30 25
AUC Data
AUCe 36,730 26,580 10,622 21,707 2,887 6,663 1,419 1,800AUC�backgroundf 36,669 26,289 10,622 21,689 2,772 1,514 1,419 1,799SEg 5,372 3,018 854 2,383 265 138 106 140R2h 0.75 0.84 0.93 0.67 0.56 0.74 0.75 0.82
a Most means are of three samples, some are of two samples.b Picograms 14C-benzene adduct per gram DNA or protein.c 5 µg benzene/kg body weight.d Data for <0.08 hours represent a sample taken within five minutes after IP administration of benzene. The other sampling times represent nominal
sampling times. Actual sampling times varied up to five minutes.e AUC values are the trapezoidal rule approximation to the AUC. f Values are the trapezoidal rule approximation to the AUC above the minimum value observed for that curve. Data <0 were replaced by 0.g SE represents the standard error in estimating the trapezoidal rule approximation to the AUC. h R2 represents the proportion of the variance among rodents eliminated by fitting the AUC data to the model.

16
Benzene Metabolism at Doses Relevant to Human Exposure
0.1 ppm for 2.5 minutes using the chamber described in theMaterials and Methods. Tables 5 and 6 show adduct levelsmeasured at various times out to 24 hours for animalsexposed to benzene by inhalation. For comparison, adductlevels after IP administration of benzene are given inTables 3 and 4. After inhalation exposure, benzene formedboth DNA and protein adducts in liver and bone marrow ofboth rodent species, which indicated that benzene wasabsorbed and metabolized. Levels of protein adducts weregreater than levels of DNA adducts in both species, regard-less of the tissue examined or the route of exposure (see
Tables 3 through 6). Figures 9 and 10 show the data used tocalculate the 24-hour AUC values for IP and inhalationexposures for both species. Adduct kinetics in B6C3F1 micewere similar for both routes of exposure; generally, adductlevels peaked in liver at 1 hour after exposure and in bonemarrow at 12 hours after exposure. In contrast, adductkinetics in rats differed for the IP and inhalation exposures:in bone marrow, levels of both protein and DNA adductsincreased until 6 to 12 hours after IP exposure, whereasadduct formation peaked within an hour of inhalationexposure or showed no clear peak at all.
Table 5. Meansa and Estimated AUCs for Adductsb in Liver After Inhalation of Benzenec
B6C3F1 Mice Rats
Protein DNA Protein DNA
Time (hours)d
0.08 375 8 68 660.16 305 31
0.5 1,988 90 123 571 1,647 77 35 17
3 1,344 69 51 176 1,455 65 22
12 803 30 40 1924 863 21 35 13
AUC Data
AUCe 25,349 1,002 1,081 481SEf 2,466 148 142 173R2 0.75 0.60 0.79 0.21
a Means are of three samples.b Picograms 14C-benzene adduct per gram DNA or protein.c 5 µg benzene/kg body weight. d Data for 0.08 hours represent a sample taken within five minutes after
benzene inhalation. The other sampling times represent nominal sampling times. Actual sampling times varied up to five minutes.
e AUC values are the trapezoidal rule approximation to the AUC. f SE represents the standard error in estimating the trapezoidal rule
approximation to the AUC.
Table 6. Meansa and Estimated AUCs for Adductsb in Bone Marrow After Inhalation of Benzenec
B6C3F1 Mice Rats
Protein DNA Protein DNA
Time (hours)d
0.08 5 6 55 �90.16 21 20.5 434 37 4
1 50 5
3 402 63 50 126 396 48
12 669 200 37 �824 476 438 31 10
AUC Data
AUCe 10,288 6,287 930 268SEf 1,100 614 124 83R2 0.74 0.96 0.40 0.26
a Means are of three samples.b Picograms 14C-benzene adduct per gram DNA or protein.c 5 µg benzene/kg body weight. d Data for 0.08 hours represent a sample taken within five minutes after
benzene inhalation. The other sampling times represent nominal sampling times. Actual sampling times varied up to five minutes.
e AUC values are the trapezoidal rule approximation to the AUC. f SE represents the standard error in estimating the trapezoidal rule
approximation to the AUC.

17
KW Turteltaub and C Mani
Figure 10. Change in benzene equivalents bound over time in the rat after IP and inhalation exposures tobenzene (at doses of 5 µg/kg body weight). Curves were generated by interpolating between the geometricmeans (GMs). Weighted averages for each time point were used to calculate the AUCs.
Figure 9. Change in benzene equivalents bound over time in B6C3F1 mice after IP and inhalation expo-sures to benzene (at doses of 5 µg/kg body weight). Curves were generated by interpolating between thegeometric means (GMs). Weighted averages for each time point were used to calculate the AUCs.

18
Benzene Metabolism at Doses Relevant to Human Exposure
Figure 11 shows the estimated differences betweeninhalation AUCs and IP AUCs and the 95% confidenceintervals for those differences. Quantitatively, adductlevels were generally lower after inhalation than after IPadministration in the rat and mouse. The B6C3F1 miceyielded consistently greater adduct levels in both liver andbone marrow than the rat after inhalation of benzene (seeTables 5 and 6).
DISCUSSION
The goal of this work was to investigate how benzenemetabolism and macromolecular adduction relate to ben-zene dose. The dose range of interest varied from highdoses used in traditional bioassays to low doses to whichhumans are exposed via their environment. We concen-trated on macromolecular adducts and the metabolites
believed to yield these adducts because they both cancause cell damage. DNA adducts are believed to be molec-ular lesions that lead to mutation and cancer. Proteinadducts may also be involved in some types of cell damage(Epe et al 1990). Both types of macromolecular adduct areindicators of the reactive dose of carcinogen to the tissuesand are also endpoints that can be quantified shortly afterexposure has occurred. Measurement of these adducts hasbeen central for determining exposure in the fields ofmolecular epidemiology and risk assessment (Golding andWatson 1999; Rappaport and Yeowell-O’Connell 1999).
We focused on liver, bone marrow, and plasma becauseliver is believed to be a primary site of benzene metabo-lism and bone marrow is a primary target organ for leu-kemia and other blood disorders (Snyder and Kalf 1994;Snyder and Hedli 1996). Also, reactive metabolites of ben-zene probably form in situ in bone marrow (Rushmore et al1984; Eastmond et al 1987). Plasma was studied as a meansof determining the circulating dose of benzene.
In order to measure the low concentrations of metabolitesand adducts expected after low-dose exposure, we utilizedAMS. This technique can quantify radiolabeled chemicalswith attomole sensitivity and has been the standard forradiocarbon dating since the early 1980s (Vogel et al 1995).Although its use in biomedical fields is much more recent,initial studies have indicated that 14C-labeled biomoleculescan be quantified to levels of a few attomoles with high pre-cision (Turteltaub and Vogel 1995; Vogel et al 1995).
Studies using AMS rely exclusively on measurement ofradiocarbon levels in the biological material of interest. Inthis case we used isolated genomic DNA, isolated protein,or extracts of plasma, liver tissue, bone marrow, or urine.Some radiocarbon in individual samples may have beendue to metabolic incorporation or noncovalent binding ofbenzene or its metabolites to DNA or protein. The DNAand protein used in this study were extensively purifiedby anion exchange chromatography and solvent extrac-tion, however, and no radiocarbon was lost from samplesvia dialysis. No protein contamination or RNA contamina-tion has been seen using these methods where DNA diges-tion has been carried out (Frantz et al 1995; Creek et al1997; Kautiainen et al 1997; Mauthe et al 1999). Thus,while we cannot rule out the possibility of metabolicincorporation or noncovalent binding, we believe it isunlikely to have contributed substantially to the kineticsor binding seen in this study.
METABOLISM OF BENZENE TO REACTIVE INTERMEDIATES IN B6C3F1 MICE
Our results show that at all doses, including those dosesin the range of human exposure, benzene was rapidly
Figure 11. Estimated differences between responses to inhalation and IPexposures to benzene for rats and B6C3F1 mice. AUC estimates of meanresponse from 0 to 24 hours after IP exposure were subtracted from esti-mates from 0 to 24 hours after inhalation exposure (differences repre-sented by circles). Lines represent joint 95% confidence intervals for thedifference in mean responses. Critical value for the confidence intervalswas calculated using Sidak’s method. Units are picograms of 14C-benzeneequivalents bound times hours per gram tissue.

19
KW Turteltaub and C Mani
absorbed and metabolized to reactive intermediates thatbound both DNA and protein. DNA and protein adductsand individual benzene metabolites were present in allsamples studied (plasma, liver, and bone marrow). Mea-sured levels of metabolites (except those in plasma andbone marrow), DNA adducts, and protein adducts weredose dependent between the doses of 50 ng/kg and50 mg/kg body weight. Neither metabolite profiles nor rela-tive amounts of each metabolite changed as a function ofdose. Whereas adducts were dose dependent, evidence ofsaturation in protein and DNA binding (plateauing ofadduct levels) was found in liver at the higher doses(greater than 50 mg/kg body weight). The nature of thetrend toward a plateau in hepatic adduct levels at higherdoses was not addressed in this work, but it may be due toa dose-dependent increase in benzene clearance viaexpired air (as reported by Sabourin and colleagues 1987and Mathews and coworkers 1998). The apparent trendtoward flattening of the dose-response curves at lowerdoses of benzene, which indicate a loss of dose depen-dency), could have a variety of causes: the log-log transfor-mation used to plot the data, artifacts of approaching thelimit of detection, changes in metabolism or repair, or anycombination of these factors. We made no attempt to char-acterize the chemical nature of the adducts or to determinethe reason for the trends. Our main finding, that DNAadducts and protein adducts are present in liver and bonemarrow at all doses, shows that reactive forms of benzenewere present in the tissues even at low doses.
In some previous studies, DNA adducts in liver or bonemarrow were not detectable after single doses of benzenebut were detectable after twice-daily administration ofbenzene for several days (Reddy et al 1989, 1994; Pathak etal 1995; Bodell et al 1996). However, several other labora-tories have reported the binding of radiolabeled benzene toDNA in various rat tissues after single treatment, (Lutz andSchlatter 1977; Arfellini et al 1985; Mazzullo et al 1989);these results support the findings reported here.
DISTRIBUTION OF REACTIVE BENZENE METABOLITES AMONG LIVER, BONE MARROW, AND URINE IN B6C3F1 MICE
The toxicity of benzene is generally considered to bemediated by metabolites formed in the liver, which thendistribute to other tissues where additional metabolismmay occur (Greenlee et al 1981; Eastmond et al 1987;Snyder and Hedli 1996). Our studies in B6C3F1 micefound muconic acid (an indicator of muconaldehyde) andhydroquinone, metabolites thought to be involved in ben-zene toxicity, in liver tissue in high concentration relativeto the other metabolites there. Muconic acid was used as a
marker for muconaldehyde production, as in previousstudies (Parke and Williams 1953; Goldstein et al 1982).Metabolite profiles of plasma, liver, and bone marrow weresimilar, with both hydroquinone and muconic acid pre-dominating over catechol and phenol. These data showthat, at a low dose, the reactive benzene metabolitesmuconaldehyde and hydroquinone are present in tissuesother than liver.
Although the metabolite AUCs have large standarderrors, they suggest some useful conclusions. The totalamounts of muconic acid and hydroquinone were greater,and they increased and peaked more rapidly in liver thanin bone marrow or plasma. These findings and the fact thatboth metabolites were present in plasma are consistentwith hepatic production of benzene metabolites and theirtransport to extrahepatic tissues, including bone marrow.The fact that metabolite levels were lower in plasma thanin bone marrow is also consistent with some accumulationof these metabolites at low doses of benzene, as Sabourinand colleagues have suggested (1989). These results arealso consistent with circulating benzene or benzenemetabolites yielding reactive metabolites directly in thebone marrow (Eastmond et al 1987). This process wouldlead to higher levels of adducts in bone marrow than inliver and more time before maximal adduct concentrationsare reached in bone marrow.
In urine, one of the major 14C-labeled products foundwas an unidentified compound. We speculate that thisradiolabeled compound was a contaminant, a uniquemetabolite, or a decomposition product of a benzenemetabolite. For example, the compound could represent abenzene metabolite, such as phenyl mercapturic acid,arising via conjugation with glutathione. This could occurvia the cyclohexadienyl pathway. However, our attemptsto characterize this metabolite using mass spectrometryand HPLC coelution with an authentic phenyl mercapturicacid standard failed. In previous studies, Mathews andcoworkers (1998) reported that hydroquinone glucuronideand phenyl sulfate were the major metabolites of benzenein urine of B6C3F1 mice after oral administration of 0.1 mgbenzene per kg body weight. Similarly, Sabourin and col-leagues (1989) observed that hydroquinone glucuronidewas the major metabolite, followed by phenyl sulfate, inurine of mice administered 1 to10 mg benzene per kg bodyweight by gavage. However, inhalation of 5 ppm benzeneshowed phenyl sulfate rather than hydroquinone glucu-ronide as the major product in mouse urine (Sabourin et al1989). Thus it appears that at lower doses a different, pres-ently unknown, metabolite seems to predominate. Furtherwork is needed to determine the nature of this metaboliteand whether it plays a role in genotoxicity.

20
Benzene Metabolism at Doses Relevant to Human Exposure
RELATION BETWEEN METABOLITE LEVELS AND MACROMOLECULAR ADDUCT FORMATION IN B6C3F1 MICE
The relation between benzene metabolism and forma-tion of benzene adducts is not clear. The dose responsesfor protein and DNA adduct levels were consistent withthe dose response for metabolites in urine and both suggestdose-dependent differences in benzene metabolism. Hyd-roquinone and muconic acid were the major metabolites inliver and bone marrow and hydroquinone levels weremuch higher in liver than in bone marrow. DNA adductAUCs were greater in bone marrow than in liver, and thedifference in the AUCs for protein adduct levels betweenthe two tissues was relatively small. Interestingly, themuconic acid AUCs in liver and bone marrow wereapproximately equivalent, paralleling the protein adductAUCs. In addition, the kinetics of metabolite formationparalleled adduct formation: metabolites in liver increasedand peaked more rapidly than bone marrow; adduct levelsalso rose faster and peaked earlier in liver. Levay andBodell (1992) have shown that the benzene metaboliteshydroquinone, catechol, and 1,2,4-benzenetriol caninteract synergistically to produce increased levels of DNAadducts, but we were unable to detect 1,2,4-benzenetriolin the samples analyzed here.
Further, in vitro treatment of mouse bone marrow withhydroquinone in another study resulted in DNA adductlevels similar to those observed in bone marrow after in vivotreatment with benzene (Levay et al 1993). Several studiessuggest that hydroquinone is the principal benzene metabo-lite to lead to DNA adduct formation in bone marrow (Irons1985; Smith et al 1989; Irons et al 1992). The results reportedhere from B6C3F1 mice, however, are inconsistent with hyd-roquinone being the sole reactive metabolite without addi-tional metabolism occurring in extrahepatic tissues. Theseresults are consistent with the hypothesis that both hydro-quinone and muconaldehyde are important reactive ben-zene metabolites and that hydroquinone undergoesextrahepatic metabolism to form macromolecular adducts(Levay et al 1993; Bodell et al 1994).
RELATION BETWEEN MACROMOLECULAR ADDUCT LEVELS AND TOXICITY IN RODENTS
Comparison of AUCs for both protein and DNA adductsin B6C3F1 mice showed that levels were higher in bonemarrow than in liver, which is consistent with target-organsusceptibility: benzene causes leukemia but not livercancer. Both protein and DNA adducts among differentstrains of mice also showed differences compared with therat. Macromolecular adduct kinetics in the DBA/2 mouse,
C57BL/6 mouse, and rat are qualitatively similar. Somedifferences in the rates of formation and rates of clearanceare evident, but these differences probably result fromscatter among individual data and may not be biological inorigin. Quantitatively, both protein and DNA adduct levelsin bone marrow, the primary target organ of benzene tox-icity, were significantly different with adduct levelsgreatest in the B6C3F1 mice and lowest in the rats. TheC57BL/6 and DBA/2 mice were intermediate at most timepoints and also had lower AUCs for both DNA and proteinadducts. The largest difference was again clearly betweenthe B6C3F1 mice and the rats.
The differences observed in macromolecular binding ofbenzene among different mouse strains and rats may havebeen partially or entirely due to differences in the concen-tration of activated benzene encountered by the proteinand DNA. This difference likely involved differences inbenzene toxicodynamics and toxicokinetics. Dose-depen-dent effects on metabolizing enzymes or transport proteinscould result in toxicodynamic differences: differences inthe proportion of reactive or detoxified metabolites orchanges in the amount of benzene or its metabolites thatare delivered to tissues. Additionally, because CYP2E1(cytochrome P450 2E1) is required for benzene metabolism(Seaton et al 1994), CYP2E1 activity in liver may be amajor factor in interspecies and interindividual benzenetoxicity (Sabourin et al 1987).
Previous work has shown that B6C3F1 mice have agreater capacity to metabolize benzene and are more sensi-tive to the tumorigenic effects of benzene than rats (Sab-ourin et al 1987, 1989; Huff et al 1988). Further, some datasuggest that because benzene induces greater levels ofmicronuclei in B6C3F1 mice, the strain can metabolizebenzene to a greater extent relative to C57BL/6 or DBA/2mice (Sabourin et al 1989; Smith et al 1990; Witz et al1990). Longacre and associates (1981) showed that tissuelevels of covalently bound metabolites were higher inmouse strains that were more sensitive to benzene toxicitythan in less-sensitive strains.
These data imply that AUCs of protein and DNA adductsin bone marrow are consistent with the capacity to bioacti-vate benzene and with benzene’s tumorigenicity amongthese rodents (Huff et al 1988, 1989). This implication sup-ports our hypothesis that greater risk is associated withhigher adduct levels, which result from an ability to pro-duce higher levels of reactive benzene metabolites. Anal-ysis of bone marrow AUCs supports the hypothesis thatB6C3F1 mice should be the most sensitive and rats the leastsensitive to benzene, with the other two mouse strainstested here (C57BL/6 and DBA/2) being intermediate.

21
KW Turteltaub and C Mani
INHALATION VERSUS IP EXPOSURE TO BENZENE
Route of exposure to benzene can also lead to differ-ences in metabolism and, in turn, differences in formationof macromolecular adducts. Benzene adduct formationresulting from low-dose inhalation versus IP administra-tion differed for rats and mice. AUCs for DNA and proteinadducts in both liver and bone marrow were generally twoto three fold greater after IP administration rather thanafter inhalation. When benzene is administered to achievea similar nominal body burden, AUCs of DNA and proteinadducts were greater in the B6C3F1 mice than the rat. Thekinetics of adduct formation and clearance was similaramong exposure routes in B6C3F1 mice but was qualita-tively different for the rat. Judged by the adduct levelsfound in the rat, very little benzene was taken up or metab-olized when administered by inhalation.
Measurement of total urinary 14C-benzene equivalentsby Sabourin and colleagues (1987) indicated that mice canmetabolize approximately four times more inhaled ben-zene than rats. Inhalation of benzene produces 10 timesmore hydroquinone conjugates in B6C3F1 mice than inrats. In a study by Medinsky et al (1989), the patterns ofbenzene metabolites seen in rats and B6C3F1 mice werevery different for inhalation and oral administration. Ratsprimarily formed the detoxification metabolite phenyl sul-fate, whereas mice formed hydroquinone glucuronide andmuconic acid in addition to phenyl sulfate. Thus, even atenvironmentally relevant doses of inhaled benzene, miceappear to metabolize benzene to reactive metabolites thatin turn lead to higher levels of macromolecular adducts intissues. Adducts thus appear to reflect the capacity tometabolize benzene across species, strains, and exposureroutes. Additionally, route of exposure does affect adductlevels and thus could affect risk estimates; depending onthe animal type, inhalation was either equivalent to or lesseffective than IP administration. What these results meanin terms of human exposure to benzene is unclear given themultiple routes of exposure that occur (predominantly viainhalation or dermal contact), but we cannot assume thatthese rodent data can be directly extrapolated to humans.
SUMMARY
The data presented here show that mice and rats canmetabolize benzene effectively at all doses including thoserelevant to human exposure. The data are consistent withour hypothesis that DNA adduct levels reflect the ability tometabolize benzene to toxic metabolites. Similarly, thedata suggest that adducts and benzene metabolites reflecttarget organ specificity and toxicity. Putatively toxicmetabolites are formed and accumulate in plasma, liver,
and bone marrow. DNA and protein adducts are dosedependent and present even at exposure levels equivalentto those humans encounter in the environment. Adductlevels are lower in rats relative to mice, and this differencereflects metabolic capacity. Further, route of exposure alsocan affect adduct levels. Thus, exposure route, kinetics,and metabolism will likely affect resulting estimates ofrisk and the use of animal models to estimate it.
IMPLICATIONS OF FINDINGS
DNA and protein adducts are likely present in all tissues,even at doses of benzene to which humans are exposed inthe environment. To our knowledge, this is the first study todemonstrate that toxic metabolites of benzene are generatedin liver, plasma, and bone marrow from exposures environ-mentally relevant to humans. Adduct levels are dose depen-dent and indicate metabolic capacity and target-organspecificity. Thus, if they can be quantified, benzene adductsare probably suitable for use in risk assessment. Responsesare not linear across doses, however, and the dose responsesfor adduct formation and metabolite levels most likely pla-teau above 50 mg benzene/kg body weight. More data areneeded to better define the shape of the dose response invarious tissues.
Our adduct data suggest that route of exposure andgenetic differences can also play a large role in benzenetoxicity through differences in metabolism and possiblyother factors. This conclusion is consistent with other datathat indicate variability in metabolism and toxicity amongrodents. Data for humans are thus needed to better judgethe effects of benzene because how well rodent models canpredict human risk is unclear. This uncertainty is high-lighted by the work of Seaton and coworkers (1994, 1995),whose data on benzene metabolism suggest that riskdepends on individual genotype.
The ultimate metabolite binding to DNA appears to beneither hydroquinone or muconaldehyde alone. Rather,muconic acid measurements indicate that the combinationof hydroquinone and muconaldehyde more closely corre-lates with macromolecular adduct formation among mousetissues. Even at low doses of benzene, the pathways of ben-zene metabolism appear to be qualitatively similar in ratsand mice although there are clearly quantitative differences.Henderson has suggested that the qualitative similarity istrue for all species (Henderson 1996). The quantitative dif-ferences do indicate that selection of the correct animalmodel is important in order to judge the human risk for ben-zene. Again, data in humans are needed to understand howto interpret animal data for risk assessment.

22
Benzene Metabolism at Doses Relevant to Human Exposure
In most species that have been studied, a greater portionof the benzene is converted to hydroquinone and muconal-dehyde if the dose is low rather than high. This trend isconsistent with our adduct formation data and alsoappears to be true for humans, where both hydroquinoneand muconic acid have been detected in the urine ofexposed workers (Rothman et al 1998). The amounts ofthese two metabolites were lower in more highly exposedworkers, which is consistent with findings in previousanimal studies (Sabourin et al 1988a,b, 1989).
Finally, this work indicates that the use of AMS can helpelucidate the effects of low doses of environmental toxi-cants. AMS can help to quantify metabolites and macro-molecular adducts and to study the mechanisms by whichtoxicants exert their effects at low doses. More researchneeds to be devoted to understanding how to use AMS inthese capacities.
ACKNOWLEDGMENTS
All AMS measurements were taken at the Center forAccelerator Mass Spectrometry at the Lawrence LivermoreNational Laboratory. The authors thank Kurt Haack, Dr JohnVogel, Esther Fultz, Dr David Nelson, and Dr Karen Dingleyfor advice and assistance in conducting experiments. Inha-lation studies were performed by Dr Janet Benson (LovelaceRespiratory Research Institute, New Mexico). In addition tofunding from the Health Effects Institute, this study wasconducted under the auspices of the US Department ofEnergy under contract W-7405-ENG-48 awarded to theLawrence Livermore National Laboratory.
REFERENCES
Aksoy M, Erdem S. 1978. Follow up study on the develop-ment of leukemia in 44 pancytopenic patients withchronic exposure to benzene. Blood 52:285–292.
American Conference of Government and IndustrialHygienists. 1999. Guide to Occupational Exposure Values.ACGIH, Cincinnati OH.
Arfellini G, Grilli S, Colacci A, Mazzullo M, Prodi G. 1985.In vivo and in vitro binding of benzene to nucleic acidsand proteins of various rat and mouse organs. Cancer Lett28:159–168.
Bailer AJ. 1988. Testing for the equality of area under thecurves when using destructive sampling techniques. JPharmacokinet Biopharm 16:303–309.
Bailer AJ, Piegorsch WW. 1990. Estimating integrals usingquadrature methods with an application in pharmacoki-netics. Biometrics 46:1201–1211.
Bauer H, Demitriadis EA, Snyder R. 1989. An in vivo studyof benzene metabolite DNA adduct formation in liver ofmale New Zealand rabbits. Arch Toxicol 63:209–213.
Bechtold WE, Sabourin PJ, Henderson RF. 1988. A reverseisotope method for determining benzene and metabolitesin tissues. J Anal Toxicol 12:176–179.
Bodell WJ, Levay G, Pongracz K, Pathak DN. 1994. DNAadducts formed by peroxidase activation of benzenemetabolites. Polycyclic Aromatic Compounds 6:1–8.
Bodell WJ, Pathak DN, Levay G, Ye Q, Pongracz K. 1996.Investigation of the DNA adducts formed in B6C3F1 micetreated with benzene: Implications for molecular dosim-etry. Environ Health Perspect 104:1189–1193.
Carere A, Antoccia A, Crebelli R, Di Chiara D, Fuselli S,Iavarone I, Isacchi G, Lagorio S, Leopardi P, Marcon F.1995. [Exposure to benzene and genotoxic effects amongfilling station attendants.] Epidemiol Prev 19:105–119.
Cocheo V, Sacco P, Boaretto C, De Saegert E, Ballesta PP,Skov H, Goelen S, Gonzalezll N, Caracena AB. 2000. Urbanbenzene and population exposure. Nature 404:141–142.
Creek MR, Mani C, Vogel JS, Turteltaub KW. 1997. Tissuedistribution and macromolecular binding of extremely lowdoses of [14C]-benzene in B6C3F1 mice. Carcinogenesis18:2421–2427.
Cronkite EP. 1987. Chemical leukemogenesis: Benzene as amodel. Semin Hematol 1:2–11.
Cronkite EP, Bullis JE, Inoue T, Drew RT. 1984. Benzeneinhalation produces leukemia in mice. Toxicol Appl Phar-macol 75:358–361.
Cronkite EP, Drew RT, Inoue T, Hirabayashi Y, BullisJE.1989. Hematotoxicity and carcinogenicity of inhaledbenzene. Environ Health Perspect 82:97–108.
Department of Health and Human Services (US). 1986.Toxicology and Carcinogenesis Studies of Benzene inF344/N Rats and Mice . Nat ional Ins t i tu tes o fHealth/National Toxicology Prog Tech Rep Ser 289, CAS71-43-2. National Toxicology Program, Washington DC.
Eastmond DA, Smith MT, Irons RD. 1987. An interaction ofbenzene metabolites reproduces the myeolotoxicityobserved with benzene exposure. Toxicol Appl Pharmacol1:85–95.

23
KW Turteltaub and C Mani
Epe B, Harttig U, Stopper H, Metzler M. 1990. Covalentbinding of estrogen metabolites to microtubular protein asa possible mechanism of aneuploidy induction and neo-plastic cell transformation. Environ Health Perspect88:123–127.
Frantz CE, Bangerter C, Fultz E, Mayer KM, Vogel JS, Tur-teltaub KW. 1995. Dose-response studies of MeIQx in ratliver and liver DNA at low doses. Carcinogenesis 16:367–374.
Golding BT, Watson WP. 1999. Possible mechanisms ofcarcinogenesis after exposure to benzene. IARC Sci Publ150:75–88.
Goldstein BD. 1977. Hematotoxicity in humans. J ToxicolEnviron Health 2(Suppl):69–105.
Goldstein BD, Witz G, Javid J, Amoruso M, Rossman T,Wolder B. 1982. Muconaldehyde: A potential toxic inter-mediate of benzene metabolism. In: Biological Intermedi-ates II. Part A (Snyder R, Parke DV, Kocsis J, Jallow D,Gibson GG, Witmer CM, eds), pp 331–339. Plenum Press,New York NY.
Greenlee WF, Sun JD, Bus JS. 1981. A proposed mecha-nism of benzene toxicity: Formation of reactive intermedi-ates from polyphenol metabolites. Toxicol ApplPharmacol 59:187–195.
Henderson RF. 1996. Species differences in the metabo-lism of benzene. Environ Health Perspect 104:1173–1175.
Huff JE, Eastin W, Roycroft J, Eustis SL, Haseman JK. 1988.Carcinogenesis studies of benzene, methyl benzene, anddimethyl benzenes. Ann N Y Acad Sci 534:427–440.
Huff JE, Haseman JK, DeMarini DM, Eustis S, MaronpotRR, Peters AC, Persing RL, Chrisp CE, Jacobs AC. 1989.Multiple site carcinogenicity of benzene in Fischer 344rats and B6C3F1 mice. Environ Health Perspect 82:125–163.
Irons RD. 1985. Quinones as toxic metabolites of benzene.J Toxicol Environ Health 16:673–678.
Irons RD, Stillman WS, Colagiovanni DB, Henry VA. 1992.Synergistic action of the benzene metabolite hydro-quinone on myelopoietic stimulating activity of granulo-cyte/macrophage colony-stimulating factor in vitro. ProcNatl Acad Sci U S A 89:3691–3695.
Kautiainen A, Vogel JS, Turteltaub KW. 1997. Trichloroeth-ylene covalently binds macromolecules dose dependentlyin mice. Chem Biol Interact 106:109–121.
Kivistö H, Pekari K, Peltonen K, Svinhufvud J, VeidebaumT, Sorsa M, Aitio A. 1997. Biological monitoring of expo-sure to benzene in the production of benzene and in acokery. Sci Total Environ 199:49–63.
Kolachana P, Subrahmanyam VV, Meyer KB, Zhang LP,Smith MT. 1993. Benzene and its phenolic metabolitesproduce oxidative DNA damage in HL60 cells in vitro andin the bone marrow in vivo. Cancer Res 53:1023–1026.
Laskin DE, Heck DE, Punjabi CJ, Laskin JD. 1987. Role ofnitric oxide in hamatosuppression and benzene-inducedtoxicity. Environ Health Perspect 104:1283–1287.
Levay G, Bodell WJ. 1992. Potentiation of DNA adduct for-mation in HL-60 cells by combination of benzene metabo-lites. Proc Natl Acad Sci U S A 89:7105–7109.
Levay G, Pathak DN, Bodell WJ. 1996. Detection of DNAadducts in the white blood cells of B6C3F1 mice treatedwith benzene. Carcinogenesis 17:151–153.
Levay G, Ross D, Bodell WJ. 1993. Peroxidase activation ofhydroquinone results in the formation of DNA adducts inHL-60 cells, mouse bone marrow macrophages and humanbone marrow. Carcinogenesis 14:2329–2334.
Longacre SL, Kocsis JJ, Snyder R. 1981. Influence of straindifferences in mice on the metabolism and toxicity of ben-zene. Toxicol Appl Pharmacol 60:398–409.
Lutz WK, Schlatter CH. 1977. Mechanism of carcinogenicaction of benzene: Irreversible binding to rat liver DNA.Chem Biol Interact 49:241–245.
Maltoni C, Ciliberti A, Cotti G, Conti B, Belpoggi F. 1989.Benzene, an experimental multipotential carcinogen:Results of the long-term bioassays performed at theBologna Institute of Oncology. Environ Health Perspect82:109–124.
Maltoni C, Conti B, Cotti G. 1983. Benzene: A multipoten-tial carcinogen. Results of long term bioassays performedat the Bologna Institute of Oncology. Am J Ind Med 4:589–630.
Mani C, Vogel J, Turteltaub KW. 1998. Strain differences inthe covalent binding of benzene to macromolecules:B6C3F1 vs C57BL/6 mice. 89th Annual Meeting of Amer-ican Association for Cancer Research. March 28–April 1,1998. American Association for Cancer Research, NewOrleans LA.
Mathews JM, Etheridge AS, Mathews HB. 1998. Dosedependent metabolism of benzene in hamsters, rats andmice. Toxicol Sci 44:14–21.

24
Benzene Metabolism at Doses Relevant to Human Exposure
Mathsoft. 1999. S-PLUS 2000 User’s Guide. Mathsoft DataAnalysis Products Division, Seattle WA.
Mauthe RJ, Dingley KH, Leveson SH, Freeman SP, TureskyRJ, Garner CR, Turteltaub KW. 1999. Comparison of DNA-adduct and tissue-available dose levels of MeIQx inhuman and rodent colon following administration of avery low dose. Int J Cancer 80:539–545.
Mazzullo M, Bartoli S, Bonora B, Colacci A, Grilli S, Lat-tanzi G, Niero A, Turina MP, Parodi S. 1989. Benzeneadducts with rat and nucleic acids and proteins: Dose-response relationship after treatment in vivo. EnvironHealth Perspect 82:259–266.
Medinsky MA, Sabourin PJ, Lucier G, Birnbaum LS, Hend-erson RF 1989. A physiological model for simulation ofbenzene metabolism by rats and mice. Toxicol Appl Phar-macol 99:193–206.
Nillson RI, Nordliner RG, Tagesson C, Walles S, JarvholmBG. 1996. Genotoxic effects in workers exposed to lowlevels of benzene from gasoline. Am J Ind Med 30:317–324.
Occupational Safety and Health Administration (US).1987. Final rule on occupational exposure to benzene. FedRegist 54:34660–34762.
Parke DV, Williams RT. 1953. Studies in detoxification 49.The metabolism of benzene containing [14C1]-benzene.Biochem J 54:231–238.
Pathak DN, Levay G, Bodell WJ. 1995. DNA adduct forma-tion in the bone marrow of B6C3F1 mice treated with ben-zene. Carcinogenesis 16:1803–1808.
Pinheiro JC, Bates DM. 2000. Mixed Effects Models in Sand S-PLUS. Springer-Verlag, New York NY.
Pongracz K, Bodell WJ. 1996. Synthesis of N2-(4-hydrox-yphenyl)-2′-deoxyguanosine-3′-phosphate: Comparison by32P-postlabeling with the DNA adducts formed in HL-60cells treated with hydroquinone. Chem Res Toxicol 9:593–598.
Rappaport SM, Yeowell-O’Connell K. 1999. Proteinadducts as dosimeters of human exposure to styrene, sty-rene-7,8-oxide and benzene. Toxicol Lett 108:117–126.
Reddy MV, Blackburn GR, Schreiner CA, Mehlman MA,Mackerer CR. 1989. 32P-analysis of DNA adducts in tissuesof benzene-treated rats. Environ Health Perspect 82:253–257.
Reddy MV, Schultz SC, Blackburn GR, Mackerer CR. 1994.Lack of DNA-adduct formation in mice treated with ben-zene. Mutat Res 325:149–155.
Rinsky RA, Hornung RW, Landrigan PJ. 1989. Re: “Ben-zene and leukemia: A review of the literature and a riskassessment.” Am J Epidemiol 129:1084–1086.
Rothman N, Bechtold WE, Yin SN, Dosemeci M, Li GL,Wang YZ, Griffith WC, Smith MT, Hayes RB. 1998. Urinaryexcretion of phenol, catechol, hydroquinone and muconicacid by workers occupationally exposed to benzene.Occup Environ Med 55:705–711.
Rothman N, Smith MT, Hayes RB, Traver RD, Hoener B,Campleman S, Li GL, Dosemeci M, Linet M, Zhang L, Xi L,Wacholder S, Lu W, Meyer KB, Titenko-Holland N, StewartJT, Yin S, Ross D. 1997. Benzene poisoning, a risk factor forhematological malignancy, is associated with the NQO1609C-->T mutation and rapid fractional excretion of chlor-zoxazone. Cancer Res 57:2839–2842.
Rushmore T, Kalf G, Snyder R. 1984. Covalent binding ofbenzene and its metabolites to DNA in rabbit bone marrowmitochondria in vitro. Chem Biol Interact 49:133–154.
Sabourin PJ, Bechtold WE, Birnbaum LS, Lucier G, Hend-erson RF. 1988a. Differences in the metabolism and dispo-sition of inhaled [3H]benzene by F344/N rats and B6C3F1mice. Toxicol Appl Pharmacol 94:128–140.
Sabourin PJ, Bechtold WE, Griffith WC, Birnbaum LS,Lucier G, Henderson RF. 1989. Effect of exposure concen-tration, exposure rate and route of administration onmetabolism of benzene by F344 rats and B6C3F1 mice.Toxicol Appl Pharmacol 99:421–444.
Sabourin PJ, Bechtold WE, Henderson RF. 1988b. A highpressure liquid chromatographic method for the separa-tion and quantitation of water-soluble radiolabeled ben-zene metabolites. Anal Biochem 170:316–327.
Sabourin PJ, Chen BT, Lucier G, Birnbaum LS, Fisher E,Henderson RF. 1987. Effect of dose on the absorption andexcretion of [14C]benzene administered orally or by inha-lation in rats and mice. Toxicol Appl Pharmacol 87:325–336.
Sabourin PJ, Muggenburg BA, Couch RC, Lefler D, LucierG, Birnbaum, LS, Henderson RF. 1992. Metabolism of[14C]benzene by cynomolgus monkeys and chimpanzees.Toxicol Appl Pharmacol 114:277–284.
Seaton MJ, Schlosser PM, Bond JA, Medinsky MA. 1994.Benzene metabolism by human liver microsomes in relation
25
KW Turteltaub and C Mani
to cytochrome P450 2E1 activity. Carcinogenesis 15:1799–1806.
Seaton MJ, Schlosser P, Medinsky MA. 1995. In vitro con-jugation of benzene metabolites by human liver: Potentialinfluence of interindividual variability on benzene tox-icity. Carcinogenesis 16:1519–1527.
Smith ET, Yager JW, Steinmetz KL, Eastmond DA. 1989.Peroxidase dependence metabolism of benzene’s phenolicmetabolites and its potential role in benzene’s toxicity andcarcinogenecity. Environ Health Perspect 82:23–29.
Smith MT. 1996. Overview of benzene-induced aplasticanaemia. Eur J Haematol 57:107–110.
Smith MT, Robertson ML, Yager JW, Eastmond DA. 1990.Role of metabolism in benzene-induced myelotoxicity andleukemogenesis. Prog Clin Biol Res 340B:125–136.
Snyder R, Hedli CC. 1996. An overview of benzene metab-olism. Environ Health Perspect 104:1165–1171.
Snyder R, Kalf A. 1994. A perspective on benzene leuke-mogenesis. Crit Rev Toxicol 24:177–209.
Snyder R, Kocsis JJ. 1975. Current concepts of chronic ben-zene toxicity. CRC Crit Rev Toxicol 3:265–288.
Snyder R, Lee EW, Kocsis JJ. 1978. Binding of labeled ben-zene metabolites to mouse liver and bone marrow. ResCommun Chem Pathol Pharmacol 20:191–194.
Snyder R, Witz G, Goldstein BD. 1993. The toxicology ofbenzene. Environ Health Perspect 100:293–306.
Sun JD, Medinsky MA, Birnbaum LS, Lucier G, HendersonRF. 1990. Benzene hemoglobin adducts in mice and rats:Characterization of formation and physiological modeling.Fundam Appl Toxicol 15:468–475.
Tompa A, Major J, Jakab MG. 1994. Monitoring of benzene-exposed workers for genotoxic effects of benzene:Improved-working-condition-related decrease in the fre-quencies of chromosomal aberrations in peripheral bloodlymphocytes. Mutat Res 304:159–165.
Tuo JS, Deng XS, Loft S, Poulsen HE.1999. Dexamethasoneameliorates oxidative DNA damage induced by benzeneand LPS in mouse bone marrow. Free Radic Res 30:29–36.
Turteltaub KW, Vogel JS. 1995. Application of acceleratormass spectrometry in toxicology: A highly sensitive toolfor low-level isotope measurements. In: Mass Spectrom-
etry in the Biological Sciences (Burlingame AL, Carr SA,eds), pp 477–495. Humana Press, Totawa NJ.
Turteltaub KW, Vogel JS, Frantz C, Felton JS, McManus M.1995. Assessment of the DNA adduction and pharmacoki-netics of PhIP and MeIOx in rodents at doses approxi-mating human exposure using the technique of acceleratormass spectrometry (AMS) and 32P-postlabeling. PrincessTakamatsu Symp 23:93–102.
Turteltaub KW, Vogel JS, Frantz CE, Fultz E. 1993. Studieson DNA adduction with heterocyclic amines by acceler-ator mass spectrometry: A new technique for tracing iso-tope-labeled DNA adduction. In: Postlabeling Methods forDetection of DNA Adducts (Phillips DH, Castegnaro M,Bartsch H, eds), pp 293–300. International Agency forResearch on Cancer, Lyon, France.
Vogel JS. 1992. Rapid production of graphite without con-tamination for biological AMS. Radiocarbon 34:344–350.
Vogel JS, Turteltaub KW, Finkel R, Nelson DE. 1995. Accel-erator mass spectrometry: Isotope identification at atto-mole sensitivity. Anal Chem 67:353A–359A.
Wallace LA. 1989. The exposure of the general populationto benzene. In: Benzene: Occupational and EnvironmentalHazards. Scientific Update (Mehlman MA, ed), pp 113–130. Princeton Scientific Publishers, Princeton NJ.
Wallace L. 1996. Environmental exposure to benzene: Anupdate. Environ Health Perspect 12:1129–1136
Wallace L, Pellizzari E, Hartwell T, Rosenzweig M,Erickson M, Sparacino C, Zelon H. 1984. Personal expo-sure to volatile organic compounds. Direct measurementin breath zone air, drinking water, food and exhaledbreath. Environ Res 35:293–319.
Witz G, Kirley TA, Maniara WM, Mylavarapu VJ, GoldsteinBD. 1991. The metabolism of benzene to muconic acid, apotential biologic marker of benzene exposure. Adv ExpMed Biol 283:613–618.
Witz G, Maniara W, Mylavarapu V, Goldstein BD 1990.Comparative metabolism of benzene and trans,trans-muconaldehyde to trans,trans-muconic acid in DBA/2Nand C57BL/6 mice. Biochem Pharmacol 40:1275–1280.
Yeowell-O'Connell K, Rothman N, Smith MT, Hayes RB, LiG, Waidyanatha S, Dosemeci M, Zhang L, Yin S, Titenko-Holland N, Rappaport SM. 1998. Hemoglobin and albuminadducts of benzene oxide among workers exposed to highlevels of benzene. Carcinogenesis 9:1565–1571.

26
Benzene Metabolism at Doses Relevant to Human Exposure
APPENDIX AVAILABLE ON REQUEST
The following appendix is available by contacting theHealth Effects Institute. Please give the author name, fulltitle and number of the report.
Appendix A. Row Data for Studies.
ABOUT THE AUTHORS
Kenneth W Turteltaub received a PhD in toxicology fromIowa State University in 1987. He was a postdoctoralfellow with Dr James Felton from 1987 to 1990 in the Bio-medical and Environmental Sciences Program at theLawrence Livermore National Laboratory. Currently DrTurteltaub is the head of the Molecular Toxicology GroupBiology and Biotechnology Research Program of theLawrence Livermore National Laboratory and holds anadjunct appointment in pharmaceutical chemistry at theUniversity of California, San Francisco. His primaryresearch interests involve the mechanisms of carcinogen-esis and the development of biomedical applications ofaccelerator mass spectrometry.
Chitra Mani received a bachelor’s degree from MadrasUniversity, India. She received a PhD in biomedical sci-ences from Worcester Polytechnic Institute, Massachu-setts, in 1993. Her thesis focused on the bioactivation ofthe binding of tamoxifen to microsomal proteins in liver.She continued on to a postdoctoral fellowship at StanfordUniversity and joined Dr Turteltaub’s group at LawrenceLivermore National Laboratory in 1995. She is presently ascientist at Pharmacyclics, a pharmaceutical company inSunnyvale, California.
OTHER PUBLICATIONS RESULTING FROM THIS RESEARCH
Mani C, Freeman S, Nelson D, Vogel SJ, Turteltaub KW.1999. Species and strain differences in the macromolec-ular binding of extremely low doses of [14C]benzene inrodents. Toxicol Appl Pharmacol 159:83–90.
Creek MR, Mani C, Vogel JS, Turteltaub KW. 1998. Tissuedistribution and macromolecular binding of extremely lowdoses of [14C]-benzene in B6C3F1 mice. Carcinogenesis18:2421–2427.
Turteltaub KW, Mani C, Dingley KH, Bench G, Mauthe RJ.1998. DNA adducts using accelerator mass spectrometry.In: Biomarkers (Mendelsohn ML, Mohr LC, Peeters JP, eds),pp 99–114. Joseph Henry Press, Washington DC.
ABBREVIATIONS AND OTHER TERMS
AMS accelerator mass spectrometry
attomole 10−18 mole
AUC area under the curve
CO2 carbon dioxide
DTT dithiothreitol
EC enzyme classification number
EPA Environmental Protection Agency (US)
femtomole 10−15 mole
GLS generalized least squares
HPLC high-performance liquid chromatog-raphy
IP intraperitoneal
MOPS 3-(N-morpholino)propanesulfonic acid
PCA perchloric acid
RNase ribonuclease
TBAHS tetrabutylammonium hydrogen sulfate

Health Effects Institute Research Report 113 © 2003 27
COMMENTARYHealth Review Committee
INTRODUCTION
In humans and other species, chronic exposure to highconcentrations of benzene induces a spectrum of condi-tions, including cancer. The effects of human exposure tobenzene at the low levels found in ambient air are not wellunderstood, however. One of the major reasons for thislack of understanding is the dearth of sensitive and accu-rate assays of benzene metabolites for these low concentra-tions. Consequently, the shape of the dose-response curvedescribing health effects at low benzene concentrations—an issue central to assessment of human risk from ben-zene—remains unresolved.
HEI initiated a research program in the 1990s to addressthe need for knowledge about health effects resulting fromexposure to ambient levels of toxic air pollutants,including benzene. Request for Applications (RFA*) 93-1,Novel Approaches to Extrapolation of Health Effects forMobile Source Toxic Air Pollutants, was part of that pro-gram. In response to this RFA, Dr Kenneth Turteltaub andhis colleague Dr Chitra Mani proposed to investigate ben-zene metabolism in rodents over an eight log-dose range,encompassing concentrations close to those to whichhumans are exposed in ambient air (typically 1 to 10 ppb,equivalent to 3.2 to 32 µg/m3 [Wallace 1996]). To achievethe sensitivity required to investigate the effects of low-level exposure to benzene, the investigators proposed touse accelerator mass spectrometry (AMS) coupled withhigh-performance liquid chromatography (HPLC). The HEIHealth Research Committee recommended funding theproposal because it thought the study could yield impor-tant information about the metabolism of benzene at low-exposure doses. Because benzene itself is not thought to bethe toxic agent, the Committee reasoned that obtainingquantitative data about the metabolism of benzene at dif-ferent exposure levels would provide information relevantto understanding the health effects of benzene at these dif-ferent levels of exposure.†
Dr Turteltaub’s draft Investigators’ Report underwentexternal peer review under direction of the HEI HealthReview Committee, the members of which discussed thereport and the reviewers’ critiques and prepared the Com-mentary. This Commentary is intended to aid HEI sponsorsand the public by highlighting the strengths of the study,pointing out alternative interpretations, and placing thereport into scientific perspective. During the review of DrTurteltaub’s study, the HEI Review Committee and theinvestigators exchanged comments and clarified issues inthe Investigators’ Report and in the Commentary.
SCIENTIFIC BACKGROUND
BENZENE METABOLISM AND MECHANISM OF TOXIC EFFECTS
Exposure to benzene can be toxic to bone marrow and tocells derived from bone marrow in humans and other spe-cies. Depending on the level and duration of exposure, aspectrum of conditions including pancytopenia, aplasticanemia, and acute myeloid leukemia can be induced inhumans (reviewed in Goldstein and Witz 2000). In otherspecies, controlled exposure to high levels of benzeneresults in tumor formation at many sites but does notinduce leukemias (International Agency for Research onCancer 1982; Huff et al 1989).
Studies suggest that benzene must be metabolized toinduce toxic effects (reviewed in Snyder and Hedli 1996).Some benzene metabolism does take place in the targetorgan (the bone marrow) but most occurs in the liver viamultiple pathways. The major mechanism of benzenemetabolism in the liver is oxidation by the cytochromeP450 2E1 monooxygenase system. Figure 1 in the Investiga-tors’ Report depicts the principal pathways of benzenemetabolism and the metabolites formed. One of the keyearly intermediates in benzene metabolism is benzeneoxide, a highly reactive epoxide, which spontaneously rear-ranges to form phenol. Phenol in turn can be oxidized bycytochrome P450 enzymes to catechol (1,2-dihydroxyben-zene), hydroquinone (HQ, or 2,4-dihydroxybenzene), or1,2,4-trihydroxybenzene (also referred to as benzene triol, orBT). Benzene oxide can also be metabolized by opening thebenzene ring, producing metabolites that includetrans,trans-muconic acid (t,t-MA). Benzene oxide alsoreacts with glutathione to form S-phenylmercapturic acid(S-PMA). In bone marrow, myeloperoxidase catalyzes thefurther oxidation of ring-hydroxylated benzene metabolites
*A list of abbreviations and other terms appears at the end of the Investiga-tors’ Report.
† Dr Turteltaub’s 3-year study, Benzene Metabolism at Doses Relevant toHuman Urban Air Exposure, began in April 1995. Total expenditures were$717,150. The draft Investigators’ Report from Turteltaub and Mani wasreceived for review in November 2000. A revised report, received in August2001, was accepted for publication in September 2001. During the reviewprocess, the HEI Health Review Committee and the investigators had theopportunity to exchange comments and to clarify issues in both the Investi-gators’ Report and in the Review Committee’s Commentary.
This document has not been reviewed by public or private party institu-tions, including those that support the Health Effects Institute; therefore, itmay not reflect the views of these parties, and no endorsements by themshould be inferred.

28
Commentary
to highly reactive quinones such as 1,2- and 1,4-benzo-quinone (1,2- and 1,4-BQ). The highly reactive electro-philic metabolites of benzene, such as benzene oxide andthe quinones, can form covalent adducts with nucleophilicsites on protein and DNA macromolecules.
The mechanism of benzene toxicity remains elusivedespite extensive research. Several mechanisms have beenproposed. One widely held hypothesis is that certain ben-zene metabolites (including benzoquinone, hydroquinone,and products of benzene triol) produce reactive oxygenspecies that interact with cellular macromolecules (Smith1996). This interaction may result in genotoxic events.Another interaction that has been described is inhibition(by activated benzene metabolites) of the activity of thenuclear enzyme topoisomerase II (Chen and Eastmond1995). Because this enzyme is involved in stabilizing thechromosomal structure, inhibiting its activity may inducechromosomal abnormalities (Chen and Eastmond 1995;Eastmond et al 2001). A combination of ring-hydroxylatedcompounds may also be the toxic agent of benzene (East-mond et al 1987). Another hypothesis is that muconalde-hyde (the precursor of t,t-MA), possibly in combinationwith other metabolites (Witz et al 1996), plays a role inbenzene’s toxicity by inducing oncogene expression (Hoand Witz, 1997).
ASSESSMENT OF RISK
Studies of occupational epidemiology have establishedthat benzene can induce leukemia, and the US Environ-mental Protection Agency (EPA) has classified benzene asa known human carcinogen (EPA 1998a). The US Occupa-tional Safety and Health Administration regulates benzenelevels in the workplace, and has set a workplace standardof 1.0 ppm as an 8-hour time weighted average (OSHA1987). In addition, the American Conference of Govern-ment and Industrial Hygienists has recommended athreshold limit value for occupational exposure of 0.5 ppmas an 8-hour time weighted average (ACGIH 1999) and theUS National Institute of Occupational Safety and Healthhas recommended a workplace benzene standard of 0.2 pm(Goldstein and Witz 2000).
Little direct information is available about the humanhealth risk of exposure to typical environmental levels ofbenzene. Thus, risk estimates have been based on extrapo-lating data obtained in other types of studies, low-doseexposures of nonhuman species and high-dose occupa-tional exposures of humans. How accurately such studiesmodel exposure of humans to low doses, however, isunclear. First, extrapolation to humans from controlledlow-dose exposure studies of other species (especiallyrodents) is difficult because species, and different strains
within a species, differ in their responses to benzene (Lon-gacre et al 1981; Witz et al 1990; Huff 1993). For example,B6C3F1 mice are more sensitive than Fischer rats to thehematotoxic and carcinogenic effects of chronic exposureto benzene (Huff 1993). In addition, studies prior to thisone have reported that levels of specific metabolites differamong species and in different strains within a species(Longacre et al 1981; Sabourin et al 1988a; Witz et al 1990;Henderson 1996). These quantitative differences may becritical, and the differences in cancer susceptibility amongdifferent animals may be due to the relative amounts of dif-ferent metabolites formed.
Second, extrapolating results of high-dose exposure ofhumans to benzene in order to predict effects of low-doseexposure is also difficult. In the absence of data on low-dose exposures, such extrapolation assumes linear rela-tions among exposure level, metabolite mixture, andhealth outcome. High-dose and low-dose exposures ofhumans to benzene may result in different mixtures ofmetabolites, however, as has been described for rats andmice and in an epidemiologic study: high levels of benzenegenerate relatively less hydroquinone than lower levels(Henderson 1996; Rothman et al 1998). These findings sug-gest that extrapolation from high to low dose should con-sider metabolic patterns at various exposure levels. Thesemetabolite patterns should be more closely related thanbenzene exposure levels to health outcomes.
1998, the EPA published Carcinogenic Effects of Ben-zene: An Update, its most recent exhaustive review of per-tinent studies of benzene’s cancer effects (EPA 1998a).Regarding an estimate of risk from environmental exposureto benzene, the document states that "there is not sufficientevidence…to reject a linear dose-response curve for ben-zene in the low-dose region, nor is there sufficient evi-dence to demonstrate that benzene is, in fact, nonlinear inits effects." Thus, "the EPA default approach of using amodel with low-dose linearity is still recommended. Of thevarious approaches employing a linear assumption, the[lifetime] risk at 1 ppm [of benzene in air] ranges from 7.1× 10⁻³ to 2.5 × 10⁻², within which any calculated unit riskestimate would have equal scientific validity.” The EPAhas produced a draft of a similarly comprehensive docu-ment on the noncancer effects of benzene (EPA 1998b).
Although the linear model is currently used in esti-mating risk, arguments exist for a model assuming either asupralinear or sublinear dose response. Improving theaccuracy of benzene risk assessment at environmentalexposure levels requires more information of several types:information about the mechanism of induction of benzene-induced leukemia and other benzene-induced disorders;information needed to characterize the specific mixture of

29
Health Review Committee
benzene metabolites delivered from liver to bone marrow,the fate of these metabolites in the bone marrow, and ulti-mately, the role of specific metabolites in development ofblood abnormalities; and information about biomarkers ofexposure as well as effect.
TECHNICAL EVALUATION
AIMS
1. To determine how dose influences benzene metabo-lism in mice. The investigators administered 5 ng to500 mg 14C-benzene per kg body weight to B6C3F1mice via intraperitoneal (IP) injection. They usedHPLC to separate and identify several benzenemetabolites (focusing on hydroquinone, MA, cate-chol, and phenol) in urine, plasma, liver, and bonemarrow up to 48 hours after injection. They thenused AMS to measure levels of 14C-metabolites.
2. To compare the formation of DNA and protein adductswith the profile of other metabolites over a wide rangeof benzene doses. The investigators initially assessedthe kinetics of forming DNA and protein adducts inB6C3F1 mice after IP injection of a single dose of 14C-benzene (5 µg per kg body weight). Using AMS, theymeasured adduct formation in liver and bonemarrow up to 48 hours after injecting benzene. Theyalso measured adduct formation over time at a rangeof 14C-benzene doses (5 ng to 500 mg per kg bodyweight).
3. To compare benzene adduct formation among dif-ferent rodents after dosing with low doses of benzene.Using AMS, the investigators measured formation ofDNA and protein adducts in liver and bone marrowup to 48 hours after IP injection of 5 µg/kg benzene tomice (B6C3F1, DBA/2, C57BL/6) and to Fischer rats.
4. To develop methods for measuring DNA and proteinadducts after inhalation of low doses of benzene. Theinvestigators conducted a pilot study to develop amethod for exposing mice and Fischer rats by inhala-tion to an approximate body burden of 5 µg benzeneper kg body weight. They then compared formationof DNA and protein adducts after inhalation and afterIP injection of the same dose of benzene.
METHODS
Exposure to Benzene
The investigators used male B6C3F1, DBA/2, and C57BL/6mice (30 g) and male Fischer rats (200 g). In most experi-ments, they exposed the animals to various concentrations of
benzene via IP injection: each animal received 200 µL cornoil containing 0.1 µCi of 14C-benzene diluted with nonradio-active benzene. According to the investigators, the radioac-tive benzene was 99% radiopure and contained no contam-inating peaks when assayed by HPLC. Control animals weregiven corn oil only. For toxicokinetic studies, the investiga-tors gave animals IP injections of 5 µg 14C-benzene per kgbody weight in corn oil (200 µL/animal) and killed the ani-mals at intervals from 0 to 48 hours after injection.
In some experiments, the investigators exposed rats andmice to 5 µg benzene per kg body weight by nose-onlyinhalation. The duration of exposure was based on eachspecies’ weight (rat, 200 g; mouse, 30 g) and volume of airdelivered per minute (0.2 L for rats, 0.04 L for mice). Ratswere exposed to 0.1 ppm 14C-benzene (0.09 µCi/animal)for 20 minutes via nose-only inhalation in a chamber at theLovelace Respiratory Research Institute (Albuquerque NM)under the supervision of Dr Janet Benson. Mice wereexposed to 0.1 ppm benzene for 2.5 minutes via nose-onlyinhalation in a chamber constructed in the investigators’laboratory. The concentration of benzene to which therodents were exposed was continuously monitored byonline infrared spectroscopy.
Separation and Analysis of Benzene Metabolites
Turteltaub and Mani separated and quantified individualbenzene metabolites in urine and in ethyl-acetate extracts ofplasma, liver, and bone marrow by HPLC as described bySabourin and colleagues (1988a). Metabolite standards wereobtained either from Sigma Chemical Company (catechol,hydroquinone, MA, and phenol; > 99% pure) or were the giftof Dr William Bechtold, Lovelace Respiratory Research Insti-tute (hydroquinone sulfate, phenyl glucuronide, and phenylsulfate). Urinary metabolites were separated and quantifiedby HPLC as described in Sabourin and colleagues (1988b).Data were normalized to the recoveries of an internal stan-dard and were expressed as femtomole 14C-labeled metabo-lite per mL HPLC eluant (Bechtold et al 1988).
Measurement of Adducts
The investigators determined the amount of benzene-derived DNA and protein adducts, which they extractedand purified from liver and bone marrow of B6C3F1 mice.DNA and protein were extracted at 1 and 12 hours after IPinjection of 5 ng to 500 mg benzene per kg body weight.The investigators used two time points because they hadpreviously found differences in the kinetics of adduct for-mation between liver and bone marrow: adduct burden inliver reached maximum levels within a few hours of expo-sure, whereas adduct burden in bone marrow reachedmaximum levels 6 to 12 hours after exposure (Creek et al

30
Commentary
1997). To compare adduct formation among rats and mice,the investigators determined adduct levels in liver andbone marrow at various times up to 48 hours after IP injec-tion of 5 µg benzene per kg body weight into B6C3F1,DBA/2, and C57BL/6 mice and Fischer rats.
AMS Analysis
The investigators assessed the radiocarbon content ofsamples by AMS. To samples containing small amounts ofcarbon, such as extracted DNA adducts and HPLC fractionsfrom liver, plasma, and bone marrow, they added thecarbon-containing compound tributyrin as a carrier toimprove the efficiency of sample handling. Samples weredried in a vacuum centrifuge and were then converted tographite using a two-step process (Vogel 1992). Briefly, thedried samples were oxidized to carbon dioxide (CO2) byheating at 900°C for 4 hours in the presence of copperoxide. The CO2 was then reduced to filamentous graphitein the presence of cobalt at 900°C. The investigators placedthe resultant graphite-on-cobalt in the ion source of a spec-trometer and analyzed it using methods described previ-ously (Turteltaub et al 1993).
Because AMS measures the ratio of a rare isotope rela-tive to a stable isotope, the investigators measured concen-trations of 14C relative to 13C and normalized them to a14C/12C ratio (Vogel et al 1995). The ratios were convertedto mass of 14C-benzene based on the specific activity of thebenzene after subtracting the natural radiocarbon contentcontributed from the sample and the tributyrin carrier,when added.
AMS provides a measure of radiocarbon content onlyand gives no information on the origin or source of theradiocarbon. Thus, all these data were reported as benzeneequivalents.
Radiocarbon is present in all biological material.Present-day natural levels (background) of 14C in livingbiological materials are 112 ± 5 attomol (ie, 10−18 mol) perg carbon. Based on analysis of more than 500 samples,tributyrin contains 15 ± 2 attomol 14C/mg. For the time-course data in this study, historical data on the 14C contentin unexposed animals was used as background. The nat-ural amount of radiocarbon in all biological material isconstant in these animals due to their age and growth con-ditions; generally, the amount varies by less than 10%.
Cumulative Burden
To compare total levels of metabolites in liver and bonemarrow, Turteltaub and Mani calculated an area under thecurve (AUC) for each metabolite or adduct in each tissueby estimating integrals at different times for up to 48 hoursafter administering benzene.
RESULTS
HPLC-AMS Detection of Low Levels of Benzene Metabolites
AMS allowed low femtomolar concentrations of 14C-labeled benzene metabolites separated by HPLC to bedetected in biological samples (eg, from mouse urine, asshown in Figure 2). The distribution of 14C across theHPLC separation (black bars) generally matched the profileof benzene metabolite standards (hydroquinone, MA,phenyl glucuronide, catechol, hydroquinone sulfate, andphenyl sulfate). Figure 2 also shows a high amount of arapidly eluting, unidentified product in the sample.
Detection of Dose-Dependent Benzene Metabolites in Tissues of B6C3F1 Mice
The Commentary Table summarizes the major results ofthe experiments involving B6C3F1 mice. Levels of severalbenzene metabolites detected in urine one hour after IPinjection of benzene were dose dependent over the range50 ng to 500 mg benzene per kg body weight (Figure 3). Atthe lowest end of the range (50 to 500 ng benzene per kgbody weight), the slope of the dose-response curve wasflatter than for higher doses but was still above backgroundlevels. In addition, the relative amounts of benzene metab-olites detected in urine remained constant over the doserange, 50 ng/kg to 500 mg/kg: unidentified metabolite ≥phenyl sulfate > MA > phenyl glucuronide ≥ hydro-quinone sulfate. The unidentified metabolite, phenyl sul-fate, and MA were therefore considered major urinarymetabolites of benzene, and phenyl glucuronide and hyd-roquinone sulfate minor urinary metabolites. The investi-gators reported that they detected low levels of freecatechol and hydroquinone but that levels of these metab-olites did not vary with benzene dose.
The pattern of metabolites detected in liver, bonemarrow, and plasma differed from that found in urine onehour after IP benzene injection (Figure 4 and Table 1).Levels of MA, hydroquinone, catechol, and phenol wereanalyzed after injecting 5, 50, or 5000 ng benzene per kgbody weight. (The unidentified metabolite detected inurine was not measured in these tissues.) In the liver,levels of MA, catechol, and hydroquinone varied with thebenzene dose, but levels of phenol did not. In plasma andbone marrow, no metabolites depended on benzene dose.
Kinetics and Total Levels of Metabolite Formation in B6C3F1 Mouse Tissues
The investigators examined the kinetics of hydro-quinone, catechol, phenol, and MA formation and clear-ance in plasma, liver and bone marrow from 0 to 48 hoursafter IP injection of 5 µg 14C-benzene per kg body weight
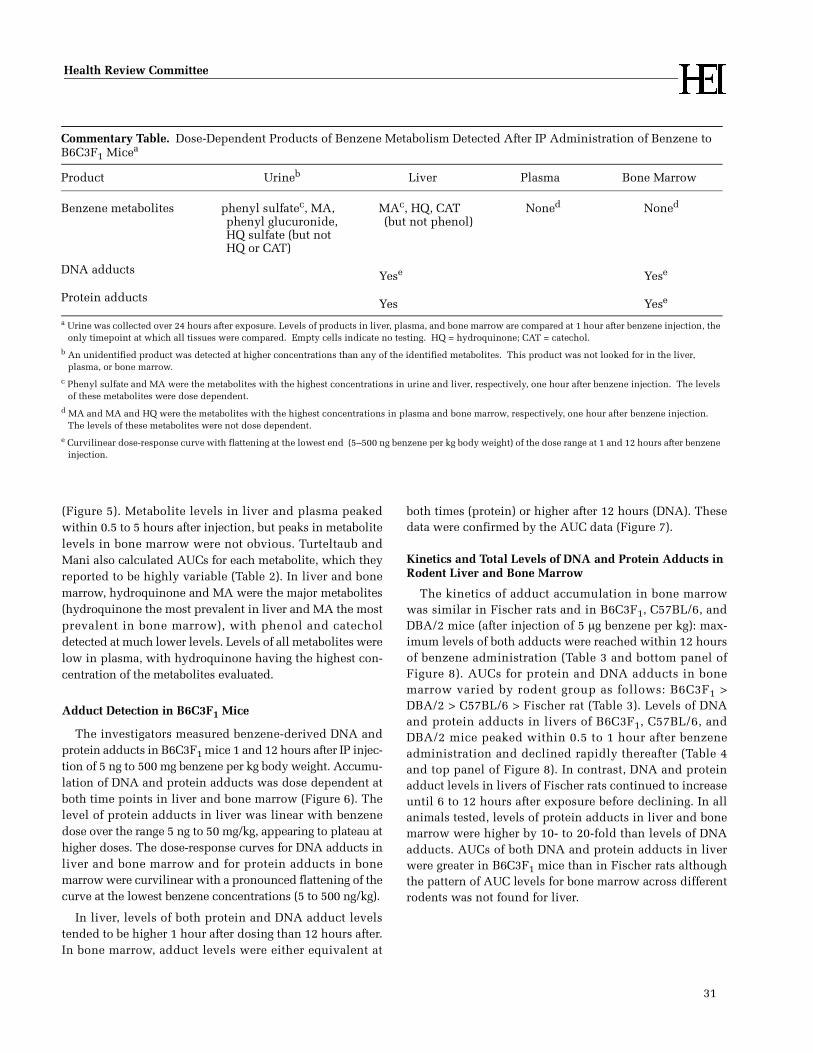
31
Health Review Committee
(Figure 5). Metabolite levels in liver and plasma peakedwithin 0.5 to 5 hours after injection, but peaks in metabolitelevels in bone marrow were not obvious. Turteltaub andMani also calculated AUCs for each metabolite, which theyreported to be highly variable (Table 2). In liver and bonemarrow, hydroquinone and MA were the major metabolites(hydroquinone the most prevalent in liver and MA the mostprevalent in bone marrow), with phenol and catecholdetected at much lower levels. Levels of all metabolites werelow in plasma, with hydroquinone having the highest con-centration of the metabolites evaluated.
Adduct Detection in B6C3F1 Mice
The investigators measured benzene-derived DNA andprotein adducts in B6C3F1 mice 1 and 12 hours after IP injec-tion of 5 ng to 500 mg benzene per kg body weight. Accumu-lation of DNA and protein adducts was dose dependent atboth time points in liver and bone marrow (Figure 6). Thelevel of protein adducts in liver was linear with benzenedose over the range 5 ng to 50 mg/kg, appearing to plateau athigher doses. The dose-response curves for DNA adducts inliver and bone marrow and for protein adducts in bonemarrow were curvilinear with a pronounced flattening of thecurve at the lowest benzene concentrations (5 to 500 ng/kg).
In liver, levels of both protein and DNA adduct levelstended to be higher 1 hour after dosing than 12 hours after.In bone marrow, adduct levels were either equivalent at
both times (protein) or higher after 12 hours (DNA). Thesedata were confirmed by the AUC data (Figure 7).
Kinetics and Total Levels of DNA and Protein Adducts in Rodent Liver and Bone Marrow
The kinetics of adduct accumulation in bone marrowwas similar in Fischer rats and in B6C3F1, C57BL/6, andDBA/2 mice (after injection of 5 µg benzene per kg): max-imum levels of both adducts were reached within 12 hoursof benzene administration (Table 3 and bottom panel ofFigure 8). AUCs for protein and DNA adducts in bonemarrow varied by rodent group as follows: B6C3F1 >DBA/2 > C57BL/6 > Fischer rat (Table 3). Levels of DNAand protein adducts in livers of B6C3F1, C57BL/6, andDBA/2 mice peaked within 0.5 to 1 hour after benzeneadministration and declined rapidly thereafter (Table 4and top panel of Figure 8). In contrast, DNA and proteinadduct levels in livers of Fischer rats continued to increaseuntil 6 to 12 hours after exposure before declining. In allanimals tested, levels of protein adducts in liver and bonemarrow were higher by 10- to 20-fold than levels of DNAadducts. AUCs of both DNA and protein adducts in liverwere greater in B6C3F1 mice than in Fischer rats althoughthe pattern of AUC levels for bone marrow across differentrodents was not found for liver.
Commentary Table. Dose-Dependent Products of Benzene Metabolism Detected After IP Administration of Benzene to B6C3F1 Micea
Product Urineb Liver Plasma Bone Marrow
Benzene metabolites phenyl sulfatec, MA, phenyl glucuronide, HQ sulfate (but not HQ or CAT)
MAc, HQ, CAT (but not phenol)
Noned Noned
DNA adducts Yese Yese
Protein adducts Yes Yese
a Urine was collected over 24 hours after exposure. Levels of products in liver, plasma, and bone marrow are compared at 1 hour after benzene injection, the only timepoint at which all tissues were compared. Empty cells indicate no testing. HQ = hydroquinone; CAT = catechol.
b An unidentified product was detected at higher concentrations than any of the identified metabolites. This product was not looked for in the liver, plasma, or bone marrow.
c Phenyl sulfate and MA were the metabolites with the highest concentrations in urine and liver, respectively, one hour after benzene injection. The levels of these metabolites were dose dependent.
d MA and MA and HQ were the metabolites with the highest concentrations in plasma and bone marrow, respectively, one hour after benzene injection. The levels of these metabolites were not dose dependent.
e Curvilinear dose-response curve with flattening at the lowest end (5–500 ng benzene per kg body weight) of the dose range at 1 and 12 hours after benzene injection.

32
Commentary
Adduct Formation in Rats and B6C3F1 Mice After Benzene Inhalation
The investigators detected DNA and protein adducts inliver and bone marrow of B6C3F1 mice and rats up to 24hours after exposure to 5 µg benzene per kg body weight byinhalation (Tables 5 and 6). Adduct levels in mouse liver andbone marrow were consistently higher than those of the rat.
The kinetics of adduct appearance in mouse liver andbone marrow were similar after inhalation and IP expo-sures; adduct levels peaked 1 and 12 hours after exposurein liver and bone marrow, respectively (Figure 9). In con-trast, adduct kinetics in rats differed by exposure route:After IP injection, both protein and DNA adducts increasedfor up to 6 to 12 hours; after inhalation exposure, adductformation either peaked within an hour of exposure orshowed no clear peak at all (Figure 10). Regardless of theroute of exposure or tissue, levels of protein adducts weregreater than DNA adduct levels in mice and rats (Tables 3and 4). Adduct levels in both species were generally lowerafter inhalation than after IP injection (Figure 11).
DISCUSSION
Turteltaub and Mani have performed an important andinnovative study of the dosimetry of benzene metabolism,producing data that address several critical issues. Using anovel and sensitive analytic technique—AMS coupledwith HPLC—they were able to detect dose-dependent for-mation of benzene metabolites, including DNA and proteinadducts, in the tissues of mice at levels 100 times lowerthan any found in previous studies. In both mice and ratsthey detected higher levels of benzene metabolites in liverand bone marrow than in plasma. These findings indicatethat benzene reaches tissues and is metabolized there, evenat levels near those to which humans may be exposed inambient air, 1 to 10 ppb. (By way of comparison with thedoses used in the current study, injecting 10 µg benzeneper kg body weight is equivalent to a mouse inhaling 2 ppbbenzene for 2.5 minutes.)
In addition, adduct levels detected in bone marrow andliver in different rodents generally correlated well with theability of benzene to induce tumors in that species or strain.This finding is important because it suggests that the forma-tion of adducts may be an early marker of benzene toxicityor carcinogenicity. Turteltaub and Mani also showed thatbenzene doses over a wide range generate similar patternsof metabolites in B6C3F1 mice, suggesting that the patternof benzene metabolism is similar at widely disparate con-centrations. This outcome differs from those reported inprevious rodent, human, and nonhuman primate studies in
which different patterns of metabolites were found at dif-ferent exposure concentrations (Sabourin et al 1992; Hend-erson 1996; Mathews et al 1998; Rothman et al 1998). Thereasons for these differences in results among studies arenot clear. In the current study, only low levels of hydro-quinone were detected in the urine of exposed mice, exclu-sively in the sulfate conjugate form. By contrast, earlierstudies indicated that in mice, hydroquinone glucuronidewas a major urinary metabolite of benzene—comprising upto 40% of all urinary metabolites—especially at low dosesof benzene (Sabourin et al 1989; Henderson 1996; Mathewset al 1998). The absence of hydroquinone glucuronide inthe current study, which most likely resulted from theinvestigators not including an inhibitor of the enzyme glu-curonidase in samples to prevent glucuronide breakdown,makes the results difficult to compare with previousrodent studies (Henderson et al 1996; Mathews et al 1998).Moreover, these rodent studies and studies of urinary ben-zene metabolites in humans and nonhuman primatesfound that the change in proportion of hydroquinone glu-curonide relative to other metabolites at different levels ofbenzene exposure was the main indicator of a dose-depen-dent shift in metabolism (Sabourin et al 1992; Hendersonet al 1996; Mathews et al 1998; Rothman et al 1998). Tur-teltaub and Mani’s inability to detect a dose-dependentshift in urinary metabolites in the current study may bedue, in part, to an inability to detect this major metaboliteof benzene.
The investigators’ use of an AUC approach provided amore accurate depiction of metabolite accumulation in tis-sues over time than data collected at a single time point.Calculation of AUCs produced numbers with large vari-ances. Mani and Turteltaub speculate that these variancesmay have been due to variation among the animals, inves-tigator error in multiple sampling, or artifacts related tomeasurement of HPLC fractions.
In addition, the finding that more benzene metaboliteswere formed after IP injection compared with inhalation ofthe same calculated dose may be important because it sug-gests that exposure via different routes may differ quantita-tively. Such differences in metabolite formation after IPexposure to benzene compared with oral exposure havebeen described previously (Sabourin et al 1989). However,although Turteltaub and Mani calculated the inhaled doseto equal the injected dose, previous estimates suggest thatthe actual dose absorbed after inhalation is probably onlyapproximately one-half the inhaled dose (Sabourin et al1987; Travis et al 1990). This discrepancy may account forthe difference in metabolite levels detected after exposurevia inhalation versus IP injection.

33
Health Review Committee
Turteltaub and Mani’s finding that the formation of DNAand protein adducts in liver and bone marrow dependedon benzene dose suggests that adduct levels may be biom-arkers of benzene exposure. The usefulness of benzeneadducts as biomarkers has been evaluated in other studies.Recent data suggest that plasma levels of the hemoglobinand albumin adducts of benzene oxide, which are proteinadducts of a benzene metabolite, may be useful as markersof occupational-level exposure to benzene (Yeowell-O’Connell et al 1998), but no information is available atexposure doses comparable to those used in the currentstudy. Turteltaub and Mani did not identify the adductsthey detected, so they do not know if the same adducts areformed in both liver and bone marrow. Identification ofthese adducts is critical for determining their utility asbiomarkers of benzene exposure. In addition, Turteltauband Mani evaluated adduct formation in liver and bonemarrow only, which are sites that cannot be routinely sam-pled. Further quantification and characterization of DNAand protein adducts in urine and blood is needed for theirvalidation as useful biomarkers of benzene exposure.
The findings of this study require a few caveats. Althoughthe results show the sensitivity of AMS coupled withHPLC, they also illustrate potential drawbacks. First, in thecurrent study, urine of B6C3F1 mice exposed to 14C-ben-zene contained a large peak of radioactivity that could notbe identified by HPLC. The investigators did not look forthis material in plasma or bone marrow; thus, the peakmight also have been present in samples from these tis-sues, with an uncertain impact on the results. This uniden-tified radioactive material may be a contaminant of theradioactive material used in the assays, or as Turteltaub andMani speculate, a previously unidentified metabolite or adecomposition product of a known benzene metabolite.Second, detection by AMS requires administration of radio-labeled benzene to study animals. Although this approachuses only extremely low levels of reagents, it is not broadlyapplicable to controlled exposure studies in humansbecause benzene is classified as a known human carcinogen.Third, although the AMS approach may be inherently moreanalytically sensitive than alternative approaches, thefailure to include glucuronidase inhibitors in samples in thecurrent study makes comparisons of some sets of results dif-ficult to relate to the results of others.
Turteltaub and Mani’s report of flattening of the dose-response curves for urinary metabolites and adduct forma-tion at the lowest end of the benzene exposure range (5 to500 ng/kg) suggests that metabolism of benzene to activatedmetabolites occurs even at these very low doses. Because thisdose-response pattern suggests no obvious threshold for ben-zene effects, this finding may have important ramifications
for understanding the human response to benzene at dosesclose to ambient levels. However, interpretation of theseresults is difficult. First, many of the radioactivity valuesreported for low benzene exposures, particularly thoseshown in Figure 6, are close to background. Interpretationof whether these values are above background is difficultbecause there are uncertainties about how the 14C contentwas determined and corrected in the measured values. Tur-teltaub and Mani state that a background level of 14C wassubtracted from the measured values, but they do not givethe number they used. The natural background level isthought to be approximately 8 pg benzene equivalents perg tissue, which is similar to levels detected at the lowestend of the dose response in this study. Second, the data inthis study are presented using log-log scales. This methodmay not be the most appropriate for data at the lowest endof the range; other transformations might show a differentdose-response pattern.
SUMMARY AND CONCLUSIONS
In this innovative study, the investigators showed that thesensitive technique of HPLC coupled with AMS coulddetect dose-dependent formation of many benzene metabo-lites in the liver, bone marrow, and urine of rodents. Dose-dependent formation of DNA and protein adducts in liverand bone marrow was detected over a wide dose range,including very low exposure. These findings indicate thatbenzene reaches target tissues and is metabolized there,even at levels near those in ambient air to which humansmay be exposed. Levels of adducts detected in bone marrowand liver in different rodents generally correlated well withthe ability of benzene to induce tumors in that species orstrain, suggesting that the formation of these adducts may bean early marker of benzene toxicity or carcinogenicity. Theresults also suggest, but do not show conclusively, that thedose-response curve for benzene in mice lacks an obviousthreshold at the lowest exposure levels evaluated. Furtherstudies are required to resolve the shape of the dose-response curve for humans at these low benzene levels.
ACKNOWLEDGMENTS
The Health Review Committee thanks the ad hocreviewers for their help in evaluating the scientific merit ofthe Investigators’ Report. The Committee is also grateful toDr Geoffrey Sunshine for his assistance in preparing its Com-mentary, and to Sally Edwards, Jenny Lamont, and FredHowe for their roles in publishing this Research Report.

34
Commentary
REFERENCES
American Conference of Government and IndustrialHygienists. 1999. Guide to Occupational Exposure Values.ACGIH, Cincinnati OH.
Bechtold WE, Sabourin PJ, Henderson RF. 1988. A reverseisotope dilution method for determining benzene andmetabolites in tissues. J Anal Toxicol 12:176–179.
Chen H, Eastmond DA. 1995. Topoisomerase inhibition byphenolic metabolites: A potential mechanism for ben-zene’s clastogenic effects. Carcinogenesis 16:2301–2307.
Creek MR, Mani C, Vogel JS, Turteltaub KW. 1997. Tissuedistribution and macromolecular binding of extremely lowdoses of [14C]-benzene in B6C3F1 mice. Carcinogenesis18:2421–2427.
Eastmond DA, Schuler M, Frantz C, Chen H, Parks R, WangL, Hasegawa L. 2001. Characterization and Mechanisms ofChromosomal Alterations Induced by Benzene in Mice andHumans. Research Report 103. Health Effects Institute,Cambridge MA.
Eastmond DA, Smith DT, Irons RD. 1987. An interaction ofbenzene metabolites reproduces the myelotoxicityobserved with benzene exposure. Toxicol Appl Pharmacol91:85–95.
Environmental Protection Agency (US). 1998a. Carcino-genic Effects of Benzene: An Update. EPA/600P-97/001F.Office of Research and Development, Washington DC.
Environmental Protection Agency (US). 1998b. Toxicolog-ical Review of Benzene (noncancer effects) [preliminarydraft]. USEPA NCEA-S-0455. EPA National Center forEnvironmental Assessment, Washington DC. (Available onthe Web a t cfpub.epa .gov/ncea/c fm/recordis -play.cfm?deid=12160.)
Goldstein BD, Witz G. 2000. Benzene. In: EnvironmentalToxicants: Human Exposures and Their Health Effects, 2nded (Lippmann M, ed), pp 121–149. John Wiley & Sons,New York NY.
Henderson RF. 1996. Species difference in the metabolismof benzene. Environ Health Perspect 104(Suppl 6):1173–1175.
Ho TY, Witz G. 1997. Increased gene expression in humanpromyeloid leukemia cells exposed to trans,trans-mucon-aldehyde, a hematotoxic benzene metabolite. Carcinogen-esis 18:739–744.
Huff JE, Haseman JK, DeMarini DM, Eustis S, MaronpotRR, Peters AC, Persing RL, Chrisp CE, Jacobs AC. 1989.Multiple-site carcinogenicity of benzene in Fischer 344rats and B6C3F1 mice. Environ Health Perspect 82:125–163.
Huff J. 1993. National Toxicology Program TechnicalReport on the Toxicology and Carcinogenesis Studies ofBenzene (CAS No. 71-43-2) in F344/N Rats and B6C3F1Mice (gavage studies). National Institutes of Environ-mental Health Sciences, Research Triangle Park NC.
International Agency for Research on Cancer. 1982. Ben-zene. In: Some Industrial Chemicals and Dyestuffs, pp 93–148. IARC Monographs on the Evaluation of CarcinogenicRisks to Humans, Vol 29. IARC, Lyon, France.
Longacre LS, Kocsis JJ, Snyder R. 1981. Influence of straindifferences in mice on the metabolism and toxicity of ben-zene. Toxicol Appl Pharmacol 60:398–409.
Mathews JM, Etheridge AS, Matthews HB. 1998. Dose-dependent metabolism of benzene in hamsters, rats, andmice. Toxicol Sci 44:14–21.
Occupational Safety and Health Administration (US).1987. Final rule on occupational exposure to benzene. FedRegist 54:34660–34762.
Rothman N, Bechtold WE, Yin S-N, Dosemeci M, Li G-L,Wang Y-Z, Griffith WC, Smith MT, Hayes RB. 1998. Uri-nary excretion of phenol, catechol, hydroquinone, andmuconic acid by workers occupationally exposed to ben-zene. Occup Environ Med 55:705–711.
Sabourin PJ, Bechtold WE, Birnbaum LS, Lucier G, Hend-erson RF. 1988a. Differences in the metabolism and dispo-sition of inhaled [3H] benzene by F344/N rats and B6C3F1mice. Toxicol Appl Pharmacol 94:128–140.
Sabourin PJ, Bechtold WE, Griffith WC, Birnbaum LS,Lucier G, Henderson RF. 1989. Effect of exposure concen-tration, exposure rate and route of administration onmetabolism of benzene by F344 rats and B6C3F1 mice.Toxicol Appl Pharmacol 99:421–444.
Sabourin PJ, Bechtold WE, Henderson RF. 1988b. A highpressure liquid chromatographic method for the separationand quantitation of water-soluble radiolabeled benzenemetabolites. Anal Biochem 170:316–327.
Sabourin PJ, Chen BT, Lucier G, Birnbaum LS, Fisher E,Henderson RF. 1987. Effect of dose on the absorption andexcretion of [14C] benzene administered orally or by inha-lation in rats and mice. Toxicol Appl Pharmacol 87:325–336.

35
Health Review Committee
Sabourin PJ, Muggenburg BA, Couch RC, Lefler D, LucierG, Birnbaum LS, Henderson RF. 1992. Metabolism of[14C]benzene by cynomolgus monkeys and chimpanzees.Toxicol Appl Pharmacol 114:277–284.
Smith MT. 1996. The mechanism of benzene-induced leu-kemia: A hypothesis and speculations on the causes of leu-kemia. Environ Health Perspect 104(Suppl 6):1219–1225.
Snyder R, Hedli CC. 1996. An overview of benzene metab-olism. Environ Health Perspect 104(Suppl 6):1165–1171.
Travis CC, Quillen JL, Arms AD. 1990. Pharmacokinetics ofbenzene. Toxicol Appl Pharmacol 102:400–420.
Turteltaub KW, Vogel JS, Frantz CE, Fultz E. 1993. Studieson DNA adduction with heterocyclic amines by acceleratormass spectrometry: A new technique for tracing isotope-labeled DNA adduction. In: Postlabeling Methods forDetection of DNA Adducts (Phillips DH, Castegnaro M,Bartsch H, eds), pp 293–300. International Agency forResearch on Cancer, Lyon, France.
Vogel JS. 1992. Rapid production of graphite without con-tamination for biological AMS. Radiocarbon 34:344–350.
Vogel JS, Turteltaub KW, Finkel R, Nelson DE. 1995. Accel-erator mass spectrometry: Isotope identification at atto-mole sensitivity. Anal Chem 67:353A–359A.
Wallace L. 1996. Environmental exposure to benzene: Anupdate. Environ Health Perspect 104(Suppl 6):1129–1136.
Witz G, Maniara WM, Mylavarapu VJ, Goldstein BD. 1990.Comparative metabolism of benzene and trans, trans-muconaldehyde to trans, trans-muconic acid in DBA/2and C57BL/6 mice. Biochem Pharmacol 40:1275-1280.
Witz G, Zhang Z, Goldstein BD. 1996. Reactive ring-openedaldehyde metabolites in benzene hematotoxicity. EnvironHealth Perspect 104(Suppl 6):1195–1199.
Yeowell-O'Connell K, Rothman N, Smith MT, Hayes RB, LiG, Waidyanatha S, Dosemeci M, Zhang L, Yin S, Titenko-Holland N, Rappaport SM. 1998. Hemoglobin and albuminadducts of benzene oxide among workers exposed to highlevels of benzene. Carcinogenesis 19:1565–1571.


Copies of these reports can be obtained from the Health Effects Institute and many are available at www.healtheffects.org.
37
Report Principal PublicationNumber Title Investigator Date
RELATED HEI PUBLICATIONS: AIR TOXICS
HEI Research Reports
Biomarkers in Czech Workers Exposed to 1,3-Butadiene: RJ Albertini 2003A Transitional Epidemiologic Study (in press)
Validation of Biomarkers in Humans Exposed to Benzene (in press) Q Qu 2003
108 Case-Cohort Study of Styrene Exposure and Ischemic GM Matanoski 2002Heart Disease
107 Emissions from Diesel and Gasoline EnginesMeasured in Highway Tunnels
Real-World Particulate Matter and Gaseous Emissions AW Gertler 2002from Motor Vehicles in a Highway Tunnel
Airborne Carbonyls from Motor Vehicle Emissions D Grosjean 2002in Two Highway Tunnels
103 Characterization and Mechanisms of Chromosomal Alterations DA Eastmond 2001Induced by Benzene in Mice and Humans
101 Respiratory Epithelial Penetration and Clearance of P Gerde 2001Particle-Borne Benzo[a]pyrene
92 1,3-Butadiene: Cancer, Mutations, and Adducts 2000
Part I: Carcinogenicity of 1,2,3,4-Diepoxybutane RF Henderson
Part II: Roles of Two Metabolites of 1,3-Butadiene in Mediating L RecioIts in Vivo Genotoxicity
Part III: In Vivo Mutation of the Endogenous hprt Genes of VE WalkerMice and Rats by 1,3-Butadiene and Its Metabolites
Part IV: Molecular Dosimetry of 1,3-Butadiene IA Blair
Part V: Hemoglobin Adducts as Biomarkers of 1,3-Butadiene JA Swenberg
Exposure and Metabolism
87 Development of Liquid Chromatography–Electrospray Ionization– AA Melikian 1999Tandem Mass Spectrometry Methods for Determination of Urinary Metabolites of Benzene in Humans
67 Development of Methods for Measuring Biological Markers of TR Fennell 1994Formaldehyde Exposure
Continued

RELATED HEI PUBLICATIONS: AIR TOXICS
38
Report Principal PublicationNumber Title Investigator Date
Copies of these reports can be obtained from the Health Effects Institute and many are available at www.healtheffects.org.
53 Use of Physical Chemistry and in Vivo Exposure to Investigate GJ Jakab 1992 the Toxicity of Formaldehyde Bound to Carbonaceous Particles in the Murine Lung
51 Effects of Formaldehyde on Xenotransplanted Human AJP Klein-Szanto 1992Respiratory Epithelium
49 Mechanisms of Aldehyde-Induced Bronchial Reactivity: Role of GD Leikauf 1992 Airway Epithelium
HEI Communications
6 Partnership to Examine Emerging Health Effects: 1999 EC/HEI Workshop on 1,3-Butadiene
2 Research Priorities for Mobile Air Toxics 1993
HEI Program Summaries
Research on Air Toxics 1999

H E A L T HE F F E C T SI N S T I T U T E
The Health Effects Institute, established
in 1980, is an independent and unbiased
source of information on the health
effects of motor vehicle emissions. HEI
studies all major pollutants, including
regulated pollutants (such as carbon
monoxide, ozone, nitrogen dioxide, and
particulate matter) and unregulated
pollutants (such as diesel engine exhaust,
methanol, and aldehydes). To date, HEI
has supported more than 200 projects at
institutions in North America and Europe
and has published over 130 research
reports.
Typically, HEI receives half its funds
from the US Environmental Protection
Agency and half from 28 manufacturers
and marketers of motor vehicles and
engines in the United States.
Occasionally, funds from other public
and private organizations either support
special projects or provide resources for
a portion of an HEI study. Regardless of
funding sources, HEI exercises complete
autonomy in setting its research
priorities and in reaching its
conclusions. An independent Board of
Directors governs HEI. The Institute’s
Health Research and Health Review
Committees serve complementary
scientific purposes and draw
distinguished scientists as members.
The results of HEI-funded studies are
made available as Research Reports,
which contain both the Investigators’
Report and the Review Committee’s
evaluation of the work’s scientific quality
and regulatory relevance.
Mark J Utell ChairProfessor of Medicine and Environmental Medicine, University of Rochester
Melvyn C BranchJoseph Negler Professor of Engineering, Mechanical EngineeringDepartment, University of Colorado
Kenneth L DemerjianProfessor and Director, Atmospheric Sciences Research Center,University at Albany, State University of New York
Peter B FarmerProfessor and Section Head, Medical Research Council Toxicology Unit,University of Leicester
Helmut GreimProfessor, Institute of Toxicology and Environmental Hygiene, TechnicalUniversity of Munich
Rogene HendersonSenior Scientist and Deputy Director, National EnvironmentalRespiratory Center, Lovelace Respiratory Research Institute
Stephen I RennardLarson Professor, Department of Internal Medicine, University ofNebraska Medical Center
Howard RocketteProfessor and Chair, Department of Biostatistics, Graduate School ofPublic Health, University of Pittsburgh
Jonathan M SametProfessor and Chairman, Department of Epidemiology, BloombergSchool of Public Health, Johns Hopkins University
Frank E SpeizerEdward H Kass Professor of Medicine, Channing Laboratory, HarvardMedical School and Department of Medicine, Brigham and Women’sHospital
Clarice R WeinbergChief, Biostatistics Branch, Environmental Diseases and MedicineProgram, National Institute of Environmental Health Sciences
BOARD OF DIRECTORS
HEALTH RESEARCH COMMITTEE
HEALTH REVIEW COMMITTEE
OFFICERS & STAFFDaniel S Greenbaum PresidentRobert M O’Keefe Vice PresidentJane Warren Director of ScienceSally Edwards Director of PublicationsJacqueline C Rutledge Director of Finance and AdministrationRichard M Cooper Corporate SecretaryCristina I Cann Staff ScientistAaron J Cohen Principal ScientistMaria G Costantini Principal Scientist
Debra A Kaden Senior ScientistGeoffrey H Sunshine Senior ScientistAnnemoon MM van Erp Staff ScientistTerésa Fasulo Senior Administrative AssistantGail A Hamblett Office and Contracts ManagerL Virgi Hepner Senior Science EditorJenny Lamont Science EditorFrancine Marmenout Senior Executive AssistantTeresina McGuire Accounting Assistant
Daniel C Tosteson ChairProfessor of Cell Biology, Dean Emeritus, Harvard Medical School
Ross AndersonProfessor and Head, Department of Public Health Sciences, St George’s Hospital Medical School, London University
John C Bailar IIIProfessor Emeritus, The University of Chicago
John R HoidalProfessor of Medicine and Chief of Pulmonary/Critical Medicine,University of Utah
Thomas W KenslerProfessor, Division of Toxicological Sciences, Department ofEnvironmental Sciences, Johns Hopkins University
Brian LeadererProfessor, Department of Epidemiology and Public Health, YaleUniversity School of Medicine
Thomas A LouisProfessor, Department of Biostatistics, Bloomberg School of PublicHealth, Johns Hopkins University
Edo D PellizzariVice President for Analytical and Chemical Sciences, ResearchTriangle Institute
Nancy ReidProfessor and Chair, Department of Statistics, University of Toronto
William N RomProfessor of Medicine and Environmental Medicine and Chief ofPulmonary and Critical Care Medicine, New York UniversityMedical Center
Sverre VedalProfessor, University of Colorado School of Medicine; Senior Faculty,National Jewish Medical and Research Center
Richard F Celeste ChairPresident, Colorado College
Donald Kennedy Vice ChairEditor-in-Chief, Science; President (Emeritus) and Bing Professor ofBiological Sciences, Stanford University
Archibald Cox Chair Emeritus Carl M Loeb University Professor (Emeritus), Harvard Law School
Purnell W ChoppinPresident Emeritus, Howard Hughes Medical Institute
Alice HuangSenior Councilor for External Relations, California Institute of Technology
Richard B StewartUniversity Professor, New York University School of Law, and Director,New York University Center on Environmental and Land Use Law
Robert M WhitePresident (Emeritus), National Academy of Engineering, and SeniorFellow, University Corporation for Atmospheric Research
fold line

H E A L T HE F F E C T SINSTITUT E
R E S E A R C H R E P O R T
Charlestown Navy Yard
120 Second Avenue
Boston MA 02129-4533 USA
+1-617-886-9330
www.healtheffects.org
H E A L T HE F F E C T SINSTITUT E
R E S E A R C HR E P O R T
Number 113February 2003
Number 113
February 2003
Benzene Metabolism in Rodents at Doses Relevant to Human Exposure from Urban AirKenneth W Turteltaub and Chitra Mani
Includes a Commentary by the Institute’s Health Review Committee
fold line