Embed Size (px)
Citation preview

165
Health and Productivity Gains from BetterIndoor Environments and TheirImplications for the U.S. Department ofEnergy
William J. Fisk1
Staff Scientist, Indoor Environment Department, Environmental Energy TechnologiesDivision, Lawrence Berkeley National Laboratory.
A substantial portion of the U.S. population suffers frequently from
communicable respiratory illnesses, allergy and asthma symptoms, and sick
building syndrome symptoms. We now have increasingly strong evidence that
changes in building design, operation, and maintenance can significantly reduce
these illnesses. Decreasing the prevalence or severity of these health effects
would lead to lower health care costs, reduced sick leave, and shorter periods of
illness-impaired work performance, resulting in annual economic benefits for the
U.S. in the tens of billions of dollars. Increasing the awareness of these potential
health and economic gains, combined with other factors, could help bring about
a shift in the way we design, construct, operate, and occupy buildings. The
current goal of providing marginally adequate indoor environments could be
replaced by the goal of providing indoor environments that maximize the health,
satisfaction, and performance of building occupants. Through research and
technology transfer, DOE and its contractors are well positioned to help
stimulate this shift in practice and, consequently, improve the health and
economic well-being of the U.S. population. Additionally, DOE’s energy-
efficiency interests would be best served by a program that prepares for the
potential shift, specifically by identifying and promoting the most energy-
efficient methods of improving the indoor environment. The associated research
and technology transfer topics of particular relevance to DOE are identified and
discussed.
________________ 1Note that the contents present the views of their authors, not necessarily those of the
Department of Energy, RAND, or any other organization with which the authors may be affiliated.

166
Introduction and Objective
Analyses by Fisk and Rosenfeld (1997) provided the first broad review in the U.S.
of the potential to improve both health and productivity through improvements
in indoor environments. Subsequent papers (Fisk 2000a, 2000b) have upgraded
and updated the analyses. This paper summarizes these prior analyses of the
potential improvements in health and associated economic benefits, incorporates
a few updates, and discusses the implications for the research and technology
transfer programs of the U.S. Department of Energy (DOE). The motivation for
this effort is to provide input for strategic planning underway by the DOE.
Unlike our prior analyses, this paper does not consider opportunities to directly
enhance work performance, through changes in the indoor environment, without
an associated improvement in health. The potential to directly enhance
productivity will be addressed at this conference in other papers.
Underlying the analyses presented in this paper are three pathways to health-
related economic benefits, as illustrated in Figure 1. In all cases, the starting point
is a change in building design, operation, and maintenance that improves indoor
environmental quality (IEQ) and enhances the health of the building’s occupants.
Economic benefits may result from: (1) reduced health care costs; (2) reduced sick
leave; and (3) a reduction in time when health effects diminish the performance
of workers while they are at work. The changes in building design, operation,
and maintenance undertaken to improve IEQ may increase or decrease building
energy use.
Methods
The basic approach was to review the relevant literature and analyze the key
studies showing linkages between indoor environmental factors and health
outcomes. Relevant papers were identified through computer-based literature
searches, reviews of conference proceedings, and discussions with researchers.
Communicable respiratory illnesses, allergies and asthma, and sick building
syndrome symptoms were identified as the three categories of health effects in
the analyses because their prevalences are influenced by IEQ and the affected
populations are very large. Published health studies were reviewed to determine
the strength of associations between building-related risk factors (e.g., low
ventilation rates) and health outcomes. Expertise in building science and
engineering provided information on the potential to diminish the risk factors.
With these inputs, plus judgments, the potential reductions in health effects were
estimated. The economic costs of these adverse health effects were estimated,
primarily by synthesizing and updating the results of previously

167
Changes in BuildingDesign, Operation andMaintenance
Improved IndoorEnvironmental Quality
Reduced AdverseHealth Effects
Increased or DecreasedBuilding Energy Use
Reduced Health Care
Reduced Sick Leave
Reduced Impairment ofPerformance at WorkFrom Adverse HealthEffects
EconomicBenefits
Figure 1—Pathways to Health and Economic Gains
published cost estimates. Prior economic estimates were updated to 1996 to
account for general inflation, health care inflation, and increases in population
(U.S. Department of Commerce 1997). Finally, the potential annual nationwide
health and productivity gains were computed by multiplying the population
affected and associated costs by the estimated potential percentage reduction in
health effects.
Even with the best of the information currently available, there is a high level of
uncertainty with these estimates of the health and associated economic gains
attainable from improvements in the indoor environment. In general, the largest
source of uncertainty is the degree to which health effects could be reduced
through practical changes in building design, operation, and maintenance. A
range of estimated gains are provided to reflect this source of uncertainty. For
sick building syndrome symptoms, the total costs to society are also uncertain;
however, the estimates provided here do not reflect this additional level of
uncertainty.
Improvements in the indoor environment depend on changes to building design,
operation, maintenance, use, or occupancy. This paper considers whether feasible
and practical changes could improve health; however, it does not claim that it
will be easy to stimulate the investments or changes in behaviors that are
necessary in order to improve IEQ. For example, this paper assumes that it is
feasible and practical to restrict indoor tobacco smoking, maintain pets outside of
the homes of pet allergic people, improve air filtration systems, prevent low
ventilation rates, and reduce water leakage from outdoors to indoors. Realization
of the “potential” health and productivity gains identified in this paper will

168
depend on changes in behavior and, in some cases, on financial investments in
better building design, operation and maintenance. The expected benefit-to-cost
ratios for these measures will often be large because the salaries and benefits of
workers typically dominate building energy, maintenance, and lease costs
(Woods 1989).
To make this article understandable to a broad audience, the use of potentially
unfamiliar statistical terminology has been minimized. For example, as
substitutes for the odds ratios or relative risks normally provided in the scientific
literature, this article provides estimates of the percentage increases and
decreases in outcomes (e.g., health effects) that are expected when building-
related risk factors (e.g., mold exposures) are present or absent. Measures of
statistical significance are included only within footnotes. The findings reported
in this paper would generally be considered to be statistically significant (e.g., the
probability that the findings are due to chance or coincidence is generally less
than 5%). Appendix 1 of Fisk (2000b) defines the odds ratio, the relative risk, the
term “adjusted”, and the means of estimating percentage changes in outcomes
from odds ratios or relative risks.
After estimating of potential health and productivity gains, this paper discusses
their implication for the US Department of Energy. This discussion is based on
the author’s knowledge of the interrelationships among building energy
efficiency, IEQ, and health and on his understanding of DOE’s mission and
capabilities.
Potential Health and Productivity Gains
For each of the three health categories, the subsequent text starts with a review of
the evidence for the linkage between indoor environmental conditions and the
health outcomes, follows with a discussion of the populations affected and
associated costs, and concludes with estimates of the potential health and
productivity gains.
Communicable Respiratory Illness
Evidence of Linkage. We first consider communicable respiratory illnesses
transmitted between people, such as influenza and common colds. Building
characteristics could change the number of aerosols containing virus or bacteria,
e.g., droplet nuclei from coughs and sneezes, that are inhaled, increase or
diminish the viability of the inhaled virus or bacteria, or modify the susceptibility
of occupants to infection. Consequently, the following building characteristics

169
may theoretically affect the prevalences of respiratory illnesses: efficiency or rate
of air filtration; rate of ventilation (i.e., supply of outside air per occupant);
amount of air recirculation in ventilation systems, separation between
individuals (dependent on occupant density and use of private work spaces); air
temperature and humidity (which affect the period of viability of infectious
aerosols); and mold levels since molds may increase susceptibility to illness. As
discussed in Fisk (2000a), infectious aerosols are thought or known to contribute
substantially to transmission of common colds (e.g., rhinovirus infections),
influenza, adenovirus infections, measles, and other common respiratory
illnesses. Disease transmission due to direct person-to-person contact or to
indirect contact via contaminated objects, may be largely unaffected by indoor
environmental and building characteristics.
In addition to the theoretical expectations, data are available from several field
studies that have examined the association of building characteristics with the
prevalence of respiratory illness among building occupants. Two studies were
performed in military barracks. A large multi-year investigation by the U.S.
Army (Brundage et al. 1988) determined that clinically-confirmed rates of acute
respiratory illness with fever were 50% higher among recruits housed in newer
barracks with closed windows, low rates of outside air supply, and extensive air
recirculation compared to recruits in older barracks with frequently open
windows, more outside air, and less recirculation.2 In another barracks study,
Langmuir et al. (1948) compared the rate of respiratory illness with fever among
recruits housed in barracks with ultraviolet lights (UV) that irradiated the indoor
air near the ceiling (a technology designed to kill infectious bioaerosols) to the
rate of respiratory illness among recruits in barracks without UV lights. For the
entire study period, the population housed in barracks with UV irradiated air
had 23% less respiratory illness.3
Several additional studies from a variety of building types provide relevant
information on this topic. Jaakkola et al. (1993), found that office workers with
one or more roommates were about 20% more likely to have more than two cases
of the common cold during the previous year than office workers with no
roommates.4 At an Antarctic station, the incidence of respiratory illness was
twice as high in the population housed in smaller (presumably more densely
populated) living units (Warshauer et al. 1989). In an older study of New York
schools (N.Y. State Commission on Ventilation 1923), there were 70% more
________________ 2Adjusted relative risk = 1.51, 95% confidence interval (CI) 1.46 to 1.56.3No test of statistical significance was performed.4Adjusted odds ratio = 1.35 (95% CI 1.00 - 1.82).

170
respiratory illnesses5 and 18% more absences from illness6 in fan-ventilated
classrooms compared to window-ventilated classrooms, despite a lower
occupant density in the fan-ventilated rooms. Unfortunately, ventilation rates
were not measured in the classrooms. Another study investigated symptoms
associated with infectious illness among 2598 combat troops stationed in Saudi
Arabia during the Gulf War (Richards et al. 1993). The study results suggest that
the type of housing (air-conditioned buildings, non-air-conditioned buildings,
open warehouses, and tents) influenced the prevalence of symptoms associated
with respiratory illness. Housing in air-conditioned buildings (ever versus never
housed in an air-conditioned building while in Saudi Arabia) was associated
with approximately a 37% greater prevalence of sore throat7 and a 19% greater
prevalence of cough.8
Although jails are not representative of other buildings because of severe
crowding and residents that are not representative of the general public, disease
transmission in jails is an important public health issue and indoor-
environmental factors that influence disease transmission in jails may also be
important, but less easily recognized, in other environments. Hoge et al. (1994)
studied an epidemic of pneumococcal disease in a Houston jail. There were
significantly fewer cases of disease among inmates with 7.4 m2 or more of space9
relative to inmates with less space. The disease attack rate was about 95% higher
in the types of jail cells with the highest carbon dioxide concentrations, i.e., the
lowest volume of outside air supply per person.10
Drinka et al. (1996) studied an outbreak of influenza in four nursing homes
located on a single campus. Influenza, confirmed by analyses of nasopharyngeal
and throat swab samples, was isolated in 2% of the residents of Building A
versus an average of 13% in the other three buildings11 (16%, 9%, and 14% in
Buildings B, C and D, respectively). After correction for the higher proportion of
respiratory illnesses that were not cultured in Building A, an estimated 3% of the
residents of Building A had influenza, a rate 76% lower than observed in the
other buildings.12 The total number of respiratory illnesses (i.e., influenza plus
other respiratory illnesses) per resident was also 50% lower in Building A.
________________ 5Difference more than three times probable error.6Difference greater than probable error.7Adjusted odds ratio =1.57 (95% CI 1.32-1.88).8Adjusted odds ratio = 1.33 (95% CI 1.01 - 1.46)9p=0.0310Relative risk = 1.95 (95% CI 1.08-3.48).11p < 0.001, Cochran-Mantel-Haenszel statistics12p < 0.001, chi-square

171
Vaccination rates and levels of nursing care did not differ among the buildings.
The authors suggested that architectural factors were the cause of the lower
infection rate in Building A. The ventilation system of Building A supplied 100%
outside air to the building (eliminating mechanical recirculation) while the
ventilation systems of the other buildings provided 30% or 70% recirculated air.
The Building A ventilation system also had additional air filters. Finally, the
public areas of Building A were larger (per resident), reducing crowding that
may facilitate disease transmission.
Milton et al. (2000) studied the association of the rate of outside air supply with
the rate of absence from work caused by illness in 3720 workers located in 40
buildings with a total of 110 independently-ventilated floors. While absence is
not synonymous with respiratory disease, a substantial proportion of short-term
absence from work caused by illness results from acute respiratory illness.
Ventilation rates were estimated based on ventilation system design, occupancy,
and selected end-of-day carbon-dioxide measurements, and buildings were
classified as moderate ventilation (~ 12 L s-1 per occupant) or high ventilation
(~24 L s-1 per occupant). The absence rate, controlling for age, gender, seniority,
crowding, and type of workspace was 35% lower in the high-ventilation
buildings.
The association of mold problems in buildings with the incidence of respiratory
infections has been investigated in a few studies. One study (Husman et al. 1993,
Husman 1996) compared the rates of acute respiratory infection in 158 residents
of apartments with verified mold problems to the rates of infection in 139
residents of apartments without mold problems. Approximately twice as many
residents of the moldy apartments reported at least one acute respiratory
infection during the previous year.13 A complex multi-stage study examined the
association of high mold exposures within day-care centers with common colds
as well as other health outcomes in children (Koskinen et al. 1995, 1997) with
inconclusive results (i.e., one comparison suggests that mold significantly
increased serious persistent respiratory infections while other comparisons found
small statistically insignificant decreases in common colds with higher mold
exposure.) The recent evidence that mold exposures may adversely affect
immune system function (Dales et al. 1998) is consistent with the findings of a
positive association between molds and respiratory infections.
Population Affected and Cost of Communicable Respiratory Illness. Virtually
everyone is affected by communicable respiratory illnesses. Averaging data from
________________ 13Relative risk is 2.2, 95% CI is 1.2 to 4.4, adjusted for age, sex, smoking and atopy

172
1992 through 1994, the civilian non-institutional population experienced 43.3
common colds and 25.7 cases of influenza per 100 population (US Department of
Commerce 1997), for a total of 0.69 illnesses per person per year.
The obvious costs of respiratory illness include health care expenses and the costs
of absence from work. Additionally, respiratory illnesses may cause a
performance decrement at work. In controlled experiments, Smith (1990) has
shown that viral respiratory illnesses, even sub-clinical infections, can adversely
affect performance on several computerized and paper-based tests that simulate
work activities. The decrement in performance can start before the onset of
symptoms and persist after symptoms are no longer evident.
Estimates of the productivity losses associated with respiratory illness are based
on periods of absence from work and restricted activity days as defined in the
National Health Interview Survey (U.S. Department of Health and Human
Services 1994). In the U.S., four common respiratory illnesses (common cold,
influenza, pneumonia, and bronchitis) cause about 176 million days lost from
work and an additional 121 million work days of substantially restricted activity
(Dixon 1985, adjusted for population gain). Assuming a 100% and 25% decrease
in productivity on lost-work and restricted-activity days, respectively, and a
$39,200 average annual compensation (U.S. Department of Commerce 1997), the
annual value of lost work is approximately $34 billion.14 The annual health care
costs for upper and lower respiratory tract infections total about $36 billion
(Dixon 1985, adjusted for population gain and health care inflation). Thus, the
total annual cost of respiratory infections is approximately $70 billion. Neglected
costs include the economic value of reduced housework and of absence from
school.
Potential Savings. Without being able to substantially change the building-
related factors that influence disease transmission, we cannot realize these health
care cost savings and productivity gains. A number of existing, relatively
practical building technologies, such as increased ventilation, reduced air
recirculation, improved filtration, ultraviolet disinfection of air, and reduced
space sharing (e.g., shared office), and reduced occupant density have the
theoretical potential of reducing inhalation exposures to infectious aerosols by
more than a factor of two.
The studies cited above suggest that changes in building characteristics and
ventilation could reduce indexes of respiratory illness by 15% (absence from
school) to 76% (influenza in nursing homes), with the strongest study (Brundage
________________ 14A similar estimate, $39 billion, is obtained based on the information in Garabaldi (1985)

173
et al. 1988) suggesting that a 33% reduction is possible. The amount of time spent
in a building should influence the probability of disease transmission within the
building. If efforts to reduce disease transmission were implemented primarily in
commercial and institutional buildings15 that people occupy approximately 25%
of the time, smaller reductions in respiratory illness would be expected in the
general population than indicated by the building-specific studies. To adjust the
reported decreases in respiratory illness for time spent in buildings, we estimated
the percentage of time that occupants spend in each type of building (100% of
time in jails and nursing home, 66% in barracks and housing, and 25% in offices
and schools) and assumed that the magnitude of the influence of a building
factor on the incidence of respiratory illness varies linearly with time spent in the
building. After this adjustment and neglecting the Gulf War study involving
some housing in tents and warehouses, the nine remaining studies cited above
yield 11 estimates of potential decreases in metrics for respiratory illness (some
studies had multiple outcomes such as influenza and total respiratory infections),
ranging from 9% to 41% with an average of 19% (see Figure 2). Considering only
the studies with explicit respiratory illness outcomes
Figure 2. Estimated decreases in respiratory illness from changes in building characteristics.
0
10
20
30
40
50
1
Ad
just
ed %
Dec
reas
e
HigherVent. Rate
inBarracks
NoShared Office
Larger Quarters
In AntarcticStation
Natural Vs.
Fan Vent.in
Classroom
Higher Vent. Rate
More spacein Nursing
Home
Higher Vent. Rate
in Jail
Higher Vent. Rate
inOffice
Respiratory IllnessAbsenceInfluenza
Resp. Illness Range, excluding outlier
UV Irridation
in Barracks
Apart-ments not
moldy
Figure 2—Estimated Decreases in Respiratory Illness from Changes in BuildingCharacteristics
________________ 15There are no technical barriers to implementation of similar measures in residences; however,
business owners will have a stronger financial incentive to take action than home owners.

174
(i.e., excluding the study with an absence outcome) results in nine estimates of
decreases in respiratory illness, adjusted for time in building, ranging from 9% to
41% with an average of 18%. The range is 9% to 20%, if the outlier value of 41%
(illness in schools) is excluded. This narrower range is adopted, i.e., 9% to 20%,
for the potential reduction in respiratory illness. With this estimate and 0.69 cases
of common colds and influenza per person per year), approximately, 16 to 37
million cases of common cold or influenza would be avoided each year in the US.
The corresponding range in the annual economic benefit is $6 billion to $14
billion.
Allergies and Asthma
Linkage. Symptoms of allergies and of asthma may be triggered by a number of
allergens in indoor air including those from house dust mites, pets, fungi, insects,
and pollens (Committee on Health Effects of Indoor Allergens 1993). Allergens
are considered a primary cause of the inflammation that underlies asthma
(Platts-Mills 1994). There is evidence (e.g., Arshad et al. 1992, Wahn et al. 1997)
that lower exposures to allergens during infancy or childhood can reduce the
sensitization to allergens. Asthma symptoms may also be evoked by irritating
chemicals, including environmental tobacco smoke (Evans et al. 1987). Viral
infections, which may be influenced by building factors, also appear to be
strongly linked to exacerbations of asthma, at least in school children. A recent
study of 108 children, age 9 to 11, found a strong association of viral infections
with asthma exacerbation (Johnston et al. 1995). Viral infections were detected in
80% to 85% of asthmatic children during periods of asthma exacerbation. During
periods without exacerbation of asthma symptoms, only 12% of the children had
detectable viral infections.16
Building factors most consistently and strongly associated with asthma and
allergic respiratory symptoms include moisture problems, indoor tobacco
smoking, house dust mites, molds, cats and dogs, and cockroach infestation
(Committee on the Assessment of Asthma and Indoor Air 1999, Committee on
Health Effects of Indoor Allergens 1993). Platts-Mills and Chapman (1987)
provide a detailed review of the substantial role of dust mites in allergic disease.
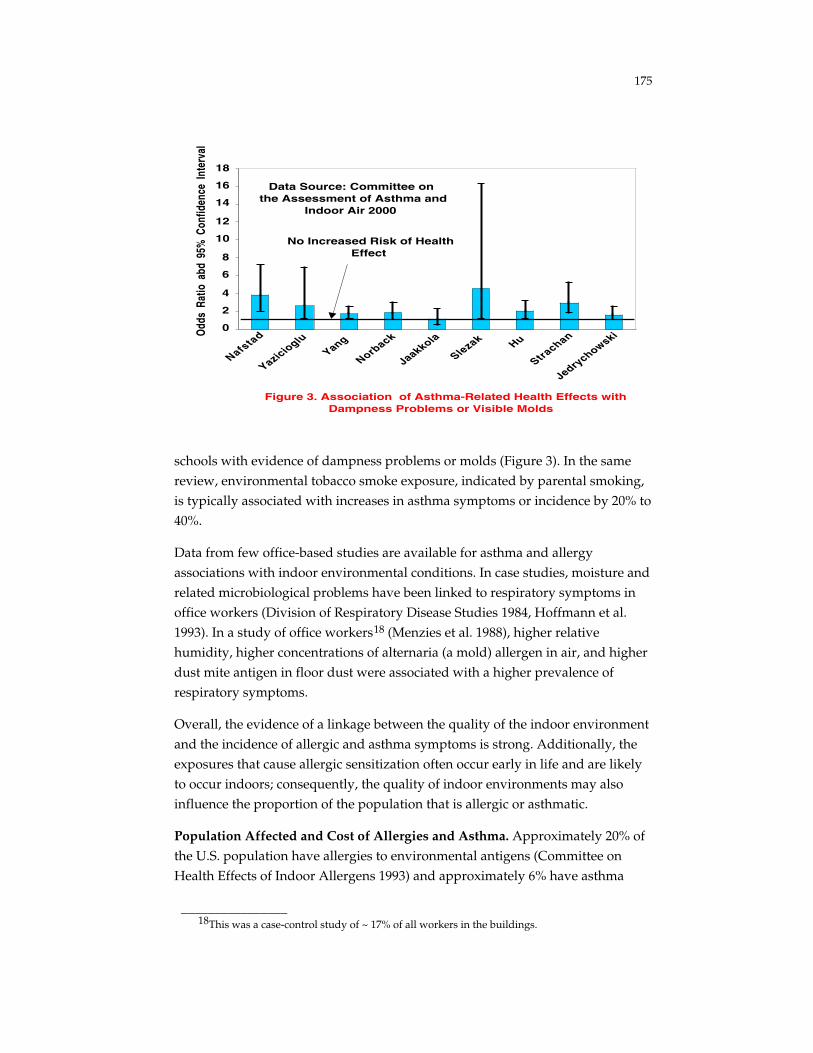
In a recent review of the association of asthma with indoor air quality by the
National Academy of Sciences (Committee on the Assessment of Asthma and
Indoor Air 1999), the prevalence of asthma or related respiratory symptoms is
increased by approximately a factor of two17 among occupants of homes or
________________ 16The difference between infection rates is statistically significant, p< 0.00117Neglecting one study in the review with a very high odds ratio of 16.
175
0
2
4
6
8
10
12
14
16
18
Nafsta
d
YaziciogluYang
Norback
Jaakkola
Slezak Hu
Strachan
JedrychowskiO
dds
Ratio
abd
95%
Con
fiden
ce I
nter
val
Figure 3. Association of Asthma-Related Health Effects with Dampness Problems or Visible Molds
No Increased Risk of Health Effect
Data Source: Committee on the Assessment of Asthma and
Indoor Air 2000
schools with evidence of dampness problems or molds (Figure 3). In the same
review, environmental tobacco smoke exposure, indicated by parental smoking,
is typically associated with increases in asthma symptoms or incidence by 20% to
40%.
Data from few office-based studies are available for asthma and allergy
associations with indoor environmental conditions. In case studies, moisture and
related microbiological problems have been linked to respiratory symptoms in
office workers (Division of Respiratory Disease Studies 1984, Hoffmann et al.
1993). In a study of office workers18 (Menzies et al. 1988), higher relative
humidity, higher concentrations of alternaria (a mold) allergen in air, and higher
dust mite antigen in floor dust were associated with a higher prevalence of
respiratory symptoms.
Overall, the evidence of a linkage between the quality of the indoor environment
and the incidence of allergic and asthma symptoms is strong. Additionally, the
exposures that cause allergic sensitization often occur early in life and are likely
to occur indoors; consequently, the quality of indoor environments may also
influence the proportion of the population that is allergic or asthmatic.
Population Affected and Cost of Allergies and Asthma. Approximately 20% of
the U.S. population have allergies to environmental antigens (Committee on
Health Effects of Indoor Allergens 1993) and approximately 6% have asthma
________________ 18This was a case-control study of ~ 17% of all workers in the buildings.

176
(Rappaport and Boodram 1998). Drawing upon five recent papers, Fisk (2000b)
has estimated that the annual costs for 1996 of allergies and asthma in the U.S. is
$15 billion. Approximately $10 billion are health care costs and the remaining
costs are indirect costs, for example the costs of lost work and school. A
significant portion of the costs of allergies and asthma reflect the burden of these
diseases in children.
Potential Savings from Changes in Building Factors. There are three general
approaches for reducing allergy and asthma symptoms via changes in buildings
and indoor environments. First, one can control the indoor sources of the agents
that cause symptoms (or that cause initial allergic sensitization). For example,
indoor tobacco smoking can be restricted to isolated separately-ventilated rooms,
or prohibited entirely. Pets can be maintained outside of the homes of
individuals that react to pet allergens. Perhaps even more broadly effective are
measures that reduce the growth of microorganisms indoors. Changes in
building design, construction, operation, and maintenance could reduce water
leaks and moisture problems and decrease indoor humidities (where humidities
are normally high), leading to a reduction in dust mites and molds in buildings.
Known reservoirs for allergens, such as carpets for dust mite allergen, can be
eliminated or modified. Improved cleaning of building interiors and HVAC
systems can also limit the growth or accumulation of allergens indoors. There are
no major technical obstacles to these measures.
The second general approach for reducing allergy and asthma symptoms is to
use air cleaning systems or increased ventilation to decrease the indoor airborne
concentrations of the relevant pollutants. Many of the relevant exposures are
airborne particles. Technologies are readily available for reducing indoor
concentrations of airborne particles generated indoors. Better filtration of the
outside air entering mechanically-ventilated buildings can also diminish the
entry of outdoor allergens into buildings. Filtration is likely to be most effective
for the smaller particles linked to allergies and asthma, such particles from
tobacco smoke. Allergens that are large particles, e.g., from dust mites, have high
gravitational settling velocities and are less effectively controlled by air filtration.
The influence of particle air cleaners on symptoms of allergies and asthma is
reviewed by Committee on the Assessment of Asthma and Indoor Air (1999), and
one more recent study is provided by van der Heide (1999). Many published
studies have important limitations such as small air cleaners, a small number of
subjects, or a focus on dust mite allergies which may be poorly controlled with
air cleaners due to the large size and high settling velocities of dust mite
allergens. Five of twelve studies involving subjects with perennial allergic
disease or asthma reported statistically significant improvements in symptoms or

177
airway hyperresponsiveness, or reduced use of medication when air cleaners
were used. In six of seven studies, seasonal allergic or asthma symptoms were
significantly reduced with air cleaner use. Subjects were blinded, i.e., unaware of
air cleaner operation, in only two of these studies involving seasonal symptoms;
thus, results could have been biased by the subjects’ expectations.
Because viral respiratory infections will often exacerbate asthma symptoms, a
third approach for reducing asthma symptoms is to modify buildings in a
manner that reduce viral respiratory infections among occupants, as discussed
previously.
With the available data, the magnitude of the potential reduction in allergy and
asthma symptoms is quite uncertain, but some reduction is clearly possible using
practical measures. The subsequent estimate is based on two considerations: 1)
the degree to which indoor allergen concentrations and concentrations of
irritating chemicals can be reduced, and 2) the strength of the reported
associations between symptoms and changeable building and IEQ factors.
Regarding the first consideration, significant reductions in allergy and asthma
symptoms would not be expected unless it was possible to substantially reduce
indoor concentrations of the associated allergens and irritants. From engineering
considerations, it is clear that concentrations of many allergens could be reduced
very substantially. Filtration systems, appropriately sized, should be capable of
reducing concentrations of the smaller airborne allergens by approximately 75%.
Some of the source control measures, such as elimination of water leaks, control
of indoor humidities, reduction or elimination of indoor smoking and pets, and
improved cleaning and maintenance are likely to result in much larger
reductions in the pollutants that contribute to allergies and asthma.
As discussed above, several cross-sectional or case-control studies have found
that building-related risk factors, such as moisture problems and mold or
environmental tobacco smoke, are associated with 20% to 100% increases in
allergy and asthma symptoms, implying that 16% to 50% reductions in
symptoms are possible by eliminating these risk factors. However, the complete
elimination of these risk factors is improbable. Assuming that it is feasible and
practical to reduce these risks by a factor of two, leads to a 8% to 25% estimate of
the potential reduction in allergy and asthma symptoms. With this estimate, the
annual savings would be ~$1 to ~$4 billion. Control measures can be targeted at
the homes or offices of susceptible individuals, reducing the societal cost.

178
Sick Building Syndrome Symptoms
Linkage. Characteristics of buildings and indoor environments have been linked
to the prevalence of acute building-related health symptoms, often called sick-
building syndrome (SBS) symptoms, experienced by building occupants. SBS
symptoms include irritation of eyes, nose, and skin, headache, fatigue, and
difficulty breathing. Although psychosocial factors such as job stress influence
SBS symptoms, many building factors are also known or suspected to influence
these symptoms including: type of ventilation system; rate of outside air
ventilation; level of chemical and microbiological pollution; and indoor
temperature and humidity (Mendell 1993; Sundell 1994; Menzies and Bourbeau
1997, Seppanen et al. 1999). In the review by Seppanen et al. (1999), 21 of 27
assessments meeting study quality criteria found lower ventilation rates to be
significantly associated with an increase in at least one SBS symptom (Figure 4).
Extrapolating from one of the largest studies, a 5 L s-1 increase in ventilation
rates in US office buildings would reduce the proportion of office workers with
frequent upper respiratory symptoms from 26% to 16%. For eye symptoms, the
corresponding reduction would be from 22% to 14%. In a set of problem
buildings studied by (Sieber et al. 1996), SBS symptoms were associated with
evidence of poorer ventilation system maintenance or cleanliness. For example,
debris inside the air intake and poor drainage from coil drain pans were
associated with a factor of three increase in lower respiratory symptoms.19 In the
same study, daily vacuuming was associated with a 50% decrease in lower
respiratory symptoms.20 In some, but not all, controlled experiments, SBS
symptoms have been reduced through practical changes in the environment such
as increased ventilation, decreased temperature, and improved cleaning of floors
and chairs (Mendell 1993, Menzies and Bourbeau 1997, Seppanen et al. 1999).
Therefore, SBS symptoms are clearly linked to features of buildings and indoor
environments.
Population Affected and Cost of SBS Symptoms. SBS symptoms are most
commonly reported by office workers and teachers that make up about 50% of
the total workforce (64 million workers21). In a modest fraction of buildings,
often referred to as “sick buildings”, symptoms become severe or widespread,
prompting investigations and remedial actions. The term “sick building
________________ 19For debris in air intake, relative risk = 3.1 and 95% CI = 1.8 to 5.2 For poor or no drainage from
drain pans, relative risk = 3.0 and 95% CI = 1.7 to 5.220Relative risk = 0.5, 95% CI = 0.3 to 0.921Based on statistical data of employed civilians by occupation (US Department of Commerce
1997), there are approximately 63 million civilian office workers plus teachers (49.6% of the civilianworkforce). Assuming that 50% of the 1.06 million active duty military personnel are also officeworkers, the total is approximately 63.5 million.

179
Author Yr.
Relative risk or (odds ratio)
Jaakkola 91a 1.1Gamble 86 1.8Gamble 86 2.4Groes 95 N/AJaakkola 91b 1.3Jaakkola 91b 1.2Jaakkola 91b 1.1Jaakkola 95 5.4-37Cochet 95 1.7 - 3.8Sundell 94 (2-3)Ruotsalainen 94 2.8Sundell 94a N/AStenberg 94 (1.87)Wu 96 N/AWu 96 N/ASundell 94a N/AJaakkola 91a 1.1Sundell 94b (1.8)Jaakkola 95 5.0-6.0Jaakkola 91a 1.1Nordström 95a (1.9-2.6)Jaakkola 94 0.35-0.46Jaakkola 91a N/AWyon 92 N/AMenzies 93a 0.8-1.2Wyon 92 N/AJaakkola 95 4.2-5.2
10 20 60 40
Ventilation RateLs-1per person
SB
PA
Figure 4. Ventilation rates per person and SBS symptoms. (Data source: Seppanen et al. 1999)
More symptoms at lowerventilation rate
More symptoms at higherventilation rate
No significant difference in symptoms
Figure 4—Ventilation Rates per Person and SBS Symptoms
syndrome” is widely used in reference to the health problems in these buildings.
However, the syndrome appears to be the visible portion of a broader
phenomenon. These same symptoms are experienced by a significant fraction of
workers in “normal” office buildings that have no history of widespread
complaints or investigations (e.g., Fisk et al. 1993; Nelson et al. 1995, Brightman
et al. 1997), although symptom prevalences vary widely among buildings. The
most representative data from US buildings, obtained in a 56-building survey
(that excluded buildings with prior SBS investigations) found that 23% of office
workers reported two or more frequent symptoms that improved when they
were away from the workplace. (HS Brightman, Harvard School of Public
Health, Personal Communication). Applying this percentage to the estimated

180
number of U.S. office workers and teachers (64 million), the number of workers
frequently affected by at least two SBS symptoms is 15 million.
SBS symptoms are a hindrance to work and are associated with absences from
work (Preller et al. 1990) and visits to doctors. When SBS symptoms are
particularly disruptive, investigations and maintenance may be required. There
are financial costs to support the investigations and considerable effort is
typically expended by building management staff, by health and safety
personnel and by building engineers. Responses to SBS have included costly
changes in the building, such as replacement of carpeting or removal of wall
coverings to remove molds, and changes in the building ventilation systems.
Some cases of SBS lead to protracted and expensive litigation. Moving employees
imposes additional costs and disruptions. Clearly, these responses to SBS impose
a significant societal cost, but information is not available to quantify this cost.
Calculations indicate that the costs of small decreases in productivity from SBS
symptoms are likely to dominate the total SBS cost. Limited information is
available in the literature that provides an indication of the influence of SBS
symptoms on worker productivity. In a New England Survey, described in EPA’s
1989 report to Congress (U.S. Environmental Protection Agency, 1989), the
average self-reported productivity loss due to poor indoor air quality was 3%.
Woods et al. (1987) completed a telephone survey of 600 U.S. office workers and
20% of the workers reported that their performance was hampered by indoor air
quality, but the study provided no indication of the magnitude of the
productivity decrement. In a study of 4373 office workers in the U.K. by Raw et
al. (1990), workers who reported higher numbers of SBS symptoms during the
past year also indicated that physical conditions at work had an adverse
influence on their productivity. Based on the data from this study, the average
self-reported productivity decrement for all workers, including those without
SBS symptoms, was about 4%.22 In an experimental study (Menzies et al. 1997b),
workers provided with individually-controlled ventilation systems reported
fewer SBS symptoms and also reported that indoor air quality at their
workstation improved productivity by 11% relative to a 4% decrease in
productivity for the control population of workers.23
________________ 22The data indicate a linear relationship between the number of SBS symptoms reported and the
self-reported influence of physical conditions on productivity. A unit increase in the number ofsymptoms (above two symptoms) was associated with approximately a 2% decrease in productivity.Approximately 50% of the workers reported that physical conditions caused a productivity decreaseof 10% or greater; 25% of workers reported a productivity decrease of 20% or more. Based on thereported distribution of productivity decrement (and productivity increase) caused by physicalconditions at work, the average self-reported productivity decrement is about 4%.
23P < 0.05 for the reduction in SBS symptoms and p < 0.001 for the self-reported change inproductivity.
181
In addition to these self-reported productivity decrements, measured data on the
relationship between SBS symptoms and worker performance are provided by
Nunes et al. (1993). Workers who reported any SBS symptoms took 7% longer to
respond in a computerized neurobehavioral test24 and error rates in this test
decreased non-significantly (the18% decrease was not significant). In a second
computerized neurobehavioral test, workers with symptoms had a 30% higher
error rate25 but response times were unchanged. Averaging the percent changes
from the four performance outcomes yields a 14% decrement in performance
among those with SBS symptoms. Multiplying by the estimated 23% of office
workers with 2 or more frequent symptoms yields a 3% average decrease in
performance.
Other objective findings were obtained in a study of 35 Norwegian classrooms.
Higher concentrations of carbon dioxide, which indicate a lower rate of
ventilation, were associated with increases in SBS symptoms and also with
poorer performance in a computerized test of reaction time26 (Myhrvold et al.
1996); however, the percentage change in performance was not specified.
Renovations of classrooms with initially poor indoor environments, relative to
classrooms without renovations, were associated with reduced SBS symptoms
and with improved performance by 5.3% in the reaction time tests27 (Myhrvold
and Olsen 1997).
Investigations by Wargocki et al. (1999, 2000, 2000a) and Lagercrantz et al. (2000)
provide additional objective evidence that SBS symptoms reduce productivity. In
a series of laboratory-based, blinded, controlled, randomized experimental
studies, the health symptoms and satisfaction with of IEQ of workers were
monitored along with the workers’ performance of work-related tasks including:
typing, addition, proof reading, and creative thinking. The laboratory had the
appearance of a normal office but enabled precise control of all environmental
parameters. Some experiments were performed with and without a pollutant
source (a 20 year old carpet) placed in the laboratory behind a visual screen.
Other experiments varied the outside air ventilation rate with the carpet present.
The study design controlled for the effects on performance of learning when
tasks were repeated. These studies have shown that removing the pollutant
________________ 24p < 0.00125p = 0.0726Correlation coefficient = 0.11 and P value = 0.009 for performance versus carbon dioxide.
Correlation coefficient = 0.20 and P value = 0.000 for performance versus a score for headache, heavyheaded, tiredness, difficulty concentrating, and unpleasant odor. Correlation coefficient = 0.11 and Pvalue = 0.008 for performance versus a score for throat irritation, nose irritation, runny nose, fit ofcoughing, short winded, runny eyes. Correlation coefficients are controlled for age.
27Measures of statistical significance are not included in paper.

182
source (carpet) or increasing ventilation rates with the pollutant source present
were associated with increased satisfaction with indoor air quality,28 decreases in
some SBS symptoms,29 and increases in performance in text typing, proof
reading, and addition.30 Considering these three work tasks, these studies
suggest that doubling of the ventilation rates increase overall performance by
1.9% (Wargocki et al. 2000a). Subsequent analyses indicated that the work
performance improved only when the intensity of SBS symptoms diminished
and identified a 7% improvement in the score on a creative thinking test31 as the
ventilation rates increased from 3 to 10 L s-1 per person (Wargocki et al. 2000b).
The estimate of the productivity loss from SBS symptoms must be based on the
limited information available. The self-reports discussed above suggest a
productivity decrease, averaged over the entire work population, of
approximately 4% due to poor indoor air quality and physical conditions at
work. Although SBS symptoms seem to be the most common work-related health
concern of office workers, some of this self-reported productivity decrement may
be a consequence of factors other than SBS symptoms. Also, dissatisfied workers
may have provided exaggerated estimates of productivity decreases. The
objective data reviewed above suggest that SBS symptoms are associated with
decrements on the order of 2% to 3%. Based on these data, we assume a
productivity decrease caused by SBS equal to 2%, recognizing that this estimate
is highly uncertain. This 2% estimate is the basis for subsequent economic
calculations.
SBS symptoms are primarily associated with office buildings and other non-
industrial indoor work places such as schools. According to Traynor et al. (1993),
office workers are responsible for approximately 50% of the US annual gross
national product. Statistical data on the occupations of the civilian labor force are
roughly consistent with this estimate (US Department of Commerce 1997), i.e.,
50% of workers have occupations that would normally be considered office work
or teaching. Since the gross domestic product (GDP) of the US in 1996 was $7.6
trillion (US Department of Commerce 1997), the GDP associated with office-type
work is approximately $3.8 trillion. Multiplying the number of office workers
and teachers (64 million) by the annual average compensation for all workers
________________ 28For pollutant source removal, P < 0.001 and P = 0.062 in two studies. For ventilation rate
increase P = 0.010. (Wargocki et al 2000a)29 For pollutant source removal p < 0.04 for severe headache in Wargocki (1999), p < 0.02 for
dizziness in Lagercrantz et al. (2000), p < 0.04 for difficulty in thinking clearly in Lagercrantz et al.(2000)
30P = 0.0002 for text typing, P = 0.056 for addition, P = 0.08 for proof reading (Wargocki et al2000a)
31P = 0.046

183
($39.2K) results in a roughly similar estimate of $2.5 trillion. Averaging these two
estimates yields $3.2 trillion. Based on the estimated 2% decrease in productivity
caused by SBS symptoms, the annual nationwide cost of SBS symptoms is on the
order of $60 billion.
Potential Savings from Changes in Building Factors. Because multiple factors,
including psychosocial factors, contribute to SBS symptoms, we cannot expect to
eliminate SBS symptoms and SBS-related costs by improving indoor
environments. However, strong evidence cited by Mendell (1993), Sundell (1994),
and Seppanen et al. (1999) of associations between SBS symptoms and building
environmental factors, together with our knowledge of methods to change
building and environmental conditions, indicate that SBS symptoms can be
reduced. As discussed, many SBS studies32 have found individual environmental
factors and building characteristics to be associated with changes of about 20% to
50% in the prevalence of individual SBS symptoms or groups of related
symptoms.33 A smaller number of studies have identified a few building-related
factors to be associated with an increase in symptoms by a factor of two or three
(e.g., Jaakkola and Miettinen 1995, Sieber et al. 1996). The review by Seppanen et
al. (1999) suggests that a 5 L s-1 per person increase in building ventilation rates
in the building stock would decrease prevalences of upper respiratory and eye
symptoms by ~35%.
In summary, the existing evidence suggests that substantial reductions in SBS
symptoms, on the order of 20% to 50%, should be possible through improvement
in individual indoor environmental conditions. Multiple indoor environmental
factors can be improved within the same building. For the estimate of cost
savings, we will assume that a 20% to 50% reduction in SBS symptoms is
practical in office buildings. The corresponding annual productivity increase is
on the order of $10 to $30 billion.
The Cost of Improving Indoor Environments
In two example calculations, Fisk (2000a) compares the cost of increasing
ventilation rates and increasing filter system efficiency in a large office building
________________ 32Most of these studies have taken place in buildings without unusual SBS problems, thus, we
assume that the reported changes in symptom prevalences with building factors apply for typicalbuildings.
33Adjusted odds ratios (ORs) for the association of symptom prevalences to individualenvironmental factors and building characteristics are frequently in the range of 1.2 to 1.6. Assuminga typical symptom prevalence of 20%, these ORs translate to risk ratios of approximately 1.2 to 1.5,suggesting that 20% to 50% reductions in prevalences of individual SBS symptoms or groups ofsymptoms should be possible through changes in single building or indoor environmental features.

184
with the productivity gains expected from reductions in health effects. The
estimated benefit-to-cost ratio is 14 and 8 for increased ventilation and better
filtration, respectively. Similar calculations by Milton (2000) result in a benefit-to-
cost ratios of three to six for increased ventilation, neglecting the benefits of
reduced health care costs which are about half of the total benefit. For many
other measures that should increase productivity, we would expect similarly
high benefit-to-cost ratios. For example, preventing or repairing roof leaks
should diminish the need for building repairs in addition to reducing allergy and
asthma symptoms. Also, some measures, such as excluding indoor tobacco
smoking or maintaining pets outdoors of the houses of asthmatics, have
negligible financial costs.
Other changes in buildings that have been associated with improved health may
have higher costs than increases in ventilation rate, improved filtration,
minimizing pollutant sources, and better maintenance. For example, reducing
occupant density by a factor of two would increase building construction or lease
costs by a factor of two and also considerably increase energy costs per occupant.
However, even such changes to buildings may be cost effective in some
situations because annual salaries plus benefits are approximately 50 times larger
than annualized construction costs or rent (Woods 1989).
Implications for the U.S. Department of Energy
A Scenario for High Performance Buildings
The enormous health cost resulting from our current way of designing,
constructing and operating buildings poses a major societal challenge. How can
we design and operate buildings that promote health and productivity? How can
we improve our homes, workplaces, schools, hospitals and other buildings so
they are positive environments for the users? Fanger (2000) has suggested a
possible paradigm shift. Over the next two decades, the current goal of providing
an adequate indoor environment may be replaced by the goal of providing
excellent indoor environments that maximize the health, satisfaction, and
performance of building occupants. Factors underlying such a paradigm shift
include the increasing affluence of the U.S. population, increased expectations for
excellent health, the desire to contain health care costs, and the rapidly increasing
evidence that IEQ affects health and productivity. Incorporation of IEQ issues in
the green building movement and the increasing use of environmental
consultants in new building projects may be the visible start of this paradigm
shift. If this shift occurs, there will be significant changes to the designs,

185
furnishings, operation, and maintenance of buildings with many potential
implications for building energy use
Role of the U.S. Department of Energy
A leadership role for the US Department of Energy is to undertake aggressive
research and technology transfer programs which: (1) help stimulate the
paradigm shift toward excellent indoor environments, thereby improving the
health and economic well-being of the US population and the competitiveness of
US businesses; and 2) guide the US response so that energy-efficient technologies
and practices are used whenever possible to provide excellent IEQ.
Such a role would be consistent with DOE’s mission as an agency that seeks to
benefit the U.S. public and U.S. businesses, in this case by developing a scientific
foundation for improvements in health and productivity. This role would also be
fully consistent with DOE’s energy-efficiency mission. Many technologies and
practices that reduce building energy use can also improve IEQ (IPMVP 1998,
Fisk and Rosenfeld 1998, Fisk 2000b); thus, health and productivity gains could
become a new stimulus for building energy efficiency. On the other hand, if DOE
largely ignores this issue, building designers and operators may choose energy-
inefficient methods of improving IEQ since the economic value of productivity
gains will often outweigh the energy costs.
This role for DOE is also consistent with DOE’s mission and history of advancing
science and technology in the buildings’ arena. In addition to a long-standing but
modest-size program of research on building ventilation, IEQ, and health, DOE
and its contractors have unique expertise and research capabilities related to
whole-building performance, HVAC, building envelopes, and building control
systems as well as established connections to buildings’ industries and
established programs for promoting improvements to buildings. The DOE
expertise in buildings, unmatched by that in any other governmental or non-
governmental organization, is essential for this area of research because
improvements in IEQ that enhance health depend on changes to the design,
operation, use, and maintenance of buildings.
DOE's activities in this field could also be a source of increased prosperity. There
is a growing realization that science and technology have been a major source of
prosperity in the US. Per unit of investment, a research and technology program
explicitly focused on IEQ, health, and productivity should be particularly
effective in enhancing prosperity,

186
Coordination with Other Agencies
An expanded research and technology transfer program in this area by DOE
would need to be coordinated with other governmental and private sector
programs. In the federal sector, EPA has IEQ programs, with a greater focus on
IEQ education and policy than on research, and NIOSH has a modest program,
primarily focusing on the relationship of the non-industrial work environment
with asthma. Additionally, NIH supports a much larger program of relevant
research, primarily basic health research on asthma, allergy, infectious disease
(but not the influence of buildings on infectious), and toxic effects of metals and
pesticides, typically without a strong contribution from the field of building
science. There are minimal overlaps between the programs of different federal
agencies. While all these agencies have an important role, their programs on IEQ
are modest and focused, and do not obviate the need for the DOE role with a
much larger focus on the building science and energy aspects of IEQ and their
relationship to health and productivity.
Nature of Knowledge Gaps
A recent review by the US General Accounting Office (GAO 1999) identified the
broad categories of IAQ-related knowledge gaps:
1. The identity and sources of pollutants;
2. Mechanisms by which people are exposed to them;
3. The health effects resulting from prolonged and intermittent exposures to
low-level concentrations of chemical and biological pollutants as well as
complex pollutant mixtures;
4. The most cost-effective strategies for reducing pollutant sources, exposures,
and consequent health effects.
The GAO review stresses the importance of multidisciplinary research
approaches to this research.
Research and Technology Transfer Needs of ParticularRelevance for DOE
Many features of building design, operation, and maintenance affect both
occupant health/productivity and building energy consumption. An expanded
DOE research and technology transfer program on the interrelationships among
buildings, health, productivity, and energy could focus most explicitly on these

187
building design, operation and maintenance features. In some instances, the
health benefits may be adequately documented and DOE-supported work could
emphasize technology development and demonstration. In other instances, DOE
is already supporting technology development or energy-performance
assessment, but additional work is necessary to quantify and demonstrate the
health benefits. The subsequent paragraphs describe these more specific research
and technology transfer needs. Considerable but not exclusive emphasis has been
placed on “win-win” opportunities for research and technology transfer that
could improve health and simultaneously save energy.
Building Ventilation
The evidence that increased rates of outside air ventilation generally lead to
improvements in perceived air quality, satisfaction with air quality, and health is
becoming very persuasive (Seppanen et al. 1999). Consequently, a shift toward
higher ventilation rates or more effective methods of controlling pollutant
exposures with ventilation seems inevitable. In general, higher ventilation rates
will increase building energy use and peak energy demands. [In U.S. residential
and service-sector buildings, an estimated 25% of energy use is for ventilation
(Orme 1998)]. However, DOE could help to shape the response to the emerging
information so that increased energy consumption and peak demands are
minimized. In addition, DOE can help to develop and promote use of some
HVAC technologies that simultaneously increase ventilation rates (or ventilation
efficiencies) and save energy. The following ventilation-related topics should be
of particular interest to DOE:
Minimum Ventilation Requirements
Existing data on the relationship of ventilation rates with health outcomes are
predominately from studies in moderate to large office buildings located in
temperate or cool climates (Seppanen et al. 1999) and most of these studies have
employed ventilation rates less than 10 L s-1 per person. There remain very
strong needs for studies: of the potential benefits of increasing ventilation rates
above 10 L s-1 per person; of ventilation requirements in humid climates; and of
ventilation requirements in other types of buildings such as small offices,
schools, retail buildings, and dwellings. In addition, since there appears to be no
threshold ventilation rate above which health outcomes do not improve
(Seppanen et al. 1999), future research needs to quantify the dose-response
relationships between ventilation rates and health outcomes so that the

188
magnitude of health benefits can be weighed against incremental energy and
equipment costs.
Better Measurement And Control of Ventilation Rates
In U.S. residences, rates of ventilation depend on the quantity of accidental
cracks and holes in building envelopes and ducts, on weather conditions, and on
window and exhaust fan use. Even in mechanically-ventilated commercial
buildings, HVAC systems very rarely include integral systems for measuring and
controlling minimum rates of outside air supply; thus, ventilation rates are
poorly controlled. The minimum ventilation rates measured in surveys of such
buildings often differ substantially from the minimum ventilation rates specified
in the applicable codes (Seppanen et al. 1999, Fisk et al. 1992, Lagus Applied
Technologies 1995, Teijonsalo et al. 1996, Turk et al. 1989). While the problems
associated with measurement and control of outside air ventilation rates have
been recognized for many years, there has been little progress toward
overcoming the problems. The large range of ventilation rates among buildings
suggests an opportunity to improve health and satisfaction with air quality by
increasing ventilation rates in buildings with low ventilation rates and
decreasing ventilation rates in buildings with high ventilation rates. Due to the
dose-response relationships between ventilation rates and health outcomes
(Seppanen et al. 1999), the average level of health symptoms and satisfaction
with air quality might be improved without increasing the total ventilation rate
of the building stock or increasing the associated energy use. Consequently,
research and technology transfer in needed on energy-efficient means of
measuring and controlling building ventilation rates.
Heat Recovery from Ventilation Air
Heat recovery systems that transfer heat (and sometimes moisture) between
ventilation exhaust airstreams and the incoming outside air can diminish the
energy required for ventilation. These systems are used commonly in northern
Europe but rarely in the regions of the US with similar climates. Increasing
ventilation rates will make heat recovery more cost effective. The technologies
required for heat recovery from exhaust ventilation air are already available, but
there is a need for demonstrations and guidelines on how and when to properly
implement and operate these systems. By quantifying and demonstrating the
benefits and costs of increased ventilation with heat recovery DOE can stimulate
the market for these strategies.

189
Displacement Ventilation
A ventilation technology used commonly in Europe, but very rarely in the U.S., is
displacement ventilation. This technology supplies air near the floor and
produces an upward airflow pattern that is more effective in limiting pollutant
exposures than an equivalent amount of well-mixed ventilation. Relative to
conventional mixing ventilation, displacement ventilation also removes warm air
more effectively. Displacement systems usually supply 100% outside air,
increasing ventilation rates relative to conventional systems that supply
predominately recirculated air; consequently, heat-recovery systems are often
combined with displacement ventilation for energy efficiency. Increased use of
displacement ventilation, where appropriate, could reduce health effects and, in
some cases, save energy. Research and technology transfer is needed to identify
and demonstrate the best opportunities for displacement ventilation.
Task Ventilation
Breathing rates are about 0.1 L s-1 per person, only 1% of the rate of the rate of
outside air supply to buildings (Fanger 2000). Task ventilation (sometimes called
personal ventilation) systems that supply outside air preferentially to the
breathing zone may be able to substantially reduce pollutant exposures and
improve health while maintaining or even reducing quantities of outside air.
These systems supply air near each occupant’s breathing zone. Moderate, 20% to
50%, exposure reductions have been demonstrated for some commercially-
available air supply technologies (Faulkner et al. 1993,1998); however,
optimization of the ventilation performance of these systems should bring even
larger reductions in exposure.
Evaporative Cooling
In some climates, direct or indirect evaporative cooling systems can replace
compressor-based cooling. These evaporative systems often supply 100% outside
air; consequently, they increase ventilation rates and will reduce indoor
concentrations of many indoor-generated pollutants. Energy savings relative to
compressor-based cooling can be large (e.g., 50%). Research and technology
transfer is needed to develop and optimize systems, quantify and demonstrate
IAQ and energy performance gains, and evaluate and address concerns about
maintenance and increased indoor humidities.

190
Moisture and Humidity Problems
Figure 3 illustrates the strong relationship of adverse respiratory and asthma
symptoms with moisture problems or the mold contamination commonly
associated with moisture problems. Many of these moisture problems are a
consequence of water leaks in building envelopes, particularly roofs. Other
moisture problems result from condensation of water vapor in walls or from
inadequate humidity control by HVAC systems in humid climates. The extent of
mold contamination resulting from a moisture problem appears to depend on the
selection of building materials. In addition to adversely affecting health, moisture
problems degrade the thermal performance of building envelopes, increase
energy use, and cause extensive materials damage requiring costly repairs. The
prevalence and severity of moisture problems are not fully understood, but a
very significant number of buildings are affected. For example, in the U.S.
Census data about 15% of houses report water leakage from outdoors
(Committee on the Assessment of Asthma and Indoor Air 2000). DOE has a
broad range of relevant expertise on building envelope performance (including
roofs and foundations), on air and moisture transport through envelopes, and on
HVAC performance. Expanded DOE research and technology transfer in this
field could help to improve health of the U.S. population, save energy, and
prevent costly damage to U.S. buildings.
Higher indoor humidities are associated with increased levels of house dust
mites (Chapter 8, Committee on the Assessment of Asthma and Indoor Air 2000).
The allergens from dust mites, arguably the most important of allergens for
humans, are associated with both the development and exacerbation of asthma
(Chapter 5, Committee on the Assessment of Asthma and Indoor Air 2000).
Particularly elevated indoor humidities, e.g., above 80% RH, can also facilitate
growth of molds indoors; however, the influence of more moderate humidities
on indoor mold growth is uncertain (Chapter 8, Committee on the Assessment of
Asthma and Indoor Air 2000). Again, there is a link to energy -- maintaining low
humidities during air conditioning increases energy use. Many associated
research questions remain. The relationships of humidity to dust mite and mold
contamination are still inadequately understood. Additionally, research,
technology development, and technology transfer efforts are needed to improve
humidity control by HVAC systems.
Efficient Air Filtration
Air filtration (or other particle air cleaning systems) show some promise in
moderately reducing allergy and asthma symptoms (Chapter 10, Committee on

191
the Assessment of Asthma and Indoor Air 1999) and portable air cleaners are
commonly used by allergic and asthmatic individuals. In addition, more efficient
air filtration systems in HVAC systems can dramatically reduce indoor
concentrations of fine particles from outdoors (Fisk et al. 2000c). There is
persuasive evidence that death rates, hospital admissions, and respiratory
symptoms increase with higher outdoor particle concentrations (EPA 1996). Since
people are indoors 90% of the time, the exposures to these outdoor particles
occur predominately indoors. Consequently, one would expect that the adverse
health effects associated with outdoor particles could be substantially reduced
through the use of more efficient filtration systems; however, these benefits have
not been demonstrated. Once again, there are strong ties with building energy
use. A 200 W portable air cleaner, operated continuously, would consume $170 of
electricity per year. More efficient filters in HVAC systems also tend to increase
fan energy requirements unless the filter is designed for a low airflow resistance.
Research is needed to determine when particle air cleaning is (or is not) effective
in improving health and to evaluate and demonstrate energy and cost effective
efficient methods of particle air cleaning.
Better Indoor Temperature Control
Despite the significant attention placed on thermal comfort by building
professionals, dissatisfaction with indoor thermal conditions is the most common
source of occupant complaints in office buildings (Federspiel 1998). In a large
field study (Schiller et al. 1988), less than 25% of the subjects were moderately
satisfied or very satisfied with air temperature. Also, 22% of the measured
thermal conditions in the winter, and almost 50% of measured thermal
conditions in the summer, were outside of the boundaries of the 1988 version of
the ASHRAE thermal comfort zone. Temperatures are also linked to health. In
several studies, increased air temperatures are associated with increases in SBS
symptoms (Mendell 1993, Mendell et al. 1999) and with reduced satisfaction with
indoor air quality (Fang et al. 1998a, 1998b). These findings indicate that greater
effort should be placed on HVAC system designs or controls that do a better job
than current systems of maintaining thermal conditions within the prescribed
comfort zones. Because indoor air temperatures influence occupant health
symptoms as well as comfort, the recommended range of indoor temperatures
may also need to be reexamined.

192
HVAC System Maintenance and Operation
Improved maintenance and operation of HVAC systems is another practice with
the potential to simultaneously save energy and improve IEQ and health. As
discussed above, Sieber et al. (1996) found that large increases in SBS symptom
prevalences were associated with evidence of poorer ventilation system
maintenance or cleanliness. Many common problems with HVAC system
performance (some discussed previously) are reported anecdotally and in
published literature. Examples of these problems include: fouling of cooling coils
and drain pans by deposited particles and microbial growth; large indoor air
temperature oscillations or temperatures maintained outside of the thermal
comfort envelope; dirty duct systems; deterioration of HVAC insulation; missing
air filters; poor control of indoor-outdoor or inter-room air pressure differences;
closed fire dampers; poor air distribution leading to excessive noise, drafts, and
thermal comfort problems; insufficient or excessive outside air ventilation;
improper damper operation (sometimes the damper linkage is disconnected from
the dampers or actuators); fans running backwards, not operating or operating at
the wrong times; sensors that are far out of calibration or disconnected; and
water leaks. Each of these problems may be due substantially to maintenance and
operation problems, although design and construction limitations and errors also
play an important role. Research and technology transfer programs are needed to
determine the prevalence and underlying causes of these problems and to
quantify and demonstrate the energy and IEQ benefits of problem prevention
and remediation.
Rethinking HVAC Architectures
Many of the HVAC system problems (mentioned in the previous text) which
increase energy use and deteriorate IEQ, have been recognized for many years;
however, progress in resolving these problems has been very limited.
Improvements to HVAC technologies tend to be incremental and to occur slowly.
In parallel with efforts to incrementally-improve existing HVAC architectures,
DOE, working in partnership with industry, could rethink HVAC from the
ground up with simultaneous goals of improved IEQ, energy efficiency, and
maintainability. Innovative HVAC architectures might include many of the
following features: outside air supply separated from the system used for
thermal conditioning; water used to transport energy around the building
(pumping water is more energy- and space-efficient than blowing air through
long ducts); individual control of thermal comfort at each workstation; outside
air supply near the breathing zone of each workstation with airflow controlled by
occupancy sensors; high efficiency particle filters; a modular design with easily

193
removable and replaceable components so that maintenance occurs in the shop;
and advanced sensors and controls. The initial step in this program would be to
assemble a highly multidisciplinary panel of experts who will define objectives
and work together on innovate HVAC architectures, unfettered by current
product designs.
Natural Ventilation
Numerous cross-sectional studies have compared the prevalence of SBS health
symptoms experienced in air-conditioned buildings with the prevalence
experienced in naturally-ventilated buildings. A large majority of these studies
have found that the occupants of the air-conditioned buildings report
significantly more symptoms after controlling for other factors (Seppanen and
Fisk 2000). The reason for these rather consistent findings is not known. One of
the hypothesized explanations is that HVAC systems are sometimes
contaminated, for example with microorganisms, deposited particles, and
residual oils from the manufacturing process, and become a source of indoor air
pollutants. These findings suggest that health symptoms might be reduced
through increased use of natural ventilation within commercial buildings located
in suitable climates. Naturally-ventilated buildings also tend to use less energy,
consequently, simultaneous energy savings and improvements in health may be
possible. However, additional research is needed before promoting a shift
toward natural ventilation. Within the U.S., there has been only one modest-size
study that compared symptom prevalences between naturally-ventilated and air-
conditioned buildings (Mendell et al. 1996). Also, until the cause of the increased
symptoms in naturally-ventilated buildings is known, it is premature to conclude
that symptom prevalences will be lower in new naturally-ventilated buildings.
Indoor Pollutant Source Reduction
The most effective method of controlling the indoor concentrations of many
indoor-generated air pollutants is to eliminate or reduce the sources present
indoors. Many of these sources depend on the design, furnishing, operation, and
maintenance of the building; for example, the selection of building and HVAC
materials and office equipment. Building ventilation requirements are
diminished when indoor pollutant source strengths are reduced; thus, indoor
pollutant source reduction can save energy. Research and technology transfer
efforts are needed to identify the sources that do and do-not affect health and to
develop and demonstrate methods of eliminating or reducing the important
sources.

194
Conclusions
1. There is relatively strong evidence that characteristics of buildings and
indoor environments significantly influence the occurrence of communicable
respiratory illness, allergy and asthma symptoms, sick building symptoms,
and worker productivity.
2. Theoretical and empirical evidence indicate that existing technologies and
procedures can improve indoor environments in a manner that increases
health and productivity. Estimates of the potential reductions in adverse
health effects are provided in Table 1.
3. Existing data and knowledge allows only crude estimates of the magnitudes
of productivity gains that may be obtained by providing better indoor
environments in a manner that improves health; however, the projected
gains are very large. For the U.S., the estimated potential annual savings plus
productivity gains, in 1996 dollars, are approximately $20 billion to $50
billion, with a breakdown as indicated in Table 1.
4. Over the next two decades, the current goal of providing an adequate indoor
environment may be replaced by an emphasis on providing excellent indoor
environments that maximize the health, satisfaction, and performance of
building occupants. Factors underlying such a paradigm shift would include
increasing affluence of the U.S. population, increased expectations for
excellent health, the desire to contain health care costs, and the rapidly
increasing evidence, summarized in this paper, that IEQ affects health and
productivity.
Table 1
Estimated Potential Productivity Gains fromImprovements in Indoor Environments
Source of
Productivity Gain
Potential Annual
Health Benefits
Potential U.S.
Annual Savings or
Productivity Gain
(1996 $ billion U.S.)
Reduced respiratory
illness
16 to 37 million avoided cases of
common cold or influenza
6–14
Reduced allergies
and asthma
8% to 25% decrease in symptoms within
53 million allergy sufferers and 16
million asthmatics
1–4
Reduced sick
building syndrome
symptoms
20% to 50% reduction in SBS health
symptoms experienced frequently at
work by ~15 million workers
10–30

195
5. A leadership role for the U.S. Department of Energy is to undertake
aggressive research and technology transfer programs which: (1) help
stimulate the shift towards excellent indoor environments, thereby
improving the health and economic well-being of the US population; and 2)
guide the U.S. response so that energy-efficient technologies and practices
are used whenever possible to provide excellent IEQ. Research and
technology transfer topics that provide opportunities for simultaneous
energy savings and improvements in health include the following: building
ventilation; evaporative cooling; reducing moisture and humidity problems;
efficient air filtration; better indoor temperature control; natural ventilation;
HVAC system maintenance and operation; rethinking HVAC architectures;
and indoor pollutant source control.
Acknowledgments
The author thanks Dr. Richard Diamond and Dr. Ashok Gadgil for their very
helpful review of a draft of this document.
This work was supported by the RAND Corporation and by the Assistant
Secretary for Energy Efficiency and Renewable Energy, Office of Building
Technology, State, and Community Programs, Office of Building Systems of the
U.S. Department of Energy (DOE) under contract No. DE-AC03-76SF00098.
References
Antonicelli L, Bilo MB, Pucci S, Schou C, Bonifazi F. 1991. Efficacy of an air-
cleaning device equipped with a high efficiency particulate air filter in house
dust mite respiratory allergy. Allergy 46:594-600.
Arshad SH, Matthews S, Gant C, Hide DW. 1992. Effect of allergen avoidance on
development of allergic disorders in infancy. The Lancet 339(8809): 1493-1497.
Brightman HS, Womble SE, Girman JR, Sieber WK, McCarthy JF, Spengler JD.
1997. Preliminary comparison of questionnaire data from two IAQ studies:
occupant and workspace characteristics of randomly selected buildings and
complaint buildings. Proc. Healthy Buildings / IAQ 1997. 2:453-458. HealthyBuildings / IAQ 1997, Washington DC.
Brundage JF, Scott RM, Lednar WM, Smith DW, Miller RN. 1988. Building-
associated risk of febrile acute respiratory diseases in army trainees. J.American Medical Association 259(14):2108-2112.
Committee on the Assessment of Asthma and Indoor Air (1999) Clearing the air:asthma and indoor air exposures. National Academies of Sciences, Institute of
Medicine, National Academy Press, Washington DC.

196
Committee on Health Effects of Indoor Allergens 1993. Indoor allergens: assessingand controlling adverse health effects. Pope AM, Patterson R, Burge, H, editors.
National Academy Press, Washington, DC.
Dales R, Miller D, White J, Dulberg C, Lazarovits AI. 1998. Influence of
residential fungal contamination on peripheral blood lymphocyte populations
in children. Archives of Environmental Health 53(3): 190-195.
Division of Respiratory Disease Studies, National Institute for Occupational
Safety and Health. 1984. Outbreaks of respiratory illness among employees in largeoffice buildings. Tennessee, District of Columbia. MMWR 33(36): 506-513.
Dixon RE. 1985. Economic costs of respiratory tract infections in the United
States. American Journal of Medicine 78(6B): 45-51.
Drinka PJ, Krause P, Schilling M, Miller BA, Shut P, Gravenstein S. 1996. Report
of an influenza-A outbreak: nursing home architecture and influenza-A attack
rates. J. American Geriatrics Society 44: 910-913.
Energy Information Administration 1998. A look at commercial buildings in 1995:characteristics, energy consumption, and energy expenditures. DOE/EIA-0625(95),
Energy Information Administration, U.S. Department of Energy.
EPA (1996) Air quality criteria for particulate matter, volume III of III, U.SEnvironmental Protection Agency, EPA/600/AP-95/001c.
Evans D, Levison MJ, Feldman CH, Clark WM, Wasilewski Y, Levin B, Mellins
RB. 1987. The impact of passive smoking on emergency room visits of urban
children with asthma. American Review of Respiratory Disease 135(3): 567-572.
Fang, L.; Clausen, G.; Fanger, P.O. 1998a. Impact of temperature and humidity on
the perception of indoor air quality. Indoor Air 8(2): 80-90.
Fang, L.; Clausen, G.; Fanger, P.O. 1998b. Impact of temperature and humidity
on perception of indoor air quality during immediate and longer whole body
exposures. Indoor Air 8(4): 276-284.
Fanger PO (2000) Indoor air quality in the 21st century: search for excellence.
Indoor Air 10(2): 68-73.
Faulkner, D., Fisk, W.J., and Sullivan, D.P. (1993) "Indoor Airflow and Pollutant
Removal in a Room With Floor-Based Task Ventilation: Results of Additional
Experiments", Building and Environment 30(3), pp. 323-332
Faulkner, D, Fisk, W.J., Sullivan, D, and Wyon, D.P. (1998) Ventilation
Efficiencies of Desk-Mounted Task/Ambient Conditioning Systems, Indoor Air9: 273-281.
Federspiel, C.C. (1998) “Statistical analysis of unsolicited thermal sensation
complaints in commercial buildings”, ASHRAE Transactions 104(1): 912-923
Fisk WJ, Mendell, MJ, Daisey, JM, Faulkner D, Hodgson AT, Nematollahi M,
Macher JM. 1993. Phase 1 of the California health building study: a summary.
Indoor Air 3: 246-254.

197
Fisk WJ, Rosenfeld, AH. 1997. Estimates of improved productivity and health
from better indoor environments. Indoor Air 7: 158-172.
Fisk, W.J. and Rosenfeld, A.H. (1998) “Potential nationwide improvements in
productivity and health from better indoor environments”, Proceedings of the
ACEEE 1998 Summer Study on Energy Efficiency in Buildings, “Energy
Efficiency in a Competitive Environment”, August 23-28, Asilomar, CA, pp.
8.85-8.97
Fisk WJ. 2000a Estimates of potential nationwide productivity and health benefits
from better indoor environments: an update, Indoor Air Quality Handbook., eds.
J. Spengler, J.M. Samet, and J.F. McCarthy, McGraw Hill. In press.
Fisk, W.J. 2000b Health and productivity gains from better indoor environments
and their relationship with building energy efficiency. Annual Review of
Energy and the Environment 25(1):1-30. In press
Fisk, W.J., Faulkner D., Sullivan, D., and Mendell, M.J. 2000c Particle
concentrations and sizes with normal and high efficiency filtration in a sealed
air-conditioned office building, Aerosol Science and Technology 32: 527-544,
Garibaldi RA. 1985. Epidemiology of community-acquired respiratory tract
infections in adults, incidence, etiology, and impact. American Journal ofMedicine 78(6B): 32-37.
GAO 1999. Indoor pollution: status of federal research activities. US General
Accounting Office, GAO/RCED-99-254, Washington, DC.
Harving H, Hansen LG, Korsgaard J, Nielsen PA, Olsen OF, Romer J, Svendsen
UG, Osterballe O. 1991. House dust mite allergy and anti-mite measures in the
indoor environment. Allergy 46 supplement 11: 33-38.
Hoffmann R.E., Wood R.C., Kreiss, K. 1993. Building-related asthma in Denver
office workers. American Journal of Public Health 83: 89-93.
Hoge CW, Reichler MR, Dominguez EA, Bremer JC, Mastro TD, Hendricks KA,
Mushev DM, Elliot JA, Fackman RR, Breiman RF. 1994. An Epidemic of
pneumococcal disease in an overcrowded, inadequately ventilated jail. NewEngland Journal of Medicine 331(10): 643-648.
Husman T. 1996. Health effects of indoor-air microorganisms. Scandinavian J. ofWorker Environmental Health 22: 5-13.
Husman T, Koskinen O, Hyvarinen A, Reponen T, Ruuskanen J, Nevalainen A.
1993. Respiratory symptoms and infections among residents in dwellings with
moisture problems or mold growth. Proc. of Indoor Air 1993, The 6th
International Conference on Indoor Air Quality and Climate. 1: 171 –174.
Indoor Air 1993, Helsinki.
IPMVP IEQ Committee. 1999. Indoor environmental quality: introduction,
linkage to energy efficiency, and measurement and verification: Appendix to
the 1999 version of the International Performance Measurement and
Verification Protocol, http://www.ipmvp.org/info/download.html

198
Jaakkola JJK, Heinonen OP. 1993. Shared office space and the risk of the common
cold. European Journal of Epidemiology 11(2): 213-216.
Jaakkola JJK, Miettinen P. 1995. Ventilation rate in office buildings and sick
building syndrome. Occupational and Environmental Medicine 52: 709-714.
Johnston SL, Pattermore PK, Sanderson G, Smith S, Lampe F, Josephs L,
Symington P, O’Toole S, Myint SH, Tyrrell DA, Holgate ST. 1995. Community
study of role of viral infections in exacerbations of asthma in 9-11 year old
children. British Medical Journal 310: 1225-1229.
Knobeloch L, Anderson H, Morgan J, Nashold R (1997) Heat related illness and
death, Wisconsin 1995. Wisconsin Medical Journal 96(5): 33-38.
Koskinen OM, Husman TM, Hyvarinen AM, Reponen TA, Ruuskanen,
Nevalainen AI. (1997). Two moldy day care centers: a follow-up study of
respiratory symptoms and infections. Indoor Air 7(4): 262-268.
Koskinen O, Husman T, Hyvarinen A, Reponen T, Ruuskanen, Nevalainen A.
1995. Respiratory symptoms and infections among children in a day-care
center with a mold problem. Indoor Air 5(1): 3-9.
Kroner WM, Stark-Martin JA. 1992. Environmentally responsive workstations andoffice worker productivity. Ed. H Levin, Proc. Indoor Environment and
Productivity, June 23-26, Baltimore, MD, ASHRAE, Atlanta.
Lagus Applied Technologies 1995. Air change rates in non-residential buildings inCalifornia, Report P400-91-034BCN, California Energy Commission,
Sacramento, CA.
Langmuir AD, Jarrett ET, Hollaenber A. 1948. Studies of the control of acute
respiratory diseases among naval recruits, III. The epidemiological pattern and
the effect of ultra-violet radiation during the winter of 1946-1947. AmericanJournal of Hygiene 48: 240-251.
Lagercrantz L, Wistrand M, Willen U, Wargocki P, Witterseh T, Sundell J (2000)
Negative impact of air pollution on productivity: previous Danish findings
repeated in a new Swedish test room. Proceedings of Healthy Buildings 2000,
vol. 1., pp. 653-658. August 6-10, Helsinki. SIY Indoor Air Information, Oy,
Helsinki.
Mendell MJ. 1993. Non-specific symptoms in office workers: a review and
summary of the epidemiologic literature. Indoor Air 3: 227-236.
Mendell M.J., Fisk, W.J., Deddens, J.A., Seavey, W.G., Smith, A.H., Smith, D.F.,
Hodgson, A.T., Daisey J.M., Goldman, L. R. (1996) “Elevated Symptom
Prevalence Associated with Ventilation Type in Office Buildings: Findings
from the California Healthy Building Study-Phase 1”, Epidemiology 7(6): 583-
589
Mendell, MJ, Fisk, W.J, Dong, M.X., Petersen, M., Hines, C.J., Faulkner, D.,
Deddens, J.A., Ruder, A.M., Sullivan, D., and Boeniger, M.F. (1999) “Enhanced
particle filtration in a non-problem office environment: preliminary results
from a double-blind crossover intervention”, American Journal of IndustrialMedicine 1: 55-57.

199
Menzies D, Bourbeau J. 1997. Building-related illness. New England Journal ofMedicine 337(21): 1524-1531.
Menzies D, Comtois P, Pasztor J, Nunes F, Hanlet JA. 1998. Aeroallergens and
work-related respiratory symptoms among office workers. J. Allergy andClinical Immunology 101(1): 38-44.
Menzies D, Pasztor J, Nunes F, Leduc J, Chan CH. 1997b. Effect of a new
ventilation system on health and well being of office workers. Archives of
Environmental Health 52(5): 360-367.
Milton DK, Glencross PM, Walters MD 2000. Risk of sick leave associated with
outdoor ventilation level, humidification, and building related complaints.
Harvard School of Public Health, Boston. Submitted to Indoor Air.
Myhrvold AN, Olsen E. 1997. Pupils health and performance due to renovation
of schools. Proc. Healthy Buildings / IAQ 1997. 1: 81-86. Healthy Buildings /
IAQ 1997. Washington, DC.
Myhrvold AN, Olsen E, Lauridsen O. 1996. Indoor environment in schools –
pupils health and performance in regard to CO2 concentrations. Proc. IndoorAir 1996, The 7th International Conference on Indoor Air Quality and Climate. 4:
369-374. SEEC Ishibashi Inc., Japan.
Nelson NA, Kaufman JD, Burt J, Karr C. 1995. Health symptoms and the work
environment in four nonproblem United States office buildings. Scand. J. WorkEnviron. Health 21(1): 51-59
New York State Commission on Ventilation. 1923. The prevalence of respiratory
diseases among children in schoolrooms ventilated by various methods.
Chapter XXIII In Ventilation: Report of the New York State Commission onVentilation. New York: E.P Dutton & Co.
Nunes F, Menzies R, Tamblyn RM, Boehm E, Letz R. 1993. The effect of varying
level of outside air supply on neurobehavioral performance function during a
study of sick building syndrome. Proc. Indoor Air 1993, The 6th International
Conference on Indoor Air Quality and Climate. 1: 53-58. Indoor Air 1993,
Helsinki.
Orme, M. (1998). Energy impact of ventilation, Technical Note 49, International
Energy Agency – Air Infiltration and Ventilation Centre, Coventry, Great
Britain.
Platts-Mills TA. 1994. How environment affects patients with allergic disease:
indoor allergens and asthma. Annals of Allergy. 72: 381-384.
Platts-Mills TA, Chapman MD. 1987. Dust mites: immunology, allergic disease,
and environmental control. J. of Allergy and Clinical Immunology. 80(6): 755-772.
Preller L, Zweers T, Brunekreef B, Boleij JSM. 1990. Sick leave due to work-
related complaints among workers in the Netherlands. Proc. Indoor Air 90, theFifth International Conference on Indoor Air Quality and Climate. 1: 227-230.
International Conference on IAQ and Climate, Ottawa.

200
Rappaport S, Boodram B. 1998. Forecasted state-specific estimates of self-
reported asthma prevalence – United States, 1998. MMWR 47(47): 1022-1025.
Raw GJ, Roys MS, Leaman A. 1990. Further finding from the office environment
survey: productivity. Proc. of Indoor Air 90, the Fifth International Conference onIndoor Air Quality and Climate. 1: 231-236, International Conference on IAQ andClimate, Ottawa.
Richards AL, Hyams KC, Watts DM, Rozmajzl PJ, Woody JN, Merrell BR. 1993.
Respiratory disease among military personnel in Saudi Arabia during
Operation Desert Shield. American J. Public Health 83(9): 1326-1329.
Schiller, G., E. Arens, F. Bauman, C. Benton, M. Fountain, and T. Doherty. (1988).
"A field study of thermal environments and comfort in office buildings."
ASHRAE Transactions, Vol. 94(2): 280-308.
Semenza JC, Rubin CH, Falter KH, Selanikio JD, Flanders WD, Howe HL Wlhelm
JL (1996) Heat-related deaths during the July 1995 heat wave in Chicago. NewEngland Journal of Medicine 335(2): 84-90.
Seppanen OA, Fisk WJ, Mendell MJ. 1999. Association of ventilation rates and
CO2-concentrations with health and other responses in commercial and
institutional buildings. Indoor Air 9: 226-252.
Seppanen OA and Fisk WJ 2000. Association of HVAC system type, components,
and operation with sick building syndrome in office buildings. In preparation.
Sieber WK, Petersen MR, Staynor LT, Malkin R, Mendell MJ, Wallingford KM,
Wilcox TG, Crandall MS, Reed L. 1996. Associations between environmental
factors and health conditions. Proc. Indoor Air’ 96. 2: 901-906. Japan: SEEC
Ishibashi, Inc.
Smith AP. 1990. Respiratory virus infections and performance. PhilosophicalTransactions of the Royal Society of London Series B, Biological Sciences.
327(N1241): 519-528.
Sundell J. 1994. On the association between building ventilation characteristics,
some indoor environmental exposures, some allergic manifestations, and
subjective symptom reports. Indoor Air: Supplement 2/94.
Teijonsalo, J. and Jaakkola, J.J. and Seppänen, O. (1996) “The Helsinki office
environmental study: Air change in mechanically ventilated buildings”, IndoorAir, 6(2): 111-117.
Traynor GW, Talbott JM, Moses DO. 1993. The role of the U.S. Department of
Energy in indoor air quality and building ventilation policy development.
Proc. Indoor Air'93, The 6th International Conference on Indoor Air Quality
and Climate. 3: 595-600. Indoor Air 93, Helsinki.
Turk BH, Grimsrud DT, Brown JT, Geisling-Sobotka KL, Harrison J, Prill RJ.
1989. Commercial Building Ventilation Rates and Particle Concentrations.
ASHRAE Transactions 95(1):422-433
U.S. Department of Commerce 1997. Statistical Abstract of the United States 1997.

201
U.S. Environmental Protection Agency 1989. Report to Congress on indoor airquality, volume II: assessment and control of indoor air pollution. U.S.
Environmental Protection Agency, Office of Air and Radiation, EPA/400/1-
89/001C.
U.S Department of Health and Human Services 1994. Vital and health statistics,current estimates from the national health interview survey, series 10: data from theNational Health Survey No. 189, DHHS Publication No. 94-1517.
van der Heide S, van Aalderen WMC, Kauffman HF, Dubois AEJ, de Monchy
JGR 1999. Clinical effects of air cleaners in homes of asthmatic children
sensitized to pet allergens. Journal of Clinical Immunology 104(2): 447-451.
Wahn U, Lau S, Bergmann R, Kulig M, Forster J, Bergmann K, Bauer CP,
Guggenmoos-Holzmann I. 1997. Indoor allergen exposure is a risk factor for
sensitization during the first three years of life. J. Allergy and ClinicalImmunology 99(6) part 1: 763-769.
Warshauer DM, Dick EC, Mandel AD, and others. 1989. Rhinovirus infections in
an isolated Antarctic station, transmission of the viruses and susceptibility of
the population. American Journal of Epidemiology 129(2):319-340.
Wargocki P. 1998. Human perception, productivity, and symptoms related to indoor airquality. Ph.D. Thesis, ET-Ph.D. 98-03, Centre for Indoor Environment and
Energy, Technical University of Denmark, 244 pp.
Wargocki P, Wyon DP, Sundell J, Clausen G, and Fanger PO (2000) The effects of
outdoor air supply rate in an office on perceived air quality, sick building
syndrome (SBS) symptoms, and productivity. Indoor Air (in press).
Wargocki P, Wyon DP, and Fanger PO (2000a) Productivity is affected by air
quality in offices. Proceeding of Healthy Buildings 2000, vol. 1, pp. 635-640.
August 6-10, Helsinki. SIY Indoor Air Information, Oy, Helsinki.
Wargocki P, Wyon DP, and Fanger PO (2000b) Pollution source control and
ventilation improve health, comfort, and productivity. International Centre for
Indoor Environment and Energy, Danish Technical University. Submitted for
presentation at Cold Climate HVAC 2000, November 1-3, 2000, Sapporo,
Japan.
Woods JE. 1989. Cost avoidance and productivity in owning and operating
buildings. Occupational Medicine 4 (4): 753-770.
Woods JE, Drewry GM, Morey PR. 1987. Office worker perceptions of indoor air
quality effects on discomfort and performance. Proc. Indoor Air 87, the 4thInternational Conference on Indoor Air Quality and Climate. 2: 464-468. Institute
for Water, Soil, and Air Hygiene, Berlin.