Embed Size (px)
Citation preview
HEAD OFFICE
ADDRESS: No.166, Sec. 2, Minsheng East Road, Taipei, Taiwan
PHONE: (886) 2-2505-7766
WEBSITE: www.evergreen-marine.com
STOCK DEPARTMENT
ADDRESS: 2F, No.166, Sec. 2, Minsheng East Road, Taipei, Taiwan
PHONE: (886) 2-2500-1668
WEBSITE: stock.evergreen.com.tw
SPOKESPERSON
NAME: Mong-Jye Lee
TITLE: President
PHONE: (886) 2-2505-7766
E-Mail: [email protected]
VICE-SPOKESPERSON
NAME: Kuang-Hui Wu
TITLE: Executive Vice President
PHONE: (886) 2-2505-7766
E-Mail: [email protected]
AUDIT
AUDITOR: Pricewaterhouse Coopers
ADDRESS: 27th Floor 333 Keelung Road, Sec. 1 Taipei 110, Taiwan
PHONE: (886) 2-2729-6666
WEBSITE: www.pwc.com/tw
EMC GDRs
SYMBOL: EGMD
EMC global depositary receipts(GDRs) are listed on
LONDON STOCK EXCHANGE.
Related information can be found at:
http://www.londonstockexchange.com
CONTENTSCHAPTER 1. Letter to Shareholders .........................................................
I. 2017 Business Report ........................................................................................
II. 2018 Business Plan ............................................................................................
CHAPTER 2. General Condition of the Company ..............................
1. Brief Introduction ............................................................................................
2. Organization ....................................................................................................
3. Directors & Supervisors ..................................................................................
4. Corporate Governance ....................................................................................
CHAPTER 3. Business Development Outline .....................................
I. Business Highlights ........................................................................................
1. Business Scope .........................................................................................
2. Container Shipping Industry Profile .........................................................
3. Status of Technology and R&D ................................................................
4. Short & Long Term Business Plans ..........................................................
II. Overview of the Industry ................................................................................
1. Market Analysis ........................................................................................
2. Key usage and Manufacturing Process of Main Products ........................
3. Status of Supply of Main Materials ..........................................................
4. Main Customers Who Purchased over 10% of Total Sales in Recent
2 Years and their individual Purchase Amount and Share ........................
5. Company’s total expense for environmental protection in 2017 ..............
6. Environmental protection policies and measures .....................................
7. New international environmental protection regulations .........................
8. Code of Conduct / Courtesy .....................................................................
9. Protection Measures for Safe Work Environment and worker Safety ......
10. Social Responsibility ................................................................................
11. Important Agreement ................................................................................
CHAPTER 4. Financial Information ........................................................
1. Five - Year Financial Summary ......................................................................
2. Five - Year Financial Analysis ........................................................................
3. Consolidated Financial Statements and Report of Independent Accountants ..
4. Parent Company Only Financial Statements and Report of Independent
Accountants ...................................................................................................
5
5
17
26
26
30
31
31
39
39
39
42
44
48
49
49
56
56
56
56
57
58
59
60
60
62
70
70
74
76
188

1 Letter to Shareholders
4
2017 Annual Report
5
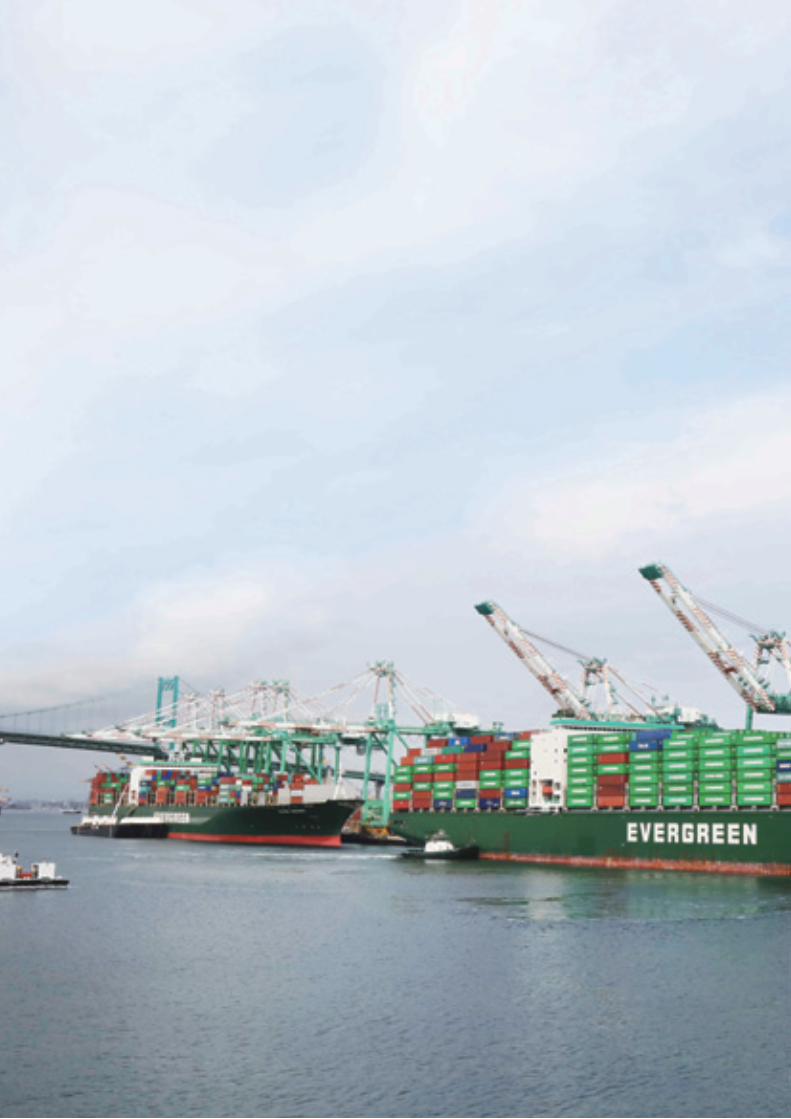
Dear Shareholders,
The global container shipping market has been in the doldrums for
several years. 2017 finally ushered in an encouraging recovery. Despite
the continued volatility of the global political situation, the geopolitical
conflicts, and the trade protectionism, the global container shipping
market maintained its integration trends in 2017. The balance of market
supply and demand has been improved. Each of the main shipping
alliances enlarged its fleet and service scope. Service networks were
expanded and the slot utilization was at a higher level, hence operation
costs were effectively reduced and revenues were increased. The global
container shipping market is characterized by increasing stability.
Great team efforts were exerted by all Evergreen employees in
implementing the policy of revenue maximization and cost reduction.
Effective improvements were made in the fields of navigational safety,
schedule reliability, terminal operation efficiency, container tracking, and
document handling. On the other hand, operations within the alliance
were enhanced as planned, enabling us to provide higher service quality
with enlarged service scope, higher sailing frequencies, and more direct
service at a lower cost level.
I. 2017 Business Report
1. Container shipping market overview
(1) Cargo volume growth
According to the World Economic outlook published by the
International Monetary Fund (IMF), global GDP grew by 3.8% in
2017, which represents an increase by 3.2% compared to 2016. The
average GDP growth rate in developed countries is 2.3%, which is
significantly higher than the average growth rate of 1.7% in the past
5 years. In emerging countries, the average GDP growth rate in 2017
was 4.8%, remaining unchanged compared to the rate in the past 5
years. All relevant economic indicators show that 2017 is a relatively
bullish year compared to past years.
Global container shipping market demands have grown steadily in
sync with the global economic recovery.
1 Letter to Shareholders
6
2017 Annual Report
7
A survey by Clarkson, a professional research institute for
Maritime Containers reveals that the global volume of container
shipments recovered significantly in 2017. Annual growth of 5% led
to a 9.2 million TEU increase which resulted in a total volume of 191
million TEU. The east-west route was up about 4.6% Year-on-year,
and the north-south route grew by about 5.2%.
As per Container Trade Statistics, the 2017 Asia-Europe segment
grew by about 4.12%. Datamyne statistics increased by about 5.81%
in the Trans-Pacific eastward segment in 2017.
(2) Capacity Supply
From April 2017, the major traditional markets are dominated by
three major alliances - 2M, Ocean Alliance and THE Alliance. Under
the operational framework of the alliance, investment by carriers in
ultra large container vessels is increasing day by day.
According to statistics released by Alphaliner, 2017 global
container fleet capacity growth rose to 3.7%, an increase of around
820,000 in TEU capacity. New deliveries totaled 146 ships at 1,126,131
TEU. A total of 156 vessels were dismantled, which was 421,562
TEU. The order of new vessels is 2,702,000 TEU, accounting for
12% of the total capacity. Among them, there were 59 ships at 18,000
TEU and 76 ships at 10,000 to 18,000 TEU. This shows that the
development of ultra-large scale ships is turning into the mainstream.
In addition, the idle capacity in the market is 487,433 TEUs (about
126 ships), accounting for 2.3% of the total global fleet capacity.
Compared to the end of 2016, the idle capacity was 1,419,649 TEUs,
about 344 ships, accounting for 7% of the total global fleet capacity at
the time.
A total of 92 ships with a capacity in excess of 18,000 TEU in
2017 account for 6% of the global fleet capacity; about 370 ships of
a capacity of 12,500~18,000 TEU make up 16% of the global fleet
capacity; about 221 ships of 10,000~12,500 TEU constitute 7% of the
global fleet capacity. About 683 ships of a capacity of 10,000 TEU and
above account for 29% of the global fleet capacity. It is estimated that
the ratio of vessels of a capacity of 10,000 TEU or more will increase
8
1 Letter to Shareholders
to 37% in 2018.
(3) Freight Market Status
With the gradual recovery of the global container shipping industry,
the overall supply and demand situation improved in 2017 with
rebounding freight rates. The financial position of the shipping lines was
also significantly better than in the previous year.
According to the Alphaliner’s statistics, the average profit level of the
shipping industry has gradually improved from -1.2% in Q1 (-5.5% in
2016), 2.8% in Q2 (-9.2% in 2016) to 5.0% in Q3 (-7.8% in 2016). Q4
saw an increase to 0.9% (-1.2%in 2016), which represents a significant
improvement 2017.
2. Company Operational Strategy
Following the continuous improvement of shipping market supply
and demand in the 2017 and the application of modern network
technologies, the global shipping container market environment also
gradually presented itself in a different light. Our operating strategies
were adjusted in response to the changing business environment.
Furthermore, through the adoption of new technologies, new platforms
and new practices, our major operation costs were reduced and core
competitiveness was enhanced. The operating principles can be
summarized as follows:
(1) Strengthening of carrier alliances to complement the expansion of
service networks;
(2) Optimal fleet deployment and enhanced slot utilization;
(3) Optimize customer relationship management and active control of
freight structure;
(4) Reasonable and timely reflection of costs and firm grasp of
opportunities for revenue improvement;
(5) Strict control of operating cost and optimization of operating
efficiency.
3. Annual Accounts & Profitability Analysis
A. Annual Accounts
In 2017, actual consolidated operating income totaled NT$150.58
billion, an increase of NT$26.11 billion compared to the NT$124.47
billion in 2016. In 2017, actual consolidated operating costs were

2017 Annual Report
9
10
1 Letter to Shareholders
NT$139.69 billion, which represents an increase by NT$11.73 billion
compared to the NT$127.96 billion in 2017.
B. Profitability Analysis
ROA: 4.01 %
ROE: 11.07 %
Net Profit Margin: 4.42 %
EPS: NTD 1.97 per share
4. Research & Development
(1) Green Fleet
Evergreen’s fleet equipment has been modified to conform to
California Air Resource Board (CARB) regulations, which became
effective on January 1, 2017, requiring all vessels docking at its ports
to use shore electric power in order to reduce exhaust emissions by at
least 70%.
The company prides itself on being the "Guardian of the Green
Earth", it has pioneered the design of S-type ships with multiple
environmental protection facilities such as double hulls, built-in oil
tanks, and shore power systems in a forward-looking approach that
exceeds international norms since 2003. L-type vessels that have been
in operation since 2012 are equipped with more advanced technologies
to enhance environmental performance and further reduce greenhouse
gas emission rates. In addition, the Type B container vessels, which
were delivered in the third quarter of 2017, are equipped with a newly-
developed sword-type stern, which can effectively reduce the wave
resistance during navigation and save fuel consumption compared to
the conventional ball-type hull.
In addition, we maintain an “Environmental Guardians” page on
our website so as to proactively disclose emissions management and
treatment of ballast and sludge, as well as provide detailed information
on S-type, L-type, and B-type designs and other green instruments for
the easy reference of our customers.
(2) Maritime Training
Evergreen embraces the spirit and vision of sustainable operations
and is firmly committed to providing its ship masters and all crew
2017 Annual Report
11
1 Letter to Shareholders
12
2017 Annual Report
13
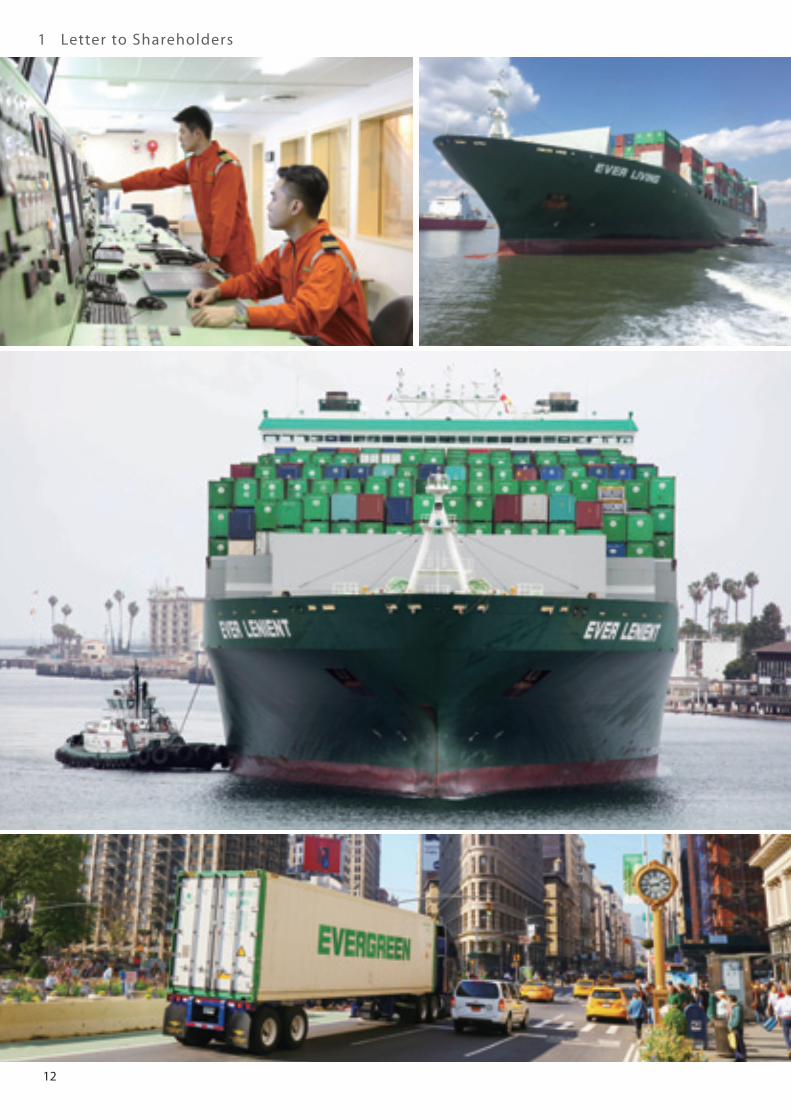
members with constant professional maritime training. Evergreen
Seafarer Training Center has a full range of training equipment and
offers rigorous and well-planned training courses to continuously
improve professional knowledge and skills of seafarers with the goal of
preventing maritime accidents and environmental pollution.
(a) In 2017, the Evergreen Seafarer Training Center organized a total of
310 professional training courses in 29 categories for 1,743 trainees.
(b) In November 2017, the UK Maritime and Coastguard Agency
recertified the Company’s electronic chart and data display system,
Proficiency in preservation responsibility, and Proficiency in
preservation awareness. The courses provided by the Evergreen
Seafarer Training Center (ESTC) met the requirements of IMO
STCW (Standards of Safety, Training, Certification, and Watch
keeping) 2010 Amendments.
(c) To actively recruit outstanding talent and aspiring maritime
professionals, Evergreen strengthened its cooperation with National
Kaohsiung Marine University, offering a graduate program
in maritime transportation with a series of complete expertise
and professional skills training courses. In addition, Evergreen
cooperates with National Taiwan Ocean University, offering a
graduate program in turbine technology and appointing outstanding
managers as lecturers in several professional courses. The goal is to
cultivate professional seafarer and administrative personnel for the
future through a mechanism of selection, training, deployment, and
retention.
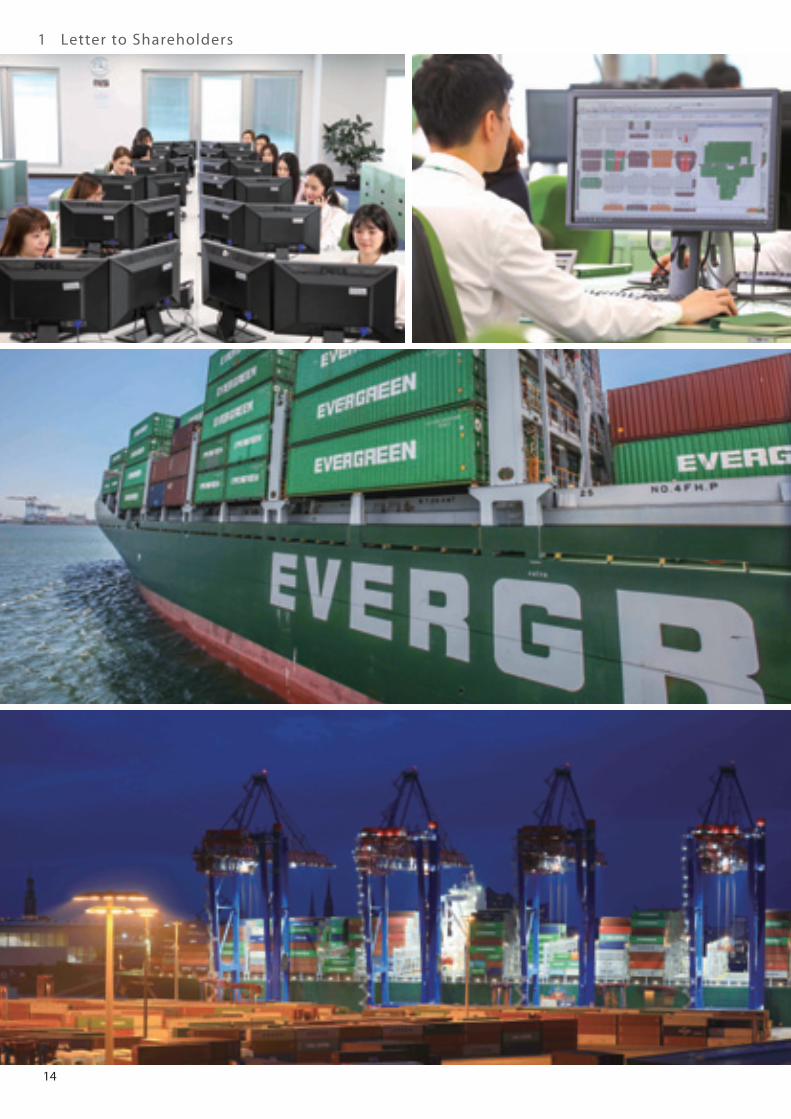
(3) E-Commerce
E-commerce is an important link of modern transportation services.
Evergreen launched its e-commerce site in 2001 (ShipmentLink.
com) and is firmly committed to constant development and updates
by embracing a global outlook and localized services. The goal
is to provide customers all over the world with localized services
characterized by timeliness, convenience, and eco-friendliness.
E-commerce has flourished in recent years due to increased
international transport demand derived from many small and medium-
sized enterprises as a result of the expansion of business opportunities
through e-commerce platforms. In view of the need for user-friendly
1 Letter to Shareholders
14
2017 Annual Report
15
logistics services of smaller volume shippers, Evergreen Line is
collaborating with Alibaba.com to allow shippers to search for freight
rates and reserve cargo space on the Alibaba.com platform directly.
This revolutionary booking service will be available primarily to
suppliers in China. Once a booking is confirmed, selected price and
capacity are also locked-in. In coordination with the supply chain
management services of Evergreen logistics, we provide customers
with more convenient services.
(4) Quality Recognition
Evergreen has been constantly improving the quality of its services.
The ultimate goal is to win the trust and approval of customers as
well as recognition and certification from international media and
organizations:
Evergreen Recognized for Corporate Governance Excellence
for the Third Consecutive Year
The Taiwan Stock Exchange (TWSE) announced the result of its
third annual corporate governance evaluation of both listed and
Over-The-Counter (OTC) companies in Taiwan. The Company is
ranked among the top 5% of all listed companies for the third year
in a row and is the only shipping company recognized for such
excellent performance.
In line with global trends, the evaluation highlights the importance
of corporate governance and requires both listed and OTC
companies to disclose not only financial data but also non-fiscal
information. The KPIs included in this evaluation assess protection
of shareholders' rights; equitable treatment of shareholders;
board composition and management; information transparency,
safeguarding of stakeholder interests and corporate social
responsibility.
In order to implement the corporate governance system, the
company invited accountants, lawyers and other professionals to
serve as independent directors in 2011. Through their professional
background and independence, they further enhanced the
functions of the board of directors and actively strengthened the
role of management and supervision. In terms of information
transparency, the company regularly discloses financial statements

1 Letter to Shareholders
16
2017 Annual Report
17
and other related information pertaining to fulfillment of corporate
social responsibilities, implementation of credit management, and
maintenance of labor-management relations on the company’s
Chinese and English websites, and thereby enabling domestic and
foreign investors, global customers, and supply chain partners to
gain a clear understanding of the company’s operating conditions.
Evergreen honored with E-Commerce Excellence Award for
three consecutive years
The company was awarded the "E-Commerce Excellence Award"
by LOG NET, a professional logistics information management
agency in 2017. From 2014 to 2016, Evergreen won this prestigious
award three consecutive times. Founded in 1991, LOG NET is
headquartered in New Jersey, USA, and is the leading brand for
logistics integrated information services. The company has held
annual e-commerce service evaluations since 2003 to recognize the
outstanding performance of logistics and transportation companies
in information systems and e-commerce solutions.
Although the market situation and operational pressures in 2016
impacted the overall e-commerce capabilities of the maritime
industry, the company still maintained consistently excellent
performance and insisted on the quality of service. Evergreen Global
Information System provides electronic data services including
establishment of customer information, information integrity,
immediacy, correctness, and various functions of information
platforms in different regions. It also provides more than ten
types of regionalized webpages in line with regional language
and information needs to make it easier for customers to arrange
their shipments online, and keep track of their progress and related
information.
II. 2018 Business PlanGlobal container shipping market is expected to grow in sync with
the global economy in 2018, and the volume of traded goods is also
expected to grow by about 5.1%. However, imbalances are caused by
supply exceeding demand and bunker oil prices continue to climb. As a
result, container shipping competitive pressure persists.

1 Letter to Shareholders
18
2017 Annual Report
19
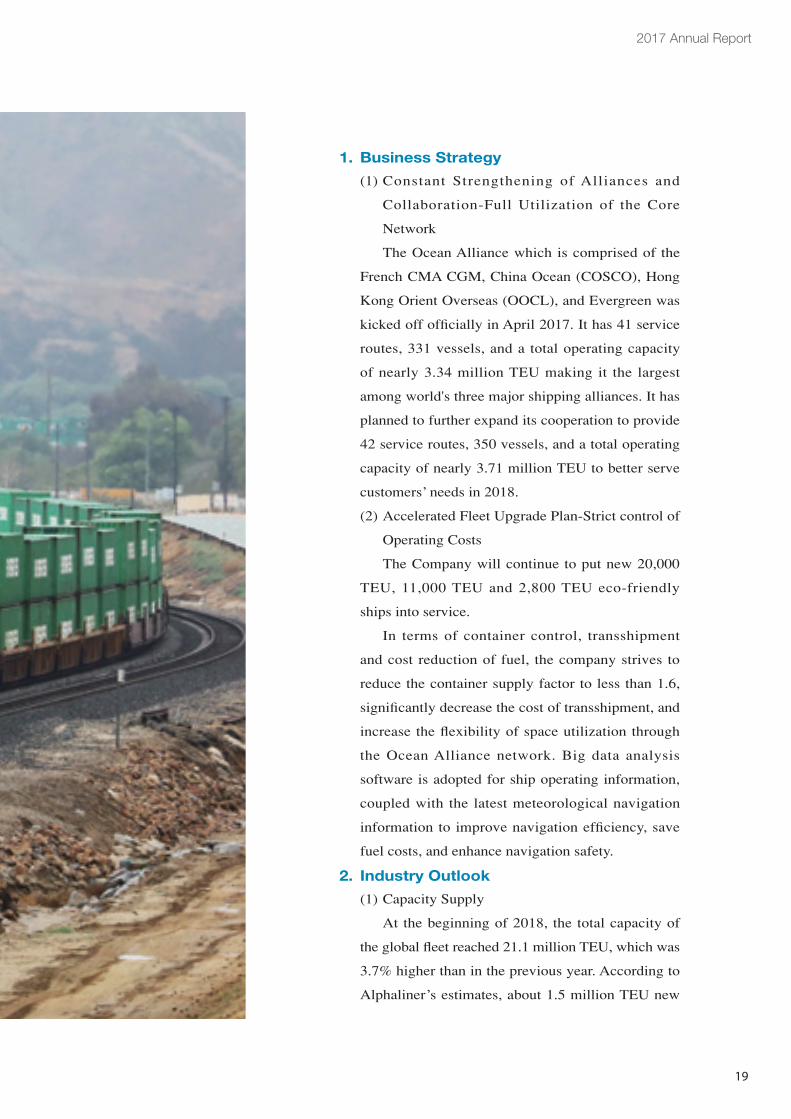
1. Business Strategy
(1) Constant Strengthening of Alliances and
Collaboration-Full Utilization of the Core
Network
The Ocean Alliance which is comprised of the
French CMA CGM, China Ocean (COSCO), Hong
Kong Orient Overseas (OOCL), and Evergreen was
kicked off officially in April 2017. It has 41 service
routes, 331 vessels, and a total operating capacity
of nearly 3.34 million TEU making it the largest
among world's three major shipping alliances. It has
planned to further expand its cooperation to provide
42 service routes, 350 vessels, and a total operating
capacity of nearly 3.71 million TEU to better serve
customers’ needs in 2018.
(2) Accelerated Fleet Upgrade Plan-Strict control of
Operating Costs
The Company will continue to put new 20,000
TEU, 11,000 TEU and 2,800 TEU eco-friendly
ships into service.
In terms of container control, transshipment
and cost reduction of fuel, the company strives to
reduce the container supply factor to less than 1.6,
significantly decrease the cost of transshipment, and
increase the flexibility of space utilization through
the Ocean Alliance network. Big data analysis
software is adopted for ship operating information,
coupled with the latest meteorological navigation
information to improve navigation efficiency, save
fuel costs, and enhance navigation safety.
2. Industry Outlook
(1) Capacity Supply
At the beginning of 2018, the total capacity of
the global fleet reached 21.1 million TEU, which was
3.7% higher than in the previous year. According to
Alphaliner’s estimates, about 1.5 million TEU new
1 Letter to Shareholders
20
2017 Annual Report
21
ship capacity will be delivered this year, and the annual transportation
capacity will grow by 6% over the previous year. Shipping companies
in the market are gradually delaying the delivery of ships, which will
ease the oversupply situation in the overall container shipping market.
(2) The Growth of Cargo Volume
According to an IMF research report, global GDP growth rate will
reach 3.9% in 2018. (6.6%, 2.9%, and 2.4% in China, the United States,
and the European Union, respectively). Despite increasing calls for
trade protectionism and anti-globalization in recent years, it is expected
that the cargo volume of shipments in 2018 will continue to grow.
Alphaliner also predicts that global volume will grow by 5.1% in 2018.
In addition, Drewry, a British shipping advisory agency, pointed out
in a recent study that turnover in each region is expected to continue to
grow, raising the forecasted growth rate to 4.5% in 2018, which means
there is an additional volume of 9 million TEU of goods to be shipped.
3. Competitive, Regulatory, and Economic Influences on
Our Business
(1) External Competition
The price of marine fuel continued to rebound in 2017. Brent
crude average price soared from US$45 per barrel to US$54, a rise
of US$9 dollars per barrel. The growth rate reached nearly 20% in
2017. Affected by the OPEC’s agreement of fuel reduction, the market
expects the average price of Brent crude oil to increase in 2018. The
continuous rise in oil prices is a heavy burden for carriers.
(2) Regulatory Impact
a. Collection of fuel data and CO2 monitoring by the International
Maritime Organization (IMO)
From January 1st, 2018, all vessels above 5,000 tons gross tonnage
in EU ports should collect and report the annual data of CO2
emissions and related information for verification, and the shipping
company should submit the monitoring plan to EU for verification
by August 31, 2017.
The 69th session of IMO Marine Environment Protection
Committee (MEPC) approved the global ship fuel consumption data
collection mechanism and revised the Annex VI of the MARPOL
Convention, which is the global ship fuel consumption data
collection mechanism. The information collected by the IMO will be
reported to the flag State after the end of each year. After verifying
22
1 Letter to Shareholders
the data, the flag State will issue a declaration of conformity to
the vessel and submit the data to the IMO’s database of ship fuel
consumption.
b. China has published new regulations designating three areas as
sulphur control areas. Effective Jan. 1, 2018, all ships berthing at
ports near the Pearl River Delta, Yangtze River Delta and the Bohai
Sea must use fuel with a sulfur content of ≤0.5% m/m.
c. The IMO and Marine Environment Protection Committee (MPEC)
reached a decision that the 0.5% m/m global ship fuel sulphur
limit will become effective on January 1, 2020. Ships operating
within the Baltic, North Sea, North American, and U.S. Caribbean
Emission Control Areas (ECAs) are required to comply with the
stricter 0.1% m/m sulphur limit regulation.
(3) Macro Business Environment
2017 was a year of transformations for global container transport
operators. In the United States, Trump was elected as the president
and de-globalization and trade protectionism became more prominent.
The economic structure of China was transformed from "investment
and export" to "consumption and domestic demand" orientation,
which not only slowed economic growth, but also affected the world
economy through production chain and other channels. The pending
Brexit, added uncertainties, making it more difficult for enterprises to
conduct investment planning and generating negative impacts on the
market. However, the global container shipping operators continue to
implement consolidation. The reshuffling of the three major alliances
has been completed, and the carriers are also trying to find a balance
between market share and freight income.
4. Future strategy
The economic growth rate of the major economies in 2018 is
expected to be positive and trade volume will continue to grow. For
the shipping industry, it could be the best year since the 2008 Financial
Crisis. However, the threat of oversupply remains as more new ships
will be delivered to the market, and the overall supply and demand is
expected to face greater challenges.
As oil prices continue to rise, the coming into effect of the Ballast
Water Convention and the requirements set forth new low sulfur fuel
2017 Annual Report
23

1 Letter to Shareholders
24
2017 Annual Report
25
regulations will also increase costs. We will seize the opportunity to
adjust the schedule of fleet network in coordination with the Ocean
Alliance and make more efficient use of transport capacity.
All staff members strive for constant improvement and self
motivation. In addition to an active implementation of the operating
performance indicators, our staff spares no effort in exploring new
markets to increase revenue and continues to implement various
policies of cost and expense reduction. Evergreen provides customers
with differentiated services to win customer support by embracing the
concept of continuous optimization of service quality. The company
earns the trust of shareholders through profitability and sustainable
operations.
26
2 General Condition of the Company
1. Brief Introduction(1) Registration Date of the Company: September 25, 1968(2) A Chronology of Evergreen Marine Corporation (Taiwan) Ltd.
1968-1976■Established with a capital of NT$2 million.■Evergreen Shipping Agency (Japan) Corporation founded.■Evergreen Shipping Agency (America) Corporation founded.
1977-1986■Evergreen Marine (UK) Limited founded.■Launching of unprecedented round-the-world eastbound services and westbound regular full
container services and construction of 24 G-type container vessels.■Evergreen Shipping Agency (Deutschland) GmbH founded.
1987-1996■Listed on the Taiwan Stock Exchange with a capital of NT$10 billion.■Launching of a Far East/US West Coast refrigerated container service.■Evergreen Marine (Hong Kong) Ltd. founded.■Issuance of Global Depository Receipts of a total value of US$115 million on the London
Stock Exchange.
1997-2001■Evergreen Shipping Agency Philippines Corporation founded.■Colon Container Terminal S.A. in Panama becomes fully operational as a common user
facility.■Evergreen Shipping Agency (Poland) SP.Z.O.O. founded.■Evergreen Container Terminal No. 5, Berths 79, 80 and 81 in Kaohsiung Port becomes fully
operational and Taiwan’s Customs authorities approved the implementation of an “overall self-management” system to improve and upgrade Evergreen’s services to shippers.
■Evergreen Shipping Agency (France) S.A.S. founded.■Evergreen Shipping Agency (Korea) Corporation founded.■Evergreen Marine Corp. (Malaysia) Sdn. Bhd. founded.■Evergreen Shipping Agency (Netherlands) B.V. founded.■Evergreen Shipping Agency (Thailand) Co., Ltd. founded.■Evergreen Marine (Singapore) Pte Ltd. founded.■Taranto Container Terminal in the south of Italy, with Evergreen Group as one of the
investors, opened for business with comprehensive feeder network serving other Italian ports, the western and eastern Mediterranean, the Adriatic Sea and the Black Sea.
■The Evergreen Seafarer Training Center is awarded ISO-9001:2000 for quality systems, marine simulator equipment, and training centers by DNV. The training center, an Evergreen Group investment opened in 1999, aims to boost the professional skills of Group crew, reduce the risk of accidents and environmental pollution at sea and conform to international regulations.
■Charng Yang Development Co., Ltd. is established as a joint venture with Tesco Taiwan for investment and construction of the Tesco Chingkuo Store in Taoyuan City.
2017 Annual Report
27
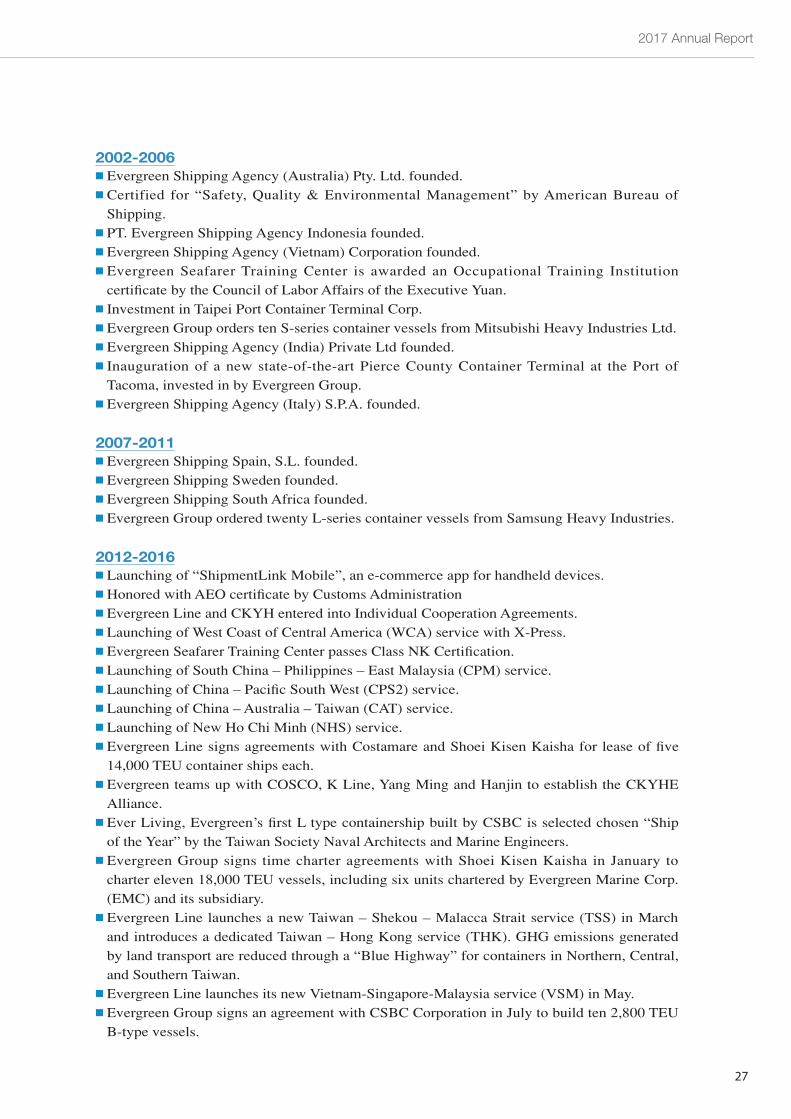
2002-2006■Evergreen Shipping Agency (Australia) Pty. Ltd. founded.■Certified for “Safety, Quality & Environmental Management” by American Bureau of
Shipping.■PT. Evergreen Shipping Agency Indonesia founded.■Evergreen Shipping Agency (Vietnam) Corporation founded.■Evergreen Seafarer Training Center is awarded an Occupational Training Institution
certificate by the Council of Labor Affairs of the Executive Yuan.■Investment in Taipei Port Container Terminal Corp.■Evergreen Group orders ten S-series container vessels from Mitsubishi Heavy Industries Ltd.■Evergreen Shipping Agency (India) Private Ltd founded.■Inauguration of a new state-of-the-art Pierce County Container Terminal at the Port of
Tacoma, invested in by Evergreen Group.■Evergreen Shipping Agency (Italy) S.P.A. founded.
2007-2011■Evergreen Shipping Spain, S.L. founded.■Evergreen Shipping Sweden founded.■Evergreen Shipping South Africa founded.■Evergreen Group ordered twenty L-series container vessels from Samsung Heavy Industries.
2012-2016■Launching of “ShipmentLink Mobile”, an e-commerce app for handheld devices. ■Honored with AEO certificate by Customs Administration■Evergreen Line and CKYH entered into Individual Cooperation Agreements.■Launching of West Coast of Central America (WCA) service with X-Press.■Evergreen Seafarer Training Center passes Class NK Certification.■Launching of South China – Philippines – East Malaysia (CPM) service.■Launching of China – Pacific South West (CPS2) service.■Launching of China – Australia – Taiwan (CAT) service.■Launching of New Ho Chi Minh (NHS) service.■Evergreen Line signs agreements with Costamare and Shoei Kisen Kaisha for lease of five
14,000 TEU container ships each. ■Evergreen teams up with COSCO, K Line, Yang Ming and Hanjin to establish the CKYHE
Alliance.■Ever Living, Evergreen’s first L type containership built by CSBC is selected chosen “Ship
of the Year” by the Taiwan Society Naval Architects and Marine Engineers.■Evergreen Group signs time charter agreements with Shoei Kisen Kaisha in January to
charter eleven 18,000 TEU vessels, including six units chartered by Evergreen Marine Corp. (EMC) and its subsidiary.
■Evergreen Line launches a new Taiwan – Shekou – Malacca Strait service (TSS) in March and introduces a dedicated Taiwan – Hong Kong service (THK). GHG emissions generated by land transport are reduced through a “Blue Highway” for containers in Northern, Central, and Southern Taiwan.
■Evergreen Line launches its new Vietnam-Singapore-Malaysia service (VSM) in May.■Evergreen Group signs an agreement with CSBC Corporation in July to build ten 2,800 TEU
B-type vessels.
28
2 General Condition of the Company
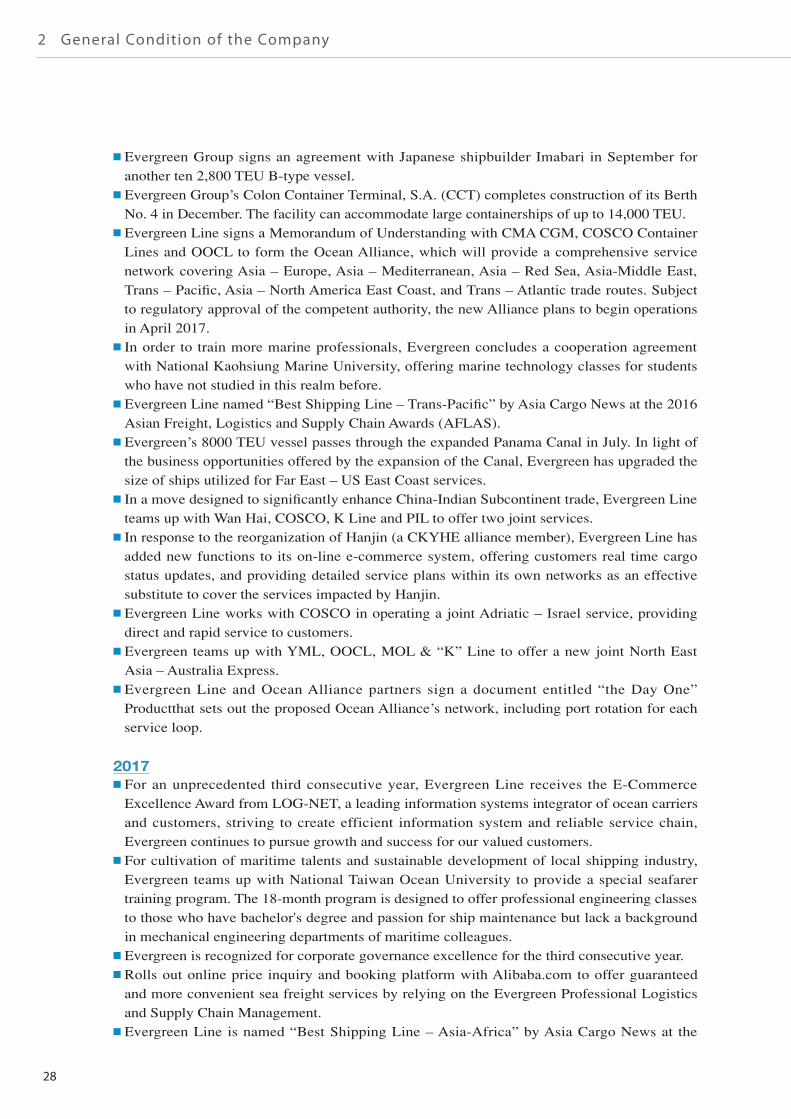
■Evergreen Group signs an agreement with Japanese shipbuilder Imabari in September for another ten 2,800 TEU B-type vessel.
■Evergreen Group’s Colon Container Terminal, S.A. (CCT) completes construction of its Berth No. 4 in December. The facility can accommodate large containerships of up to 14,000 TEU.
■Evergreen Line signs a Memorandum of Understanding with CMA CGM, COSCO Container Lines and OOCL to form the Ocean Alliance, which will provide a comprehensive service network covering Asia – Europe, Asia – Mediterranean, Asia – Red Sea, Asia-Middle East, Trans – Pacific, Asia – North America East Coast, and Trans – Atlantic trade routes. Subject to regulatory approval of the competent authority, the new Alliance plans to begin operations in April 2017.
■In order to train more marine professionals, Evergreen concludes a cooperation agreement with National Kaohsiung Marine University, offering marine technology classes for students who have not studied in this realm before.
■Evergreen Line named “Best Shipping Line – Trans-Pacific” by Asia Cargo News at the 2016 Asian Freight, Logistics and Supply Chain Awards (AFLAS).
■Evergreen’s 8000 TEU vessel passes through the expanded Panama Canal in July. In light of the business opportunities offered by the expansion of the Canal, Evergreen has upgraded the size of ships utilized for Far East – US East Coast services.
■In a move designed to significantly enhance China-Indian Subcontinent trade, Evergreen Line teams up with Wan Hai, COSCO, K Line and PIL to offer two joint services.
■In response to the reorganization of Hanjin (a CKYHE alliance member), Evergreen Line has added new functions to its on-line e-commerce system, offering customers real time cargo status updates, and providing detailed service plans within its own networks as an effective substitute to cover the services impacted by Hanjin.
■Evergreen Line works with COSCO in operating a joint Adriatic – Israel service, providing direct and rapid service to customers.
■Evergreen teams up with YML, OOCL, MOL & “K” Line to offer a new joint North East Asia – Australia Express.
■Evergreen Line and Ocean Alliance partners sign a document entitled “the Day One” Productthat sets out the proposed Ocean Alliance’s network, including port rotation for each service loop.
2017■For an unprecedented third consecutive year, Evergreen Line receives the E-Commerce
Excellence Award from LOG-NET, a leading information systems integrator of ocean carriers and customers, striving to create efficient information system and reliable service chain, Evergreen continues to pursue growth and success for our valued customers.
■For cultivation of maritime talents and sustainable development of local shipping industry, Evergreen teams up with National Taiwan Ocean University to provide a special seafarer training program. The 18-month program is designed to offer professional engineering classes to those who have bachelor's degree and passion for ship maintenance but lack a background in mechanical engineering departments of maritime colleagues.
■Evergreen is recognized for corporate governance excellence for the third consecutive year.■Rolls out online price inquiry and booking platform with Alibaba.com to offer guaranteed
and more convenient sea freight services by relying on the Evergreen Professional Logistics and Supply Chain Management.
■Evergreen Line is named “Best Shipping Line – Asia-Africa” by Asia Cargo News at the
2017 Annual Report
29
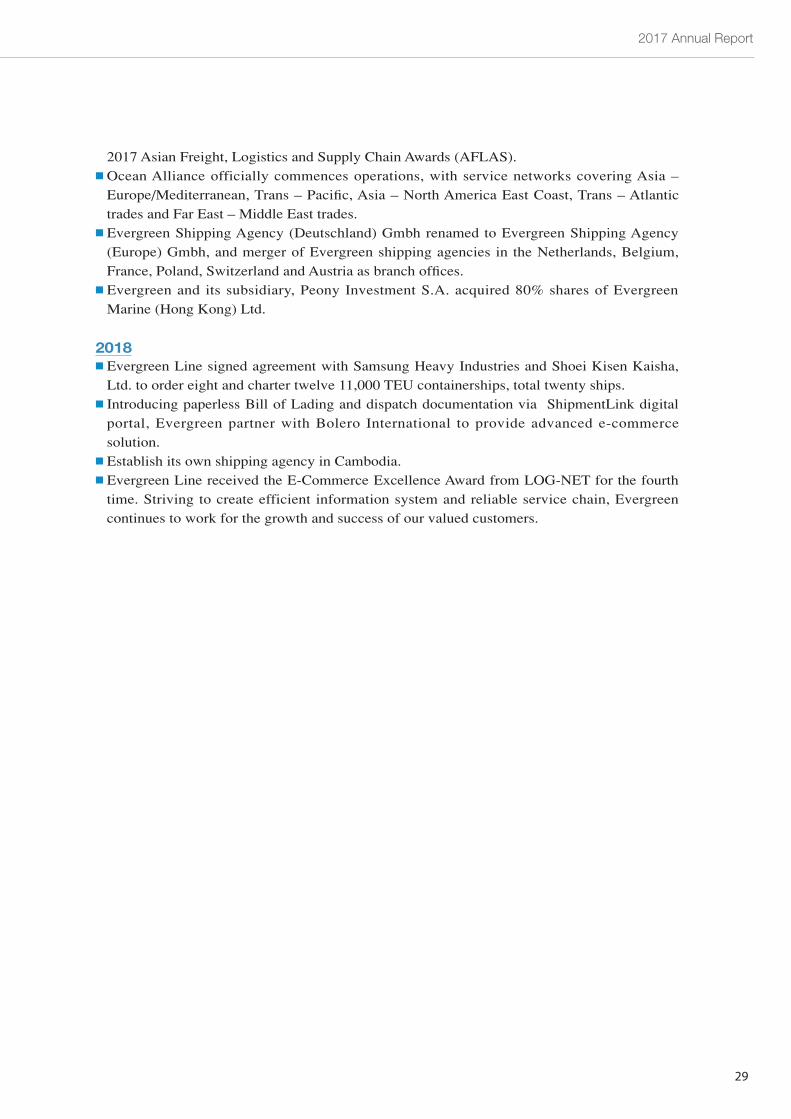
2017 Asian Freight, Logistics and Supply Chain Awards (AFLAS).■Ocean Alliance officially commences operations, with service networks covering Asia –
Europe/Mediterranean, Trans – Pacific, Asia – North America East Coast, Trans – Atlantic trades and Far East – Middle East trades.
■Evergreen Shipping Agency (Deutschland) Gmbh renamed to Evergreen Shipping Agency (Europe) Gmbh, and merger of Evergreen shipping agencies in the Netherlands, Belgium, France, Poland, Switzerland and Austria as branch offices.
■Evergreen and its subsidiary, Peony Investment S.A. acquired 80% shares of Evergreen Marine (Hong Kong) Ltd.
2018■Evergreen Line signed agreement with Samsung Heavy Industries and Shoei Kisen Kaisha,
Ltd. to order eight and charter twelve 11,000 TEU containerships, total twenty ships.■Introducing paperless Bill of Lading and dispatch documentation via ShipmentLink digital
portal, Evergreen partner with Bolero International to provide advanced e-commerce solution.
■Establish its own shipping agency in Cambodia.■Evergreen Line received the E-Commerce Excellence Award from LOG-NET for the fourth
time. Striving to create efficient information system and reliable service chain, Evergreen continues to work for the growth and success of our valued customers.
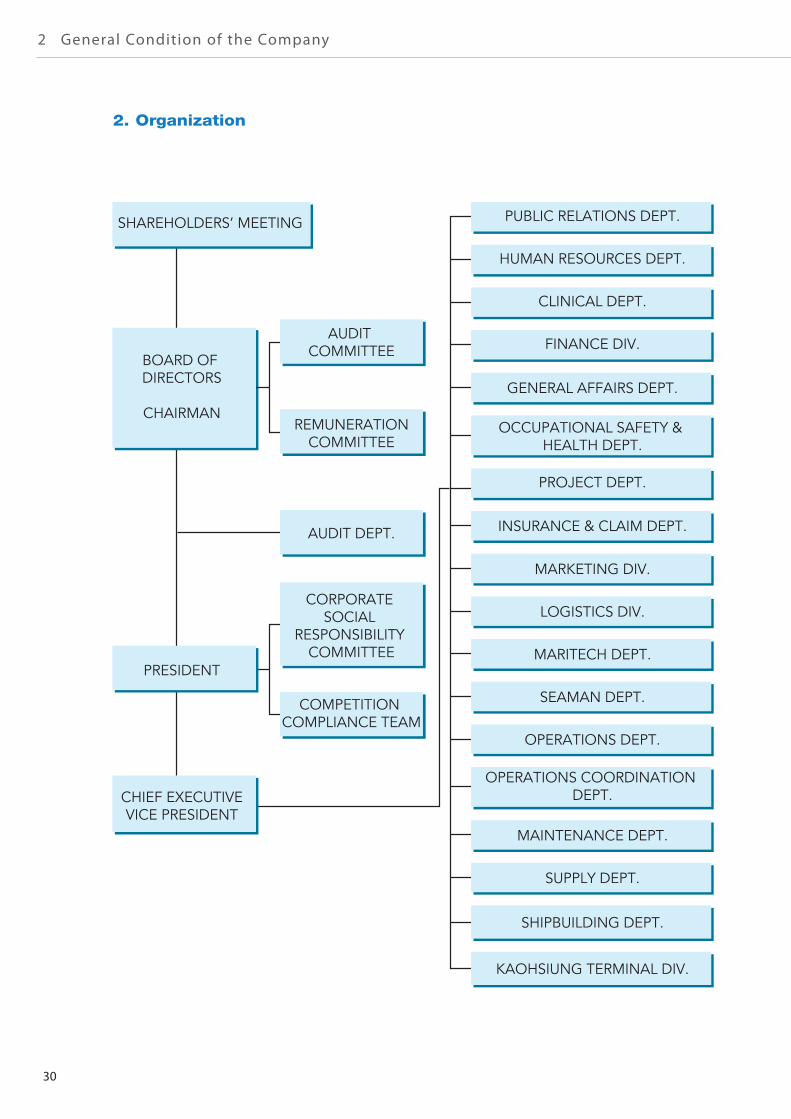
2. Organization
30
2 General Condition of the Company
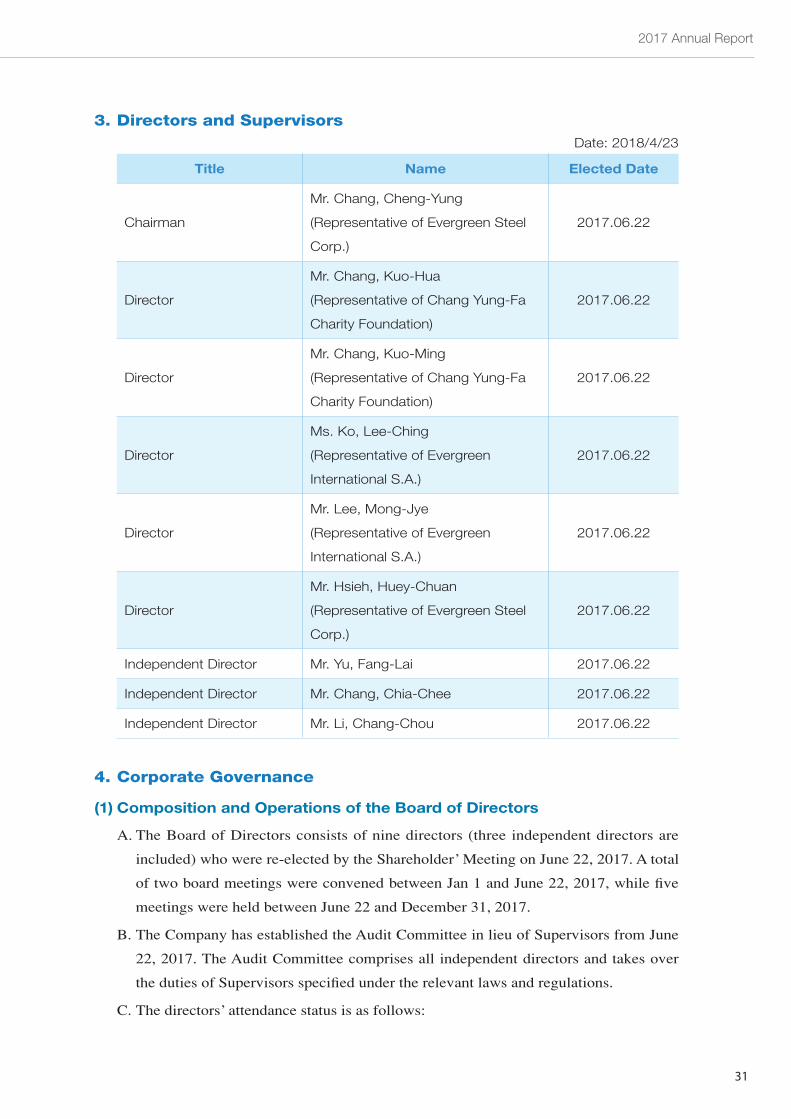
3. Directors and SupervisorsDate: 2018/4/23
Title Name Elected Date
Chairman
Mr. Chang, Cheng-Yung
(Representative of Evergreen Steel
Corp.)
2017.06.22
Director
Mr. Chang, Kuo-Hua
(Representative of Chang Yung-Fa
Charity Foundation)
2017.06.22
Director
Mr. Chang, Kuo-Ming
(Representative of Chang Yung-Fa
Charity Foundation)
2017.06.22
Director
Ms. Ko, Lee-Ching
(Representative of Evergreen
International S.A.)
2017.06.22
Director
Mr. Lee, Mong-Jye
(Representative of Evergreen
International S.A.)
2017.06.22
Director
Mr. Hsieh, Huey-Chuan
(Representative of Evergreen Steel
Corp.)
2017.06.22
Independent Director Mr. Yu, Fang-Lai 2017.06.22
Independent Director Mr. Chang, Chia-Chee 2017.06.22
Independent Director Mr. Li, Chang-Chou 2017.06.22
4. Corporate Governance
(1) Composition and Operations of the Board of Directors
A. The Board of Directors consists of nine directors (three independent directors are
included) who were re-elected by the Shareholder’ Meeting on June 22, 2017. A total
of two board meetings were convened between Jan 1 and June 22, 2017, while five
meetings were held between June 22 and December 31, 2017.
B. The Company has established the Audit Committee in lieu of Supervisors from June
22, 2017. The Audit Committee comprises all independent directors and takes over
the duties of Supervisors specified under the relevant laws and regulations.
C. The directors’ attendance status is as follows:
2017 Annual Report
31
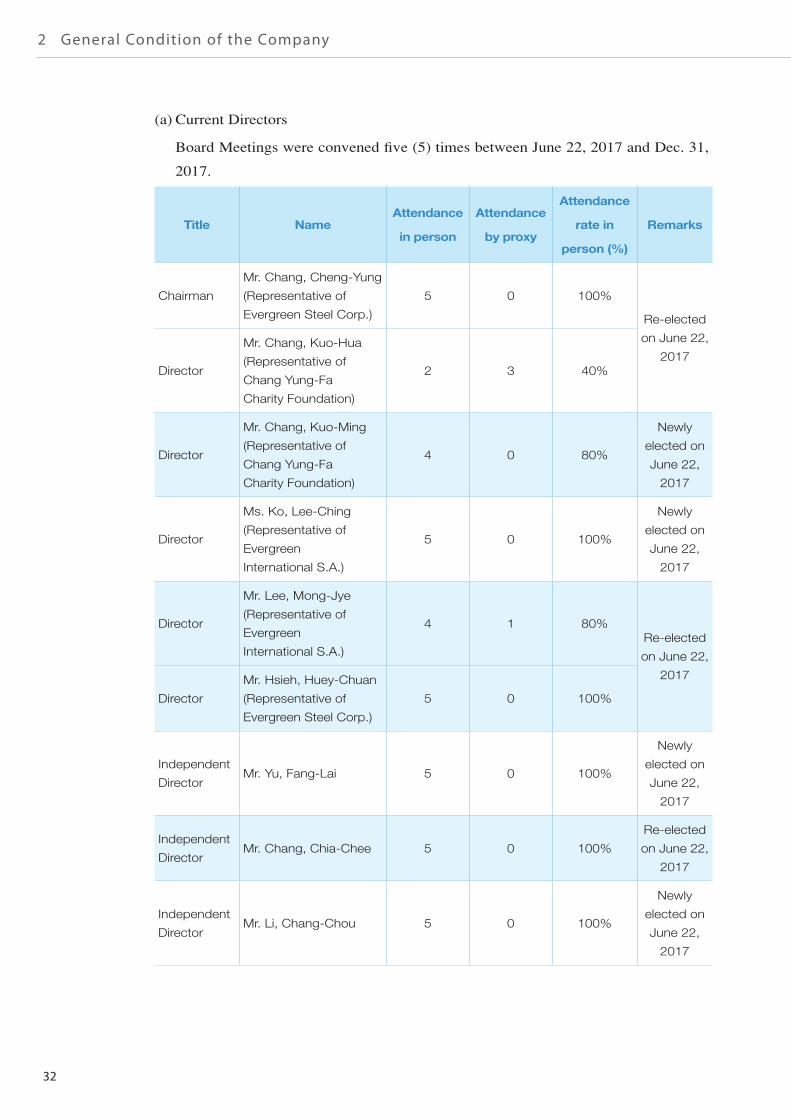
(a) Current Directors
Board Meetings were convened five (5) times between June 22, 2017 and Dec. 31,
2017.
Title NameAttendance
in person
Attendance
by proxy
Attendance
rate in
person (%)
Remarks
Chairman
Mr. Chang, Cheng-Yung
(Representative of
Evergreen Steel Corp.)
5 0 100%
Re-elected
on June 22,
2017Director
Mr. Chang, Kuo-Hua
(Representative of
Chang Yung-Fa
Charity Foundation)
2 3 40%
Director
Mr. Chang, Kuo-Ming
(Representative of
Chang Yung-Fa
Charity Foundation)
4 0 80%
Newly
elected on
June 22,
2017
Director
Ms. Ko, Lee-Ching
(Representative of
Evergreen
International S.A.)
5 0 100%
Newly
elected on
June 22,
2017
Director
Mr. Lee, Mong-Jye
(Representative of
Evergreen
International S.A.)
4 1 80%Re-elected
on June 22,
2017
Director
Mr. Hsieh, Huey-Chuan
(Representative of
Evergreen Steel Corp.)
5 0 100%
Independent
DirectorMr. Yu, Fang-Lai 5 0 100%
Newly
elected on
June 22,
2017
Independent
DirectorMr. Chang, Chia-Chee 5 0 100%
Re-elected
on June 22,
2017
Independent
DirectorMr. Li, Chang-Chou 5 0 100%
Newly
elected on
June 22,
2017
32
2 General Condition of the Company
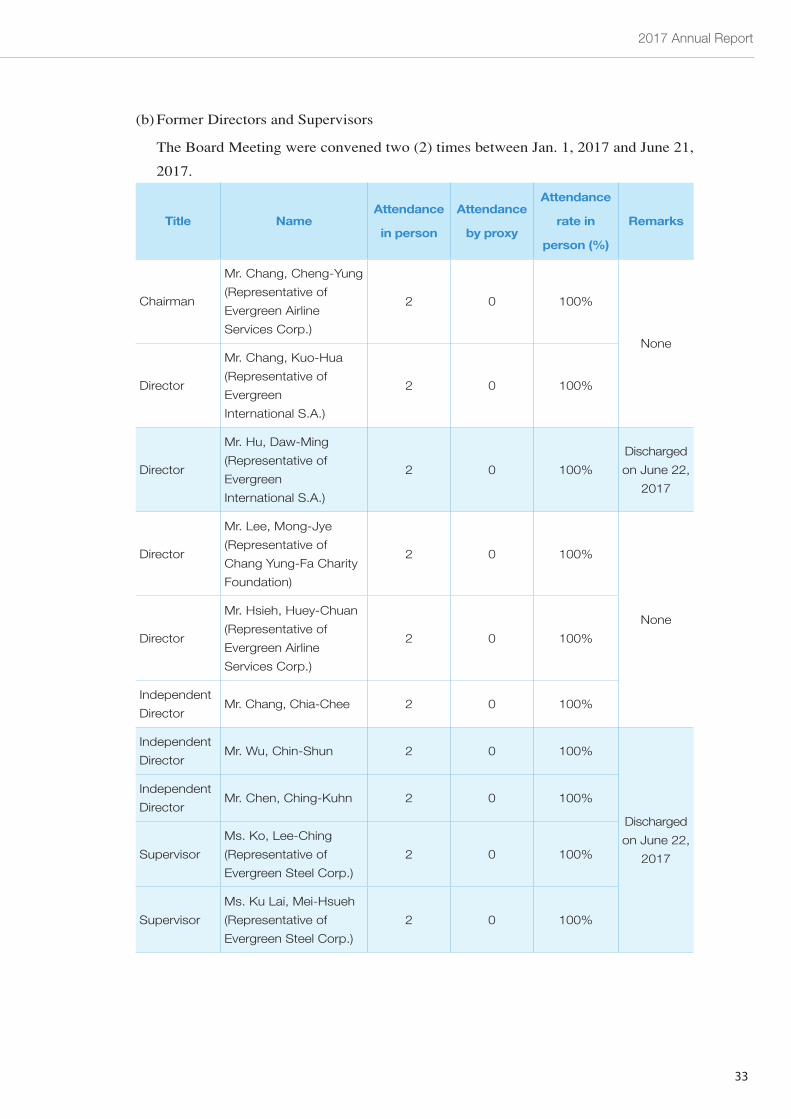
(b) Former Directors and Supervisors
The Board Meeting were convened two (2) times between Jan. 1, 2017 and June 21,
2017.
Title NameAttendance
in person
Attendance
by proxy
Attendance
rate in
person (%)
Remarks
Chairman
Mr. Chang, Cheng-Yung
(Representative of
Evergreen Airline
Services Corp.)
2 0 100%
None
Director
Mr. Chang, Kuo-Hua
(Representative of
Evergreen
International S.A.)
2 0 100%
Director
Mr. Hu, Daw-Ming
(Representative of
Evergreen
International S.A.)
2 0 100%
Discharged
on June 22,
2017
Director
Mr. Lee, Mong-Jye
(Representative of
Chang Yung-Fa Charity
Foundation)
2 0 100%
None
Director
Mr. Hsieh, Huey-Chuan
(Representative of
Evergreen Airline
Services Corp.)
2 0 100%
Independent
DirectorMr. Chang, Chia-Chee 2 0 100%
Independent
DirectorMr. Wu, Chin-Shun 2 0 100%
Discharged
on June 22,
2017
Independent
DirectorMr. Chen, Ching-Kuhn 2 0 100%
Supervisor
Ms. Ko, Lee-Ching
(Representative of
Evergreen Steel Corp.)
2 0 100%
Supervisor
Ms. Ku Lai, Mei-Hsueh
(Representative of
Evergreen Steel Corp.)
2 0 100%
2017 Annual Report
33
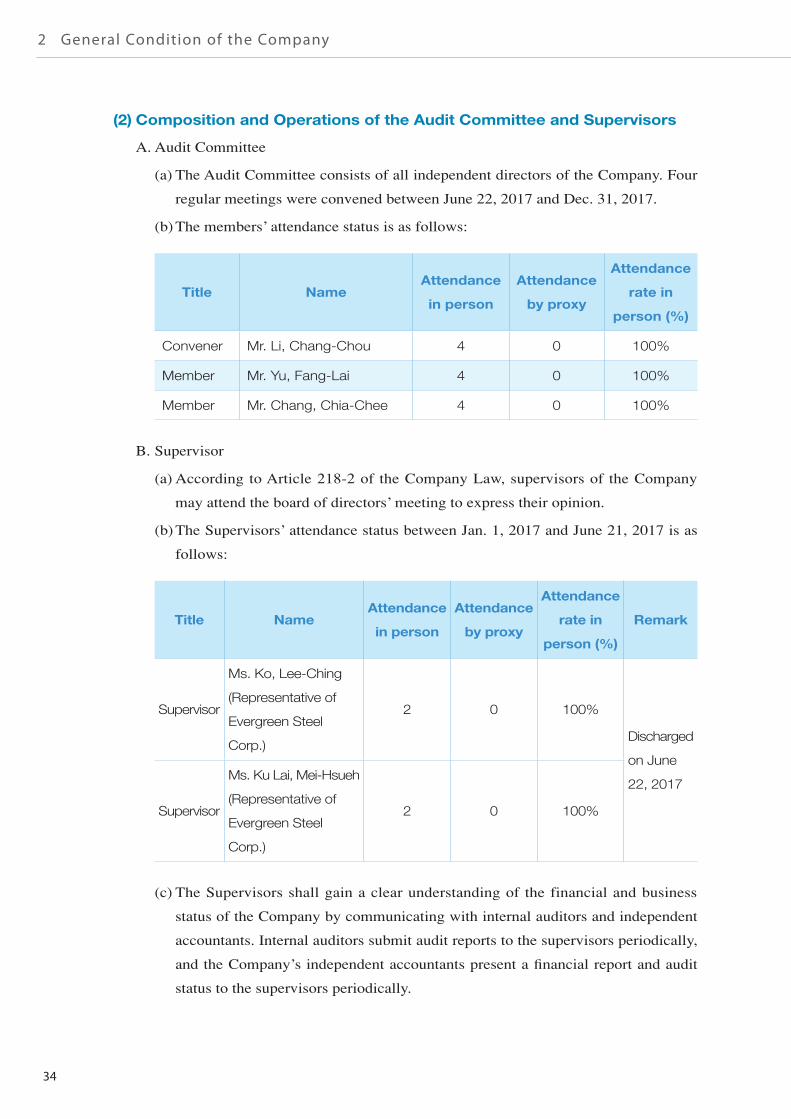
(2) Composition and Operations of the Audit Committee and Supervisors
A. Audit Committee
(a) The Audit Committee consists of all independent directors of the Company. Four
regular meetings were convened between June 22, 2017 and Dec. 31, 2017.
(b) The members’ attendance status is as follows:
Title NameAttendance
in person
Attendance
by proxy
Attendance
rate in
person (%)
Convener Mr. Li, Chang-Chou 4 0 100%
Member Mr. Yu, Fang-Lai 4 0 100%
Member Mr. Chang, Chia-Chee 4 0 100%
B. Supervisor
(a) According to Article 218-2 of the Company Law, supervisors of the Company
may attend the board of directors’ meeting to express their opinion.
(b) The Supervisors’ attendance status between Jan. 1, 2017 and June 21, 2017 is as
follows:
Title NameAttendance
in person
Attendance
by proxy
Attendance
rate in
person (%)
Remark
Supervisor
Ms. Ko, Lee-Ching
(Representative of
Evergreen Steel
Corp.)
2 0 100%
Discharged
on June
22, 2017
Supervisor
Ms. Ku Lai, Mei-Hsueh
(Representative of
Evergreen Steel
Corp.)
2 0 100%
(c) The Supervisors shall gain a clear understanding of the financial and business
status of the Company by communicating with internal auditors and independent
accountants. Internal auditors submit audit reports to the supervisors periodically,
and the Company’s independent accountants present a financial report and audit
status to the supervisors periodically.
34
2 General Condition of the Company
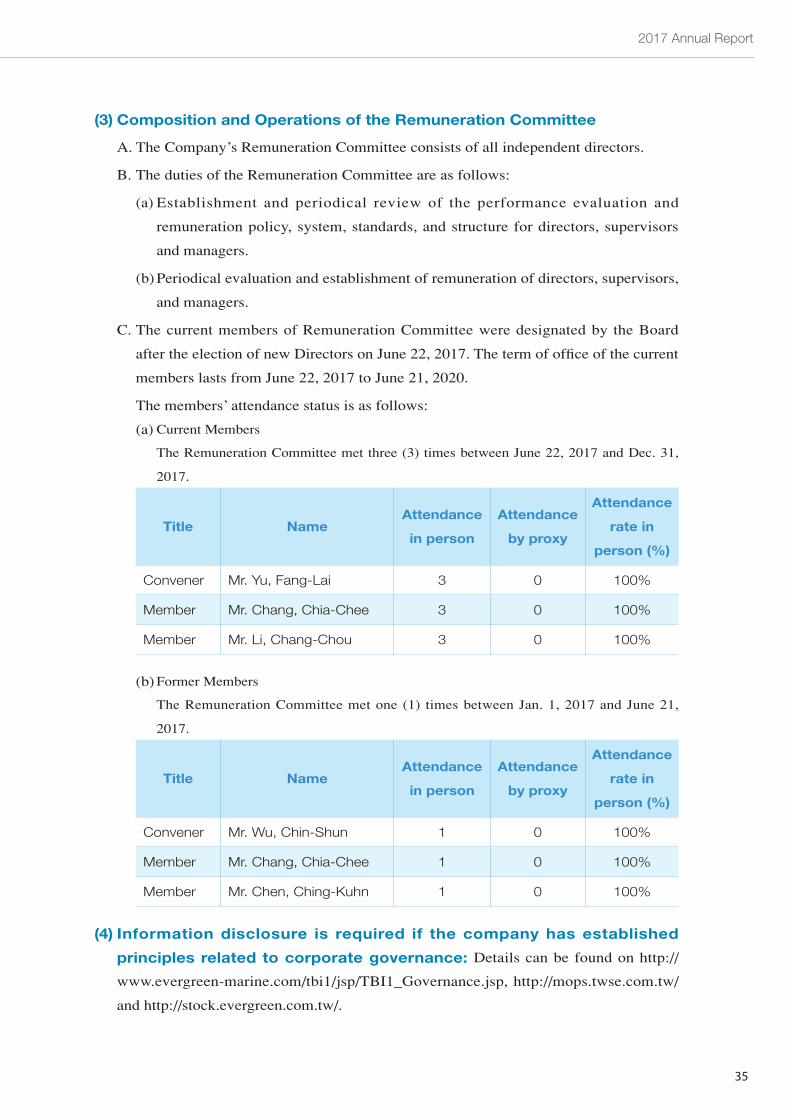
(3) Composition and Operations of the Remuneration Committee
A. The Company’s Remuneration Committee consists of all independent directors.
B. The duties of the Remuneration Committee are as follows:
(a) Establishment and periodical review of the performance evaluation and
remuneration policy, system, standards, and structure for directors, supervisors
and managers.
(b) Periodical evaluation and establishment of remuneration of directors, supervisors,
and managers.
C. The current members of Remuneration Committee were designated by the Board
after the election of new Directors on June 22, 2017. The term of office of the current
members lasts from June 22, 2017 to June 21, 2020.
The members’ attendance status is as follows:
(a) Current Members
The Remuneration Committee met three (3) times between June 22, 2017 and Dec. 31,
2017.
Title NameAttendance
in person
Attendance
by proxy
Attendance
rate in
person (%)
Convener Mr. Yu, Fang-Lai 3 0 100%
Member Mr. Chang, Chia-Chee 3 0 100%
Member Mr. Li, Chang-Chou 3 0 100%
(b) Former Members
The Remuneration Committee met one (1) times between Jan. 1, 2017 and June 21,
2017.
Title NameAttendance
in person
Attendance
by proxy
Attendance
rate in
person (%)
Convener Mr. Wu, Chin-Shun 1 0 100%
Member Mr. Chang, Chia-Chee 1 0 100%
Member Mr. Chen, Ching-Kuhn 1 0 100%
(4) Information disclosure is required if the company has established
principles related to corporate governance: Details can be found on http://
www.evergreen-marine.com/tbi1/jsp/TBI1_Governance.jsp, http://mops.twse.com.tw/
and http://stock.evergreen.com.tw/.
2017 Annual Report
35
(5) Internal Control System Execution Status
Evergreen Marine Corp. (Taiwan) LTD.Internal Control Statement
Date: Mar. 26, 2018
The Company states the following with regard to its internal control system during
the period from Jan. 1, 2017 to Dec. 31, 2017, based on the findings of self-evaluation:
1. The Company is fully aware that establishing, operating, and maintaining an internal
control system are the responsibility of its Board of Directors and management. The
Company has established such a system aimed at providing reasonable assurance
of the achievement of objectives in the effectiveness and efficiency of operations
(including profits, performance, and safeguard of asset security), reliability, timeliness,
transparency of reporting, and compliance with applicable laws and regulations.
2. An internal control system has inherent limitations. No matter how perfectly designed,
an effective internal control system can provide only reasonable assurance of
accomplishing the three goals mentioned above. Furthermore, the effectiveness of an
internal control system may change along with changes in the environment or external
circumstances. The internal control system of the Company contains self-monitoring
mechanisms, however, and the Company takes corrective actions as soon as a deficiency
is identified.
3. The Company judges the design and operating effectiveness of its internal control
system based on the criteria provided in the Regulations Governing the Establishment
of Internal Control Systems by Public Companies promulgated by the Securities and
Futures Commission, Ministry of Finance (hereinbelow, the “Regulations”). The internal
control system judgment criteria adopted by the Regulations divide internal control into
five elements based on the process of management control: 1. Control environment 2.
Risk assessment 3. Control activities 4. Information and communications 5. Monitoring.
Each element further contains several items. Please refer to the Regulations for details.
4. The Company has evaluated the design and operating effectiveness of its internal control
system according to the aforesaid criteria.
5. Based on the findings of the evaluation mentioned in the preceding paragraph, the
Company believes that during the stated time period its internal control system (including
its supervision of subsidiaries), encompassing internal controls for knowledge of
the degree of achievement of operational effectiveness and efficiency objectives,
reliability, timeliness, transparency of reporting, and compliance with applicable laws
and regulations, was effectively designed and operating, and reasonably assured the
achievement of the above-stated objectives.
36
2 General Condition of the Company
6. This Statement will become a major part of the content of the Company's Annual Report
and Prospectus, and will be made public. Any falsehood, concealment, or other illegality
in the content made public will entail legal liability under Articles 20, 32, 171, and 174
of the Securities and Exchange Law.
7. This statement has been passed by the Board of Directors Meeting of the Company held
on Mar. 23, 2018, where zero of the 8 attending directors (include commissioned to
attend) expressed dissenting opinions, and all affirmed the contents of this Statement.
Evergreen Marine Corp.(Taiwan) LTD.
Chairman:
President:
2017 Annual Report
37
(6) Risk management systems in relation to the financial reporting process
A.The effect of fluctuations in interest rates, exchange rates, and inflation on the
company’s profit and loss and future response measures:
As freight income is mainly in USD, we pay attention to exchange rate fluctuations at
all times and adopt the following measures in response:
(a) Use of professional financial information systems, constant monitoring of
international exchange rate fluctuations, maintenance of close contact with
financial institutions to get the most up-to-date exchange rate information and
gain a firm grasp of exchange rate fluctuations, which in turn allows the adoption
of active response measures to cope with potential impacts of exchange rate
fluctuations.
(b) Use of the same currency for revenues and expenses if possible in order to
achieve natural hedging and prevent exchange rate risk. Shipping revenues in
foreign currencies are used to settle payments in foreign currencies in different
countries. Natural hedging is utilized to minimize exchange risks.
(c) Opening of foreign currency accounts to buy or sell foreign currencies in
accordance with actual capital demands and exchange rate developments.
B.Guidelines for engaging in high risk, high leverage investments, lending to third
parties, providing guarantees and endorsements, and engaging in derivative
transactions:
Currently there are no outstanding amounts for provision of loan to third parties.
All endorsements and guarantees are provided to subsidiaries and affiliates. All
related transactions are arranged according to our guidelines on providing loans,
endorsements and guarantees to third parties.
All derivatives trades are conducted for the purpose of hedging. Interest rate and
fuel swap agreements are done to hedge risk arising from market volatility and price
fluctuation. Relevant operations are carried out pursuant to the Procedures Governing
Derivative Trading.
38
2 Company Profile
2017 Annual Report
39
I. Business Highlights
1. Business Scope
(1) The company’s main business areas
The core business of Evergreen is container shipping. Our fleet capacity ranked
sixth in the world at the end of 2017. All of our service routes are operated on a regular
liner basis. We also offer inland transport, stevedoring, and logistics support services.
Our customers are drawn from the manufacturing, trading, and retail industries and
come from all over the world thus the company’s business performance is closely
connected to the global economy.
(2) Present service items
The company’s short-and long-haul service routes form a global network, including:
a. Transpacific trade
b. Far East-Europe/Mediterranean trade
c. Transatlantic trade
d. Far East-Latin America/Africa trade
e. Intra-Asian trade
In addition to the above service routes, we also provide a regional feeder service
network, such as within the Caribbean and the Indian subcontinent and other regions, to
shorten delivery times.
(3) Planned service development
The maritime business environment has dramatically improved compared to last
year. Major Carriers further strengthened different Shipping Alliances. Evergreen,
as a founding member of Ocean Alliance since April 2017, embraces a strategy of
simultaneous focus on stability and flexibility, in its constant optimization of the fleet
network and service routes to cope with the latest market trends. Adjustments to our
service routes in 2017 are summarized below:
Transpacific routes
In April 2017, a new Ocean Alliance composed of Evergreen, COSCO, CMA CGM
and OOCL, was formed to expand port coverage and service scope through a brand new
Ocean Alliance's network that encompasses 20 services in Transpacific with 13 Asia -
North American West Coast services ( PRX / CEN / PE1 / AAC / CPS / PVCS / HTW
/ TPS / PCC1 / NP1 / PE2 / TPN / PNW1), and 7 Asia – North American East Coast (
PE2 / AUE / PE1 / NUE / SAX / PEX3 / GME ) service routes.
Far East-Europe/Mediterranean strings
1. As of April 2017, the Ocean Alliance, composed of Evergreen, COSCO, CMA
CGM and OOCL, provides 6 services for the Far East - Northern Europe route
scope, including a total 33 direct calling ports such as Gdansk and Southampton.
Weekly Capacity increased by 295 TEU, (equivalent to 2%), compared to Q1 prior
3 Business Development Outline
40
3 Business Development Outline
to formation of Ocean Alliance; In addition, the alliance provides 5 services for
the Far East - Mediterranean route scope, including 35 direct calling ports such as
Venice and Haifa. Weekly Capacity increased by 1,100TEU, equivalent to 12%,
compared to Q1 prior to formation of the Ocean Alliance.
2. Intra-Europe Feeder Services: In November 2017, Evergreen teamed up with YML
and COSCO to create a new joint operation. This weekly service encompasses five
ships of 4,250 TEU capacities, one each provided by Evergreen and YML and the
remaining three by COSCO. The launch of this new service will enable Evergreen
to provide a direct connection from North Europe to the Mediterranean, particularly
to Morocco, Turkey, Israel and Egypt and dramatically shorten delivery times which
is a benefit especially for reefer containers.
3. Mediterranean Regional Services:
(1) In 2017, Evergreen aimed to consolidate the Group Intra-Med feeder Network
to provide customers with the best combination of transport needs. All main
regional services continued throughout 2017 with minor rotation adjustments.
Izmir and Gemlik, Turkey, services routes were shifted from GTS to ADL and
BSM to GTS, respectively.
(2) Major changes occurred in the North Africa sector, where NAF, PAL and LYS2
services have been merged into one single service “NAFR” in response to
lowered import demand from Asia. Besides, Mediterranean regional services to
Tunis, Tunisia, have been temporarily suspended because the actual length of
stay in port exceeds 30 days per voyage. Evergreen Line operations in Tunisia
are now focusing on the port of Bizerte in Tunisia.
(3) Intensified co-operation with EMES to extend the service range to Casablanca,
Morocco via Piraeus, was initiated in June 2017 and terminated in December.
This paved the way for the new EMX service (Europe-Med Express), launched
by EMU in cooperation with COSCO and through rational transshipment to
strengthen service competitiveness in this area.
Far East-Latin America/Africa routes
1. Far East-East Africa services (AEF/ASEA): Maintenance of 2-string services
through joint agreement with COSCO and X-press on AEF service, and provision of
ASEA service through allocation swap with CMA CGM and Emirates, continuous
enhancement of daily operations and provision of quality services to valuable
customers.
2. Far East-South Africa services (FAX/ASA): Maintenance of the well-regarded
ASA / FAX 2-loop service with Cosco / K-Line / PIL / MOL team to offer the most
competitive and stable individual services to Durban and Cape Town.
3. Far East-Panama/Caribbean: The Company utilizes a part of the capacity of the
Far East-North American East Coast services to expand deployment in Panama/
2017 Annual Report
41
Caribbean Sea. As of April 2017, we provide enough capacity for clients due to
Ocean Alliance service expansion. There are currently two services (AUE and
NUE) in the Far East-Panama/Caribbean trade.
4. Far East-Mexico/South American West Coast (WSA/WSA2): There are 11 vessels
in WSA joint service and 10 vessels in WSA2 joint service. The Company deploys
6 vessels in WSA and 1 vessel in WSA2.
5. Far East-South American East Coast (ESA/ESA2): There are 12 vessels in ESA
joint service (4 of them deployed by Evergreen). Evergreen swaps slots with NYK
in ESA2.
Far East-Middle East/Red Sea/India Subcontinent/Australia routes
1. Far East-Middle East Service: After the Ocean Alliance commenced operations in
April 2017, the service network for Far East to Middle East has been upgraded.
There are six sailings a week and the port coverage could be the one of the best in
the market.
2. Far East-Red Sea Service: From April 2017, the Ocean Alliance enlarged vessel
capacity to eight 9,600 TEU and eight 6,500 TEU container ships with 2-string
weekly services to expand port coverage from Far East to Red Sea loop and cater to
the local demand with “service quality” and “schedule reliability”.
3. Far East-Indian Subcontinent Service: In 2017, one 2,800 TEU containership and
one 4,200 TEU containership are separately deployed in two West-North India joint
direct services. Apart from that, there is one 4,200 TEU containership deployed in
Pakistan joint direct service. In December 2017, the capacity was increased by a
further 200 TEU in South-East India direct service to expand the service scope and
market share of the India-Pakistani market.
4. Far East- Australia Service: Evergreen put one more vessel into the NEAX service
at the end of May 2017. There are a total three vessels in the Far East to Australia
string to meet customers demand and strengthen service competitiveness.
Intra-Asia Routes
1. In order to strengthen the network from China to Indonesia, the CIT service route
(China – Indonesia – Thailand route) was launched in March 2017 to provide
express services and to meet customer demands.
2. To provide better shipping services from China to Vietnam, Singapore and
Malaysia, the CVM service was launched in March 2017 to provide express
services. The overall transit time was shortened to meet customer needs.
3. The NSB service (Northeast Asia-Southeast Asia Route) was extended to Shanghai
in March 2017 and to Port Klang North Port in July 2017. This route provides direct
services between Shanghai and Singapore and strengthens the direct service of
Klang Port. Meanwhile, it enhances the coverage of the NSB route schedules.
42
3 Business Development Outline
4. In order to optimize direct services from South Korea and Central China to the
Philippines, KTP service (South Korea - Taiwan - Philippines) Subic Bay was
added in April 2017 and Central China – Philippines was added in October. These
services provide customers more convenient services from South Korea and China
to the Philippines.
5. Since September 2017, JTP service (Japan-South China-Vietnam) was reshuffled to
add Haiphong as a port of call and provide Japan-Haiphong bidirectional service.
This move has effectively improved the space utilization, drastically shortened the
transit time and greatly improved the quality of shipping services.
6. TPH service (Taiwan-Philippines) has been enhanced to provide customers with
a more extensive service by adding Cagayan in November 2017. This service
increases Evergreen’s market share in the Philippines.
7. In line with terminal draught limitations and environmental energy saving
requirements, a wider ship design has been adopted to enhance cargo loading
capacity, schedule punctuality, and market competitiveness. A total of twenty 2,800
TEU Type-B container vessels were ordered by Evergreen Group. Three of these
vessels have been deployed into the NSD service (Northeast Asia-Southeast Asia)
in the fourth quarter of Year 2017 and the remaining new vessels are expected to be
fully operational in the Intra Asia region by Year 2019.
2. Container Shipping Industry Profile(1) Macroeconomic Environment
According to Alphaliner statistics, the global container shipping demand grew by
6.5% in 2017, which represents a significant recovery from only 2.5% in 2016. The
global fleet capacity growth rate rose from 1.8% in 2016 to 3.7% in 2017. As a result of
sufficient cargo volume from the first quarter to the third quarter rarely seen in recent
years (despite the softening in the fourth quarter), 2017 as a whole brought positive
results for the ocean carriers.
Industry integration is the main theme of 2017. In Asia, the forth- ranked COSCO
group’s acquisition of the seventh-ranked OOCL is undoubtedly the largest merger and
acquisition case of the shipping market in 2017. The purpose of the acquisition is to
optimize the network of routes and the distribution of capacity, reduce the related cost
of suppliers, integrate the container fleet and enhance the management capability. In
addition, Japan's big three shipping companies also merged their container transport
business (including overseas terminals business) to set up ONE Express. The official
kick-off date is slated for April 1, 2018. In Europe, the Danish Maersk acquisition
of German Hamburg-sud has been completed. Hapag-Lloyd also announced the
completion of formal integration with UAE (UASC) of the Arab Emirates. It is
expected that industry consolidation will continue over the next few years.
2017 Annual Report
43
A series of consolidations of container shipping market significantly changed the
market structure. Container shipping industry concentration has been greatly elevated.
Three major alliances (2M, Ocean Alliance, and THE Alliance) now control most of the
market capacity and the main market in east-west strings.
Looking ahead to 2018, Alphaliner reports point to a cargo volume growth rate of
about 5%. After MSC and CMA CGM placed the order for the world's largest container
ship, the market will face another record breaking year of Ultra Container Vessel
delivery. Yet market fundamentals are encouraging, and port and trade statistics are
expected to show a continued recovery in 2018.
(2) Relationships with Up-, Mid- and Downstream Companies
Marine shipping is the main transportation tool used in international trade. The
ratio of transportation volume via container ships and total cargo tonnage has been
raised year on year, covering most consumer product items. Not only is its industry
chain interconnectivity extremely high but it is also closely related to consumer
livelihood. This is summarized below:
a. Upstream industry
Shipyards
Transportation equipment manufacturers
Ship or transport equipment rental providers
b. Mid-stream industries
Marine fuel suppliers
Ship and transportation equipment repairers
Terminal operators
Land transportation logistics providers
Shipping alliance or slot purchasing partners
c. Downstream industries
Direct shippers (manufacturers, retailers, service providers)
Freight forwarding and logistics industry
(3) Product Development Trends
a. Industry concentration at an all-time high
Marine industry consolidation has accelerated in 2017. The combined capacity
of the Top ten carriers accounted for a record high 77% at the end of 2017. This
figure is expected to increase further to 82%, with the impending absorption of
OOCL by COSCO and the merger of K Line, MOL and NYK to form “Ocean
Network Express” (ONE).
b. Mainstream of ULCVs
Containership deliveries reached a total of 1.19 Million TEU in 2017, 26%
more than in the previous year. Ultra-large containerships of 14,000 TEU and
beyond accounted for about 56% of this new capacity.
44
3 Business Development Outline
c. Green Shipping Trends
In recent years, due to the worsening issues of global warming and climate
change, reduction of carbon emissions to protect the environment has turned
into an issue of universal concern. Thus, green shipping concepts have become a
prime focus for the industry. Relevant regulations are being enacted around the
world. For example, China has designated three emission controls areas, the IMO
has advanced the use of low sulphur fuels by 2020, and the main international
ports are incentivizing the use of light diesel oil during docking and the active use
of shore power to reduce environmental pollution. In response to these regulatory
trends, new ships are adopting energy-efficient, low-pollution designs. Green
shipping is the trend of the future.
(4) Status of Market Competition
a. Top three Carriers retain market positions
Maersk, MSC and CMA CGM retained their respective positions as the top
three carriers in the global container shipping industry. But COSCO and Hapag-
Lloyd have closed the gap through consolidation in the last two years. COSCO is
expected to leap into the number three spot once it completes the acquisition of
OOCL next year.
b. New alliances dominate main East-West routes
The reshuffle of the former 2M/G6/CKYHE/O3 alliances led to the formation
of new Alliances on 1 April 2017. The three new Alliances, 2M+HMM, Ocean
Alliance and THE Alliance, currently control 91% of the Far East - North
America trade capacity and 99% of the Far East- Europe trade capacity.
3. Status of Technology and R&D
R&D expenditures and results during the reporting year
(1) Green Fleet
The Company aims to be a "Guardian of the Green Earth". Since 2003, it has
been leading the industry in the design of S-type systems with double hull, built-
in oil tanks, shore power systems, and many other environmental protection
facilities on ships. Type L vessels put into operation since 2012 have enhanced their
environmental performance with more advanced technologies to further reduce their
greenhouse gas emission rates. In addition, the Type B container wheel delivered
beginning in the third quarter of 2017 is equipped with a newly developed sword-
type bow and can effectively reduce the wave resistance during navigation and save
fuel consumption compared with the traditional spherical bow.
In addition, we maintain an “Environmental Guardians” page on our website to
provide detailed information on emissions management and treatment of ballast and
2017 Annual Report
45
sludge, as well as introducing 17 state-of-the-art S-type, B-type and L-type designs
and other green equipment for the easy reference of our customers.
(2) Maritime Certification
Evergreen upholds the spirit and vision of sustainable development and firm
commitment to professional maritime training. The Evergreen Seafarer Training Center
has comprehensive training equipment and we rigorously organize training courses to
continuously improve professional knowledge and skills of our crews so as to prevent
the incidence of maritime accidents and environmental pollution.
In 2017, the Evergreen Seafarer Training Center organized a total of 310
professional training courses in 29 categories for 1,743 trainees.
In November 2017, the UK Maritime and Coastguard Agency recertified the
electronic chart and data display system, Proficiency in preservation responsibility
and Proficiency in preservation awareness of the company. The courses provided by
the Evergreen Seafarer Training Center (ESTC) met the requirements set forth in
IMO STCW (Standards of Safety, Training, Certification, and Watch keeping) 2010
Amendments.
Actively recruit outstanding talent and aspiring maritime professionals, Evergreen
strengthened its cooperation with National Kaohsiung Marine University, offering
a graduate program in maritime transportation with a series of complete knowledge
and professional skills training courses, offering the opportunity for non-maritime
undergraduates to engage in maritime work.
In addition, Evergreen cooperates with National Taiwan Ocean University, offering
a graduate program in turbine technology and appointing outstanding managers as
lecturers in several professional courses. The goal is to cultivate professional seafarer
and administrative personnel for the future through a mechanism of selection, training,
deployment, and retention.
(3) E-Commerce
Evergreen continuously invests resources and exerts efforts in E-commerce services
to create a safe and efficient information system and reliable service chain by adopting
a perspective characterized by a global outlook and localized services to help customers
seize business opportunities and strengthen market competitiveness.
E-commerce has flourished in recent years due to increased international transport
demand derived from many small and medium-sized enterprises as a result of the
expansion of business opportunities through e-commerce platforms. In view of the
need for user-friendly logistics services of smaller volume shippers, Evergreen Line
is collaborating with Alibaba.com to allow shippers to search for freight rates and
reserve cargo space on the Alibaba.com platform directly. This revolutionary booking
service will be available primarily to suppliers in China. Once a booking is confirmed,
46
3 Business Development Outline
selected price and capacity are also locked-in. In coordination with the supply chain
management services of Evergreen logistics, we provide customers with more
convenient services.
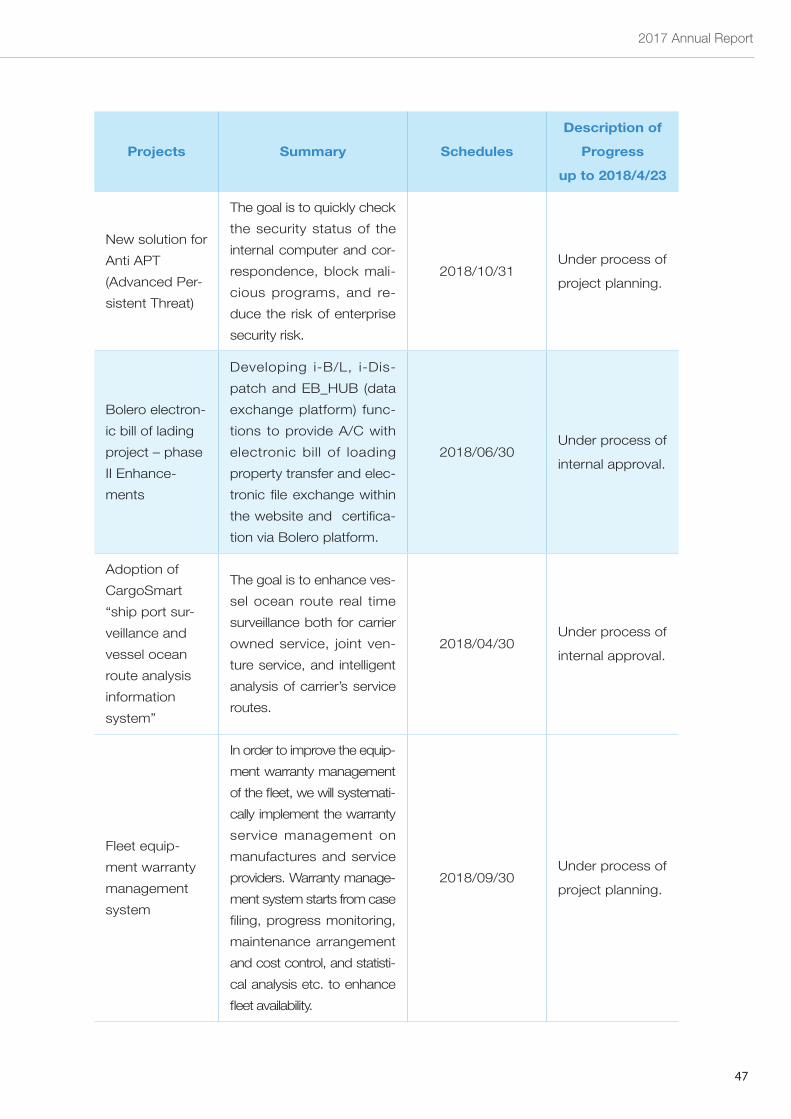
Future R&D Plans
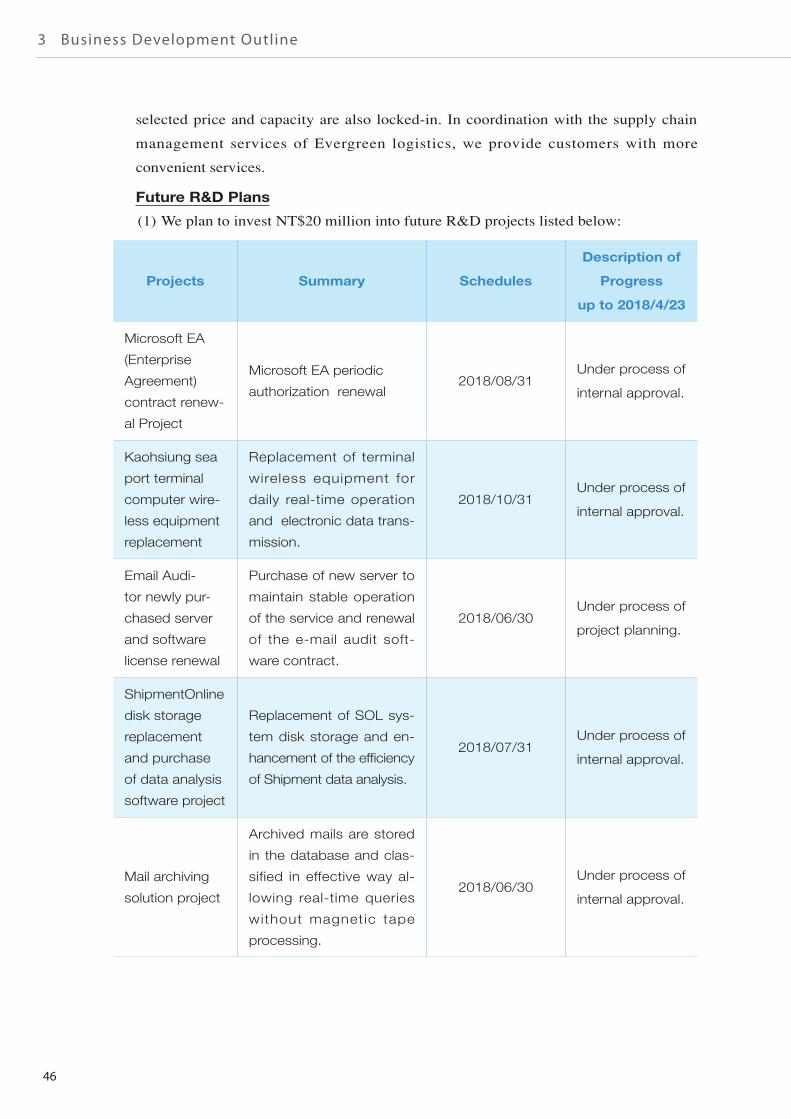
(1) We plan to invest NT$20 million into future R&D projects listed below:
Projects Summary Schedules
Description of
Progress
up to 2018/4/23
Microsoft EA
(Enterprise
Agreement)
contract renew-
al Project
Microsoft EA periodic
authorization renewal2018/08/31
Under process of
internal approval.
Kaohsiung sea
port terminal
computer wire-
less equipment
replacement
Replacement of terminal
wireless equipment for
daily real-time operation
and electronic data trans-
mission.
2018/10/31Under process of
internal approval.
Email Audi-
tor newly pur-
chased server
and software
license renewal
Purchase of new server to
maintain stable operation
of the service and renewal
of the e-mail audit soft-
ware contract.
2018/06/30Under process of
project planning.
ShipmentOnline
disk storage
replacement
and purchase
of data analysis
software project
Replacement of SOL sys-
tem disk storage and en-
hancement of the efficiency
of Shipment data analysis.
2018/07/31Under process of
internal approval.
Mail archiving
solution project
Archived mails are stored
in the database and clas-
sified in effective way al-
lowing real-time queries
without magnetic tape
processing.
2018/06/30Under process of
internal approval.
2017 Annual Report
47
Projects Summary Schedules
Description of
Progress
up to 2018/4/23
New solution for
Anti APT
(Advanced Per-
sistent Threat)
The goal is to quickly check
the security status of the
internal computer and cor-
respondence, block mali-
cious programs, and re-
duce the risk of enterprise
security risk.
2018/10/31Under process of
project planning.
Bolero electron-
ic bill of lading
project – phase
II Enhance-
ments
Developing i-B/L, i-Dis-
patch and EB_HUB (data
exchange platform) func-
tions to provide A/C with
electronic bill of loading
property transfer and elec-
tronic file exchange within
the website and certifica-
tion via Bolero platform.
2018/06/30Under process of
internal approval.
Adoption of
CargoSmart
“ship port sur-
veillance and
vessel ocean
route analysis
information
system”
The goal is to enhance ves-
sel ocean route real time
surveillance both for carrier
owned service, joint ven-
ture service, and intelligent
analysis of carrier’s service
routes.
2018/04/30Under process of
internal approval.
Fleet equip-
ment warranty
management
system
In order to improve the equip-
ment warranty management
of the fleet, we will systemati-
cally implement the warranty
service management on
manufactures and service
providers. Warranty manage-
ment system starts from case
filing, progress monitoring,
maintenance arrangement
and cost control, and statisti-
cal analysis etc. to enhance
fleet availability.
2018/09/30Under process of
project planning.
48
3 Business Development Outline
(2) Factors leading to success in future R&D projects
A. Knowledge of trends;
B. Sound planning;
C. Coordinated execution.
4. Short & Long Term Business Plans
Short-Term: Enhanced competitiveness and maintenance of growth
momentum
(1) Full grasp of market dynamics: provision differentiated services, strengthening of
communication with customers, and improvement of service quality to gain more
support.
(2) Improvement of ship loading factors: Enhancement of schedule accuracy, loading
efficiency, and fleet flexibility, etc. to achieve economies of scale.
(3) Expansion of joint venture partnerships: Identification of the best routes and
widening of service network coverage to provide customers with premium product
mixes and optimized service quality.
(4) Enforcement of line performance management: Appointment of line managers
to conduct regular line inspections and reviews. Line managers are expected to
improve ship loading factors, adjust cargo composition in order to maximize
revenue on trade lanes, and immediately propose improvements for under-
performing trade lanes.
Long-Term: Reduction of operating costs and pursuit of sustainable
profitability
(1) Training courses: We believe that employees are the most valuable asset of the
company. We provide employees with solid, professional training courses and
enforce a rotation system to cultivate professional competencies and international
viewpoints of our employees.
(2) Encouragement of employees to think outside the box: business development
must continue to inject new ideas, maximize benefits, and reduce costs as the goal,
coupled with continuous improvement of operational efficiency.
(3) Reduction of operating costs: This includes improvements in unit cost reduction
and KPI achievement through shared responsibility and staff participation so as to
boost operational efficiency.
(4) Constant strengthening of physical fitness and enhancement of overall energy
efficiency.
2017 Annual Report
49
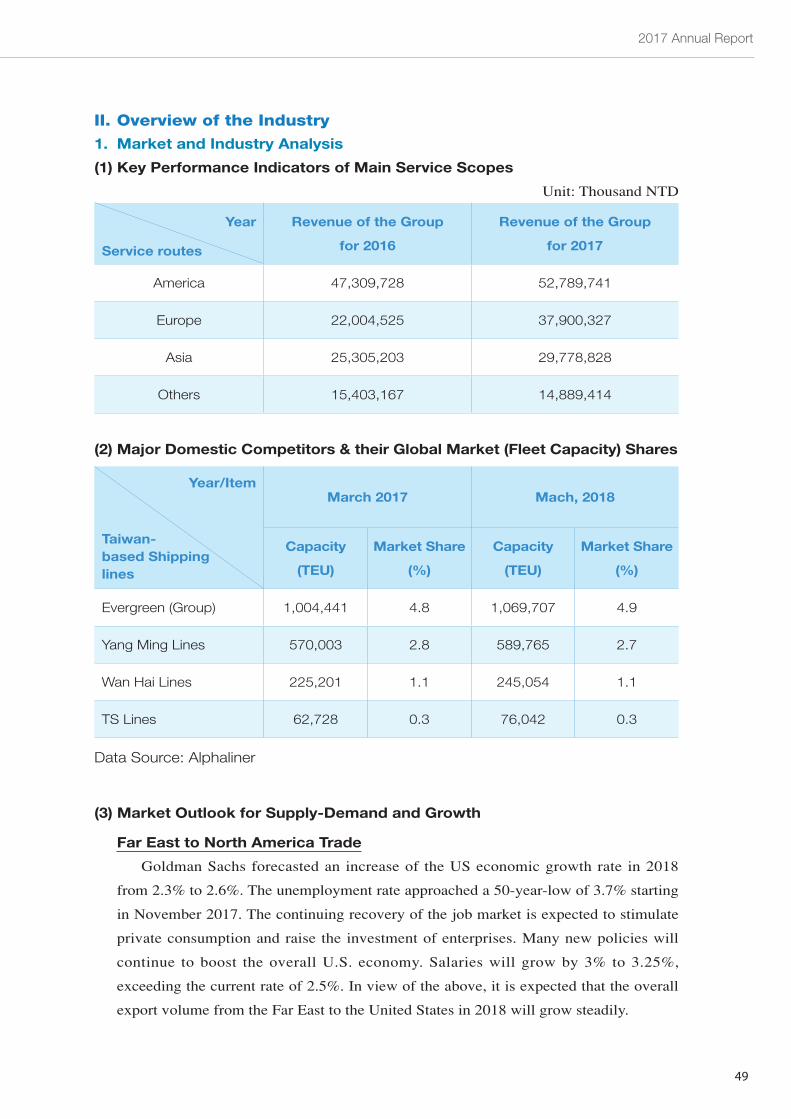
II. Overview of the Industry
1. Market and Industry Analysis
(1) Key Performance Indicators of Main Service Scopes
Unit: Thousand NTD
Year
Service routes
Revenue of the Group
for 2016
Revenue of the Group
for 2017
America 47,309,728 52,789,741
Europe 22,004,525 37,900,327
Asia 25,305,203 29,778,828
Others 15,403,167 14,889,414
(2) Major Domestic Competitors & their Global Market (Fleet Capacity) Shares
Year/Item
Taiwan-based Shippinglines
March 2017 Mach, 2018
Capacity
(TEU)
Market Share
(%)
Capacity
(TEU)
Market Share
(%)
Evergreen (Group) 1,004,441 4.8 1,069,707 4.9
Yang Ming Lines 570,003 2.8 589,765 2.7
Wan Hai Lines 225,201 1.1 245,054 1.1
TS Lines 62,728 0.3 76,042 0.3
Data Source: Alphaliner
(3) Market Outlook for Supply-Demand and Growth
Far East to North America Trade
Goldman Sachs forecasted an increase of the US economic growth rate in 2018
from 2.3% to 2.6%. The unemployment rate approached a 50-year-low of 3.7% starting
in November 2017. The continuing recovery of the job market is expected to stimulate
private consumption and raise the investment of enterprises. Many new policies will
continue to boost the overall U.S. economy. Salaries will grow by 3% to 3.25%,
exceeding the current rate of 2.5%. In view of the above, it is expected that the overall
export volume from the Far East to the United States in 2018 will grow steadily.
50
3 Business Development Outline
North America to Far East Trade
The Global Economy is expected to maintain its growth momentum in 2018.
However, it is not likely that global trade will achieve significant growth as in 2017
since economic status is at a higher level compared to the previous year coupled with
stable international raw material prices. Furthermore, Vietnam and China government
have raised the barrier on DDGS by imposing new rules on pesticide and increased
the import tax which will limit the volume of US exports. Besides, the new policy to
control the quality of waste materials adopted by the Chinese government will further
limit US export volume since waste materials are the major export commodities from
US (small-scale businesses fail to meet relevant criteria in the field of equipment and
product quality). Since the US export trend for 2018 is conservative and the market
capacity supply continues to grow, the US export market will still pose a serious
challenge caused by cut-throat price competition in 2018.
Far East to Europe/Mediterranean Trade
Against the backdrop of a major reshuffling to form 3 major alliances and
European/ Mediterranean economic recovery, the overall capacity supply increased by
4.5%, while cargo volume increased by 6%. Consequently, ocean freight rates returned
to reasonable and profitable levels. However, starting from September, the Chinese
government adopted tougher environmental policies that caused market trends to
slightly drop in Q4. In view of 2018 market outlook, overall market capacity in Europe/
Mediterranean trade is expected to increase by 6%. Major carriers including Evergreen
will commission 20K TEU Ultra Large Container Ships. In view of the above,
competitive pressures in the market are expected to persist in 2018.
Europe to Far East Trade
After China adjusted the regulations governing waste cargos, the main commodity
(waste goods) exported from Europe is predicted to decline by 30% and allocated to
alternative routes. Export cargo quantities from Europe are predicted to slightly increase
by 3.8%. Ocean Alliance will adjust certain routes and calling ports in May 2018 in
order to offer stable and exceptional service for our customers.
Europe to North America Trade
According to Datamyne, Alphaliner and Drewry reports, fleet capacity of
Transatlantic Westbound market increased by 11.3% in 2017 while total demand
increased by 3.6% only. The average revenue suffered from downward adjustments.
Starting in the 2nd year of Ocean Alliance, Evergreen service will be more competitive
with faster T/S time and expanded port coverage on the U.S. East Coast side with the
aim to provide efficient and reliable services.
Far East – Mexico/South America West Coast Market
The capacity of WSA/WSA2 was enlarged in 2017. Starting from the second
2017 Annual Report
51
quarter of 2017, ocean freight and cargo volume increased. The services of carriers will
be reshuffled in the second quarter of 2018 due to consolidation trends. As long as the
market supply remains balanced, our revenue is expected to grow.
Far East – Panama/Caribbean Market
As for the Caribbean Market in 2017, the economy of major countries is stably
growing along with increasing cargo sources and improved revenue, except for
Venezuela which still reeled from political and economic chaos. IMF forecasts that
Panama and other major Caribbean countries will maintain a positive growth rate of 5%
and increasing cargo volume and revenue.
Far East to East Coast South America
In 2017, the annual loading factor and the rate level reached a new high benefitted
from the balance of supply and demand. The revenue also increased substantially due
to appropriate addition of extra loader. The economic growth in Brazil, Argentina,
Uruguay, and Paraguay in 2018 is expected to rise by roughly 3% according to forecasts
by IMF. The bullish market of 2017 on the east coast of South America is expected to
continue in 2018.
Far East to Africa Trade
The South African economy gradually picked up steam, currency value was stable,
and purchasing power was restored in 2017 compared to 2016. IMF forecasts that
South Africa's GDP in 2018 will be 1.1% higher than in the previous year and the
market is expected to continue its development. Export volume to East Africa fell short
of the target mainly due to conservative customer attitudes as a consequence of instable
political and economy situation in the wake of the presidential election in Kenya in Q4
2017. IMF has predicted a growth rate exceeding 5% in Kenya and Tanzania, and 1.1%
growth in South Africa in 2018. As a result stable growth of the overall economy and
cargo volume is expected in 2018.
Far East to Middle East/Red Sea/India Pakistan Trade
Since the Ocean Alliance commenced operations in April 2017, the service network
has been upgraded to six sailings to the Middle East and two sailings to the Red Sea per
week. The port coverage could be one of the best in the market. A review of the market
conditions of 2017 reveals a hike of the ocean freight rate level due to a peak in cargo
movements rushed out from China before Holy Ramadan. After that time, the average
rate had come down from July levels due to oversupply in capacity. In the India/
Pakistan market, the market volume and GDP exhibited strong growth, and the freight
rate level hit a five-year high because demand exceeded supply.
In 2018, the service network of the Middle East and Red Sea trade will be
maintained in the context of the Ocean Alliance’s cooperation structure. Middle Eastern
52
3 Business Development Outline
trade remained at a constant level and the coverage rate and capacity of the Far East to
Red Sea loop will be upgraded with additional calls from North/South China/Korea and
Sokhna, Egypt.
The Middle East and Red Sea market situation could be better than last year due
to gradually rising oil prices the optimistic financial prospects in 2018. However,
market supply and demand are still focal points in the future. South Asian countries are
optimistic about their GDP growth rates and the volume of goods will increase in the
near future. We will develop new Services to further expand the market share in India.
Far East to Australia trade
Due to improvements of the raw material market, the demand for imports from
Australia increased and the supply of vessel capacity was tight. The freight rate of the
Australian line approached a three-year high in the fourth quarter of 2017.
According to forecasts of the Australian Bureau of Statistics, the population of
Australia will reach 24.9 million at the end of 2018. This represents an increase of
33% compared to the level of 18.77 million in 2001. Population growth boosted the
real estate market and expanded the demand for products for domestic consumption.
Evergreen is going to up-size the vessel capacity to meet the market demand. It will
help Evergreen to further expand its market share.
Intra-Asia Trade
According to a recent IMF report, 2018 global economic activity strengthened
with an economic growth rate of 3.7%, which represents the same level as in 2017.
Asia continues to lead the global economy with its strong economic growth, with an
estimated increase of 5.5% in 2018. Among Asian countries, China's GDP growth is
the strongest with an expected increase of 6.5%, turning China into the fastest-growing
region.
As for ASEAN, including Indonesia, Malaysia, the Philippines, Thailand and
Vietnam, the overall GDP growth was 5.2%. It is expected that there will be room for
growth in the bilateral trade volume between China and ASEAN, and the trade and
logistics interactions between ASEAN countries will intensify. The outlook for Intra
Asia trade in 2018 is therefore still optimistic.
Reefer business
Population and income growth have led to an increase in consumer demand.
Besides, traditional reefer vessels have gradually declined over the years. Reefer
container volume growth is estimated at about 4.5% in the coming three years.
In Asia, demand for frozen and refrigerated cargo has increased. The main sources
of imports are fruits and vegetables, frozen meat, seafood and alcohol in North
America, Europe, and South America, meat from South America, and meat, seafood,
and fruits from India.
2017 Annual Report
53
To cope with market demand, we will place an order for construction of 3,000
reefer units, while at the same time expanding reefer traffic in Intra-Asia, India, North
and South American areas, as well as enhance Cold Treatment and CA(Controlled
Atmosphere) service to diversify cargo source and grow our reefer business.
Special equipment
Capitalizing on the global service network of Ocean Alliance, Evergreen’s special
container business kept growing in 2017 and traffic originating from the areas of China,
Taiwan and Japan accounted for 73%.
Through an increase in infrastructure investments in particular, we are targeting the
market in China and Asia. To cope with tonnage growth and market demand, Evergreen
Line plans to placean order for new special equipment to enlarge the special cargo
business, expand the market, and grasp business opportunities.
(4) A competitive niche
Innovative Thinking
The international shipping market is changing rapidly. It requires creative thinking
to make corresponding adjustments to overcome the challenges of sustainability, such
as assignment of line managers and adoption of a KPI system to monitor performance
and make necessary adjustments to make the best use of corporate assets and create
maximum revenue income.
Recognized Quality
Evergreen strives to upgrade its service quality. In addition to gaining customers’
trust and recognition, it also continues to receive international recognition and
certifications from international media agencies and organizations:
(1) Evergreen named Best Asia-Africa Shipping Line
Evergreen Line was named Best Shipping Line - Asia-Africa by the Asia Cargo
News at the 2017 Asian Freight, Logistics and Supply Chain Awards, Logistics and
Supply Chain Awards (AFLAS).
Criteria for “Supply Chain Asia Logistics Awards” selection include shipment
accuracy, efficiency of information systems, and the convenience of customer
service system. Winners were selected by the readers of Asia Cargo News Global
Reader Vote, rather than a jury composed of the industry experts. This award is
therefore particularly significant as it signals a vote of confidence in the carrier's
efforts to provide shippers with quality services.
(2) Evergreen honored with E-Commerce Excellence Award for three consecutive
years
The company was awarded the "E-Commerce Excellence Award" by LOG NET,
a professional logistics information management agency. From 2014 to 2016,
Evergreen won this prestigious award three consecutive times. Founded in 1991,
54
3 Business Development Outline
LOG NET is headquartered in New Jersey, USA, and is the leading brand for
logistics integrated information services. The company has held annual e-commerce
service evaluations since 2003 to recognize the outstanding performance of logistics
and transportation companies in information systems and e-commerce solutions.
Although the market situation and operational pressures in 2016 had a significant
impact on the overall e-commerce capabilities of the maritime industry, the
company still maintained consistently excellent performance and insisted on the
quality of its services. Evergreen Global Information System provides electronic
data services including the establishment of customer information, information
integrity, immediacy, accuracy, and various functions of information platforms in
different regions. It also provides more than ten types of regionalized webpages in
line with regional language and information needs to make it easier for customers
to arrange their shipments online, and keep track of their progress and related
information.
E-Commerce
E-commerce is an important link of modern transportation services. Evergreen
has been relentless in its pursuit of quality service and as early as in 2001. Evergreen
launched of its E-commerce web site ShipmentLink.com to provide global customers
with more real-time, more convenient and more eco-friendly services.
E-commerce has flourished in recent years due to increased transport demand
derived from many small and medium-sized enterprises as a result of the expansion of
business opportunities through E-commerce platforms. In view of the need for user-
friendly logistics services of smaller volume shippers, Evergreen Line is collaborating
with Alibaba.com to allow shippers to search for freight rates and reserve cargo space
on the Alibaba.com platform directly. This revolutionary booking service that be
available primarily to suppliers in China. Once a booking is confirmed, selected price
and capacity are also locked-in. In coordination with the supply chain management
services of Evergreen logistics, we provide customers with more convenient services.
Eco-Friendliness
Pursuant to the requirements set forth in Airborne Toxic Control Measure for
Auxiliary Diesel Engines operated on Ocean-Going Vessels At-Berth in a California
Port approved by California Air Resource Board (CARB), the Company fleet’s use of
shore electricity and emission reductions are required to be at least 70% effective as of
January 1, 2017.
The Company actively participates in the ship deceleration plan led by the
National Oceanic and Atmospheric Administration (NOAA). The initiative was
aimed at reducing greenhouse gas emissions of vessels and avoiding whale collisions
by encouraging slow sailing speeds in California's Santa Barbara Channel region.
2017 Annual Report
55
Evergreen Line has received recognition for its excellent performance in a voluntary
environmental and ecological protection program. In addition, the company will
implement the concept of environmental protection in fleet planning, use the most
advanced shipbuilding technology and equipment, and build an eco-friendly fleet.
Ships participating in the Santa Barbara Water Speed Deceleration Plan include the
eco-friendly S-type ship that won the Lloyd's Register “Best Ship Award of the Year”
in the UK and the new-generation eco-friendly L-type ship that has been delivered and
commissioned in recent years. The goal is to contribute to the sustainable development
of transportation services and protection of the marine environment that international
trade relies on through high-quality services.
(5) Advantages, Disadvantages and Response Strategies for Future Development
Advantages
(1) Shipping mergers and acquisitions continued to be carried out and the industry
concentration was further enhanced.
(2) Carriers reap the benefits of cost reduction and cooperation by joining alliances.
(3) The South Asia market is flourishing.
(4) The cargo volume of emerging economies is growing.
(5) The expansion of the Panama Canal in 2016 and the raising of the height of the
New York-Brazil Bridge have been completed. Thus, 14,000 TEU vessels are able
to pass through the Panama Canal to the East Coast. Carriers can benefit from the
use of large vessels to reduce operating unit costs.
(6) The Chinese “One Belt One Road initiative” invites investment, promotes the
smooth flow of goods, and facilitates the development of shipping industry.
Disadvantages
(1) With many countries turning their attention to the domestic economy and a rising
trend of protectionism, the pace of global economic and trade development may be
curbed, further exacerbating political risks and affecting the shipping industry.
(2) 20,000 TEU ships are successively deployed into Asia-European route. Thus, the
14,000 TEU ships originally deployed in this area are redeployed to the Asia- North
American East Coast and other routes where smaller ships are used, causing excess
supply in East-West and North-South routes.
(3) Soaring fuel prices increase carriers’ cost.
(4) Cyber attacks persist.
Response strategies
Facing the new normalcy of imbalanced capacity demand and supply, we adapt the
following strategies:
56
3 Business Development Outline
(1) Under the premise of providing customers with quality shipping services
worldwide, any options that can enhance port coverage, reduce costs, optimize the
combination of fleet investment and enhance competitiveness can be considered.
The constant provision of better service routes in the global market according to
customer’s needs is the key.
(2) Fleet renewal reduces operating costs and improves competitiveness. 28,000 TEU
of chartering and 20,000 TEU in ships will be delivered to strengthen the company
fleet network and create greater economies of scale.
(3) Management and employees in general should make every effort to reach
quantitative performance targets. KPI management will make overall operations
easier to master, analyze and adjust to ensure achievement of set targets.
(4) Establishment of a Computer Information Security Committee to regularly update
policy content and review the status of policy implementation.
2. Key usage and manufacturing process of main products
(1) Function of main products
Main Product Functions
Container ShippingGlobal transportation of standard and special containerized cargo.
(2) Manufacturing Process of Main Products
As a container shipping transportation service provider, our disclosed service string
and their adjustments provide the details for processing of our main products.
3. Status of Supply of Main Materials
Being a container shipping transportation service provider, we do not use raw
materials as manufacturers do, however we do have to use substantial fuel quantities
for transportation equipment consumption which can be deemed main materials. Except
for stable supply through cooperation with reputable vendors at major ports, we also
tactically adjust fueling port rotations in line with fuel price developments in addition
to strategic slow steaming measures for cost reduction.
4. Main customers who account for over 10% of total sales in recent 2
years and their individual purchase amounts and share: None.
5. Company’s total expenses for environmental protection in 2017
In 2017, no major environmental pollution incidents occurred in our fleets,
and there were no losses or penalties incurred. Expenses were simply for routine
2017 Annual Report
57
maintenance of equipment, and additional costs for use of low pollutant fuels. Expense
details are listed below:
(1) The cost of maintenance and parts for environmental protection equipment, shore
power systems and SOx Scrubber amounted to USD 5,722,373.89.
(2) The cost for vessels using low-sulfur fuel for M/E, Generator Engine and Aux.
boiler while sailing in emission control areas to comply with IMO regulations &
CARB requirements of the US west coast amounted to USD 35,076,897.19.
(3) The cost for vessels M/E, Generator and Aux. Boiler using Marine Gas oil when
berthing at EU ports and using low-sulfur fuel oil while sailing in emission control
areas amounted to USD 17,089,108.30.
6. Environmental protection policies and measures
The Company has formulated environmental protection policies to safeguard our
marine environments. We continuously upgrade our shipboard equipment to reduce
air pollution emissions and manage our own fleets with requirements exceeding
international regulations. The Company is currently undertaking the following measures
for environmental protection:
(1) In compliance with the California Air Resources Board (CARB) regulation, fleet
vessels sailing through the West Coast of U.S., within 24 nautical miles of the
California baseline should use Marine Gas Oil for M/E, Generator Engines and
Aux. Boiler.
(2) Implementation of strict audits and corrective action for fleet and advance
preparations in order to prevent deficiencies and pollution.
(3) All seafarers are provided with accurate environmental awareness and knowledge
through comprehensive environmental training programs.
(4) Maintenance of all environmental equipment on board to ensure smooth crew
operations.
(5) Continuous monitoring of the operating condition of vessel’s main engine and
auxiliary machineries. Adoption of necessary actions in a prompt manner to
increase fuel usage efficiency and thereby reach the goal of energy conservation and
carbon emission reduction.
(6) Maintenance of the validity of statutory certificates such as International Oil
Pollution Prevention (IOPP), International Air Pollution Prevention (IAPP) and
International Sewage Pollution Prevention (ISPP) for all vessels.
(7) Continuous signing up for GARD Protection and Indemnity (GARD P&I)
insurance.
(8) Provision of the Vessel Certificate of Financial Responsibility (COFR) for all
vessels sailing to United States to undertake relevant responsibilities and obligations
if oil pollution occurs in US water.
58
3 Business Development Outline
(9) Carrying out of M/E turbocharger cut-out operation in coordination with vessel’s
slow steaming in order to reduce fuel oil consumption and GHG emission.
(10) Close scrutiny of the development of international regulations for environmental
protection. Compliance with new regulations allows the fleet to meet the
requirements for environmental protection in ports and around the world.
(11) The maximum allowable Sulphur content of fuel oil used by ships at berth in EU
port shall not exceed 0.1 % m/m after January 1, 2010.
(12) For all ocean-going vessels entering the Emission Control Area (Baltic Sea, North
Sea and the English Channel, North America) sulphur content of fuel oil used on
board ships shall not exceed 0.1 % m/m after January 1, 2015.
(13) All ocean-going vessels use cleaner fuel (the Sulphur content shall not exceed 0.5
% m/m) while at berth in Hong Kong waters with effect from July 1, 2015.
(14) Vessels berthing at any ports within the emission control areas of Pearl River
Delta, the Yangtze River Delta are required to use fuel oils whose sulphur content
does not exceed 0.5% m/m after January 1, 2017.
(15) North Atlantic Right Whale Seasonal Speed Restrictions are in effect. Restrictions
imposed by the NOAA require vessels to proceed at 10 knots or less in restricted
areas during specific times of the year (from Nov. to Apr.) in the Mid-Atlantic
and Southeast U.S. Seasonal Management Areas (SMAs) of the U.S. East Coast.
Vessels are allowed to operate at speeds greater than 10 knots, if necessary
to maintain a safe maneuvering speed in areas where conditions are severely
restricting ship maneuverability. Any deviation from the speed restriction should
be entered in the logbook.
(16) Commissioning of AMP system and use shore power for all E -Type, S-Type and
L-Type vessels berthing at ports of USLAX, USOKL. And connection to the Cold
Ironing running berthing at ports of CNXGA, CNSHG, CNNBO, CNXSM and
CNYYT & CNXHK.
(17) Evergreen Line has been recognized for its excellent performance in a voluntary
environmental and ecological protection program. The initiative was aimed at
reducing greenhouse gas emissions of vessels and avoiding whale collisions by
encouraging slow sailing speeds in California's Santa Barbara Channel region.
(18) In line with the EU MRV regulation, Evergreen has established a monitoring plan.
All ships above 5,000 gross tonnage that have called at EU ports from January
1, 2018, should collect and report CO2 emissions information annually for
verification.
7. New international environmental protection regulations
(1) Starting from January 1, 2018, the vessels above 5,000 gross tonnage berthed at all
the ports in the controlled waters of the Pearl River Delta, Yangtze River Delta and
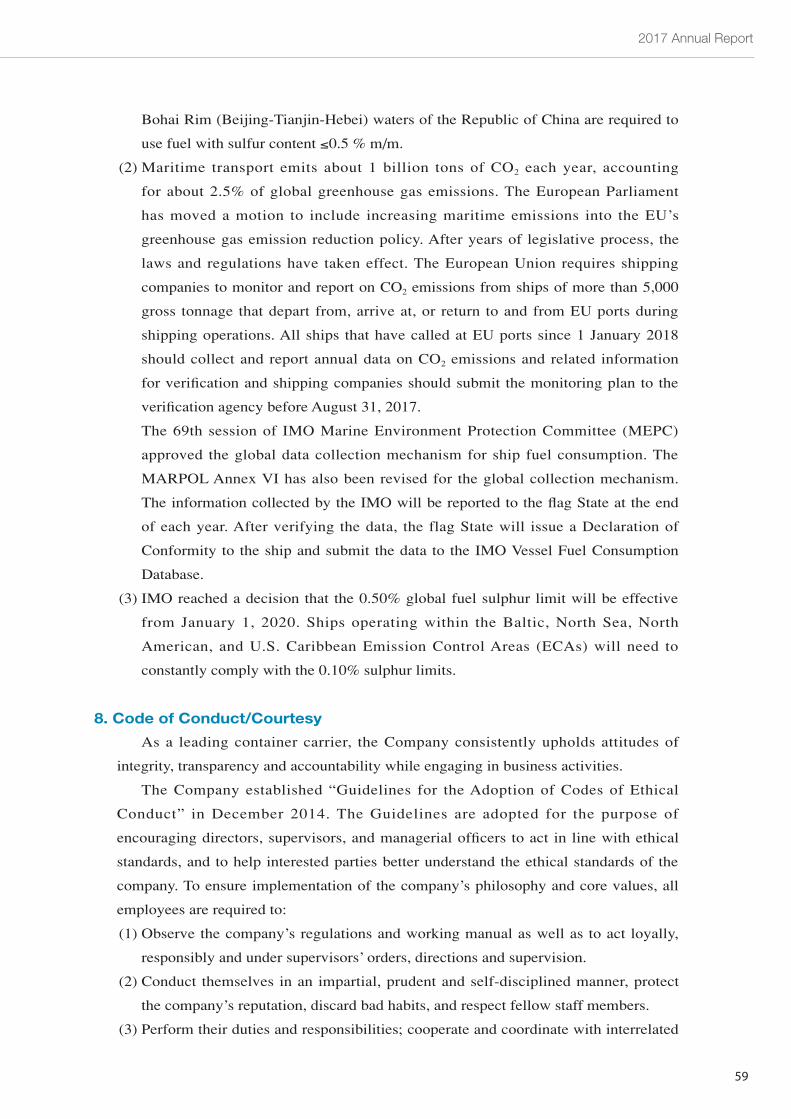
2017 Annual Report
59
Bohai Rim (Beijing-Tianjin-Hebei) waters of the Republic of China are required to
use fuel with sulfur content ≤0.5 % m/m.
(2) Maritime transport emits about 1 billion tons of CO2 each year, accounting
for about 2.5% of global greenhouse gas emissions. The European Parliament
has moved a motion to include increasing maritime emissions into the EU’s
greenhouse gas emission reduction policy. After years of legislative process, the
laws and regulations have taken effect. The European Union requires shipping
companies to monitor and report on CO2 emissions from ships of more than 5,000
gross tonnage that depart from, arrive at, or return to and from EU ports during
shipping operations. All ships that have called at EU ports since 1 January 2018
should collect and report annual data on CO2 emissions and related information
for verification and shipping companies should submit the monitoring plan to the
verification agency before August 31, 2017.
The 69th session of IMO Marine Environment Protection Committee (MEPC)
approved the global data collection mechanism for ship fuel consumption. The
MARPOL Annex VI has also been revised for the global collection mechanism.
The information collected by the IMO will be reported to the flag State at the end
of each year. After verifying the data, the flag State will issue a Declaration of
Conformity to the ship and submit the data to the IMO Vessel Fuel Consumption
Database.
(3) IMO reached a decision that the 0.50% global fuel sulphur limit will be effective
from January 1, 2020. Ships operating within the Baltic, North Sea, North
American, and U.S. Caribbean Emission Control Areas (ECAs) will need to
constantly comply with the 0.10% sulphur limits.
8. Code of Conduct/Courtesy
As a leading container carrier, the Company consistently upholds attitudes of
integrity, transparency and accountability while engaging in business activities.
The Company established “Guidelines for the Adoption of Codes of Ethical
Conduct” in December 2014. The Guidelines are adopted for the purpose of
encouraging directors, supervisors, and managerial officers to act in line with ethical
standards, and to help interested parties better understand the ethical standards of the
company. To ensure implementation of the company’s philosophy and core values, all
employees are required to:
(1) Observe the company’s regulations and working manual as well as to act loyally,
responsibly and under supervisors’ orders, directions and supervision.
(2) Conduct themselves in an impartial, prudent and self-disciplined manner, protect
the company’s reputation, discard bad habits, and respect fellow staff members.
(3) Perform their duties and responsibilities; cooperate and coordinate with interrelated
60
3 Business Development Outline
departments to achieve goals set by the company.
(4) Commit to performing all services in a conscientious without any practices that
could be construed as bribery and/or corruption.
(5) Strictly Refrain from discriminating against any employee, contractor or customer.
(6) Comply with any and all competition law regimes that are relevant to their countries
of operation.
9. Protection Measures for Safe Work Environment and Worker Safety
The Company has set up an Occupational Safety and Health Department in
accordance with the Occupational Safety and Health Act for the purpose of enhancing
a complete occupational training mechanism and providing workers with a safe and
healthy working environment. Continuous promotion of safety and health education is
adopted to reduce the possibility of occupational accidents. The main functions of the
Occupational Safety and Health Department are described below:
(1) Employees are required to observe Safety and Health Work Rules, as the Law is
effective from its date of promulgation.
(2) Occupational Safety and Health Department is obliged to perform its duties and
abide by the Occupational Safety and Health Act, arranging safety and health
education and training for new and current employees.
(3) Regular organization of fire safety training education or drills under the Fire Service
Act.
(4) A Medical Clinic Department is established to provide periodic health examinations,
health care, and medical assistance.
(5) Security guards and an entry access control system are deployed day and night to
protect the company’s property and workers’ safety against occupational hazards.
(6) Sexual harassment is a serious legal violation. The company emphasizes its
importance and has set up a dedicated telephone and e-mail address to handle
complaints concerning sexual harassment.
10. Social Responsibility
Evergreen founder and group chairman Dr. Y.F. Chang strongly believed in giving
back to society. In 1985, he founded the Chang Yung-fa Foundation, a non-profit
organization committed to providing emergency and medical aid, promoting education
and cultural exchange, as well as elevating moral standards for three decades.
Among its milestones are the formation of the Evergreen Symphony Orchestra and
the launch of Morals Monthly, a magazine distributed free of charge with a monthly
circulation of around 360,000 copies in more than 30 countries. The Foundation also
operates the Evergreen Maritime Museum, an institution dedicated to the preservation
of maritime heritage and promotion of maritime education.
2017 Annual Report
61
Evergreen has also worked closely with maritime schools in Taiwan to support
marine education.
In November 2013, Typhoon Haiyan devastated the central region of the
Philippines, causing catastrophic damage. Evergreen worked with Crisis Relief
Services & Training (CREST), a non-profit Christian humanitarian organization
in Malaysia, offering free transportation services to transport relief supplies to the
affected areas.
The officers and crew of Evergreen Line’s 7,024-TEU containership EVER
SUMMIT promptly responded to a distress call and successfully rescued 16 Indian
seafarers from a sunken Panamanian tanker, BITU GULF, about 40 nautical miles off
the coast of Vietnam in the South China Sea on January 20, 2014.
To celebrate the 300th anniversary of Karlsruhe, Taiwan presented the German city
with a steel cable sculpture for exhibition in a summer festival. For the purpose of art
promotion and cultural exchange, Evergreen Line sponsored the event and provided a
free transportation service for this oversized object in August, 2015. The sculpture was
created by Kang Mu-hsiang, a Taiwan artist renowned for transforming discarded items
into eye-catching artworks.
In support of the Chang Yung-fa Foundation’s efforts to promote education in
remote areas, Evergreen donated 15 secondhand high-end servers and 100 personal
computers to the Hsinchu County Education Department, providing assistance to local
schools in improving their digital teaching ability.
The company was also honored with a Corporate Social Responsibility Award
presented by Containerisation International and Lloydtional and Lloydeong-term
commitment to environmental protection, education, and social concern. The Chang
Yung-fa Foundation was recognized with a Group Excellence Award in the Arts &
Education Contribution category presented by the Ministry of Education in 2015
for its deep commitment and efforts in the fields of music education, oceanic art,
craftsmanship, and art education.
Evergreen Line voluntarily participates in Vessel Speed Reduction Program in 2017,
led by NOAA's Channel Islands National Marine Sanctuary. The company’s concrete
actions to avoid whale collisions and reduce greenhouse gas emissions of vessels has
been honored with an environmental protection award.
The officers and crew of Evergreen Line's containership EVER DIADEM joined
forces with another ship to successfully rescue thirty seafarers forced to abandon their
burning fishing vessel off the coast of Madagascar in the Indian Ocean.
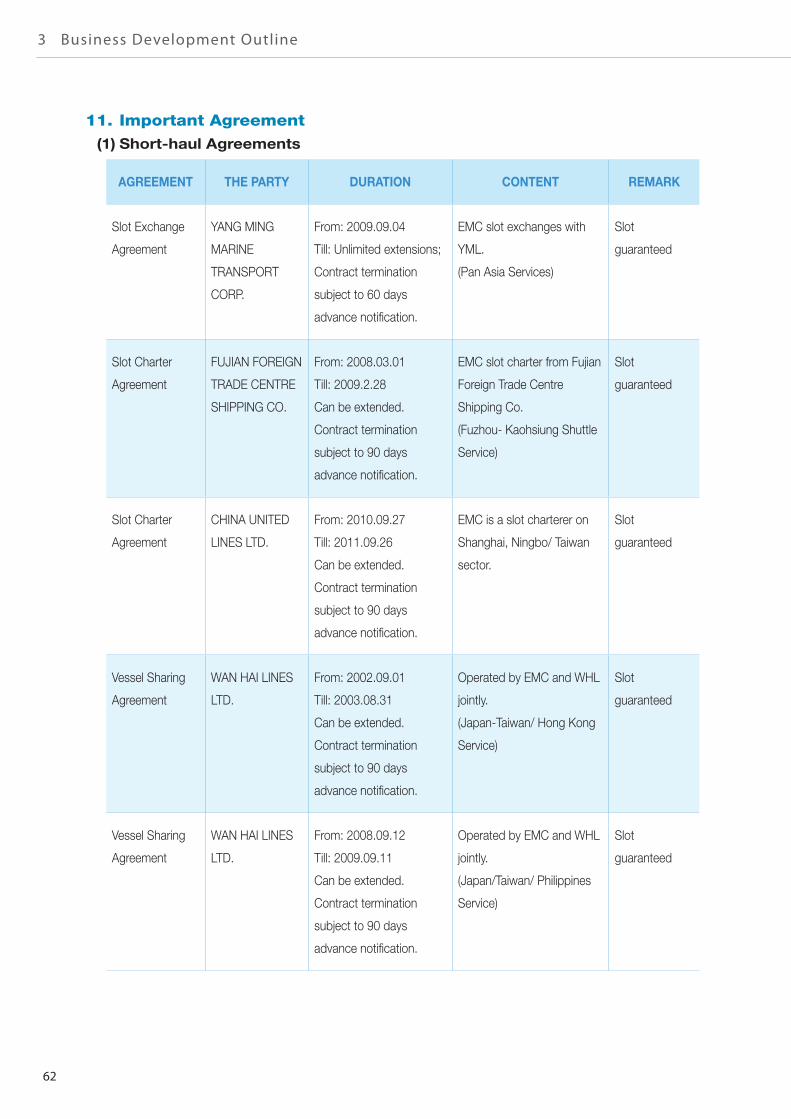
62
3 Business Development Outline
11. Important Agreement
(1) Short-haul Agreements
AGREEMENT THE PARTY DURATION CONTENT REMARK
Slot Exchange
Agreement
YANG MING
MARINE
TRANSPORT
CORP.
From: 2009.09.04
Till: Unlimited extensions;
Contract termination
subject to 60 days
advance notification.
EMC slot exchanges with
YML.
(Pan Asia Services)
Slot
guaranteed
Slot Charter
Agreement
FUJIAN FOREIGN
TRADE CENTRE
SHIPPING CO.
From: 2008.03.01
Till: 2009.2.28
Can be extended.
Contract termination
subject to 90 days
advance notification.
EMC slot charter from Fujian
Foreign Trade Centre
Shipping Co.
(Fuzhou- Kaohsiung Shuttle
Service)
Slot
guaranteed
Slot Charter
Agreement
CHINA UNITED
LINES LTD.
From: 2010.09.27
Till: 2011.09.26
Can be extended.
Contract termination
subject to 90 days
advance notification.
EMC is a slot charterer on
Shanghai, Ningbo/ Taiwan
sector.
Slot
guaranteed
Vessel Sharing
Agreement
WAN HAI LINES
LTD.
From: 2002.09.01
Till: 2003.08.31
Can be extended.
Contract termination
subject to 90 days
advance notification.
Operated by EMC and WHL
jointly.
(Japan-Taiwan/ Hong Kong
Service)
Slot
guaranteed
Vessel Sharing
Agreement
WAN HAI LINES
LTD.
From: 2008.09.12
Till: 2009.09.11
Can be extended.
Contract termination
subject to 90 days
advance notification.
Operated by EMC and WHL
jointly.
(Japan/Taiwan/ Philippines
Service)
Slot
guaranteed
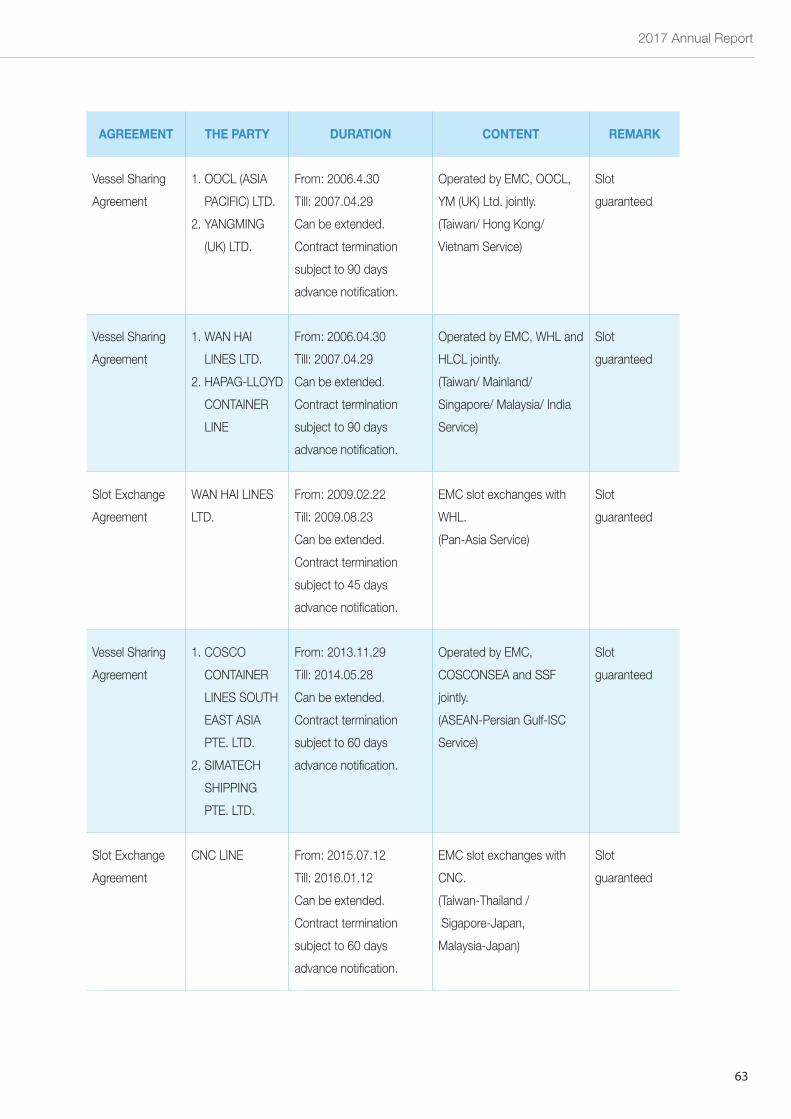
2017 Annual Report
63
AGREEMENT THE PARTY DURATION CONTENT REMARK
Vessel Sharing
Agreement
1. OOCL (ASIA
PACIFIC) LTD.
2. YANGMING
(UK) LTD.
From: 2006.4.30
Till: 2007.04.29
Can be extended.
Contract termination
subject to 90 days
advance notification.
Operated by EMC, OOCL,
YM (UK) Ltd. jointly.
(Taiwan/ Hong Kong/
Vietnam Service)
Slot
guaranteed
Vessel Sharing
Agreement
1. WAN HAI
LINES LTD.
2. HAPAG-LLOYD
CONTAINER
LINE
From: 2006.04.30
Till: 2007.04.29
Can be extended.
Contract termination
subject to 90 days
advance notification.
Operated by EMC, WHL and
HLCL jointly.
(Taiwan/ Mainland/
Singapore/ Malaysia/ India
Service)
Slot
guaranteed
Slot Exchange
Agreement
WAN HAI LINES
LTD.
From: 2009.02.22
Till: 2009.08.23
Can be extended.
Contract termination
subject to 45 days
advance notification.
EMC slot exchanges with
WHL.
(Pan-Asia Service)
Slot
guaranteed
Vessel Sharing
Agreement
1. COSCO
CONTAINER
LINES SOUTH
EAST ASIA
PTE. LTD.
2. SIMATECH
SHIPPING
PTE. LTD.
From: 2013.11.29
Till: 2014.05.28
Can be extended.
Contract termination
subject to 60 days
advance notification.
Operated by EMC,
COSCONSEA and SSF
jointly.
(ASEAN-Persian Gulf-ISC
Service)
Slot
guaranteed
Slot Exchange
Agreement
CNC LINE From: 2015.07.12
Till: 2016.01.12
Can be extended.
Contract termination
subject to 60 days
advance notification.
EMC slot exchanges with
CNC.
(Taiwan-Thailand /
Sigapore-Japan,
Malaysia-Japan)
Slot
guaranteed
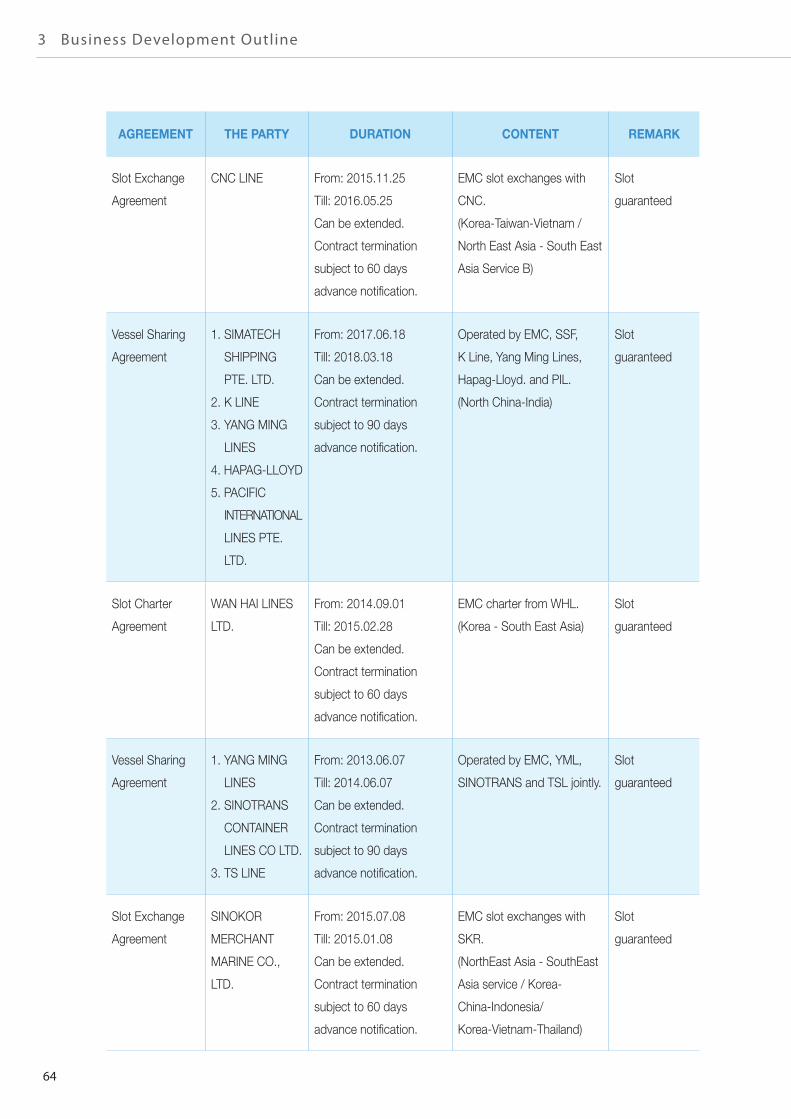
64
3 Business Development Outline
AGREEMENT THE PARTY DURATION CONTENT REMARK
Slot Exchange
Agreement
CNC LINE From: 2015.11.25
Till: 2016.05.25
Can be extended.
Contract termination
subject to 60 days
advance notification.
EMC slot exchanges with
CNC.
(Korea-Taiwan-Vietnam /
North East Asia - South East
Asia Service B)
Slot
guaranteed
Vessel Sharing
Agreement
1. SIMATECH
SHIPPING
PTE. LTD.
2. K LINE
3. YANG MING
LINES
4. HAPAG-LLOYD
5. PACIFIC
INTERNATIONAL
LINES PTE.
LTD.
From: 2017.06.18
Till: 2018.03.18
Can be extended.
Contract termination
subject to 90 days
advance notification.
Operated by EMC, SSF,
K Line, Yang Ming Lines,
Hapag-Lloyd. and PIL.
(North China-India)
Slot
guaranteed
Slot Charter
Agreement
WAN HAI LINES
LTD.
From: 2014.09.01
Till: 2015.02.28
Can be extended.
Contract termination
subject to 60 days
advance notification.
EMC charter from WHL.
(Korea - South East Asia)
Slot
guaranteed
Vessel Sharing
Agreement
1. YANG MING
LINES
2. SINOTRANS
CONTAINER
LINES CO LTD.
3. TS LINE
From: 2013.06.07
Till: 2014.06.07
Can be extended.
Contract termination
subject to 90 days
advance notification.
Operated by EMC, YML,
SINOTRANS and TSL jointly.
Slot
guaranteed
Slot Exchange
Agreement
SINOKOR
MERCHANT
MARINE CO.,
LTD.
From: 2015.07.08
Till: 2015.01.08
Can be extended.
Contract termination
subject to 60 days
advance notification.
EMC slot exchanges with
SKR.
(NorthEast Asia - SouthEast
Asia service / Korea-
China-Indonesia/
Korea-Vietnam-Thailand)
Slot
guaranteed
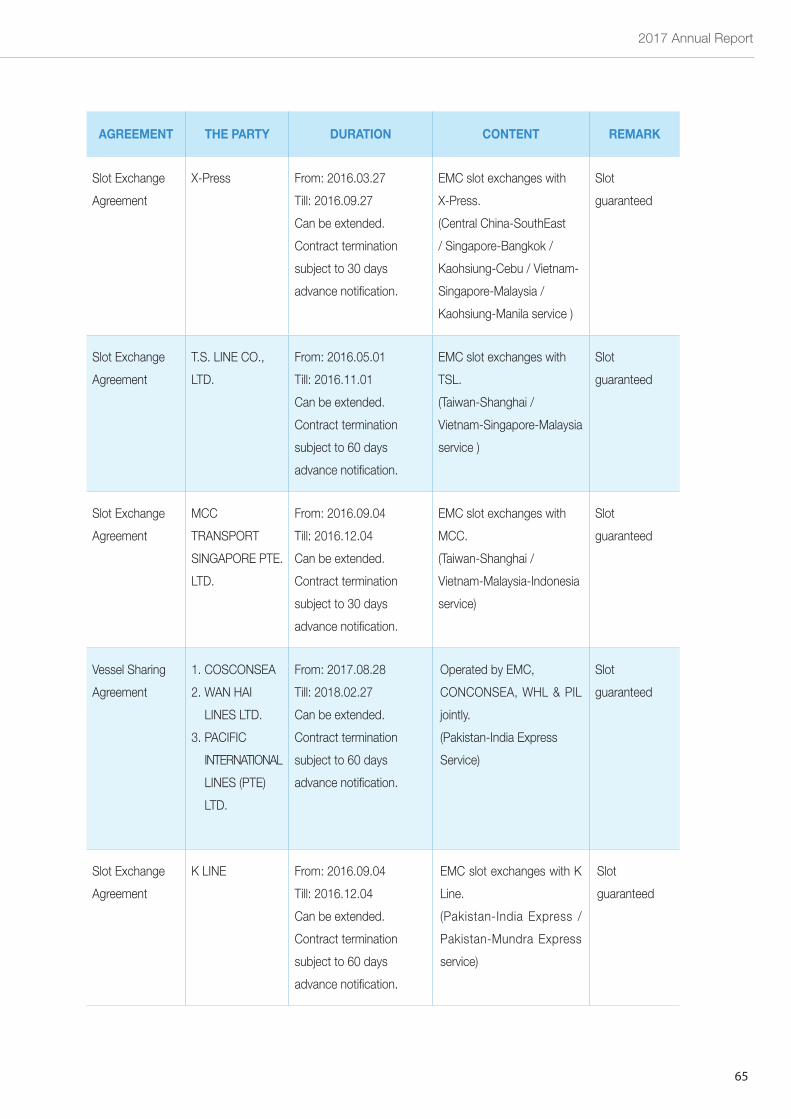
2017 Annual Report
65
AGREEMENT THE PARTY DURATION CONTENT REMARK
Slot Exchange
Agreement
X-Press From: 2016.03.27
Till: 2016.09.27
Can be extended.
Contract termination
subject to 30 days
advance notification.
EMC slot exchanges with
X-Press.
(Central China-SouthEast
/ Singapore-Bangkok /
Kaohsiung-Cebu / Vietnam-
Singapore-Malaysia /
Kaohsiung-Manila service )
Slot
guaranteed
Slot Exchange
Agreement
T.S. LINE CO.,
LTD.
From: 2016.05.01
Till: 2016.11.01
Can be extended.
Contract termination
subject to 60 days
advance notification.
EMC slot exchanges with
TSL.
(Taiwan-Shanghai /
Vietnam-Singapore-Malaysia
service )
Slot
guaranteed
Slot Exchange
Agreement
MCC
TRANSPORT
SINGAPORE PTE.
LTD.
From: 2016.09.04
Till: 2016.12.04
Can be extended.
Contract termination
subject to 30 days
advance notification.
EMC slot exchanges with
MCC.
(Taiwan-Shanghai /
Vietnam-Malaysia-Indonesia
service)
Slot
guaranteed
Vessel Sharing
Agreement
1. COSCONSEA
2. WAN HAI
LINES LTD.
3. PACIFIC
INTERNATIONAL
LINES (PTE)
LTD.
From: 2017.08.28
Till: 2018.02.27
Can be extended.
Contract termination
subject to 60 days
advance notification.
Operated by EMC,
CONCONSEA, WHL & PIL
jointly.
(Pakistan-India Express
Service)
Slot
guaranteed
Slot Exchange
Agreement
K LINE From: 2016.09.04
Till: 2016.12.04
Can be extended.
Contract termination
subject to 60 days
advance notification.
EMC slot exchanges with K
Line.
(Pakistan-India Express /
Pakistan-Mundra Express
service)
Slot
guaranteed
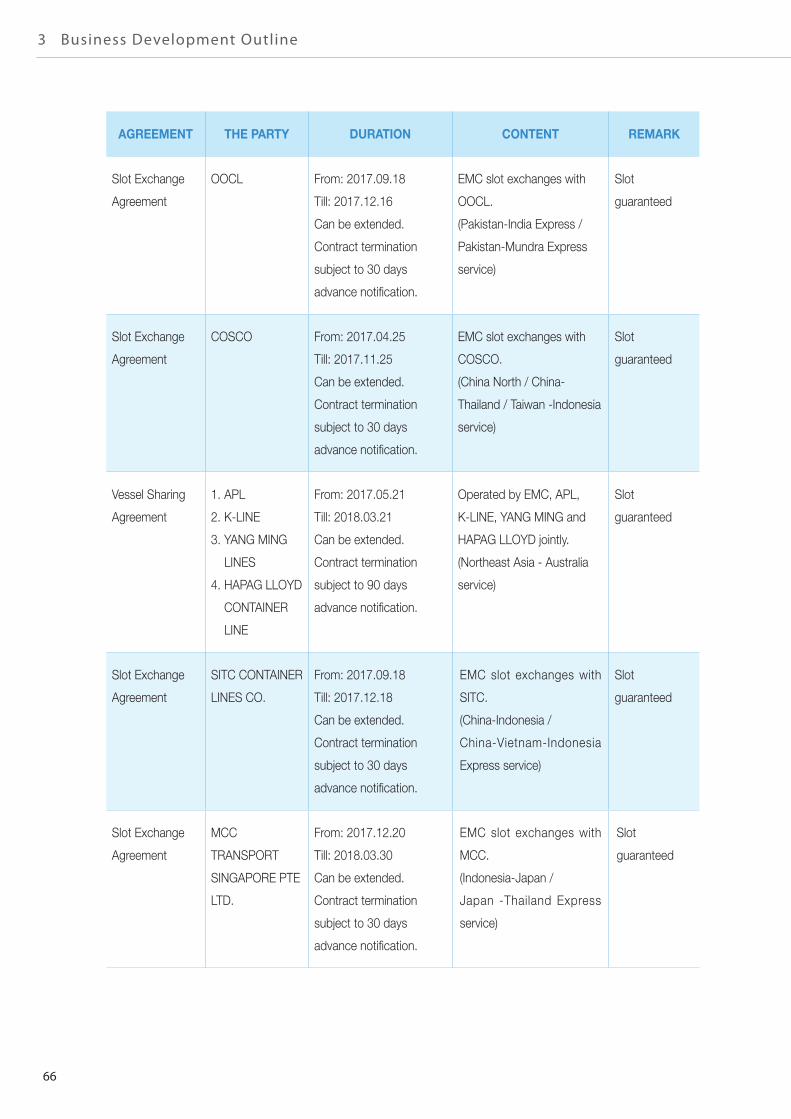
66
3 Business Development Outline
AGREEMENT THE PARTY DURATION CONTENT REMARK
Slot Exchange
Agreement
OOCL From: 2017.09.18
Till: 2017.12.16
Can be extended.
Contract termination
subject to 30 days
advance notification.
EMC slot exchanges with
OOCL.
(Pakistan-India Express /
Pakistan-Mundra Express
service)
Slot
guaranteed
Slot Exchange
Agreement
COSCO From: 2017.04.25
Till: 2017.11.25
Can be extended.
Contract termination
subject to 30 days
advance notification.
EMC slot exchanges with
COSCO.
(China North / China-
Thailand / Taiwan -Indonesia
service)
Slot
guaranteed
Vessel Sharing
Agreement
1. APL
2. K-LINE
3. YANG MING
LINES
4. HAPAG LLOYD
CONTAINER
LINE
From: 2017.05.21
Till: 2018.03.21
Can be extended.
Contract termination
subject to 90 days
advance notification.
Operated by EMC, APL,
K-LINE, YANG MING and
HAPAG LLOYD jointly.
(Northeast Asia - Australia
service)
Slot
guaranteed
Slot Exchange
Agreement
SITC CONTAINER
LINES CO.
From: 2017.09.18
Till: 2017.12.18
Can be extended.
Contract termination
subject to 30 days
advance notification.
EMC slot exchanges with
SITC.
(China-Indonesia /
China-Vietnam-Indonesia
Express service)
Slot
guaranteed
Slot Exchange
Agreement
MCC
TRANSPORT
SINGAPORE PTE
LTD.
From: 2017.12.20
Till: 2018.03.30
Can be extended.
Contract termination
subject to 30 days
advance notification.
EMC slot exchanges with
MCC.
(Indonesia-Japan /
Japan -Thailand Express
service)
Slot
guaranteed
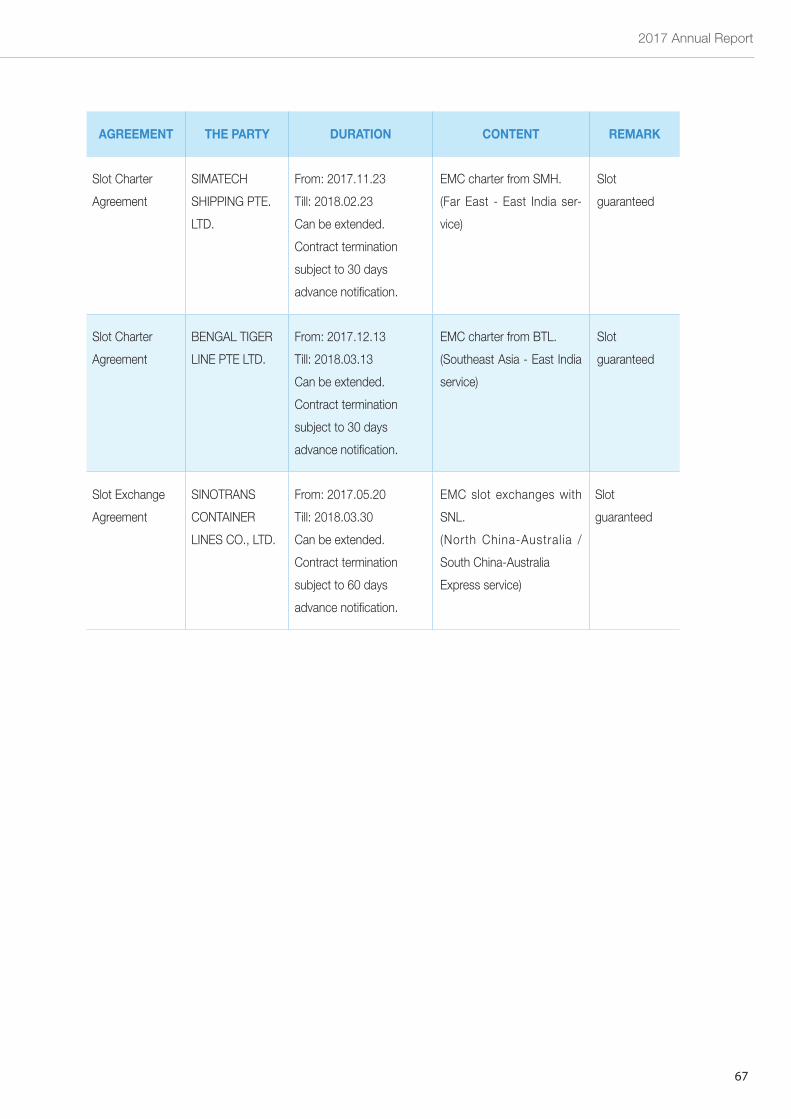
2017 Annual Report
67
AGREEMENT THE PARTY DURATION CONTENT REMARK
Slot Charter
Agreement
SIMATECH
SHIPPING PTE.
LTD.
From: 2017.11.23
Till: 2018.02.23
Can be extended.
Contract termination
subject to 30 days
advance notification.
EMC charter from SMH.
(Far East - East India ser-
vice)
Slot
guaranteed
Slot Charter
Agreement
BENGAL TIGER
LINE PTE LTD.
From: 2017.12.13
Till: 2018.03.13
Can be extended.
Contract termination
subject to 30 days
advance notification.
EMC charter from BTL.
(Southeast Asia - East India
service)
Slot
guaranteed
Slot Exchange
Agreement
SINOTRANS
CONTAINER
LINES CO., LTD.
From: 2017.05.20
Till: 2018.03.30
Can be extended.
Contract termination
subject to 60 days
advance notification.
EMC slot exchanges with
SNL.
(North China-Austral ia /
South China-Australia
Express service)
Slot
guaranteed
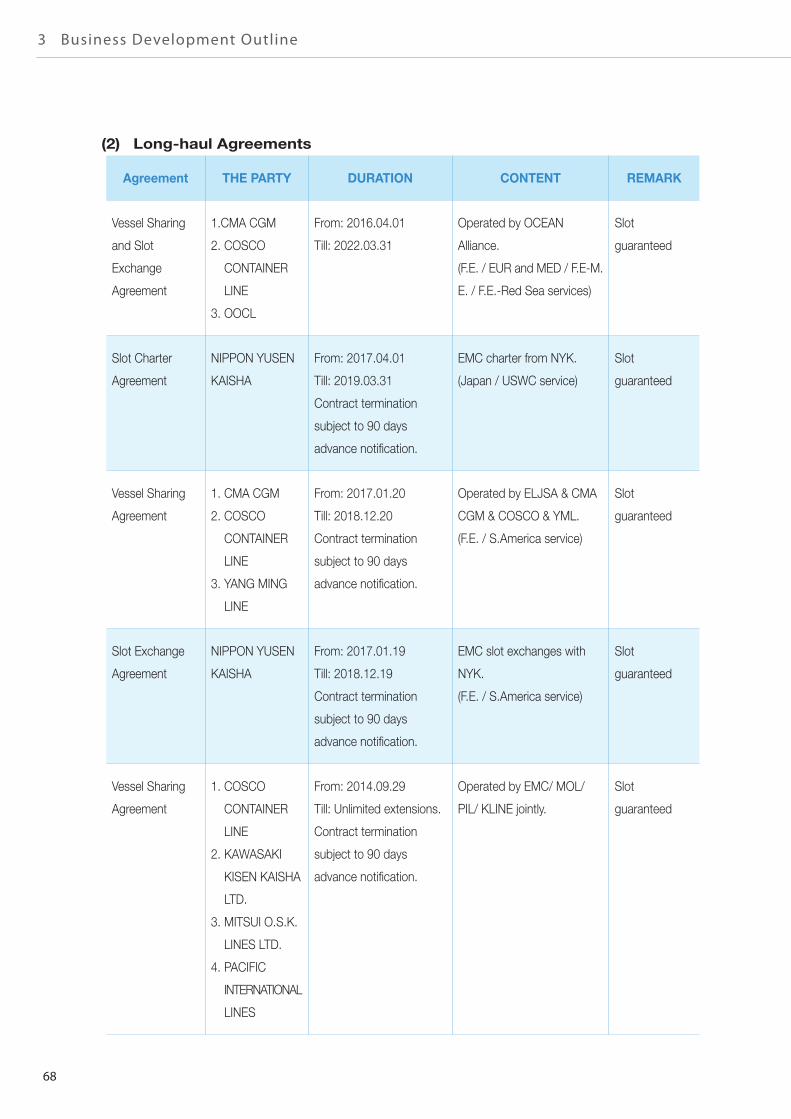
68
3 Business Development Outline
(2) Long-haul Agreements
Agreement THE PARTY DURATION CONTENT REMARK
Vessel Sharing
and Slot
Exchange
Agreement
1.CMA CGM
2. COSCO
CONTAINER
LINE
3. OOCL
From: 2016.04.01
Till: 2022.03.31
Operated by OCEAN
Alliance.
(F.E. / EUR and MED / F.E-M.
E. / F.E.-Red Sea services)
Slot
guaranteed
Slot Charter
Agreement
NIPPON YUSEN
KAISHA
From: 2017.04.01
Till: 2019.03.31
Contract termination
subject to 90 days
advance notification.
EMC charter from NYK.
(Japan / USWC service)
Slot
guaranteed
Vessel Sharing
Agreement
1. CMA CGM
2. COSCO
CONTAINER
LINE
3. YANG MING
LINE
From: 2017.01.20
Till: 2018.12.20
Contract termination
subject to 90 days
advance notification.
Operated by ELJSA & CMA
CGM & COSCO & YML.
(F.E. / S.America service)
Slot
guaranteed
Slot Exchange
Agreement
NIPPON YUSEN
KAISHA
From: 2017.01.19
Till: 2018.12.19
Contract termination
subject to 90 days
advance notification.
EMC slot exchanges with
NYK.
(F.E. / S.America service)
Slot
guaranteed
Vessel Sharing
Agreement
1. COSCO
CONTAINER
LINE
2. KAWASAKI
KISEN KAISHA
LTD.
3. MITSUI O.S.K.
LINES LTD.
4. PACIFIC
INTERNATIONAL
LINES
From: 2014.09.29
Till: Unlimited extensions.
Contract termination
subject to 90 days
advance notification.
Operated by EMC/ MOL/
PIL/ KLINE jointly.
Slot
guaranteed
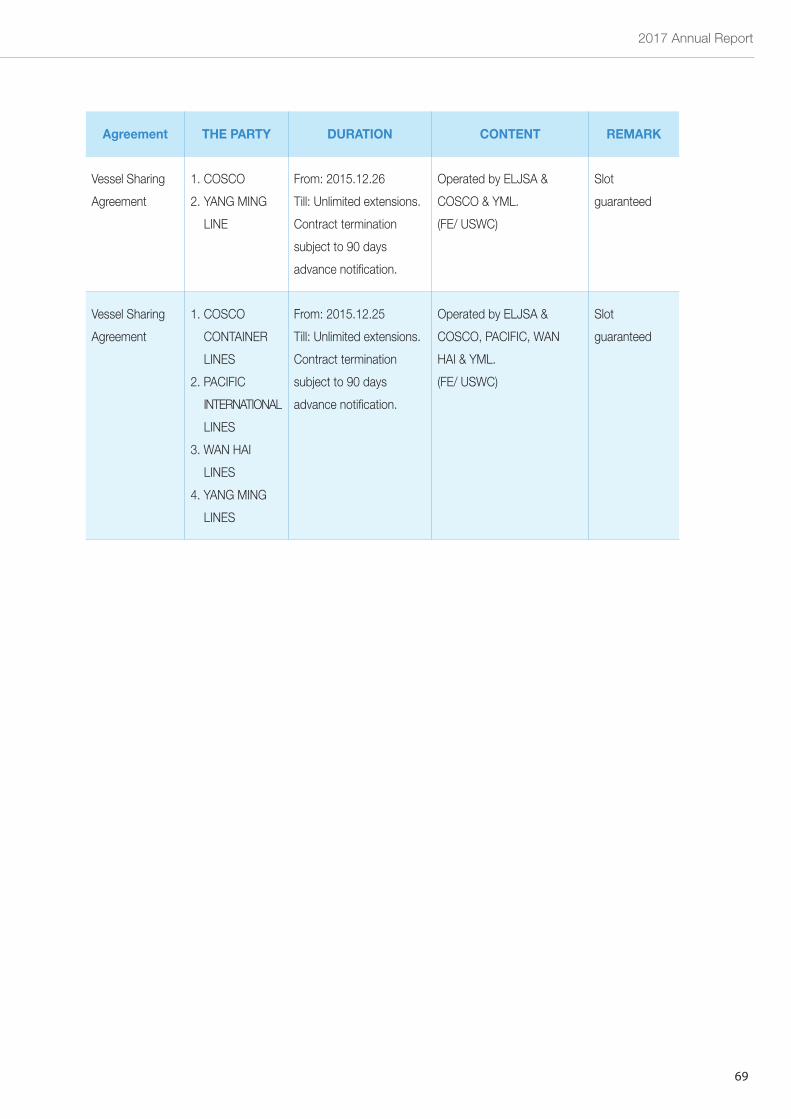
2017 Annual Report
69
Agreement THE PARTY DURATION CONTENT REMARK
Vessel Sharing
Agreement
1. COSCO
2. YANG MING
LINE
From: 2015.12.26
Till: Unlimited extensions.
Contract termination
subject to 90 days
advance notification.
Operated by ELJSA &
COSCO & YML.
(FE/ USWC)
Slot
guaranteed
Vessel Sharing
Agreement
1. COSCO
CONTAINER
LINES
2. PACIFIC
INTERNATIONAL
LINES
3. WAN HAI
LINES
4. YANG MING
LINES
From: 2015.12.25
Till: Unlimited extensions.
Contract termination
subject to 90 days
advance notification.
Operated by ELJSA &
COSCO, PACIFIC, WAN
HAI & YML.
(FE/ USWC)
Slot
guaranteed
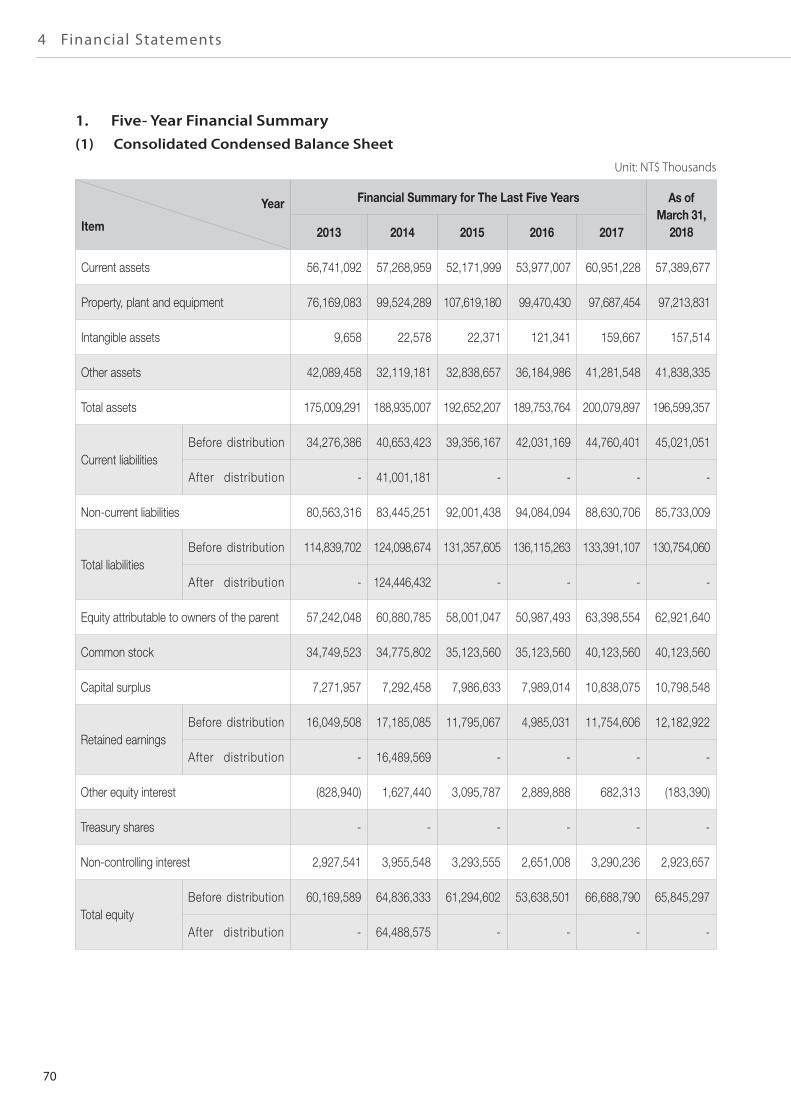
70
4 Financial Statements
1. Five- Year Financial Summary(1) Consolidated Condensed Balance Sheet
Unit: NT$ Thousands
Year
Item
Financial Summary for The Last Five Years As of March 31,
20182013 2014 2015 2016 2017
Current assets 56,741,092 57,268,959 52,171,999 53,977,007 60,951,228 57,389,677
Property, plant and equipment 76,169,083 99,524,289 107,619,180 99,470,430 97,687,454 97,213,831
Intangible assets 9,658 22,578 22,371 121,341 159,667 157,514
Other assets 42,089,458 32,119,181 32,838,657 36,184,986 41,281,548 41,838,335
Total assets 175,009,291 188,935,007 192,652,207 189,753,764 200,079,897 196,599,357
Current liabilitiesBefore distribution 34,276,386 40,653,423 39,356,167 42,031,169 44,760,401 45,021,051
After distribution - 41,001,181 - - - -
Non-current liabilities 80,563,316 83,445,251 92,001,438 94,084,094 88,630,706 85,733,009
Total liabilitiesBefore distribution 114,839,702 124,098,674 131,357,605 136,115,263 133,391,107 130,754,060
After distribution - 124,446,432 - - - -
Equity attributable to owners of the parent 57,242,048 60,880,785 58,001,047 50,987,493 63,398,554 62,921,640
Common stock 34,749,523 34,775,802 35,123,560 35,123,560 40,123,560 40,123,560
Capital surplus 7,271,957 7,292,458 7,986,633 7,989,014 10,838,075 10,798,548
Retained earningsBefore distribution 16,049,508 17,185,085 11,795,067 4,985,031 11,754,606 12,182,922
After distribution - 16,489,569 - - - -
Other equity interest (828,940) 1,627,440 3,095,787 2,889,888 682,313 (183,390)
Treasury shares - - - - - -
Non-controlling interest 2,927,541 3,955,548 3,293,555 2,651,008 3,290,236 2,923,657
Total equityBefore distribution 60,169,589 64,836,333 61,294,602 53,638,501 66,688,790 65,845,297
After distribution - 64,488,575 - - - -
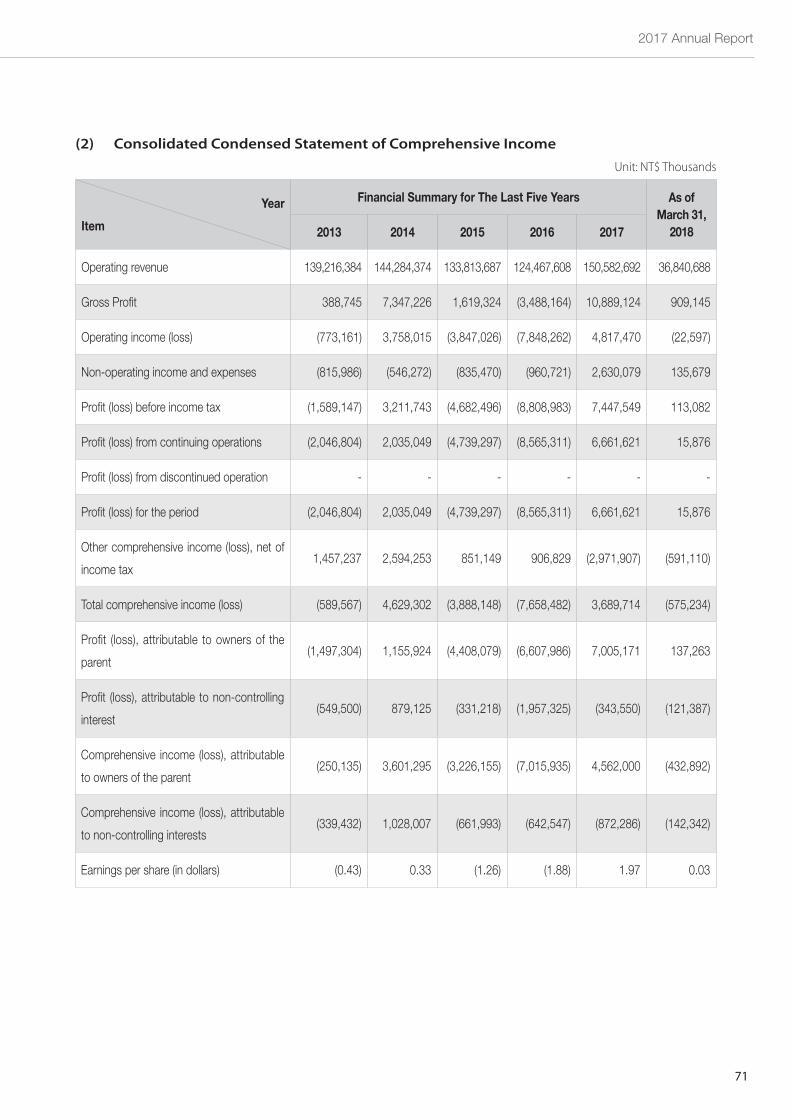
2017 Annual Report
71
(2) Consolidated Condensed Statement of Comprehensive Income
Unit: NT$ Thousands
Year
Item
Financial Summary for The Last Five Years As of March 31,
20182013 2014 2015 2016 2017
Operating revenue 139,216,384 144,284,374 133,813,687 124,467,608 150,582,692 36,840,688
Gross Profit 388,745 7,347,226 1,619,324 (3,488,164) 10,889,124 909,145
Operating income (loss) (773,161) 3,758,015 (3,847,026) (7,848,262) 4,817,470 (22,597)
Non-operating income and expenses (815,986) (546,272) (835,470) (960,721) 2,630,079 135,679
Profit (loss) before income tax (1,589,147) 3,211,743 (4,682,496) (8,808,983) 7,447,549 113,082
Profit (loss) from continuing operations (2,046,804) 2,035,049 (4,739,297) (8,565,311) 6,661,621 15,876
Profit (loss) from discontinued operation - - - - - -
Profit (loss) for the period (2,046,804) 2,035,049 (4,739,297) (8,565,311) 6,661,621 15,876
Other comprehensive income (loss), net of
income tax1,457,237 2,594,253 851,149 906,829 (2,971,907) (591,110)
Total comprehensive income (loss) (589,567) 4,629,302 (3,888,148) (7,658,482) 3,689,714 (575,234)
Profit (loss), attributable to owners of the
parent(1,497,304) 1,155,924 (4,408,079) (6,607,986) 7,005,171 137,263
Profit (loss), attributable to non-controlling
interest(549,500) 879,125 (331,218) (1,957,325) (343,550) (121,387)
Comprehensive income (loss), attributable
to owners of the parent(250,135) 3,601,295 (3,226,155) (7,015,935) 4,562,000 (432,892)
Comprehensive income (loss), attributable
to non-controlling interests(339,432) 1,028,007 (661,993) (642,547) (872,286) (142,342)
Earnings per share (in dollars) (0.43) 0.33 (1.26) (1.88) 1.97 0.03
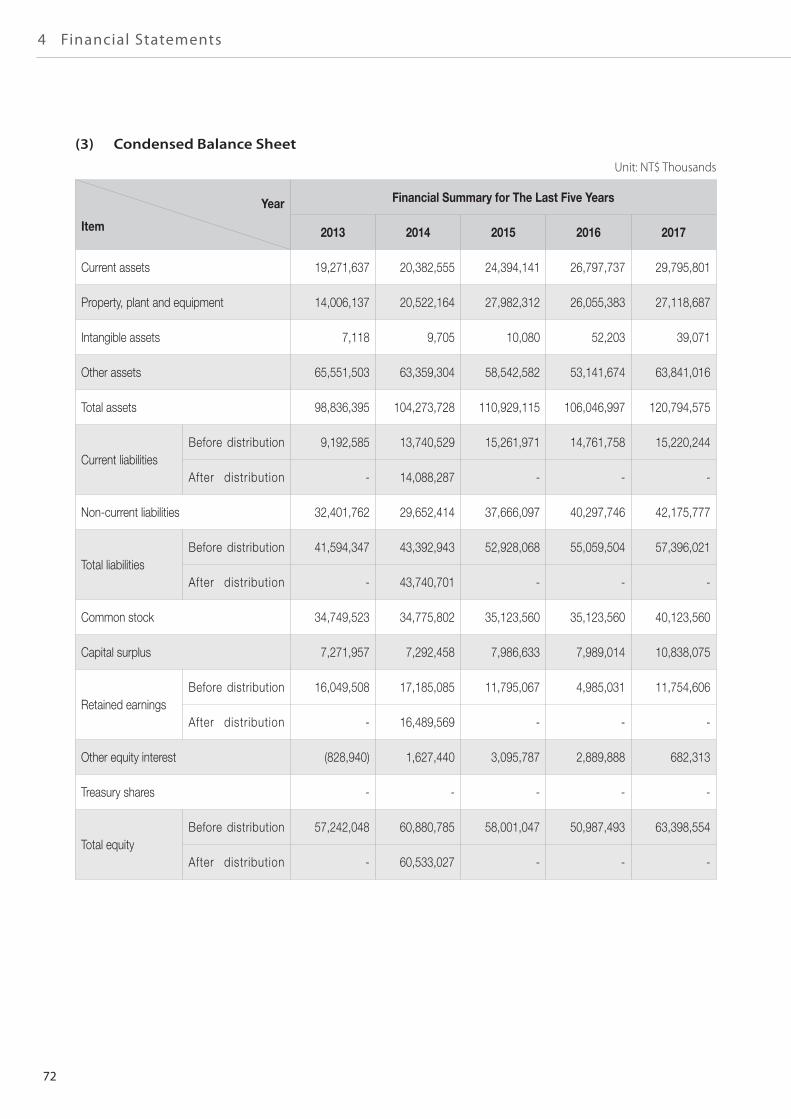
72
4 Financial Statements
(3) Condensed Balance Sheet
Unit: NT$ Thousands
Year
Item
Financial Summary for The Last Five Years
2013 2014 2015 2016 2017
Current assets 19,271,637 20,382,555 24,394,141 26,797,737 29,795,801
Property, plant and equipment 14,006,137 20,522,164 27,982,312 26,055,383 27,118,687
Intangible assets 7,118 9,705 10,080 52,203 39,071
Other assets 65,551,503 63,359,304 58,542,582 53,141,674 63,841,016
Total assets 98,836,395 104,273,728 110,929,115 106,046,997 120,794,575
Current liabilitiesBefore distribution 9,192,585 13,740,529 15,261,971 14,761,758 15,220,244
After distribution - 14,088,287 - - -
Non-current liabilities 32,401,762 29,652,414 37,666,097 40,297,746 42,175,777
Total liabilitiesBefore distribution 41,594,347 43,392,943 52,928,068 55,059,504 57,396,021
After distribution - 43,740,701 - - -
Common stock 34,749,523 34,775,802 35,123,560 35,123,560 40,123,560
Capital surplus 7,271,957 7,292,458 7,986,633 7,989,014 10,838,075
Retained earningsBefore distribution 16,049,508 17,185,085 11,795,067 4,985,031 11,754,606
After distribution - 16,489,569 - - -
Other equity interest (828,940) 1,627,440 3,095,787 2,889,888 682,313
Treasury shares - - - - -
Total equityBefore distribution 57,242,048 60,880,785 58,001,047 50,987,493 63,398,554
After distribution - 60,533,027 - - -
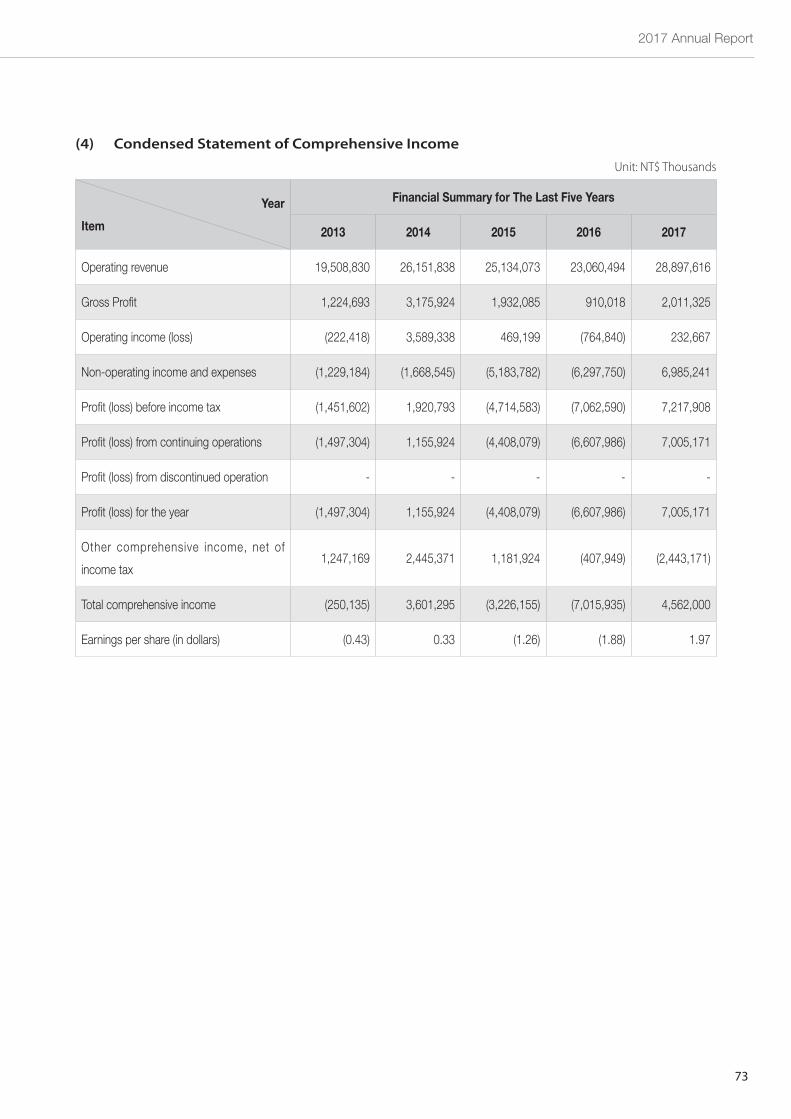
2017 Annual Report
73
(4) Condensed Statement of Comprehensive Income
Unit: NT$ Thousands
Year
Item
Financial Summary for The Last Five Years
2013 2014 2015 2016 2017
Operating revenue 19,508,830 26,151,838 25,134,073 23,060,494 28,897,616
Gross Profit 1,224,693 3,175,924 1,932,085 910,018 2,011,325
Operating income (loss) (222,418) 3,589,338 469,199 (764,840) 232,667
Non-operating income and expenses (1,229,184) (1,668,545) (5,183,782) (6,297,750) 6,985,241
Profit (loss) before income tax (1,451,602) 1,920,793 (4,714,583) (7,062,590) 7,217,908
Profit (loss) from continuing operations (1,497,304) 1,155,924 (4,408,079) (6,607,986) 7,005,171
Profit (loss) from discontinued operation - - - - -
Profit (loss) for the year (1,497,304) 1,155,924 (4,408,079) (6,607,986) 7,005,171
Other comprehensive income, net of
income tax1,247,169 2,445,371 1,181,924 (407,949) (2,443,171)
Total comprehensive income (250,135) 3,601,295 (3,226,155) (7,015,935) 4,562,000
Earnings per share (in dollars) (0.43) 0.33 (1.26) (1.88) 1.97
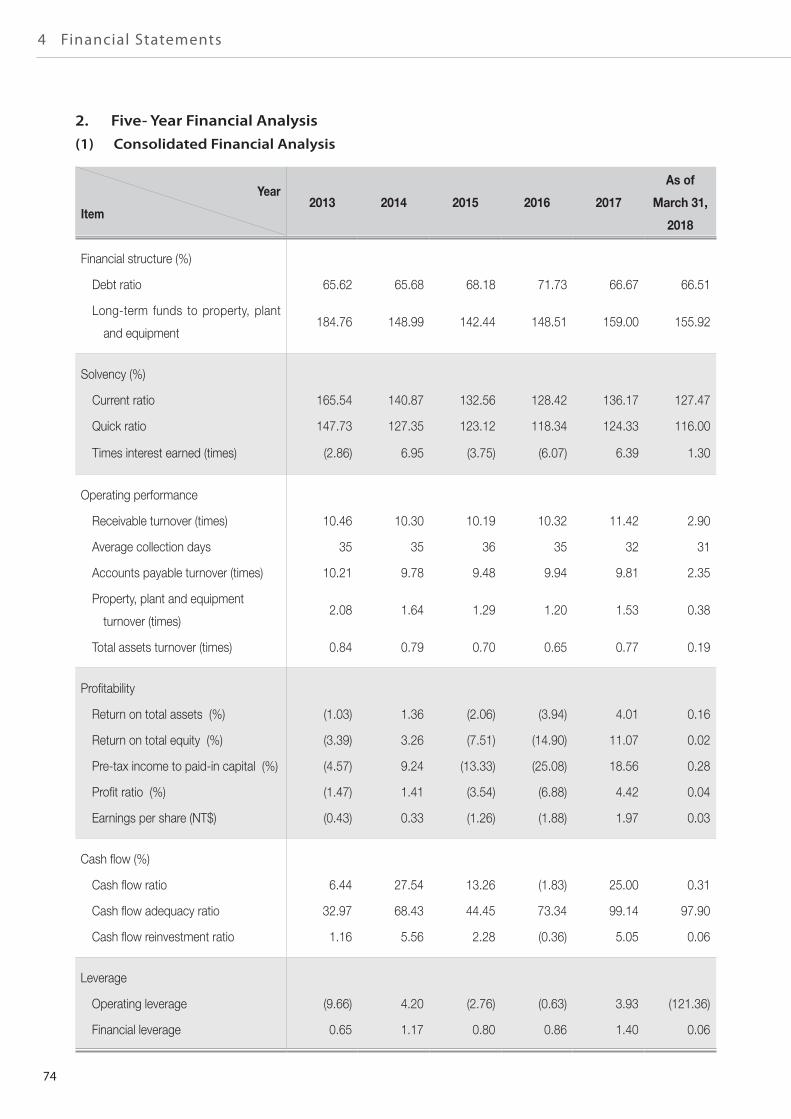
74
4 Financial Statements
2. Five- Year Financial Analysis(1) Consolidated Financial Analysis
Year
Item2013 2014 2015 2016 2017
As of
March 31,
2018
Financial structure (%)
Debt ratio 65.62 65.68 68.18 71.73 66.67 66.51
Long-term funds to property, plant
and equipment184.76 148.99 142.44 148.51 159.00 155.92
Solvency (%)
Current ratio 165.54 140.87 132.56 128.42 136.17 127.47
Quick ratio 147.73 127.35 123.12 118.34 124.33 116.00
Times interest earned (times) (2.86) 6.95 (3.75) (6.07) 6.39 1.30
Operating performance
Receivable turnover (times) 10.46 10.30 10.19 10.32 11.42 2.90
Average collection days 35 35 36 35 32 31
Accounts payable turnover (times) 10.21 9.78 9.48 9.94 9.81 2.35
Property, plant and equipment
turnover (times)2.08 1.64 1.29 1.20 1.53 0.38
Total assets turnover (times) 0.84 0.79 0.70 0.65 0.77 0.19
Profitability
Return on total assets (%) (1.03) 1.36 (2.06) (3.94) 4.01 0.16
Return on total equity (%) (3.39) 3.26 (7.51) (14.90) 11.07 0.02
Pre-tax income to paid-in capital (%) (4.57) 9.24 (13.33) (25.08) 18.56 0.28
Profit ratio (%) (1.47) 1.41 (3.54) (6.88) 4.42 0.04
Earnings per share (NT$) (0.43) 0.33 (1.26) (1.88) 1.97 0.03
Cash flow (%)
Cash flow ratio 6.44 27.54 13.26 (1.83) 25.00 0.31
Cash flow adequacy ratio 32.97 68.43 44.45 73.34 99.14 97.90
Cash flow reinvestment ratio 1.16 5.56 2.28 (0.36) 5.05 0.06
Leverage
Operating leverage (9.66) 4.20 (2.76) (0.63) 3.93 (121.36)
Financial leverage 0.65 1.17 0.80 0.86 1.40 0.06
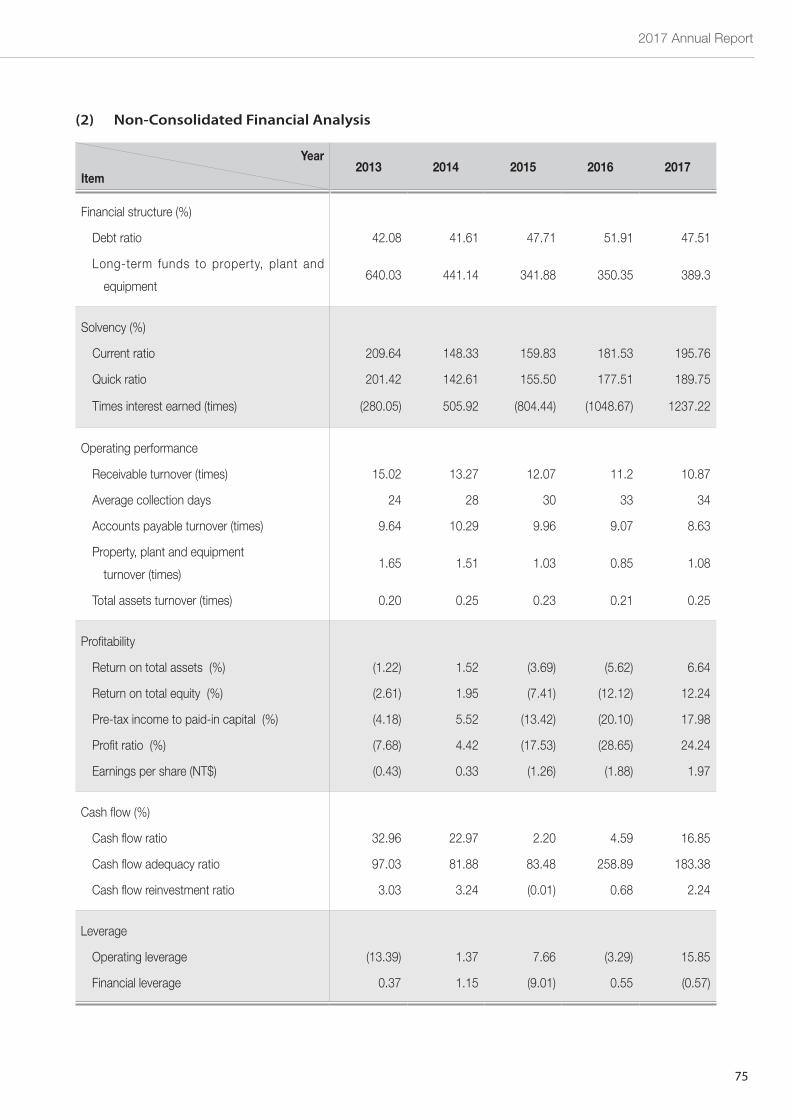
2017 Annual Report
75
(2) Non-Consolidated Financial Analysis
Year
Item2013 2014 2015 2016 2017
Financial structure (%)
Debt ratio 42.08 41.61 47.71 51.91 47.51
Long-term funds to property, plant and
equipment640.03 441.14 341.88 350.35 389.3
Solvency (%)
Current ratio 209.64 148.33 159.83 181.53 195.76
Quick ratio 201.42 142.61 155.50 177.51 189.75
Times interest earned (times) (280.05) 505.92 (804.44) (1048.67) 1237.22
Operating performance
Receivable turnover (times) 15.02 13.27 12.07 11.2 10.87
Average collection days 24 28 30 33 34
Accounts payable turnover (times) 9.64 10.29 9.96 9.07 8.63
Property, plant and equipment
turnover (times)1.65 1.51 1.03 0.85 1.08
Total assets turnover (times) 0.20 0.25 0.23 0.21 0.25
Profitability
Return on total assets (%) (1.22) 1.52 (3.69) (5.62) 6.64
Return on total equity (%) (2.61) 1.95 (7.41) (12.12) 12.24
Pre-tax income to paid-in capital (%) (4.18) 5.52 (13.42) (20.10) 17.98
Profit ratio (%) (7.68) 4.42 (17.53) (28.65) 24.24
Earnings per share (NT$) (0.43) 0.33 (1.26) (1.88) 1.97
Cash flow (%)
Cash flow ratio 32.96 22.97 2.20 4.59 16.85
Cash flow adequacy ratio 97.03 81.88 83.48 258.89 183.38
Cash flow reinvestment ratio 3.03 3.24 (0.01) 0.68 2.24
Leverage
Operating leverage (13.39) 1.37 7.66 (3.29) 15.85
Financial leverage 0.37 1.15 (9.01) 0.55 (0.57)
76
4 Financial Statements
~1~
REPORT OF INDEPENDENT ACCOUNTANTS TRANSLATED FROM CHINESE
To the Board of Directors and Shareholders of Evergreen Marine Corporation (Taiwan) Ltd.
OpinionWe have audited the accompanying consolidated balance sheets of Evergreen Marine Corporation(Taiwan) Ltd. (the“ Company”) and its subsidiaries (collectively referred herein as the “Group”) as ofDecember 31, 2017 and 2016, and the related consolidated statements of comprehensive income, ofchanges in equity and of cash flows for the years then ended, and a summary of the significant accountingpolicies and other explanatory information.
In our opinion, based on our audits and the reports of other independent accountants (please refer toOther Matter section of the report), the accompanying consolidated financial statements present fairly,in all material respects, the financial position of the Group as of December 31, 2017 and 2016, and itsfinancial performance and cash flows for the years then ended in accordance with the “RegulationsGoverning the Preparations of Financial Reports by Securities Issuers” and the International FinancialReporting Standards, International Accounting Standards, IFRIC Interpretations, and SIC Interpretationsas endorsed by the Financial Supervisory Commission.
Basis for opinionWe conducted our audits in accordance with the “Regulations Governing Auditing and Attestation ofFinancial Statements by Certified Public Accountants” and generally accepted auditing standards in theRepublic of China (ROC GAAS). Our responsibilities under those standards are further described in theAuditor’s Responsibilities for the Audit of the Consolidated Financial Statements section of our report.We are independent of the Group in accordance with the Code of Professional Ethics for Certified PublicAccountants in the Republic of China (the “Code”), and we have fulfilled our other ethicalresponsibilities in accordance with the Code. We believe that the audit evidence we have obtained andthe reports of other independent accountants are sufficient and appropriate to provide a basis for ouropinion.
Key audit mattersKey audit matters are those matters that, in our professional judgement, were of most significance in ouraudit of the financial statements of the current period. These matters were addressed in the context ofour audit of the financial statements as a whole and, in forming our opinion thereon, we do not provide
3. Consolidated Financial Statements and Report of Independent Accountants
2017 Annual Report
77
~2~
a separate opinion on these matters.The key audit matters of the Group’s consolidated financial statements for the year ended December 31,2017 are as follows:
Accuracy of freight revenue
DescriptionPlease refer to Note 4(31) for accounting policies on revenue recognition, Note 5(2) for uncertainty ofaccounting estimates and assumptions applied on revenue recognition, and Note 6(21) for details of salesrevenue.
Evergreen Marine Corporation (Taiwan) Ltd. primarily engages in global container shipping servicecovering ocean-going and near-sea shipping line, shipping agency business as well as container freightstation business. In 2017, freight revenue was NT$ 135,358,310 thousand, representing 89.89% ofoperating revenue. Since ocean-going shipping often lasts for several days, voyages are sometimescompleted after the date of balance sheet. Also, demands for freight are consistently sent by forwardersduring voyage. Due to the factors mentioned above, freight revenue is recognized under the percentage-of-completion method for each vessel during the reporting period.
Despite the Group conducting business worldwide, its transactions are all in small amounts, whereas thefreight rate is subject to fluctuation caused by cargo loading rate as well as market competition.Worldwide shipping agencies use a system to record the transactions by entering data including shippingdeparture, destination, counterparty, transit time, shipping amounts, and freight price for the Group.Therefore, management could recognize freight revenue in accordance with the data on bill of ladingreports generated from the system, accompanied by estimation made from past experience and currentcargo loading conditions the revenue that would flow in, and calculate the revenue under percentage-of-completion method. As the process of recording transactions, communicating with agencies, maintainingthe system are done manually, and the estimation of freight revenue are subject to management’sjudgement, therefore freight revenue involves high uncertainty and is material to the financial statements.Given the conditions mentioned above, we consider the accuracy of freight revenue and the appropriateuse of cut-off by the Group and its investee companies as a key audit matter.
78
4 Financial Statements
~3~
How our audit addressed the matter
We performed the following audit procedures on the above key audit matter:
1. Obtained an understanding of the operation and industry of the Group to assess the reasonablenessof policies and procedures on revenue recognition, and confirmed whether it is appropriate to thefinancial statements.
2. Obtained an understanding of the procedures of revenue recognition from booking, picking, billingto receiving. Assessed and tested relevant internal controls, including checking freight items andamounts of delivery information against the approved contracts and booking list. In addition,recalculated the accuracy of freight revenue, and ensured its consistency with the bill of lading report.
3. Obtained the estimated freight income report for vessels underway as of balance sheets date, andinquired with management for the reasonableness of judgement. In addition, checked historicalfreight revenue for total voyage under each individual vessel, along with comparing with currentcargo loading condition as well as actual revenue received after period end to ensure thereasonableness of revenue assumptions.
4. Confirmed the completeness of vessels underway for the reporting period, including tracking themovements of shipments on the internet to ensure the vessels that depart before period end have beentaken into consideration in the freight revenue calculation.
5. Verified accuracy of data used in calculating percentage of completion under each voyage, includingselecting samples and check whether total shipping days shown on the Company’s website are inagreement with cruise timetable as well as recalculating shipping days (days between departure andbalance sheet date), in order to examine the soundness of percentage applied.
Impairment of property, plant and equipmentDescriptionPlease refer to Note 4(16) for accounting policies on property, plant and equipment, Note 5(2) foruncertainty of accounting estimates and assumptions applied on impairment of property, plant andequipment, and Note 6(8) for details of property, plant and equipment.
As of December 31, 2017, property, plant and equipment amounted to NT$ 97,687,454 thousand,constituting 48.82% of total assets, and ship equipment, transport equipment and cargo handlingequipment amounted to NT$ 76,190,454 thousand, accounting for approximately 77.99% of totalproperty, plant and equipment. As new ships have been built and put into operation by many carriers
2017 Annual Report
79
~4~
around the world, market supply has exceeded demand. Therefore, the market imbalance led to pricecompetition, resulting to losses for the industry and raising the risk of asset impairment. The valuationof impairment and recoverable amounts are evaluated by the Group using the present value of the futurecash flows expected to be derived from an asset or cash-generating unit compared to the book value.The main assumptions of discount rates used in recoverable amounts, and expected operating revenuegrowth rates, gross profit, operating profit rates, capital expenditures and discount rates used in futurecash flow estimates are subject to management’s judgement and involve high uncertainty, and theestimated results are material to the consolidated financial statements. Given the conditions mentionedabove, we consider the impairment assessment of ship equipment, transport equipment and cargohandling equipment in the property, plant and equipment under the Group and its investee companies asa key audit matter.
How our audit addressed the matterWe performed the following audit procedures on the above key audit matter:1. Obtained an understanding and assessed the relevant policies, internal controls and process applied
to valuation of assets impairments.2. Interviewed with management regarding the impairment test report, and assessed the reasonableness
of discounts rate and the reasonableness of operating revenue, gross profit, operating profit rate,growth rates and capital expenditure that management used in estimating future cash flows bychecking actual performance under past operating plans and comparing the performance withindustry forecast to evaluate the intention and capability of management.
3. Checked the parameters of the valuation model and recalculated the valuation model for accuracy.
Other matter – Audit by other independent accountantsWe did not audit the financial statements of all the consolidated subsidiaries. Those statements and theinformation disclosed in Note 13 were performed by other independent accountants whose reportsthereon have been furnished to us, and our audit expressed herein is based solely on the reports of theother independent accountants. The statements reflect that total assets in these subsidiaries amounted toNT$53,765,827 thousand and NT$62,747,081 thousand, constituting 26.87% and 33.07% of the totalconsolidated assets as of December 31, 2017, and 2016, respectively. Net operating revenues in thesubsidiaries amounted to NT$55,681,727 thousand and NT$46,208,197 thousand, constituting 36.98%and 37.12% of the total consolidated net operating revenues of 2017 and 2016 for the years then ended.In addition, we did not audit the financial statements of all the investee companies accounted for using
80
4 Financial Statements
~5~
equity method. Those statements were audited by other independent accountants whose reports thereonhave been furnished to us, and our audit expressed herein, insofar as it relates to the amounts includedfor those investee companies accounted for using equity method and information disclosed in Note 13related to these long-term equity investments, is based solely on the reports of other independentaccountants. Long-term equity investments in these investee companies amounted to NT$16,239,361thousand and NT$15,396,048 thousand, constituting 8.12% and 8.11% of the total consolidated assetsas of December 31, 2017 and 2016, respectively, and comprehensive loss (including share of profit orloss and share of other comprehensive income of associates and joint ventures accounted for using equitymethod) was NT$1,892,245 thousand and NT$1,049,924 thousand for the years then ended.
We have also audited the parent company only financial statement of Evergreen Marine Corporation(Taiwan) Ltd. as of and for the years ended December 31, 2017 and 2016 on which we have issued anunqualified opinion with explanatory paragraph thereon.
Responsibilities of management and those charged with governance for theconsolidated financial statementsManagement is responsible for the preparation and fair presentation of the consolidated financialstatements in accordance with the Regulations Governing the Preparations of Financial Reports bySecurities Issuers and the International Financial Reporting Standards, International AccountingStandards, IFRIC Interpretations, and SIC Interpretations as endorsed by the Financial SupervisoryCommission, and for such internal control as management determines is necessary to enable thepreparation of financial statements that are free from material misstatement, whether due to fraud orerror.
In preparing the financial statements, management is responsible for assessing the Group’s ability tocontinue as a going concern, disclosing, as applicable, matters related to going concern and using thegoing concern basis of accounting unless management either intends to liquidate the Group or to ceaseoperations, or has no realistic alternative but to do so.
Those charged with governance, including supervisors, are responsible for overseeing the Group’sfinancial reporting process.
Auditor’s responsibilities for the audit of the consolidated financial statementsOur objectives are to obtain reasonable assurance about whether the consolidated financial statements
2017 Annual Report
81
~6~
as a whole are free from material misstatement, whether due to fraud or error, and to issue an auditor’sreport that includes our opinion. Reasonable assurance is a high level of assurance, but is not a guaranteethat an audit conducted in accordance with ROC GAAS will always detect a material misstatement whenit exists. Misstatements can arise from fraud or error and are considered material if, individually or inthe aggregate, they could reasonably be expected to influence the economic decisions of users taken onthe basis of these consolidated financial statements.
As part of an audit in accordance with ROC GAAS, we exercise professional judgement and maintainprofessional skepticism throughout the audit. We also:1. Identify and assess the risks of material misstatement of the consolidated financial statements,
whether due to fraud or error, design and perform audit procedures responsive to those risks, andobtain audit evidence that is sufficient and appropriate to provide a basis for our opinion. The riskof not detecting a material misstatement resulting from fraud is higher than for one resulting fromerror, as fraud may involve collusion, forgery, intentional omissions, misrepresentations, or theoverride of internal control.
2. Obtain an understanding of internal control relevant to the audit in order to design audit proceduresthat are appropriate in the circumstances, but not for the purpose of expressing an opinion on theeffectiveness of the Group.
3. Evaluate the appropriateness of accounting policies used and the reasonableness of accountingestimates and related disclosures made by management.
4. Conclude on the appropriateness of management’s use of the going concern basis of accountingand, based on the audit evidence obtained, whether a material uncertainty exists related to eventsor conditions that may cast significant doubt on the Group’s ability to continue as a going concern.If we conclude that a material uncertainty exists, we are required to draw attention in our auditor’sreport to the related disclosures in the financial statements or, if such disclosures are inadequate, tomodify our opinion. Our conclusions are based on the audit evidence obtained up to the date of ourauditor’s report. However, future events or conditions may cause the Group to cease to continue asa going concern.
5. Evaluate the overall presentation, structure and content of the consolidated financial statements,including the disclosures, and whether the financial statements represent the underlyingtransactions and events in a manner that achieves fair presentation.
6. Obtain sufficient appropriate audit evidence regarding the financial information of the entities orbusiness activities within the Group to express an opinion on the financial statements. We are
82
4 Financial Statements
~7~
responsible for the direction, supervision and performance of the group audit. We remain solelyresponsible for our audit opinion.
We communicate with those charged with governance regarding, among other matters, the planned scopeand timing of the audit and significant audit findings, including any significant deficiencies in internalcontrol that we identify during our audit.
We also provide those charged with governance with a statement that we have complied with relevantethical requirements regarding independence, and to communicate with them all relationships and othermatters that may reasonably be thought to bear on our independence, and where applicable, relatedsafeguards.From the matters communicated with those charged with governance, we determine those matters thatwere of most significance in the audit of the consolidated financial statements of the current period andare therefore the key audit matters. We describe these matters in our auditor’s report unless law orregulation precludes public disclosure about the matter or when, in extremely rare circumstances, wedetermine that a matter should not be communicated in our report because the adverse consequences ofdoing so would reasonably be expected to outweigh the public interest benefits of such communication.
Lai, Chung-Hsi
Chih, Ping-Chiun
For and on behalf of PricewaterhouseCoopers, TaiwanMarch 23, 2018
-------------------------------------------------------------------------------------------------------------------------------------------------The accompanying consolidated financial statements are not intended to present the financial position and results ofoperations and cash flows in accordance with accounting principles generally accepted in countries and jurisdictions otherthan the Republic of China. The standards, procedures and practices in the Republic of China governing the audit of suchfinancial statements may differ from those generally accepted in countries and jurisdictions other than the Republic of China.Accordingly, the accompanying consolidated financial statements and report of independent accountants are not intended foruse by those who are not informed about the accounting principles or auditing standards generally accepted in the Republicof China, and their applications in practice.As the financial statements are the responsibility of the management, PricewaterhouseCoopers cannot accept any liability forthe use of, or reliance on, the English translation or for any errors or misunderstandings that may derive from the translation.
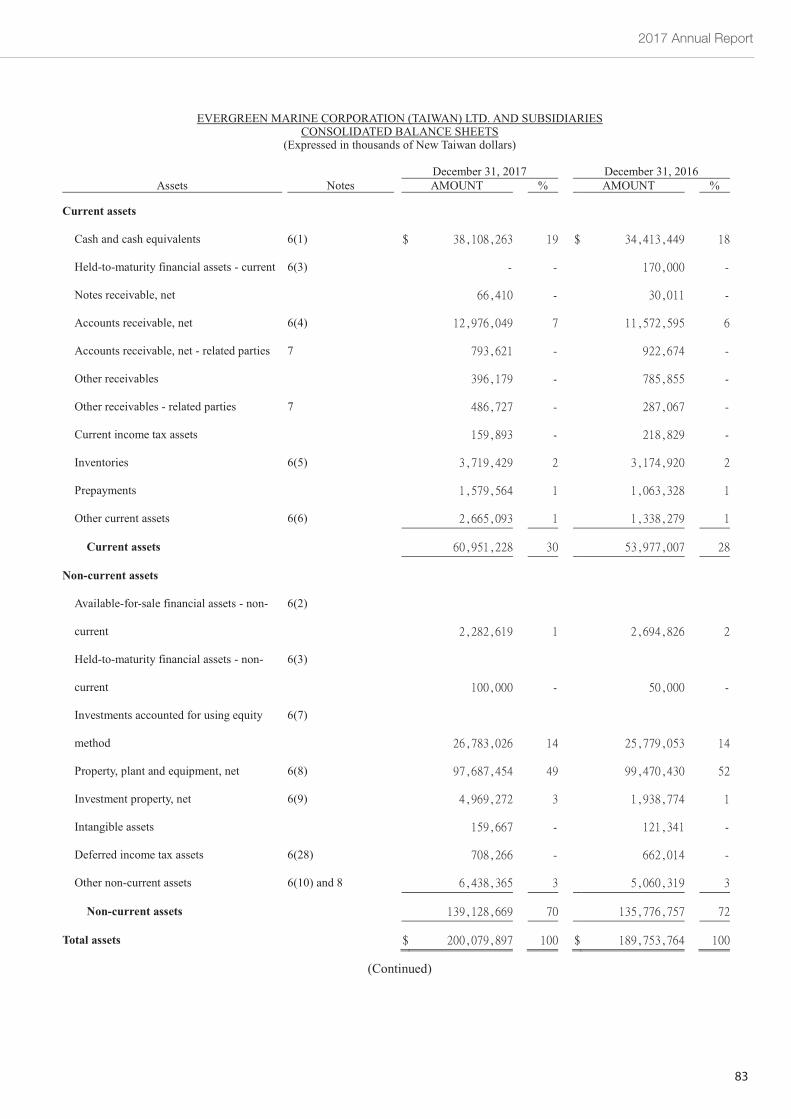
2017 Annual Report
83
EVERGREEN MARINE CORPORATION (TAIWAN) LTD. AND SUBSIDIARIESCONSOLIDATED BALANCE SHEETS
(Expressed in thousands of New Taiwan dollars)
~8~
December 31, 2017 December 31, 2016Assets Notes AMOUNT % AMOUNT %
Current assets
Cash and cash equivalents 6(1)
Held-to-maturity financial assets - current 6(3)
Notes receivable, net
Accounts receivable, net 6(4)
Accounts receivable, net - related parties 7
Other receivables
Other receivables - related parties 7
Current income tax assets
Inventories 6(5)
Prepayments
Other current assets 6(6)
Current assets
Non-current assets
Available-for-sale financial assets - non-
current
6(2)
Held-to-maturity financial assets - non-
current
6(3)
Investments accounted for using equity
method
6(7)
Property, plant and equipment, net 6(8)
Investment property, net 6(9)
Intangible assets
Deferred income tax assets 6(28)
Other non-current assets 6(10) and 8
Non-current assets
Total assets
(Continued)
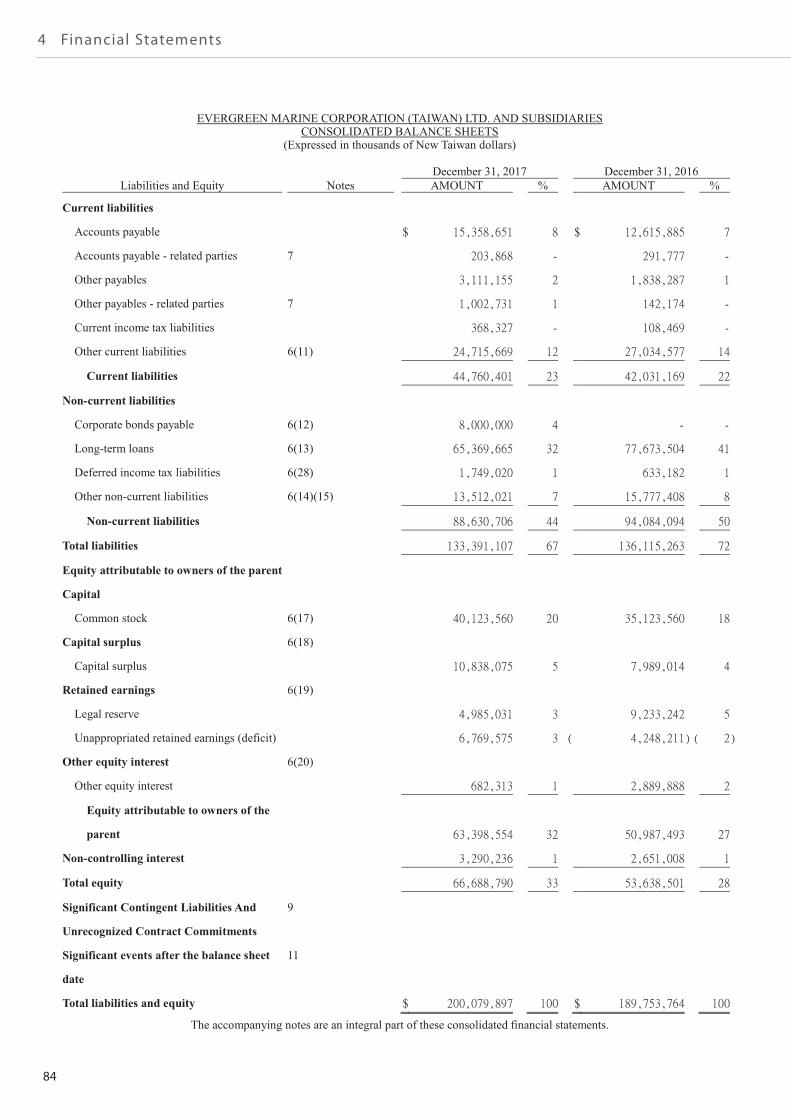
84
4 Financial Statements
EVERGREEN MARINE CORPORATION (TAIWAN) LTD. AND SUBSIDIARIESCONSOLIDATED BALANCE SHEETS
(Expressed in thousands of New Taiwan dollars)
The accompanying notes are an integral part of these consolidated financial statements.
~9~
December 31, 2017 December 31, 2016Liabilities and Equity Notes AMOUNT % AMOUNT %
Current liabilities
Accounts payable
Accounts payable - related parties 7
Other payables
Other payables - related parties 7
Current income tax liabilities
Other current liabilities 6(11)
Current liabilities
Non-current liabilities
Corporate bonds payable 6(12)
Long-term loans 6(13)
Deferred income tax liabilities 6(28)
Other non-current liabilities 6(14)(15)
Non-current liabilities
Total liabilities
Equity attributable to owners of the parent
Capital
Common stock 6(17)
Capital surplus 6(18)
Capital surplus
Retained earnings 6(19)
Legal reserve
Unappropriated retained earnings (deficit)
Other equity interest 6(20)
Other equity interest
Equity attributable to owners of the
parent
Non-controlling interest
Total equity
Significant Contingent Liabilities And
Unrecognized Contract Commitments
9
Significant events after the balance sheet
date
11
Total liabilities and equity
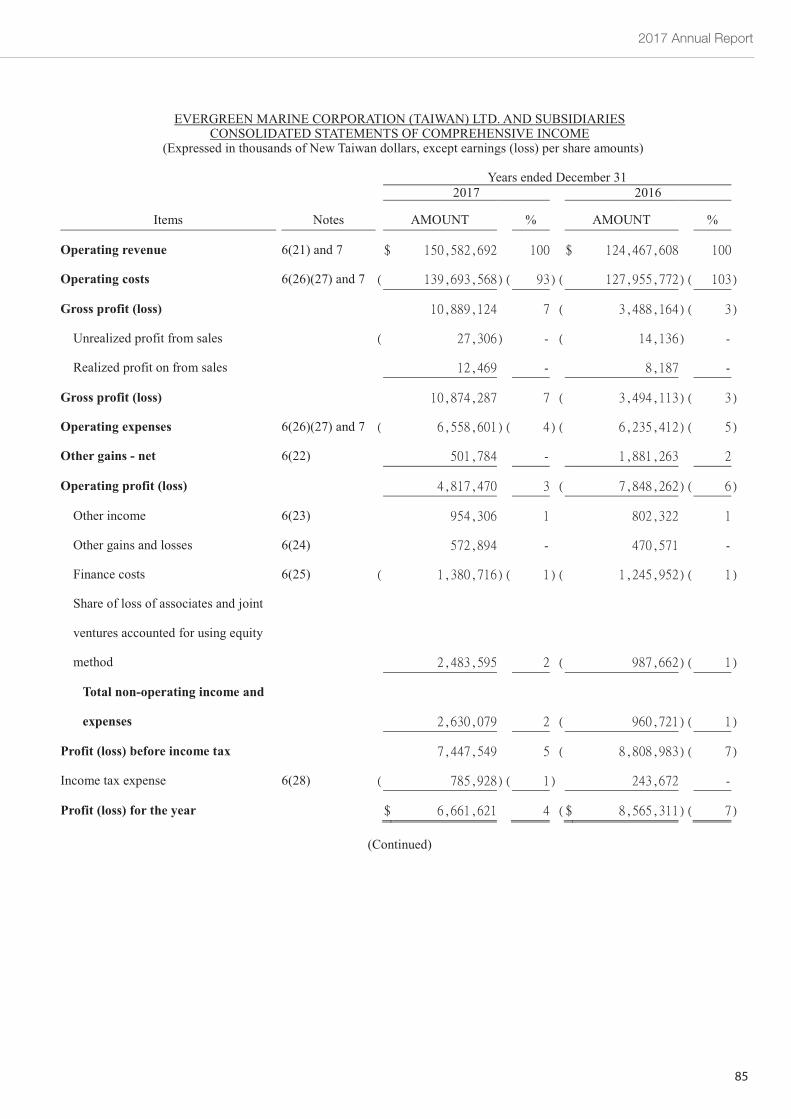
2017 Annual Report
85
EVERGREEN MARINE CORPORATION (TAIWAN) LTD. AND SUBSIDIARIESCONSOLIDATED STATEMENTS OF COMPREHENSIVE INCOME
(Expressed in thousands of New Taiwan dollars, except earnings (loss) per share amounts)
~10~
Years ended December 312017 2016
Items Notes AMOUNT % AMOUNT %
Operating revenue 6(21) and 7
Operating costs 6(26)(27) and 7
Gross profit (loss)
Unrealized profit from sales
Realized profit on from sales
Gross profit (loss)
Operating expenses 6(26)(27) and 7
Other gains - net 6(22)
Operating profit (loss)
Other income 6(23)
Other gains and losses 6(24)
Finance costs 6(25)
Share of loss of associates and joint
ventures accounted for using equity
method
Total non-operating income and
expenses
Profit (loss) before income tax
Income tax expense 6(28)
Profit (loss) for the year
(Continued)
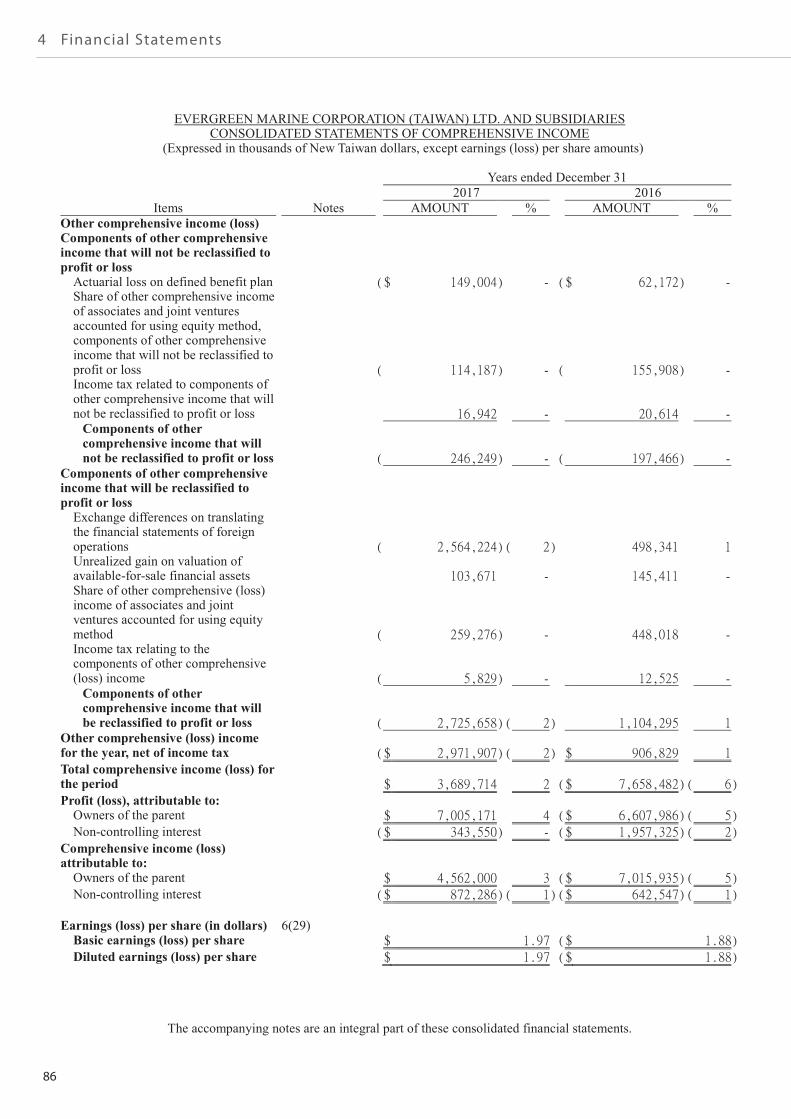
86
4 Financial Statements
EVERGREEN MARINE CORPORATION (TAIWAN) LTD. AND SUBSIDIARIESCONSOLIDATED STATEMENTS OF COMPREHENSIVE INCOME
(Expressed in thousands of New Taiwan dollars, except earnings (loss) per share amounts)
The accompanying notes are an integral part of these consolidated financial statements.
~11~
Years ended December 312017 2016
Items Notes AMOUNT % AMOUNT %Other comprehensive income (loss)Components of other comprehensiveincome that will not be reclassified toprofit or loss
Actuarial loss on defined benefit planShare of other comprehensive incomeof associates and joint venturesaccounted for using equity method,components of other comprehensiveincome that will not be reclassified toprofit or lossIncome tax related to components ofother comprehensive income that willnot be reclassified to profit or lossComponents of othercomprehensive income that willnot be reclassified to profit or loss
Components of other comprehensiveincome that will be reclassified toprofit or loss
Exchange differences on translatingthe financial statements of foreignoperationsUnrealized gain on valuation ofavailable-for-sale financial assetsShare of other comprehensive (loss)income of associates and jointventures accounted for using equitymethodIncome tax relating to thecomponents of other comprehensive(loss) incomeComponents of othercomprehensive income that willbe reclassified to profit or loss
Other comprehensive (loss) incomefor the year, net of income taxTotal comprehensive income (loss) forthe periodProfit (loss), attributable to:
Owners of the parentNon-controlling interest
Comprehensive income (loss)attributable to:
Owners of the parentNon-controlling interest
Earnings (loss) per share (in dollars) 6(29)Basic earnings (loss) per shareDiluted earnings (loss) per share
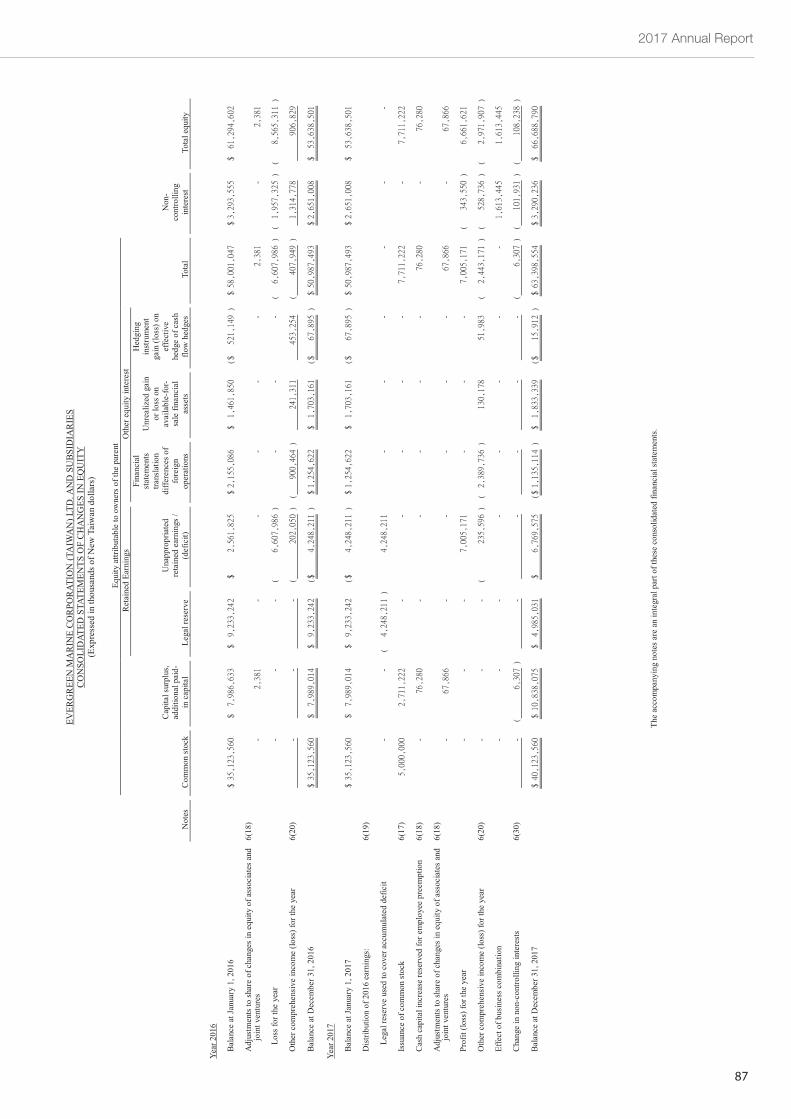
2017 Annual Report
87
EVER
GR
EEN
MA
RIN
EC
OR
POR
ATIO
N(T
AIW
AN
)LTD
.AN
DSU
BSID
IAR
IES
CO
NSO
LID
ATED
STAT
EMEN
TSO
FC
HA
NG
ESIN
EQU
ITY
(Exp
ress
edin
thou
sand
sofN
ewTa
iwan
dolla
rs)
Equi
tyat
tribu
tabl
eto
owne
rsof
the
pare
ntR
etai
ned
Earn
ings
Oth
ereq
uity
inte
rest
Not
esC
omm
onst
ock
Cap
itals
urpl
us,
addi
tiona
lpai
d-in
capi
tal
Lega
lres
erve
Una
ppro
pria
ted
reta
ined
earn
ings
/(d
efic
it)
Fina
ncia
lst
atem
ents
trans
latio
ndi
ffere
nces
offo
reig
nop
erat
ions
Unr
ealiz
edga
inor
loss
onav
aila
ble-
for-
sale
finan
cial
asse
ts
Hed
ging
inst
rum
ent
gain
(loss
)on
effe
ctiv
ehe
dge
ofca
shflo
whe
dges
Tota
l
Non
-co
ntro
lling
inte
rest
Tota
lequ
ity
The
acco
mpa
nyin
gno
tesa
rean
inte
gral
part
ofth
ese
cons
olid
ated
finan
cial
stat
emen
ts.
~12~
Year
2016
Bala
nce
atJa
nuar
y1,
2016
Adj
ustm
ents
tosh
are
ofch
ange
sin
equi
tyof
asso
ciat
esan
djo
intv
entu
res
6(18
)
Loss
fort
heye
ar
Oth
erco
mpr
ehen
sive
inco
me
(loss
)for
the
year
6(20
)
Bala
nce
atD
ecem
ber3
1,20
16
Year
2017
Bala
nce
atJa
nuar
y1,
2017
Dist
ribut
ion
of20
16ea
rnin
gs:
6(19
)
Lega
lres
erve
used
toco
vera
ccum
ulat
edde
ficit
Issu
ance
ofco
mm
onst
ock
6(17
)
Cas
hca
pita
linc
reas
ere
serv
edfo
rem
ploy
eepr
eem
ptio
n6(
18)
Adj
ustm
ents
tosh
are
ofch
ange
sin
equi
tyof
asso
ciat
esan
djo
intv
entu
res
6(18
)
Prof
it(lo
ss)f
orth
eye
ar
Oth
erco
mpr
ehen
sive
inco
me
(loss
)for
the
year
6(20
)
Effe
ctof
busi
ness
com
bina
tion
Cha
nge
inno
n-co
ntro
lling
inte
rest
s6(
30)
Bala
nce
atD
ecem
ber3
1,20
17
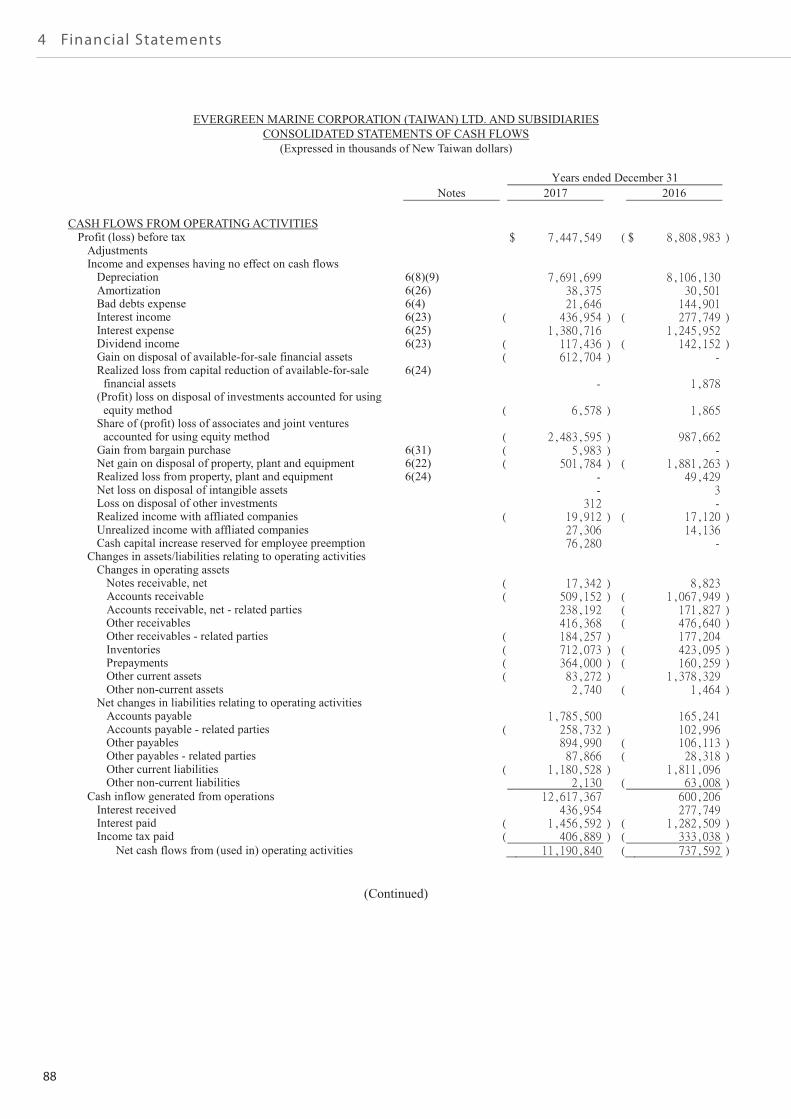
88
4 Financial Statements
EVERGREEN MARINE CORPORATION (TAIWAN) LTD. AND SUBSIDIARIESCONSOLIDATED STATEMENTS OF CASH FLOWS
(Expressed in thousands of New Taiwan dollars)
Years ended December 31Notes 2017 2016
~13~
CASH FLOWS FROM OPERATING ACTIVITIESProfit (loss) before tax
AdjustmentsIncome and expenses having no effect on cash flows
Depreciation 6(8)(9)Amortization 6(26)Bad debts expense 6(4)Interest income 6(23)Interest expense 6(25)Dividend income 6(23)Gain on disposal of available-for-sale financial assetsRealized loss from capital reduction of available-for-sale
financial assets6(24)
(Profit) loss on disposal of investments accounted for usingequity method
Share of (profit) loss of associates and joint venturesaccounted for using equity method
Gain from bargain purchase 6(31)Net gain on disposal of property, plant and equipment 6(22)Realized loss from property, plant and equipment 6(24)Net loss on disposal of intangible assetsLoss on disposal of other investmentsRealized income with affliated companiesUnrealized income with affliated companiesCash capital increase reserved for employee preemption
Changes in assets/liabilities relating to operating activitiesChanges in operating assets
Notes receivable, netAccounts receivableAccounts receivable, net - related partiesOther receivablesOther receivables - related partiesInventoriesPrepaymentsOther current assetsOther non-current assets
Net changes in liabilities relating to operating activitiesAccounts payableAccounts payable - related partiesOther payablesOther payables - related partiesOther current liabilitiesOther non-current liabilities
Cash inflow generated from operationsInterest receivedInterest paidIncome tax paid
Net cash flows from (used in) operating activities
(Continued)
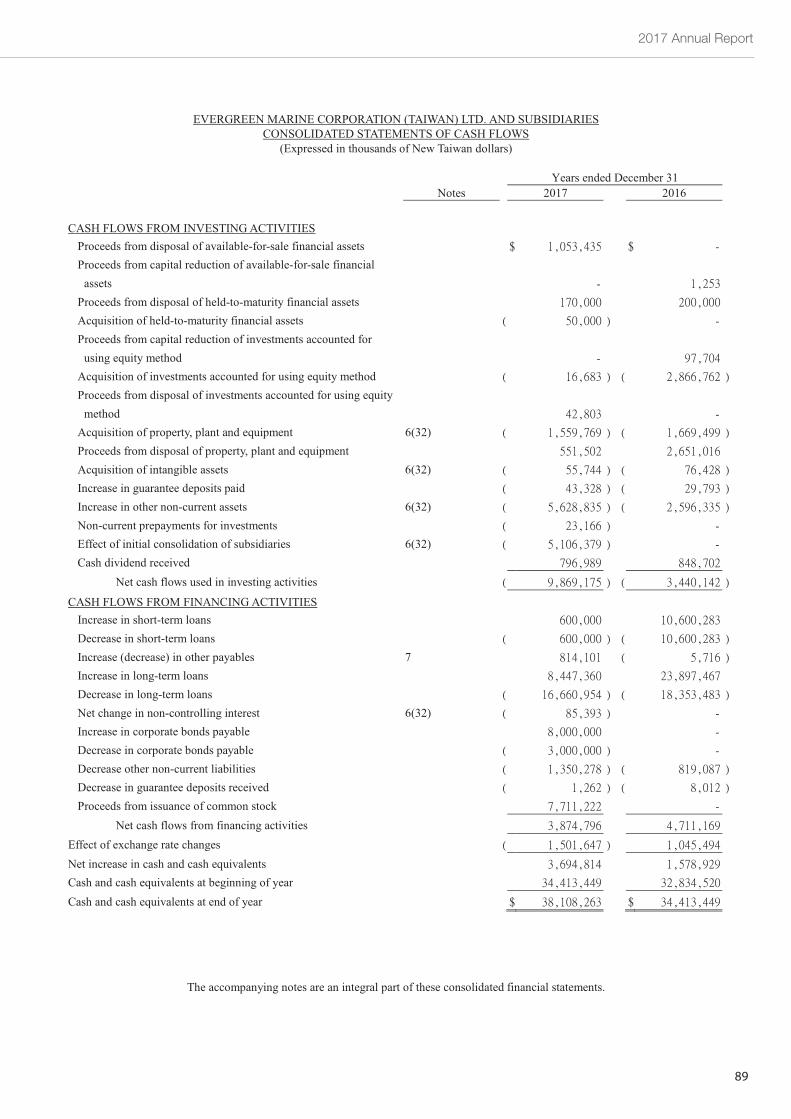
2017 Annual Report
89
EVERGREEN MARINE CORPORATION (TAIWAN) LTD. AND SUBSIDIARIESCONSOLIDATED STATEMENTS OF CASH FLOWS
(Expressed in thousands of New Taiwan dollars)
Years ended December 31Notes 2017 2016
The accompanying notes are an integral part of these consolidated financial statements.
~14~
CASH FLOWS FROM INVESTING ACTIVITIESProceeds from disposal of available-for-sale financial assetsProceeds from capital reduction of available-for-sale financial
assetsProceeds from disposal of held-to-maturity financial assetsAcquisition of held-to-maturity financial assetsProceeds from capital reduction of investments accounted for
using equity methodAcquisition of investments accounted for using equity methodProceeds from disposal of investments accounted for using equity
methodAcquisition of property, plant and equipment 6(32)Proceeds from disposal of property, plant and equipmentAcquisition of intangible assets 6(32)Increase in guarantee deposits paidIncrease in other non-current assets 6(32)Non-current prepayments for investmentsEffect of initial consolidation of subsidiaries 6(32)Cash dividend received
Net cash flows used in investing activities
CASH FLOWS FROM FINANCING ACTIVITIESIncrease in short-term loansDecrease in short-term loansIncrease (decrease) in other payables 7Increase in long-term loansDecrease in long-term loansNet change in non-controlling interest 6(32)Increase in corporate bonds payableDecrease in corporate bonds payableDecrease other non-current liabilitiesDecrease in guarantee deposits receivedProceeds from issuance of common stock
Net cash flows from financing activitiesEffect of exchange rate changesNet increase in cash and cash equivalentsCash and cash equivalents at beginning of yearCash and cash equivalents at end of year
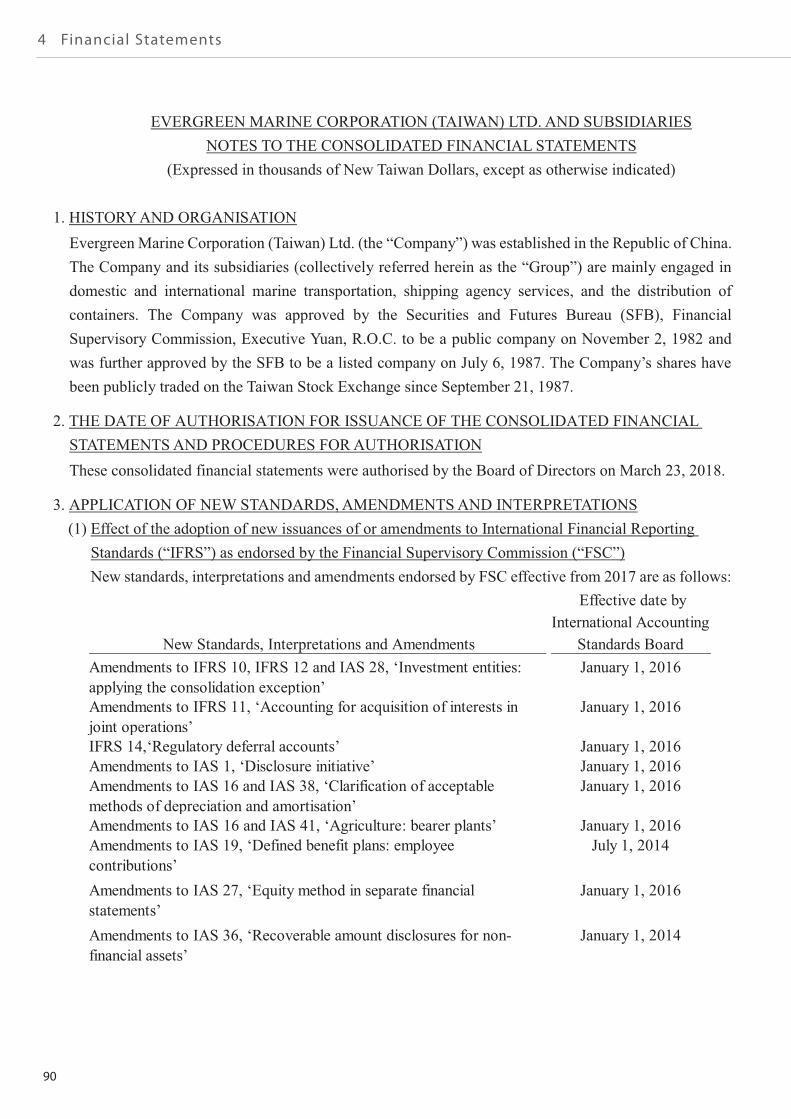
90
4 Financial Statements
~15~
EVERGREEN MARINE CORPORATION (TAIWAN) LTD. AND SUBSIDIARIESNOTES TO THE CONSOLIDATED FINANCIAL STATEMENTS
(Expressed in thousands of New Taiwan Dollars, except as otherwise indicated)
1. HISTORY AND ORGANISATIONEvergreen Marine Corporation (Taiwan) Ltd. (the “Company”) was established in the Republic of China.The Company and its subsidiaries (collectively referred herein as the “Group”) are mainly engaged indomestic and international marine transportation, shipping agency services, and the distribution ofcontainers. The Company was approved by the Securities and Futures Bureau (SFB), FinancialSupervisory Commission, Executive Yuan, R.O.C. to be a public company on November 2, 1982 andwas further approved by the SFB to be a listed company on July 6, 1987. The Company’s shares havebeen publicly traded on the Taiwan Stock Exchange since September 21, 1987.
2. THE DATE OF AUTHORISATION FOR ISSUANCE OF THE CONSOLIDATED FINANCIALSTATEMENTS AND PROCEDURES FOR AUTHORISATIONThese consolidated financial statements were authorised by the Board of Directors on March 23, 2018.
3. APPLICATION OF NEW STANDARDS, AMENDMENTS AND INTERPRETATIONS(1) Effect of the adoption of new issuances of or amendments to International Financial Reporting
Standards (“IFRS”) as endorsed by the Financial Supervisory Commission (“FSC”)New standards, interpretations and amendments endorsed by FSC effective from 2017 are as follows:
New Standards, Interpretations and Amendments
Effective date byInternational Accounting
Standards BoardAmendments to IFRS 10, IFRS 12 and IAS 28, ‘Investment entities:applying the consolidation exception’
January 1, 2016
Amendments to IFRS 11, ‘Accounting for acquisition of interests injoint operations’
January 1, 2016
IFRS 14,‘Regulatory deferral accounts’ January 1, 2016Amendments to IAS 1, ‘Disclosure initiative’ January 1, 2016Amendments to IAS 16 and IAS 38, ‘Clarification of acceptablemethods of depreciation and amortisation’
January 1, 2016
Amendments to IAS 16 and IAS 41, ‘Agriculture: bearer plants’ January 1, 2016Amendments to IAS 19, ‘Defined benefit plans: employeecontributions’
July 1, 2014
Amendments to IAS 27, ‘Equity method in separate financialstatements’
January 1, 2016
Amendments to IAS 36, ‘Recoverable amount disclosures for non-financial assets’
January 1, 2014
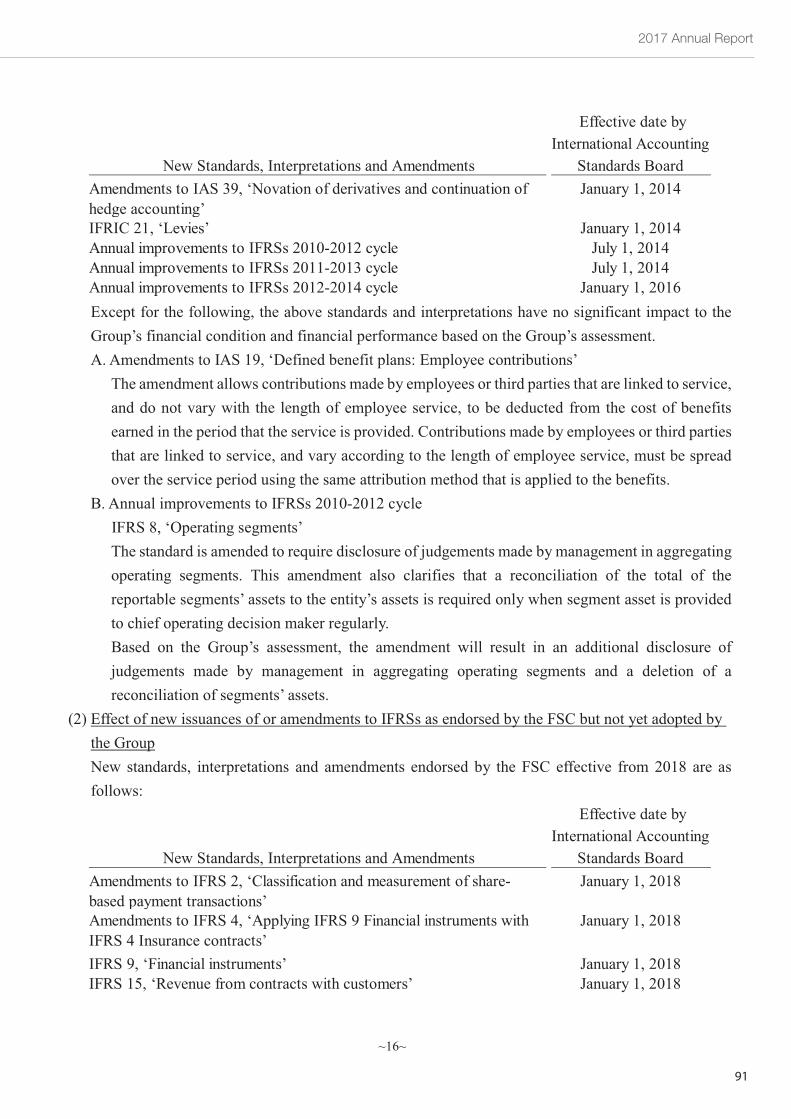
2017 Annual Report
91
~16~
Except for the following, the above standards and interpretations have no significant impact to theGroup’s financial condition and financial performance based on the Group’s assessment.A. Amendments to IAS 19, ‘Defined benefit plans: Employee contributions’
The amendment allows contributions made by employees or third parties that are linked to service,and do not vary with the length of employee service, to be deducted from the cost of benefitsearned in the period that the service is provided. Contributions made by employees or third partiesthat are linked to service, and vary according to the length of employee service, must be spreadover the service period using the same attribution method that is applied to the benefits.
B. Annual improvements to IFRSs 2010-2012 cycleIFRS 8, ‘Operating segments’The standard is amended to require disclosure of judgements made by management in aggregatingoperating segments. This amendment also clarifies that a reconciliation of the total of thereportable segments’ assets to the entity’s assets is required only when segment asset is providedto chief operating decision maker regularly.Based on the Group’s assessment, the amendment will result in an additional disclosure ofjudgements made by management in aggregating operating segments and a deletion of areconciliation of segments’ assets.
(2) Effect of new issuances of or amendments to IFRSs as endorsed by the FSC but not yet adopted bythe GroupNew standards, interpretations and amendments endorsed by the FSC effective from 2018 are asfollows:
New Standards, Interpretations and Amendments
Effective date byInternational Accounting
Standards BoardAmendments to IAS 39, ‘Novation of derivatives and continuation ofhedge accounting’
January 1, 2014
IFRIC 21, ‘Levies’ January 1, 2014Annual improvements to IFRSs 2010-2012 cycle July 1, 2014Annual improvements to IFRSs 2011-2013 cycle July 1, 2014Annual improvements to IFRSs 2012-2014 cycle January 1, 2016
New Standards, Interpretations and Amendments
Effective date byInternational Accounting
Standards BoardAmendments to IFRS 2, ‘Classification and measurement of share-based payment transactions’
January 1, 2018
Amendments to IFRS 4, ‘Applying IFRS 9 Financial instruments withIFRS 4 Insurance contracts’
January 1, 2018
IFRS 9, ‘Financial instruments’ January 1, 2018IFRS 15, ‘Revenue from contracts with customers’ January 1, 2018
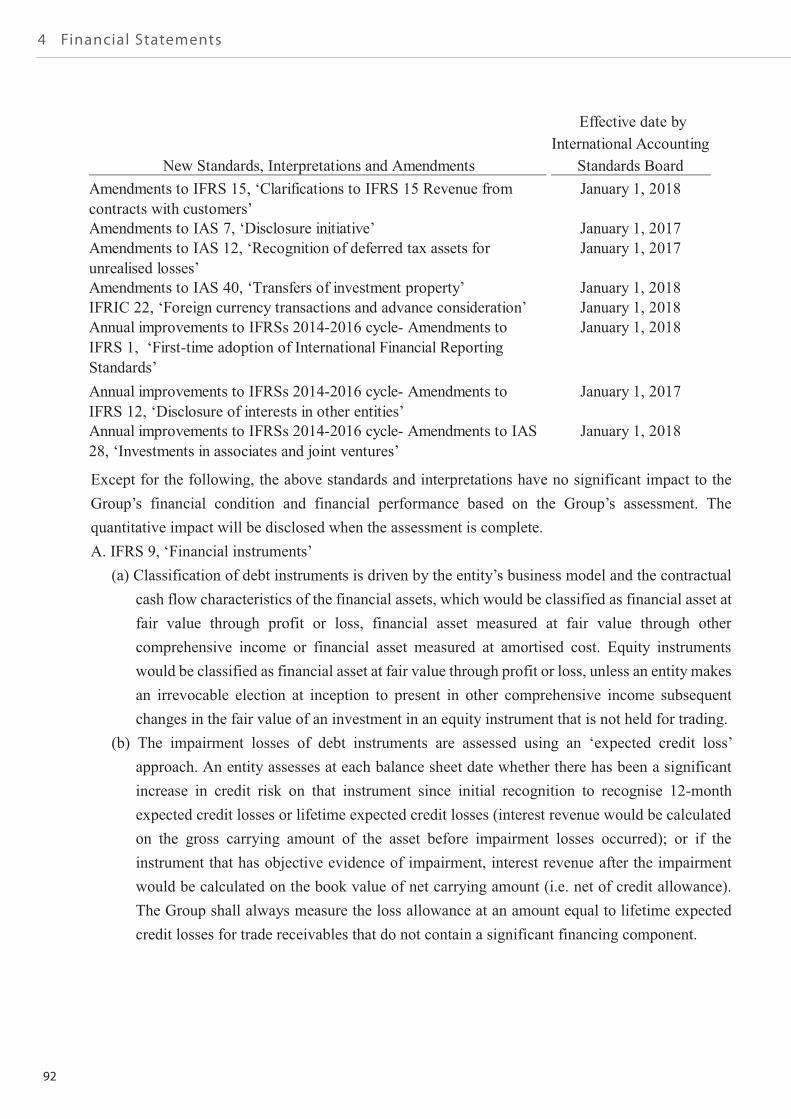
92
4 Financial Statements
~17~
Except for the following, the above standards and interpretations have no significant impact to theGroup’s financial condition and financial performance based on the Group’s assessment. Thequantitative impact will be disclosed when the assessment is complete.A. IFRS 9, ‘Financial instruments’
(a) Classification of debt instruments is driven by the entity’s business model and the contractualcash flow characteristics of the financial assets, which would be classified as financial asset atfair value through profit or loss, financial asset measured at fair value through othercomprehensive income or financial asset measured at amortised cost. Equity instrumentswould be classified as financial asset at fair value through profit or loss, unless an entity makesan irrevocable election at inception to present in other comprehensive income subsequentchanges in the fair value of an investment in an equity instrument that is not held for trading.
(b) The impairment losses of debt instruments are assessed using an ‘expected credit loss’approach. An entity assesses at each balance sheet date whether there has been a significantincrease in credit risk on that instrument since initial recognition to recognise 12-monthexpected credit losses or lifetime expected credit losses (interest revenue would be calculatedon the gross carrying amount of the asset before impairment losses occurred); or if theinstrument that has objective evidence of impairment, interest revenue after the impairmentwould be calculated on the book value of net carrying amount (i.e. net of credit allowance).The Group shall always measure the loss allowance at an amount equal to lifetime expectedcredit losses for trade receivables that do not contain a significant financing component.
New Standards, Interpretations and Amendments
Effective date byInternational Accounting
Standards BoardAmendments to IFRS 15, ‘Clarifications to IFRS 15 Revenue fromcontracts with customers’
January 1, 2018
Amendments to IAS 7, ‘Disclosure initiative’ January 1, 2017Amendments to IAS 12, ‘Recognition of deferred tax assets forunrealised losses’
January 1, 2017
Amendments to IAS 40, ‘Transfers of investment property’ January 1, 2018IFRIC 22, ‘Foreign currency transactions and advance consideration’ January 1, 2018Annual improvements to IFRSs 2014-2016 cycle- Amendments toIFRS 1, ‘First-time adoption of International Financial ReportingStandards’
January 1, 2018
Annual improvements to IFRSs 2014-2016 cycle- Amendments toIFRS 12, ‘Disclosure of interests in other entities’
January 1, 2017
Annual improvements to IFRSs 2014-2016 cycle- Amendments to IAS28, ‘Investments in associates and joint ventures’
January 1, 2018
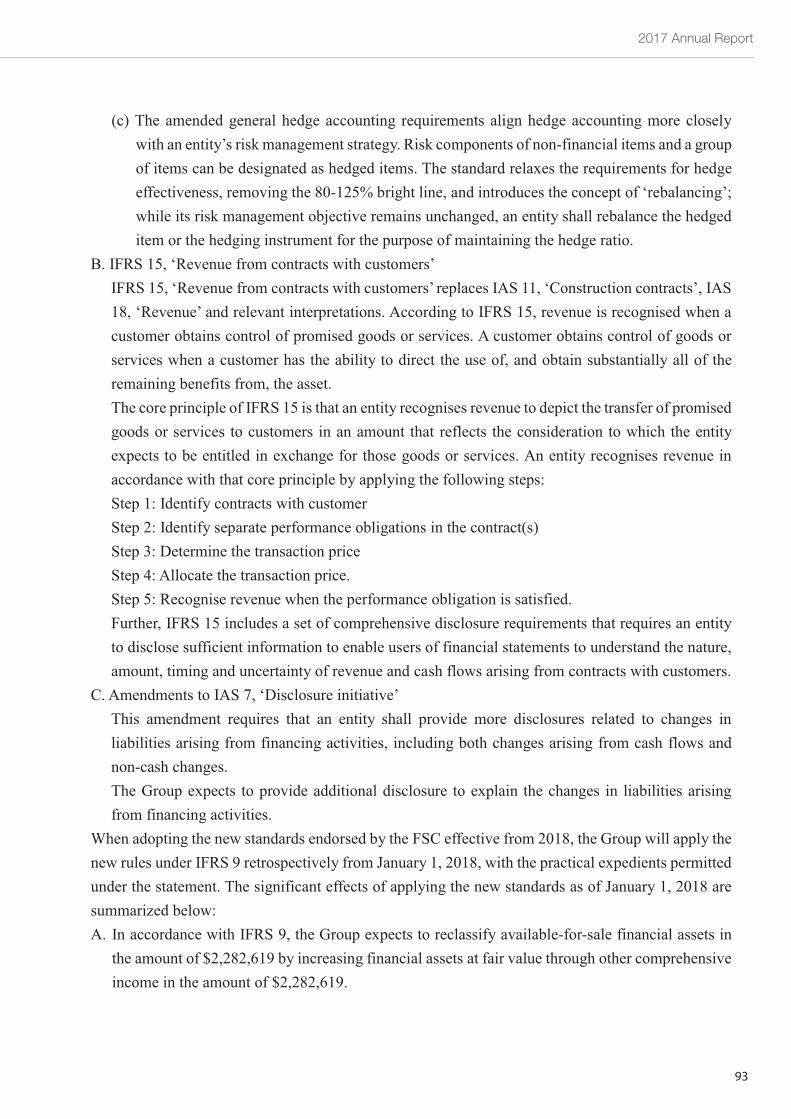
2017 Annual Report
93
~18~
(c) The amended general hedge accounting requirements align hedge accounting more closelywith an entity’s risk management strategy. Risk components of non-financial items and a groupof items can be designated as hedged items. The standard relaxes the requirements for hedgeeffectiveness, removing the 80-125% bright line, and introduces the concept of ‘rebalancing’;while its risk management objective remains unchanged, an entity shall rebalance the hedgeditem or the hedging instrument for the purpose of maintaining the hedge ratio.
B. IFRS 15, ‘Revenue from contracts with customers’IFRS 15, ‘Revenue from contracts with customers’ replaces IAS 11, ‘Construction contracts’, IAS18, ‘Revenue’ and relevant interpretations. According to IFRS 15, revenue is recognised when acustomer obtains control of promised goods or services. A customer obtains control of goods orservices when a customer has the ability to direct the use of, and obtain substantially all of theremaining benefits from, the asset.The core principle of IFRS 15 is that an entity recognises revenue to depict the transfer of promisedgoods or services to customers in an amount that reflects the consideration to which the entityexpects to be entitled in exchange for those goods or services. An entity recognises revenue inaccordance with that core principle by applying the following steps:Step 1: Identify contracts with customerStep 2: Identify separate performance obligations in the contract(s)Step 3: Determine the transaction priceStep 4: Allocate the transaction price.Step 5: Recognise revenue when the performance obligation is satisfied.Further, IFRS 15 includes a set of comprehensive disclosure requirements that requires an entityto disclose sufficient information to enable users of financial statements to understand the nature,amount, timing and uncertainty of revenue and cash flows arising from contracts with customers.
C. Amendments to IAS 7, ‘Disclosure initiative’This amendment requires that an entity shall provide more disclosures related to changes inliabilities arising from financing activities, including both changes arising from cash flows andnon-cash changes.The Group expects to provide additional disclosure to explain the changes in liabilities arisingfrom financing activities.
When adopting the new standards endorsed by the FSC effective from 2018, the Group will apply thenew rules under IFRS 9 retrospectively from January 1, 2018, with the practical expedients permittedunder the statement. The significant effects of applying the new standards as of January 1, 2018 aresummarized below:A. In accordance with IFRS 9, the Group expects to reclassify available-for-sale financial assets in
the amount of $2,282,619 by increasing financial assets at fair value through other comprehensiveincome in the amount of $2,282,619.
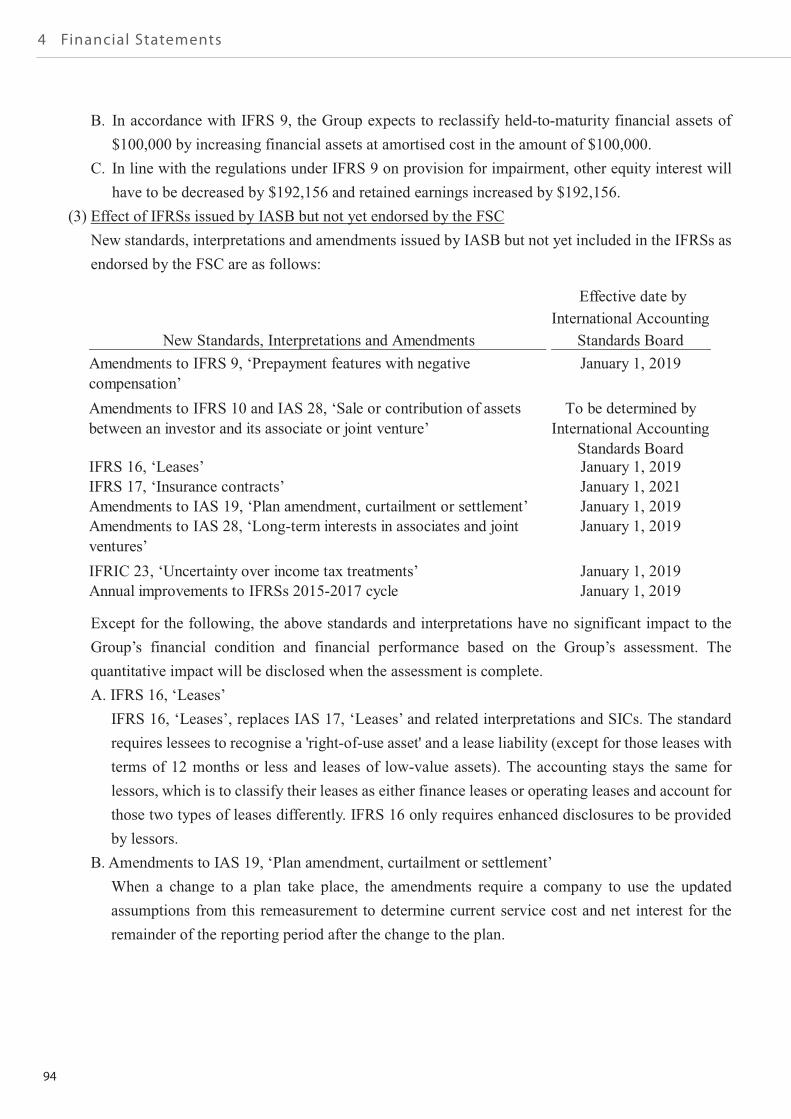
94
4 Financial Statements
~19~
B. In accordance with IFRS 9, the Group expects to reclassify held-to-maturity financial assets of$100,000 by increasing financial assets at amortised cost in the amount of $100,000.
C. In line with the regulations under IFRS 9 on provision for impairment, other equity interest willhave to be decreased by $192,156 and retained earnings increased by $192,156.
(3) Effect of IFRSs issued by IASB but not yet endorsed by the FSCNew standards, interpretations and amendments issued by IASB but not yet included in the IFRSs asendorsed by the FSC are as follows:
Except for the following, the above standards and interpretations have no significant impact to theGroup’s financial condition and financial performance based on the Group’s assessment. Thequantitative impact will be disclosed when the assessment is complete.A. IFRS 16, ‘Leases’
IFRS 16, ‘Leases’, replaces IAS 17, ‘Leases’ and related interpretations and SICs. The standardrequires lessees to recognise a 'right-of-use asset' and a lease liability (except for those leases withterms of 12 months or less and leases of low-value assets). The accounting stays the same forlessors, which is to classify their leases as either finance leases or operating leases and account forthose two types of leases differently. IFRS 16 only requires enhanced disclosures to be providedby lessors.
B. Amendments to IAS 19, ‘Plan amendment, curtailment or settlement’When a change to a plan take place, the amendments require a company to use the updatedassumptions from this remeasurement to determine current service cost and net interest for theremainder of the reporting period after the change to the plan.
New Standards, Interpretations and Amendments
Effective date byInternational Accounting
Standards BoardAmendments to IFRS 9, ‘Prepayment features with negativecompensation’
January 1, 2019
Amendments to IFRS 10 and IAS 28, ‘Sale or contribution of assetsbetween an investor and its associate or joint venture’
To be determined byInternational Accounting
Standards BoardIFRS 16, ‘Leases’ January 1, 2019IFRS 17, ‘Insurance contracts’ January 1, 2021Amendments to IAS 19, ‘Plan amendment, curtailment or settlement’ January 1, 2019Amendments to IAS 28, ‘Long-term interests in associates and jointventures’
January 1, 2019
IFRIC 23, ‘Uncertainty over income tax treatments’ January 1, 2019Annual improvements to IFRSs 2015-2017 cycle January 1, 2019
2017 Annual Report
95
~20~
C. Annual improvements to IFRSs 2015-2017 cycle(a) Amendments to IFRS 3, ‘Business combinations’
The amendments clarified that obtaining control of a business that is a joint operation is abusiness combination achieved in stages. The acquirer should remeasure its previously heldinterest in the joint operation at fair value at of the acquisition date.
(b) Amendments to IAS 12, ‘Income taxes’The amendment clarified that the income tax consequences of dividends on financialinstruments classified as equity should be recognised according to where the past transactionsor events that generated distributable profits were recognised. These requirements apply to allincome tax consequences of dividends.
(d) Amendments to IAS 23, ‘Borrowing costs’The amendments clarified that if a specific borrowing remains outstanding after the relatedqualifying asset is ready for its intended use or sale, it becomes part of general borrowings.
4. SUMMARY OF SIGNIFICANT ACCOUNTING POLICIESThe principal accounting policies applied in the preparation of these consolidated financial statementsare set out below. These policies have been consistently applied to all the periods presented, unlessotherwise stated.(1) Compliance statement
These consolidated financial statements of the Group have been prepared in accordance with theRegulations Governing the Preparation of Financial Reports by Securities Issuers”, InternationalFinancial Reporting Standards, International Accounting Standards, IFRIC Interpretations, and SICInterpretations as endorsed by the FSC (collectively referred herein as the “IFRSs”).
(2) Basis of preparationA. Except for the following items, the consolidated financial statements have been prepared under
the historical cost convention:(a) Financial assets and financial liabilities (including derivative instruments) at fair value through
profit or loss.(b) Available-for-sale financial assets measured at fair value.(c) Defined benefit liabilities recognised based on the net amount of pension fund assets less
present value of defined benefit obligation.B. The preparation of financial statements in conformity with IFRSs requires the use of certain critical
accounting estimates. It also requires management to exercise its judgement in the process ofapplying the Group’s accounting policies. The areas involving a higher degree of judgement orcomplexity, or areas where assumptions and estimates are significant to the consolidated financialstatements are disclosed in Note 5.
96
4 Financial Statements
~21~
(3) Basis of consolidationA. Basis for preparation of consolidated financial statements:
(a) All subsidiaries are included in the Group’s consolidated financial statements. Subsidiariesare all entities (including structured entities) controlled by the Group. The Group controls anentity when the Group is exposed, or has rights, to variable returns from its involvement withthe entity and has the ability to affect those returns through its power over the entity.Consolidation of subsidiaries begins from the date the Group obtains control of the subsidiariesand ceases when the Group loses control of the subsidiaries.
(b) Inter-company transactions, balances and unrealised gains or losses on transactions betweencompanies within the Group are eliminated. Accounting policies of subsidiaries have beenadjusted where necessary to ensure consistency with the policies adopted by the Group.
(c) Profit or loss and each component of other comprehensive income are attributed to the ownersof the parent and to the non-controlling interests. Total comprehensive income is attributed tothe owners of the parent and to the non-controlling interests even if this results in the non-controlling interests having a deficit balance.
(d) Changes in a parent’s ownership interest in a subsidiary that do not result in the parent losingcontrol of the subsidiary (transactions with non-controlling interests) are accounted for asequity transactions, i.e. transactions with owners in their capacity as owners. Any differencebetween the amount by which the non-controlling interests are adjusted and the fair value ofthe consideration paid or received is recognised directly in equity.
(e) When the Group loses control of a subsidiary, the Group remeasures any investment retainedin the former subsidiary at its fair value. That fair value is regarded as the fair value on initialrecognition of a financial asset or the cost on initial recognition of the associate or joint venture.Any difference between fair value and carrying amount is recognised in profit or loss. Allamounts previously recognised in other comprehensive income in relation to the subsidiaryare reclassified to profit or loss on the same basis as would be required if the related assets orliabilities were disposed of. That is, when the Group loses control of a subsidiary, all gainsor losses previously recognised in other comprehensive income in relation to the subsidiaryshould be reclassified from equity to profit or loss, if such gains or losses would be reclassifiedto profit or loss when the related assets or liabilities are disposed of.
2017 Annual Report
97
~22~
B. Subsidiaries included in the consolidated financial statements:
Name of Name of Main business December 31, December 31,Investor Subsidiary activities 2017 2016 Description
The TTSC Cargo loading 55.00 55.00
Company and discharging
The Peony Investments in 100.00 100.00
Company transport-relatedbusiness
The ETS Terminal Services 100.00 100.00
Company
The EGH Container shipping and 79.00 - (i)Company agency services dealing
with port formalities
Peony GMS Container shipping 100.00 100.00
Peony Clove Investments in container 100.00 100.00
yards and port terminals
Peony EMU Container shipping 51.00 51.00
Peony EHIC(M) Manufacturing of 84.44 84.44
dry steel containersand container parts
Peony Armand Investments in container 70.00 70.00
N.V. yards and port terminals
Peony KTIL Loading, 20.00 20.00 (a)discharging, storage,repairs and cleaning
Peony MBPI Containers storage 95.03 95.03
and inspections ofcontainers at thecustoms house
Peony MBT Inland transportation, 17.39 17.39
repairs and cleaningof containers
Ownership (%)
98
4 Financial Statements
~23~
Name of Name of Main business December 31, December 31,Investor Subsidiary activities 2017 2016 Description
Ownership (%)
Peony EGS Agency services dealing 51.00 51.00
with port formalities
Peony EGK Agency services dealing 100.00 100.00
with port formalities
Peony EGT Agency services dealing 85.00 51.00 (j)with port formalities
Peony EGI Agency services dealing 99.99 99.99
with port formalities
Peony EMA Agency services dealing 67.50 67.50
with port formalities
Peony EIT Agency services dealing 55.00 55.00
with port formalities
Peony EES Agency services dealing 100.00 55.00 (k)with port formalities
Peony ERU Agency services dealing 51.00 51.00
with port formalities
Peony EEU Agency services dealing 100.00 100.00
with port formalities
Peony EGD-WWX Agency services dealing 100.00 100.00 (d)with port formalities
Peony EGF Agency services dealing - 100.00 (c)with port formalities
Peony EGN Agency services dealing - 100.00 (g)with port formalities
Peony ESA Agency services dealing 55.00 55.00
with port formalities
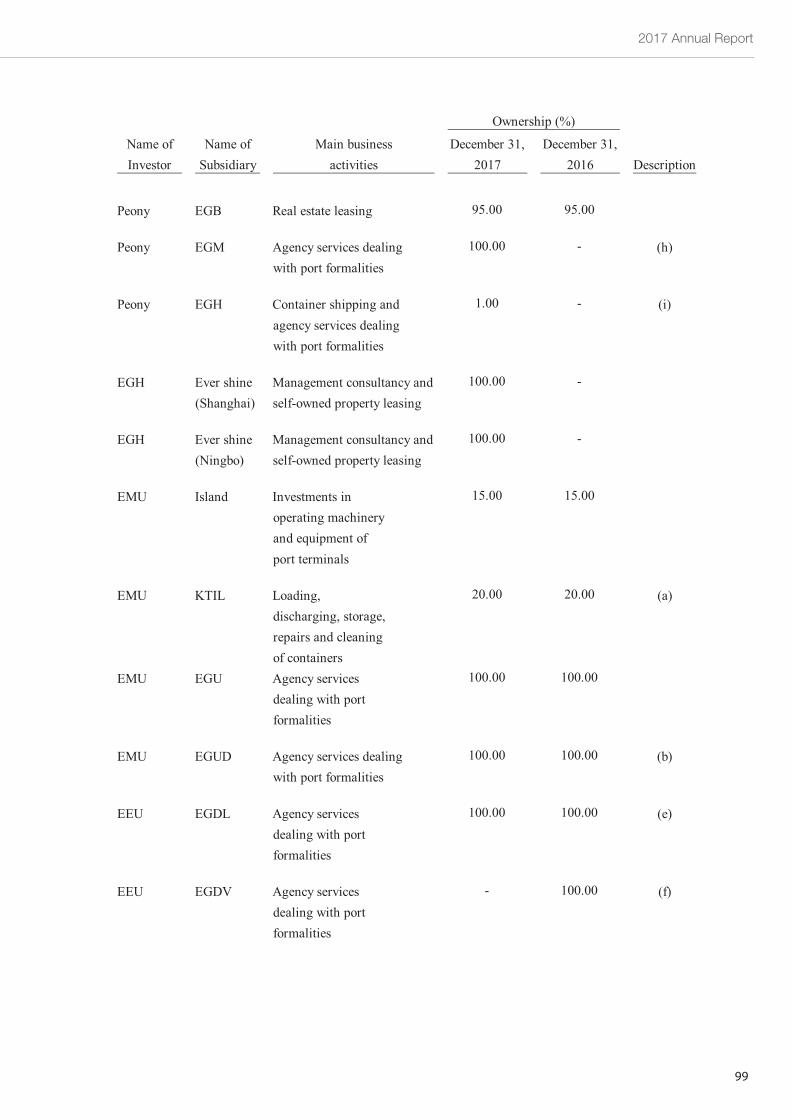
2017 Annual Report
99
~24~
Name of Name of Main business December 31, December 31,Investor Subsidiary activities 2017 2016 Description
Ownership (%)
Peony EGB Real estate leasing 95.00 95.00
Peony EGM Agency services dealing 100.00 - (h)with port formalities
Peony EGH Container shipping and 1.00 - (i)agency services dealingwith port formalities
EGH Ever shine Management consultancy and 100.00 -
(Shanghai) self-owned property leasing
EGH Ever shine Management consultancy and 100.00 -
(Ningbo) self-owned property leasing
EMU Island Investments in 15.00 15.00
operating machineryand equipment ofport terminals
EMU KTIL Loading, 20.00 20.00 (a)discharging, storage,repairs and cleaningof containers
EMU EGU Agency services 100.00 100.00
dealing with portformalities
EMU EGUD Agency services dealing 100.00 100.00 (b)with port formalities
EEU EGDL Agency services 100.00 100.00 (e)dealing with portformalities
EEU EGDV Agency services - 100.00 (f)dealing with portformalities
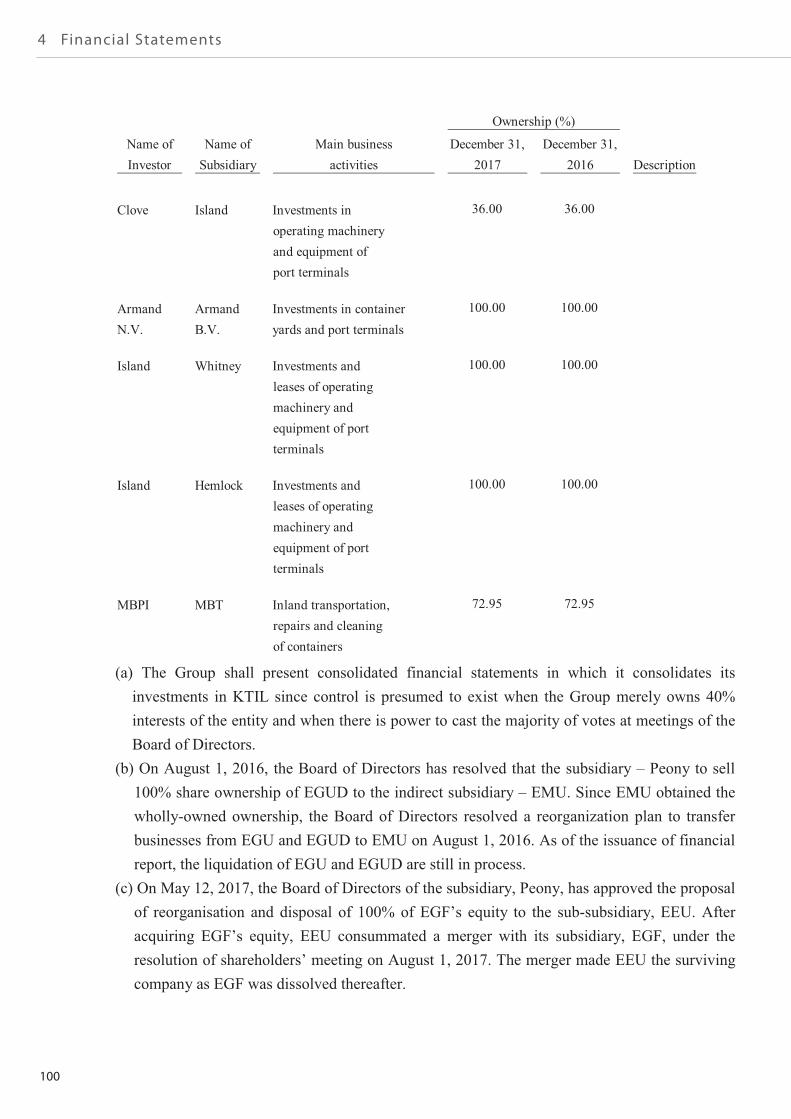
100
4 Financial Statements
~25~
(a) The Group shall present consolidated financial statements in which it consolidates itsinvestments in KTIL since control is presumed to exist when the Group merely owns 40%interests of the entity and when there is power to cast the majority of votes at meetings of theBoard of Directors.
(b) On August 1, 2016, the Board of Directors has resolved that the subsidiary – Peony to sell100% share ownership of EGUD to the indirect subsidiary – EMU. Since EMU obtained thewholly-owned ownership, the Board of Directors resolved a reorganization plan to transferbusinesses from EGU and EGUD to EMU on August 1, 2016. As of the issuance of financialreport, the liquidation of EGU and EGUD are still in process.
(c) On May 12, 2017, the Board of Directors of the subsidiary, Peony, has approved the proposalof reorganisation and disposal of 100% of EGF’s equity to the sub-subsidiary, EEU. Afteracquiring EGF’s equity, EEU consummated a merger with its subsidiary, EGF, under theresolution of shareholders’ meeting on August 1, 2017. The merger made EEU the survivingcompany as EGF was dissolved thereafter.
Name of Name of Main business December 31, December 31,Investor Subsidiary activities 2017 2016 Description
Ownership (%)
Clove Island Investments in 36.00 36.00
operating machineryand equipment ofport terminals
Armand Armand Investments in container 100.00 100.00
N.V. B.V. yards and port terminals
Island Whitney Investments and 100.00 100.00
leases of operatingmachinery andequipment of portterminals
Island Hemlock Investments and 100.00 100.00
leases of operatingmachinery andequipment of portterminals
MBPI MBT Inland transportation, 72.95 72.95
repairs and cleaningof containers
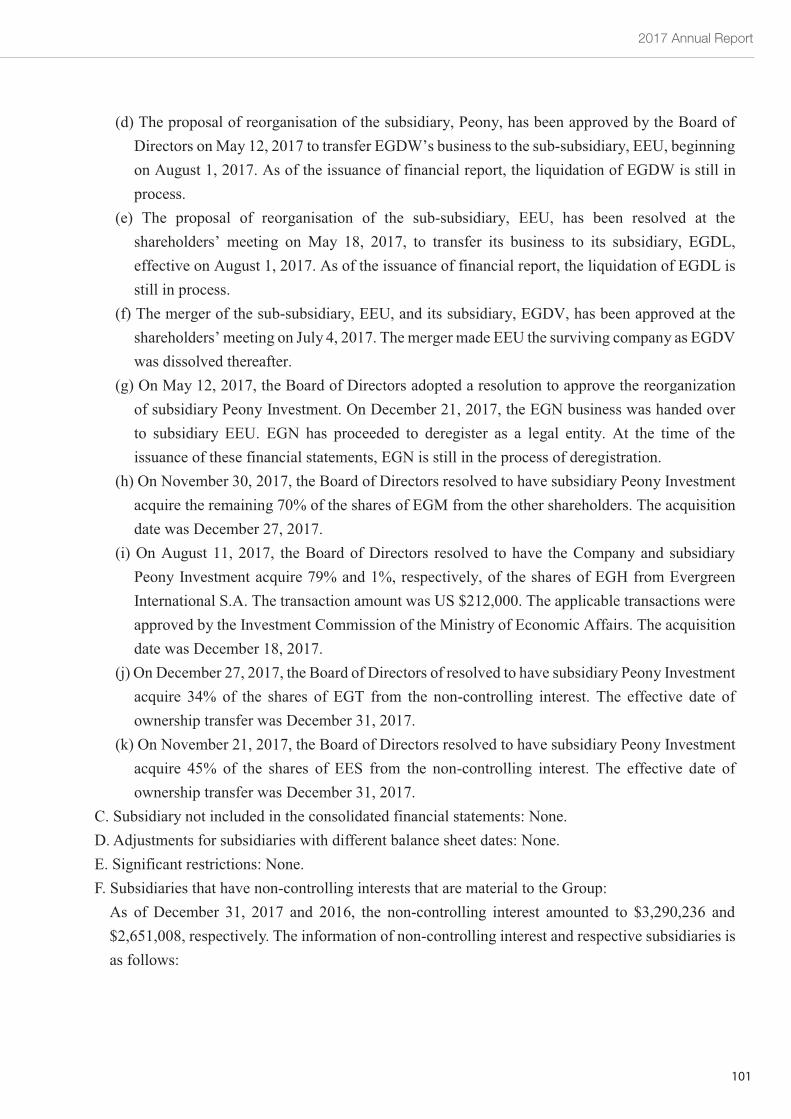
2017 Annual Report
101
~26~
(d) The proposal of reorganisation of the subsidiary, Peony, has been approved by the Board ofDirectors on May 12, 2017 to transfer EGDW’s business to the sub-subsidiary, EEU, beginningon August 1, 2017. As of the issuance of financial report, the liquidation of EGDW is still inprocess.
(e) The proposal of reorganisation of the sub-subsidiary, EEU, has been resolved at theshareholders’ meeting on May 18, 2017, to transfer its business to its subsidiary, EGDL,effective on August 1, 2017. As of the issuance of financial report, the liquidation of EGDL isstill in process.
(f) The merger of the sub-subsidiary, EEU, and its subsidiary, EGDV, has been approved at theshareholders’ meeting on July 4, 2017. The merger made EEU the surviving company as EGDVwas dissolved thereafter.
(g) On May 12, 2017, the Board of Directors adopted a resolution to approve the reorganizationof subsidiary Peony Investment. On December 21, 2017, the EGN business was handed overto subsidiary EEU. EGN has proceeded to deregister as a legal entity. At the time of theissuance of these financial statements, EGN is still in the process of deregistration.
(h) On November 30, 2017, the Board of Directors resolved to have subsidiary Peony Investmentacquire the remaining 70% of the shares of EGM from the other shareholders. The acquisitiondate was December 27, 2017.
(i) On August 11, 2017, the Board of Directors resolved to have the Company and subsidiaryPeony Investment acquire 79% and 1%, respectively, of the shares of EGH from EvergreenInternational S.A. The transaction amount was US $212,000. The applicable transactions wereapproved by the Investment Commission of the Ministry of Economic Affairs. The acquisitiondate was December 18, 2017.
(j) On December 27, 2017, the Board of Directors of resolved to have subsidiary Peony Investmentacquire 34% of the shares of EGT from the non-controlling interest. The effective date ofownership transfer was December 31, 2017.
(k) On November 21, 2017, the Board of Directors resolved to have subsidiary Peony Investmentacquire 45% of the shares of EES from the non-controlling interest. The effective date ofownership transfer was December 31, 2017.
C. Subsidiary not included in the consolidated financial statements: None.D. Adjustments for subsidiaries with different balance sheet dates: None.E. Significant restrictions: None.F. Subsidiaries that have non-controlling interests that are material to the Group:
As of December 31, 2017 and 2016, the non-controlling interest amounted to $3,290,236 and$2,651,008, respectively. The information of non-controlling interest and respective subsidiaries isas follows:
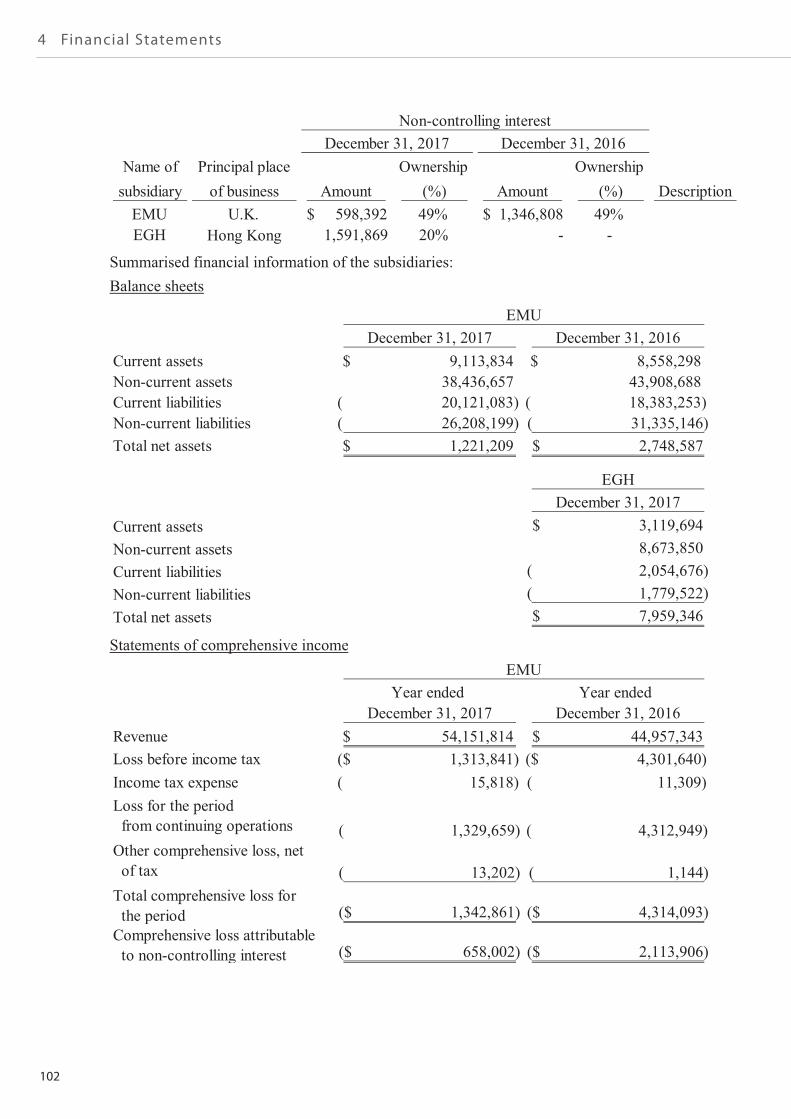
102
4 Financial Statements
~27~
Summarised financial information of the subsidiaries:Balance sheets
Statements of comprehensive income
Name of Principal place Ownership Ownershipsubsidiary of business Amount (%) Amount (%) Description
EMU U.K. $ 598,392 49% $ 1,346,808 49%EGH Hong Kong 1,591,869 20% - -
Non-controlling interestDecember 31, 2017 December 31, 2016
December 31, 2017 December 31, 2016Current assets 9,113,834$ 8,558,298$Non-current assets 38,436,657 43,908,688Current liabilities 20,121,083)( 18,383,253)(Non-current liabilities 26,208,199)( 31,335,146)(Total net assets 1,221,209$ 2,748,587$
EMU
EGHDecember 31, 2017
Current assets 3,119,694$Non-current assets 8,673,850Current liabilities 2,054,676)(Non-current liabilities 1,779,522)(Total net assets 7,959,346$
Year ended Year endedDecember 31, 2017 December 31, 2016
Revenue 54,151,814$ 44,957,343$Loss before income tax 1,313,841)($ 4,301,640)($Income tax expense 15,818)( 11,309)(Loss for the period
from continuing operations 1,329,659)( 4,312,949)(Other comprehensive loss, net
of tax 13,202)( 1,144)(Total comprehensive loss for
the period 1,342,861)($ 4,314,093)($Comprehensive loss attributable
to non-controlling interest 658,002)($ 2,113,906)($
EMU
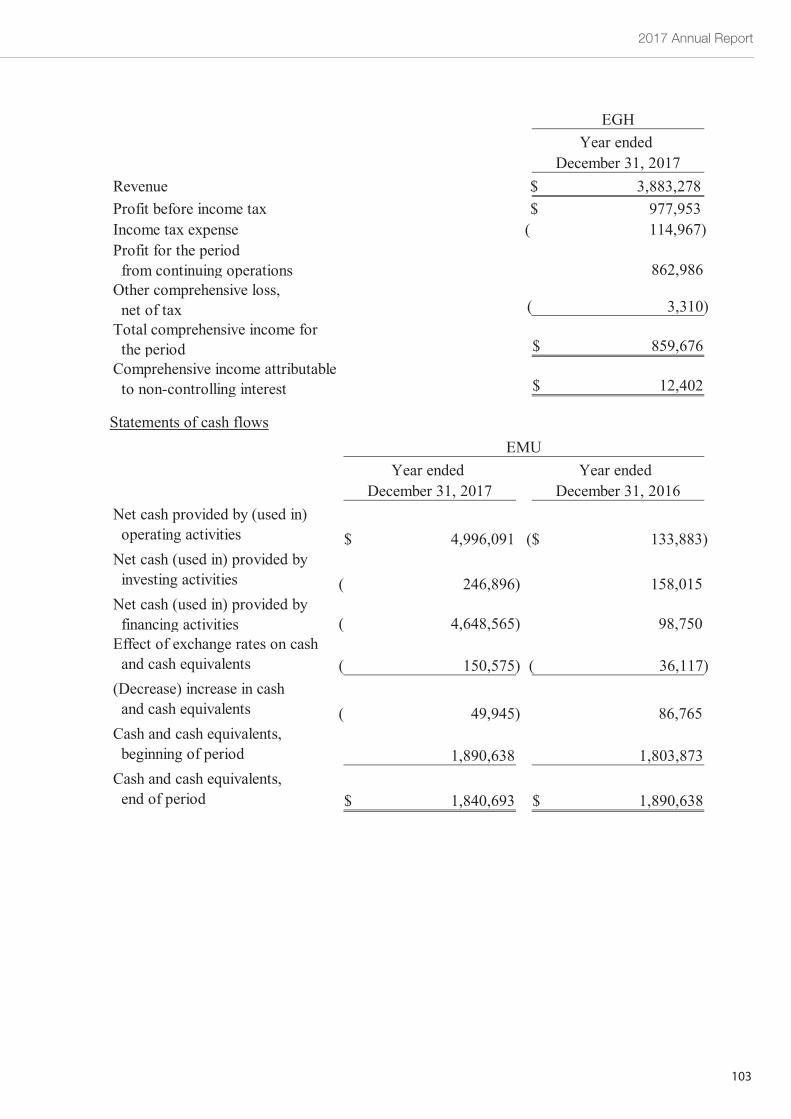
2017 Annual Report
103
~28~
Statements of cash flows
EGHYear ended
December 31, 2017Revenue 3,883,278$Profit before income tax 977,953$Income tax expense 114,967)(Profit for the period
from continuing operations 862,986Other comprehensive loss,
net of tax 3,310)(Total comprehensive income for
the period 859,676$Comprehensive income attributable
to non-controlling interest 12,402$
Year ended Year endedDecember 31, 2017 December 31, 2016
Net cash provided by (used in)operating activities 4,996,091$ 133,883)($
Net cash (used in) provided byinvesting activities 246,896)( 158,015
Net cash (used in) provided byfinancing activities 4,648,565)( 98,750
Effect of exchange rates on cashand cash equivalents 150,575)( 36,117)(
(Decrease) increase in cashand cash equivalents 49,945)( 86,765
Cash and cash equivalents,beginning of period 1,890,638 1,803,873
Cash and cash equivalents,end of period 1,840,693$ 1,890,638$
EMU
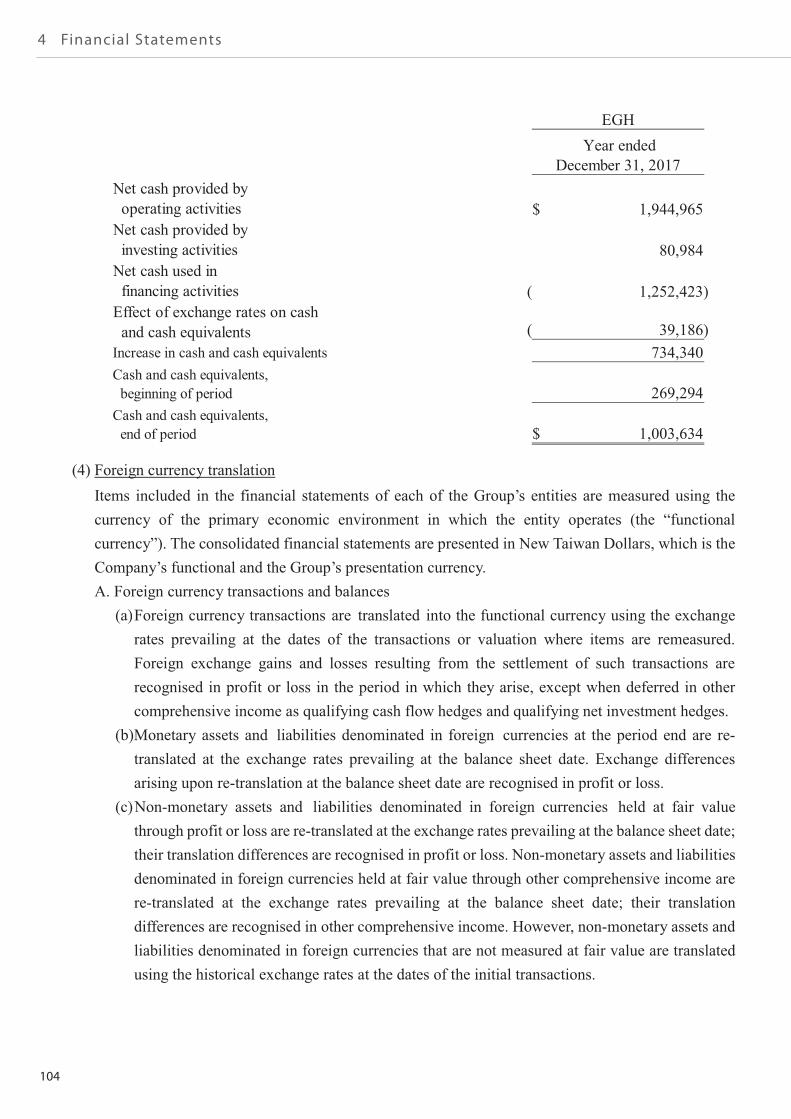
104
4 Financial Statements
~29~
(4) Foreign currency translationItems included in the financial statements of each of the Group’s entities are measured using thecurrency of the primary economic environment in which the entity operates (the “functionalcurrency”). The consolidated financial statements are presented in New Taiwan Dollars, which is theCompany’s functional and the Group’s presentation currency.A. Foreign currency transactions and balances
(a) Foreign currency transactions are translated into the functional currency using the exchangerates prevailing at the dates of the transactions or valuation where items are remeasured.Foreign exchange gains and losses resulting from the settlement of such transactions arerecognised in profit or loss in the period in which they arise, except when deferred in othercomprehensive income as qualifying cash flow hedges and qualifying net investment hedges.
(b) Monetary assets and liabilities denominated in foreign currencies at the period end are re-translated at the exchange rates prevailing at the balance sheet date. Exchange differencesarising upon re-translation at the balance sheet date are recognised in profit or loss.
(c) Non-monetary assets and liabilities denominated in foreign currencies held at fair valuethrough profit or loss are re-translated at the exchange rates prevailing at the balance sheet date;their translation differences are recognised in profit or loss. Non-monetary assets and liabilitiesdenominated in foreign currencies held at fair value through other comprehensive income arere-translated at the exchange rates prevailing at the balance sheet date; their translationdifferences are recognised in other comprehensive income. However, non-monetary assets andliabilities denominated in foreign currencies that are not measured at fair value are translatedusing the historical exchange rates at the dates of the initial transactions.
EGHYear ended
December 31, 2017Net cash provided by
operating activities 1,944,965$Net cash provided by
investing activities 80,984Net cash used in
financing activities 1,252,423)(Effect of exchange rates on cash
and cash equivalents 39,186)(Increase in cash and cash equivalents 734,340Cash and cash equivalents,
beginning of period 269,294Cash and cash equivalents,
end of period 1,003,634$
2017 Annual Report
105
~30~
(d) All other foreign exchange gains and losses based on the nature of those transactions arepresented in the statement of comprehensive income within ‘other gains and losses’.
B. Translation of foreign operations(a) The operating results and financial position of all the group entities and associates that have a
functional currency different from the presentation currency are translated into the presentationcurrency as follows:
i. Assets and liabilities for each balance sheet presented are translated at the closing exchangerate at the date of that balance sheet;
ii. Income and expenses for each statement of comprehensive income are translated at averageexchange rates of that period; and
iii. All resulting exchange differences are recognised in other comprehensive income.(b) When the foreign operation partially disposed of or sold is an associate, exchange differences
that were recorded in other comprehensive income are proportionately reclassified to profit orloss as part of the gain or loss on sale. In addition, even when the Group retains partial interestin the former foreign associate after losing significant influence over the former foreignassociate, such transactions should be accounted for as disposal of all interest in these foreignoperations.
(c) When the foreign operation partially disposed of or sold is a subsidiary, cumulative exchangedifferences that were recorded in other comprehensive income are proportionately transferredto the non-controlling interest in this foreign operation. In addition, even when the Groupretains partial interest in the former foreign subsidiary after losing control of the former foreignsubsidiary, such transactions should be accounted for as disposal of all interest in the foreignoperation.
(5) Classification of current and non-current itemsA. Assets that meet one of the following criteria are classified as current assets; otherwise they are
classified as non-current assets:(a) Assets arising from operating activities that are expected to be realised, or are intended to be
sold or consumed within the normal operating cycle;(b) Assets held mainly for trading purposes;(c) Assets that are expected to be realised within twelve months from the balance sheet date;(d) Cash and cash equivalents, excluding restricted cash and cash equivalents and those that are to
be exchanged or used to settle liabilities more than twelve months after the balance sheet date.B. Liabilities that meet one of the following criteria are classified as current liabilities; otherwise they
are classified as non-current liabilities:(a) Liabilities that are expected to be settled within the normal operating cycle;(b) Liabilities arising mainly from trading activities;(c) Liabilities that are to be settled within twelve months from the balance sheet date;
106
4 Financial Statements
~31~
(d) Liabilities for which the repayment date cannot be extended unconditionally to more thantwelve months after the balance sheet date. Terms of a liability that could, at the option of thecounterparty, result in its settlement by the issue of equity instruments do not affect itsclassification.
(6) Cash equivalentsCash equivalents refer to short-term, highly liquid investments that are readily convertible to knownamounts of cash and which are subject to an insignificant risk of changes in value. Time deposits withoriginal maturities of one year or less that meet the definition above and are held for the purpose ofmeeting short-term cash commitments in operations are classified as cash equivalents.
(7) Financial assets at fair value through profit or lossA. Financial assets at fair value through profit or loss are financial assets held for trading or financial
assets designated as at fair value through profit or loss on initial recognition. Financial assets areclassified in this category of held for trading if acquired principally for the purpose of selling in theshort-term. Derivatives are also categorized as financial assets held for trading unless they aredesignated as hedges. Financial assets that meet one of the following criteria are designated as atfair value through profit or loss on initial recognition:(a) Hybrid (combined) contracts; or(b) They eliminate or significantly reduce a measurement or recognition inconsistency; or(c) They are managed and their performance is evaluated on a fair value basis, in accordance with
a documented risk management or investment strategy.B. On a regular way purchase or sale basis, financial assets at fair value through profit or loss are
recognised and derecognised using trade date accounting.C. Financial assets at fair value through profit or loss are initially recognised at fair value. Related
transaction costs are expensed in profit or loss. These financial assets are subsequently remeasuredand stated at fair value, and any changes in the fair value of these financial assets are recognisedin profit or loss.
(8) Available-for-sale financial assetsA. Available-for-sale financial assets are non-derivatives that are either designated in this category
or not classified in any of the other categories.B. On a regular way purchase or sale basis, available-for-sale financial assets are recognised and
derecognised using trade date accounting.C. Available-for-sale financial assets are initially recognised at fair value plus transaction costs. These
financial assets are subsequently remeasured and stated at fair value, and any changes in the fairvalue of these financial assets are recognised in other comprehensive income. Investments inequity instruments that do not have a quoted market price in an active market and whose fair valuecannot be reliably measured are presented in ‘financial assets carried at cost’.
2017 Annual Report
107
~32~
(9) Held-to-maturity financial assetsA. Held-to-maturity financial assets are non-derivative financial assets with fixed or determinable
payments and fixed maturity date that the Group has the positive intention and ability to hold tomaturity other than those that meet the definition of loans and receivables and those that aredesignated as at fair value through profit or loss or as available-for-sale on initial recognition.
B. On a regular way purchase or sale basis, held-to-maturity financial assets are recognised andderecognised using trade date accounting.
C. Held-to-maturity financial assets are initially recognised at fair value on the trade date plustransaction costs and subsequently measured at amortised cost using the effective interest method,less provision for impairment. Amortisation of a premium or a discount on such assets isrecognised in profit or loss.
(10) Notes, accounts and other receivablesNotes and accounts receivable are claims resulting from the sale of goods or services. Receivablesarising from transactions other than the sale of goods or services are classified as other receivables.Notes, accounts and other receivables are recognised initially at fair value and subsequentlymeasured at amortised cost using the effective interest method, less provision for impairment.However, short-term accounts receivable without bearing interest are subsequently measured atinitial invoice amount as effect of discounting is immaterial.
(11) Impairment of financial assetsA. The Group assesses at each balance sheet date whether there is objective evidence that a financial
asset or a group of financial assets is impaired as a result of one or more events that occurred afterthe initial recognition of the asset (a ‘loss event’) and that loss event (or events) has an impact onthe estimated future cash flows of the financial asset or group of financial assets that can bereliably estimated.
B. The criteria that the Group uses to determine whether there is objective evidence of an impairmentloss is as follows:(a) Significant financial difficulty of the issuer or debtor;(b) A breach of contract, such as a default or delinquency in interest or principal payments;(c) The Group, for economic or legal reasons relating to the borrower’s financial difficulty, granted
the borrower a concession that a lender would not otherwise consider;(d) It becomes probable that the borrower will enter bankruptcy or other financial reorganisation;(e) The disappearance of an active market for that financial asset because of financial difficulties;(f) Observable data indicating that there is a measurable decrease in the estimated future cash
flows from a group of financial assets since the initial recognition of those assets, althoughthe decrease cannot yet be identified with the individual financial asset in the group, includingadverse changes in the payment status of borrowers in the group or national or local economicconditions that correlate with defaults on the assets in the group;
108
4 Financial Statements
~33~
(g) Information about significant changes with an adverse effect that have taken place in thetechnology, market, economic or legal environment in which the issuer operates, and indicatesthat the cost of the investment in the equity instrument may not be recovered; or
(h) A significant or prolonged decline in the fair value of an investment in an equity instrumentbelow its cost.
C. When the Group assesses that there has been objective evidence of impairment and an impairmentloss has occurred, accounting for impairment is made as follows according to the category offinancial assets:(a) Financial assets measured at cost
The amount of the impairment loss is measured as the difference between the asset’s carryingamount and the present value of estimated future cash flows discounted at current marketreturn rate of similar financial assets, and is recognised in profit or loss. Impairment lossrecognised for this category shall not be reversed subsequently. Impairment loss is recognisedby adjusting the carrying amount of the asset through the use of an impairment allowanceaccount.
(b) Available-for-sale financial assetsThe amount of the impairment loss is measured as the difference between the asset’sacquisition cost (less any principal repayment and amortisation) and current fair value, lessany impairment loss on that financial asset previously recognised in profit or loss, and isreclassified from ‘other comprehensive income’ to ‘profit or loss’. If, in a subsequent period,the fair value of an investment in a debt instrument increases, and the increase can be relatedobjectively to an event occurring after the impairment loss was recognised, such impairmentloss is reversed through profit or loss. Impairment loss of an investment in an equityinstrument recognised in profit or loss shall not be reversed through profit or loss. Impairmentloss is recognised and reversed by adjusting the carrying amount of the asset through the useof an impairment allowance account.
(12) Derecognition of financial assetsThe Group derecognises a financial asset when one of the following conditions is met:A. The contractual rights to receive cash flows from the financial asset expire.B. The contractual rights to receive cash flows from the financial asset have been transferred and
the Group has transferred substantially all risks and rewards of ownership of the financial asset.C. The contractual rights to receive cash flows from the financial asset have been transferred;
however, the Group has not retained control of the financial asset.(13) Leases (lessor)
Lease income from an operating lease (net of any incentives given to the lessee) is recognised inprofit or loss on a straight-line basis over the lease term.
2017 Annual Report
109
~34~
(14) InventoriesInventories refer to fuel inventories and steel inventories. Fuel inventories are physically measuredby the crew of each ship and reported back to the Head Office through telegraph for recordingpurposes at balance sheet date. Valuation of inventories is based on the exchange rate prevailing atbalance sheet date.The perpetual inventory system is adopted for steel inventory recognition. Steel inventories arestated at cost. The cost is determined using the weighted-average method. At the end of period,inventories are evaluated at the lower of cost or net realisable value, and the individual item approachis used in the comparison of cost and net realisable value. The calculation of net realisable valueshould be based on the estimated selling price in the normal course of business, net of estimatedcosts of completion and estimated selling expenses.
(15) Investments accounted for using equity method / associatesA. Associates are all entities over which the Group has significant influence but not control. In
general, it is presumed that the investor has significant influence, if an investor holds, directly orindirectly 20 percent or more of the voting power of the investee. Investments in associates areaccounted for using the equity method and are initially recognised at cost.
B. The Group’s share of its associates’ post-acquisition profits or losses is recognised in profit orloss, and its share of post-acquisition movements in other comprehensive income is recognised inother comprehensive income. When the Group’s share of losses in an associate equals or exceedsits interest in the associate, including any other unsecured receivables, the Group does notrecognise further losses, unless it has incurred legal or constructive obligations or made paymentson behalf of the associate.
C. When changes in an associate’s equity that are not recognised in profit or loss or othercomprehensive income of the associate and such changes not affecting the Group’s ownershippercentage of the associate, the Group recognises the Group’s share of change in equity of theassociate in ‘capital surplus’ in proportion to its ownership.
D. Unrealised gains and loss on transactions between the Group and its associates are eliminated tothe extent of the Group’s interest in the associates. Unrealised losses are also eliminated unlessthe transaction provides evidence of an impairment of the asset transferred. Accounting policiesof associates have been adjusted where necessary to ensure consistency with the policies adoptedby the Group.
E. In the case that an associate issues new shares and the Group does not subscribe or acquire newshares proportionately, which results in a change in the Group’s ownership percentage of theassociate but maintains significant influence on the associate, then ‘capital surplus’ and‘investments accounted for using equity method’ shall be adjusted for the increase or decrease ofits share of equity interest. If the above condition causes a decrease in the Group’s ownershippercentage of the associate, in addition to the above adjustment, the amounts previously
110
4 Financial Statements
~35~
recognised in other comprehensive income in relation to the associate are reclassified to profit orloss proportionately on the same basis as would be required if the relevant assets or liabilitieswere disposed of.
F. Upon loss of significant influence over an associate, the Group remeasures any investmentretained in the former associate at its fair value. Any difference between fair value and carryingamount is recognised in profit or loss.
G. When the Group disposes its investment in an associate and loses significant influence over thisassociate, the amounts previously recognised in other comprehensive income in relation to theassociate, are reclassified to profit or loss, on the same basis as would be required if the relevantassets or liabilities were disposed of. If it retains significant influence over this associate, theamounts previously recognised in other comprehensive income in relation to the associate arereclassified to profit or loss proportionately in accordance with the aforementioned approach.
H. When the Group disposes its investment in an associate and loses significant influence over thisassociate, the amounts previously recognised as capital surplus in relation to the associate aretransferred to profit or loss. If it still retains significant influence over this associate, then theamounts previously recognised as capital surplus in relation to the associate are transferred toprofit or loss proportionately.
(16) Property, plant and equipmentA. Property, plant and equipment are initially recorded at cost. Borrowing costs incurred during the
construction period are capitalised.B. Subsequent costs are included in the asset’s carrying amount or recognised as a separate asset, as
appropriate, only when it is probable that future economic benefits associated with the item willflow to the Group and the cost of the item can be measured reliably. The carrying amount of thereplaced part is derecognised. All other repairs and maintenance are charged to profit or lossduring the financial period in which they are incurred.
C. Land is not depreciated. Other property, plant and equipment apply cost model and aredepreciated using the straight-line method to allocate their cost over their estimated useful lives.Each part of an item of property, plant, and equipment with a cost that is significant in relation tothe total cost of the item must be depreciated separately.
D. The assets’ residual values, useful lives and depreciation methods are reviewed, and adjusted ifappropriate, at each balance sheet date. If expectations for the assets’ residual values and usefullives differ from previous estimates or the patterns of consumption of the assets’ future economicbenefits embodied in the assets have changed significantly, any change is accounted for as achange in estimate under IAS 8, ‘Accounting Policies, Changes in Accounting Estimates andErrors’, from the date of the change. The estimated useful lives of property, plant and equipmentare as follows:
2017 Annual Report
111
~36~
Buildings 20 ~ 135 yearsLoading and unloading equipment 2 ~ 20 yearsShips 18 ~ 25 yearsTransportation equipment 6 ~ 10 yearsLease assets 3 ~ 90 yearsOther equipment 2 ~ 15 years
(17) Leased assets/ operating leases (lessee)A. Based on the terms of a lease contract, a lease is classified as a finance lease if the Group assumes
substantially all the risks and rewards incidental to ownership of the leased asset.(a) A finance lease is recognised as an asset and a liability at the lease’s commencement at the
lower of the fair value of the leased asset or the present value of the minimum lease payments.(b) The minimum lease payments are apportioned between the finance charges and the reduction
of the outstanding liability. The finance charges are allocated to each period over the leaseterm so as to produce a constant periodic rate of interest on the remaining balance of theliability.
(c) Property, plant and equipment held under finance leases are depreciated over their estimateduseful lives. If there is no reasonable certainty that the Group will obtain ownership at the endof the lease, the asset shall be depreciated over the shorter of the lease term and its useful life.
B. Payments made under an operating lease (net of any incentives received from the lessor) arerecognised in profit or loss on a straight-line basis over the lease term.
C. The accounting treatment of sale and leaseback transactions depends on the substance of thetransaction. If sale and finance leaseback is in substance a financing transaction, the differencebetween the sales proceeds and the carrying value of the asset is deferred and amortised to theincome statement over the lease term. If the sale price is below the fair value, the differencebetween sale price and carrying amount should be recognised immediately except that, if a lossarising is compensated by future rent at below market price, it should be deferred and amortisedin proportion to the rent payments over the period for which the asset is expected to be used. Ifthe sale price is above the fair value, the excess of proceeds over fair value should be deferredand amortised over the period for which the asset is expected to be used.
(18) Investment propertyAn investment property is stated initially at its cost and measured subsequently using the cost model.Except for land, investment property is depreciated on a straight-line basis over its estimated usefullife of 20 ~ 60 years.
(19) Intangible assetsComputer software is stated at cost and amortised on a straight-line basis over its estimated usefullife of 3 years.
112
4 Financial Statements
~37~
(20) Impairment of non-financial assetsThe Group assesses at each balance sheet date the recoverable amounts of those assets where thereis an indication that they are impaired. An impairment loss is recognised for the amount by whichthe asset’s carrying amount exceeds its recoverable amount. The recoverable amount is the higherof an asset’s fair value less costs to sell or value in use. When the circumstances or reasons forrecognizing impairment loss for an asset in prior years no longer exist or diminish, the impairmentloss is reversed. The increased carrying amount due to reversal should not be more than what thedepreciated or amortised historical cost would have been if the impairment had not been recognised.
(21) BorrowingsA. Borrowings are recognised initially at fair value, net of transaction costs incurred. Borrowings
are subsequently stated at amortised cost; any difference between the proceeds (net of transactioncosts) and the redemption value is recognised in profit or loss over the period of the borrowingsusing the effective interest method.
B. Fees paid on the establishment of loan facilities are recognised as transaction costs of the loan tothe extent that it is probable that some or all of the facility will be drawn down. In this case, thefee is deferred until the draw-down occurs. To the extent there is no evidence that it is probablethat some or all of the facility will be drawn down, the fee is capitalised as a pre-payment forliquidity services and amortised over the period of the facility to which it relates.
(22) Accounts payableAccounts payable are obligations to pay for goods or services that have been acquired in the ordinarycourse of business from suppliers. They are recognised initially at fair value and subsequentlymeasured at amortised cost using the effective interest method. However, short-term accountspayable without bearing interest are subsequently measured at initial invoice amount as effect ofdiscounting is immaterial.
(23) Financial liabilities at fair value through profit or lossA. Financial liabilities at fair value through profit or loss are financial liabilities held for trading or
financial liabilities designated as at fair value through profit or loss on initial recognition.Financial liabilities are classified in this category of held for trading if acquired principally forthe purpose of repurchasing in the short-term. Derivatives are also categorized as financialliabilities held for trading unless they are designated as hedges. Financial liabilities that meet oneof the following criteria are designated as at fair value through profit or loss on initial recognition:(a) Hybrid (combined) contracts; or(b) They eliminate or significantly reduce a measurement or recognition inconsistency; or(c) They are managed and their performance is evaluated on a fair value basis, in accordance
with a documented risk management policy.B. Financial liabilities at fair value through profit or loss are initially recognised at fair value. Related
transaction costs are expensed in profit or loss. These financial liabilities are subsequentlyremeasured and stated at fair value, and any changes in the fair value of these financial liabilities
2017 Annual Report
113
~38~
are recognised in profit or loss. Derivative liabilities that are linked to equity instruments whichdo not have a quoted market price in an active market and whose fair value cannot be reliablymeasured, and that must be settled by delivery of such unquoted equity instruments are presentedin ‘financial liabilities measured at cost’.
(24) Derecognition of financial liabilitiesA financial liability is derecognised when the obligation under the liability specified in the contractis discharged or cancelled or expires.
(25) Offsetting financial instrumentsFinancial assets and liabilities are offset and reported in the net amount in the balance sheet whenthere is a legally enforceable right to offset the recognised amounts and there is an intention to settleon a net basis or realise the asset and settle the liability simultaneously.
(26) Financial liabilities and equity instrumentsA. Ordinary corporate bonds issued by the Group are initially recognised at fair value, net of
transaction costs incurred. Ordinary corporate bonds are subsequently stated at amortised cost;any difference between the proceeds (net of transaction costs) and the redemption value isaccounted for as the premium or discount on bonds payable and presented as an addition to ordeduction from bonds payable, which is amortised in profit or loss as an adjustment to the ‘financecosts’ over the period of bond circulation using the effective interest method.
B. Convertible corporate bonds issued by the Group contain conversion options (that is, thebondholders have the right to convert the bonds into the Group’s common shares by exchanginga fixed amount of cash for a fixed number of common shares), call options and put options. TheGroup classifies the bonds payable and derivative features embedded in convertible corporatebonds on initial recognition as a financial asset, a financial liability or an equity instrument.Convertible corporate bonds are accounted for as follows:(a) Call options and put options embedded in convertible corporate bonds are recognised initially
at net fair value as ‘financial assets or financial liabilities at fair value through profit or loss’.They are subsequently remeasured and stated at fair value on each balance sheet date; the gainor loss is recognised as ‘gain or loss on valuation of financial assets or financial liabilities atfair value through profit or loss’.
(b) Bonds payable of convertible corporate bonds is initially recognised at fair value andsubsequently stated at amortised cost. Any difference between the proceeds and theredemption value is accounted for as the premium or discount on bonds payable and presentedas an addition to or deduction from bonds payable, which is amortised in profit or loss as anadjustment to the ‘finance costs’ over the period of bond circulation using the effective interestmethod.
(c) Conversion options embedded in convertible corporate bonds issued by the Group, whichmeet the definition of an equity instrument, are initially recognised in ‘capital surplus—stock
114
4 Financial Statements
~39~
warrants’ at the residual amount of total issue price less amounts of ‘financial assets orfinancial liabilities at fair value through profit or loss’ and ‘bonds payable—net’ as statedabove. Conversion options are not subsequently remeasured.
(d) Any transaction costs directly attributable to the issuance of convertible corporate bonds areallocated to the liability and equity components in proportion to the allocation of proceeds.
(e) When bondholders exercise conversion options, the liability component of the bonds(including ‘bonds payable’ and ‘financial assets or financial liabilities at fair value throughprofit or loss’) shall be remeasured on the conversion date. The book value of common sharesissued due to the conversion shall be based on the adjusted book value of the abovementionedliability component plus the book value of capital surplus - share options.
(27) Derivative financial instruments and hedging activitiesA. Derivatives are initially recognised at fair value on the date a derivative contract is entered into
and are subsequently remeasured at their fair value. Any changes in the fair value are recognisedin profit or loss.
B. The Group designates certain derivatives as hedges of a particular risk associated with arecognised asset or liability or a highly probable forecast transaction (cash flow hedge).
C. The Group documents at the inception of the transaction the relationship between hedginginstruments and hedged items, as well as its risk management objectives and strategy forundertaking various hedging transactions. The Group also documents its assessment, both athedge inception and on an ongoing basis, of whether the derivatives that are used in hedgingtransactions are highly effective in offsetting changes in fair values or cash flows of hedged items.
D. The full fair value of a hedging derivative is classified as a non-current asset or liability when theremaining maturity of the hedged item is more than 12 months, and as a current asset or liabilitywhen the remaining maturity of the hedged item is less than 12 months. Trading derivatives areclassified as current assets or liabilities.
E. Cash flow hedge(a) The effective portion of changes in the fair value of derivatives that are designated and qualified
as cash flow hedges is recognised in other comprehensive income. The gain or loss relating tothe ineffective portion is recognised immediately in the statement of comprehensive incomewithin ‘other gains and losses’.
(b) Amounts accumulated in other comprehensive income are reclassified into profit or loss in theperiods when the hedged item affects profit or loss. The gain or loss relating to the effectiveportion of interest rate swaps hedging variable rate borrowings is recognised in the statementof comprehensive income within ‘finance costs’. However, when the forecast transaction thatis hedged results in the recognition of a non-financial asset or financial liability, the gains andlosses previously deferred in other comprehensive income are reclassified into profit or loss inthe periods when the asset acquired or the liability assumed affects profit or loss. The deferredamounts are ultimately recognised in operating costs.
2017 Annual Report
115
~40~
(c) When a hedging instrument expires, or is sold, cancelled or executed, or when a hedge nolonger meets the criteria for hedge accounting, any cumulative gain or loss existing in othercomprehensive income at that time remains in other comprehensive income. When a forecasttransaction occurs or is no longer expected to occur, the cumulative gain or loss that wasreported in other comprehensive income is transferred to profit or loss in the periods when thehedged forecast cash flow affects profit or loss.
(28) Employee benefitsA. Short-term employee benefits
Short-term employee benefits are measured at the undiscounted amount of the benefits expectedto be paid in respect of service rendered by employees in a period and should be recognised asexpense in that period when the employees render service.
B. Pensions(a) Defined contribution plans
For defined contribution plans, the contributions are recognised as pension expense when theyare due on an accrual basis. Prepaid contributions are recognised as an asset to the extent of acash refund or a reduction in the future payments.
(b) Defined benefit plansi. Net obligation under a defined benefit plan is defined as the present value of an amount of
pension benefits that employees will receive on retirement for their services with the Groupin current period or prior periods. The liability recognised in the balance sheet in respectof defined benefit pension plans is the present value of the defined benefit obligation at thebalance sheet date less the fair value of plan assets, together with adjustments forunrecognised past service costs. The net defined benefit obligation is calculated annuallyby independent actuaries using the projected unit credit method. The rate used to discountis determined by using interest rates of high-quality corporate bonds that are denominatedin the currency in which the benefits will be paid, and that have terms to maturityapproximating to the terms of the related pension liability; when there is no deep market inhigh-quality corporate bonds, the Group uses interest rates of government bonds (at thebalance sheet date) instead.
ii. Remeasurements arising on defined benefit plans are recognised in other comprehensiveincome in the period in which they arise and are recorded as retained earnings.
iii. Past service costs are recognised immediately in profit or loss.C. Termination benefits
Termination benefits are employee benefits provided in exchange for the termination ofemployment as a result from either the Group’s decision to terminate an employee’s employmentbefore the normal retirement date, or an employee’s decision to accept an offer of redundancybenefits in exchange for the termination of employment. The Group recognises termination
116
4 Financial Statements
~41~
benefits when it is demonstrably committed to a termination, when it has a detailed formal planto terminate the employment of current employees and when it can no longer withdraw the plan.In the case of an offer made by the Group to encourage voluntary termination of employment,the termination benefits are recognised as expenses only when it is probable that the employeesare expected to accept the offer and the number of the employees taking the offer can be reliablyestimated. Benefits falling due more than 12 months after balance sheet date are discounted totheir present value.
D. Employees’ compensation and directors’ and supervisors’ remunerationEmployees’ compensation and directors’ and supervisors’ remuneration are recognised asexpense and liability, provided that such recognition is required under legal or constructiveobligation and those amounts can be reliably estimated. Any difference between the resolvedamounts and the subsequently actual distributed amounts is accounted for as changes in estimates.If employee compensation is paid by shares, the Group calculates the number of shares based onthe closing price at the previous day of the board meeting resolution.
(29) Income taxA. The tax expense for the period comprises current and deferred tax. Tax is recognised in profit or
loss, except to the extent that it relates to items recognised in other comprehensive income oritems recognised directly in equity, in which cases the tax is recognised in other comprehensiveincome or equity.
B. The current income tax expense is calculated on the basis of the tax laws enacted or substantivelyenacted at the balance sheet date in the countries where the Company and its subsidiaries operateand generate taxable income. Management periodically evaluates positions taken in tax returnswith respect to situations in accordance with applicable tax regulations. It establishes provisionswhere appropriate based on the amounts expected to be paid to the tax authorities. An additional10% tax is levied on the unappropriated retained earnings and is recorded as income tax expensein the year the stockholders resolve to retain the earnings.
C. Deferred income tax is recognised, using the balance sheet liability method, on temporarydifferences arising between the tax bases of assets and liabilities and their carrying amounts in theconsolidated balance sheet. Deferred income tax is provided on temporary differences arising oninvestments in subsidiaries and associates, except where the timing of the reversal of thetemporary difference is controlled by the Group and it is probable that the temporary differencewill not reverse in the foreseeable future. Deferred income tax is determined using tax rates andlaws that have been enacted or substantially enacted by the balance sheet date and are expectedto apply when the related deferred income tax asset is realised or the deferred income tax liabilityis settled.
D. Deferred tax assets are recognised only to the extent that it is probable that future taxable profitwill be available against which the temporary differences can be utilized. At each balance sheet
2017 Annual Report
117
~42~
date, unrecognised and recognised deferred income tax assets are reassessed.E. Current income tax assets and liabilities are offset and the net amount reported in the balance
sheet when there is a legally enforceable right to offset the recognised amounts and there is anintention to settle on a net basis or realise the asset and settle the liability simultaneously. Deferredincome tax assets and liabilities are offset on the balance sheet when the entity has the legallyenforceable right to offset current tax assets against current tax liabilities and they are levied bythe same taxation authority on either the same entity or different entities that intend to settle on anet basis or realise the asset and settle the liability simultaneously.
F. A deferred tax asset shall be recognised for the carryforward of unused tax credits resulting fromacquisitions of equipment or technology, research and development expenditures and equityinvestments to the extent that it is possible that future taxable profit will be available against whichthe unused tax credits can be utilised.
(30) DividendsDividends are recorded in the Company’s financial statements in the period in which they areapproved by the Company’s shareholders. Cash dividends are recorded as liabilities; stock dividendsare recorded as stock dividends to be distributed and are reclassified to ordinary shares on theeffective date of new shares issuance.
(31) Revenue recognitionA. Sales of goods
Revenue is measured at the fair value of the consideration received or receivable taking intoaccount of business tax, returns, rebates and discounts for the sale of goods to external customersin the ordinary course of the Group’s activities. Revenue arising from the sales of goods isrecognised when the Group has delivered the goods to the customer, the amount of sales revenuecan be measured reliably and it is probable that the future economic benefits associated with thetransaction will flow to the entity. The delivery of goods is completed when the significant risksand rewards of ownership have been transferred to the customer, the Group retains neithercontinuing managerial involvement to the degree usually associated with ownership nor effectivecontrol over the goods sold, and the customer has accepted the goods based on the sales contractor there is objective evidence showing that all acceptance provisions have been satisfied.
B. Sales of servicesRevenue from delivering services is recognised under the percentage-of-completion methodwhen the outcome of services provided can be estimated reliably. The stage of completion of aservice contract is measured by the percentage of the actual services performed as of the financialreporting date to the total services to be performed. If the outcome of a service contract cannotbe estimated reliably, contract revenue should be recognised only to the extent that contract costsincurred are likely to be recoverable.
118
4 Financial Statements
~43~
(32) Operating segmentsOperating segments are reported in a manner consistent with the internal reporting provided to theChief Operating Decision-Maker. The Chief Operating Decision-Maker is responsible for allocatingresources and assessing performance of the operating segments.
5. CRITICAL ACCOUNTING JUDGEMENTS, ESTIMATES AND KEY SOURCES OFASSUMPTION UNCERTAINTYThe preparation of these consolidated financial statements requires management to make criticaljudgements in applying the Group’s accounting policies and make critical assumptions and estimatesconcerning future events. Assumptions and estimates may differ from the actual results and arecontinually evaluated and adjusted based on historical experience and other factors. Such assumptionsand estimates have a significant risk of causing a material adjustment to the carrying amounts of assetsand liabilities within the next financial year; and the related information is addressed below:(1) Critical judgements in applying the Group’s accounting policies
Financial assets—impairment of equity investmentsThe Group follows the guidance of IAS 39 to determine whether a financial asset—equity investmentis impaired. This determination requires significant judgement. In making this judgement, the Groupevaluates, among other factors, the duration and extent to which the fair value of an equity investmentis less than its cost and the financial health of and short-term business outlook for the investee,including factors such as industry and sector performance, changes in technology and operational andfinancing cash flow.If the decline of the fair value of an individual equity investment below cost was consideredsignificant or prolonged, the Group would transfer the accumulated fair value adjustments recognisedin other comprehensive income on the impaired available-for-sale financial assets to profit or loss orbeing the recognition of the impairment loss on the impaired financial assets measured at cost in profitor loss.
(2) Critical accounting estimates and assumptionsA. Revenue recognition
Revenue from delivering services and related costs are recognised under the percentage-of-completion method when the outcome of services provided can be estimated reliably. The stage ofcompletion of a service contract is measured by the percentage of the actual services performed asof the financial reporting date to the total services to be performed.
B. Impairment assessment of tangible and intangible assets (excluding goodwill)The Group assesses impairment based on its subjective judgement and determines the separate cashflows of a specific group of assets, useful lives of assets and the future possible income andexpenses arising from the assets depending on how assets are utilized and industrial characteristics.Any changes of economic circumstances or estimates due to the change of Group strategy mightcause material impairment on assets in the future.As of December 31, 2017, the Group had property, plant, equipment and intangible assetsamounting to $97,687,454 and $159,667, respectively.
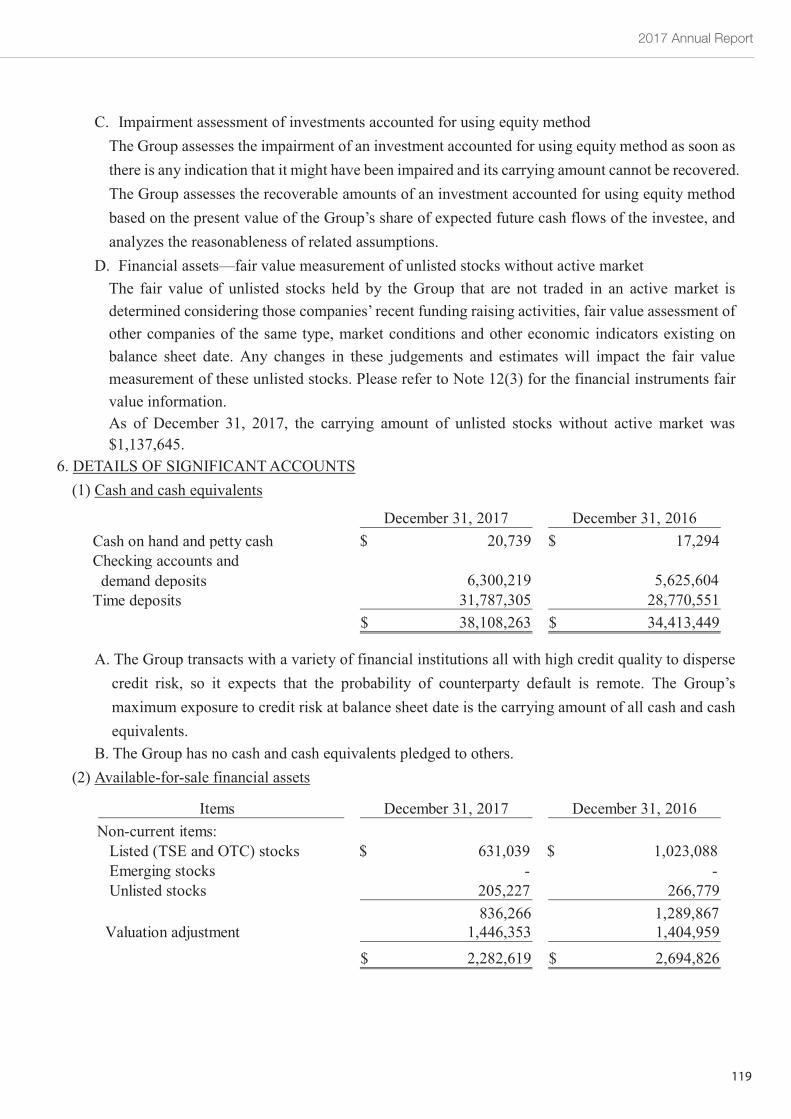
2017 Annual Report
119
~44~
C. Impairment assessment of investments accounted for using equity methodThe Group assesses the impairment of an investment accounted for using equity method as soon asthere is any indication that it might have been impaired and its carrying amount cannot be recovered.The Group assesses the recoverable amounts of an investment accounted for using equity methodbased on the present value of the Group’s share of expected future cash flows of the investee, andanalyzes the reasonableness of related assumptions.
D. Financial assets—fair value measurement of unlisted stocks without active marketThe fair value of unlisted stocks held by the Group that are not traded in an active market isdetermined considering those companies’ recent funding raising activities, fair value assessment ofother companies of the same type, market conditions and other economic indicators existing onbalance sheet date. Any changes in these judgements and estimates will impact the fair valuemeasurement of these unlisted stocks. Please refer to Note 12(3) for the financial instruments fairvalue information.As of December 31, 2017, the carrying amount of unlisted stocks without active market was$1,137,645.
6. DETAILS OF SIGNIFICANT ACCOUNTS(1) Cash and cash equivalents
A. The Group transacts with a variety of financial institutions all with high credit quality to dispersecredit risk, so it expects that the probability of counterparty default is remote. The Group’smaximum exposure to credit risk at balance sheet date is the carrying amount of all cash and cashequivalents.
B. The Group has no cash and cash equivalents pledged to others.(2) Available-for-sale financial assets
December 31, 2017 December 31, 2016Cash on hand and petty cash 20,739$ 17,294$Checking accounts and
demand deposits 6,300,219 5,625,604Time deposits 31,787,305 28,770,551
38,108,263$ 34,413,449$
Items December 31, 2017 December 31, 2016Non-current items:
Listed (TSE and OTC) stocks 631,039$ 1,023,088$Emerging stocks - -Unlisted stocks 205,227 266,779
836,266 1,289,867Valuation adjustment 1,446,353 1,404,959
2,282,619$ 2,694,826$
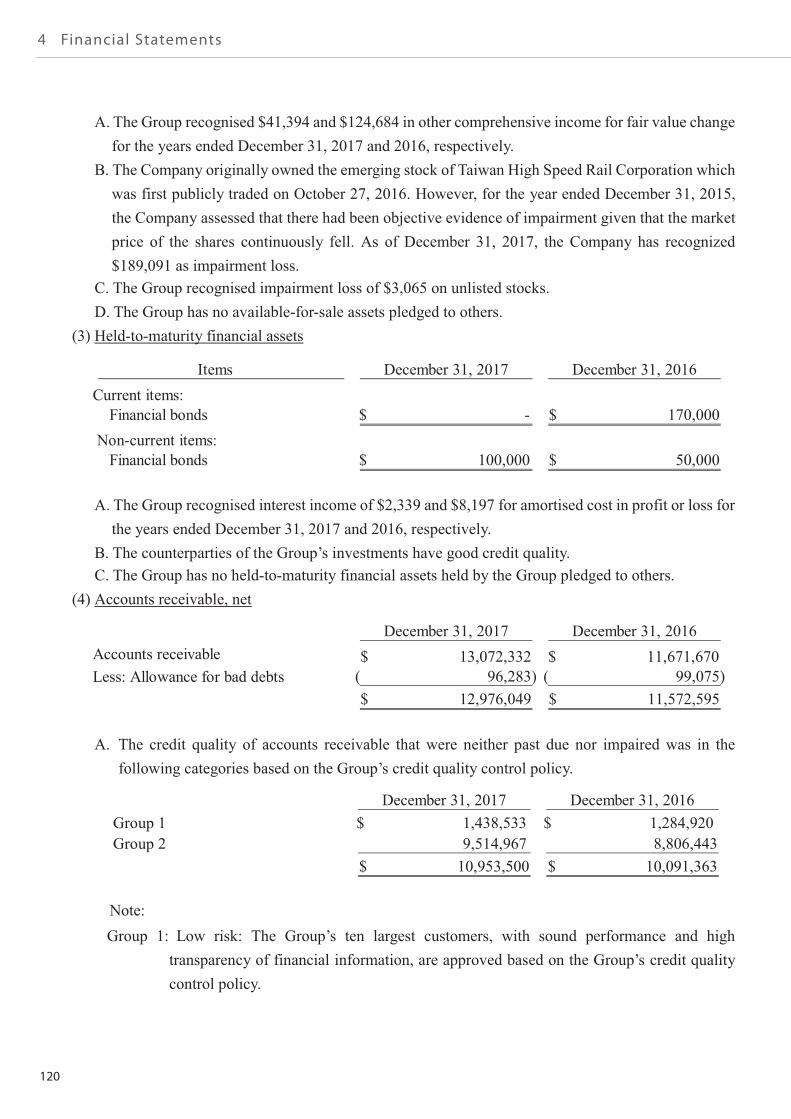
120
4 Financial Statements
~45~
A. The Group recognised $41,394 and $124,684 in other comprehensive income for fair value changefor the years ended December 31, 2017 and 2016, respectively.
B. The Company originally owned the emerging stock of Taiwan High Speed Rail Corporation whichwas first publicly traded on October 27, 2016. However, for the year ended December 31, 2015,the Company assessed that there had been objective evidence of impairment given that the marketprice of the shares continuously fell. As of December 31, 2017, the Company has recognized$189,091 as impairment loss.
C. The Group recognised impairment loss of $3,065 on unlisted stocks.D. The Group has no available-for-sale assets pledged to others.
(3) Held-to-maturity financial assets
A. The Group recognised interest income of $2,339 and $8,197 for amortised cost in profit or loss forthe years ended December 31, 2017 and 2016, respectively.
B. The counterparties of the Group’s investments have good credit quality.C. The Group has no held-to-maturity financial assets held by the Group pledged to others.
(4) Accounts receivable, net
A. The credit quality of accounts receivable that were neither past due nor impaired was in thefollowing categories based on the Group’s credit quality control policy.
Note:Group 1: Low risk: The Group’s ten largest customers, with sound performance and high
transparency of financial information, are approved based on the Group’s credit qualitycontrol policy.
Items December 31, 2017 December 31, 2016Current items:
Financial bonds -$ 170,000$Non-current items:
Financial bonds 100,000$ 50,000$
December 31, 2017 December 31, 2016Accounts receivable 13,072,332$ 11,671,670$Less: Allowance for bad debts 96,283)( 99,075)(
12,976,049$ 11,572,595$
December 31, 2017 December 31, 2016Group 1 1,438,533$ 1,284,920$Group 2 9,514,967 8,806,443
10,953,500$ 10,091,363$
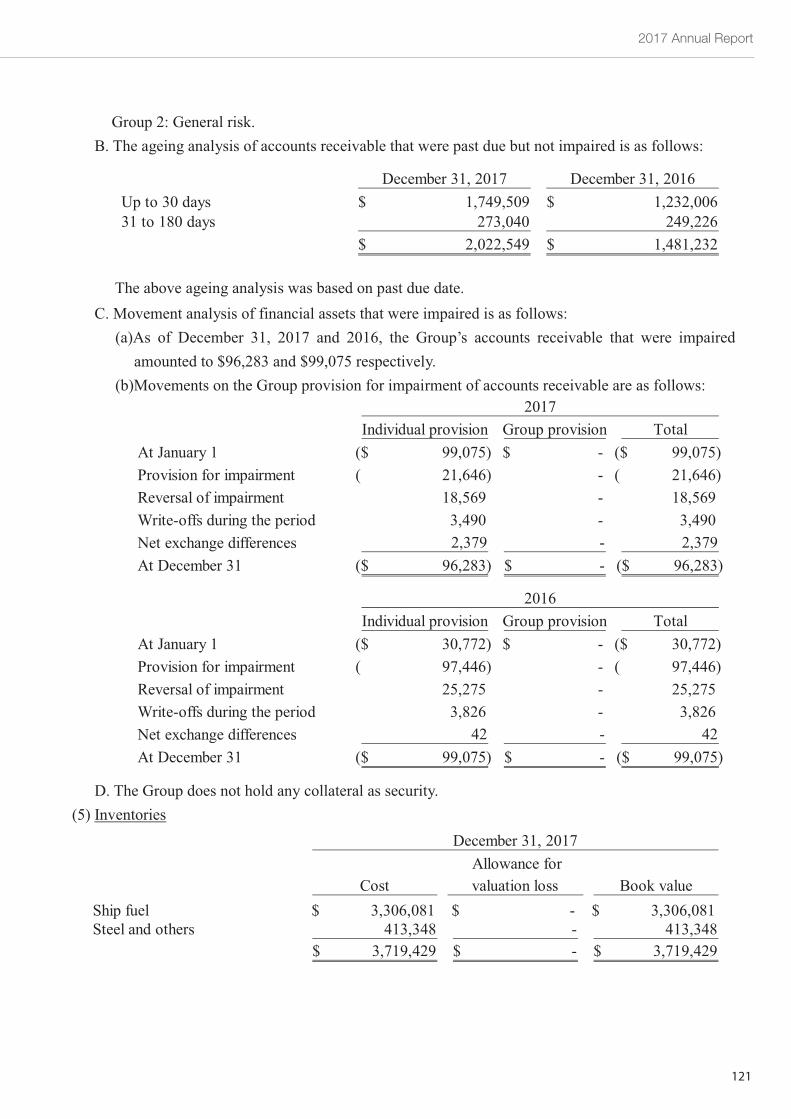
2017 Annual Report
121
~46~
Group 2: General risk.B. The ageing analysis of accounts receivable that were past due but not impaired is as follows:
The above ageing analysis was based on past due date.C. Movement analysis of financial assets that were impaired is as follows:
(a)As of December 31, 2017 and 2016, the Group’s accounts receivable that were impairedamounted to $96,283 and $99,075 respectively.
(b)Movements on the Group provision for impairment of accounts receivable are as follows:
D. The Group does not hold any collateral as security.(5) Inventories
December 31, 2017 December 31, 2016Up to 30 days 1,749,509$ 1,232,006$31 to 180 days 273,040 249,226
2,022,549$ 1,481,232$
Individual provision Group provision TotalAt January 1 99,075)($ -$ 99,075)($Provision for impairment 21,646)( - 21,646)(Reversal of impairment 18,569 - 18,569Write-offs during the period 3,490 - 3,490Net exchange differences 2,379 - 2,379At December 31 96,283)($ -$ 96,283)($
2017
Individual provision Group provision TotalAt January 1 30,772)($ -$ 30,772)($Provision for impairment 97,446)( - 97,446)(Reversal of impairment 25,275 - 25,275Write-offs during the period 3,826 - 3,826Net exchange differences 42 - 42At December 31 99,075)($ -$ 99,075)($
2016
CostAllowance forvaluation loss Book value
Ship fuel 3,306,081$ -$ 3,306,081$Steel and others 413,348 - 413,348
3,719,429$ -$ 3,719,429$
December 31, 2017
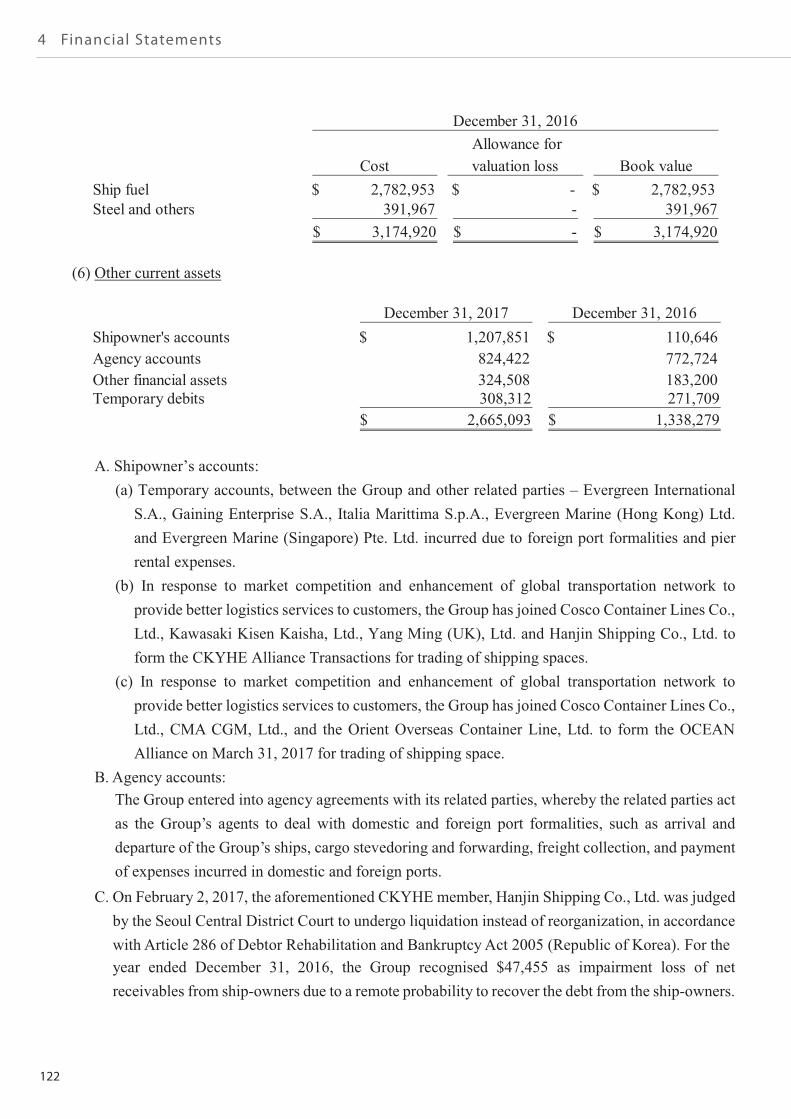
122
4 Financial Statements
~47~
(6) Other current assets
A. Shipowner’s accounts:(a) Temporary accounts, between the Group and other related parties – Evergreen International
S.A., Gaining Enterprise S.A., Italia Marittima S.p.A., Evergreen Marine (Hong Kong) Ltd.and Evergreen Marine (Singapore) Pte. Ltd. incurred due to foreign port formalities and pierrental expenses.
(b) In response to market competition and enhancement of global transportation network toprovide better logistics services to customers, the Group has joined Cosco Container Lines Co.,Ltd., Kawasaki Kisen Kaisha, Ltd., Yang Ming (UK), Ltd. and Hanjin Shipping Co., Ltd. toform the CKYHE Alliance Transactions for trading of shipping spaces.
(c) In response to market competition and enhancement of global transportation network toprovide better logistics services to customers, the Group has joined Cosco Container Lines Co.,Ltd., CMA CGM, Ltd., and the Orient Overseas Container Line, Ltd. to form the OCEANAlliance on March 31, 2017 for trading of shipping space.
B. Agency accounts:The Group entered into agency agreements with its related parties, whereby the related parties actas the Group’s agents to deal with domestic and foreign port formalities, such as arrival anddeparture of the Group’s ships, cargo stevedoring and forwarding, freight collection, and paymentof expenses incurred in domestic and foreign ports.
C. On February 2, 2017, the aforementioned CKYHE member, Hanjin Shipping Co., Ltd. was judgedby the Seoul Central District Court to undergo liquidation instead of reorganization, in accordancewith Article 286 of Debtor Rehabilitation and Bankruptcy Act 2005 (Republic of Korea). For theyear ended December 31, 2016, the Group recognised $47,455 as impairment loss of netreceivables from ship-owners due to a remote probability to recover the debt from the ship-owners.
CostAllowance forvaluation loss Book value
Ship fuel 2,782,953$ -$ 2,782,953$Steel and others 391,967 - 391,967
3,174,920$ -$ 3,174,920$
December 31, 2016
December 31, 2017 December 31, 2016Shipowner's accounts 1,207,851$ 110,646$Agency accounts 824,422 772,724Other financial assets 324,508 183,200Temporary debits 308,312 271,709
2,665,093$ 1,338,279$
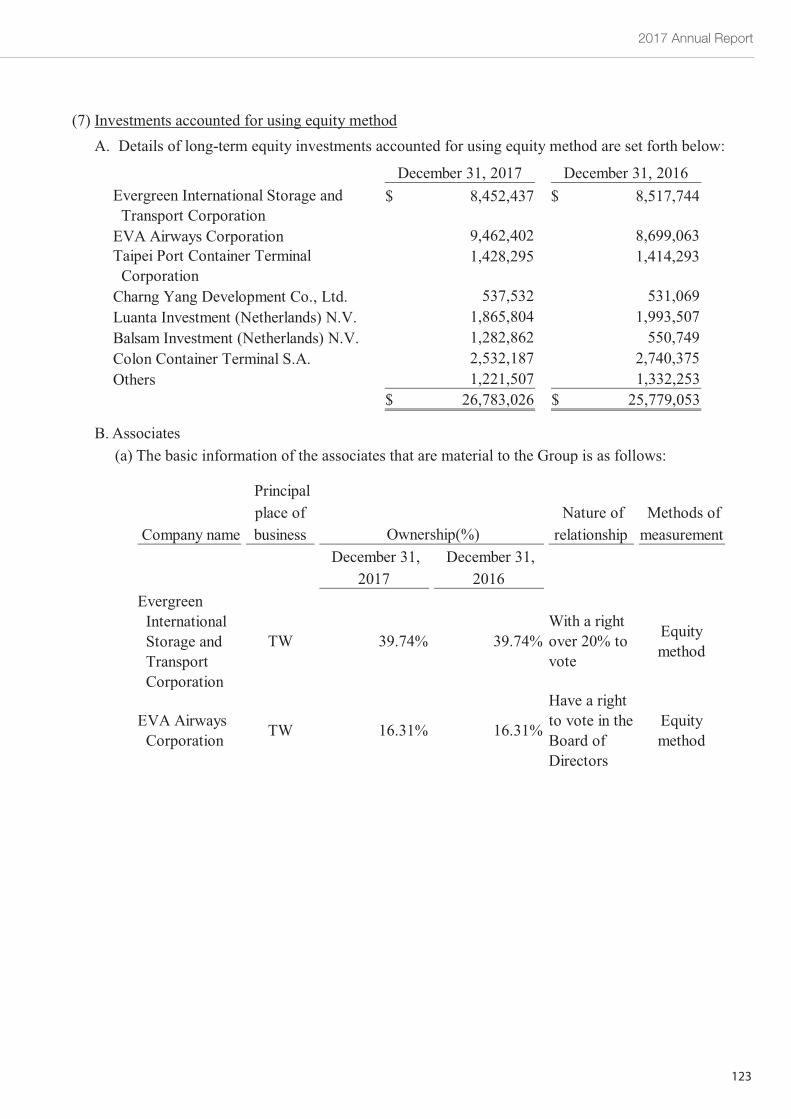
2017 Annual Report
123
~48~
(7) Investments accounted for using equity methodA. Details of long-term equity investments accounted for using equity method are set forth below:
B. Associates(a) The basic information of the associates that are material to the Group is as follows:
December 31, 2017 December 31, 2016Evergreen International Storage and
Transport Corporation8,452,437$ 8,517,744$
EVA Airways Corporation 9,462,402 8,699,063Taipei Port Container Terminal
Corporation1,428,295 1,414,293
Charng Yang Development Co., Ltd. 537,532 531,069Luanta Investment (Netherlands) N.V. 1,865,804 1,993,507Balsam Investment (Netherlands) N.V. 1,282,862 550,749Colon Container Terminal S.A. 2,532,187 2,740,375Others 1,221,507 1,332,253
26,783,026$ 25,779,053$
Company name
Principalplace ofbusiness
Nature ofrelationship
Methods ofmeasurement
December 31,2017
December 31,2016
EvergreenInternationalStorage andTransportCorporation
TW 39.74% 39.74%With a rightover 20% tovote
Equitymethod
EVA AirwaysCorporation TW 16.31% 16.31%
Have a rightto vote in theBoard ofDirectors
Equitymethod
Ownership(%)
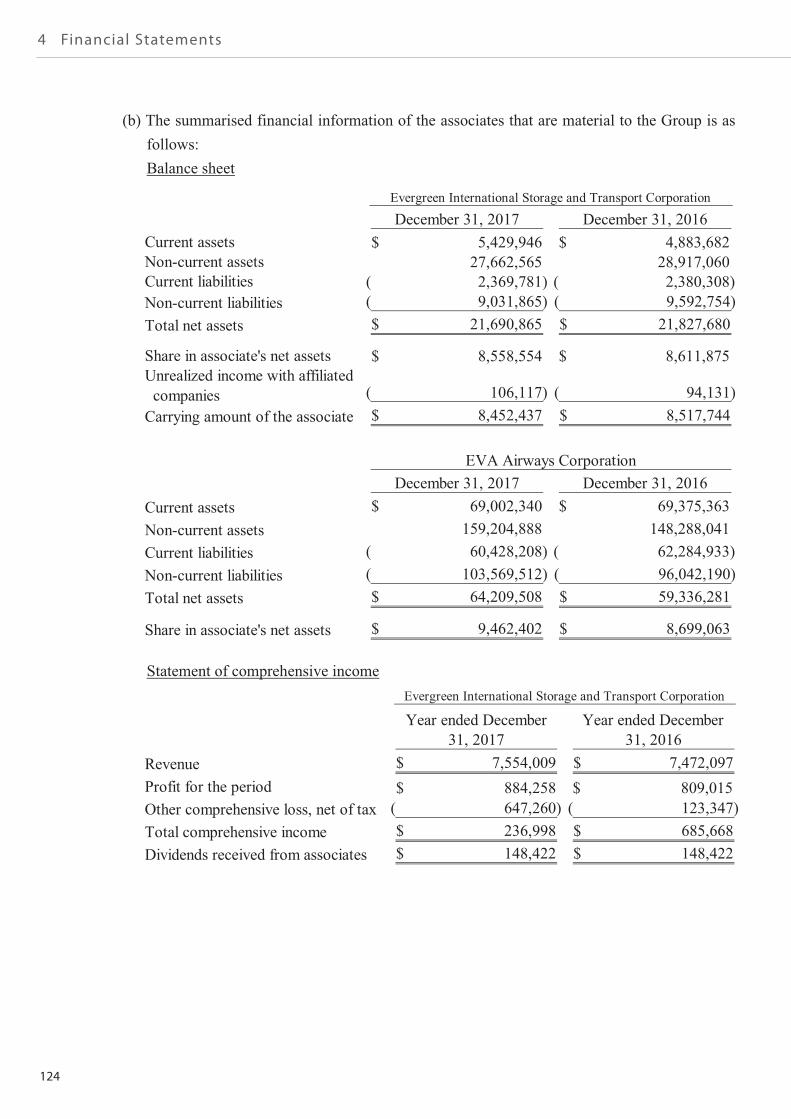
124
4 Financial Statements
~49~
(b) The summarised financial information of the associates that are material to the Group is asfollows:Balance sheet
Statement of comprehensive income
December 31, 2017 December 31, 2016Current assets 5,429,946$ 4,883,682$Non-current assets 27,662,565 28,917,060Current liabilities 2,369,781)( 2,380,308)(Non-current liabilities 9,031,865)( 9,592,754)(Total net assets 21,690,865$ 21,827,680$
Share in associate's net assets 8,558,554$ 8,611,875$Unrealized income with affiliated
companies 106,117)( 94,131)(Carrying amount of the associate 8,452,437$ 8,517,744$
Evergreen International Storage and Transport Corporation
December 31, 2017 December 31, 2016Current assets 69,002,340$ 69,375,363$Non-current assets 159,204,888 148,288,041Current liabilities 60,428,208)( 62,284,933)(Non-current liabilities 103,569,512)( 96,042,190)(Total net assets 64,209,508$ 59,336,281$
Share in associate's net assets 9,462,402$ 8,699,063$
EVA Airways Corporation
Year ended December Year ended December31, 2017 31, 2016
Revenue 7,554,009$ 7,472,097$Profit for the period 884,258$ 809,015$Other comprehensive loss, net of tax 647,260)( 123,347)(Total comprehensive income 236,998$ 685,668$Dividends received from associates 148,422$ 148,422$
Evergreen International Storage and Transport Corporation
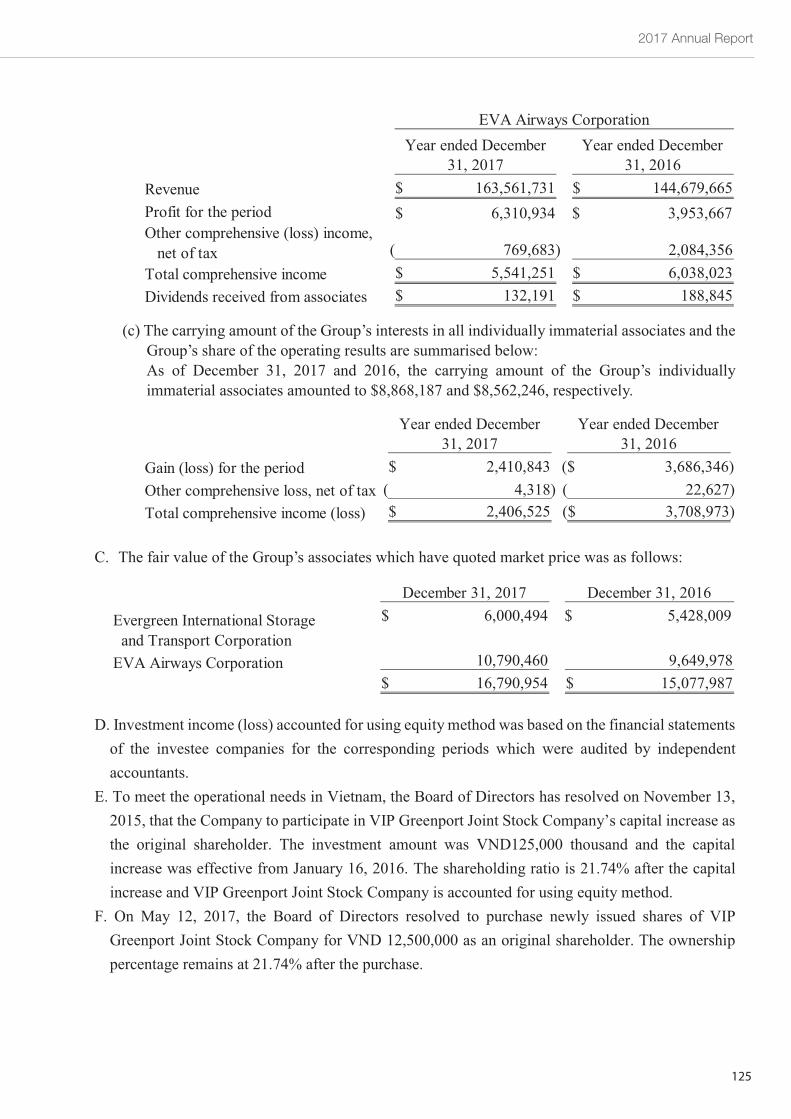
2017 Annual Report
125
~50~
(c) The carrying amount of the Group’s interests in all individually immaterial associates and theGroup’s share of the operating results are summarised below:As of December 31, 2017 and 2016, the carrying amount of the Group’s individuallyimmaterial associates amounted to $8,868,187 and $8,562,246, respectively.
C. The fair value of the Group’s associates which have quoted market price was as follows:
D. Investment income (loss) accounted for using equity method was based on the financial statementsof the investee companies for the corresponding periods which were audited by independentaccountants.
E. To meet the operational needs in Vietnam, the Board of Directors has resolved on November 13,2015, that the Company to participate in VIP Greenport Joint Stock Company’s capital increase asthe original shareholder. The investment amount was VND125,000 thousand and the capitalincrease was effective from January 16, 2016. The shareholding ratio is 21.74% after the capitalincrease and VIP Greenport Joint Stock Company is accounted for using equity method.
F. On May 12, 2017, the Board of Directors resolved to purchase newly issued shares of VIPGreenport Joint Stock Company for VND 12,500,000 as an original shareholder. The ownershippercentage remains at 21.74% after the purchase.
Year ended December Year ended December31, 2017 31, 2016
Revenue 163,561,731$ 144,679,665$Profit for the period 6,310,934$ 3,953,667$Other comprehensive (loss) income,
net of tax 769,683)( 2,084,356Total comprehensive income 5,541,251$ 6,038,023$Dividends received from associates 132,191$ 188,845$
EVA Airways Corporation
Year ended December Year ended December31, 2017 31, 2016
Gain (loss) for the period 2,410,843$ 3,686,346)($Other comprehensive loss, net of tax 4,318)( 22,627)(Total comprehensive income (loss) 2,406,525$ 3,708,973)($
December 31, 2017 December 31, 2016
Evergreen International Storageand Transport Corporation
6,000,494$ 5,428,009$
EVA Airways Corporation 10,790,460 9,649,97816,790,954$ 15,077,987$
126
4 Financial Statements
~51~
G. The Board of Directors has resolved that the subsidiary - Peony Investment S.A. to participate inNingbo Victory Container Co., Ltd. capital increase as the original shareholder, and the investmentamount was USD 6,144 thousand as of May 26, 2016. The shareholding ratio remained at 40%after the capital increase and Ningbo Victory Container Co., Ltd. is accounted for using equitymethod.
H. The Board of Directors has resolved that the subsidiary - Peony Investment S.A. to participate inBalsam Investment (Netherlands) N.V.’s capital increase as an original shareholder. Theinvestment amount was USD 76,930 thousand for the year ended December 31, 2016. Theshareholding ratio remains at 49% after the capital increase and Balsam Investment (Netherlands)N.V. is accounted for using equity method.
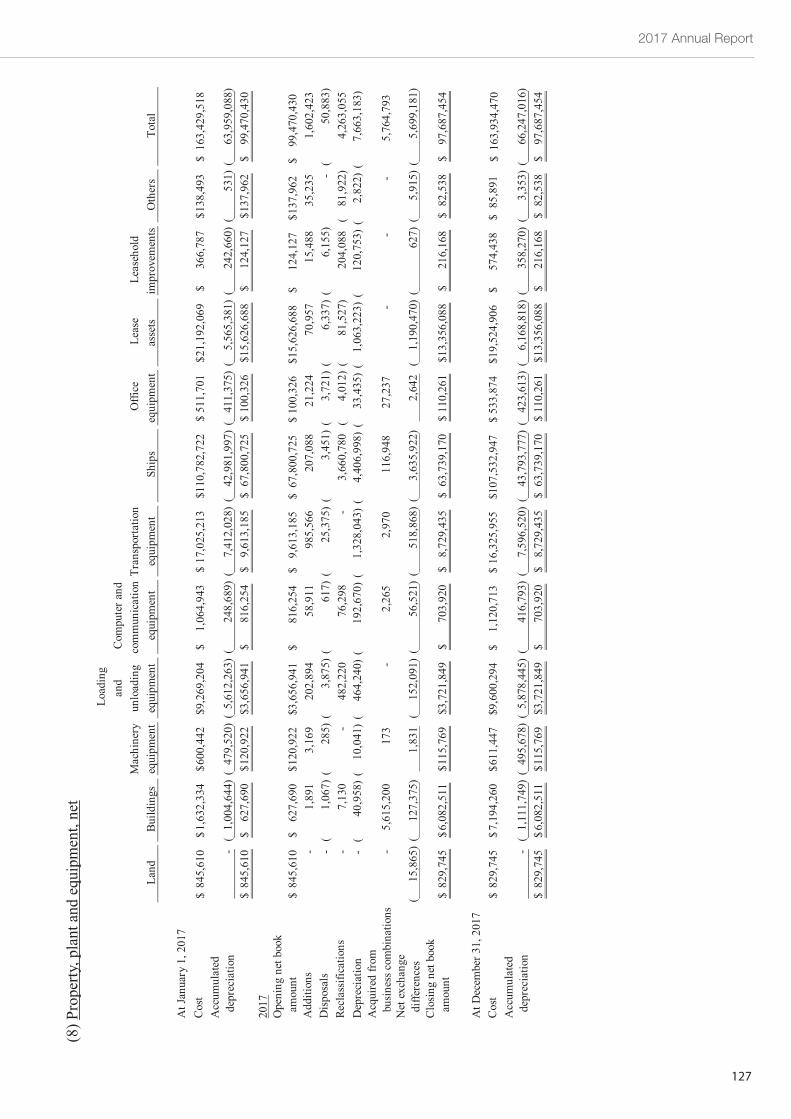
2017 Annual Report
127
~52~
(8)P
rope
rty,p
lant
and
equi
pmen
t,ne
t
Land
Build
ings
Mac
hine
ryeq
uipm
ent
Load
ing
and
unlo
adin
geq
uipm
ent
Com
pute
rand
com
mun
icat
ion
equi
pmen
tTr
ansp
orta
tion
equi
pmen
tSh
ips
Offi
ceeq
uipm
ent
Leas
eas
sets
Leas
ehol
dim
prov
emen
tsO
ther
sTo
tal
AtJ
anua
ry1,
2017
Cos
t84
5,61
0$
1,63
2,33
4$
600,
442
$9,
269,
204
$1,
064,
943
$17
,025
,213
$11
0,78
2,72
2$
511,
701
$21
,192
,069
$36
6,78
7$
138,
493
$16
3,42
9,51
8$
Acc
umul
ated
depr
ecia
tion
-1,
004,
644)
(47
9,52
0)(
5,61
2,26
3)(
248,
689)
(7,
412,
028)
(42
,981
,997
)(
411,
375)
(5,
565,
381)
(24
2,66
0)(
531)
(63
,959
,088
)(
845,
610
$62
7,69
0$
120,
922
$3,
656,
941
$81
6,25
4$
9,61
3,18
5$
67,8
00,7
25$
100,
326
$15
,626
,688
$12
4,12
7$
137,
962
$99
,470
,430
$20
17O
peni
ngne
tboo
kam
ount
845,
610
$62
7,69
0$
120,
922
$3,
656,
941
$81
6,25
4$
9,61
3,18
5$
67,8
00,7
25$
100,
326
$15
,626
,688
$12
4,12
7$
137,
962
$99
,470
,430
$A
dditi
ons
-1,
891
3,16
920
2,89
458
,911
985,
566
207,
088
21,2
2470
,957
15,4
8835
,235
1,60
2,42
3D
ispo
sals
-1,
067)
(28
5)(
3,87
5)(
617)
(25
,375
)(
3,45
1)(
3,72
1)(
6,33
7)(
6,15
5)(
-50
,883
)(
Recl
assi
ficat
ions
-7,
130
-48
2,22
076
,298
-3,
660,
780
4,01
2)(
81,5
27)
(20
4,08
881
,922
)(
4,26
3,05
5D
epre
ciat
ion
-40
,958
)(
10,0
41)
(46
4,24
0)(
192,
670)
(1,
328,
043)
(4,
406,
998)
(33
,435
)(
1,06
3,22
3)(
120,
753)
(2,
822)
(7,
663,
183)
(A
cqui
red
from
busin
essc
ombi
natio
ns-
5,61
5,20
017
3-
2,26
52,
970
116,
948
27,2
37-
--
5,76
4,79
3N
etex
chan
gedi
ffere
nces
15,8
65)
(12
7,37
5)(
1,83
115
2,09
1)(
56,5
21)
(51
8,86
8)(
3,63
5,92
2)(
2,64
21,
190,
470)
(62
7)(
5,91
5)(
5,69
9,18
1)(
Clo
sing
netb
ook
amou
nt82
9,74
5$
6,08
2,51
1$
115,
769
$3,
721,
849
$70
3,92
0$
8,72
9,43
5$
63,7
39,1
70$
110,
261
$13
,356
,088
$21
6,16
8$
82,5
38$
97,6
87,4
54$
Cos
t82
9,74
5$
7,19
4,26
0$
611,
447
$9,
600,
294
$1,
120,
713
$16
,325
,955
$10
7,53
2,94
7$
533,
874
$19
,524
,906
$57
4,43
8$
85,8
91$
163,
934,
470
$A
ccum
ulat
edde
prec
iatio
n-
1,11
1,74
9)(
495,
678)
(5,
878,
445)
(41
6,79
3)(
7,59
6,52
0)(
43,7
93,7
77)
(42
3,61
3)(
6,16
8,81
8)(
358,
270)
(3,
353)
(66
,247
,016
)(
829,
745
$6,
082,
511
$11
5,76
9$
3,72
1,84
9$
703,
920
$8,
729,
435
$63
,739
,170
$11
0,26
1$
13,3
56,0
88$
216,
168
$82
,538
$97
,687
,454
$
AtD
ecem
ber3
1,20
17
~52~
(8)P
rope
rty,p
lant
and
equi
pmen
t,ne
t
Land
Build
ings
Mac
hine
ryeq
uipm
ent
Load
ing
and
unlo
adin
geq
uipm
ent
Com
pute
rand
com
mun
icat
ion
equi
pmen
tTr
ansp
orta
tion
equi
pmen
tSh
ips
Offi
ceeq
uipm
ent
Leas
eas
sets
Leas
ehol
dim
prov
emen
tsO
ther
sTo
tal
AtJ
anua
ry1,
2017
Cos
t84
5,61
0$
1,63
2,33
4$
600,
442
$9,
269,
204
$1,
064,
943
$17
,025
,213
$11
0,78
2,72
2$
511,
701
$21
,192
,069
$36
6,78
7$
138,
493
$16
3,42
9,51
8$
Acc
umul
ated
depr
ecia
tion
-1,
004,
644)
(47
9,52
0)(
5,61
2,26
3)(
248,
689)
(7,
412,
028)
(42
,981
,997
)(
411,
375)
(5,
565,
381)
(24
2,66
0)(
531)
(63
,959
,088
)(
845,
610
$62
7,69
0$
120,
922
$3,
656,
941
$81
6,25
4$
9,61
3,18
5$
67,8
00,7
25$
100,
326
$15
,626
,688
$12
4,12
7$
137,
962
$99
,470
,430
$20
17O
peni
ngne
tboo
kam
ount
845,
610
$62
7,69
0$
120,
922
$3,
656,
941
$81
6,25
4$
9,61
3,18
5$
67,8
00,7
25$
100,
326
$15
,626
,688
$12
4,12
7$
137,
962
$99
,470
,430
$A
dditi
ons
-1,
891
3,16
920
2,89
458
,911
985,
566
207,
088
21,2
2470
,957
15,4
8835
,235
1,60
2,42
3D
ispo
sals
-1,
067)
(28
5)(
3,87
5)(
617)
(25
,375
)(
3,45
1)(
3,72
1)(
6,33
7)(
6,15
5)(
-50
,883
)(
Recl
assif
icat
ions
-7,
130
-48
2,22
076
,298
-3,
660,
780
4,01
2)(
81,5
27)
(20
4,08
881
,922
)(
4,26
3,05
5D
epre
ciat
ion
-40
,958
)(
10,0
41)
(46
4,24
0)(
192,
670)
(1,
328,
043)
(4,
406,
998)
(33
,435
)(
1,06
3,22
3)(
120,
753)
(2,
822)
(7,
663,
183)
(A
cqui
red
from
busin
essc
ombi
natio
ns-
5,61
5,20
017
3-
2,26
52,
970
116,
948
27,2
37-
--
5,76
4,79
3N
etex
chan
gedi
ffere
nces
15,8
65)
(12
7,37
5)(
1,83
115
2,09
1)(
56,5
21)
(51
8,86
8)(
3,63
5,92
2)(
2,64
21,
190,
470)
(62
7)(
5,91
5)(
5,69
9,18
1)(
Clo
sing
netb
ook
amou
nt82
9,74
5$
6,08
2,51
1$
115,
769
$3,
721,
849
$70
3,92
0$
8,72
9,43
5$
63,7
39,1
70$
110,
261
$13
,356
,088
$21
6,16
8$
82,5
38$
97,6
87,4
54$
Cos
t82
9,74
5$
7,19
4,26
0$
611,
447
$9,
600,
294
$1,
120,
713
$16
,325
,955
$10
7,53
2,94
7$
533,
874
$19
,524
,906
$57
4,43
8$
85,8
91$
163,
934,
470
$A
ccum
ulat
edde
prec
iatio
n-
1,11
1,74
9)(
495,
678)
(5,
878,
445)
(41
6,79
3)(
7,59
6,52
0)(
43,7
93,7
77)
(42
3,61
3)(
6,16
8,81
8)(
358,
270)
(3,
353)
(66
,247
,016
)(
829,
745
$6,
082,
511
$11
5,76
9$
3,72
1,84
9$
703,
920
$8,
729,
435
$63
,739
,170
$11
0,26
1$
13,3
56,0
88$
216,
168
$82
,538
$97
,687
,454
$
AtD
ecem
ber3
1,20
17
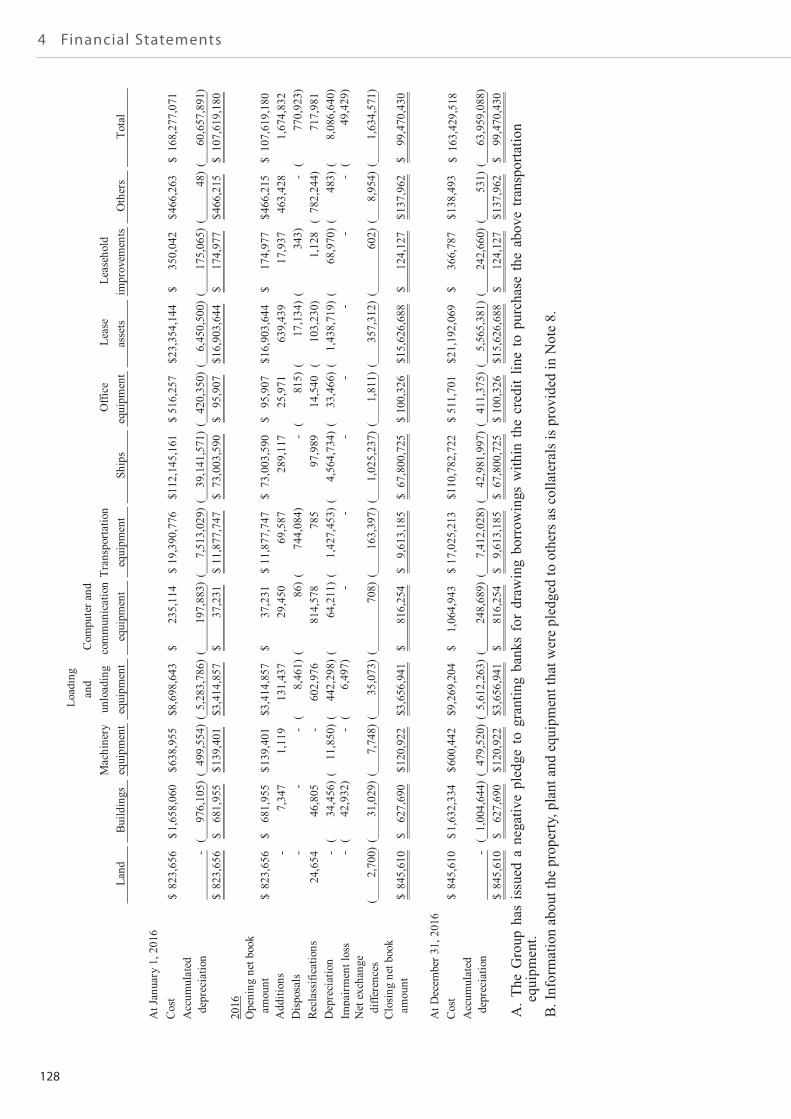
128
4 Financial Statements
~53~
A.T
heG
roup
has
issu
eda
nega
tive
pled
geto
gran
ting
bank
sfo
rdr
awin
gbo
rrow
ings
with
inth
ecr
edit
line
topu
rcha
seth
eab
ove
trans
porta
tion
equi
pmen
t.B
.Inf
orm
atio
nab
outt
hepr
oper
ty,p
lant
and
equi
pmen
ttha
twer
epl
edge
dto
othe
rsas
colla
tera
lsis
prov
ided
inN
ote
8.
Land
Build
ings
Mac
hine
ryeq
uipm
ent
Load
ing
and
unlo
adin
geq
uipm
ent
Com
pute
rand
com
mun
icat
ion
equi
pmen
tTr
ansp
orta
tion
equi
pmen
tSh
ips
Offi
ceeq
uipm
ent
Leas
eas
sets
Leas
ehol
dim
prov
emen
tsO
ther
sTo
tal
AtJ
anua
ry1,
2016
Cos
t82
3,65
6$
1,65
8,06
0$
638,
955
$8,
698,
643
$23
5,11
4$
19,3
90,7
76$
112,
145,
161
$51
6,25
7$
23,3
54,1
44$
350,
042
$46
6,26
3$
168,
277,
071
$A
ccum
ulat
edde
prec
iatio
n-
976,
105)
(49
9,55
4)(
5,28
3,78
6)(
197,
883)
(7,
513,
029)
(39
,141
,571
)(
420,
350)
(6,
450,
500)
(17
5,06
5)(
48)
(60
,657
,891
)(
823,
656
$68
1,95
5$
139,
401
$3,
414,
857
$37
,231
$11
,877
,747
$73
,003
,590
$95
,907
$16
,903
,644
$17
4,97
7$
466,
215
$10
7,61
9,18
0$
2016
Ope
ning
netb
ook
amou
nt82
3,65
6$
681,
955
$13
9,40
1$
3,41
4,85
7$
37,2
31$
11,8
77,7
47$
73,0
03,5
90$
95,9
07$
16,9
03,6
44$
174,
977
$46
6,21
5$
107,
619,
180
$A
dditi
ons
-7,
347
1,11
913
1,43
729
,450
69,5
8728
9,11
725
,971
639,
439
17,9
3746
3,42
81,
674,
832
Dis
posa
ls-
--
8,46
1)(
86)
(74
4,08
4)(
-81
5)(
17,1
34)
(34
3)(
-77
0,92
3)(
Recl
assi
ficat
ions
24,6
5446
,805
-60
2,97
681
4,57
878
597
,989
14,5
4010
3,23
0)(
1,12
878
2,24
4)(
717,
981
Dep
reci
atio
n-
34,4
56)
(11
,850
)(
442,
298)
(64
,211
)(
1,42
7,45
3)(
4,56
4,73
4)(
33,4
66)
(1,
438,
719)
(68
,970
)(
483)
(8,
086,
640)
(Im
pairm
entl
oss
-42
,932
)(
-6,
497)
(-
--
--
--
49,4
29)
(N
etex
chan
gedi
ffere
nces
2,70
0)(
31,0
29)
(7,
748)
(35
,073
)(
708)
(16
3,39
7)(
1,02
5,23
7)(
1,81
1)(
357,
312)
(60
2)(
8,95
4)(
1,63
4,57
1)(
Clo
sing
netb
ook
amou
nt84
5,61
0$
627,
690
$12
0,92
2$
3,65
6,94
1$
816,
254
$9,
613,
185
$67
,800
,725
$10
0,32
6$
15,6
26,6
88$
124,
127
$13
7,96
2$
99,4
70,4
30$
AtD
ecem
ber3
1,20
16C
ost
845,
610
$1,
632,
334
$60
0,44
2$
9,26
9,20
4$
1,06
4,94
3$
17,0
25,2
13$
110,
782,
722
$51
1,70
1$
21,1
92,0
69$
366,
787
$13
8,49
3$
163,
429,
518
$A
ccum
ulat
edde
prec
iatio
n-
1,00
4,64
4)(
479,
520)
(5,
612,
263)
(24
8,68
9)(
7,41
2,02
8)(
42,9
81,9
97)
(41
1,37
5)(
5,56
5,38
1)(
242,
660)
(53
1)(
63,9
59,0
88)
(84
5,61
0$
627,
690
$12
0,92
2$
3,65
6,94
1$
816,
254
$9,
613,
185
$67
,800
,725
$10
0,32
6$
15,6
26,6
88$
124,
127
$13
7,96
2$
99,4
70,4
30$
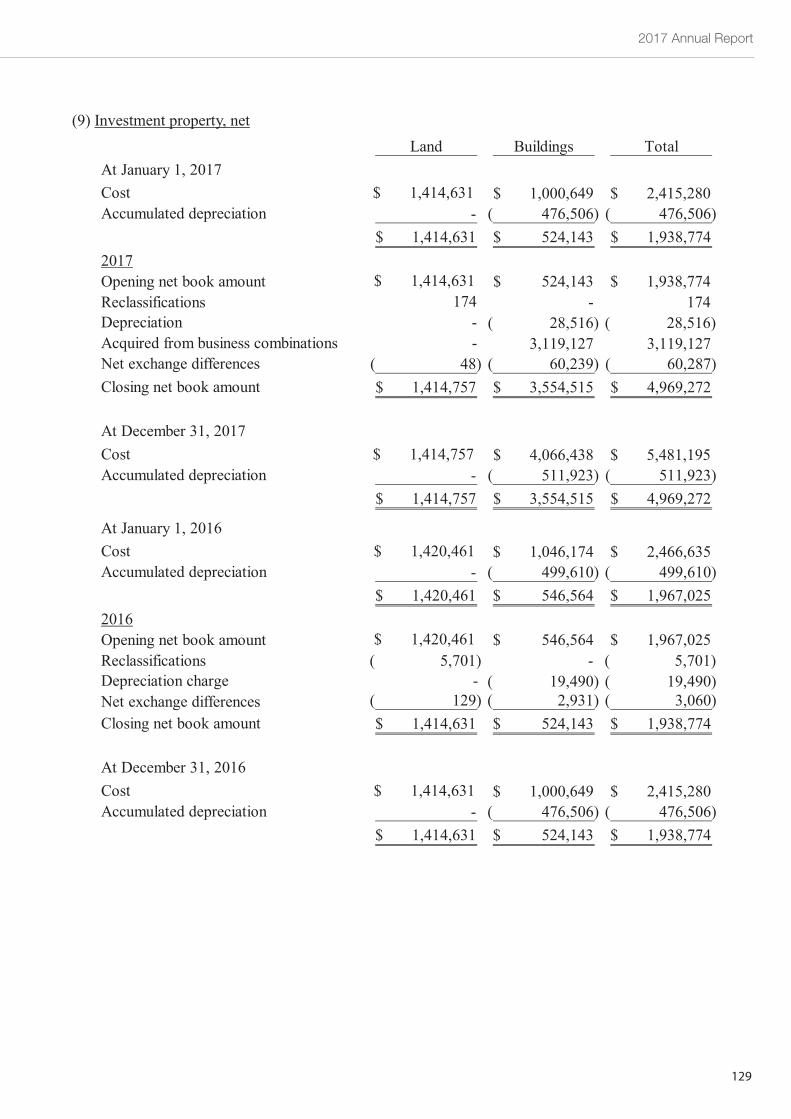
2017 Annual Report
129
~54~
(9) Investment property, netLand Buildings Total
At January 1, 2017Cost $ 1,414,631 1,000,649$ 2,415,280$Accumulated depreciation - 476,506)( 476,506)(
1,414,631$ 524,143$ 1,938,774$2017Opening net book amount $ 1,414,631 524,143$ 1,938,774$Reclassifications 174 - 174Depreciation - 28,516)( 28,516)(Acquired from business combinations - 3,119,127 3,119,127Net exchange differences 48)( 60,239)( 60,287)(Closing net book amount 1,414,757$ 3,554,515$ 4,969,272$
At December 31, 2017Cost $ 1,414,757 4,066,438$ 5,481,195$Accumulated depreciation - 511,923)( 511,923)(
1,414,757$ 3,554,515$ 4,969,272$
At January 1, 2016Cost $ 1,420,461 1,046,174$ 2,466,635$Accumulated depreciation - 499,610)( 499,610)(
1,420,461$ 546,564$ 1,967,025$2016Opening net book amount $ 1,420,461 546,564$ 1,967,025$Reclassifications 5,701)( - 5,701)(Depreciation charge - 19,490)( 19,490)(Net exchange differences 129)( 2,931)( 3,060)(Closing net book amount 1,414,631$ 524,143$ 1,938,774$
At December 31, 2016Cost $ 1,414,631 1,000,649$ 2,415,280$Accumulated depreciation - 476,506)( 476,506)(
1,414,631$ 524,143$ 1,938,774$
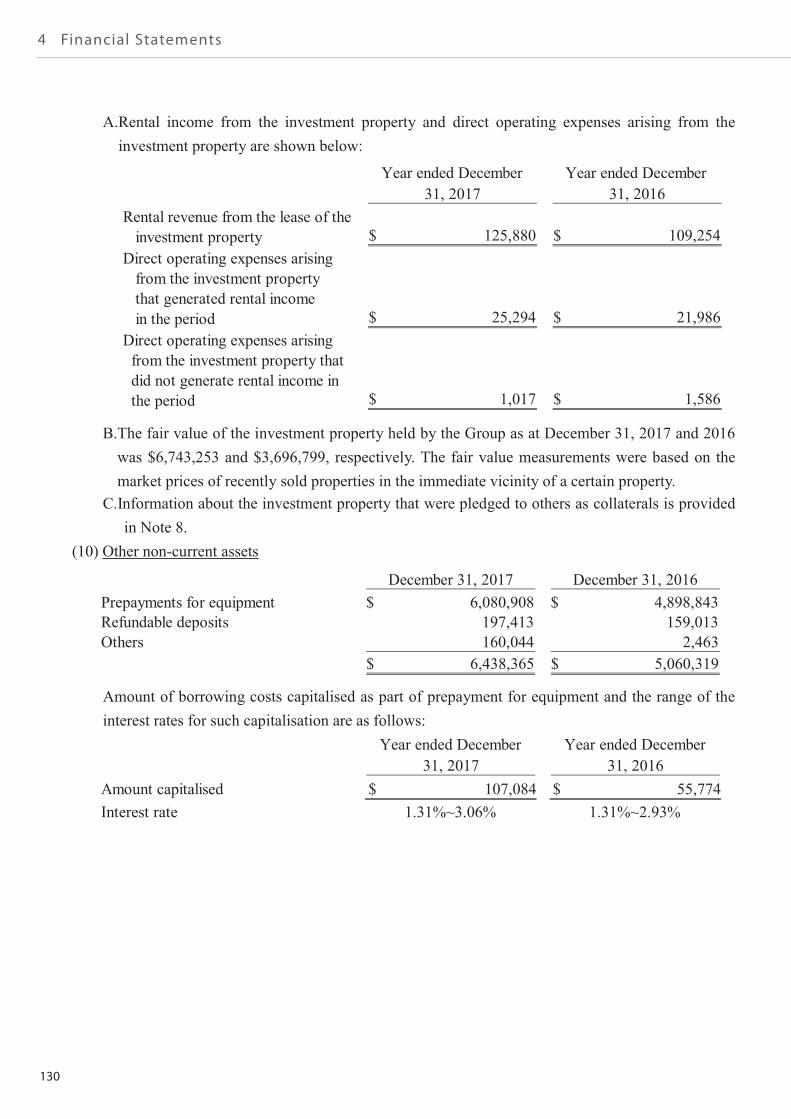
130
4 Financial Statements
~55~
A.Rental income from the investment property and direct operating expenses arising from theinvestment property are shown below:
B.The fair value of the investment property held by the Group as at December 31, 2017 and 2016was $6,743,253 and $3,696,799, respectively. The fair value measurements were based on themarket prices of recently sold properties in the immediate vicinity of a certain property.
C.Information about the investment property that were pledged to others as collaterals is providedin Note 8.
(10) Other non-current assets
Amount of borrowing costs capitalised as part of prepayment for equipment and the range of theinterest rates for such capitalisation are as follows:
Year ended December Year ended December31, 2017 31, 2016
Rental revenue from the lease of theinvestment property 125,880$ 109,254$
Direct operating expenses arisingfrom the investment propertythat generated rental incomein the period 25,294$ 21,986$
Direct operating expenses arisingfrom the investment property thatdid not generate rental income inthe period 1,017$ 1,586$
December 31, 2017 December 31, 2016Prepayments for equipment 6,080,908$ 4,898,843$Refundable deposits 197,413 159,013Others 160,044 2,463
6,438,365$ 5,060,319$
Year ended December Year ended December31, 2017 31, 2016
Amount capitalised $ 107,084 $ 55,774Interest rate 1.31%~3.06% 1.31%~2.93%
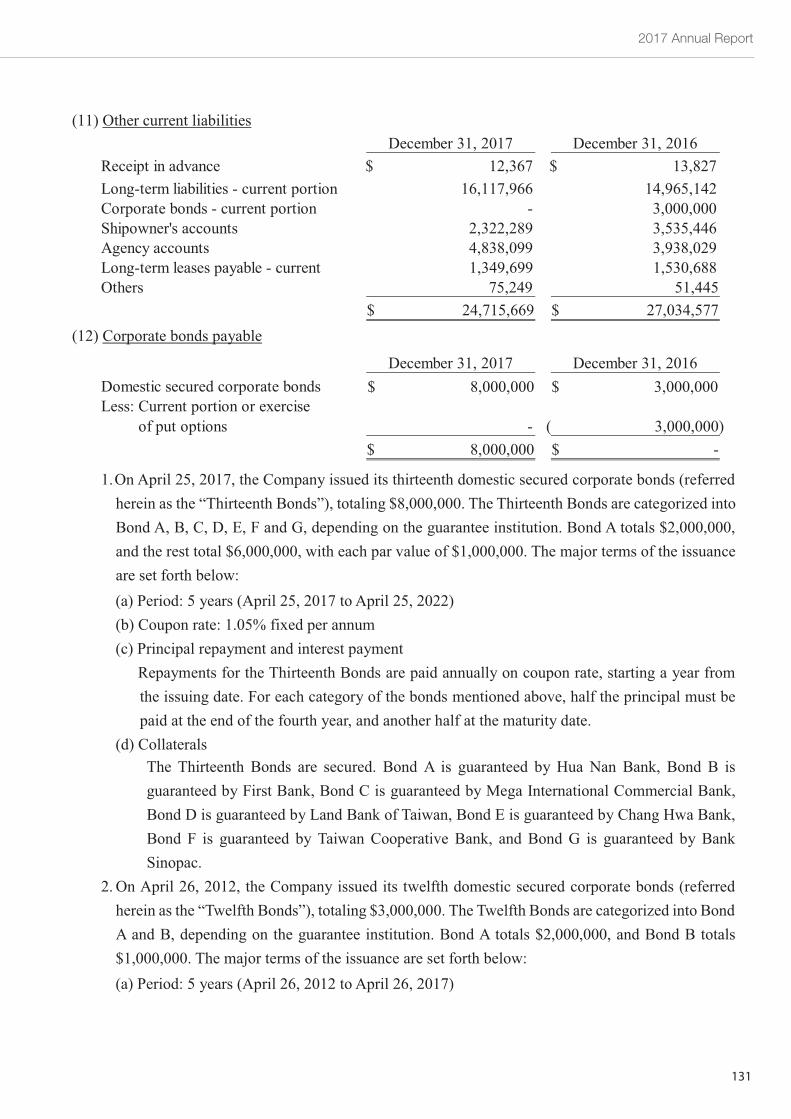
2017 Annual Report
131
~56~
(11) Other current liabilities
(12) Corporate bonds payable
1.. On April 25, 2017, the Company issued its thirteenth domestic secured corporate bonds (referredherein as the “Thirteenth Bonds”), totaling $8,000,000. The Thirteenth Bonds are categorized intoBond A, B, C, D, E, F and G, depending on the guarantee institution. Bond A totals $2,000,000,and the rest total $6,000,000, with each par value of $1,000,000. The major terms of the issuanceare set forth below:(a) Period: 5 years (April 25, 2017 to April 25, 2022)(b) Coupon rate: 1.05% fixed per annum(c) Principal repayment and interest payment
Repayments for the Thirteenth Bonds are paid annually on coupon rate, starting a year fromthe issuing date. For each category of the bonds mentioned above, half the principal must bepaid at the end of the fourth year, and another half at the maturity date.
(d) CollateralsThe Thirteenth Bonds are secured. Bond A is guaranteed by Hua Nan Bank, Bond B isguaranteed by First Bank, Bond C is guaranteed by Mega International Commercial Bank,Bond D is guaranteed by Land Bank of Taiwan, Bond E is guaranteed by Chang Hwa Bank,Bond F is guaranteed by Taiwan Cooperative Bank, and Bond G is guaranteed by BankSinopac.
2.. On April 26, 2012, the Company issued its twelfth domestic secured corporate bonds (referredherein as the “Twelfth Bonds”), totaling $3,000,000. The Twelfth Bonds are categorized into BondA and B, depending on the guarantee institution. Bond A totals $2,000,000, and Bond B totals$1,000,000. The major terms of the issuance are set forth below:(a) Period: 5 years (April 26, 2012 to April 26, 2017)
December 31, 2017 December 31, 2016Receipt in advance 12,367$ 13,827$Long-term liabilities - current portion 16,117,966 14,965,142Corporate bonds - current portion - 3,000,000Shipowner's accounts 2,322,289 3,535,446Agency accounts 4,838,099 3,938,029Long-term leases payable - current 1,349,699 1,530,688Others 75,249 51,445
24,715,669$ 27,034,577$
December 31, 2017 December 31, 2016Domestic secured corporate bonds 8,000,000$ 3,000,000$Less: Current portion or exercise
of put options - 3,000,000)(8,000,000$ -$
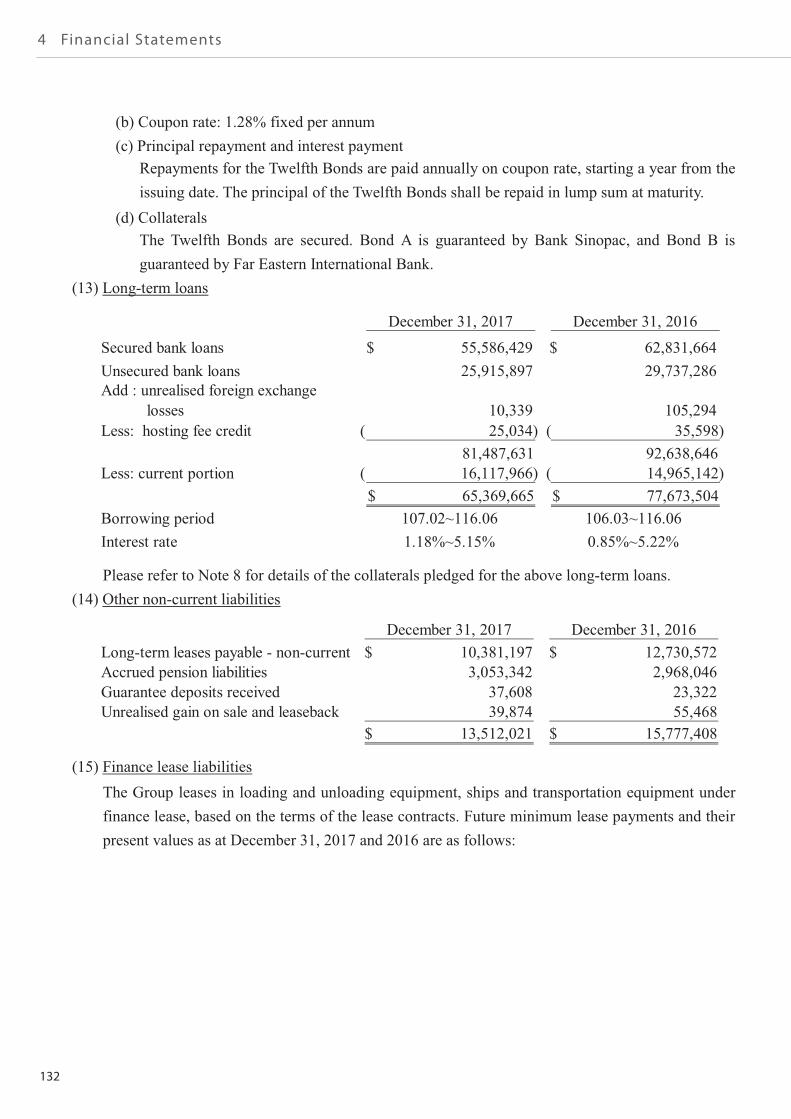
132
4 Financial Statements
~57~
(b) Coupon rate: 1.28% fixed per annum(c) Principal repayment and interest payment
Repayments for the Twelfth Bonds are paid annually on coupon rate, starting a year from theissuing date. The principal of the Twelfth Bonds shall be repaid in lump sum at maturity.
(d) CollateralsThe Twelfth Bonds are secured. Bond A is guaranteed by Bank Sinopac, and Bond B isguaranteed by Far Eastern International Bank.
(13) Long-term loans
Please refer to Note 8 for details of the collaterals pledged for the above long-term loans.(14) Other non-current liabilities
(15) Finance lease liabilitiesThe Group leases in loading and unloading equipment, ships and transportation equipment underfinance lease, based on the terms of the lease contracts. Future minimum lease payments and theirpresent values as at December 31, 2017 and 2016 are as follows:
December 31, 2017 December 31, 2016
Secured bank loans 55,586,429$ 62,831,664$Unsecured bank loans 25,915,897 29,737,286Add : unrealised foreign exchange
losses 10,339 105,294Less: hosting fee credit 25,034)( 35,598)(
81,487,631 92,638,646Less: current portion 16,117,966)( 14,965,142)(
65,369,665$ 77,673,504$Borrowing period 107.02~116.06 106.03~116.06Interest rate 1.18%~5.15% 0.85%~5.22%
December 31, 2017 December 31, 2016Long-term leases payable - non-current 10,381,197$ 12,730,572$Accrued pension liabilities 3,053,342 2,968,046Guarantee deposits received 37,608 23,322Unrealised gain on sale and leaseback 39,874 55,468
13,512,021$ 15,777,408$
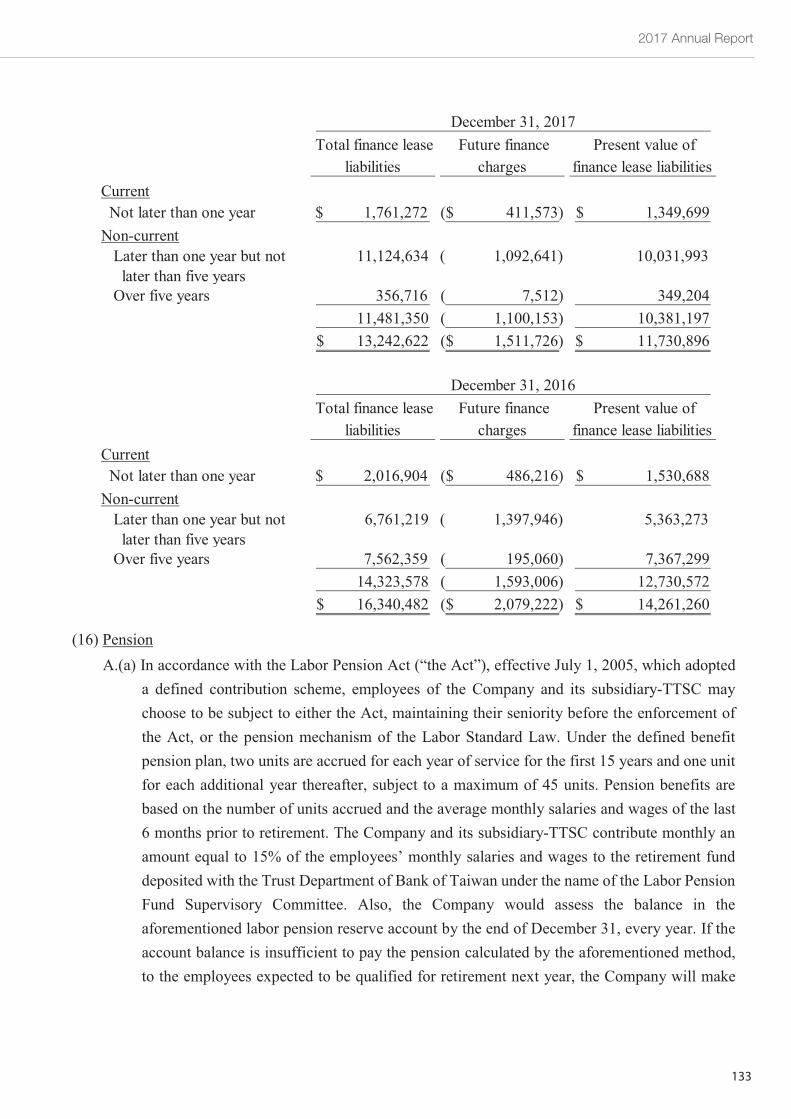
2017 Annual Report
133
~58~
(16) PensionA.(a) In accordance with the Labor Pension Act (“the Act”), effective July 1, 2005, which adopted
a defined contribution scheme, employees of the Company and its subsidiary-TTSC maychoose to be subject to either the Act, maintaining their seniority before the enforcement ofthe Act, or the pension mechanism of the Labor Standard Law. Under the defined benefitpension plan, two units are accrued for each year of service for the first 15 years and one unitfor each additional year thereafter, subject to a maximum of 45 units. Pension benefits arebased on the number of units accrued and the average monthly salaries and wages of the last6 months prior to retirement. The Company and its subsidiary-TTSC contribute monthly anamount equal to 15% of the employees’ monthly salaries and wages to the retirement funddeposited with the Trust Department of Bank of Taiwan under the name of the Labor PensionFund Supervisory Committee. Also, the Company would assess the balance in theaforementioned labor pension reserve account by the end of December 31, every year. If theaccount balance is insufficient to pay the pension calculated by the aforementioned method,to the employees expected to be qualified for retirement next year, the Company will make
Total finance leaseliabilities
Future financecharges
Present value offinance lease liabilities
CurrentNot later than one year 1,761,272$ 411,573)($ 1,349,699$
Non-currentLater than one year but not
later than five years11,124,634 1,092,641)( 10,031,993
Over five years 356,716 7,512)( 349,20411,481,350 1,100,153)( 10,381,19713,242,622$ 1,511,726)($ 11,730,896$
December 31, 2017
Total finance leaseliabilities
Future financecharges
Present value offinance lease liabilities
CurrentNot later than one year 2,016,904$ 486,216)($ 1,530,688$
Non-currentLater than one year but not
later than five years6,761,219 1,397,946)( 5,363,273
Over five years 7,562,359 195,060)( 7,367,29914,323,578 1,593,006)( 12,730,57216,340,482$ 2,079,222)($ 14,261,260$
December 31, 2016
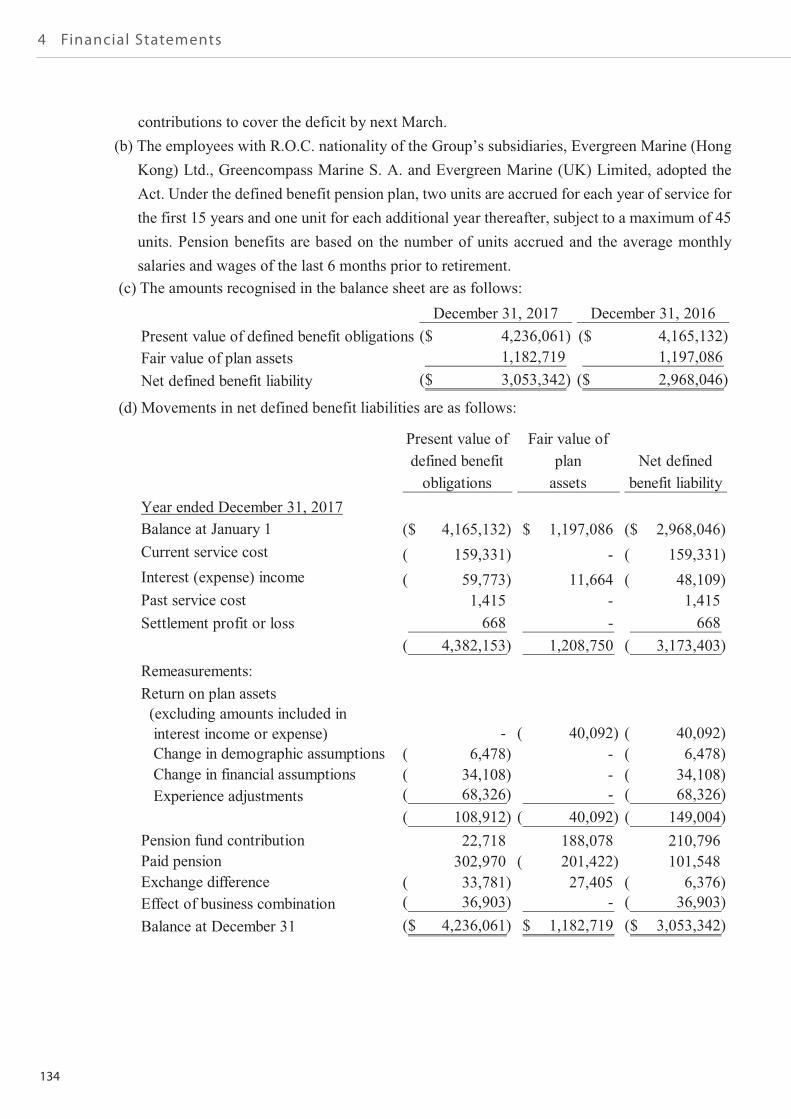
134
4 Financial Statements
~59~
contributions to cover the deficit by next March.(b) The employees with R.O.C. nationality of the Group’s subsidiaries, Evergreen Marine (Hong
Kong) Ltd., Greencompass Marine S. A. and Evergreen Marine (UK) Limited, adopted theAct. Under the defined benefit pension plan, two units are accrued for each year of service forthe first 15 years and one unit for each additional year thereafter, subject to a maximum of 45units. Pension benefits are based on the number of units accrued and the average monthlysalaries and wages of the last 6 months prior to retirement.
(c) The amounts recognised in the balance sheet are as follows:
(d) Movements in net defined benefit liabilities are as follows:
December 31, 2017 December 31, 2016Present value of defined benefit obligations 4,236,061)($ 4,165,132)($Fair value of plan assets 1,182,719 1,197,086Net defined benefit liability 3,053,342)($ 2,968,046)($
Present value ofdefined benefit
obligations
Fair value ofplan
assetsNet defined
benefit liabilityYear ended December 31, 2017Balance at January 1 4,165,132)($ 1,197,086$ 2,968,046)($Current service cost 159,331)( - 159,331)(Interest (expense) income 59,773)( 11,664 48,109)(Past service cost 1,415 - 1,415Settlement profit or loss 668 - 668
4,382,153)( 1,208,750 3,173,403)(Remeasurements:Return on plan assets
(excluding amounts included ininterest income or expense) - 40,092)( 40,092)(Change in demographic assumptions 6,478)( - 6,478)(Change in financial assumptions 34,108)( - 34,108)(Experience adjustments 68,326)( - 68,326)(
108,912)( 40,092)( 149,004)(Pension fund contribution 22,718 188,078 210,796Paid pension 302,970 201,422)( 101,548Exchange difference 33,781)( 27,405 6,376)(Effect of business combination 36,903)( - 36,903)(Balance at December 31 4,236,061)($ 1,182,719$ 3,053,342)($
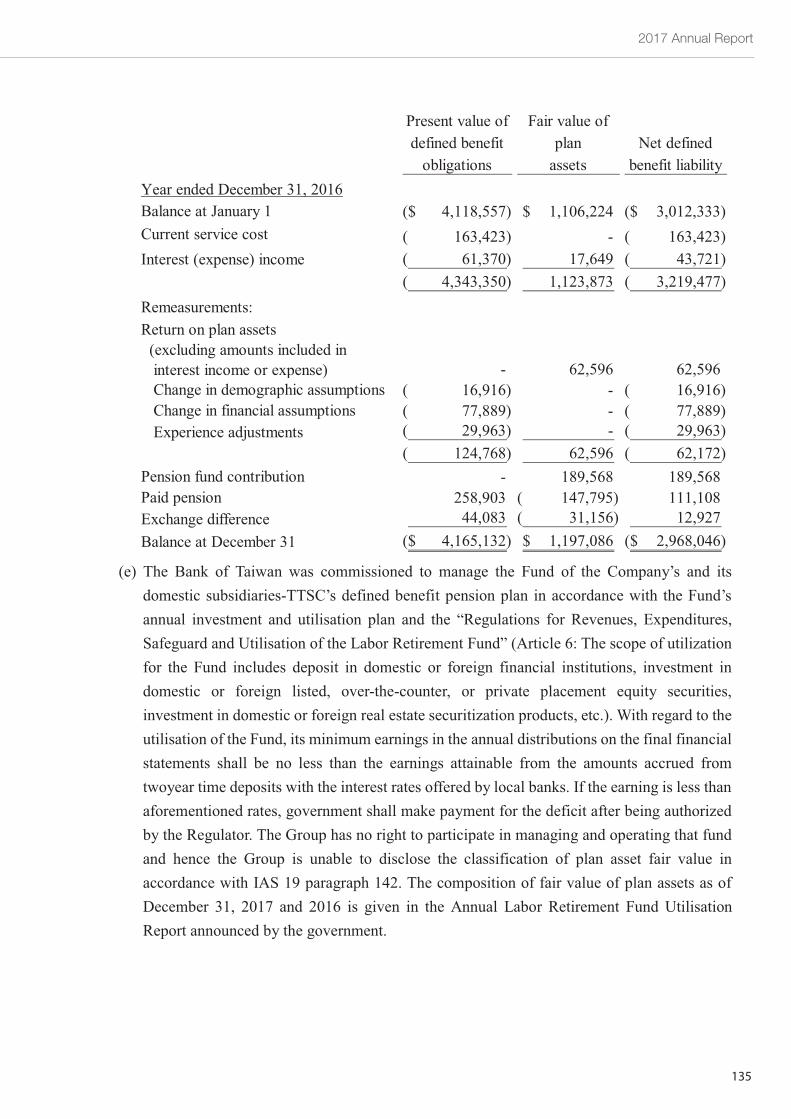
2017 Annual Report
135
~60~
(e) The Bank of Taiwan was commissioned to manage the Fund of the Company’s and itsdomestic subsidiaries-TTSC’s defined benefit pension plan in accordance with the Fund’sannual investment and utilisation plan and the “Regulations for Revenues, Expenditures,Safeguard and Utilisation of the Labor Retirement Fund” (Article 6: The scope of utilizationfor the Fund includes deposit in domestic or foreign financial institutions, investment indomestic or foreign listed, over-the-counter, or private placement equity securities,investment in domestic or foreign real estate securitization products, etc.). With regard to theutilisation of the Fund, its minimum earnings in the annual distributions on the final financialstatements shall be no less than the earnings attainable from the amounts accrued fromtwoyear time deposits with the interest rates offered by local banks. If the earning is less thanaforementioned rates, government shall make payment for the deficit after being authorizedby the Regulator. The Group has no right to participate in managing and operating that fundand hence the Group is unable to disclose the classification of plan asset fair value inaccordance with IAS 19 paragraph 142. The composition of fair value of plan assets as ofDecember 31, 2017 and 2016 is given in the Annual Labor Retirement Fund UtilisationReport announced by the government.
Present value ofdefined benefit
obligations
Fair value ofplan
assetsNet defined
benefit liabilityYear ended December 31, 2016Balance at January 1 4,118,557)($ 1,106,224$ 3,012,333)($Current service cost 163,423)( - 163,423)(Interest (expense) income 61,370)( 17,649 43,721)(
4,343,350)( 1,123,873 3,219,477)(Remeasurements:Return on plan assets
(excluding amounts included ininterest income or expense) - 62,596 62,596Change in demographic assumptions 16,916)( - 16,916)(Change in financial assumptions 77,889)( - 77,889)(Experience adjustments 29,963)( - 29,963)(
124,768)( 62,596 62,172)(Pension fund contribution - 189,568 189,568Paid pension 258,903 147,795)( 111,108Exchange difference 44,083 31,156)( 12,927Balance at December 31 4,165,132)($ 1,197,086$ 2,968,046)($
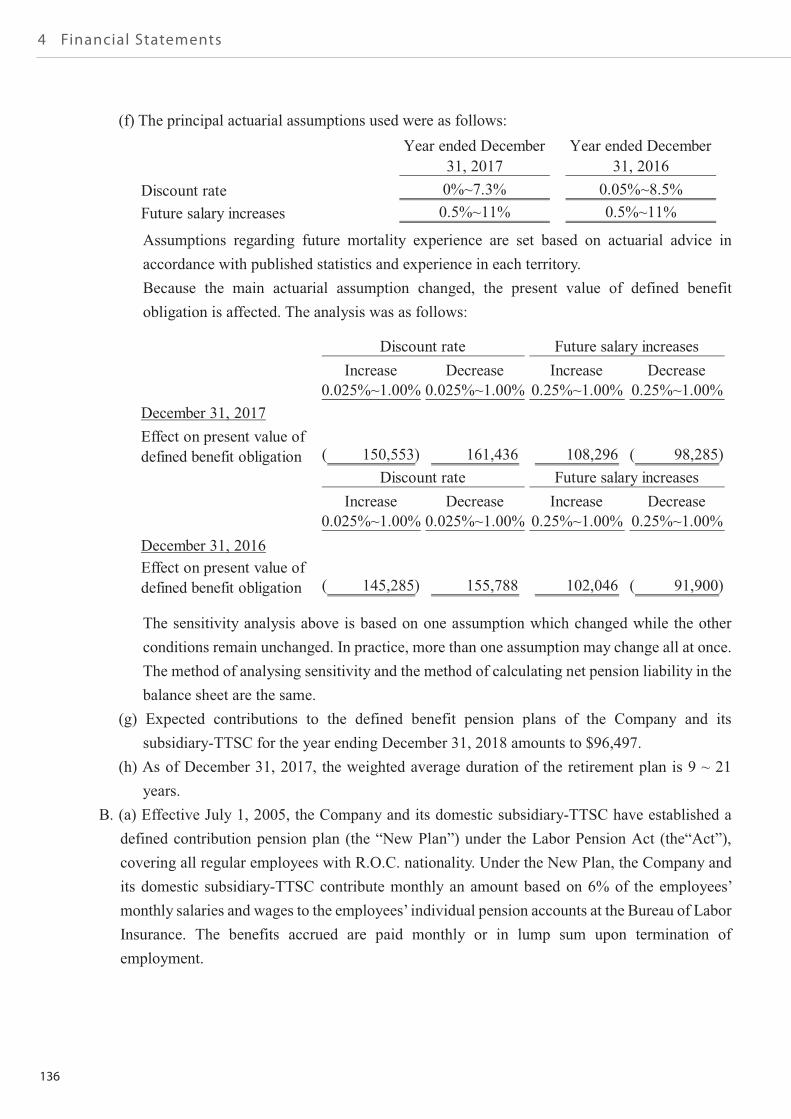
136
4 Financial Statements
~61~
(f) The principal actuarial assumptions used were as follows:
Assumptions regarding future mortality experience are set based on actuarial advice inaccordance with published statistics and experience in each territory.Because the main actuarial assumption changed, the present value of defined benefitobligation is affected. The analysis was as follows:
The sensitivity analysis above is based on one assumption which changed while the otherconditions remain unchanged. In practice, more than one assumption may change all at once.The method of analysing sensitivity and the method of calculating net pension liability in thebalance sheet are the same.
(g) Expected contributions to the defined benefit pension plans of the Company and itssubsidiary-TTSC for the year ending December 31, 2018 amounts to $96,497.
(h) As of December 31, 2017, the weighted average duration of the retirement plan is 9 ~ 21years.
B. (a) Effective July 1, 2005, the Company and its domestic subsidiary-TTSC have established adefined contribution pension plan (the “New Plan”) under the Labor Pension Act (the“Act”),covering all regular employees with R.O.C. nationality. Under the New Plan, the Company andits domestic subsidiary-TTSC contribute monthly an amount based on 6% of the employees’monthly salaries and wages to the employees’ individual pension accounts at the Bureau of LaborInsurance. The benefits accrued are paid monthly or in lump sum upon termination ofemployment.
Year ended December Year ended December31, 2017 31, 2016
Discount rate 0%~7.3% 0.05%~8.5%Future salary increases 0.5%~11% 0.5%~11%
Increase Decrease Increase Decrease0.025%~1.00% 0.025%~1.00% 0.25%~1.00% 0.25%~1.00%
December 31, 2017Effect on present value ofdefined benefit obligation 150,553)( 161,436 108,296 98,285)(
Increase Decrease Increase Decrease0.025%~1.00% 0.025%~1.00% 0.25%~1.00% 0.25%~1.00%
December 31, 2016Effect on present value ofdefined benefit obligation 145,285)( 155,788 102,046 91,900)(
Discount rate Future salary increases
Discount rate Future salary increases
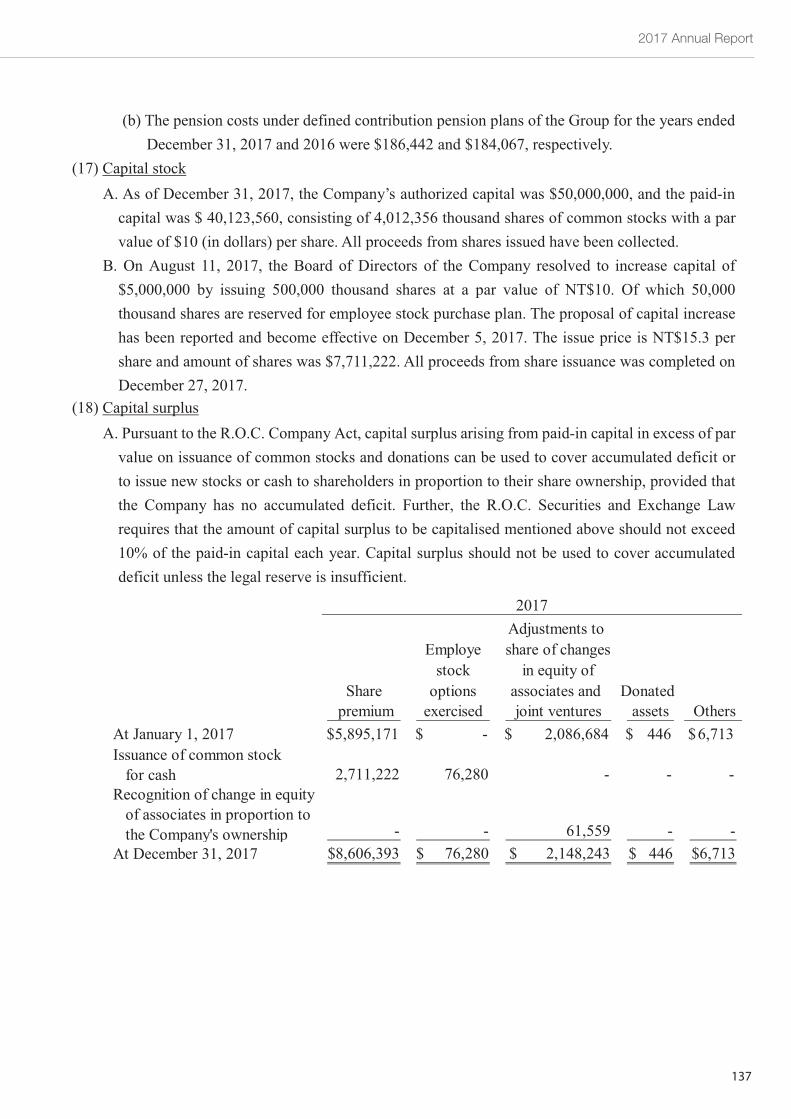
2017 Annual Report
137
~62~
(b) The pension costs under defined contribution pension plans of the Group for the years endedDecember 31, 2017 and 2016 were $186,442 and $184,067, respectively.
(17) Capital stockA. As of December 31, 2017, the Company’s authorized capital was $50,000,000, and the paid-in
capital was $ 40,123,560, consisting of 4,012,356 thousand shares of common stocks with a parvalue of $10 (in dollars) per share. All proceeds from shares issued have been collected.
B. On August 11, 2017, the Board of Directors of the Company resolved to increase capital of$5,000,000 by issuing 500,000 thousand shares at a par value of NT$10. Of which 50,000thousand shares are reserved for employee stock purchase plan. The proposal of capital increasehas been reported and become effective on December 5, 2017. The issue price is NT$15.3 pershare and amount of shares was $7,711,222. All proceeds from share issuance was completed onDecember 27, 2017.
(18) Capital surplusA. Pursuant to the R.O.C. Company Act, capital surplus arising from paid-in capital in excess of par
value on issuance of common stocks and donations can be used to cover accumulated deficit orto issue new stocks or cash to shareholders in proportion to their share ownership, provided thatthe Company has no accumulated deficit. Further, the R.O.C. Securities and Exchange Lawrequires that the amount of capital surplus to be capitalised mentioned above should not exceed10% of the paid-in capital each year. Capital surplus should not be used to cover accumulateddeficit unless the legal reserve is insufficient.
Adjustments toEmploye share of changes
stock in equity ofShare options associates and Donated
premium exercised joint ventures assets OthersAt January 1, 2017 5,895,171$ -$ 2,086,684$ 446$ 6,713$Issuance of common stock
for cash 2,711,222 76,280 - - -Recognition of change in equity
of associates in proportion tothe Company's ownership - - 61,559 - -
At December 31, 2017 8,606,393$ 76,280$ 2,148,243$ 446$ 6,713$
2017
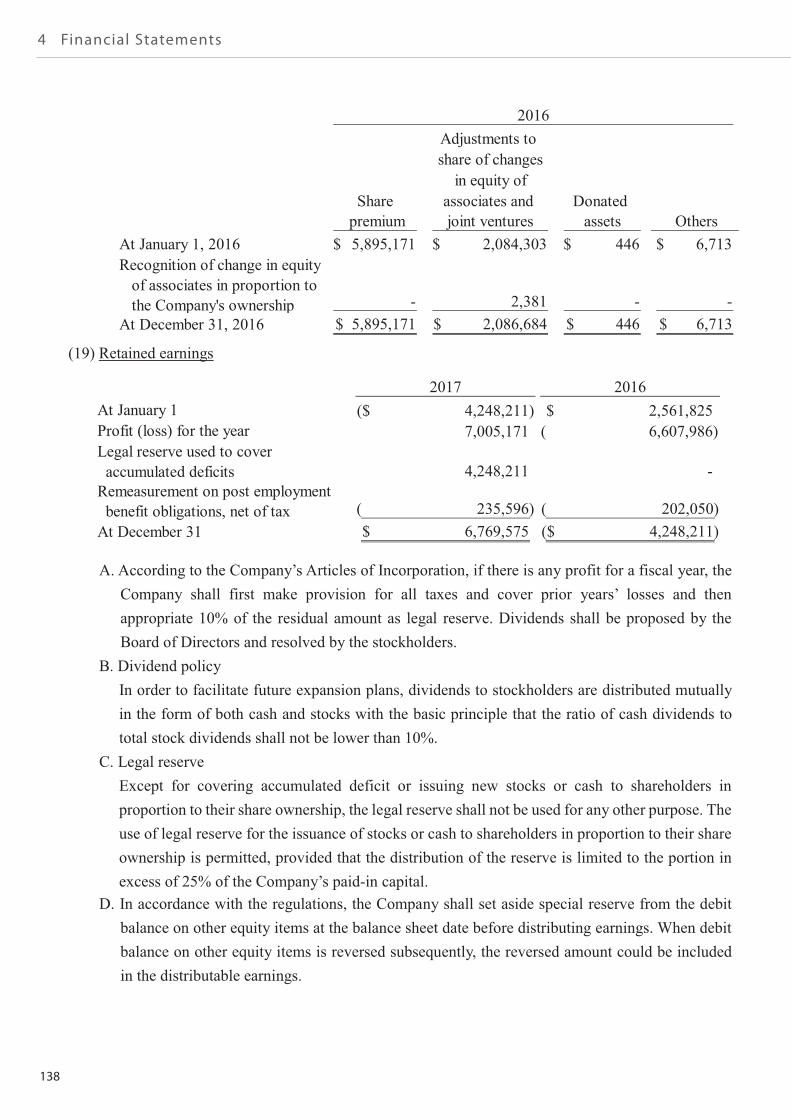
138
4 Financial Statements
~63~
(19) Retained earnings
A. According to the Company’s Articles of Incorporation, if there is any profit for a fiscal year, theCompany shall first make provision for all taxes and cover prior years’ losses and thenappropriate 10% of the residual amount as legal reserve. Dividends shall be proposed by theBoard of Directors and resolved by the stockholders.
B. Dividend policyIn order to facilitate future expansion plans, dividends to stockholders are distributed mutuallyin the form of both cash and stocks with the basic principle that the ratio of cash dividends tototal stock dividends shall not be lower than 10%.
C. Legal reserveExcept for covering accumulated deficit or issuing new stocks or cash to shareholders inproportion to their share ownership, the legal reserve shall not be used for any other purpose. Theuse of legal reserve for the issuance of stocks or cash to shareholders in proportion to their shareownership is permitted, provided that the distribution of the reserve is limited to the portion inexcess of 25% of the Company’s paid-in capital.
D. In accordance with the regulations, the Company shall set aside special reserve from the debitbalance on other equity items at the balance sheet date before distributing earnings. When debitbalance on other equity items is reversed subsequently, the reversed amount could be includedin the distributable earnings.
Adjustments toshare of changes
in equity ofShare associates and Donated
premium joint ventures assets OthersAt January 1, 2016 5,895,171$ 2,084,303$ 446$ 6,713$Recognition of change in equity
of associates in proportion tothe Company's ownership - 2,381 - -
At December 31, 2016 5,895,171$ 2,086,684$ 446$ 6,713$
2016
2017 2016At January 1 4,248,211)($ 2,561,825$Profit (loss) for the year 7,005,171 6,607,986)(Legal reserve used to cover
accumulated deficits 4,248,211 -Remeasurement on post employment
benefit obligations, net of tax 235,596)( 202,050)(At December 31 6,769,575$ 4,248,211)($
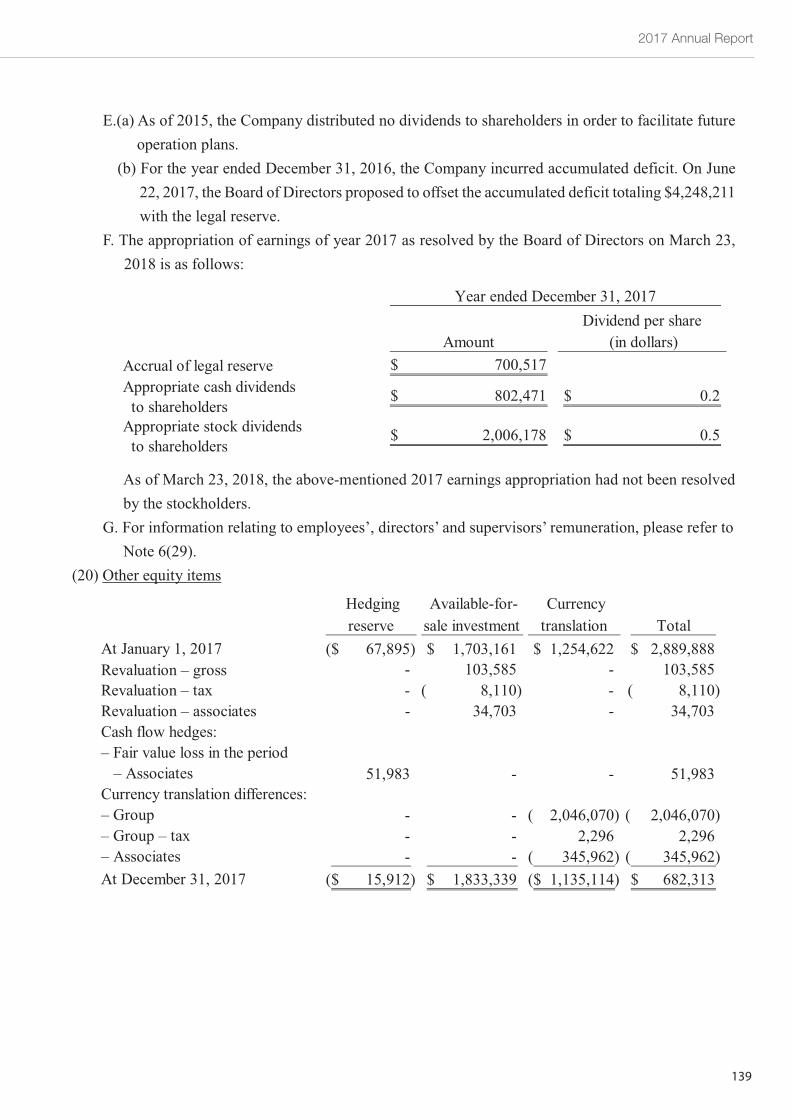
2017 Annual Report
139
~64~
E.(a) As of 2015, the Company distributed no dividends to shareholders in order to facilitate futureoperation plans.
.(b) For the year ended December 31, 2016, the Company incurred accumulated deficit. On June22, 2017, the Board of Directors proposed to offset the accumulated deficit totaling $4,248,211with the legal reserve.
F. The appropriation of earnings of year 2017 as resolved by the Board of Directors on March 23,2018 is as follows:
As of March 23, 2018, the above-mentioned 2017 earnings appropriation had not been resolvedby the stockholders.
G. For information relating to employees’, directors’ and supervisors’ remuneration, please refer toNote 6(29).
(20) Other equity items
Dividend per shareAmount (in dollars)
Accrual of legal reserve 700,517$Appropriate cash dividends
to shareholders802,471$ 0.2$
Appropriate stock dividendsto shareholders
2,006,178$ 0.5$
Year ended December 31, 2017
Hedgingreserve
Available-for-sale investment
Currencytranslation Total
At January 1, 2017 67,895)($ 1,703,161$ 1,254,622$ 2,889,888$Revaluation – gross - 103,585 - 103,585Revaluation – tax - 8,110)( - 8,110)(Revaluation – associates - 34,703 - 34,703Cash flow hedges:– Fair value loss in the period
– Associates 51,983 - - 51,983Currency translation differences:– Group - - 2,046,070)( 2,046,070)(– Group – tax - - 2,296 2,296– Associates - - 345,962)( 345,962)(At December 31, 2017 15,912)($ 1,833,339$ 1,135,114)($ 682,313$
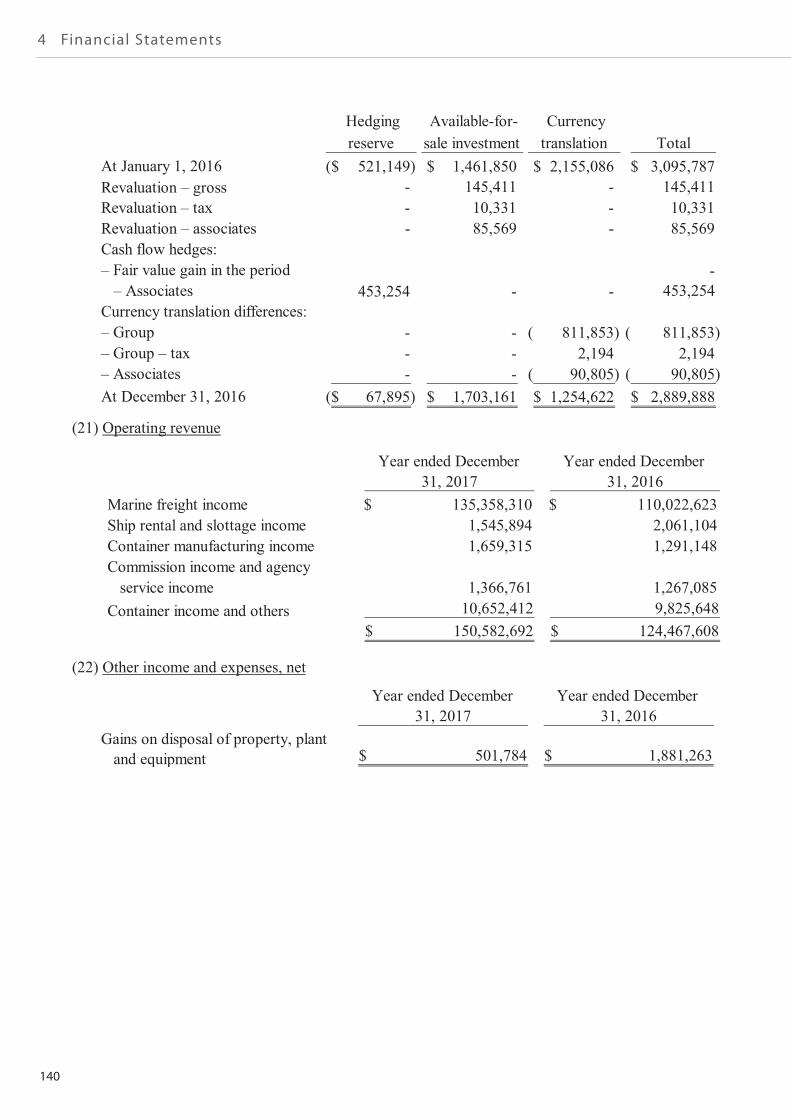
140
4 Financial Statements
~65~
(21) Operating revenue
(22) Other income and expenses, net
Hedgingreserve
Available-for-sale investment
Currencytranslation Total
At January 1, 2016 521,149)($ 1,461,850$ 2,155,086$ 3,095,787$Revaluation – gross - 145,411 - 145,411Revaluation – tax - 10,331 - 10,331Revaluation – associates - 85,569 - 85,569Cash flow hedges:– Fair value gain in the period -
– Associates 453,254 - - 453,254Currency translation differences:– Group - - 811,853)( 811,853)(– Group – tax - - 2,194 2,194– Associates - - 90,805)( 90,805)(At December 31, 2016 67,895)($ 1,703,161$ 1,254,622$ 2,889,888$
Year ended December Year ended December31, 2017 31, 2016
Marine freight income 135,358,310$ 110,022,623$Ship rental and slottage income 1,545,894 2,061,104Container manufacturing income 1,659,315 1,291,148Commission income and agency
service income 1,366,761 1,267,085Container income and others 10,652,412 9,825,648
150,582,692$ 124,467,608$
Year ended December Year ended December31, 2017 31, 2016
Gains on disposal of property, plantand equipment 501,784$ 1,881,263$
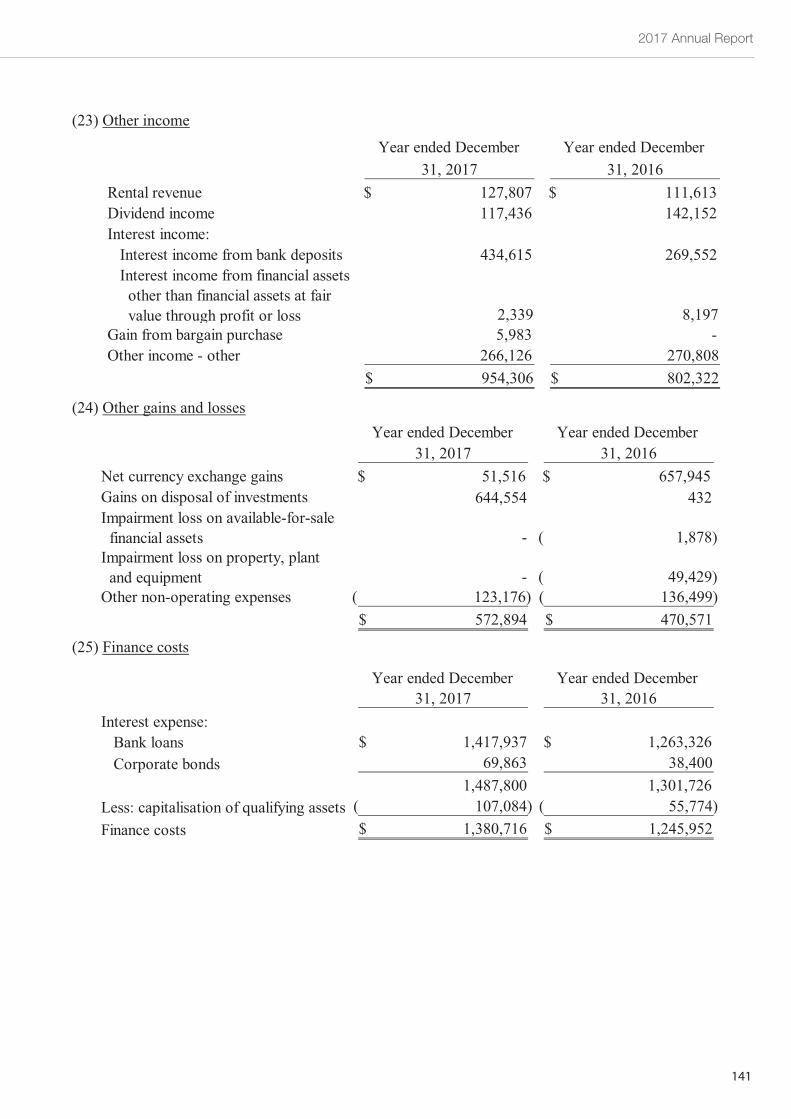
2017 Annual Report
141
~66~
(23) Other income
(24) Other gains and losses
(25) Finance costs
Year ended December Year ended December31, 2017 31, 2016
Rental revenue 127,807$ 111,613$Dividend income 117,436 142,152Interest income:
Interest income from bank deposits 434,615 269,552Interest income from financial assets
other than financial assets at fairvalue through profit or loss 2,339 8,197
Gain from bargain purchase 5,983 -Other income - other 266,126 270,808
954,306$ 802,322$
Year ended December Year ended December31, 2017 31, 2016
Net currency exchange gains 51,516$ 657,945$Gains on disposal of investments 644,554 432Impairment loss on available-for-sale
financial assets - 1,878)(Impairment loss on property, plant
and equipment - 49,429)(Other non-operating expenses 123,176)( 136,499)(
572,894$ 470,571$
Year ended December Year ended December31, 2017 31, 2016
Interest expense:Bank loans 1,417,937$ 1,263,326$Corporate bonds 69,863 38,400
1,487,800 1,301,726Less: capitalisation of qualifying assets 107,084)( 55,774)(Finance costs 1,380,716$ 1,245,952$
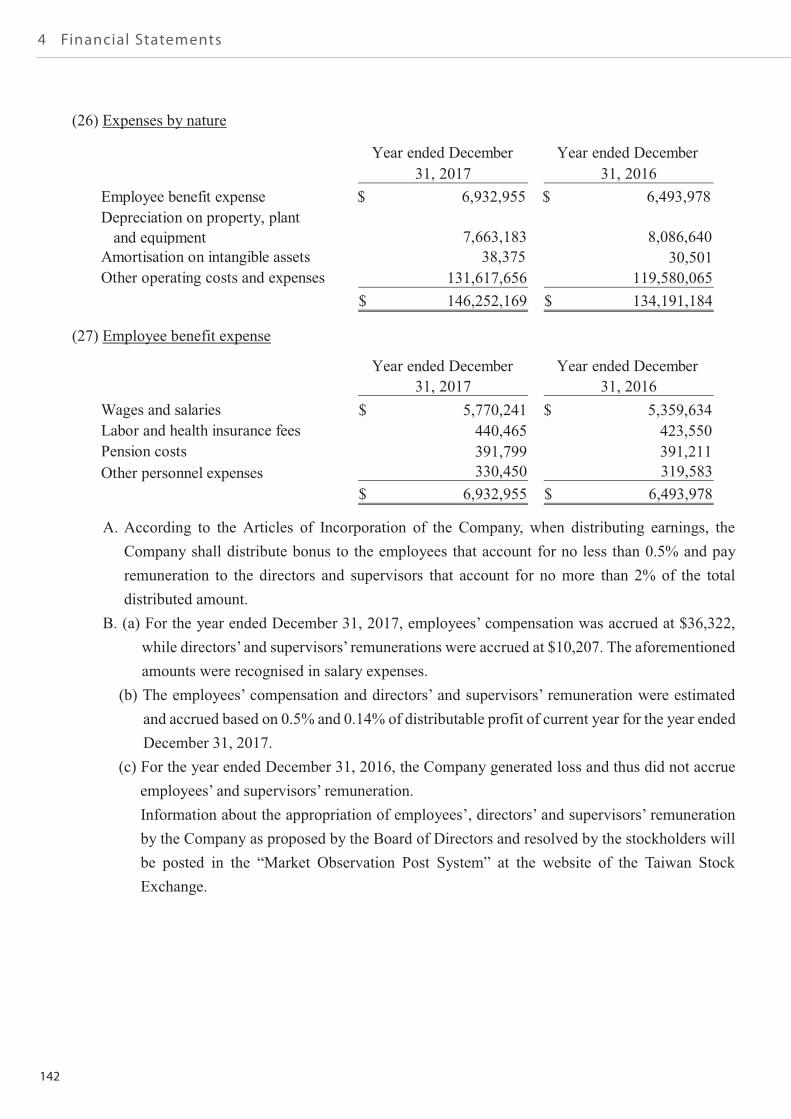
142
4 Financial Statements
~67~
(26) Expenses by nature
(27) Employee benefit expense
A. According to the Articles of Incorporation of the Company, when distributing earnings, theCompany shall distribute bonus to the employees that account for no less than 0.5% and payremuneration to the directors and supervisors that account for no more than 2% of the totaldistributed amount.
B. (a) For the year ended December 31, 2017, employees’ compensation was accrued at $36,322,while directors’ and supervisors’ remunerations were accrued at $10,207. The aforementionedamounts were recognised in salary expenses.
(b) The employees’ compensation and directors’ and supervisors’ remuneration were estimatedand accrued based on 0.5% and 0.14% of distributable profit of current year for the year endedDecember 31, 2017.
(c) For the year ended December 31, 2016, the Company generated loss and thus did not accrueemployees’ and supervisors’ remuneration.Information about the appropriation of employees’, directors’ and supervisors’ remunerationby the Company as proposed by the Board of Directors and resolved by the stockholders willbe posted in the “Market Observation Post System” at the website of the Taiwan StockExchange.
Year ended December Year ended December31, 2017 31, 2016
Employee benefit expense 6,932,955$ 6,493,978$Depreciation on property, plant
and equipment 7,663,183 8,086,640Amortisation on intangible assets 38,375 30,501Other operating costs and expenses 131,617,656 119,580,065
146,252,169$ 134,191,184$
Year ended December Year ended December31, 2017 31, 2016
Wages and salaries 5,770,241$ 5,359,634$Labor and health insurance fees 440,465 423,550Pension costs 391,799 391,211Other personnel expenses 330,450 319,583
6,932,955$ 6,493,978$
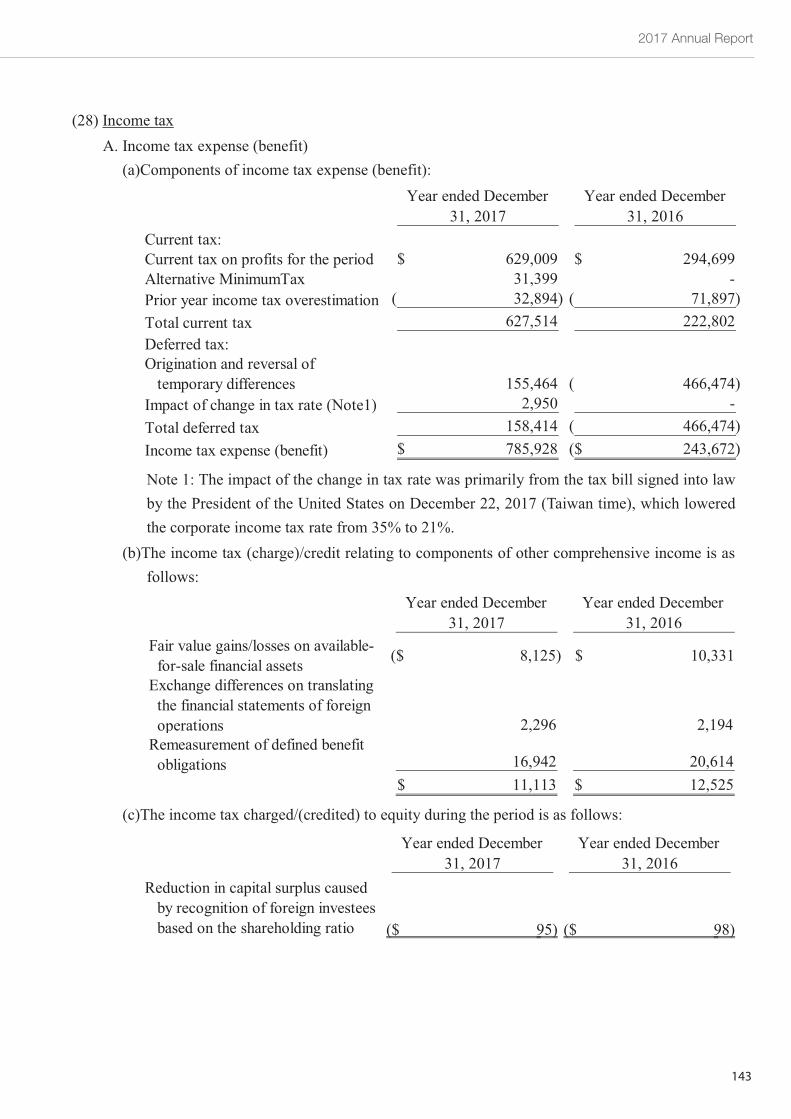
2017 Annual Report
143
~68~
(28) Income taxA. Income tax expense (benefit)
(a)Components of income tax expense (benefit):
Note 1: The impact of the change in tax rate was primarily from the tax bill signed into lawby the President of the United States on December 22, 2017 (Taiwan time), which loweredthe corporate income tax rate from 35% to 21%.
(b)The income tax (charge)/credit relating to components of other comprehensive income is asfollows:
(c)The income tax charged/(credited) to equity during the period is as follows:
Year ended December Year ended December31, 2017 31, 2016
Current tax:Current tax on profits for the period 629,009$ 294,699$Alternative MinimumTax 31,399 -Prior year income tax overestimation 32,894)( 71,897)(Total current tax 627,514 222,802Deferred tax:Origination and reversal of
temporary differences 155,464 466,474)(Impact of change in tax rate (Note1) 2,950 -Total deferred tax 158,414 466,474)(Income tax expense (benefit) 785,928$ 243,672)($
Year ended December Year ended December31, 2017 31, 2016
Fair value gains/losses on available-for-sale financial assets ($ 8,125) $ 10,331
Exchange differences on translatingthe financial statements of foreignoperations 2,296 2,194
Remeasurement of defined benefitobligations 16,942 20,614
11,113$ 12,525$
Year ended December Year ended December31, 2017 31, 2016
Reduction in capital surplus causedby recognition of foreign investeesbased on the shareholding ratio 95)($ 98)($
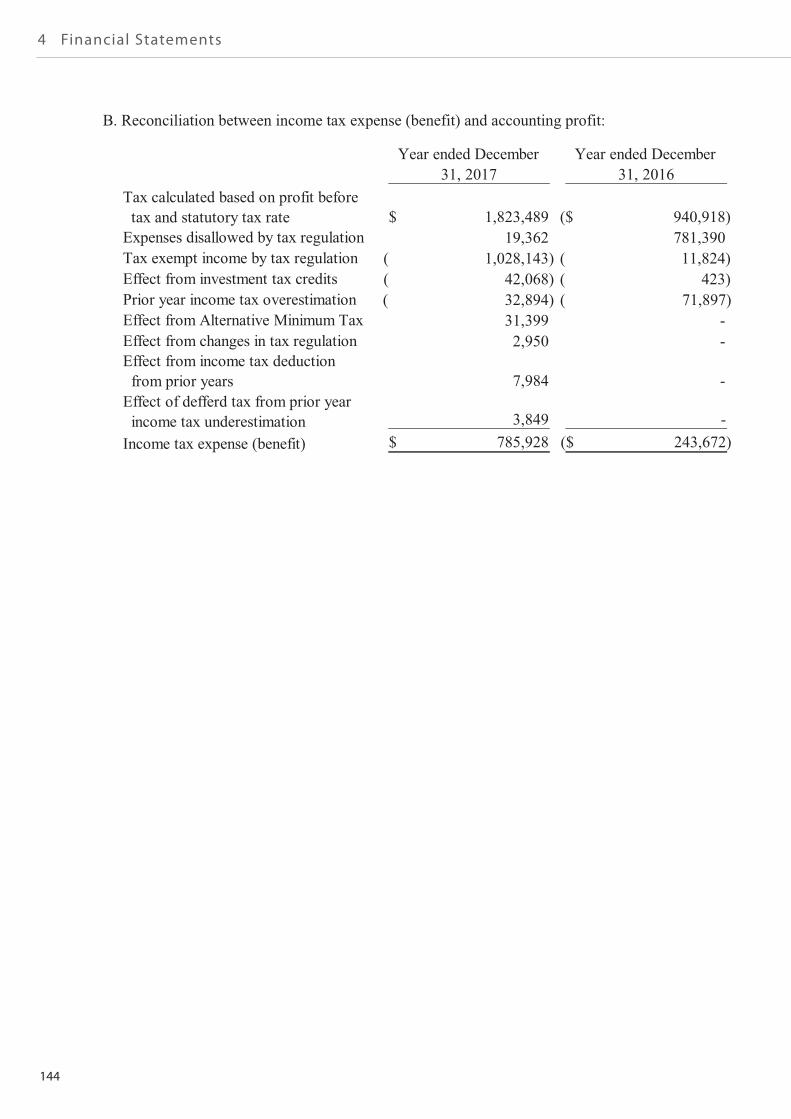
144
4 Financial Statements
~69~
B. Reconciliation between income tax expense (benefit) and accounting profit:
Year ended December Year ended December31, 2017 31, 2016
Tax calculated based on profit beforetax and statutory tax rate 1,823,489$ 940,918)($
Expenses disallowed by tax regulation 19,362 781,390Tax exempt income by tax regulation 1,028,143)( 11,824)(Effect from investment tax credits 42,068)( 423)(Prior year income tax overestimation 32,894)( 71,897)(Effect from Alternative Minimum Tax 31,399 -Effect from changes in tax regulation 2,950 -Effect from income tax deduction
from prior years 7,984 -Effect of defferd tax from prior year
income tax underestimation 3,849 -Income tax expense (benefit) 785,928$ 243,672)($
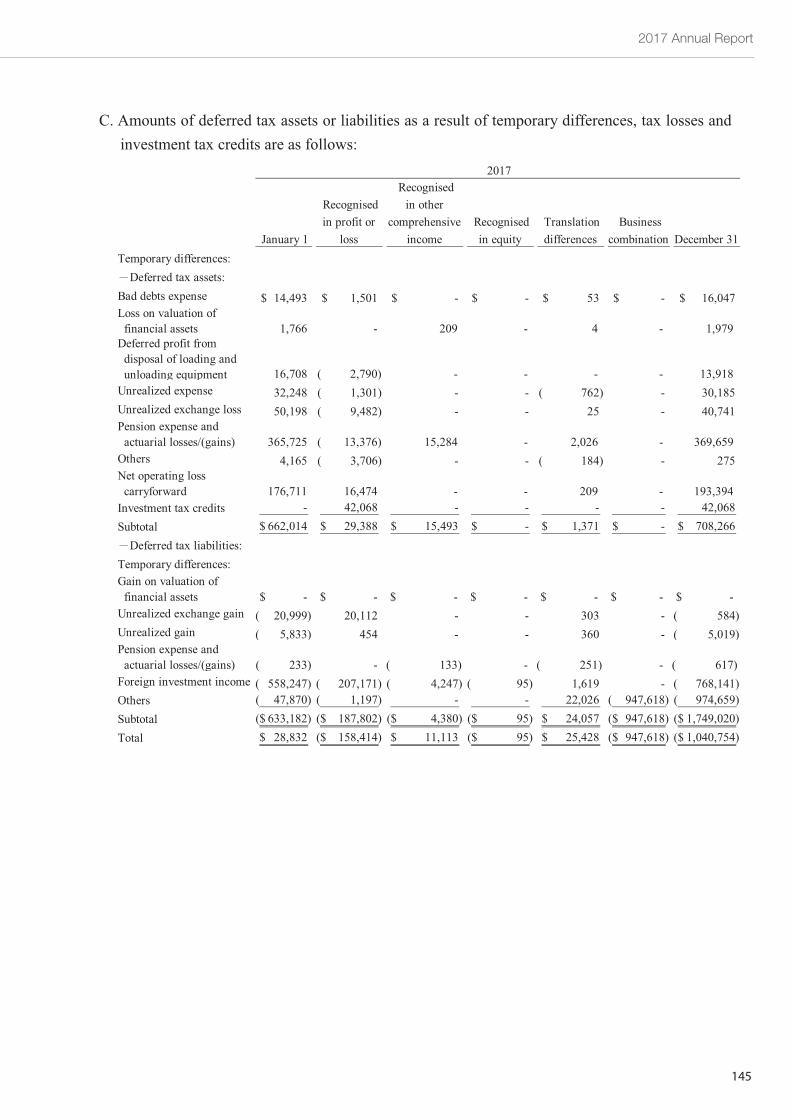
2017 Annual Report
145
~70~
C. Amounts of deferred tax assets or liabilities as a result of temporary differences, tax losses andinvestment tax credits are as follows:
January 1
Recognisedin profit or
loss
Recognisedin other
comprehensiveincome
Recognisedin equity
Translationdifferences
Businesscombination December 31
Temporary differences:Deferred tax assets:
Bad debts expense 14,493$ 1,501$ -$ -$ 53$ -$ 16,047$Loss on valuation of
financial assets 1,766 - 209 - 4 - 1,979Deferred profit from
disposal of loading andunloading equipment 16,708 2,790)( - - - - 13,918
Unrealized expense 32,248 1,301)( - - 762)( - 30,185Unrealized exchange loss 50,198 9,482)( - - 25 - 40,741Pension expense and
actuarial losses/(gains) 365,725 13,376)( 15,284 - 2,026 - 369,659Others 4,165 3,706)( - - 184)( - 275Net operating loss
carryforward 176,711 16,474 - - 209 - 193,394Investment tax credits - 42,068 - - - - 42,068Subtotal 662,014$ 29,388$ 15,493$ -$ 1,371$ -$ 708,266$
Deferred tax liabilities:Temporary differences:Gain on valuation of
financial assets -$ -$ -$ -$ -$ -$ -$Unrealized exchange gain 20,999)( 20,112 - - 303 - 584)(Unrealized gain 5,833)( 454 - - 360 - 5,019)(Pension expense and
actuarial losses/(gains) 233)( - 133)( - 251)( - 617)(Foreign investment income 558,247)( 207,171)( 4,247)( 95)( 1,619 - 768,141)(Others 47,870)( 1,197)( - - 22,026 947,618)( 974,659)(Subtotal 633,182)($ 187,802)($ 4,380)($ 95)($ 24,057$ 947,618)($ 1,749,020)($Total 28,832$ 158,414)($ 11,113$ 95)($ 25,428$ 947,618)($ 1,040,754)($
2017
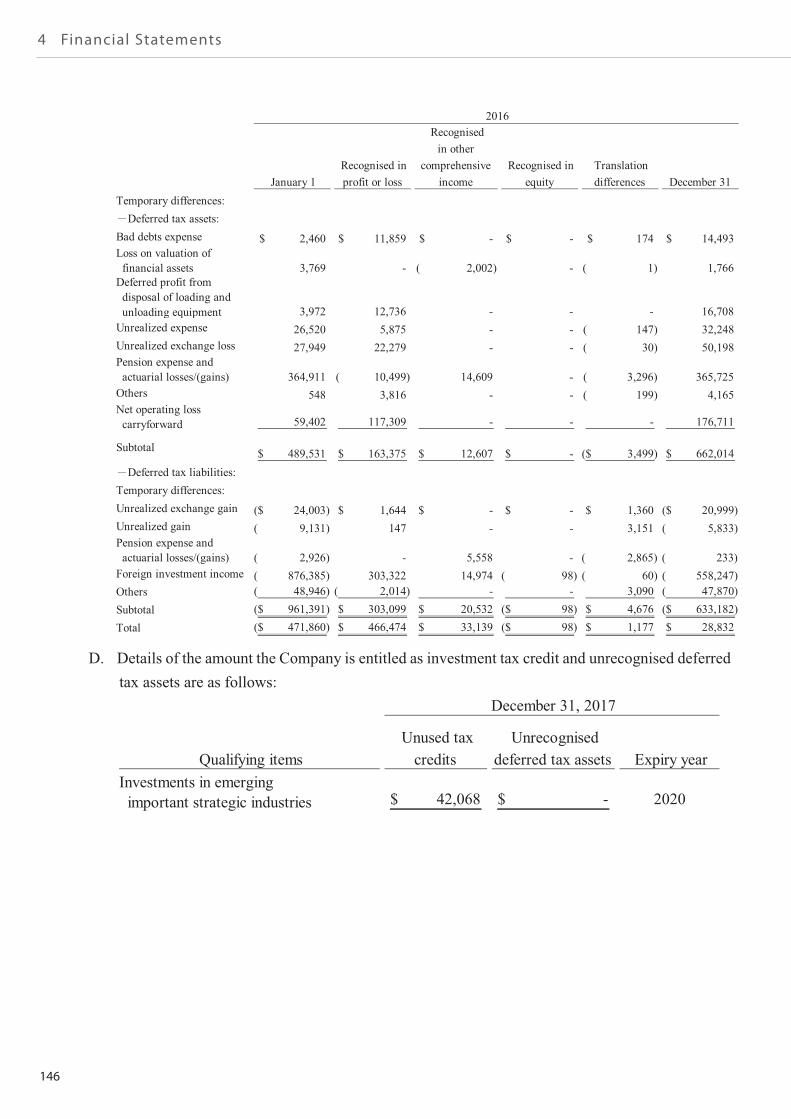
146
4 Financial Statements
~71~
D. Details of the amount the Company is entitled as investment tax credit and unrecognised deferredtax assets are as follows:
January 1Recognised inprofit or loss
Recognisedin other
comprehensiveincome
Recognised inequity
Translationdifferences December 31
Temporary differences:Deferred tax assets:
Bad debts expense 2,460$ 11,859$ -$ -$ 174$ 14,493$Loss on valuation of
financial assets 3,769 - 2,002)( - 1)( 1,766Deferred profit from
disposal of loading andunloading equipment 3,972 12,736 - - - 16,708
Unrealized expense 26,520 5,875 - - 147)( 32,248Unrealized exchange loss 27,949 22,279 - - 30)( 50,198Pension expense and
actuarial losses/(gains) 364,911 10,499)( 14,609 - 3,296)( 365,725Others 548 3,816 - - 199)( 4,165Net operating loss
carryforward 59,402 117,309 - - - 176,711
Subtotal 489,531$ 163,375$ 12,607$ -$ 3,499)($ 662,014$Deferred tax liabilities:
Temporary differences:Unrealized exchange gain 24,003)($ 1,644$ -$ -$ 1,360$ 20,999)($Unrealized gain 9,131)( 147 - - 3,151 5,833)(Pension expense and
actuarial losses/(gains) 2,926)( - 5,558 - 2,865)( 233)(Foreign investment income 876,385)( 303,322 14,974 98)( 60)( 558,247)(Others 48,946)( 2,014)( - - 3,090 47,870)(Subtotal 961,391)($ 303,099$ 20,532$ 98)($ 4,676$ 633,182)($Total 471,860)($ 466,474$ 33,139$ 98)($ 1,177$ 28,832$
2016
Qualifying itemsUnused tax
creditsUnrecognised
deferred tax assets Expiry yearInvestments in emerging
important strategic industries 42,068$ -$ 2020
December 31, 2017
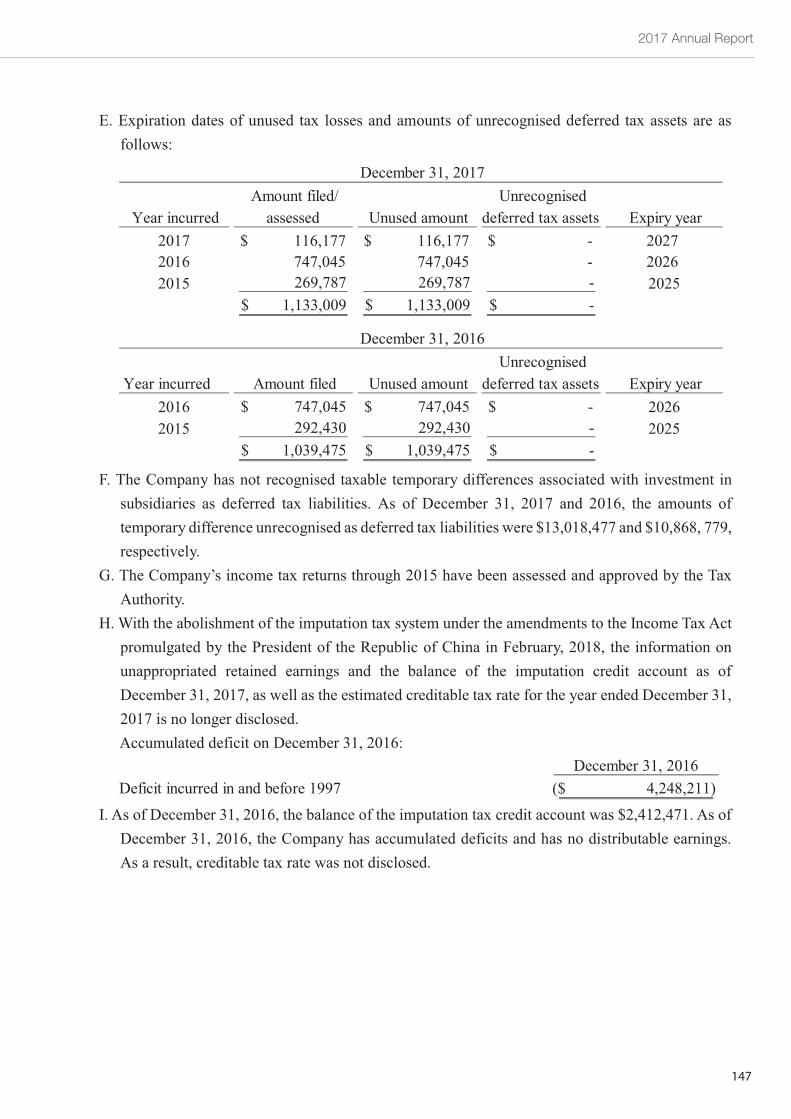
2017 Annual Report
147
~72~
E. Expiration dates of unused tax losses and amounts of unrecognised deferred tax assets are asfollows:
F. The Company has not recognised taxable temporary differences associated with investment insubsidiaries as deferred tax liabilities. As of December 31, 2017 and 2016, the amounts oftemporary difference unrecognised as deferred tax liabilities were $13,018,477 and $10,868, 779,respectively.
G. The Company’s income tax returns through 2015 have been assessed and approved by the TaxAuthority.
H. With the abolishment of the imputation tax system under the amendments to the Income Tax Actpromulgated by the President of the Republic of China in February, 2018, the information onunappropriated retained earnings and the balance of the imputation credit account as ofDecember 31, 2017, as well as the estimated creditable tax rate for the year ended December 31,2017 is no longer disclosed.Accumulated deficit on December 31, 2016:
I. As of December 31, 2016, the balance of the imputation tax credit account was $2,412,471. As ofDecember 31, 2016, the Company has accumulated deficits and has no distributable earnings.As a result, creditable tax rate was not disclosed.
Year incurredAmount filed/
assessed Unused amountUnrecognised
deferred tax assets Expiry year2017 116,177$ 116,177$ -$ 20272016 747,045 747,045 - 20262015 269,787 269,787 - 2025
1,133,009$ 1,133,009$ -$
December 31, 2017
Year incurred Amount filed Unused amountUnrecognised
deferred tax assets Expiry year2016 747,045$ 747,045$ -$ 20262015 292,430 292,430 - 2025
1,039,475$ 1,039,475$ -$
December 31, 2016
December 31, 2016Deficit incurred in and before 1997 4,248,211)($
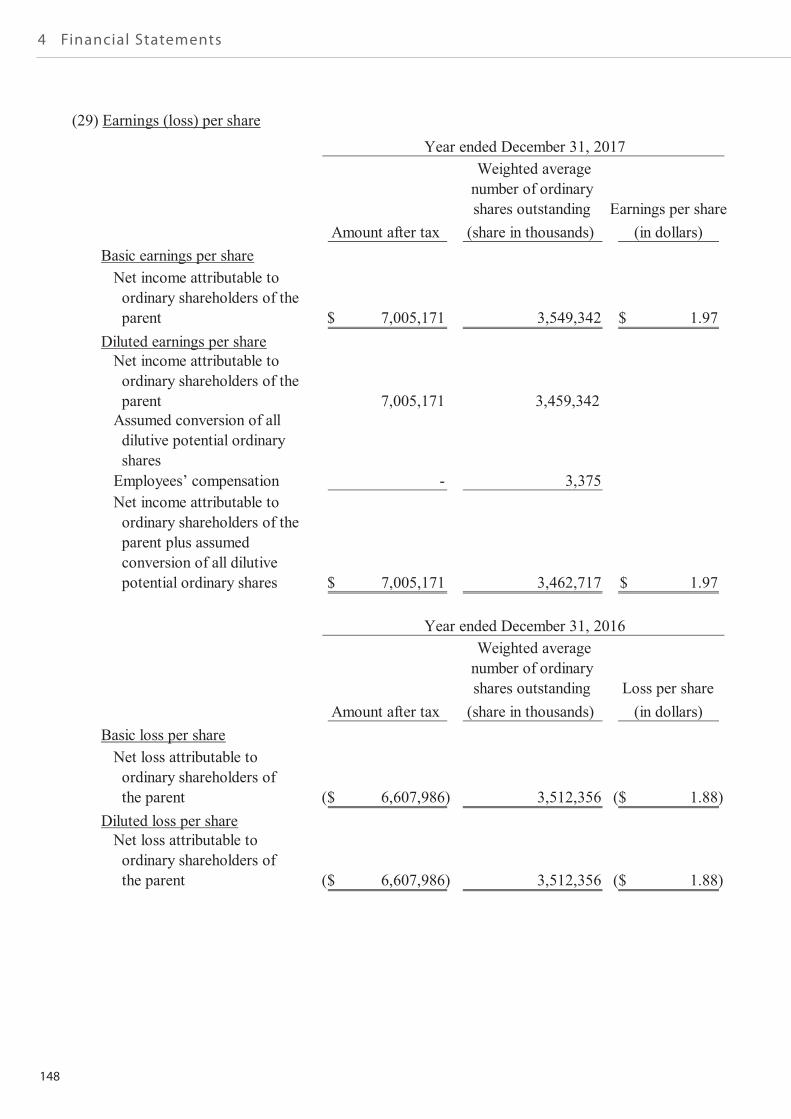
148
4 Financial Statements
~73~
(29) Earnings (loss) per share
Weighted averagenumber of ordinaryshares outstanding Earnings per share
Amount after tax (share in thousands) (in dollars)Basic earnings per share
Net income attributable toordinary shareholders of theparent 7,005,171$ 3,549,342 1.97$
Diluted earnings per shareNet income attributable to
ordinary shareholders of theparent 7,005,171 3,459,342
Assumed conversion of alldilutive potential ordinaryshares
Employees’ compensation - 3,375Net income attributable to
ordinary shareholders of theparent plus assumedconversion of all dilutivepotential ordinary shares 7,005,171$ 3,462,717 1.97$
Weighted averagenumber of ordinaryshares outstanding Loss per share
Amount after tax (share in thousands) (in dollars)Basic loss per share
Net loss attributable toordinary shareholders ofthe parent 6,607,986)($ 3,512,356 1.88)($
Diluted loss per shareNet loss attributable to
ordinary shareholders ofthe parent 6,607,986)($ 3,512,356 1.88)($
Year ended December 31, 2017
Year ended December 31, 2016
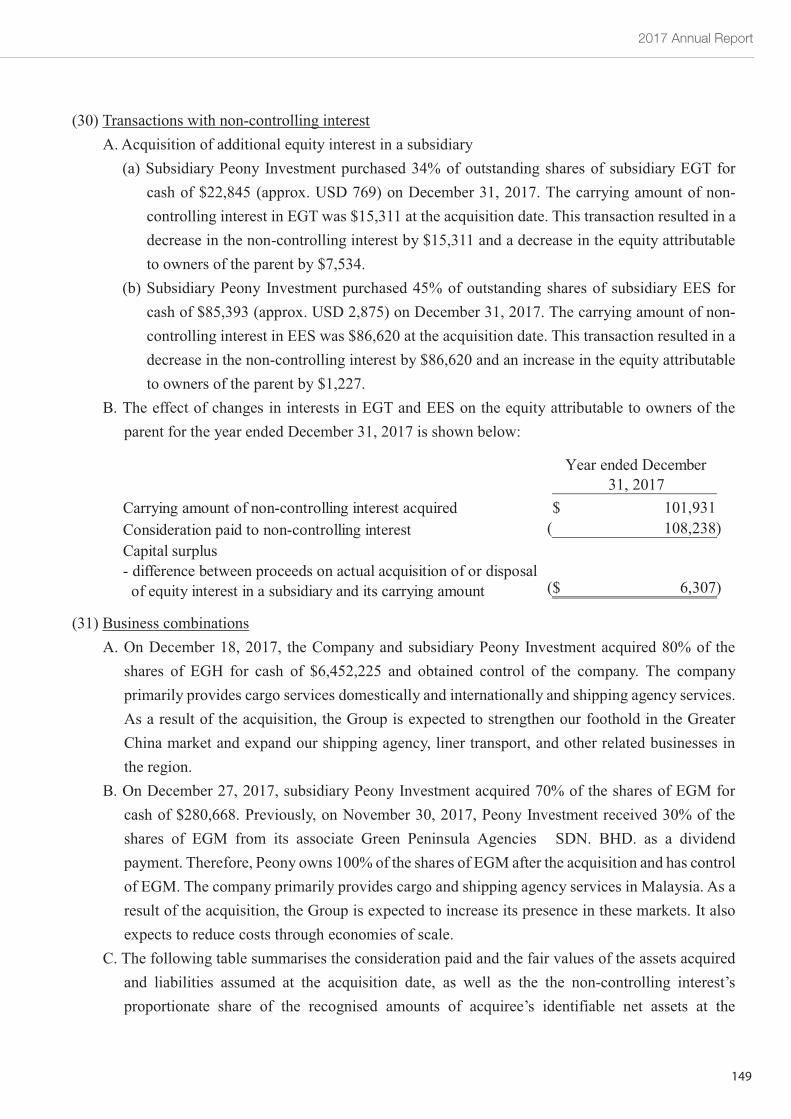
2017 Annual Report
149
~74~
(30) Transactions with non-controlling interestA. Acquisition of additional equity interest in a subsidiary
(a) Subsidiary Peony Investment purchased 34% of outstanding shares of subsidiary EGT forcash of $22,845 (approx. USD 769) on December 31, 2017. The carrying amount of non-controlling interest in EGT was $15,311 at the acquisition date. This transaction resulted in adecrease in the non-controlling interest by $15,311 and a decrease in the equity attributableto owners of the parent by $7,534.
(b) Subsidiary Peony Investment purchased 45% of outstanding shares of subsidiary EES forcash of $85,393 (approx. USD 2,875) on December 31, 2017. The carrying amount of non-controlling interest in EES was $86,620 at the acquisition date. This transaction resulted in adecrease in the non-controlling interest by $86,620 and an increase in the equity attributableto owners of the parent by $1,227.
B. The effect of changes in interests in EGT and EES on the equity attributable to owners of theparent for the year ended December 31, 2017 is shown below:
(31) Business combinationsA. On December 18, 2017, the Company and subsidiary Peony Investment acquired 80% of the
shares of EGH for cash of $6,452,225 and obtained control of the company. The companyprimarily provides cargo services domestically and internationally and shipping agency services.As a result of the acquisition, the Group is expected to strengthen our foothold in the GreaterChina market and expand our shipping agency, liner transport, and other related businesses inthe region.
B. On December 27, 2017, subsidiary Peony Investment acquired 70% of the shares of EGM forcash of $280,668. Previously, on November 30, 2017, Peony Investment received 30% of theshares of EGM from its associate Green Peninsula Agencies SDN. BHD. as a dividendpayment. Therefore, Peony owns 100% of the shares of EGM after the acquisition and has controlof EGM. The company primarily provides cargo and shipping agency services in Malaysia. As aresult of the acquisition, the Group is expected to increase its presence in these markets. It alsoexpects to reduce costs through economies of scale.
C. The following table summarises the consideration paid and the fair values of the assets acquiredand liabilities assumed at the acquisition date, as well as the the non-controlling interest’sproportionate share of the recognised amounts of acquiree’s identifiable net assets at the
Year ended December31, 2017
Carrying amount of non-controlling interest acquired 101,931$Consideration paid to non-controlling interest 108,238)(Capital surplus- difference between proceeds on actual acquisition of or disposal
of equity interest in a subsidiary and its carrying amount 6,307)($
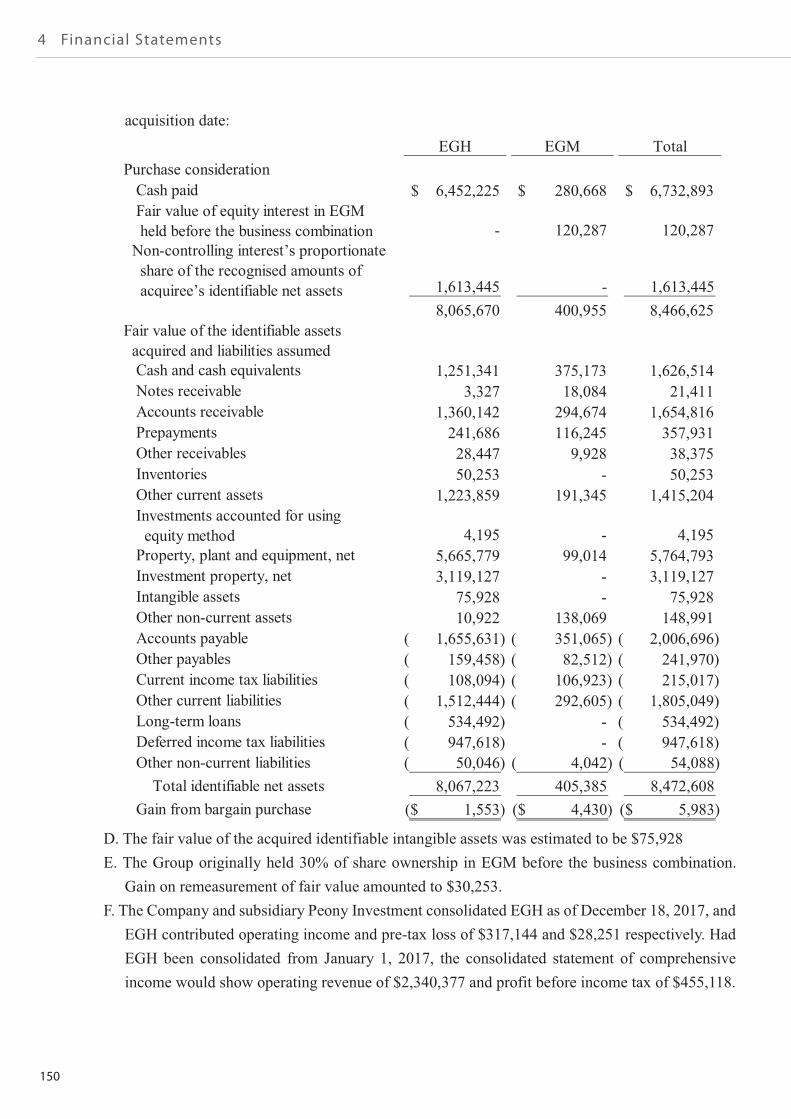
150
4 Financial Statements
~75~
acquisition date:
D. The fair value of the acquired identifiable intangible assets was estimated to be $75,928E. The Group originally held 30% of share ownership in EGM before the business combination.
Gain on remeasurement of fair value amounted to $30,253.F. The Company and subsidiary Peony Investment consolidated EGH as of December 18, 2017, and
EGH contributed operating income and pre-tax loss of $317,144 and $28,251 respectively. HadEGH been consolidated from January 1, 2017, the consolidated statement of comprehensiveincome would show operating revenue of $2,340,377 and profit before income tax of $455,118.
EGH EGM TotalPurchase consideration
Cash paid 6,452,225$ 280,668$ 6,732,893$Fair value of equity interest in EGMheld before the business combination - 120,287 120,287
Non-controlling interest’s proportionateshare of the recognised amounts ofacquiree’s identifiable net assets 1,613,445 - 1,613,445
8,065,670 400,955 8,466,625Fair value of the identifiable assets
acquired and liabilities assumedCash and cash equivalents 1,251,341 375,173 1,626,514Notes receivable 3,327 18,084 21,411Accounts receivable 1,360,142 294,674 1,654,816Prepayments 241,686 116,245 357,931Other receivables 28,447 9,928 38,375Inventories 50,253 - 50,253Other current assets 1,223,859 191,345 1,415,204Investments accounted for using
equity method 4,195 - 4,195Property, plant and equipment, net 5,665,779 99,014 5,764,793Investment property, net 3,119,127 - 3,119,127Intangible assets 75,928 - 75,928Other non-current assets 10,922 138,069 148,991Accounts payable 1,655,631)( 351,065)( 2,006,696)(Other payables 159,458)( 82,512)( 241,970)(Current income tax liabilities 108,094)( 106,923)( 215,017)(Other current liabilities 1,512,444)( 292,605)( 1,805,049)(Long-term loans 534,492)( - 534,492)(Deferred income tax liabilities 947,618)( - 947,618)(Other non-current liabilities 50,046)( 4,042)( 54,088)(
Total identifiable net assets 8,067,223 405,385 8,472,608Gain from bargain purchase 1,553)($ 4,430)($ 5,983)($
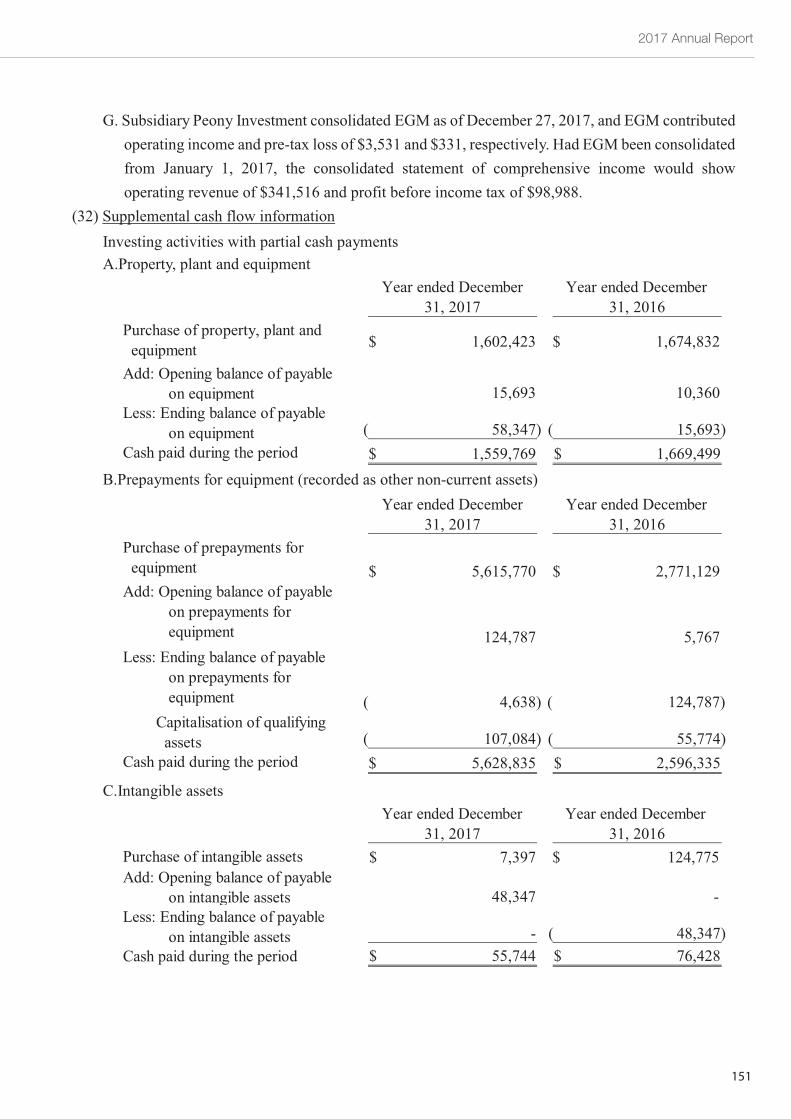
2017 Annual Report
151
~76~
G. Subsidiary Peony Investment consolidated EGM as of December 27, 2017, and EGM contributedoperating income and pre-tax loss of $3,531 and $331, respectively. Had EGM been consolidatedfrom January 1, 2017, the consolidated statement of comprehensive income would showoperating revenue of $341,516 and profit before income tax of $98,988.
(32) Supplemental cash flow informationInvesting activities with partial cash paymentsA.Property, plant and equipment
B.Prepayments for equipment (recorded as other non-current assets)
C.Intangible assets
Year ended December Year ended December31, 2017 31, 2016
Purchase of property, plant andequipment 1,602,423$ 1,674,832$
Add: Opening balance of payableon equipment 15,693 10,360
Less: Ending balance of payableon equipment 58,347)( 15,693)(
Cash paid during the period 1,559,769$ 1,669,499$
Year ended December Year ended December31, 2017 31, 2016
Purchase of prepayments forequipment 5,615,770$ 2,771,129$
Add: Opening balance of payableon prepayments forequipment 124,787 5,767
Less: Ending balance of payableon prepayments forequipment 4,638)( 124,787)(
Capitalisation of qualifyingassets 107,084)( 55,774)(
Cash paid during the period 5,628,835$ 2,596,335$
Year ended December Year ended December31, 2017 31, 2016
Purchase of intangible assets 7,397$ 124,775$Add: Opening balance of payable
on intangible assets 48,347 -Less: Ending balance of payable
on intangible assets - 48,347)(Cash paid during the period 55,744$ 76,428$
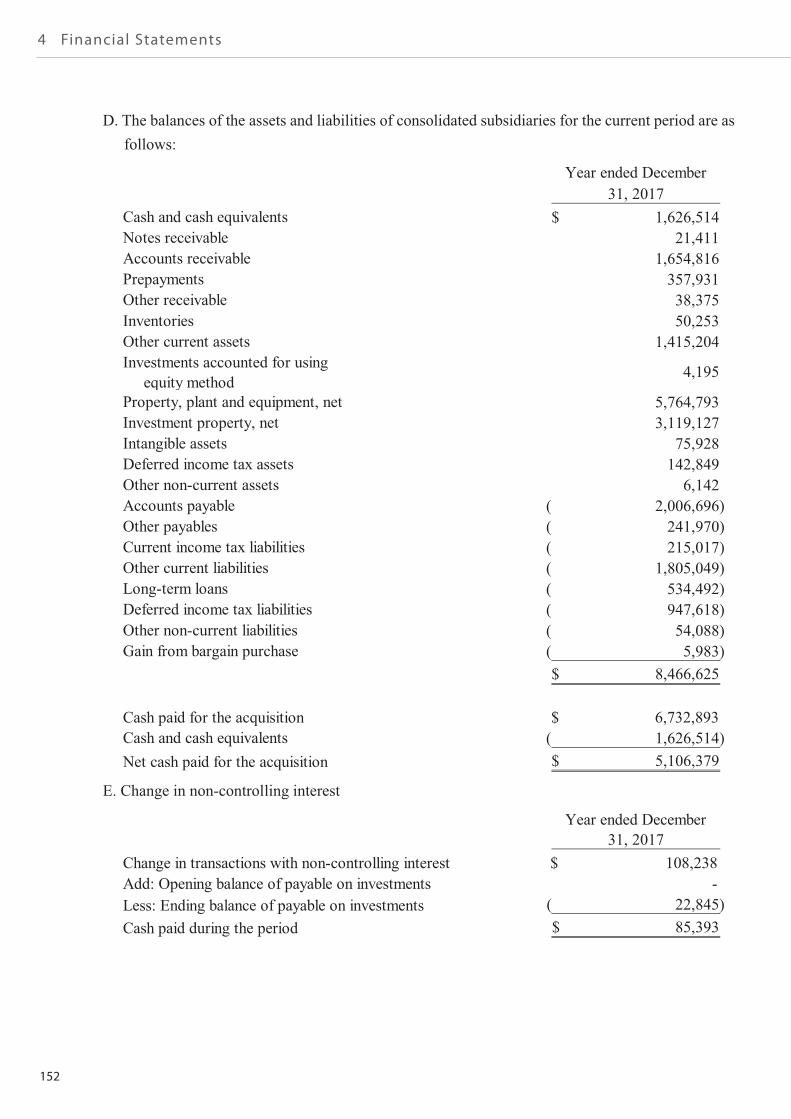
152
4 Financial Statements
~77~
D. The balances of the assets and liabilities of consolidated subsidiaries for the current period are asfollows:
E. Change in non-controlling interest
Year ended December31, 2017
Cash and cash equivalents 1,626,514$Notes receivable 21,411Accounts receivable 1,654,816Prepayments 357,931Other receivable 38,375Inventories 50,253Other current assets 1,415,204Investments accounted for using
equity method4,195
Property, plant and equipment, net 5,764,793Investment property, net 3,119,127Intangible assets 75,928Deferred income tax assets 142,849Other non-current assets 6,142Accounts payable 2,006,696)(Other payables 241,970)(Current income tax liabilities 215,017)(Other current liabilities 1,805,049)(Long-term loans 534,492)(Deferred income tax liabilities 947,618)(Other non-current liabilities 54,088)(Gain from bargain purchase 5,983)(
8,466,625$
Cash paid for the acquisition 6,732,893$Cash and cash equivalents 1,626,514)(Net cash paid for the acquisition 5,106,379$
Year ended December31, 2017
Change in transactions with non-controlling interest 108,238$Add: Opening balance of payable on investments -Less: Ending balance of payable on investments 22,845)(Cash paid during the period 85,393$
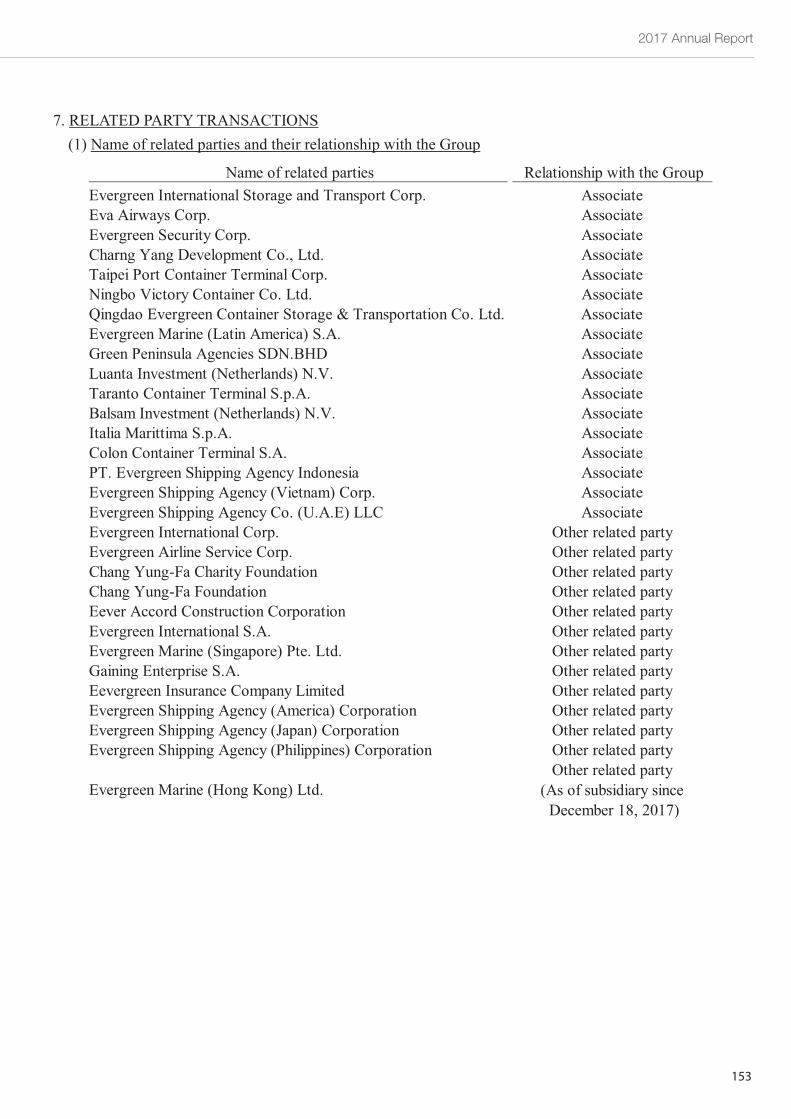
2017 Annual Report
153
~78~
7. RELATED PARTY TRANSACTIONS(1) Name of related parties and their relationship with the Group
Name of related parties Relationship with the GroupEvergreen International Storage and Transport Corp. AssociateEva Airways Corp. AssociateEvergreen Security Corp. AssociateCharng Yang Development Co., Ltd. AssociateTaipei Port Container Terminal Corp. AssociateNingbo Victory Container Co. Ltd. AssociateQingdao Evergreen Container Storage & Transportation Co. Ltd. AssociateEvergreen Marine (Latin America) S.A. AssociateGreen Peninsula Agencies SDN.BHD AssociateLuanta Investment (Netherlands) N.V. AssociateTaranto Container Terminal S.p.A. AssociateBalsam Investment (Netherlands) N.V. AssociateItalia Marittima S.p.A. AssociateColon Container Terminal S.A. AssociatePT. Evergreen Shipping Agency Indonesia AssociateEvergreen Shipping Agency (Vietnam) Corp. AssociateEvergreen Shipping Agency Co. (U.A.E) LLC AssociateEvergreen International Corp. Other related partyEvergreen Airline Service Corp. Other related partyChang Yung-Fa Charity Foundation Other related partyChang Yung-Fa Foundation Other related partyEever Accord Construction Corporation Other related partyEvergreen International S.A. Other related partyEvergreen Marine (Singapore) Pte. Ltd. Other related partyGaining Enterprise S.A. Other related partyEevergreen Insurance Company Limited Other related partyEvergreen Shipping Agency (America) Corporation Other related partyEvergreen Shipping Agency (Japan) Corporation Other related partyEvergreen Shipping Agency (Philippines) Corporation Other related party
Evergreen Marine (Hong Kong) Ltd.Other related party
(As of subsidiary sinceDecember 18, 2017)
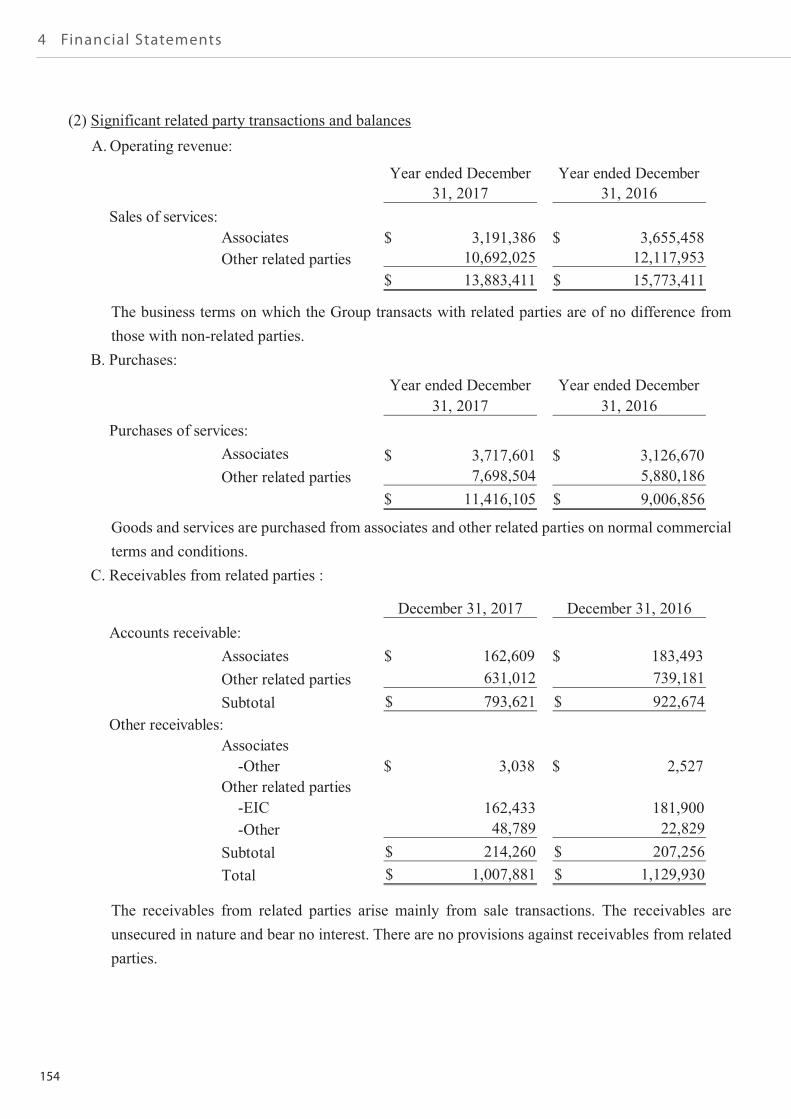
154
4 Financial Statements
~79~
(2) Significant related party transactions and balancesA.Operating revenue:
The business terms on which the Group transacts with related parties are of no difference fromthose with non-related parties.
B.Purchases:
Goods and services are purchased from associates and other related parties on normal commercialterms and conditions.
C.Receivables from related parties :
The receivables from related parties arise mainly from sale transactions. The receivables areunsecured in nature and bear no interest. There are no provisions against receivables from relatedparties.
Year ended December Year ended December31, 2017 31, 2016
Sales of services:Associates 3,191,386$ 3,655,458$Other related parties 10,692,025 12,117,953
13,883,411$ 15,773,411$
Year ended December Year ended December31, 2017 31, 2016
Purchases of services:Associates 3,717,601$ 3,126,670$Other related parties 7,698,504 5,880,186
11,416,105$ 9,006,856$
. December 31, 2017 December 31, 2016Accounts receivable:
Associates 162,609$ 183,493$Other related parties 631,012 739,181Subtotal 793,621$ 922,674$
Other receivables:Associates
-Other 3,038$ 2,527$Other related parties
-EIC 162,433 181,900-Other 48,789 22,829
Subtotal 214,260$ 207,256$Total 1,007,881$ 1,129,930$
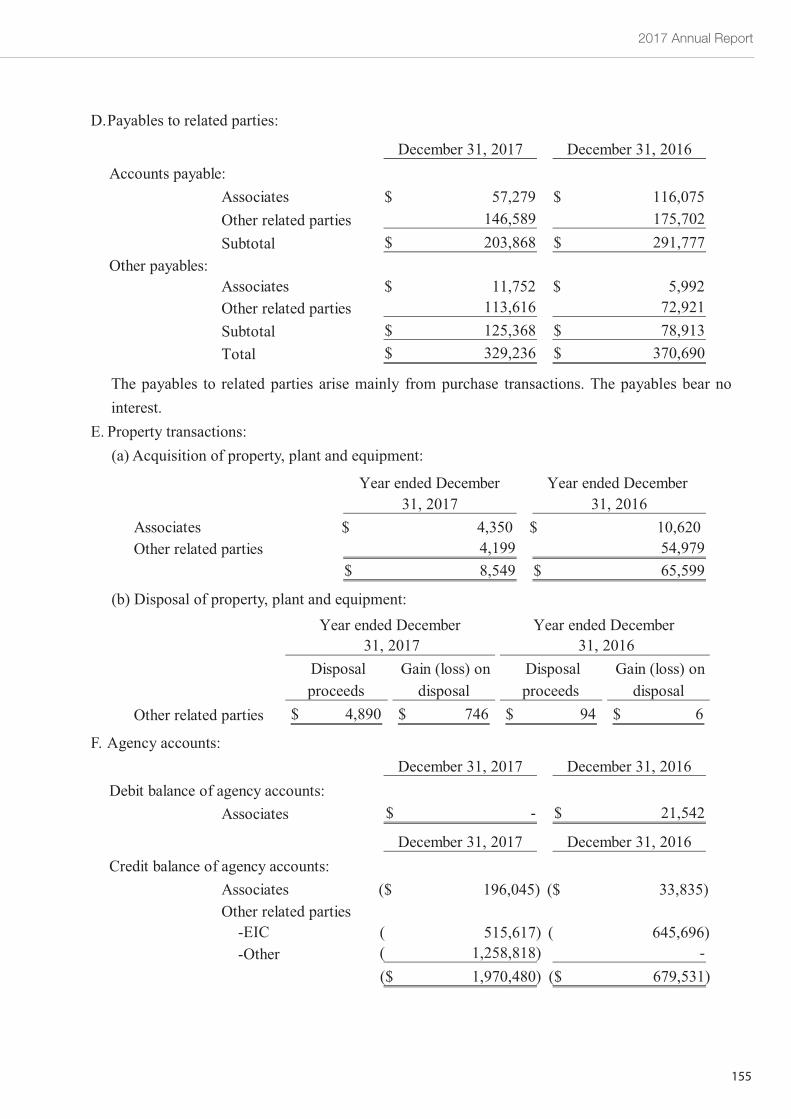
2017 Annual Report
155
~80~
D.Payables to related parties:
The payables to related parties arise mainly from purchase transactions. The payables bear nointerest.
E.Property transactions:(a) Acquisition of property, plant and equipment:
(b) Disposal of property, plant and equipment:
F.Agency accounts:
. December 31, 2017 December 31, 2016Accounts payable:
Associates 57,279$ 116,075$Other related parties 146,589 175,702Subtotal 203,868$ 291,777$
Other payables:Associates 11,752$ 5,992$Other related parties 113,616 72,921Subtotal 125,368$ 78,913$Total 329,236$ 370,690$
Year ended December Year ended December31, 2017 31, 2016
Associates 4,350$ 10,620$Other related parties 4,199 54,979
8,549$ 65,599$
Disposalproceeds
Gain (loss) ondisposal
Disposalproceeds
Gain (loss) ondisposal
Other related parties 4,890$ 746$ 94$ 6$
31, 2017 31, 2016Year ended December Year ended December
. December 31, 2017 December 31, 2016Debit balance of agency accounts:
Associates -$ 21,542$
. December 31, 2017 December 31, 2016Credit balance of agency accounts:
Associates 196,045)($ 33,835)($Other related parties
-EIC 515,617)( 645,696)(-Other 1,258,818)( -
1,970,480)($ 679,531)($
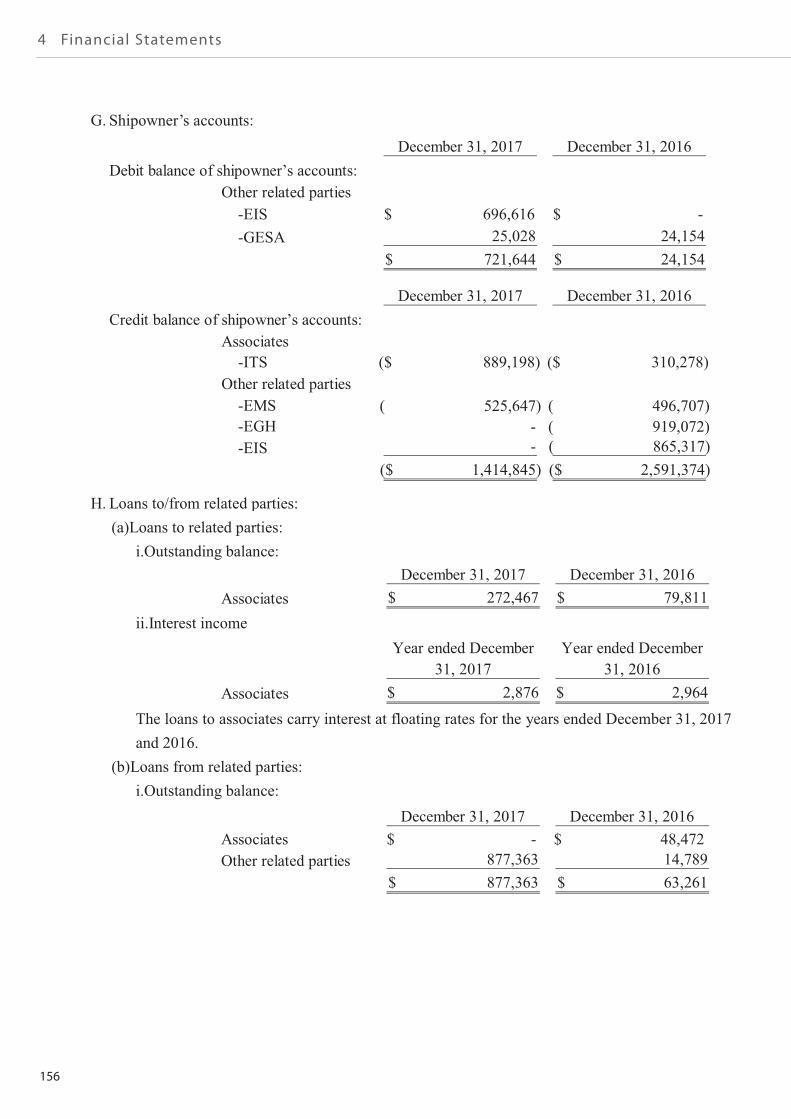
156
4 Financial Statements
~81~
G.Shipowner’s accounts:
H.Loans to/from related parties:(a)Loans to related parties:
i.Outstanding balance:
ii.Interest income
The loans to associates carry interest at floating rates for the years ended December 31, 2017and 2016.
(b)Loans from related parties:i.Outstanding balance:
. December 31, 2017 December 31, 2016Debit balance of shipowner’s accounts:
Other related parties-EIS 696,616$ -$-GESA 25,028 24,154
721,644$ 24,154$
. December 31, 2017 December 31, 2016Credit balance of shipowner’s accounts:
Associates-ITS 889,198)($ 310,278)($
Other related parties-EMS 525,647)( 496,707)(-EGH - 919,072)(-EIS - 865,317)(
1,414,845)($ 2,591,374)($
. December 31, 2017 December 31, 2016Associates 272,467$ 79,811$
Year ended December Year ended December31, 2017 31, 2016
Associates 2,876$ 2,964$
. December 31, 2017 December 31, 2016Associates -$ 48,472$Other related parties 877,363 14,789
877,363$ 63,261$
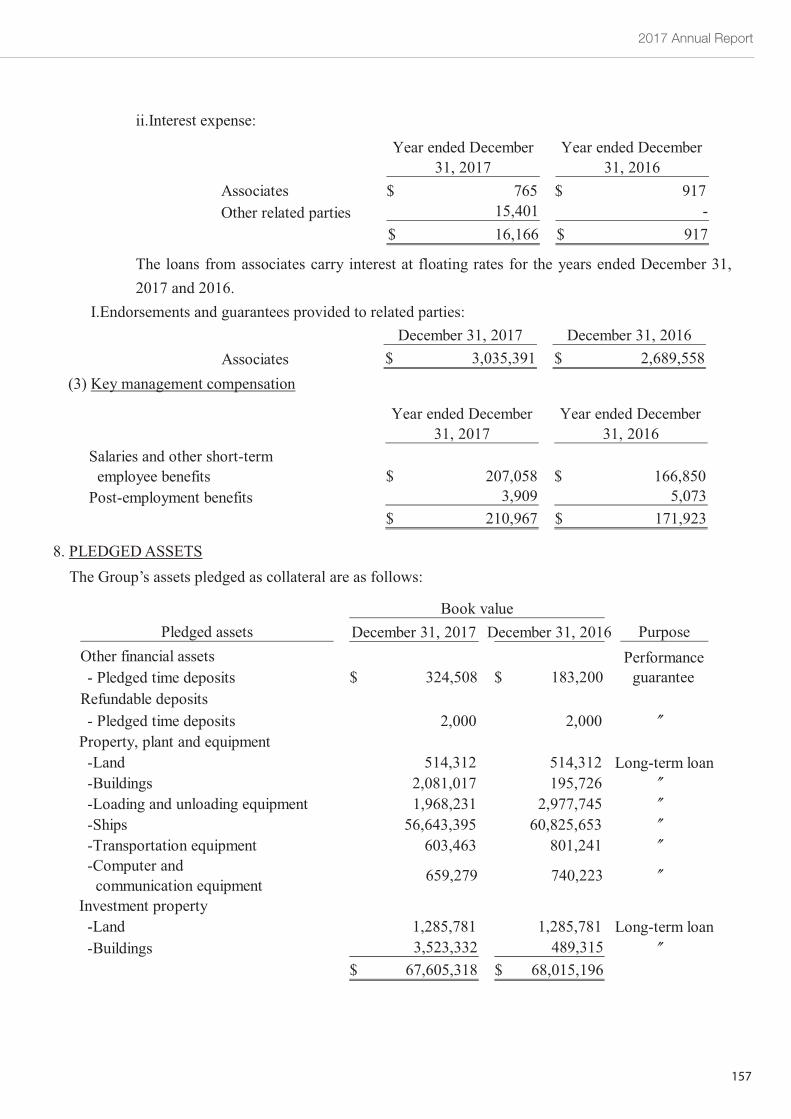
2017 Annual Report
157
~82~
ii.Interest expense:
The loans from associates carry interest at floating rates for the years ended December 31,2017 and 2016.
I.Endorsements and guarantees provided to related parties:
(3) Key management compensation
8. PLEDGED ASSETSThe Group’s assets pledged as collateral are as follows:
Year ended December Year ended December31, 2017 31, 2016
Associates 765$ 917$Other related parties 15,401 -
16,166$ 917$
. December 31, 2017 December 31, 2016Associates 3,035,391$ 2,689,558$
Year ended December Year ended December31, 2017 31, 2016
Salaries and other short-termemployee benefits 207,058$ 166,850$
Post-employment benefits 3,909 5,073210,967$ 171,923$
Pledged assets December 31, 2017 December 31, 2016 PurposeOther financial assets Performance- Pledged time deposits 324,508$ 183,200$ guarantee
Refundable deposits- Pledged time deposits 2,000 2,000
Property, plant and equipment-Land 514,312 514,312 Long-term loan-Buildings 2,081,017 195,726-Loading and unloading equipment 1,968,231 2,977,745-Ships 56,643,395 60,825,653-Transportation equipment 603,463 801,241-Computer and
communication equipment 659,279 740,223
Investment property-Land 1,285,781 1,285,781 Long-term loan-Buildings 3,523,332 489,315
67,605,318$ 68,015,196$
Book value
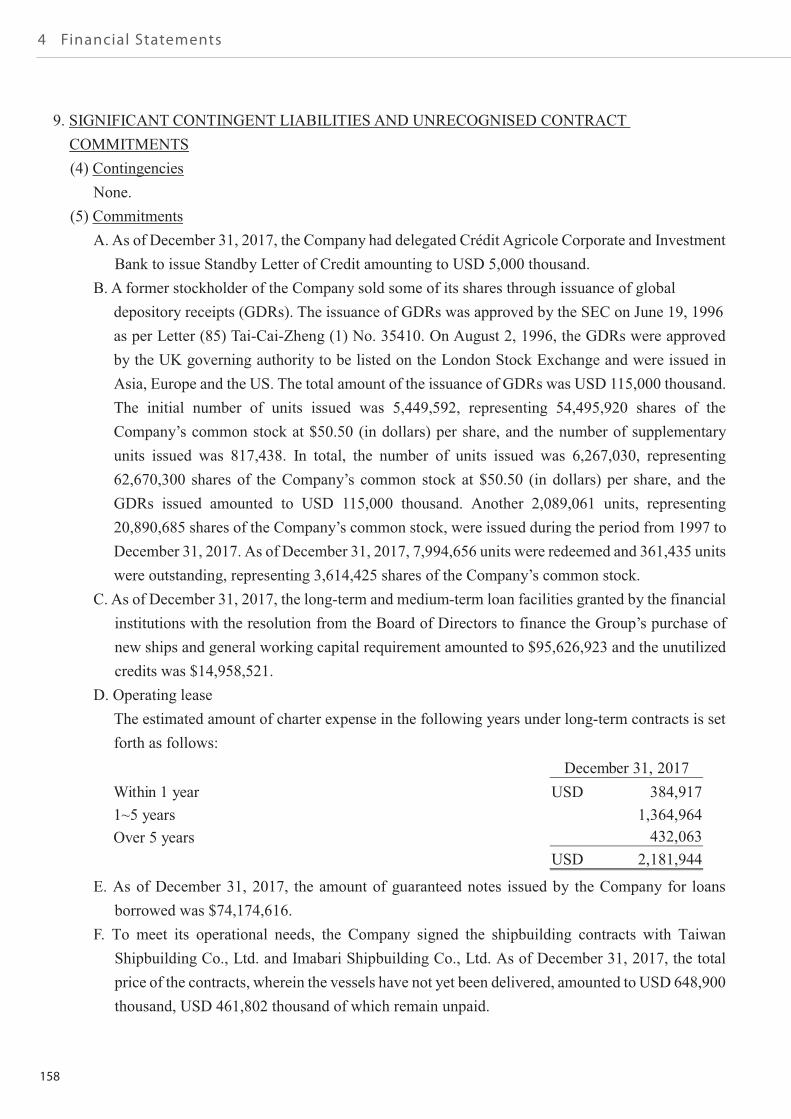
158
4 Financial Statements
~83~
9. SIGNIFICANT CONTINGENT LIABILITIES AND UNRECOGNISED CONTRACTCOMMITMENTS(4) Contingencies
None.(5) Commitments
A. As of December 31, 2017, the Company had delegated Crédit Agricole Corporate and InvestmentBank to issue Standby Letter of Credit amounting to USD 5,000 thousand.
B. A former stockholder of the Company sold some of its shares through issuance of globaldepository receipts (GDRs). The issuance of GDRs was approved by the SEC on June 19, 1996as per Letter (85) Tai-Cai-Zheng (1) No. 35410. On August 2, 1996, the GDRs were approvedby the UK governing authority to be listed on the London Stock Exchange and were issued inAsia, Europe and the US. The total amount of the issuance of GDRs was USD 115,000 thousand.The initial number of units issued was 5,449,592, representing 54,495,920 shares of theCompany’s common stock at $50.50 (in dollars) per share, and the number of supplementaryunits issued was 817,438. In total, the number of units issued was 6,267,030, representing62,670,300 shares of the Company’s common stock at $50.50 (in dollars) per share, and theGDRs issued amounted to USD 115,000 thousand. Another 2,089,061 units, representing20,890,685 shares of the Company’s common stock, were issued during the period from 1997 toDecember 31, 2017. As of December 31, 2017, 7,994,656 units were redeemed and 361,435 unitswere outstanding, representing 3,614,425 shares of the Company’s common stock.
C. As of December 31, 2017, the long-term and medium-term loan facilities granted by the financialinstitutions with the resolution from the Board of Directors to finance the Group’s purchase ofnew ships and general working capital requirement amounted to $95,626,923 and the unutilizedcredits was $14,958,521.
D. Operating leaseThe estimated amount of charter expense in the following years under long-term contracts is setforth as follows:
E. As of December 31, 2017, the amount of guaranteed notes issued by the Company for loansborrowed was $74,174,616.
F. To meet its operational needs, the Company signed the shipbuilding contracts with TaiwanShipbuilding Co., Ltd. and Imabari Shipbuilding Co., Ltd. As of December 31, 2017, the totalprice of the contracts, wherein the vessels have not yet been delivered, amounted to USD 648,900thousand, USD 461,802 thousand of which remain unpaid.
December 31, 2017Within 1 year 384,917USD1~5 years 1,364,964Over 5 years 432,063
2,181,944USD
2017 Annual Report
159
~84~
10. SIGNIFICANT DISASTER LOSSNone.
11. SIGNIFICANT EVENTS AFTER THE BALANCE SHEET DATEA. Under the amendments to the Income Tax Act which was promulgated by the President of the
Republic of China in February, 2018, the Company’s applicable income tax rate will be raised from17% to 20% effective from January 1, 2018. This will increase the Company’s deferred tax assetsand deferred tax liabilities by $88,349 and $129,570, respectively, which will be adjusted in the firstquarter of 2018.
B. For details of appropriation of earnings as proposed by the Board of Directors on March 23, 2018,please refer to Note 6(19).
C. On February 8, 2018, the consolidated Company signed a shipbuilding contract with SamsungHeavy Industries Co., Ltd., which is valued at USD 755,040 for operational purposes. At the timeof the issuance of these financial statements, no payments have been made yet.
D. For operational purposes, the Board of Directors resolved on March 23, 2018 to purchase shippingequipment (including dry containers, reefer containers and freezing equipment) from ChinaInternational Marine Containers (Group) Co., Ltd. and Carrier Transicold Pte. Ltd. for USD 144,148and USD 18,900, respectively.
E. In response to international regulations on sulfur content in shipping fuel, the Board of Directorsresolved on March 23, 2018 to purchase sulfur emission abatement equipment from WartsilaFinland Oy and Alfa Laval Nijmegen B.V. for USD 54,500 and EUR 19,362, respectively.
12. OTHERS(1) Capital management
The Group’s objectives when managing capital are to safeguard the Group’s ability to continue as agoing concern in order to provide returns for shareholders and to maintain an optimal capital structureto reduce the cost of capital. In order to maintain or adjust the capital structure, the Group may adjustthe amount of dividends paid to shareholders, return capital to shareholders and issue new shares tomaintain an optimal capital.
(2) Financial instrumentsA. Fair value information of financial instruments
(a) Except for those listed in the table below, the book value of cash and cash equivalents andfinancial instruments measured at amortised cost (including notes receivable, accountsreceivable, other receivables, other financial assets, refundable deposits, guarantee depositsreceived, held-to-maturity financial assets, short-term borrowings, accounts payable and otherpayables) are approximate to their fair values. The fair value information of financialinstruments measured at fair value is provided in Note 12(3).
Except for those listed in the table below, the book value of cash and cash equivalents and
financial instruments measured at amortised cost (including notes receivable, accounts
receivable, other receivables, other financial assets, refundable deposits, guarantee deposits
received, held-to-maturity financial assets, short-term borrowings, accounts payable and
other payables) are approximate to their fair values. The fair value information of financial
instruments measured at fair value is provided in Note 12(3).
The Group’s objectives when managing capital are to safeguard the Group’s ability to continue
as a going concern in order to provide returns for shareholders and tomaintain an optimal capital
structure to reduce the cost of capital. In order to maintain or adjust the capital structure, the Group
may adjust the amount of dividends paid to shareholders, return capital to shareholders and issue
new shares to maintain an optimal capital.
~84~
10. SIGNIFICANT DISASTER LOSSNone.
11. SIGNIFICANT EVENTS AFTER THE BALANCE SHEET DATEA. Under the amendments to the Income Tax Act which was promulgated by the President of the
Republic of China in February, 2018, the Company’s applicable income tax rate will be raised from17% to 20% effective from January 1, 2018. This will increase the Company’s deferred tax assetsand deferred tax liabilities by $88,349 and $129,570, respectively, which will be adjusted in the firstquarter of 2018.
B. For details of appropriation of earnings as proposed by the Board of Directors on March 23, 2018,please refer to Note 6(19).
C. On February 8, 2018, the consolidated Company signed a shipbuilding contract with SamsungHeavy Industries Co., Ltd., which is valued at USD 755,040 for operational purposes. At the timeof the issuance of these financial statements, no payments have been made yet.
D. For operational purposes, the Board of Directors resolved on March 23, 2018 to purchase shippingequipment (including dry containers, reefer containers and freezing equipment) from ChinaInternational Marine Containers (Group) Co., Ltd. and Carrier Transicold Pte. Ltd. for USD 144,148and USD 18,900, respectively.
E. In response to international regulations on sulfur content in shipping fuel, the Board of Directorsresolved on March 23, 2018 to purchase sulfur emission abatement equipment from WartsilaFinland Oy and Alfa Laval Nijmegen B.V. for USD 54,500 and EUR 19,362, respectively.
12. OTHERS(1) Capital management
The Group’s objectives when managing capital are to safeguard the Group’s ability to continue as agoing concern in order to provide returns for shareholders and to maintain an optimal capital structureto reduce the cost of capital. In order to maintain or adjust the capital structure, the Group may adjustthe amount of dividends paid to shareholders, return capital to shareholders and issue new shares tomaintain an optimal capital.
(2) Financial instrumentsA. Fair value information of financial instruments
(a) Except for those listed in the table below, the book value of cash and cash equivalents andfinancial instruments measured at amortised cost (including notes receivable, accountsreceivable, other receivables, other financial assets, refundable deposits, guarantee depositsreceived, held-to-maturity financial assets, short-term borrowings, accounts payable and otherpayables) are approximate to their fair values. The fair value information of financialinstruments measured at fair value is provided in Note 12(3).
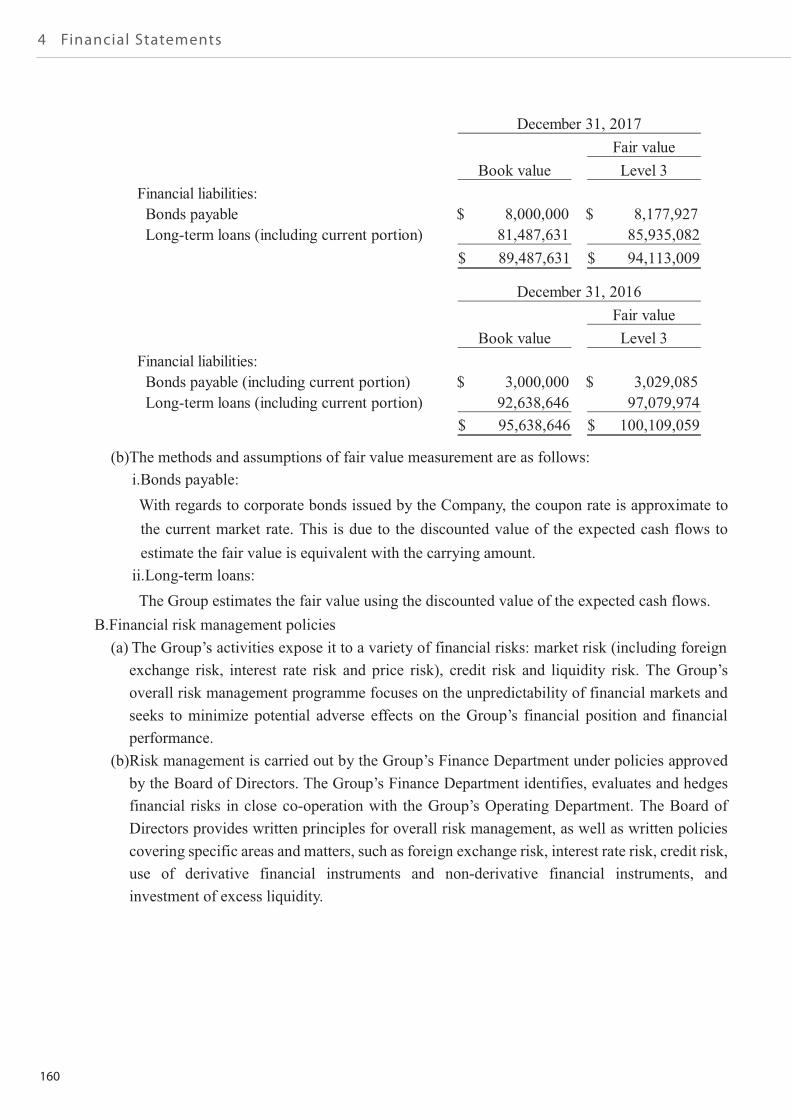
160
4 Financial Statements
~85~
(b)The methods and assumptions of fair value measurement are as follows:i.Bonds payable:With regards to corporate bonds issued by the Company, the coupon rate is approximate tothe current market rate. This is due to the discounted value of the expected cash flows toestimate the fair value is equivalent with the carrying amount.
ii.Long-term loans:The Group estimates the fair value using the discounted value of the expected cash flows.
B.Financial risk management policies(a) The Group’s activities expose it to a variety of financial risks: market risk (including foreign
exchange risk, interest rate risk and price risk), credit risk and liquidity risk. The Group’soverall risk management programme focuses on the unpredictability of financial markets andseeks to minimize potential adverse effects on the Group’s financial position and financialperformance.
(b)Risk management is carried out by the Group’s Finance Department under policies approvedby the Board of Directors. The Group’s Finance Department identifies, evaluates and hedgesfinancial risks in close co-operation with the Group’s Operating Department. The Board ofDirectors provides written principles for overall risk management, as well as written policiescovering specific areas and matters, such as foreign exchange risk, interest rate risk, credit risk,use of derivative financial instruments and non-derivative financial instruments, andinvestment of excess liquidity.
Fair valueBook value Level 3
Financial liabilities:Bonds payable 8,000,000$ 8,177,927$Long-term loans (including current portion) 81,487,631 85,935,082
89,487,631$ 94,113,009$
December 31, 2017
Fair valueBook value Level 3
Financial liabilities:Bonds payable (including current portion) 3,000,000$ 3,029,085$Long-term loans (including current portion) 92,638,646 97,079,974
95,638,646$ 100,109,059$
December 31, 2016
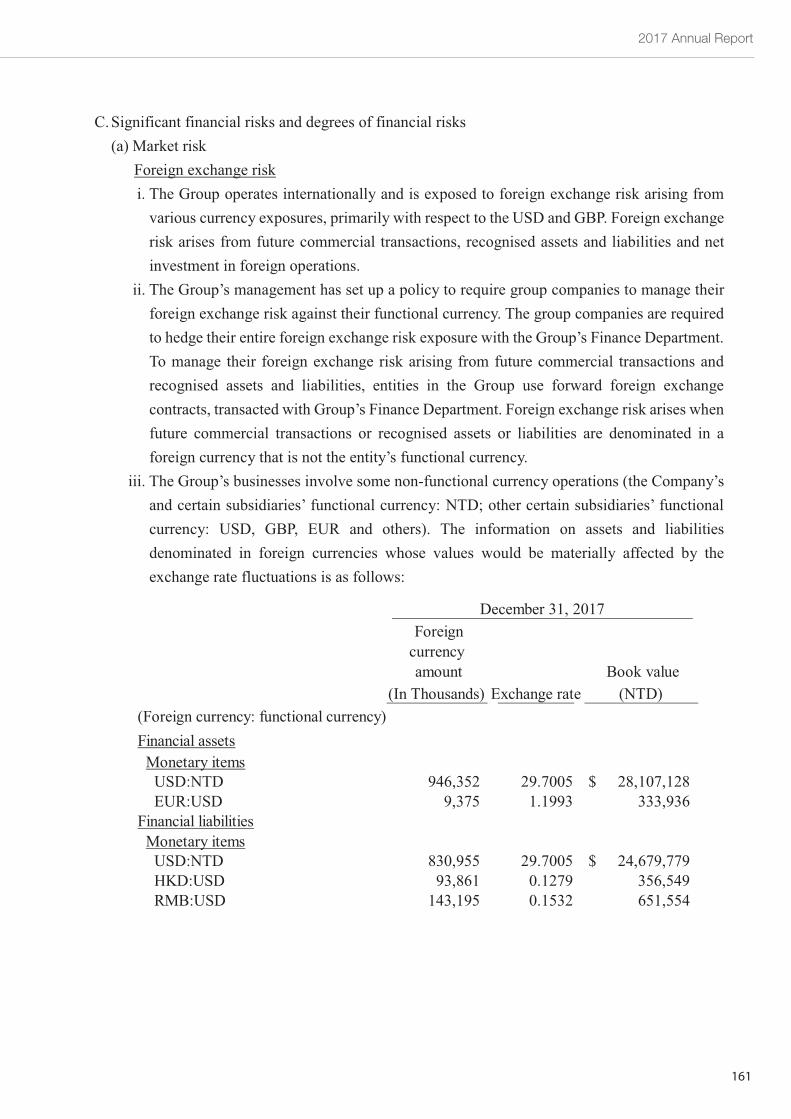
2017 Annual Report
161
~86~
C.Significant financial risks and degrees of financial risks(a)Market risk
Foreign exchange riski. The Group operates internationally and is exposed to foreign exchange risk arising from
various currency exposures, primarily with respect to the USD and GBP. Foreign exchangerisk arises from future commercial transactions, recognised assets and liabilities and netinvestment in foreign operations.
ii. The Group’s management has set up a policy to require group companies to manage theirforeign exchange risk against their functional currency. The group companies are requiredto hedge their entire foreign exchange risk exposure with the Group’s Finance Department.To manage their foreign exchange risk arising from future commercial transactions andrecognised assets and liabilities, entities in the Group use forward foreign exchangecontracts, transacted with Group’s Finance Department. Foreign exchange risk arises whenfuture commercial transactions or recognised assets or liabilities are denominated in aforeign currency that is not the entity’s functional currency.
iii. The Group’s businesses involve some non-functional currency operations (the Company’sand certain subsidiaries’ functional currency: NTD; other certain subsidiaries’ functionalcurrency: USD, GBP, EUR and others). The information on assets and liabilitiesdenominated in foreign currencies whose values would be materially affected by theexchange rate fluctuations is as follows:
Foreigncurrencyamount
(In Thousands) Exchange rateBook value
(NTD)
Financial assetsMonetary items
USD:NTD 946,352 29.7005 28,107,128$EUR:USD 9,375 1.1993 333,936
Financial liabilitiesMonetary items
USD:NTD 830,955 29.7005 24,679,779$HKD:USD 93,861 0.1279 356,549RMB:USD 143,195 0.1532 651,554
December 31, 2017
(Foreign currency: functional currency)
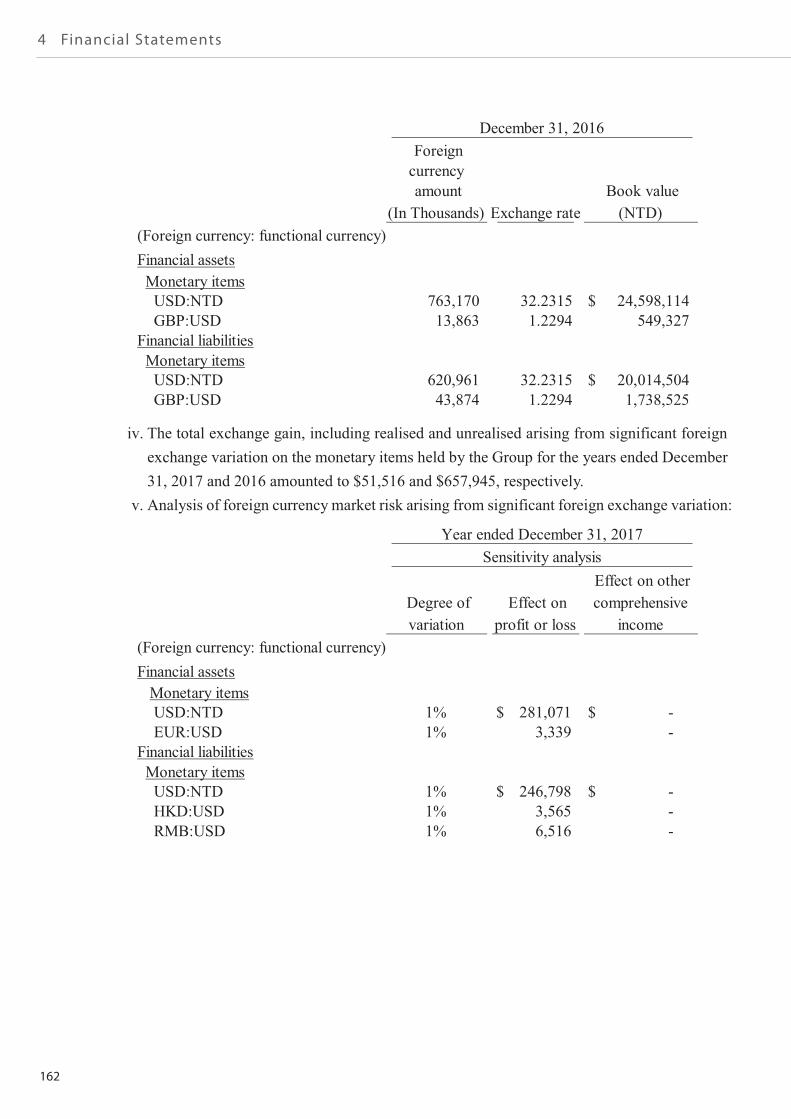
162
4 Financial Statements
~87~
iv. The total exchange gain, including realised and unrealised arising from significant foreignexchange variation on the monetary items held by the Group for the years ended December31, 2017 and 2016 amounted to $51,516 and $657,945, respectively.
v. Analysis of foreign currency market risk arising from significant foreign exchange variation:
Foreigncurrencyamount
(In Thousands) Exchange rateBook value
(NTD)
Financial assetsMonetary items
USD:NTD 763,170 32.2315 24,598,114$GBP:USD 13,863 1.2294 549,327
Financial liabilitiesMonetary items
USD:NTD 620,961 32.2315 20,014,504$GBP:USD 43,874 1.2294 1,738,525
December 31, 2016
(Foreign currency: functional currency)
Degree ofvariation
Effect onprofit or loss
Effect on othercomprehensive
income
Financial assetsMonetary itemsUSD:NTD 1% 281,071$ -$EUR:USD 1% 3,339 -
Financial liabilitiesMonetary items
USD:NTD 1% 246,798$ -$HKD:USD 1% 3,565 -RMB:USD 1% 6,516 -
Year ended December 31, 2017Sensitivity analysis
(Foreign currency: functional currency)
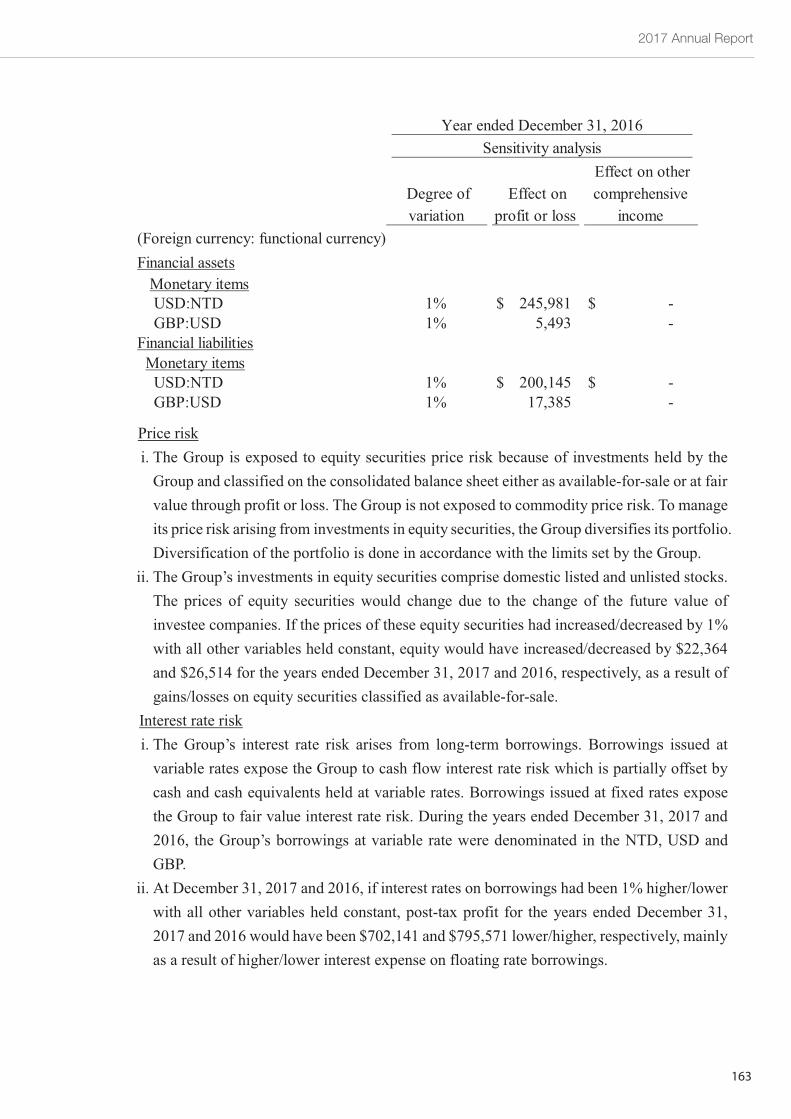
2017 Annual Report
163
~88~
Price riski. The Group is exposed to equity securities price risk because of investments held by the
Group and classified on the consolidated balance sheet either as available-for-sale or at fairvalue through profit or loss. The Group is not exposed to commodity price risk. To manageits price risk arising from investments in equity securities, the Group diversifies its portfolio.Diversification of the portfolio is done in accordance with the limits set by the Group.
ii. The Group’s investments in equity securities comprise domestic listed and unlisted stocks.The prices of equity securities would change due to the change of the future value ofinvestee companies. If the prices of these equity securities had increased/decreased by 1%with all other variables held constant, equity would have increased/decreased by $22,364and $26,514 for the years ended December 31, 2017 and 2016, respectively, as a result ofgains/losses on equity securities classified as available-for-sale.
Interest rate riski. The Group’s interest rate risk arises from long-term borrowings. Borrowings issued at
variable rates expose the Group to cash flow interest rate risk which is partially offset bycash and cash equivalents held at variable rates. Borrowings issued at fixed rates exposethe Group to fair value interest rate risk. During the years ended December 31, 2017 and2016, the Group’s borrowings at variable rate were denominated in the NTD, USD andGBP.
ii. At December 31, 2017 and 2016, if interest rates on borrowings had been 1% higher/lowerwith all other variables held constant, post-tax profit for the years ended December 31,2017 and 2016 would have been $702,141 and $795,571 lower/higher, respectively, mainlyas a result of higher/lower interest expense on floating rate borrowings.
Degree ofvariation
Effect onprofit or loss
Effect on othercomprehensive
income
Financial assetsMonetary itemsUSD:NTD 1% 245,981$ -$GBP:USD 1% 5,493 -
Financial liabilitiesMonetary items
USD:NTD 1% 200,145$ -$GBP:USD 1% 17,385 -
Year ended December 31, 2016Sensitivity analysis
(Foreign currency: functional currency)
164
4 Financial Statements
~89~
(b)Credit riski. Credit risk refers to the risk of financial loss to the Group arising from default by the clients
or counterparties of financial instruments on the contract obligations. According to theGroup’s credit policy, each local entity in the Group is responsible for managing andanalysing the credit risk for each of their new clients before standard payment and deliveryterms and conditions are offered. Internal risk control assesses the credit quality of thecustomers, taking into account their financial position, past experience and other factors.Individual risk limits are set based on internal or external ratings in accordance with limitsset by the Board of Directors. The utilisation of credit limits is regularly monitored. Creditrisk arises from cash and cash equivalents, derivative financial instruments and deposits withbanks and financial institutions, as well as credit exposures to wholesale and retail customers,including outstanding receivables and committed transactions. For banks and financialinstitutions, only independently rated parties with high reputation are accepted.
ii. For the years ended December 31, 2017 and 2016, no credit limits were exceeded during thereporting periods, and management does not expect any significant losses from non-performance by these counterparties.
iii. For credit quality information of financial assets that are neither past due nor impaired,please refer to Note 6(5).
(c)Liquidity riski. Cash flow forecasting is performed in the operating entities of the Group and aggregated by
Group’s Finance Department. Group’s Finance Department monitors rolling forecasts of theGroup’s liquidity requirements to ensure it has sufficient cash to meet operational needs.
ii. The table below analyses the Group’s non-derivative financial liabilities and net-settled orgross-settled derivative financial liabilities into relevant maturity groupings based on theremaining period at the balance sheet date to the contractual maturity date for non-derivativefinancial liabilities.
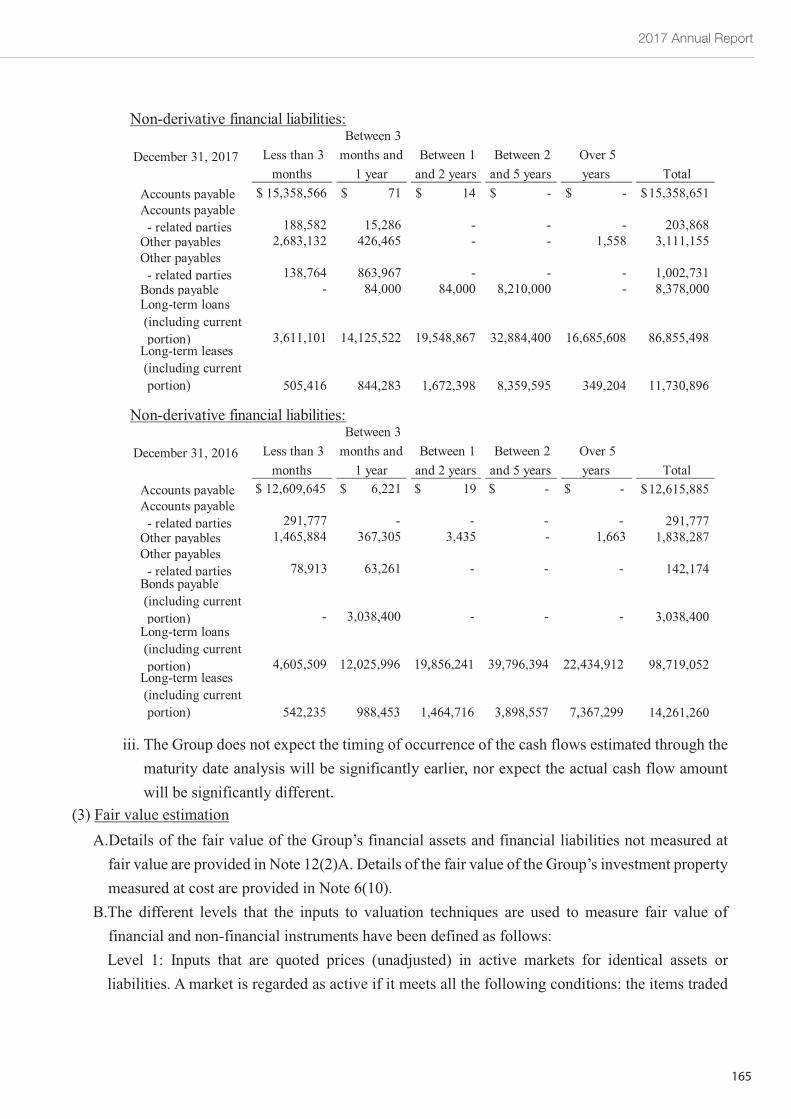
2017 Annual Report
165
~90~
iii. The Group does not expect the timing of occurrence of the cash flows estimated through thematurity date analysis will be significantly earlier, nor expect the actual cash flow amountwill be significantly different.
(3) Fair value estimationA.Details of the fair value of the Group’s financial assets and financial liabilities not measured at
fair value are provided in Note 12(2)A. Details of the fair value of the Group’s investment propertymeasured at cost are provided in Note 6(10).
B.The different levels that the inputs to valuation techniques are used to measure fair value offinancial and non-financial instruments have been defined as follows:Level 1: Inputs that are quoted prices (unadjusted) in active markets for identical assets orliabilities. A market is regarded as active if it meets all the following conditions: the items traded
Non-derivative financial liabilities:
December 31, 2017 Less than 3months
Between 3months and
1 yearBetween 1
and 2 yearsBetween 2
and 5 yearsOver 5years Total
Accounts payable 15,358,566$ 71$ 14$ -$ -$ 15,358,651$Accounts payable
- related parties 188,582 15,286 - - - 203,868Other payables 2,683,132 426,465 - - 1,558 3,111,155Other payables
- related parties 138,764 863,967 - - - 1,002,731Bonds payable - 84,000 84,000 8,210,000 - 8,378,000Long-term loans(including currentportion) 3,611,101 14,125,522 19,548,867 32,884,400 16,685,608 86,855,498
Long-term leases(including currentportion) 505,416 844,283 1,672,398 8,359,595 349,204 11,730,896
Non-derivative financial liabilities:
December 31, 2016 Less than 3months
Between 3months and
1 yearBetween 1
and 2 yearsBetween 2
and 5 yearsOver 5years Total
Accounts payable $ 12,609,645 $ 6,221 $ 19 $ - $ - 12,615,885$Accounts payable
- related parties 291,777 - - - - 291,777Other payables 1,465,884 367,305 3,435 - 1,663 1,838,287Other payables
- related parties 78,913 63,261 - - - 142,174Bonds payable(including currentportion) - 3,038,400 - - - 3,038,400
Long-term loans(including currentportion) 4,605,509 12,025,996 19,856,241 39,796,394 22,434,912 98,719,052
Long-term leases(including currentportion) 542,235 988,453 1,464,716 3,898,557 7,367,299 14,261,260
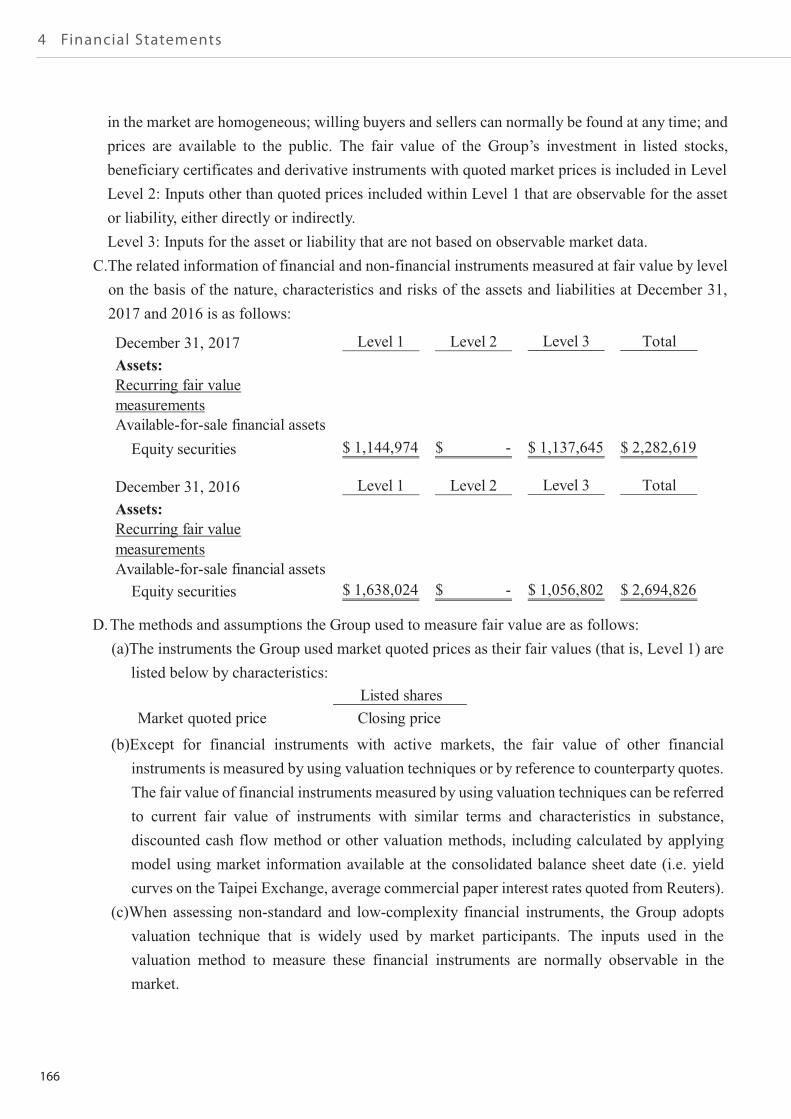
166
4 Financial Statements
~91~
in the market are homogeneous; willing buyers and sellers can normally be found at any time; andprices are available to the public. The fair value of the Group’s investment in listed stocks,beneficiary certificates and derivative instruments with quoted market prices is included in LevelLevel 2: Inputs other than quoted prices included within Level 1 that are observable for the assetor liability, either directly or indirectly.Level 3: Inputs for the asset or liability that are not based on observable market data.
C.The related information of financial and non-financial instruments measured at fair value by levelon the basis of the nature, characteristics and risks of the assets and liabilities at December 31,2017 and 2016 is as follows:
D. The methods and assumptions the Group used to measure fair value are as follows:(a)The instruments the Group used market quoted prices as their fair values (that is, Level 1) are
listed below by characteristics:
(b)Except for financial instruments with active markets, the fair value of other financialinstruments is measured by using valuation techniques or by reference to counterparty quotes.The fair value of financial instruments measured by using valuation techniques can be referredto current fair value of instruments with similar terms and characteristics in substance,discounted cash flow method or other valuation methods, including calculated by applyingmodel using market information available at the consolidated balance sheet date (i.e. yieldcurves on the Taipei Exchange, average commercial paper interest rates quoted from Reuters).
(c)When assessing non-standard and low-complexity financial instruments, the Group adoptsvaluation technique that is widely used by market participants. The inputs used in thevaluation method to measure these financial instruments are normally observable in themarket.
December 31, 2017 Level 1 Level 2 Level 3 TotalAssets:Recurring fair valuemeasurementsAvailable-for-sale financial assets
Equity securities 1,144,974$ -$ 1,137,645$ 2,282,619$
December 31, 2016 Level 1 Level 2 Level 3 TotalAssets:Recurring fair valuemeasurementsAvailable-for-sale financial assets
Equity securities 1,638,024$ -$ 1,056,802$ 2,694,826$
Listed sharesMarket quoted price Closing price
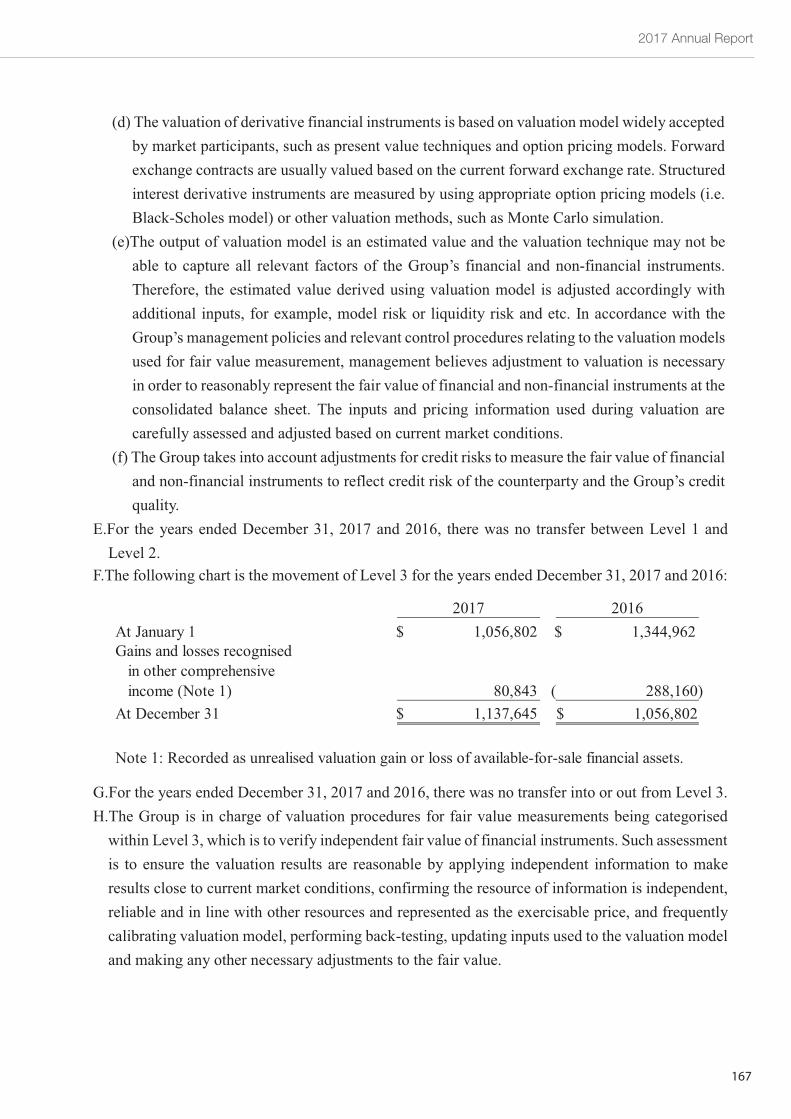
2017 Annual Report
167
~92~
(d) The valuation of derivative financial instruments is based on valuation model widely acceptedby market participants, such as present value techniques and option pricing models. Forwardexchange contracts are usually valued based on the current forward exchange rate. Structuredinterest derivative instruments are measured by using appropriate option pricing models (i.e.Black-Scholes model) or other valuation methods, such as Monte Carlo simulation.
(e)The output of valuation model is an estimated value and the valuation technique may not beable to capture all relevant factors of the Group’s financial and non-financial instruments.Therefore, the estimated value derived using valuation model is adjusted accordingly withadditional inputs, for example, model risk or liquidity risk and etc. In accordance with theGroup’s management policies and relevant control procedures relating to the valuation modelsused for fair value measurement, management believes adjustment to valuation is necessaryin order to reasonably represent the fair value of financial and non-financial instruments at theconsolidated balance sheet. The inputs and pricing information used during valuation arecarefully assessed and adjusted based on current market conditions.
(f) The Group takes into account adjustments for credit risks to measure the fair value of financialand non-financial instruments to reflect credit risk of the counterparty and the Group’s creditquality.
E.For the years ended December 31, 2017 and 2016, there was no transfer between Level 1 andLevel 2.
F.The following chart is the movement of Level 3 for the years ended December 31, 2017 and 2016:
G.For the years ended December 31, 2017 and 2016, there was no transfer into or out from Level 3.H.The Group is in charge of valuation procedures for fair value measurements being categorised
within Level 3, which is to verify independent fair value of financial instruments. Such assessmentis to ensure the valuation results are reasonable by applying independent information to makeresults close to current market conditions, confirming the resource of information is independent,reliable and in line with other resources and represented as the exercisable price, and frequentlycalibrating valuation model, performing back-testing, updating inputs used to the valuation modeland making any other necessary adjustments to the fair value.
2017 2016At January 1 1,056,802$ 1,344,962$Gains and losses recognised
in other comprehensiveincome (Note 1) 80,843 288,160)(
At December 31 1,137,645$ 1,056,802$
Note 1: Recorded as unrealised valuation gain or loss of available-for-sale financial assets.
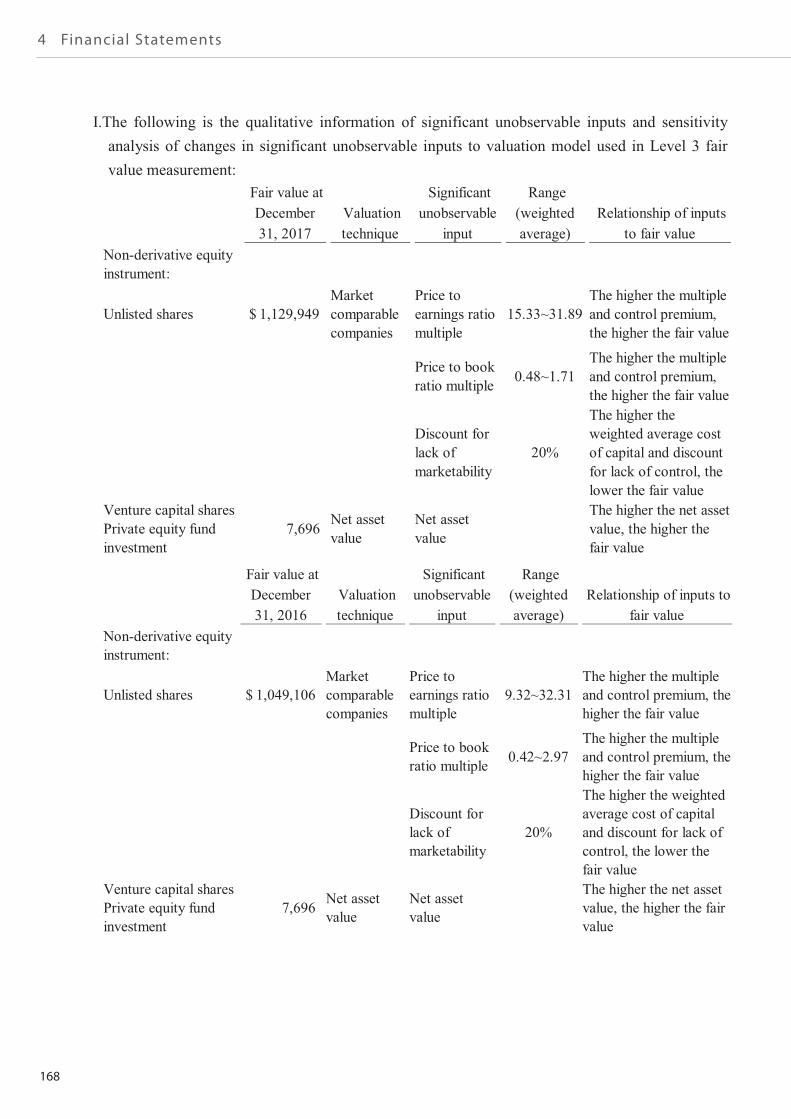
168
4 Financial Statements
~93~
I.The following is the qualitative information of significant unobservable inputs and sensitivityanalysis of changes in significant unobservable inputs to valuation model used in Level 3 fairvalue measurement:
Fair value atDecember31, 2017
Valuationtechnique
Significantunobservable
input
Range(weightedaverage)
Relationship of inputsto fair value
Non-derivative equityinstrument:
Unlisted shares 1,129,949$Marketcomparablecompanies
Price toearnings ratiomultiple
15.33~31.89The higher the multipleand control premium,the higher the fair value
Price to bookratio multiple 0.48~1.71
The higher the multipleand control premium,the higher the fair value
Discount forlack ofmarketability
20%
The higher theweighted average costof capital and discountfor lack of control, thelower the fair value
Venture capital sharesPrivate equity fundinvestment
7,696 Net assetvalue
Net assetvalue
The higher the net assetvalue, the higher thefair value
Fair value atDecember31, 2016
Valuationtechnique
Significantunobservable
input
Range(weightedaverage)
Relationship of inputs tofair value
Non-derivative equityinstrument:
Unlisted shares 1,049,106$Marketcomparablecompanies
Price toearnings ratiomultiple
9.32~32.31The higher the multipleand control premium, thehigher the fair value
Price to bookratio multiple 0.42~2.97
The higher the multipleand control premium, thehigher the fair value
Discount forlack ofmarketability
20%
The higher the weightedaverage cost of capitaland discount for lack ofcontrol, the lower thefair value
Venture capital sharesPrivate equity fundinvestment
7,696 Net assetvalue
Net assetvalue
The higher the net assetvalue, the higher the fairvalue
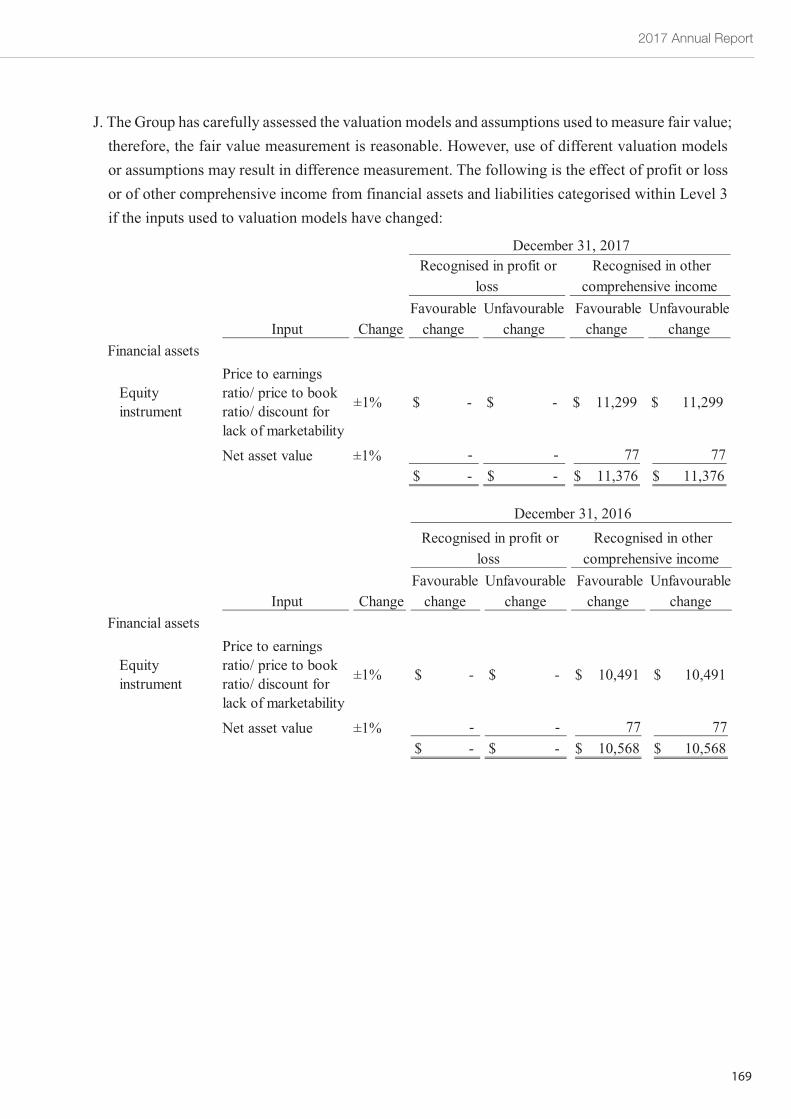
2017 Annual Report
169
~94~
J. The Group has carefully assessed the valuation models and assumptions used to measure fair value;therefore, the fair value measurement is reasonable. However, use of different valuation modelsor assumptions may result in difference measurement. The following is the effect of profit or lossor of other comprehensive income from financial assets and liabilities categorised within Level 3if the inputs used to valuation models have changed:
Input ChangeFavourable
changeUnfavourable
changeFavourable
changeUnfavourable
changeFinancial assets
Equityinstrument
Price to earningsratio/ price to bookratio/ discount forlack of marketability
±1% $ - $ - $ 11,299 $ 11,299
Net asset value ±1% - - 77 77$ - $ - $ 11,376 $ 11,376
December 31, 2017Recognised in profit or
lossRecognised in other
comprehensive income
Input ChangeFavourable
changeUnfavourable
changeFavourable
changeUnfavourable
changeFinancial assets
Equityinstrument
Price to earningsratio/ price to bookratio/ discount forlack of marketability
±1% $ - $ - $ 10,491 $ 10,491
Net asset value ±1% - - 77 77$ - $ - $ 10,568 $ 10,568
December 31, 2016Recognised in profit or
lossRecognised in other
comprehensive income
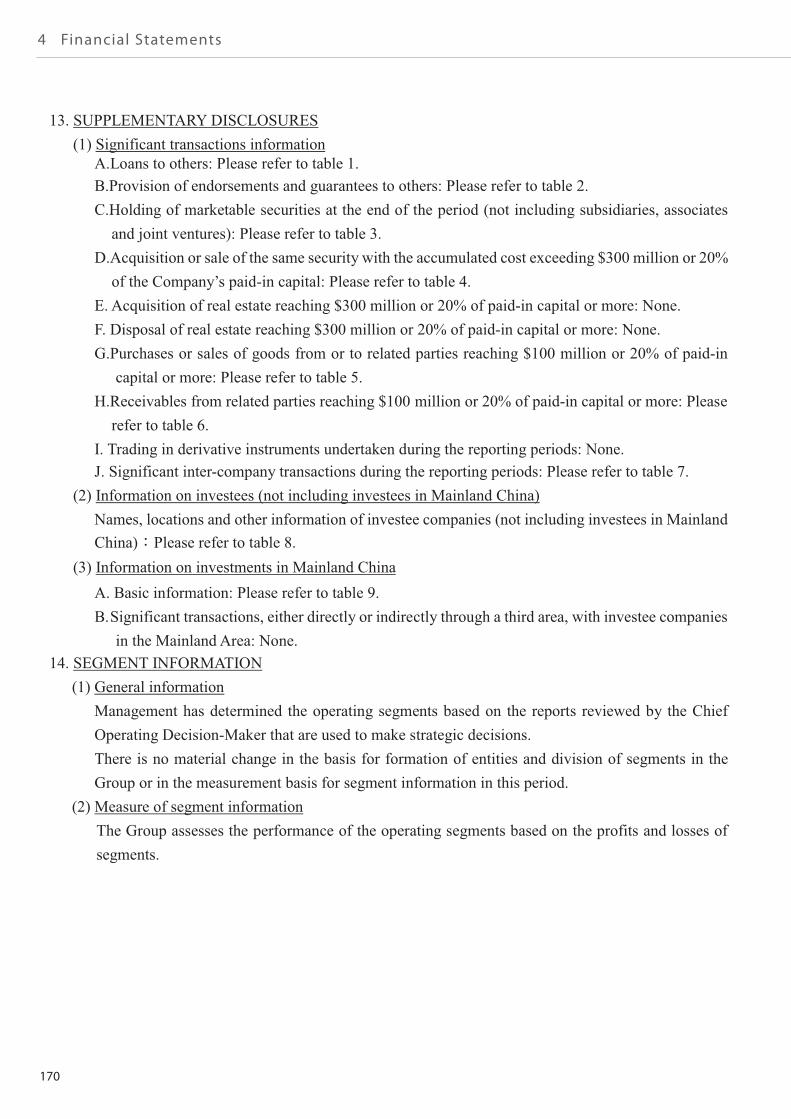
170
4 Financial Statements
~95~
13. SUPPLEMENTARY DISCLOSURES(1) Significant transactions information
A.Loans to others: Please refer to table 1.B.Provision of endorsements and guarantees to others: Please refer to table 2.C.Holding of marketable securities at the end of the period (not including subsidiaries, associates
and joint ventures): Please refer to table 3.D.Acquisition or sale of the same security with the accumulated cost exceeding $300 million or 20%
of the Company’s paid-in capital: Please refer to table 4.E. Acquisition of real estate reaching $300 million or 20% of paid-in capital or more: None.F. Disposal of real estate reaching $300 million or 20% of paid-in capital or more: None.G.Purchases or sales of goods from or to related parties reaching $100 million or 20% of paid-in
capital or more: Please refer to table 5.H.Receivables from related parties reaching $100 million or 20% of paid-in capital or more: Please
refer to table 6.I. Trading in derivative instruments undertaken during the reporting periods: None.J. Significant inter-company transactions during the reporting periods: Please refer to table 7.
(2) Information on investees (not including investees in Mainland China)Names, locations and other information of investee companies (not including investees in MainlandChina) Please refer to table 8.
(3) Information on investments in Mainland ChinaA. Basic information: Please refer to table 9.B.Significant transactions, either directly or indirectly through a third area, with investee companies
in the Mainland Area: None.14. SEGMENT INFORMATION
(1) General informationManagement has determined the operating segments based on the reports reviewed by the ChiefOperating Decision-Maker that are used to make strategic decisions.There is no material change in the basis for formation of entities and division of segments in theGroup or in the measurement basis for segment information in this period.
(2) Measure of segment informationThe Group assesses the performance of the operating segments based on the profits and losses ofsegments.
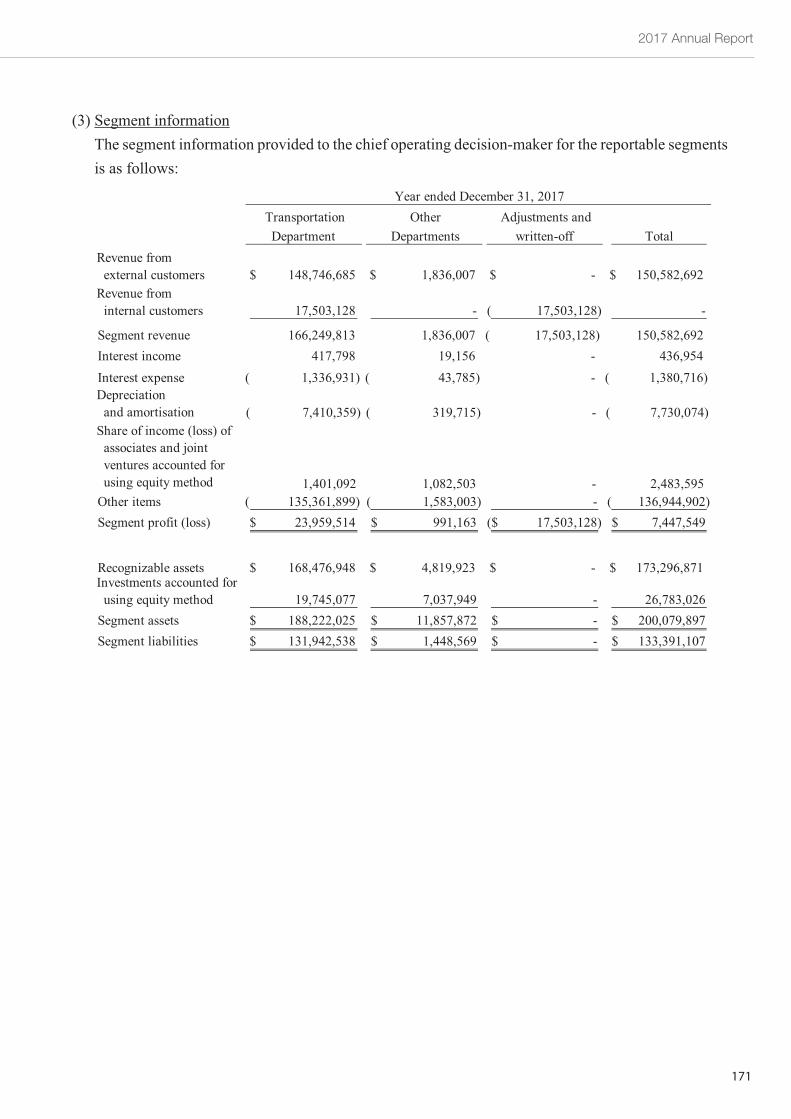
2017 Annual Report
171
~96~
(3) Segment informationThe segment information provided to the chief operating decision-maker for the reportable segmentsis as follows:
TransportationDepartment
OtherDepartments
Adjustments andwritten-off Total
Revenue fromexternal customers 148,746,685$ 1,836,007$ -$ 150,582,692$
Revenue frominternal customers 17,503,128 - 17,503,128)( -
Segment revenue 166,249,813 1,836,007 17,503,128)( 150,582,692Interest income 417,798 19,156 - 436,954Interest expense 1,336,931)( 43,785)( - 1,380,716)(Depreciation
and amortisation 7,410,359)( 319,715)( - 7,730,074)(Share of income (loss) of
associates and jointventures accounted forusing equity method 1,401,092 1,082,503 - 2,483,595
Other items 135,361,899)( 1,583,003)( - 136,944,902)(Segment profit (loss) 23,959,514$ 991,163$ 17,503,128)($ 7,447,549$
Recognizable assets 168,476,948$ 4,819,923$ -$ 173,296,871$Investments accounted for
using equity method 19,745,077 7,037,949 - 26,783,026Segment assets 188,222,025$ 11,857,872$ -$ 200,079,897$Segment liabilities 131,942,538$ 1,448,569$ -$ 133,391,107$
Year ended December 31, 2017
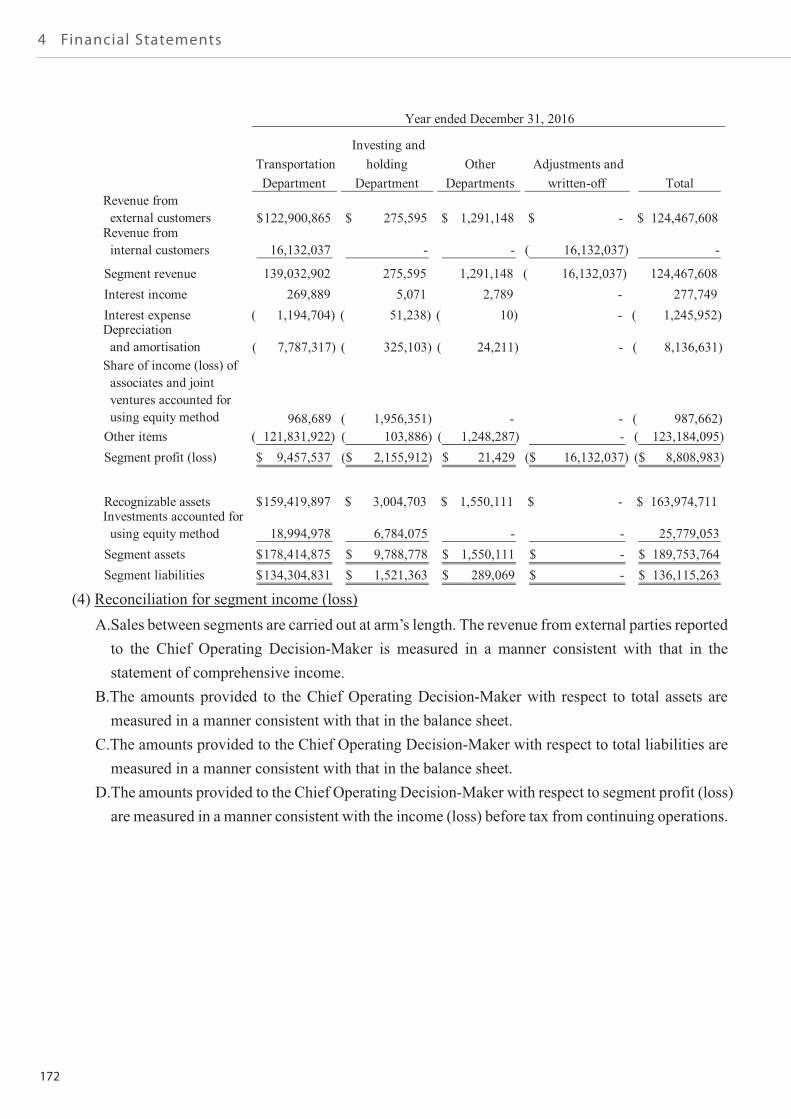
172
4 Financial Statements
~97~
(4) Reconciliation for segment income (loss)A.Sales between segments are carried out at arm’s length. The revenue from external parties reported
to the Chief Operating Decision-Maker is measured in a manner consistent with that in thestatement of comprehensive income.
B.The amounts provided to the Chief Operating Decision-Maker with respect to total assets aremeasured in a manner consistent with that in the balance sheet.
C.The amounts provided to the Chief Operating Decision-Maker with respect to total liabilities aremeasured in a manner consistent with that in the balance sheet.
D.The amounts provided to the Chief Operating Decision-Maker with respect to segment profit (loss)are measured in a manner consistent with the income (loss) before tax from continuing operations.
TransportationDepartment
Investing andholding
DepartmentOther
DepartmentsAdjustments and
written-off TotalRevenue from
external customers 122,900,865$ 275,595$ 1,291,148$ -$ 124,467,608$Revenue from
internal customers 16,132,037 - - 16,132,037)( -
Segment revenue 139,032,902 275,595 1,291,148 16,132,037)( 124,467,608Interest income 269,889 5,071 2,789 - 277,749Interest expense 1,194,704)( 51,238)( 10)( - 1,245,952)(Depreciation
and amortisation 7,787,317)( 325,103)( 24,211)( - 8,136,631)(Share of income (loss) of
associates and jointventures accounted forusing equity method 968,689 1,956,351)( - - 987,662)(
Other items 121,831,922)( 103,886)( 1,248,287)( - 123,184,095)(Segment profit (loss) 9,457,537$ 2,155,912)($ 21,429$ 16,132,037)($ 8,808,983)($
Recognizable assets 159,419,897$ 3,004,703$ 1,550,111$ -$ 163,974,711$Investments accounted for
using equity method 18,994,978 6,784,075 - - 25,779,053Segment assets 178,414,875$ 9,788,778$ 1,550,111$ -$ 189,753,764$Segment liabilities 134,304,831$ 1,521,363$ 289,069$ -$ 136,115,263$
Year ended December 31, 2016
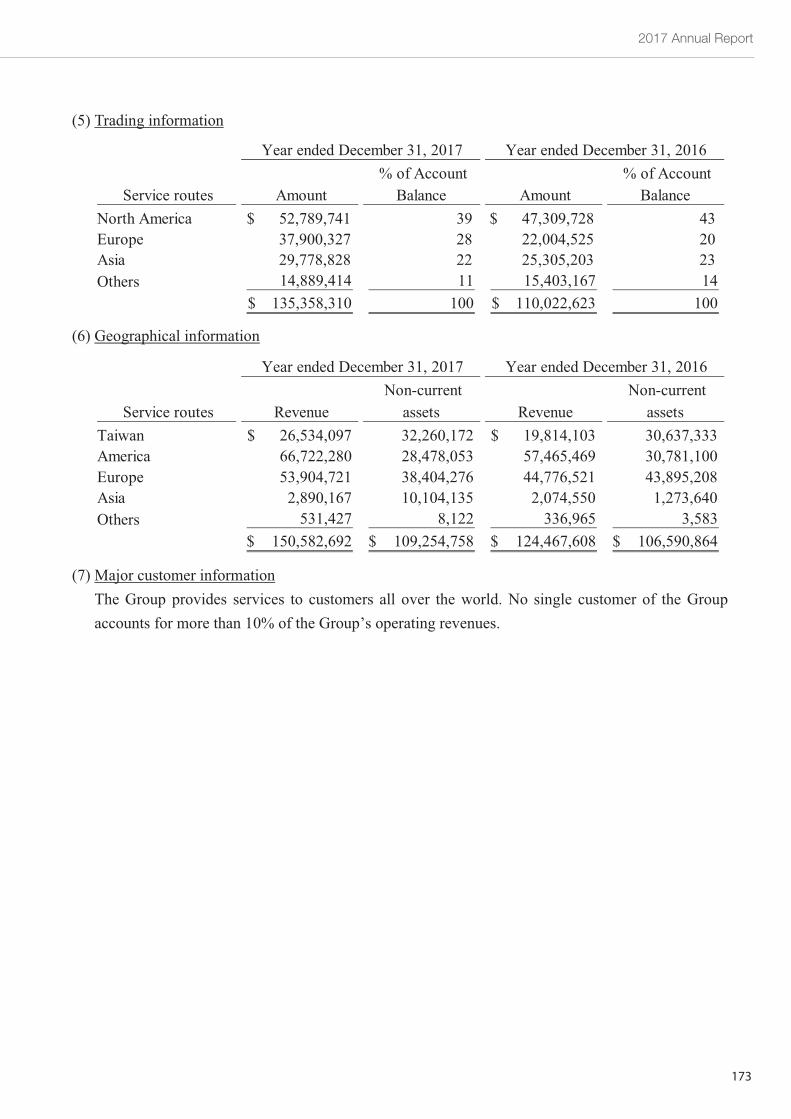
2017 Annual Report
173
~98~
(5) Trading information
(6) Geographical information
(7) Major customer informationThe Group provides services to customers all over the world. No single customer of the Groupaccounts for more than 10% of the Group’s operating revenues.
Service routes Amount% of Account
Balance Amount% of Account
BalanceNorth America 52,789,741$ 39 47,309,728$ 43Europe 37,900,327 28 22,004,525 20Asia 29,778,828 22 25,305,203 23Others 14,889,414 11 15,403,167 14
135,358,310$ 100 110,022,623$ 100
Year ended December 31, 2017 Year ended December 31, 2016
Service routes RevenueNon-current
assets RevenueNon-current
assetsTaiwan 26,534,097$ 32,260,172 19,814,103$ 30,637,333America 66,722,280 28,478,053 57,465,469 30,781,100Europe 53,904,721 38,404,276 44,776,521 43,895,208Asia 2,890,167 10,104,135 2,074,550 1,273,640Others 531,427 8,122 336,965 3,583
150,582,692$ 109,254,758$ 124,467,608$ 106,590,864$
Year ended December 31, 2017 Year ended December 31, 2016
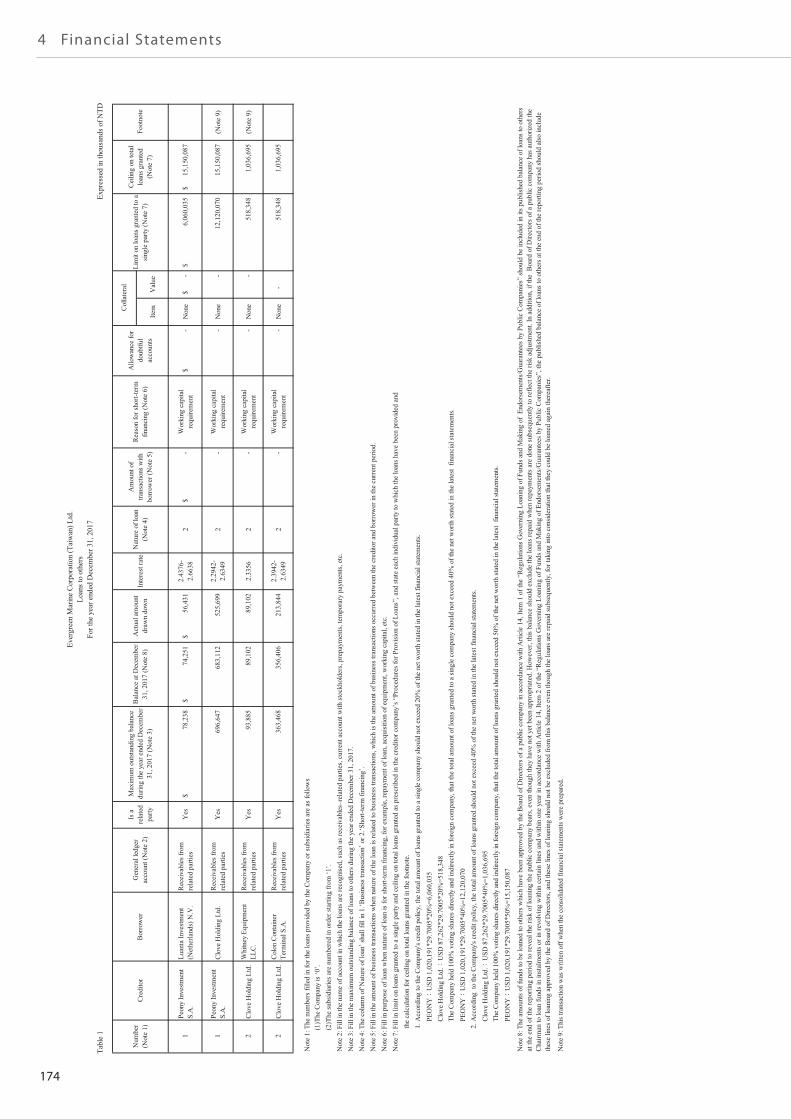
174
4 Financial Statements
Item
Val
ue
1Pe
ony
Inve
stm
ent
S.A
.Lu
anta
Inve
stm
ent
(Net
herla
nds)
N.V
.R
ecei
vabl
es fr
omre
late
d pa
rties
Yes
78,2
38$
74,2
51$
56
,431
$
2.
4376
-2.
6638
2-
$
Wor
king
cap
ital
requ
irem
ent
-$
N
one
-$
6,
060,
035
$
15,1
50,0
87$
1Pe
ony
Inve
stm
ent
S.A
.C
love
Hol
ding
Ltd
.R
ecei
vabl
es fr
omre
late
d pa
rties
Yes
696,
647
68
3,11
2
525,
699
2.
2942
-2.
6349
2-
Wor
king
cap
ital
requ
irem
ent
-
N
one
-
12
,120
,070
15,1
50,0
87
(Not
e 9)
2C
love
Hol
ding
Ltd
.W
hitn
ey E
quip
men
tLL
C.
Rec
eiva
bles
from
rela
ted
parti
esY
es93
,885
89
,102
89,1
02
2.33
562
-
W
orki
ng c
apita
lre
quire
men
t-
Non
e-
518,
348
1,
036,
695
(Not
e 9)
2C
love
Hol
ding
Ltd
.C
olon
Con
tain
erTe
rmin
al S
.A.
Rec
eiva
bles
from
rela
ted
parti
esY
es36
3,46
8
356,
406
21
3,84
4
2.39
42-
2.63
492
-
W
orki
ng c
apita
lre
quire
men
t-
Non
e
-51
8,34
8
1,03
6,69
5
Not
e 1:
The
num
bers
fille
d in
for t
he lo
ans p
rovi
ded
by th
e C
ompa
ny o
r sub
sidia
ries a
re a
s fol
low
s
(1
)The
Com
pany
is ‘0
’.
(2
)The
subs
idia
ries a
re n
umbe
red
in o
rder
star
ting
from
‘1’.
Not
e 2:
Fill
in th
e na
me
of a
ccou
nt in
whi
ch th
e lo
ans a
re re
cogn
ised,
such
as r
ecei
vabl
es–r
elat
ed p
artie
s, cu
rren
t acc
ount
with
stoc
khol
ders
, pre
paym
ents
, tem
pora
ry p
aym
ents
, etc
.N
ote
3: F
ill in
the
max
imum
out
stan
ding
bal
ance
of l
oans
to o
ther
s dur
ing
the
year
end
ed D
ecem
ber 3
1, 2
017.
Not
e 4:
The
col
umn
of‘N
atur
e of
loan
’ sha
ll fil
l in
1.‘B
usin
ess t
rans
actio
n’ o
r 2.‘S
hort-
term
fina
ncin
g’.
Not
e 5:
Fill
in th
e am
ount
of b
usin
ess t
rans
actio
ns w
hen
natu
re o
f the
loan
is re
late
d to
bus
ines
s tra
nsac
tions
, whi
ch is
the
amou
nt o
f bus
ines
s tra
nsac
tions
occ
urre
d be
twee
n th
e cr
edito
r and
bor
row
er in
the
curr
ent p
erio
d.N
ote
6: F
ill in
pur
pose
of l
oan
whe
n na
ture
of l
oan
is fo
r sho
rt-te
rm fi
nanc
ing,
for e
xam
ple,
repa
ymen
t of l
oan,
acq
uisit
ion
of e
quip
men
t, w
orki
ng c
apita
l, et
c.N
ote
7: F
ill in
lim
it on
loan
s gra
nted
to a
sing
le p
arty
and
cei
ling
on to
tal l
oans
gra
nted
as p
resc
ribed
in th
e cr
edito
r com
pany
’s “
Proc
edur
es fo
r Pro
visio
n of
Loa
ns”,
and
stat
e ea
ch in
divi
dual
par
ty to
whi
ch th
e lo
ans h
ave
been
pro
vide
d an
d
th
e ca
lcul
atio
n fo
r cei
ling
on to
tal l
oans
gra
nted
in th
e fo
otno
te.
1. A
ccor
ding
to th
e C
ompa
ny's
cred
it po
licy,
the
tota
l am
ount
of l
oans
gra
nted
to a
sing
le c
ompa
ny sh
ould
not
exc
eed
20%
of t
he n
et w
orth
stat
ed in
the
late
st fi
nanc
ial s
tate
men
ts.
P
EON
YU
SD 1
,020
,191
*29.
7005
*20%
=6,0
60,0
35
Clo
ve H
oldi
ng L
td.
USD
87,
262*
29.7
005*
20%
=518
,348
T
he C
ompa
ny h
eld
100%
vot
ing
shar
es d
irect
ly a
nd in
dire
ctly
in fo
reig
n co
mpa
ny, t
hat t
he to
tal a
mou
nt o
f loa
ns g
rant
ed to
a si
ngle
com
pany
shou
ld n
ot e
xcee
d 40
% o
f the
net
wor
th st
ated
in th
e la
test
fin
anci
al st
atem
ents
.
P
EON
YU
SD 1
,020
,191
*29.
7005
*40%
=12,
120,
070
2. A
ccor
ding
to
the
Com
pany
's cr
edit
polic
y, th
e to
tal a
mou
nt o
f loa
ns g
rant
ed sh
ould
not
exc
eed
40%
of t
he n
et w
orth
stat
ed in
the
late
st fi
nanc
ial s
tate
men
ts.
C
love
Hol
ding
Ltd
.U
SD 8
7,26
2*29
.700
5*40
%=1
,036
,695
T
he C
ompa
ny h
eld
100%
vot
ing
shar
es d
irect
ly a
nd in
dire
ctly
in fo
reig
n co
mpa
ny, t
hat t
he to
tal a
mou
nt o
f loa
ns g
rant
ed sh
ould
not
exc
eed
50%
of t
he n
et w
orth
stat
ed in
the
late
st f
inan
cial
stat
emen
ts.
P
EON
YU
SD 1
,020
,191
*29.
7005
*50%
=15,
150,
087
Not
e 9:
Thi
s tra
nsac
tion
was
writ
ten
off w
hen
the
cons
olid
ated
fina
ncia
l sta
tem
ents
wer
e pr
epar
ed.
Not
e 8:
The
am
ount
s of f
unds
to b
e lo
aned
to o
ther
s whi
ch h
ave
been
app
rove
d by
the
Boa
rd o
f Dire
ctor
s of a
pub
lic c
ompa
ny in
acc
orda
nce
with
Arti
cle
14, I
tem
1 o
f the
“R
egul
atio
ns G
over
ning
Loa
ning
of F
unds
and
Mak
ing
of E
ndor
sem
ents
/Gua
rant
ees b
y Pu
blic
Com
pani
es”
shou
ld b
e in
clud
ed in
its p
ublis
hed
bala
nce
of lo
ans t
o ot
hers
at th
e en
d of
the
repo
rting
per
iod
to re
veal
the
risk
of lo
anin
g th
e pu
blic
com
pany
bea
rs, e
ven
thou
gh th
ey h
ave
not y
et b
een
appr
opria
ted.
How
ever
, thi
s bal
ance
shou
ld e
xclu
de th
e lo
ans r
epai
d w
hen
repa
ymen
ts a
re d
one
subs
eque
ntly
to re
flect
the
risk
adju
stm
ent.
In a
dditi
on, i
f the
Boa
rd o
f Dire
ctor
s of a
pub
lic c
ompa
ny h
as a
utho
rized
the
Cha
irman
to lo
an fu
nds i
n in
stal
men
ts o
r in
revo
lvin
g w
ithin
cer
tain
line
s and
with
in o
ne y
ear i
n ac
cord
ance
with
Arti
cle
14, I
tem
2 o
f the
“R
egul
atio
ns G
over
ning
Loa
ning
of F
unds
and
Mak
ing
of E
ndor
sem
ents
/Gua
rant
ees b
y Pu
blic
Com
pani
es”,
the
publ
ished
bal
ance
of l
oans
to o
ther
s at t
he e
nd o
f the
repo
rting
per
iod
shou
ld a
lso in
clud
eth
ese
lines
of l
oani
ng a
ppro
ved
by th
e B
oard
of D
irect
ors,
and
thes
e lin
es o
f loa
ning
shou
ld n
ot b
e ex
clud
ed fr
om th
is ba
lanc
e ev
en th
ough
the
loan
s are
repa
id su
bseq
uent
ly, f
or ta
king
into
con
sider
atio
n th
at th
ey c
ould
be
loan
ed a
gain
ther
eafte
r.
Col
late
ral
Lim
it on
loan
s gra
nted
to a
singl
e pa
rty (N
ote
7)
Cei
ling
on to
tal
loan
s gra
nted
(Not
e 7)
Foot
note
Inte
rest
rate
Nat
ure
of lo
an(N
ote
4)
Am
ount
of
trans
actio
ns w
ithbo
rrow
er (N
ote
5)
Rea
son
for s
hort-
term
finan
cing
(Not
e 6)
Allo
wan
ce fo
rdo
ubtfu
lac
coun
ts
Max
imum
out
stan
ding
bal
ance
durin
g th
e ye
ar e
nded
Dec
embe
r31
, 201
7 (N
ote
3)
Bal
ance
at D
ecem
ber
31, 2
017
(Not
e 8)
Act
ual a
mou
ntdr
awn
dow
nN
umbe
r(N
ote
1)C
redi
tor
Bor
row
er
Gen
eral
ledg
erac
coun
t (N
ote
2)
Is a
rela
ted
party
Ever
gree
n M
arin
e C
orpo
ratio
n (T
aiw
an) L
td.
Loan
s to
othe
rsFo
r the
yea
r end
ed D
ecem
ber 3
1, 2
017
Tabl
e 1
Expr
esse
d in
thou
sand
s of N
TD(E
xcep
t as o
ther
wise
indi
cate
d)
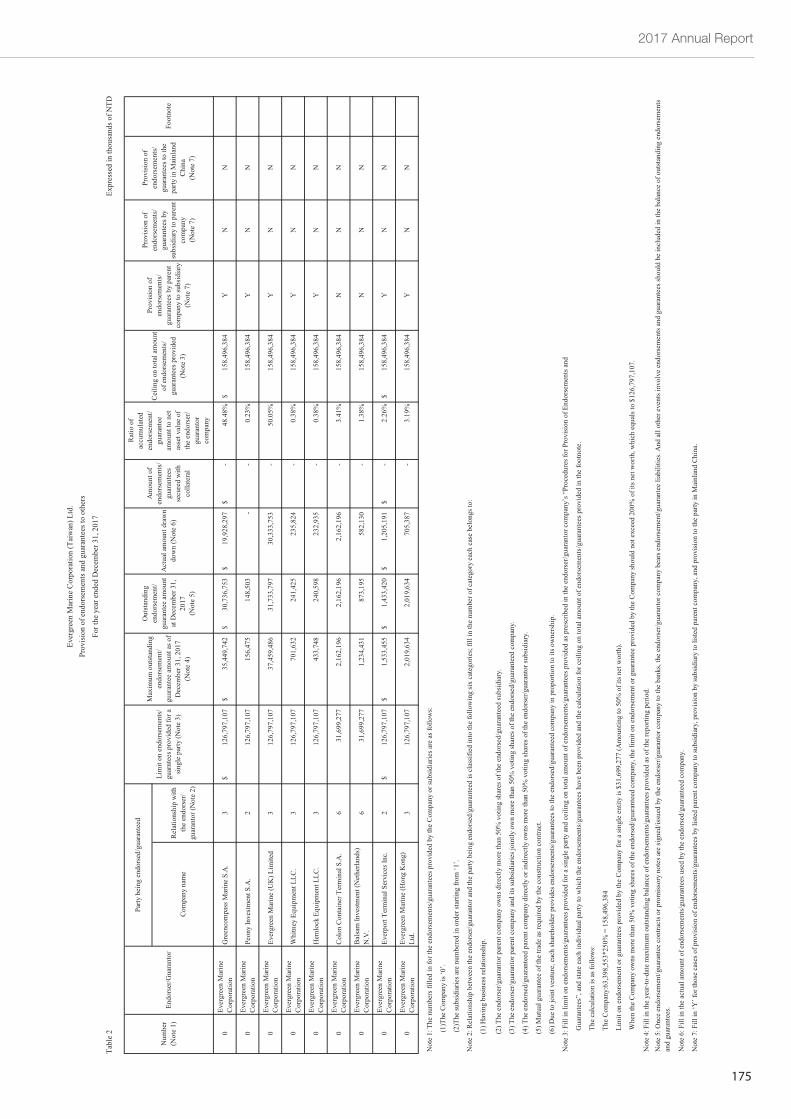
2017 Annual Report
175
Com
pany
nam
eR
elat
ions
hip
with
the
endo
rser
/gu
aran
tor (
Not
e 2)
0Ev
ergr
een
Mar
ine
Cor
pora
tion
Gre
enco
mpa
ss M
arin
e S.
A.
312
6,79
7,10
7$
35,4
49,7
42$
30
,736
,753
$
19,9
28,2
97$
-$
48
.48%
158,
496,
384
$
YN
N
0Ev
ergr
een
Mar
ine
Cor
pora
tion
Peon
y In
vest
men
t S.A
.2
126,
797,
107
15
6,47
5
14
8,50
3
-
-
0.23
%15
8,49
6,38
4
Y
NN
0Ev
ergr
een
Mar
ine
Cor
pora
tion
Ever
gree
n M
arin
e (U
K) L
imite
d3
126,
797,
107
37
,459
,486
31,7
33,7
97
30
,333
,753
-
50.0
5%15
8,49
6,38
4
Y
NN
0Ev
ergr
een
Mar
ine
Cor
pora
tion
Whi
tney
Equ
ipm
ent L
LC.
312
6,79
7,10
7
701,
632
241,
425
235,
824
-
0.38
%15
8,49
6,38
4
Y
NN
0Ev
ergr
een
Mar
ine
Cor
pora
tion
Hem
lock
Equ
ipm
ent L
LC.
312
6,79
7,10
7
433,
748
240,
598
232,
935
-
0.38
%15
8,49
6,38
4
Y
NN
0Ev
ergr
een
Mar
ine
Cor
pora
tion
Col
on C
onta
iner
Ter
min
al S
.A.
631
,699
,277
2,16
2,19
6
2,16
2,19
6
2,16
2,19
6
-
3.41
%15
8,49
6,38
4
N
NN
0Ev
ergr
een
Mar
ine
Cor
pora
tion
Bal
sam
Inve
stm
ent (
Net
herla
nds)
N.V
.6
31,6
99,2
77
1,
234,
431
87
3,19
5
58
2,13
0
-
1.
38%
158,
496,
384
NN
N
0Ev
ergr
een
Mar
ine
Cor
pora
tion
Ever
port
Term
inal
Ser
vice
s Inc
.2
126,
797,
107
$
1,
533,
455
$
1,
433,
420
$
1,
205,
191
$
-$
2.
26%
158,
496,
384
$
YN
N
0Ev
ergr
een
Mar
ine
Cor
pora
tion
Ever
gree
n M
arin
e (H
ong
Kon
g)Lt
d.3
126,
797,
107
2,
019,
634
2,
019,
634
70
5,38
7
-
3.
19%
158,
496,
384
YN
N
Not
e 1:
The
num
bers
fille
d in
for t
he e
ndor
sem
ents
/gua
rant
ees p
rovi
ded
by th
e C
ompa
ny o
r sub
sidi
arie
s are
as f
ollo
ws:
(
1)Th
e C
ompa
ny is
‘0’.
(
2)Th
e su
bsid
iarie
s are
num
bere
d in
ord
er st
artin
g fro
m ‘1
’.
Not
e 2:
Rel
atio
nshi
p be
twee
n th
e en
dors
er/g
uara
ntor
and
the
party
bei
ng e
ndor
sed/
guar
ante
ed is
cla
ssifi
ed in
to th
e fo
llow
ing
six
cate
gorie
s; fil
l in
the
num
ber o
f cat
egor
y ea
ch c
ase
belo
ngs t
o:
(1
) Hav
ing
busi
ness
rela
tions
hip.
(2
) The
end
orse
r/gua
rant
or p
aren
t com
pany
ow
ns d
irect
ly m
ore
than
50%
vot
ing
shar
es o
f the
end
orse
d/gu
aran
teed
subs
idia
ry.
(3
) The
end
orse
r/gua
rant
or p
aren
t com
pany
and
its s
ubsi
diar
ies j
oint
ly o
wn
mor
e th
an 5
0% v
otin
g sh
ares
of t
he e
ndor
sed/
guar
ante
ed c
ompa
ny.
(4
) The
end
orse
d/gu
aran
teed
par
ent c
ompa
ny d
irect
ly o
r ind
irect
ly o
wns
mor
e th
an 5
0% v
otin
g sh
ares
of t
he e
ndor
ser/g
uara
ntor
subs
idia
ry.
(5
) Mut
ual g
uara
ntee
of t
he tr
ade
as re
quire
d by
the
cons
truct
ion
cont
ract
.
(6
) Due
to jo
int v
entu
re, e
ach
shar
ehol
der p
rovi
des e
ndor
sem
ents
/gua
rant
ees t
o th
e en
dors
ed/g
uara
ntee
d co
mpa
ny in
pro
porti
on to
its o
wne
rshi
p.
Not
e 3:
Fill
in li
mit
on e
ndor
sem
ents
/gua
rant
ees p
rovi
ded
for a
sing
le p
arty
and
cei
ling
on to
tal a
mou
nt o
f end
orse
men
ts/g
uara
ntee
s pro
vide
d as
pre
scrib
ed in
the
endo
rser
/gua
rant
or c
ompa
ny’s
“Pr
oced
ures
for P
rovi
sion
of E
ndor
sem
ents
and
Gua
rant
ees”
, and
stat
e ea
ch in
divi
dual
par
ty to
whi
ch th
e en
dors
emen
ts/g
uara
ntee
s hav
e be
en p
rovi
ded
and
the
calc
ulat
ion
for c
eilin
g on
tota
l am
ount
of e
ndor
sem
ents
/gua
rant
ees p
rovi
ded
in th
e fo
otno
te.
The
calc
ulat
ion
is a
s fol
low
s:
The
Com
pany
:63,
398,
553*
250%
= 1
58,4
96,3
84
Lim
it on
end
orse
men
t or g
uara
ntee
s pro
vide
d by
the
Com
pany
for a
sing
le e
ntity
is $
31,6
99,2
77 (A
mou
ntin
g to
50%
of i
ts n
et w
orth
).
Whe
n th
e C
ompa
ny o
wns
mor
e th
an 5
0% v
otin
g sh
ares
of t
he e
ndor
sed/
guar
ante
ed c
ompa
ny, t
he li
mit
on e
ndor
sem
ent o
r gua
rant
ee p
rovi
ded
by th
e C
ompa
ny sh
ould
not
exc
eed
200%
of i
ts n
et w
orth
, whi
ch e
qual
s to
$126
,797
,107
.
Not
e 4:
Fill
in th
e ye
ar-to
-dat
e m
axim
um o
utst
andi
ng b
alan
ce o
f end
orse
men
ts/g
uara
ntee
s pro
vide
d as
of t
he re
porti
ng p
erio
d.
Not
e 6:
Fill
in th
e ac
tual
am
ount
of e
ndor
sem
ents
/gua
rant
ees u
sed
by th
e en
dors
ed/g
uara
ntee
d co
mpa
ny.
Not
e 7:
Fill
in ‘Y
’ for
thos
e ca
ses o
f pro
visi
on o
f end
orse
men
ts/g
uara
ntee
s by
liste
d pa
rent
com
pany
to su
bsid
iary
, pro
visi
on b
y su
bsid
iary
to li
sted
par
ent c
ompa
ny, a
nd p
rovi
sion
to th
e pa
rty in
Mai
nlan
d C
hina
.
Not
e 5:
Onc
e en
dors
emen
t/gua
rant
ee c
ontra
cts o
r pro
mis
sory
not
es a
re si
gned
/issu
ed b
y th
e en
dors
er/g
uara
ntor
com
pany
to th
e ba
nks,
the
endo
rser
/gua
rant
or c
ompa
ny b
ears
end
orse
men
t/gua
rant
ee li
abili
ties.
And
all
othe
r eve
nts i
nvol
ve e
ndor
sem
ents
and
gua
rant
ees s
houl
d be
incl
uded
in th
e ba
lanc
e of
out
stan
ding
end
orse
men
tsan
d gu
aran
tees
.
Prov
isio
n of
endo
rsem
ents
/gu
aran
tees
to th
epa
rty in
Mai
nlan
dC
hina
(Not
e 7)
Foot
note
Am
ount
of
endo
rsem
ents
/gu
aran
tees
secu
red
with
colla
tera
l
Rat
io o
fac
cum
ulat
eden
dors
emen
t/gu
aran
tee
amou
nt to
net
asse
t val
ue o
fth
e en
dors
er/
guar
anto
rco
mpa
ny
Cei
ling
on to
tal a
mou
ntof
end
orse
men
ts/
guar
ante
es p
rovi
ded
(Not
e 3)
Prov
isio
n of
endo
rsem
ents
/gu
aran
tees
by
pare
ntco
mpa
ny to
subs
idia
ry(N
ote
7)
Prov
isio
n of
endo
rsem
ents
/gu
aran
tees
by
subs
idia
ry to
par
ent
com
pany
(Not
e 7)
Out
stan
ding
endo
rsem
ent/
guar
ante
e am
ount
at D
ecem
ber 3
1,20
17(N
ote
5)
Act
ual a
mou
nt d
raw
ndo
wn
(Not
e 6)
Num
ber
(Not
e 1)
Endo
rser
/Gua
rant
or
Party
bei
ng e
ndor
sed/
guar
ante
ed
Lim
it on
end
orse
men
ts/
guar
ntee
s pro
vide
d fo
r asi
ngle
par
ty (N
ote
3)
Max
imum
out
stan
ding
endo
rsem
ent/
guar
ante
e am
ount
as o
fD
ecem
ber 3
1, 2
017
(Not
e 4)
Ever
gree
n M
arin
e C
orpo
ratio
n (T
aiw
an) L
td.
Prov
isio
n of
end
orse
men
ts a
nd g
uara
ntee
s to
othe
rs
For t
he y
ear e
nded
Dec
embe
r 31,
201
7
Tabl
e 2
Expr
esse
d in
thou
sand
s of N
TD
Com
pany
nam
eR
elat
ions
hip
with
the
endo
rser
/gu
aran
tor (
Not
e 2)
0Ev
ergr
een
Mar
ine
Cor
pora
tion
Gre
enco
mpa
ss M
arin
e S.
A.
312
6,79
7,10
7$
35,4
49,7
42$
30
,736
,753
$
19,9
28,2
97$
-$
48
.48%
158,
496,
384
$
YN
N
0Ev
ergr
een
Mar
ine
Cor
pora
tion
Peon
y In
vest
men
t S.A
.2
126,
797,
107
15
6,47
5
14
8,50
3
-
-
0.23
%15
8,49
6,38
4
Y
NN
0Ev
ergr
een
Mar
ine
Cor
pora
tion
Ever
gree
n M
arin
e (U
K) L
imite
d3
126,
797,
107
37
,459
,486
31,7
33,7
97
30
,333
,753
-
50.0
5%15
8,49
6,38
4
Y
NN
0Ev
ergr
een
Mar
ine
Cor
pora
tion
Whi
tney
Equ
ipm
ent L
LC.
312
6,79
7,10
7
701,
632
241,
425
235,
824
-
0.38
%15
8,49
6,38
4
Y
NN
0Ev
ergr
een
Mar
ine
Cor
pora
tion
Hem
lock
Equ
ipm
ent L
LC.
312
6,79
7,10
7
433,
748
240,
598
232,
935
-
0.38
%15
8,49
6,38
4
Y
NN
0Ev
ergr
een
Mar
ine
Cor
pora
tion
Col
on C
onta
iner
Ter
min
al S
.A.
631
,699
,277
2,16
2,19
6
2,16
2,19
6
2,16
2,19
6
-
3.41
%15
8,49
6,38
4
N
NN
0Ev
ergr
een
Mar
ine
Cor
pora
tion
Bal
sam
Inve
stm
ent (
Net
herla
nds)
N.V
.6
31,6
99,2
77
1,
234,
431
87
3,19
5
58
2,13
0
-
1.
38%
158,
496,
384
NN
N
0Ev
ergr
een
Mar
ine
Cor
pora
tion
Ever
port
Term
inal
Ser
vice
s Inc
.2
126,
797,
107
$
1,
533,
455
$
1,
433,
420
$
1,
205,
191
$
-$
2.
26%
158,
496,
384
$
YN
N
0Ev
ergr
een
Mar
ine
Cor
pora
tion
Ever
gree
n M
arin
e (H
ong
Kon
g)Lt
d.3
126,
797,
107
2,
019,
634
2,
019,
634
70
5,38
7
-
3.
19%
158,
496,
384
YN
N
Not
e 1:
The
num
bers
fille
d in
for t
he e
ndor
sem
ents
/gua
rant
ees p
rovi
ded
by th
e C
ompa
ny o
r sub
sidi
arie
s are
as f
ollo
ws:
(
1)Th
e C
ompa
ny is
‘0’.
(
2)Th
e su
bsid
iarie
s are
num
bere
d in
ord
er st
artin
g fro
m ‘1
’.
Not
e 2:
Rel
atio
nshi
p be
twee
n th
e en
dors
er/g
uara
ntor
and
the
party
bei
ng e
ndor
sed/
guar
ante
ed is
cla
ssifi
ed in
to th
e fo
llow
ing
six
cate
gorie
s; fil
l in
the
num
ber o
f cat
egor
y ea
ch c
ase
belo
ngs t
o:
(1
) Hav
ing
busi
ness
rela
tions
hip.
(2
) The
end
orse
r/gua
rant
or p
aren
t com
pany
ow
ns d
irect
ly m
ore
than
50%
vot
ing
shar
es o
f the
end
orse
d/gu
aran
teed
subs
idia
ry.
(3
) The
end
orse
r/gua
rant
or p
aren
t com
pany
and
its s
ubsi
diar
ies j
oint
ly o
wn
mor
e th
an 5
0% v
otin
g sh
ares
of t
he e
ndor
sed/
guar
ante
ed c
ompa
ny.
(4
) The
end
orse
d/gu
aran
teed
par
ent c
ompa
ny d
irect
ly o
r ind
irect
ly o
wns
mor
e th
an 5
0% v
otin
g sh
ares
of t
he e
ndor
ser/g
uara
ntor
subs
idia
ry.
(5
) Mut
ual g
uara
ntee
of t
he tr
ade
as re
quire
d by
the
cons
truct
ion
cont
ract
.
(6
) Due
to jo
int v
entu
re, e
ach
shar
ehol
der p
rovi
des e
ndor
sem
ents
/gua
rant
ees t
o th
e en
dors
ed/g
uara
ntee
d co
mpa
ny in
pro
porti
on to
its o
wne
rshi
p.
Not
e 3:
Fill
in li
mit
on e
ndor
sem
ents
/gua
rant
ees p
rovi
ded
for a
sing
le p
arty
and
cei
ling
on to
tal a
mou
nt o
f end
orse
men
ts/g
uara
ntee
s pro
vide
d as
pre
scrib
ed in
the
endo
rser
/gua
rant
or c
ompa
ny’s
“Pr
oced
ures
for P
rovi
sion
of E
ndor
sem
ents
and
Gua
rant
ees”
, and
stat
e ea
ch in
divi
dual
par
ty to
whi
ch th
e en
dors
emen
ts/g
uara
ntee
s hav
e be
en p
rovi
ded
and
the
calc
ulat
ion
for c
eilin
g on
tota
l am
ount
of e
ndor
sem
ents
/gua
rant
ees p
rovi
ded
in th
e fo
otno
te.
The
calc
ulat
ion
is a
s fol
low
s:
The
Com
pany
:63,
398,
553*
250%
= 1
58,4
96,3
84
Lim
it on
end
orse
men
t or g
uara
ntee
s pro
vide
d by
the
Com
pany
for a
sing
le e
ntity
is $
31,6
99,2
77 (A
mou
ntin
g to
50%
of i
ts n
et w
orth
).
Whe
n th
e C
ompa
ny o
wns
mor
e th
an 5
0% v
otin
g sh
ares
of t
he e
ndor
sed/
guar
ante
ed c
ompa
ny, t
he li
mit
on e
ndor
sem
ent o
r gua
rant
ee p
rovi
ded
by th
e C
ompa
ny sh
ould
not
exc
eed
200%
of i
ts n
et w
orth
, whi
ch e
qual
s to
$126
,797
,107
.
Not
e 4:
Fill
in th
e ye
ar-to
-dat
e m
axim
um o
utst
andi
ng b
alan
ce o
f end
orse
men
ts/g
uara
ntee
s pro
vide
d as
of t
he re
porti
ng p
erio
d.
Not
e 6:
Fill
in th
e ac
tual
am
ount
of e
ndor
sem
ents
/gua
rant
ees u
sed
by th
e en
dors
ed/g
uara
ntee
d co
mpa
ny.
Not
e 7:
Fill
in ‘Y
’ for
thos
e ca
ses o
f pro
visi
on o
f end
orse
men
ts/g
uara
ntee
s by
liste
d pa
rent
com
pany
to su
bsid
iary
, pro
visi
on b
y su
bsid
iary
to li
sted
par
ent c
ompa
ny, a
nd p
rovi
sion
to th
e pa
rty in
Mai
nlan
d C
hina
.
Not
e 5:
Onc
e en
dors
emen
t/gua
rant
ee c
ontra
cts o
r pro
mis
sory
not
es a
re si
gned
/issu
ed b
y th
e en
dors
er/g
uara
ntor
com
pany
to th
e ba
nks,
the
endo
rser
/gua
rant
or c
ompa
ny b
ears
end
orse
men
t/gua
rant
ee li
abili
ties.
And
all
othe
r eve
nts i
nvol
ve e
ndor
sem
ents
and
gua
rant
ees s
houl
d be
incl
uded
in th
e ba
lanc
e of
out
stan
ding
end
orse
men
tsan
d gu
aran
tees
.
Prov
isio
n of
endo
rsem
ents
/gu
aran
tees
to th
epa
rty in
Mai
nlan
dC
hina
(Not
e 7)
Foot
note
Am
ount
of
endo
rsem
ents
/gu
aran
tees
secu
red
with
colla
tera
l
Rat
io o
fac
cum
ulat
eden
dors
emen
t/gu
aran
tee
amou
nt to
net
asse
t val
ue o
fth
e en
dors
er/
guar
anto
rco
mpa
ny
Cei
ling
on to
tal a
mou
ntof
end
orse
men
ts/
guar
ante
es p
rovi
ded
(Not
e 3)
Prov
isio
n of
endo
rsem
ents
/gu
aran
tees
by
pare
ntco
mpa
ny to
subs
idia
ry(N
ote
7)
Prov
isio
n of
endo
rsem
ents
/gu
aran
tees
by
subs
idia
ry to
par
ent
com
pany
(Not
e 7)
Out
stan
ding
endo
rsem
ent/
guar
ante
e am
ount
at D
ecem
ber 3
1,20
17(N
ote
5)
Act
ual a
mou
nt d
raw
ndo
wn
(Not
e 6)
Num
ber
(Not
e 1)
Endo
rser
/Gua
rant
or
Party
bei
ng e
ndor
sed/
guar
ante
ed
Lim
it on
end
orse
men
ts/
guar
ntee
s pro
vide
d fo
r asi
ngle
par
ty (N
ote
3)
Max
imum
out
stan
ding
endo
rsem
ent/
guar
ante
e am
ount
as o
fD
ecem
ber 3
1, 2
017
(Not
e 4)
Ever
gree
n M
arin
e C
orpo
ratio
n (T
aiw
an) L
td.
Prov
isio
n of
end
orse
men
ts a
nd g
uara
ntee
s to
othe
rs
For t
he y
ear e
nded
Dec
embe
r 31,
201
7
Tabl
e 2
Expr
esse
d in
thou
sand
s of N
TD
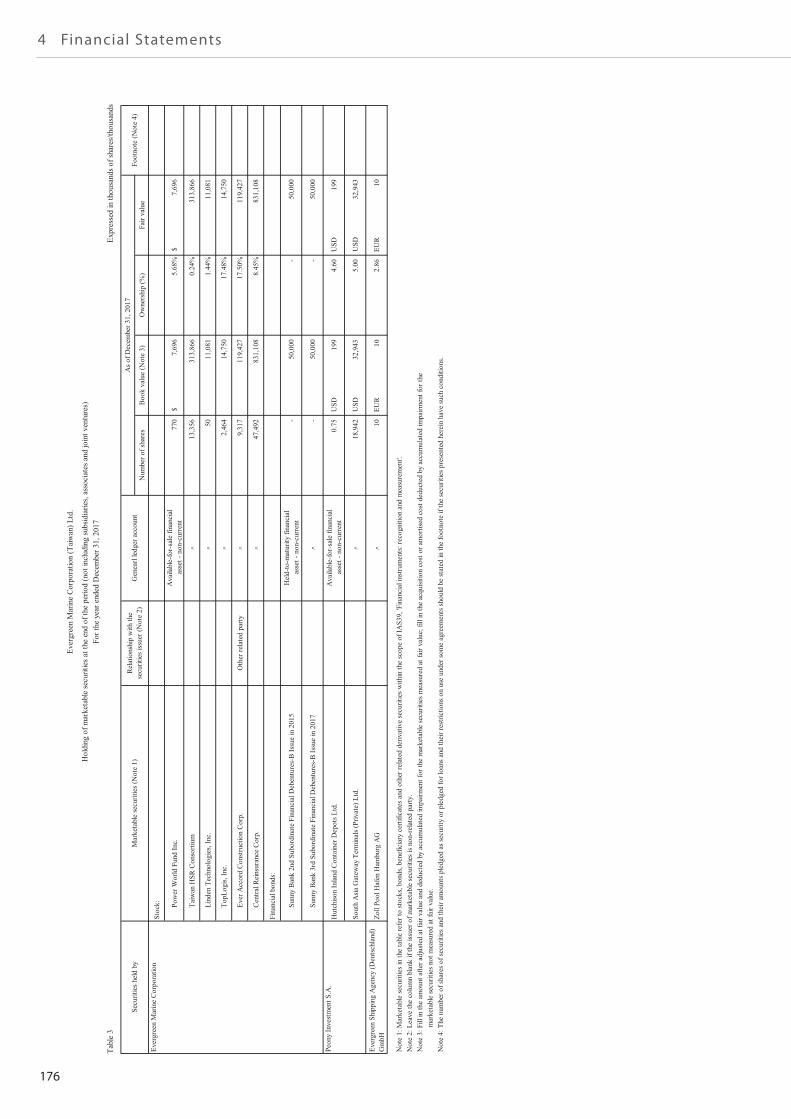
176
4 Financial Statements
Num
ber o
f sha
res
Boo
k va
lue
(Not
e 3)
Ow
ners
hip
(%)
Fair
valu
e
Stoc
k: Pow
er W
orld
Fun
d In
c.A
vaila
ble-
for-
sale
fina
ncia
l a
sset
- no
n-cu
rren
t77
0
7,69
6$
5.
68%
7,69
6$
Taiw
an H
SR C
onso
rtium
13,3
56
31
3,86
6
0.24
%31
3,86
6
Lind
en T
echn
olog
ies,
Inc.
50
11
,081
1.44
%11
,081
TopL
ogis,
Inc.
2,46
4
14
,750
17.4
8%14
,750
Ever
Acc
ord
Con
stru
ctio
n C
orp.
Oth
er re
late
d pa
rty9,
317
119,
427
17
.50%
119,
427
Cen
tral R
eins
uran
ce C
orp.
47,4
92
83
1,10
8
8.45
%83
1,10
8
Fina
ncia
l bon
ds:
Sunn
y B
ank
2nd
Subo
rdin
ate
Fina
ncia
l Deb
entu
res-
B Is
sue
in 2
015
Hel
d-to
-mat
urity
fina
ncia
l a
sset
- no
n-cu
rren
t-
50
,000
-
50,0
00
Sunn
y B
ank
3rd
Subo
rdin
ate
Fina
ncia
l Deb
entu
res-
B Is
sue
in 2
017
-
50,0
00
-
50
,000
Hut
chiso
n In
land
Con
tain
er D
epot
s Ltd
.A
vaila
ble-
for-
sale
fina
ncia
l a
sset
- no
n-cu
rren
t0.
75
USD
199
4.60
USD
199
Sout
h A
sia G
atew
ay T
erm
inal
s (Pr
ivat
e) L
td.
18,9
42
U
SD
3
2,94
35.
00
USD
32,
943
Ever
gree
n Sh
ippi
ng A
genc
y (D
euts
chla
nd)
Gm
bHZo
ll Po
ol H
afen
Ham
burg
AG
10
EU
R
102.
86
EUR
10
Not
e 1:
Mar
keta
ble
secu
ritie
s in
the
tabl
e re
fer t
o st
ocks
, bon
ds, b
enef
icia
ry c
ertif
icat
es a
nd o
ther
rela
ted
deriv
ativ
e se
curit
ies w
ithin
the
scop
e of
IAS3
9, 'F
inan
cial
inst
rum
ents
: rec
ogni
tion
and
mea
sure
men
t'.N
ote
2: L
eave
the
colu
mn
blan
k if
the
issue
r of m
arke
tabl
e se
curit
ies i
s non
-rel
ated
par
ty.
Not
e 3:
Fill
in th
e am
ount
afte
r adj
uste
d at
fair
valu
e an
d de
duct
ed b
y ac
cum
ulat
ed im
pairm
ent f
or th
e m
arke
tabl
e se
curit
ies m
easu
red
at fa
ir va
lue;
fill
in th
e ac
quisi
tion
cost
or a
mor
tised
cos
t ded
ucte
d by
acc
umul
ated
impa
irmen
t for
the
mar
keta
ble
secu
ritie
s not
mea
sure
d at
fair
valu
e.N
ote
4: T
he n
umbe
r of s
hare
s of s
ecur
ities
and
thei
r am
ount
s ple
dged
as s
ecur
ity o
r ple
dged
for l
oans
and
thei
r res
trict
ions
on
use
unde
r som
e ag
reem
ents
shou
ld b
e st
ated
in th
e fo
otno
te if
the
secu
ritie
s pre
sent
ed h
erei
n ha
ve su
ch c
ondi
tions
.
Peon
y In
vest
men
t S.A
.
Ever
gree
n M
arin
e C
orpo
ratio
n
Foot
note
(Not
e 4)
Secu
ritie
s hel
d by
Mar
keta
ble
secu
ritie
s (N
ote
1)R
elat
ions
hip
with
the
secu
ritie
s iss
uer (
Not
e 2)
Gen
earl
ledg
er a
ccou
ntA
s of D
ecem
ber 3
1, 2
017
(Exc
ept a
s oth
erw
ise in
dica
ted)
Ever
gree
n M
arin
e C
orpo
ratio
n (T
aiw
an) L
td.
Hol
ding
of m
arke
tabl
e se
curit
ies a
t the
end
of t
he p
erio
d (n
ot in
clud
ing
subs
idia
ries,
asso
ciat
es a
nd jo
int v
entu
res)
For t
he y
ear e
nded
Dec
embe
r 31,
201
7
Tabl
e 3
Expr
esse
d in
thou
sand
s of s
hare
s/tho
usan
ds
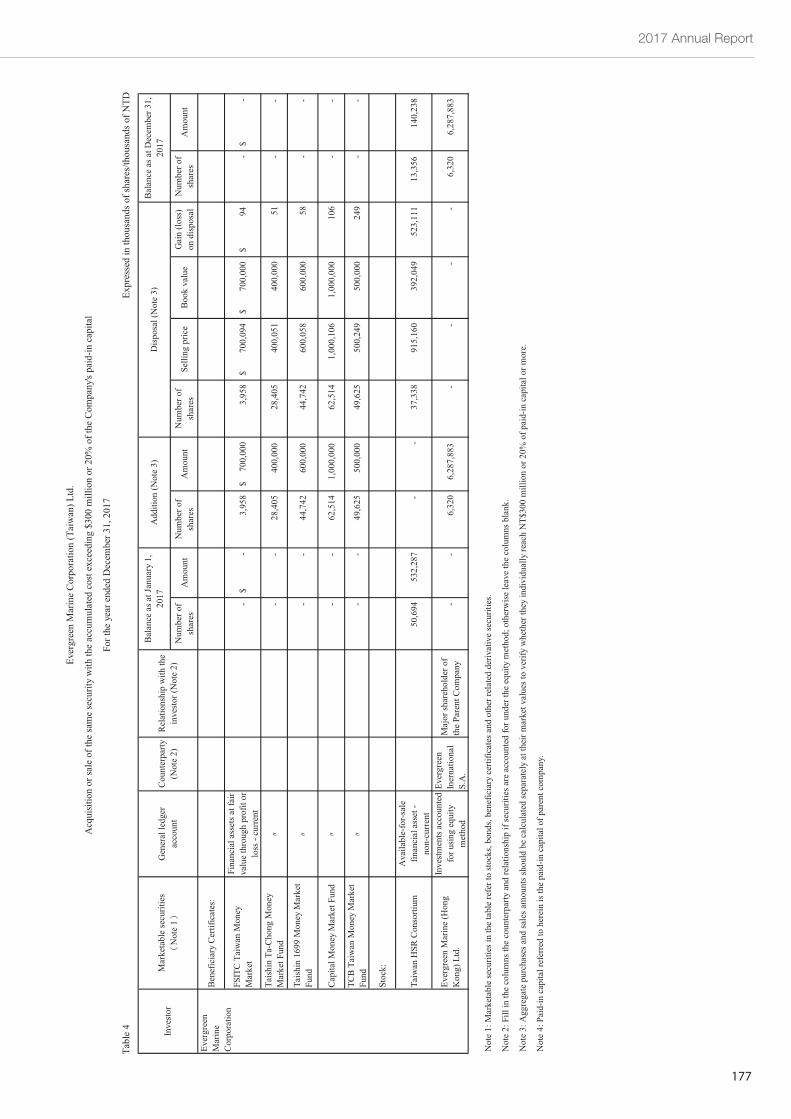
2017 Annual Report
177
Num
ber o
fsh
ares
Am
ount
Num
ber o
fsh
ares
Am
ount
Num
ber o
fsh
ares
Selli
ng p
rice
Boo
k va
lue
Gai
n (lo
ss)
on d
ispo
sal
Num
ber o
fsh
ares
Am
ount
Ben
efic
iary
Cer
tific
ates
:
FSIT
C T
aiw
an M
oney
Mar
ket
Fina
ncia
l ass
ets a
t fai
rva
lue
thro
ugh
prof
it or
loss
- cu
rren
t
-
-$
3
,958
700,
000
$
3
,958
700,
094
$
700,
000
$
94$
-
-$
Tais
hin
Ta-C
hong
Mon
eyM
arke
t Fun
d
-
-
2
8,40
5
4
00,0
00
28,
405
4
00,0
51
400
,000
5
1
-
-
Tais
hin
1699
Mon
ey M
arke
tFu
nd
-
-
4
4,74
2
6
00,0
00
44,
742
6
00,0
58
600
,000
5
8
-
-
Cap
ital M
oney
Mar
ket F
und
-
-
62,
514
1
,000
,000
6
2,51
4
1
,000
,106
1,0
00,0
00
106
-
-
TCB
Tai
wan
Mon
ey M
arke
tFu
nd
-
-
4
9,62
5
5
00,0
00
49,
625
5
00,2
49
500
,000
24
9
-
-
Stoc
k:
Taiw
an H
SR C
onso
rtium
Ava
ilabl
e-fo
r-sa
lefin
anci
al a
sset
-no
n-cu
rren
t
50,6
94
53
2,28
7
-
-
37,
338
9
15,1
60
392
,049
523
,111
13,
356
14
0,23
8
Ever
gree
n M
arin
e (H
ong
Kon
g) L
td.
Inve
stm
ents
acc
ount
edfo
r usi
ng e
quity
met
hod
Ever
gree
nIn
erna
tiona
lS.
A.
Maj
or sh
areh
olde
r of
the
Pare
nt C
ompa
ny
-
-
6,3
20
6,2
87,8
83
-
-
-
-
6,3
20
6,
287,
883
Not
e 1:
Mar
keta
ble
secu
ritie
s in
the
tabl
e re
fer t
o st
ocks
, bon
ds, b
enef
icia
ry c
ertif
icat
es a
nd o
ther
rela
ted
deriv
ativ
e se
curit
ies.
Not
e 2:
Fill
in th
e co
lum
ns th
e co
unte
rpar
ty a
nd re
latio
nshi
p if
secu
ritie
s are
acc
ount
ed fo
r und
er th
e eq
uity
met
hod;
oth
erw
ise
leav
e th
e co
lum
ns b
lank
.
Not
e 3:
Agg
rega
te p
urch
ases
and
sale
s am
ount
s sho
uld
be c
alcu
late
d se
para
tely
at t
heir
mar
ket v
alue
s to
verif
y w
heth
er th
ey in
divi
dual
ly re
ach
NT$
300
mill
ion
or 2
0% o
f pai
d-in
cap
ital o
r mor
e.
Not
e 4:
Pai
d-in
cap
ital r
efer
red
to h
erei
n is
the
paid
-in c
apita
l of p
aren
t com
pany
.
For t
he y
ear e
nded
Dec
embe
r 31,
201
7
Tabl
e 4
Ever
gree
nM
arin
eC
orpo
ratio
n
Ever
gree
n M
arin
e C
orpo
ratio
n (T
aiw
an) L
td.
Expr
esse
d in
thou
sand
s of s
hare
s/th
ousa
nds o
f NTD
Add
ition
(Not
e 3)
Dis
posa
l (N
ote
3)B
alan
ce a
s at D
ecem
ber 3
1,20
17In
vest
orM
arke
tabl
e se
curit
ies
Not
e 1
Gen
eral
ledg
erac
coun
tC
ount
erpa
rty(N
ote
2)R
elat
ions
hip
with
the
inve
stor
(Not
e 2)
Bal
ance
as a
t Jan
uary
1,
2017
Acq
uisi
tion
or sa
le o
f the
sam
e se
curit
y w
ith th
e ac
cum
ulat
ed c
ost e
xcee
ding
$30
0 m
illio
n or
20%
of t
he C
ompa
ny's
paid
-in c
apita
l
Num
ber o
fsh
ares
Am
ount
Num
ber o
fsh
ares
Am
ount
Num
ber o
fsh
ares
Selli
ng p
rice
Boo
k va
lue
Gai
n (lo
ss)
on d
ispo
sal
Num
ber o
fsh
ares
Am
ount
Ben
efic
iary
Cer
tific
ates
:
FSIT
C T
aiw
an M
oney
Mar
ket
Fina
ncia
l ass
ets a
t fai
rva
lue
thro
ugh
prof
it or
loss
- cu
rren
t
-
-$
3
,958
700,
000
$
3
,958
700,
094
$
700,
000
$
94$
-
-$
Tais
hin
Ta-C
hong
Mon
eyM
arke
t Fun
d
-
-
2
8,40
5
4
00,0
00
28,
405
4
00,0
51
400
,000
5
1
-
-
Tais
hin
1699
Mon
ey M
arke
tFu
nd
-
-
4
4,74
2
6
00,0
00
44,
742
6
00,0
58
600
,000
5
8
-
-
Cap
ital M
oney
Mar
ket F
und
-
-
62,
514
1
,000
,000
6
2,51
4
1
,000
,106
1,0
00,0
00
106
-
-
TCB
Tai
wan
Mon
ey M
arke
tFu
nd
-
-
4
9,62
5
5
00,0
00
49,
625
5
00,2
49
500
,000
24
9
-
-
Stoc
k:
Taiw
an H
SR C
onso
rtium
Ava
ilabl
e-fo
r-sa
lefin
anci
al a
sset
-no
n-cu
rren
t
50,6
94
53
2,28
7
-
-
37,
338
9
15,1
60
392
,049
523
,111
13,
356
14
0,23
8
Ever
gree
n M
arin
e (H
ong
Kon
g) L
td.
Inve
stm
ents
acc
ount
edfo
r usi
ng e
quity
met
hod
Ever
gree
nIn
erna
tiona
lS.
A.
Maj
or sh
areh
olde
r of
the
Pare
nt C
ompa
ny
-
-
6,3
20
6,2
87,8
83
-
-
-
-
6,3
20
6,
287,
883
Not
e 1:
Mar
keta
ble
secu
ritie
s in
the
tabl
e re
fer t
o st
ocks
, bon
ds, b
enef
icia
ry c
ertif
icat
es a
nd o
ther
rela
ted
deriv
ativ
e se
curit
ies.
Not
e 2:
Fill
in th
e co
lum
ns th
e co
unte
rpar
ty a
nd re
latio
nshi
p if
secu
ritie
s are
acc
ount
ed fo
r und
er th
e eq
uity
met
hod;
oth
erw
ise
leav
e th
e co
lum
ns b
lank
.
Not
e 3:
Agg
rega
te p
urch
ases
and
sale
s am
ount
s sho
uld
be c
alcu
late
d se
para
tely
at t
heir
mar
ket v
alue
s to
verif
y w
heth
er th
ey in
divi
dual
ly re
ach
NT$
300
mill
ion
or 2
0% o
f pai
d-in
cap
ital o
r mor
e.
Not
e 4:
Pai
d-in
cap
ital r
efer
red
to h
erei
n is
the
paid
-in c
apita
l of p
aren
t com
pany
.
For t
he y
ear e
nded
Dec
embe
r 31,
201
7
Tabl
e 4
Ever
gree
nM
arin
eC
orpo
ratio
n
Ever
gree
n M
arin
e C
orpo
ratio
n (T
aiw
an) L
td.
Expr
esse
d in
thou
sand
s of s
hare
s/th
ousa
nds o
f NTD
Add
ition
(Not
e 3)
Dis
posa
l (N
ote
3)B
alan
ce a
s at D
ecem
ber 3
1,20
17In
vest
orM
arke
tabl
e se
curit
ies
Not
e 1
Gen
eral
ledg
erac
coun
tC
ount
erpa
rty(N
ote
2)R
elat
ions
hip
with
the
inve
stor
(Not
e 2)
Bal
ance
as a
t Jan
uary
1,
2017
Acq
uisi
tion
or sa
le o
f the
sam
e se
curit
y w
ith th
e ac
cum
ulat
ed c
ost e
xcee
ding
$30
0 m
illio
n or
20%
of t
he C
ompa
ny's
paid
-in c
apita
l
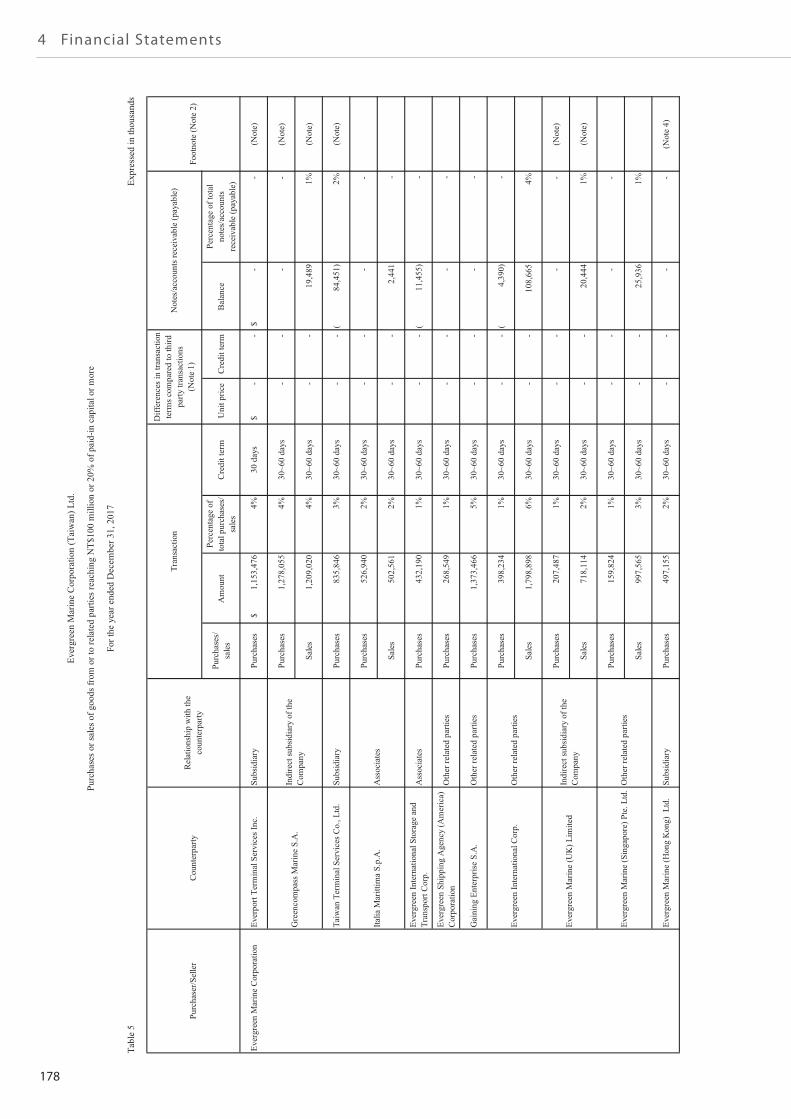
178
4 Financial Statements
Purc
hase
s/sa
les
Am
ount
Pe
rcen
tage
of
tota
l pur
chas
es/
sale
sC
redi
t ter
mU
nit p
rice
Cre
dit t
erm
Bal
ance
Pe
rcen
tage
of t
otal
note
s/ac
coun
tsre
ceiv
able
(pay
able
)
Ever
gree
n M
arin
e C
orpo
ratio
nEv
erpo
rt Te
rmin
al S
ervi
ces I
nc.
Subs
idia
ryPu
rcha
ses
$1,
153,
476
4%30
day
s $
-
-
$
-
-
(Not
e)
Purc
hase
s1,
278,
055
4%30
~60
days
-
-
-
-(N
ote)
Sale
s1,
209,
020
4%30
~60
days
-
-19
,489
1%(N
ote)
Taiw
an T
erm
inal
Ser
vice
s Co.
, Ltd
.Su
bsid
iary
Purc
hase
s83
5,84
63%
30~6
0 da
ys
-
-
(84
,451
)2%
(Not
e)
Purc
hase
s52
6,94
02%
30~6
0 da
ys
-
-
-
-
Sale
s50
2,56
12%
30~6
0 da
ys
-
-
2,44
1-
Ever
gree
n In
tern
atio
nal S
tora
ge a
ndTr
ansp
ort C
orp.
Ass
ocia
tes
Purc
hase
s43
2,19
01%
30~6
0 da
ys
-
-
(11
,455
)-
Ever
gree
n Sh
ippi
ng A
genc
y (A
mer
ica)
Cor
pora
tion
Oth
er re
late
d pa
rties
Purc
hase
s26
8,54
91%
30~6
0 da
ys
-
-
--
Gai
ning
Ent
erpr
ise
S.A
.O
ther
rela
ted
parti
esPu
rcha
ses
1,37
3,46
65%
30~6
0 da
ys
-
-
--
Purc
hase
s39
8,23
41%
30~6
0 da
ys
-
-
(4,
390)
-
Sale
s1,
798,
898
6%30
~60
days
-
-10
8,66
54%
Purc
hase
s20
7,48
71%
30~6
0 da
ys
-
-
-
-
(Not
e)
Sale
s71
8,11
42%
30~6
0 da
ys
-
-
20,4
441%
(Not
e)
Purc
hase
s15
9,82
41%
30~6
0 da
ys
-
-
-
-
Sale
s99
7,56
53%
30~6
0 da
ys
-
-
25,9
361%
Ever
gree
n M
arin
e (H
ong
Kon
g) L
td.
Subs
idia
ryPu
rcha
ses
497,
155
2%30
~60
days
-
-
-
-(N
ote
4)
Italia
Mar
ittim
a S.
p.A
.A
ssoc
iate
s
Gre
enco
mpa
ss M
arin
e S.
A.
Indi
rect
subs
idia
ry o
f the
Com
pany
Ever
gree
n M
arin
e C
orpo
ratio
n (T
aiw
an) L
td.
Purc
hase
s or s
ales
of g
oods
from
or t
o re
late
d pa
rties
reac
hing
NT$
100
mill
ion
or 2
0% o
f pai
d-in
cap
ital o
r mor
e
For t
he y
ear e
nded
Dec
embe
r 31,
201
7
Tabl
e 5
Foot
note
(Not
e 2)
Purc
hase
r/Sel
ler
Cou
nter
party
Rel
atio
nshi
p w
ith th
eco
unte
rpar
ty
Tran
sact
ion
Diff
eren
ces i
n tra
nsac
tion
term
s com
pare
d to
third
party
tran
sact
ions
(Not
e 1)
Not
es/a
ccou
nts r
ecei
vabl
e (p
ayab
le)
Ever
gree
n M
arin
e (U
K) L
imite
dIn
dire
ct su
bsid
iary
of t
heC
ompa
ny
Expr
esse
d in
thou
sand
s
Ever
gree
n M
arin
e (S
inga
pore
) Pte
. Ltd
.O
ther
rela
ted
parti
es
Ever
gree
n In
tern
atio
nal C
orp.
(Exc
ept a
s oth
erw
ise
indi
cate
d)
Oth
er re
late
d pa
rties
Purc
hase
s/sa
les
Am
ount
Pe
rcen
tage
of
tota
l pur
chas
es/
sale
sC
redi
t ter
mU
nit p
rice
Cre
dit t
erm
Bal
ance
Pe
rcen
tage
of t
otal
note
s/ac
coun
tsre
ceiv
able
(pay
able
)
Ever
gree
n M
arin
e C
orpo
ratio
nEv
erpo
rt Te
rmin
al S
ervi
ces I
nc.
Subs
idia
ryPu
rcha
ses
$1,
153,
476
4%30
day
s $
-
-
$
-
-
(Not
e)
Purc
hase
s1,
278,
055
4%30
~60
days
-
-
-
-(N
ote)
Sale
s1,
209,
020
4%30
~60
days
-
-19
,489
1%(N
ote)
Taiw
an T
erm
inal
Ser
vice
s Co.
, Ltd
.Su
bsid
iary
Purc
hase
s83
5,84
63%
30~6
0 da
ys
-
-
(84
,451
)2%
(Not
e)
Purc
hase
s52
6,94
02%
30~6
0 da
ys
-
-
-
-
Sale
s50
2,56
12%
30~6
0 da
ys
-
-
2,44
1-
Ever
gree
n In
tern
atio
nal S
tora
ge a
ndTr
ansp
ort C
orp.
Ass
ocia
tes
Purc
hase
s43
2,19
01%
30~6
0 da
ys
-
-
(11
,455
)-
Ever
gree
n Sh
ippi
ng A
genc
y (A
mer
ica)
Cor
pora
tion
Oth
er re
late
d pa
rties
Purc
hase
s26
8,54
91%
30~6
0 da
ys
-
-
--
Gai
ning
Ent
erpr
ise
S.A
.O
ther
rela
ted
parti
esPu
rcha
ses
1,37
3,46
65%
30~6
0 da
ys
-
-
--
Purc
hase
s39
8,23
41%
30~6
0 da
ys
-
-
(4,
390)
-
Sale
s1,
798,
898
6%30
~60
days
-
-10
8,66
54%
Purc
hase
s20
7,48
71%
30~6
0 da
ys
-
-
-
-
(Not
e)
Sale
s71
8,11
42%
30~6
0 da
ys
-
-
20,4
441%
(Not
e)
Purc
hase
s15
9,82
41%
30~6
0 da
ys
-
-
-
-
Sale
s99
7,56
53%
30~6
0 da
ys
-
-
25,9
361%
Ever
gree
n M
arin
e (H
ong
Kon
g) L
td.
Subs
idia
ryPu
rcha
ses
497,
155
2%30
~60
days
-
-
-
-(N
ote
4)
Italia
Mar
ittim
a S.
p.A
.A
ssoc
iate
s
Gre
enco
mpa
ss M
arin
e S.
A.
Indi
rect
subs
idia
ry o
f the
Com
pany
Ever
gree
n M
arin
e C
orpo
ratio
n (T
aiw
an) L
td.
Purc
hase
s or s
ales
of g
oods
from
or t
o re
late
d pa
rties
reac
hing
NT$
100
mill
ion
or 2
0% o
f pai
d-in
cap
ital o
r mor
e
For t
he y
ear e
nded
Dec
embe
r 31,
201
7
Tabl
e 5
Foot
note
(Not
e 2)
Purc
hase
r/Sel
ler
Cou
nter
party
Rel
atio
nshi
p w
ith th
eco
unte
rpar
ty
Tran
sact
ion
Diff
eren
ces i
n tra
nsac
tion
term
s com
pare
d to
third
party
tran
sact
ions
(Not
e 1)
Not
es/a
ccou
nts r
ecei
vabl
e (p
ayab
le)
Ever
gree
n M
arin
e (U
K) L
imite
dIn
dire
ct su
bsid
iary
of t
heC
ompa
ny
Expr
esse
d in
thou
sand
s
Ever
gree
n M
arin
e (S
inga
pore
) Pte
. Ltd
.O
ther
rela
ted
parti
es
Ever
gree
n In
tern
atio
nal C
orp.
(Exc
ept a
s oth
erw
ise
indi
cate
d)
Oth
er re
late
d pa
rtiesPu
rcha
ses/
sale
sA
mou
nt
Perc
enta
ge o
fto
tal p
urch
ases
/sa
les
Cre
dit t
erm
Uni
t pric
eC
redi
t ter
mB
alan
ce
Perc
enta
ge o
f tot
alno
tes/
acco
unts
rece
ivab
le (p
ayab
le)
Ever
gree
n M
arin
e C
orpo
ratio
nEv
erpo
rt Te
rmin
al S
ervi
ces I
nc.
Subs
idia
ryPu
rcha
ses
$1,
153,
476
4%30
day
s $
-
-
$
-
-
(Not
e)
Purc
hase
s1,
278,
055
4%30
~60
days
-
-
-
-(N
ote)
Sale
s1,
209,
020
4%30
~60
days
-
-19
,489
1%(N
ote)
Taiw
an T
erm
inal
Ser
vice
s Co.
, Ltd
.Su
bsid
iary
Purc
hase
s83
5,84
63%
30~6
0 da
ys
-
-
(84
,451
)2%
(Not
e)
Purc
hase
s52
6,94
02%
30~6
0 da
ys
-
-
-
-
Sale
s50
2,56
12%
30~6
0 da
ys
-
-
2,44
1-
Ever
gree
n In
tern
atio
nal S
tora
ge a
ndTr
ansp
ort C
orp.
Ass
ocia
tes
Purc
hase
s43
2,19
01%
30~6
0 da
ys
-
-
(11
,455
)-
Ever
gree
n Sh
ippi
ng A
genc
y (A
mer
ica)
Cor
pora
tion
Oth
er re
late
d pa
rties
Purc
hase
s26
8,54
91%
30~6
0 da
ys
-
-
--
Gai
ning
Ent
erpr
ise
S.A
.O
ther
rela
ted
parti
esPu
rcha
ses
1,37
3,46
65%
30~6
0 da
ys
-
-
--
Purc
hase
s39
8,23
41%
30~6
0 da
ys
-
-
(4,
390)
-
Sale
s1,
798,
898
6%30
~60
days
-
-10
8,66
54%
Purc
hase
s20
7,48
71%
30~6
0 da
ys
-
-
-
-
(Not
e)
Sale
s71
8,11
42%
30~6
0 da
ys
-
-
20,4
441%
(Not
e)
Purc
hase
s15
9,82
41%
30~6
0 da
ys
-
-
-
-
Sale
s99
7,56
53%
30~6
0 da
ys
-
-
25,9
361%
Ever
gree
n M
arin
e (H
ong
Kon
g) L
td.
Subs
idia
ryPu
rcha
ses
497,
155
2%30
~60
days
-
-
-
-(N
ote
4)
Italia
Mar
ittim
a S.
p.A
.A
ssoc
iate
s
Gre
enco
mpa
ss M
arin
e S.
A.
Indi
rect
subs
idia
ry o
f the
Com
pany
Ever
gree
n M
arin
e C
orpo
ratio
n (T
aiw
an) L
td.
Purc
hase
s or s
ales
of g
oods
from
or t
o re
late
d pa
rties
reac
hing
NT$
100
mill
ion
or 2
0% o
f pai
d-in
cap
ital o
r mor
e
For t
he y
ear e
nded
Dec
embe
r 31,
201
7
Tabl
e 5
Foot
note
(Not
e 2)
Purc
hase
r/Sel
ler
Cou
nter
party
Rel
atio
nshi
p w
ith th
eco
unte
rpar
ty
Tran
sact
ion
Diff
eren
ces i
n tra
nsac
tion
term
s com
pare
d to
third
party
tran
sact
ions
(Not
e 1)
Not
es/a
ccou
nts r
ecei
vabl
e (p
ayab
le)
Ever
gree
n M
arin
e (U
K) L
imite
dIn
dire
ct su
bsid
iary
of t
heC
ompa
ny
Expr
esse
d in
thou
sand
s
Ever
gree
n M
arin
e (S
inga
pore
) Pte
. Ltd
.O
ther
rela
ted
parti
es
Ever
gree
n In
tern
atio
nal C
orp.
(Exc
ept a
s oth
erw
ise
indi
cate
d)
Oth
er re
late
d pa
rties
Purc
hase
s/sa
les
Am
ount
Pe
rcen
tage
of
tota
l pur
chas
es/
sale
sC
redi
t ter
mU
nit p
rice
Cre
dit t
erm
Bal
ance
Pe
rcen
tage
of t
otal
note
s/ac
coun
tsre
ceiv
able
(pay
able
)
Ever
gree
n M
arin
e C
orpo
ratio
nEv
erpo
rt Te
rmin
al S
ervi
ces I
nc.
Subs
idia
ryPu
rcha
ses
$1,
153,
476
4%30
day
s $
-
-
$
-
-
(Not
e)
Purc
hase
s1,
278,
055
4%30
~60
days
-
-
-
-(N
ote)
Sale
s1,
209,
020
4%30
~60
days
-
-19
,489
1%(N
ote)
Taiw
an T
erm
inal
Ser
vice
s Co.
, Ltd
.Su
bsid
iary
Purc
hase
s83
5,84
63%
30~6
0 da
ys
-
-
(84
,451
)2%
(Not
e)
Purc
hase
s52
6,94
02%
30~6
0 da
ys
-
-
-
-
Sale
s50
2,56
12%
30~6
0 da
ys
-
-
2,44
1-
Ever
gree
n In
tern
atio
nal S
tora
ge a
ndTr
ansp
ort C
orp.
Ass
ocia
tes
Purc
hase
s43
2,19
01%
30~6
0 da
ys
-
-
(11
,455
)-
Ever
gree
n Sh
ippi
ng A
genc
y (A
mer
ica)
Cor
pora
tion
Oth
er re
late
d pa
rties
Purc
hase
s26
8,54
91%
30~6
0 da
ys
-
-
--
Gai
ning
Ent
erpr
ise
S.A
.O
ther
rela
ted
parti
esPu
rcha
ses
1,37
3,46
65%
30~6
0 da
ys
-
-
--
Purc
hase
s39
8,23
41%
30~6
0 da
ys
-
-
(4,
390)
-
Sale
s1,
798,
898
6%30
~60
days
-
-10
8,66
54%
Purc
hase
s20
7,48
71%
30~6
0 da
ys
-
-
-
-
(Not
e)
Sale
s71
8,11
42%
30~6
0 da
ys
-
-
20,4
441%
(Not
e)
Purc
hase
s15
9,82
41%
30~6
0 da
ys
-
-
-
-
Sale
s99
7,56
53%
30~6
0 da
ys
-
-
25,9
361%
Ever
gree
n M
arin
e (H
ong
Kon
g) L
td.
Subs
idia
ryPu
rcha
ses
497,
155
2%30
~60
days
-
-
-
-(N
ote
4)
Italia
Mar
ittim
a S.
p.A
.A
ssoc
iate
s
Gre
enco
mpa
ss M
arin
e S.
A.
Indi
rect
subs
idia
ry o
f the
Com
pany
Ever
gree
n M
arin
e C
orpo
ratio
n (T
aiw
an) L
td.
Purc
hase
s or s
ales
of g
oods
from
or t
o re
late
d pa
rties
reac
hing
NT$
100
mill
ion
or 2
0% o
f pai
d-in
cap
ital o
r mor
e
For t
he y
ear e
nded
Dec
embe
r 31,
201
7
Tabl
e 5
Foot
note
(Not
e 2)
Purc
hase
r/Sel
ler
Cou
nter
party
Rel
atio
nshi
p w
ith th
eco
unte
rpar
ty
Tran
sact
ion
Diff
eren
ces i
n tra
nsac
tion
term
s com
pare
d to
third
party
tran
sact
ions
(Not
e 1)
Not
es/a
ccou
nts r
ecei
vabl
e (p
ayab
le)
Ever
gree
n M
arin
e (U
K) L
imite
dIn
dire
ct su
bsid
iary
of t
heC
ompa
ny
Expr
esse
d in
thou
sand
s
Ever
gree
n M
arin
e (S
inga
pore
) Pte
. Ltd
.O
ther
rela
ted
parti
es
Ever
gree
n In
tern
atio
nal C
orp.
(Exc
ept a
s oth
erw
ise
indi
cate
d)
Oth
er re
late
d pa
rties
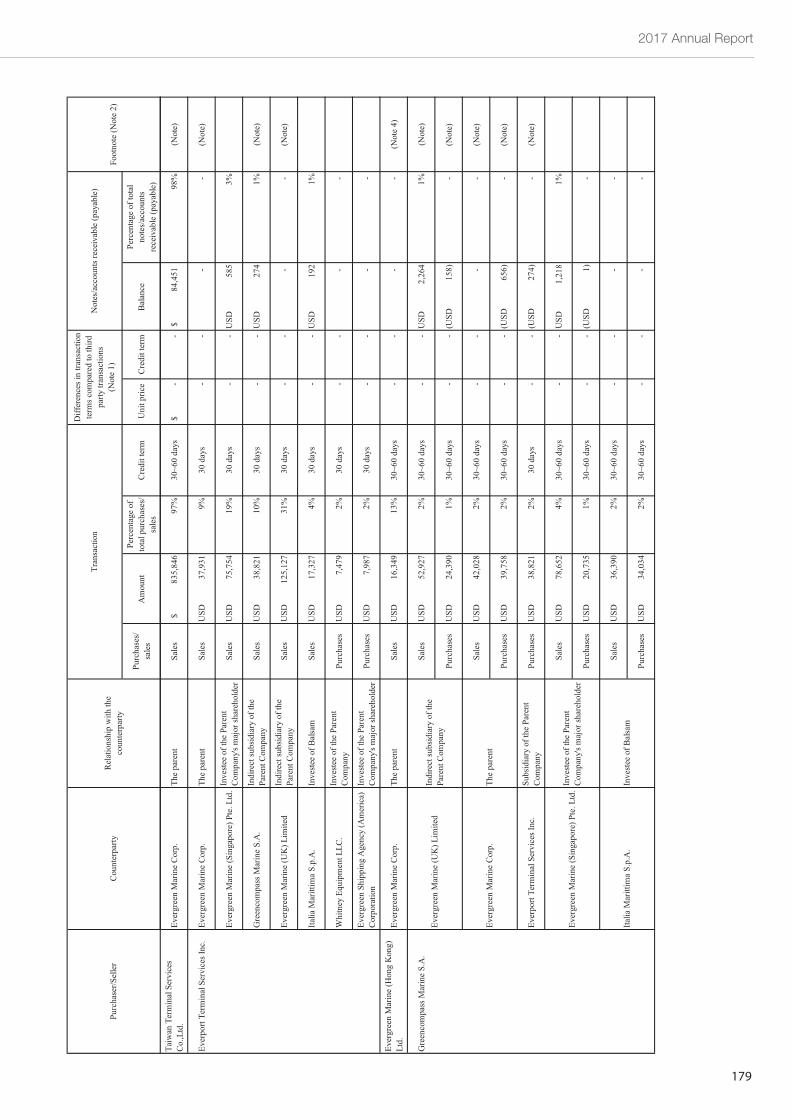
2017 Annual Report
179
Purc
hase
s/sa
les
Am
ount
Pe
rcen
tage
of
tota
l pur
chas
es/
sale
sC
redi
t ter
mU
nit p
rice
Cre
dit t
erm
Bal
ance
Pe
rcen
tage
of t
otal
note
s/ac
coun
tsre
ceiv
able
(pay
able
)
Foot
note
(Not
e 2)
Purc
hase
r/Sel
ler
Cou
nter
party
Rel
atio
nshi
p w
ith th
eco
unte
rpar
ty
Tran
sact
ion
Diff
eren
ces i
n tra
nsac
tion
term
s com
pare
d to
third
party
tran
sact
ions
(Not
e 1)
Not
es/a
ccou
nts r
ecei
vabl
e (p
ayab
le)
Taiw
an T
erm
inal
Ser
vice
sC
o.,L
td.
Ever
gree
n M
arin
e C
orp.
The
pare
ntSa
les
$83
5,84
697
%30
~60
days
$
-
- $
84,
451
98%
(Not
e)
Ever
port
Term
inal
Ser
vice
s Inc
.Ev
ergr
een
Mar
ine
Cor
p.Th
e pa
rent
Sale
sU
SD37
,931
9%30
day
s
-
-
-
-
(Not
e)
Ever
gree
n M
arin
e (S
inga
pore
) Pte
. Ltd
.In
vest
ee o
f the
Par
ent
Com
pany
's m
ajor
shar
ehol
der
Sale
sU
SD75
,754
19%
30 d
ays
-
-U
SD58
53%
Gre
enco
mpa
ss M
arin
e S.
A.
Indi
rect
subs
idia
ry o
f the
Pare
nt C
ompa
nySa
les
USD
38,8
2110
%30
day
s
-
-
USD
274
1%(N
ote)
Ever
gree
n M
arin
e (U
K) L
imite
dIn
dire
ct su
bsid
iary
of t
hePa
rent
Com
pany
Sale
sU
SD12
5,12
731
%30
day
s
-
-
-
-
(Not
e)
Italia
Mar
ittim
a S.
p.A
.In
vest
ee o
f Bal
sam
Sale
sU
SD17
,327
4%30
day
s
-
-
USD
192
1%
Whi
tney
Equ
ipm
ent L
LC.
Inve
stee
of t
he P
aren
tC
ompa
nyPu
rcha
ses
USD
7,47
92%
30 d
ays
-
-
-
-
Ever
gree
n Sh
ippi
ng A
genc
y (A
mer
ica)
Cor
pora
tion
Inve
stee
of t
he P
aren
tC
ompa
ny's
maj
or sh
areh
olde
rPu
rcha
ses
USD
7,98
72%
30 d
ays
-
-
-
-
Ever
gree
n M
arin
e (H
ong
Kon
g)Lt
d.Ev
ergr
een
Mar
ine
Cor
p.Th
e pa
rent
Sale
sU
SD16
,349
13%
30~6
0 da
ys
-
-
-
-
(Not
e 4)
Gre
enco
mpa
ss M
arin
e S.
A.
Sale
sU
SD52
,927
2%30
~60
days
-
-U
SD2,
264
1%(N
ote)
Purc
hase
sU
SD24
,390
1%30
~60
days
-
-(U
SD15
8)
-
(Not
e)
Sale
sU
SD42
,028
2%30
~60
days
-
-
-
-(N
ote)
Purc
hase
sU
SD39
,758
2%30
~60
days
-
-(U
SD65
6)
-
(Not
e)
Ever
port
Term
inal
Ser
vice
s Inc
.Su
bsid
iary
of t
he P
aren
tC
ompa
nyPu
rcha
ses
USD
38,8
212%
30 d
ays
-
-(U
SD27
4)
-
(Not
e)
Sale
sU
SD78
,652
4%30
~60
days
-
-U
SD1,
218
1%
Purc
hase
sU
SD20
,735
1%30
~60
days
-
-(U
SD1)
-
Sale
sU
SD36
,390
2%30
~60
days
-
-
-
-
Purc
hase
sU
SD34
,034
2%30
~60
days
-
-
-
-
Inve
stee
of B
alsa
mIta
lia M
aritt
ima
S.p.
A.
Ever
gree
n M
arin
e (U
K) L
imite
dIn
dire
ct su
bsid
iary
of t
hePa
rent
Com
pany
Ever
gree
n M
arin
e C
orp.
The
pare
nt
Ever
gree
n M
arin
e (S
inga
pore
) Pte
. Ltd
.In
vest
ee o
f the
Par
ent
Com
pany
's m
ajor
shar
ehol
der
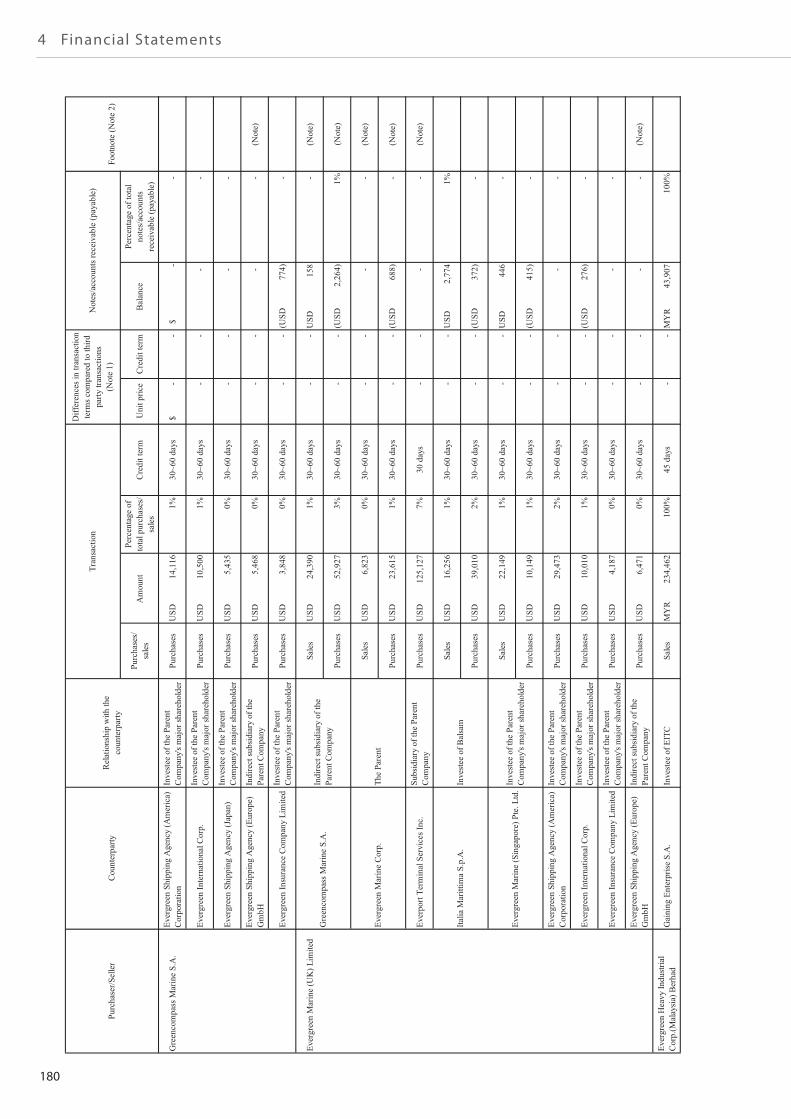
180
4 Financial Statements
Purc
hase
s/sa
les
Am
ount
Pe
rcen
tage
of
tota
l pur
chas
es/
sale
sC
redi
t ter
mU
nit p
rice
Cre
dit t
erm
Bal
ance
Pe
rcen
tage
of t
otal
note
s/ac
coun
tsre
ceiv
able
(pay
able
)
Foot
note
(Not
e 2)
Purc
hase
r/Sel
ler
Cou
nter
party
Rel
atio
nshi
p w
ith th
eco
unte
rpar
ty
Tran
sact
ion
Diff
eren
ces i
n tra
nsac
tion
term
s com
pare
d to
third
party
tran
sact
ions
(Not
e 1)
Not
es/a
ccou
nts r
ecei
vabl
e (p
ayab
le)
Gre
enco
mpa
ss M
arin
e S.
A.
Ever
gree
n Sh
ippi
ng A
genc
y (A
mer
ica)
Cor
pora
tion
Inve
stee
of t
he P
aren
tC
ompa
ny's
maj
or sh
areh
olde
rPu
rcha
ses
USD
14,1
161%
30~6
0 da
ys $
-
-
$-
-
Ever
gree
n In
tern
atio
nal C
orp.
Inve
stee
of t
he P
aren
tC
ompa
ny's
maj
or sh
areh
olde
rPu
rcha
ses
USD
10,5
001%
30~6
0 da
ys
-
-
-
-
Ever
gree
n Sh
ippi
ng A
genc
y (J
apan
)In
vest
ee o
f the
Par
ent
Com
pany
's m
ajor
shar
ehol
der
Purc
hase
sU
SD5,
435
0%30
~60
days
-
-
-
-
Ever
gree
n Sh
ippi
ng A
genc
y (E
urop
e)G
mbH
Indi
rect
subs
idia
ry o
f the
Pare
nt C
ompa
nyPu
rcha
ses
USD
5,46
80%
30~6
0 da
ys
-
-
-
-
(Not
e)
Ever
gree
n In
sura
nce
Com
pany
Lim
ited
Inve
stee
of t
he P
aren
tC
ompa
ny's
maj
or sh
areh
olde
rPu
rcha
ses
USD
3,84
80%
30~6
0 da
ys
-
-
(USD
774)
-
Ever
gree
n M
arin
e (U
K) L
imite
dSa
les
USD
24,3
901%
30~6
0 da
ys
-
-
USD
158
-(N
ote)
Purc
hase
sU
SD52
,927
3%30
~60
days
-
-(U
SD2,
264)
1%(N
ote)
Sale
sU
SD6,
823
0%30
~60
days
-
-
-
-(N
ote)
Purc
hase
sU
SD23
,615
1%30
~60
days
-
-(U
SD68
8)
-
(Not
e)
Ever
port
Term
inal
Ser
vice
s Inc
.Su
bsid
iary
of t
he P
aren
tC
ompa
nyPu
rcha
ses
USD
125,
127
7%30
day
s
-
-
-
-
(Not
e)
Sale
sU
SD16
,256
1%30
~60
days
-
-U
SD2,
774
1%
Purc
hase
sU
SD39
,010
2%30
~60
days
-
-(U
SD37
2)
-
Sale
sU
SD22
,149
1%30
~60
days
-
-U
SD44
6
-
Purc
hase
sU
SD10
,149
1%30
~60
days
-
-(U
SD41
5)
-
Ever
gree
n Sh
ippi
ng A
genc
y (A
mer
ica)
Cor
pora
tion
Inve
stee
of t
he P
aren
tC
ompa
ny's
maj
or sh
areh
olde
rPu
rcha
ses
USD
29,4
732%
30~6
0 da
ys
-
-
-
-
Ever
gree
n In
tern
atio
nal C
orp.
Inve
stee
of t
he P
aren
tC
ompa
ny's
maj
or sh
areh
olde
rPu
rcha
ses
USD
10,0
101%
30~6
0 da
ys
-
-
(USD
276)
-
Ever
gree
n In
sura
nce
Com
pany
Lim
ited
Inve
stee
of t
he P
aren
tC
ompa
ny's
maj
or sh
areh
olde
rPu
rcha
ses
USD
4,18
70%
30~6
0 da
ys
-
-
-
-
Ever
gree
n Sh
ippi
ng A
genc
y (E
urop
e)G
mbH
Indi
rect
subs
idia
ry o
f the
Pare
nt C
ompa
nyPu
rcha
ses
USD
6,47
10%
30~6
0 da
ys
-
-
-
-
(Not
e)
Ever
gree
n H
eavy
Indu
stria
lC
orp.
(Mal
aysi
a) B
erha
dG
aini
ng E
nter
pris
e S.
A.
Inve
stee
of E
ITC
Sale
sM
YR
234,
462
100%
45 d
ays
-
-M
YR
43,9
0710
0%
Gre
enco
mpa
ss M
arin
e S.
A.
Indi
rect
subs
idia
ry o
f the
Pare
nt C
ompa
ny
Italia
Mar
ittim
a S.
p.A
.In
vest
ee o
f Bal
sam
Ever
gree
n M
arin
e (S
inga
pore
) Pte
. Ltd
.In
vest
ee o
f the
Par
ent
Com
pany
's m
ajor
shar
ehol
der
Ever
gree
n M
arin
e C
orp.
The
Pare
nt
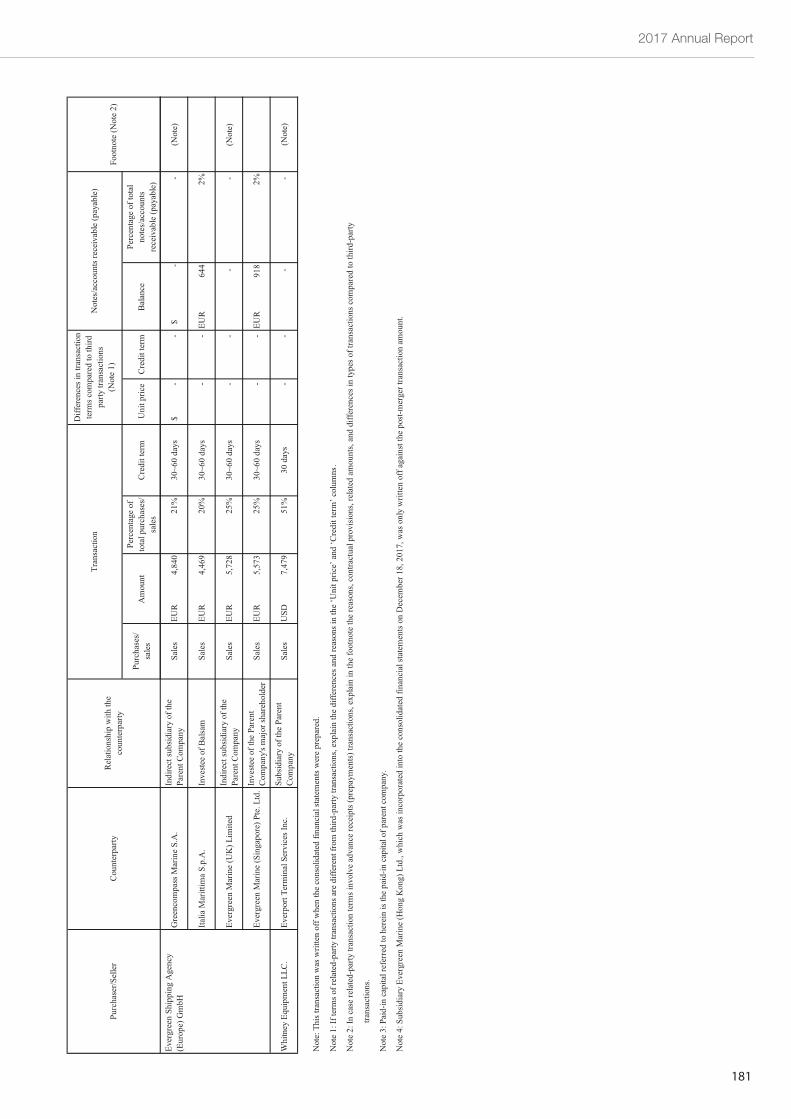
2017 Annual Report
181
Purc
hase
s/sa
les
Am
ount
Pe
rcen
tage
of
tota
l pur
chas
es/
sale
sC
redi
t ter
mU
nit p
rice
Cre
dit t
erm
Bal
ance
Pe
rcen
tage
of t
otal
note
s/ac
coun
tsre
ceiv
able
(pay
able
)
Foot
note
(Not
e 2)
Purc
hase
r/Sel
ler
Cou
nter
party
Rel
atio
nshi
p w
ith th
eco
unte
rpar
ty
Tran
sact
ion
Diff
eren
ces i
n tra
nsac
tion
term
s com
pare
d to
third
party
tran
sact
ions
(Not
e 1)
Not
es/a
ccou
nts r
ecei
vabl
e (p
ayab
le)
Ever
gree
n Sh
ippi
ng A
genc
y(E
urop
e) G
mbH
Gre
enco
mpa
ss M
arin
e S.
A.
Indi
rect
subs
idia
ry o
f the
Pare
nt C
ompa
nySa
les
EUR
4,84
021
%30
~60
days
$
-
-$
-
-
(Not
e)
Italia
Mar
ittim
a S.
p.A
.In
vest
ee o
f Bal
sam
Sale
sEU
R4,
469
20%
30~6
0 da
ys
-
-
EUR
644
2%
Ever
gree
n M
arin
e (U
K) L
imite
dIn
dire
ct su
bsid
iary
of t
hePa
rent
Com
pany
Sale
sEU
R5,
728
25%
30~6
0 da
ys
-
-
-
-
(Not
e)
Ever
gree
n M
arin
e (S
inga
pore
) Pte
. Ltd
.In
vest
ee o
f the
Par
ent
Com
pany
's m
ajor
shar
ehol
der
Sale
sEU
R5,
573
25%
30~6
0 da
ys
-
-
EUR
918
2%
Whi
tney
Equ
ipm
ent L
LC.
Ever
port
Term
inal
Ser
vice
s Inc
.Su
bsid
iary
of t
he P
aren
tC
ompa
nySa
les
USD
7,47
951
%30
day
s
-
-
-
-
(Not
e)
Not
e 1:
If te
rms o
f rel
ated
-par
ty tr
ansa
ctio
ns a
re d
iffer
ent f
rom
third
-par
ty tr
ansa
ctio
ns, e
xpla
in th
e di
ffere
nces
and
reas
ons i
n th
e ‘U
nit p
rice’
and
‘Cre
dit t
erm
’ col
umns
.
Not
e 2:
In c
ase
rela
ted-
party
tran
sact
ion
term
s inv
olve
adv
ance
rece
ipts
(pre
paym
ents)
tran
sact
ions
, exp
lain
in th
e fo
otno
te th
e re
ason
s, co
ntra
ctua
l pro
visi
ons,
rela
ted
amou
nts,
and
diffe
renc
es in
type
s of t
rans
actio
ns c
ompa
red
to th
ird-p
arty
tran
sact
ions
.
Not
e 3:
Pai
d-in
cap
ital r
efer
red
to h
erei
n is
the
paid
-in c
apita
l of p
aren
t com
pany
.
Not
e 4:
Sub
sidi
ary
Ever
gree
n M
arin
e (H
ong
Kon
g) L
td.,
whi
ch w
as in
corp
orat
ed in
to th
e co
nsol
idat
ed fi
nanc
ial s
tate
men
ts on
Dec
embe
r 18,
201
7, w
as o
nly
writ
ten
off a
gain
st th
e po
st-m
erge
r tra
nsac
tion
amou
nt.
Not
e: T
his t
rans
actio
n w
as w
ritte
n of
f whe
n th
e co
nsol
idat
ed fi
nanc
ial s
tate
men
ts w
ere
prep
ared
.
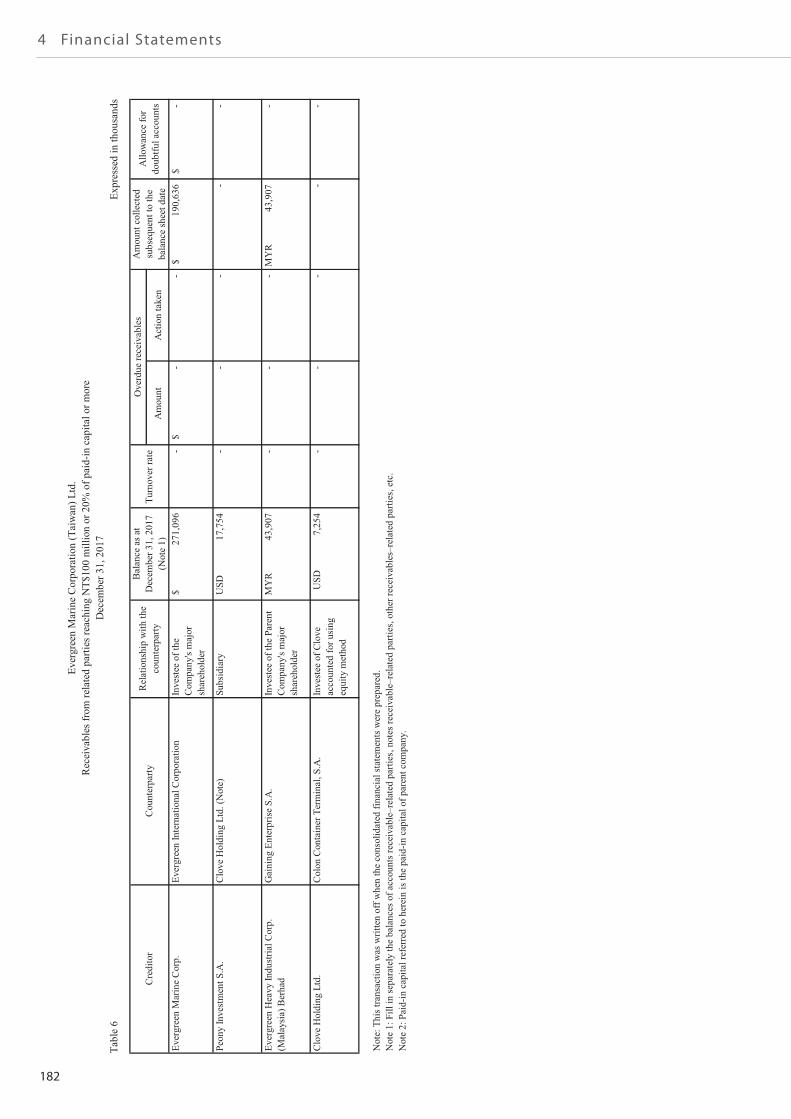
182
4 Financial Statements
Tabl
e 6
Expr
esse
d in
thou
sand
s(E
xcep
t as o
ther
wis
e in
dica
ted)
Am
ount
A
ctio
n ta
ken
Ever
gree
n M
arin
e C
orp.
Ever
gree
n In
tern
atio
nal C
orpo
ratio
nIn
vest
ee o
f the
Com
pany
's m
ajor
shar
ehol
der
271,
096
$
-
-
$
-
190,
636
$
-
$
Peon
y In
vest
men
t S.A
.C
love
Hol
ding
Ltd
. (N
ote)
Subs
idia
ryU
SD
1
7,75
4-
-
-
-
-
Ever
gree
n H
eavy
Indu
stria
l Cor
p.(M
alay
sia)
Ber
had
Gai
ning
Ent
erpr
ise
S.A
.In
vest
ee o
f the
Par
ent
Com
pany
's m
ajor
shar
ehol
der
MY
R
4
3,90
7-
-
-
MY
R
4
3,90
7-
Clo
ve H
oldi
ng L
td.
Col
on C
onta
iner
Ter
min
al, S
.A.
Inve
stee
of C
love
acco
unte
d fo
r usi
ngeq
uity
met
hod
USD
7,2
54-
-
-
-
-
Not
e: T
his t
rans
actio
n w
as w
ritte
n of
f whe
n th
e co
nsol
idat
ed fi
nanc
ial s
tate
men
ts w
ere
prep
ared
.N
ote
1: F
ill in
sepa
rate
ly th
e ba
lanc
es o
f acc
ount
s rec
eiva
ble–
rela
ted
parti
es, n
otes
rece
ivab
le–r
elat
ed p
artie
s, ot
her r
ecei
vabl
es–r
elat
ed p
artie
s, e
tc.
Not
e 2:
Pai
d-in
cap
ital r
efer
red
to h
erei
n is
the
paid
-in c
apita
l of p
aren
t com
pany
.
Am
ount
col
lect
edsu
bseq
uent
to th
eba
lanc
e sh
eet d
ate
Allo
wan
ce fo
rdo
ubtfu
l acc
ount
sC
redi
tor
Cou
nter
party
Rel
atio
nshi
p w
ith th
eco
unte
rpar
ty
Bal
ance
as a
tD
ecem
ber 3
1, 2
017
(Not
e 1)
Turn
over
rate
O
verd
ue re
ceiv
able
s
Ever
gree
n M
arin
e C
orpo
ratio
n (T
aiw
an) L
td.
Rec
eiva
bles
from
rela
ted
parti
es re
achi
ng N
T$10
0 m
illio
n or
20%
of p
aid-
in c
apita
l or m
ore
Dec
embe
r 31,
201
7Ta
ble
6Ex
pres
sed
in th
ousa
nds
(Exc
ept a
s oth
erw
ise
indi
cate
d)
Am
ount
A
ctio
n ta
ken
Ever
gree
n M
arin
e C
orp.
Ever
gree
n In
tern
atio
nal C
orpo
ratio
nIn
vest
ee o
f the
Com
pany
's m
ajor
shar
ehol
der
271,
096
$
-
-
$
-
190,
636
$
-
$
Peon
y In
vest
men
t S.A
.C
love
Hol
ding
Ltd
. (N
ote)
Subs
idia
ryU
SD
1
7,75
4-
-
-
-
-
Ever
gree
n H
eavy
Indu
stria
l Cor
p.(M
alay
sia)
Ber
had
Gai
ning
Ent
erpr
ise
S.A
.In
vest
ee o
f the
Par
ent
Com
pany
's m
ajor
shar
ehol
der
MY
R
4
3,90
7-
-
-
MY
R
4
3,90
7-
Clo
ve H
oldi
ng L
td.
Col
on C
onta
iner
Ter
min
al, S
.A.
Inve
stee
of C
love
acco
unte
d fo
r usi
ngeq
uity
met
hod
USD
7,2
54-
-
-
-
-
Not
e: T
his t
rans
actio
n w
as w
ritte
n of
f whe
n th
e co
nsol
idat
ed fi
nanc
ial s
tate
men
ts w
ere
prep
ared
.N
ote
1: F
ill in
sepa
rate
ly th
e ba
lanc
es o
f acc
ount
s rec
eiva
ble–
rela
ted
parti
es, n
otes
rece
ivab
le–r
elat
ed p
artie
s, ot
her r
ecei
vabl
es–r
elat
ed p
artie
s, e
tc.
Not
e 2:
Pai
d-in
cap
ital r
efer
red
to h
erei
n is
the
paid
-in c
apita
l of p
aren
t com
pany
.
Am
ount
col
lect
edsu
bseq
uent
to th
eba
lanc
e sh
eet d
ate
Allo
wan
ce fo
rdo
ubtfu
l acc
ount
sC
redi
tor
Cou
nter
party
Rel
atio
nshi
p w
ith th
eco
unte
rpar
ty
Bal
ance
as a
tD
ecem
ber 3
1, 2
017
(Not
e 1)
Turn
over
rate
O
verd
ue re
ceiv
able
s
Ever
gree
n M
arin
e C
orpo
ratio
n (T
aiw
an) L
td.
Rec
eiva
bles
from
rela
ted
parti
es re
achi
ng N
T$10
0 m
illio
n or
20%
of p
aid-
in c
apita
l or m
ore
Dec
embe
r 31,
201
7
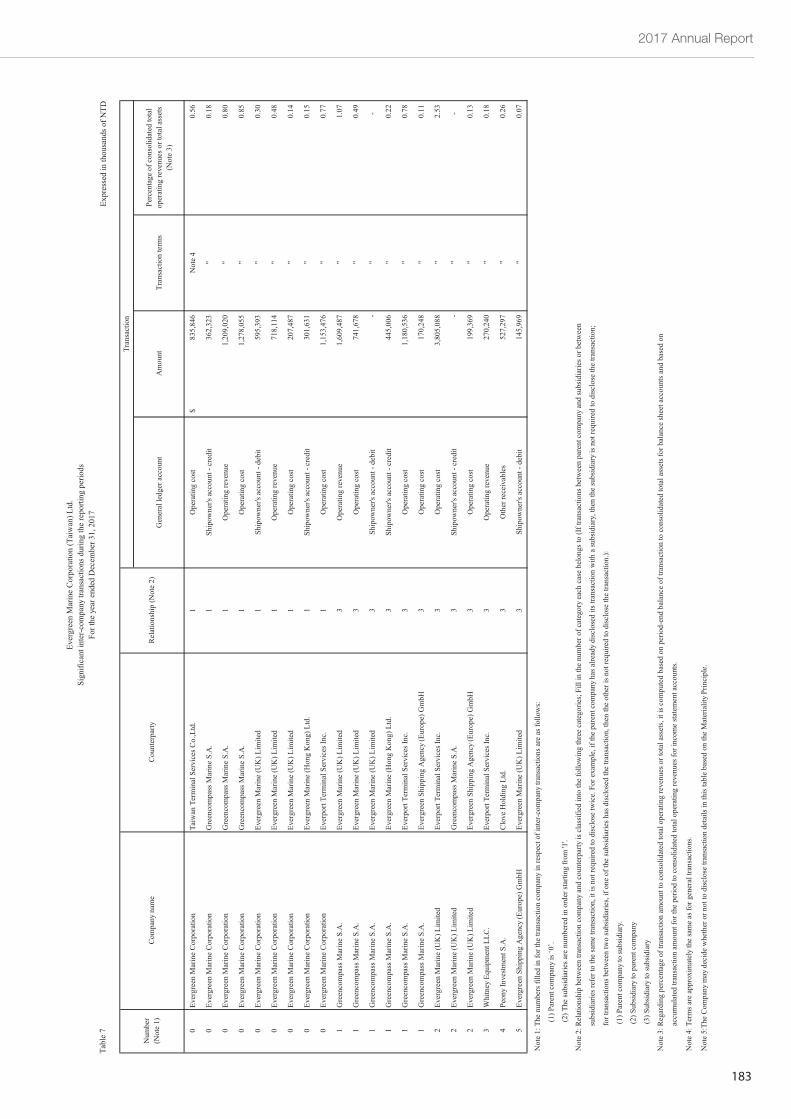
2017 Annual Report
183
Expr
esse
d in
thou
sand
s of N
TD(E
xcep
t as o
ther
wis
e in
dica
ted)
Gen
eral
ledg
er a
ccou
ntA
mou
ntTr
ansa
ctio
n te
rms
Perc
enta
ge o
f con
solid
ated
tota
lop
erat
ing
reve
nues
or t
otal
ass
ets
(Not
e 3)
0Ev
ergr
een
Mar
ine
Cor
pora
tion
Taiw
an T
erm
inal
Ser
vice
s Co.
,Ltd
.1
Ope
ratin
g co
st83
5,84
6$
Not
e 4
0.56
0Ev
ergr
een
Mar
ine
Cor
pora
tion
Gre
enco
mpa
ss M
arin
e S.
A.
1Sh
ipow
ner's
acc
ount
- cr
edit
362,
323
"
0.18
0Ev
ergr
een
Mar
ine
Cor
pora
tion
Gre
enco
mpa
ss M
arin
e S.
A.
1O
pera
ting
reve
nue
1,20
9,02
0
"
0.80
0Ev
ergr
een
Mar
ine
Cor
pora
tion
Gre
enco
mpa
ss M
arin
e S.
A.
1O
pera
ting
cost
1,27
8,05
5
"
0.85
0Ev
ergr
een
Mar
ine
Cor
pora
tion
Ever
gree
n M
arin
e (U
K) L
imite
d1
Ship
owne
r's a
ccou
nt -
debi
t59
5,39
3
"0.
30
0Ev
ergr
een
Mar
ine
Cor
pora
tion
Ever
gree
n M
arin
e (U
K) L
imite
d1
Ope
ratin
g re
venu
e71
8,11
4
"0.
48
0Ev
ergr
een
Mar
ine
Cor
pora
tion
Ever
gree
n M
arin
e (U
K) L
imite
d1
Ope
ratin
g co
st20
7,48
7
"0.
14
0Ev
ergr
een
Mar
ine
Cor
pora
tion
Ever
gree
n M
arin
e (H
ong
Kon
g) L
td.
1Sh
ipow
ner's
acc
ount
- cr
edit
301,
631
"
0.15
0Ev
ergr
een
Mar
ine
Cor
pora
tion
Ever
port
Term
inal
Ser
vice
s Inc
.1
Ope
ratin
g co
st1,
153,
476
"0.
77
1G
reen
com
pass
Mar
ine
S.A
.Ev
ergr
een
Mar
ine
(UK
) Lim
ited
3O
pera
ting
reve
nue
1,60
9,48
7
"
1.07
1G
reen
com
pass
Mar
ine
S.A
.Ev
ergr
een
Mar
ine
(UK
) Lim
ited
3O
pera
ting
cost
741,
678
"
0.49
1G
reen
com
pass
Mar
ine
S.A
.Ev
ergr
een
Mar
ine
(UK
) Lim
ited
3Sh
ipow
ner's
acc
ount
- de
bit
-
"-
1G
reen
com
pass
Mar
ine
S.A
.Ev
ergr
een
Mar
ine
(Hon
g K
ong)
Ltd
.3
Ship
owne
r's a
ccou
nt -
cred
it44
5,00
6
"0.
22
1G
reen
com
pass
Mar
ine
S.A
.Ev
erpo
rt Te
rmin
al S
ervi
ces I
nc.
3O
pera
ting
cost
1,18
0,53
6
"
0.78
1G
reen
com
pass
Mar
ine
S.A
.Ev
ergr
een
Ship
ping
Age
ncy
(Eur
ope)
Gm
bH3
Ope
ratin
g co
st17
0,24
8
"0.
11
2Ev
ergr
een
Mar
ine
(UK
) Lim
ited
Ever
port
Term
inal
Ser
vice
s Inc
.3
Ope
ratin
g co
st3,
805,
088
"2.
53
2Ev
ergr
een
Mar
ine
(UK
) Lim
ited
Gre
enco
mpa
ss M
arin
e S.
A.
3Sh
ipow
ner's
acc
ount
- cr
edit
-
"-
2Ev
ergr
een
Mar
ine
(UK
) Lim
ited
Ever
gree
n Sh
ippi
ng A
genc
y (E
urop
e) G
mbH
3O
pera
ting
cost
199,
369
"
0.13
3W
hitn
ey E
quip
men
t LLC
.Ev
erpo
rt Te
rmin
al S
ervi
ces I
nc.
3O
pera
ting
reve
nue
270,
240
"
0.18
4Pe
ony
Inve
stmen
t S.A
.C
love
Hol
ding
Ltd
.3
Oth
er re
ceiv
able
s52
7,29
7
"0.
26
5Ev
ergr
een
Ship
ping
Age
ncy
(Eur
ope)
Gm
bHEv
ergr
een
Mar
ine
(UK
) Lim
ited
3Sh
ipow
ner's
acc
ount
- de
bit
145,
969
"
0.07
Not
e 1:
The
num
bers
fille
d in
for t
he tr
ansa
ctio
n co
mpa
ny in
resp
ect o
f int
er-c
ompa
ny tr
ansa
ctio
ns a
re a
s fol
low
s:
(1
) Par
ent c
ompa
ny is
‘0’.
(2
) The
subs
idia
ries a
re n
umbe
red
in o
rder
star
ting
from
'1'.
Not
e 2:
Rel
atio
nshi
p be
twee
n tra
nsac
tion
com
pany
and
cou
nter
party
is c
lass
ified
into
the
follo
win
g th
ree
cate
gorie
s; Fi
ll in
the
num
ber o
f cat
egor
y ea
ch c
ase
belo
ngs t
o (I
f tra
nsac
tions
bet
wee
n pa
rent
com
pany
and
subs
idia
ries o
r bet
wee
n
subs
idia
ries r
efer
to th
e sa
me
trans
actio
n, it
is n
ot re
quire
d to
dis
clos
e tw
ice.
For
exa
mpl
e, if
the
pare
nt c
ompa
ny h
as a
lread
y di
sclo
sed
its tr
ansa
ctio
n w
ith a
subs
idia
ry, t
hen
the
subs
idia
ry is
not
requ
ired
to d
iscl
ose
the
trans
actio
n;
for t
rans
actio
ns b
etw
een
two
subs
idia
ries,
if on
e of
the
subs
idia
ries h
as d
iscl
osed
the
trans
actio
n, th
en th
e ot
her i
s not
requ
ired
to d
iscl
ose
the
trans
actio
n.):
(1)
Par
ent c
ompa
ny to
subs
idia
ry.
(2)
Sub
sidia
ry to
par
ent c
ompa
ny
(3)
Sub
sidia
ry to
subs
idia
ry
Not
e 3:
Reg
ardi
ng p
erce
ntag
e of
tran
sact
ion
amou
nt to
con
solid
ated
tota
l ope
ratin
g re
venu
es o
r tot
al a
sset
s, it
is co
mpu
ted
base
d on
per
iod-
end
bala
nce
of tr
ansa
ctio
n to
con
solid
ated
tota
l ass
ets f
or b
alan
ce sh
eet a
ccou
nts a
nd b
ased
on
acc
umul
ated
tran
sact
ion
amou
nt fo
r the
per
iod
to c
onso
lidat
ed to
tal o
pera
ting
reve
nues
for i
ncom
e sta
tem
ent a
ccou
nts.
Not
e 4:
Ter
ms a
re a
ppro
xim
atel
y th
e sa
me
as fo
r gen
eral
tran
sact
ions
.
Not
e 5:
The
Com
pany
may
dec
ide
whe
ther
or n
ot to
dis
clos
e tra
nsac
tion
deta
ils in
this
tabl
e ba
sed
on th
e M
ater
ialit
y Pr
inci
ple.
Num
ber
(Not
e 1)
Com
pany
nam
eC
ount
erpa
rtyR
elat
ions
hip
(Not
e 2)
Tran
sact
ion
Ever
gree
n M
arin
e C
orpo
ratio
n (T
aiw
an) L
td.
Sign
ifica
nt in
ter-c
ompa
ny tr
ansa
ctio
ns d
urin
g th
e re
porti
ng p
erio
dsFo
r the
yea
r end
ed D
ecem
ber 3
1, 2
017
Tabl
e 7
Expr
esse
d in
thou
sand
s of N
TD(E
xcep
t as o
ther
wis
e in
dica
ted)
Gen
eral
ledg
er a
ccou
ntA
mou
ntTr
ansa
ctio
n te
rms
Perc
enta
ge o
f con
solid
ated
tota
lop
erat
ing
reve
nues
or t
otal
ass
ets
(Not
e 3)
0Ev
ergr
een
Mar
ine
Cor
pora
tion
Taiw
an T
erm
inal
Ser
vice
s Co.
,Ltd
.1
Ope
ratin
g co
st83
5,84
6$
Not
e 4
0.56
0Ev
ergr
een
Mar
ine
Cor
pora
tion
Gre
enco
mpa
ss M
arin
e S.
A.
1Sh
ipow
ner's
acc
ount
- cr
edit
362,
323
"
0.18
0Ev
ergr
een
Mar
ine
Cor
pora
tion
Gre
enco
mpa
ss M
arin
e S.
A.
1O
pera
ting
reve
nue
1,20
9,02
0
"
0.80
0Ev
ergr
een
Mar
ine
Cor
pora
tion
Gre
enco
mpa
ss M
arin
e S.
A.
1O
pera
ting
cost
1,27
8,05
5
"
0.85
0Ev
ergr
een
Mar
ine
Cor
pora
tion
Ever
gree
n M
arin
e (U
K) L
imite
d1
Ship
owne
r's a
ccou
nt -
debi
t59
5,39
3
"0.
30
0Ev
ergr
een
Mar
ine
Cor
pora
tion
Ever
gree
n M
arin
e (U
K) L
imite
d1
Ope
ratin
g re
venu
e71
8,11
4
"0.
48
0Ev
ergr
een
Mar
ine
Cor
pora
tion
Ever
gree
n M
arin
e (U
K) L
imite
d1
Ope
ratin
g co
st20
7,48
7
"0.
14
0Ev
ergr
een
Mar
ine
Cor
pora
tion
Ever
gree
n M
arin
e (H
ong
Kon
g) L
td.
1Sh
ipow
ner's
acc
ount
- cr
edit
301,
631
"
0.15
0Ev
ergr
een
Mar
ine
Cor
pora
tion
Ever
port
Term
inal
Ser
vice
s Inc
.1
Ope
ratin
g co
st1,
153,
476
"0.
77
1G
reen
com
pass
Mar
ine
S.A
.Ev
ergr
een
Mar
ine
(UK
) Lim
ited
3O
pera
ting
reve
nue
1,60
9,48
7
"
1.07
1G
reen
com
pass
Mar
ine
S.A
.Ev
ergr
een
Mar
ine
(UK
) Lim
ited
3O
pera
ting
cost
741,
678
"
0.49
1G
reen
com
pass
Mar
ine
S.A
.Ev
ergr
een
Mar
ine
(UK
) Lim
ited
3Sh
ipow
ner's
acc
ount
- de
bit
-
"-
1G
reen
com
pass
Mar
ine
S.A
.Ev
ergr
een
Mar
ine
(Hon
g K
ong)
Ltd
.3
Ship
owne
r's a
ccou
nt -
cred
it44
5,00
6
"0.
22
1G
reen
com
pass
Mar
ine
S.A
.Ev
erpo
rt Te
rmin
al S
ervi
ces I
nc.
3O
pera
ting
cost
1,18
0,53
6
"
0.78
1G
reen
com
pass
Mar
ine
S.A
.Ev
ergr
een
Ship
ping
Age
ncy
(Eur
ope)
Gm
bH3
Ope
ratin
g co
st17
0,24
8
"0.
11
2Ev
ergr
een
Mar
ine
(UK
) Lim
ited
Ever
port
Term
inal
Ser
vice
s Inc
.3
Ope
ratin
g co
st3,
805,
088
"2.
53
2Ev
ergr
een
Mar
ine
(UK
) Lim
ited
Gre
enco
mpa
ss M
arin
e S.
A.
3Sh
ipow
ner's
acc
ount
- cr
edit
-
"-
2Ev
ergr
een
Mar
ine
(UK
) Lim
ited
Ever
gree
n Sh
ippi
ng A
genc
y (E
urop
e) G
mbH
3O
pera
ting
cost
199,
369
"
0.13
3W
hitn
ey E
quip
men
t LLC
.Ev
erpo
rt Te
rmin
al S
ervi
ces I
nc.
3O
pera
ting
reve
nue
270,
240
"
0.18
4Pe
ony
Inve
stmen
t S.A
.C
love
Hol
ding
Ltd
.3
Oth
er re
ceiv
able
s52
7,29
7
"0.
26
5Ev
ergr
een
Ship
ping
Age
ncy
(Eur
ope)
Gm
bHEv
ergr
een
Mar
ine
(UK
) Lim
ited
3Sh
ipow
ner's
acc
ount
- de
bit
145,
969
"
0.07
Not
e 1:
The
num
bers
fille
d in
for t
he tr
ansa
ctio
n co
mpa
ny in
resp
ect o
f int
er-c
ompa
ny tr
ansa
ctio
ns a
re a
s fol
low
s:
(1
) Par
ent c
ompa
ny is
‘0’.
(2
) The
subs
idia
ries a
re n
umbe
red
in o
rder
star
ting
from
'1'.
Not
e 2:
Rel
atio
nshi
p be
twee
n tra
nsac
tion
com
pany
and
cou
nter
party
is c
lass
ified
into
the
follo
win
g th
ree
cate
gorie
s; Fi
ll in
the
num
ber o
f cat
egor
y ea
ch c
ase
belo
ngs t
o (I
f tra
nsac
tions
bet
wee
n pa
rent
com
pany
and
subs
idia
ries o
r bet
wee
n
subs
idia
ries r
efer
to th
e sa
me
trans
actio
n, it
is n
ot re
quire
d to
dis
clos
e tw
ice.
For
exa
mpl
e, if
the
pare
nt c
ompa
ny h
as a
lread
y di
sclo
sed
its tr
ansa
ctio
n w
ith a
subs
idia
ry, t
hen
the
subs
idia
ry is
not
requ
ired
to d
isclo
se th
e tra
nsac
tion;
for t
rans
actio
ns b
etw
een
two
subs
idia
ries,
if on
e of
the
subs
idia
ries h
as d
iscl
osed
the
trans
actio
n, th
en th
e ot
her i
s not
requ
ired
to d
iscl
ose
the
trans
actio
n.):
(1)
Par
ent c
ompa
ny to
subs
idia
ry.
(2)
Sub
sidia
ry to
par
ent c
ompa
ny
(3)
Sub
sidia
ry to
subs
idia
ry
Not
e 3:
Reg
ardi
ng p
erce
ntag
e of
tran
sact
ion
amou
nt to
con
solid
ated
tota
l ope
ratin
g re
venu
es o
r tot
al a
sset
s, it
is co
mpu
ted
base
d on
per
iod-
end
bala
nce
of tr
ansa
ctio
n to
con
solid
ated
tota
l ass
ets f
or b
alan
ce sh
eet a
ccou
nts a
nd b
ased
on
acc
umul
ated
tran
sact
ion
amou
nt fo
r the
per
iod
to c
onso
lidat
ed to
tal o
pera
ting
reve
nues
for i
ncom
e sta
tem
ent a
ccou
nts.
Not
e 4:
Ter
ms a
re a
ppro
xim
atel
y th
e sa
me
as fo
r gen
eral
tran
sact
ions
.
Not
e 5:
The
Com
pany
may
dec
ide
whe
ther
or n
ot to
dis
clos
e tra
nsac
tion
deta
ils in
this
tabl
e ba
sed
on th
e M
ater
ialit
y Pr
inci
ple.
Num
ber
(Not
e 1)
Com
pany
nam
eC
ount
erpa
rtyR
elat
ions
hip
(Not
e 2)
Tran
sact
ion
Ever
gree
n M
arin
e C
orpo
ratio
n (T
aiw
an) L
td.
Sign
ifica
nt in
ter-c
ompa
ny tr
ansa
ctio
ns d
urin
g th
e re
porti
ng p
erio
dsFo
r the
yea
r end
ed D
ecem
ber 3
1, 2
017
Tabl
e 7
Expr
esse
d in
thou
sand
s of N
TD(E
xcep
t as o
ther
wis
e in
dica
ted)
Gen
eral
ledg
er a
ccou
ntA
mou
ntTr
ansa
ctio
n te
rms
Perc
enta
ge o
f con
solid
ated
tota
lop
erat
ing
reve
nues
or t
otal
ass
ets
(Not
e 3)
0Ev
ergr
een
Mar
ine
Cor
pora
tion
Taiw
an T
erm
inal
Ser
vice
s Co.
,Ltd
.1
Ope
ratin
g co
st83
5,84
6$
Not
e 4
0.56
0Ev
ergr
een
Mar
ine
Cor
pora
tion
Gre
enco
mpa
ss M
arin
e S.
A.
1Sh
ipow
ner's
acc
ount
- cr
edit
362,
323
"
0.18
0Ev
ergr
een
Mar
ine
Cor
pora
tion
Gre
enco
mpa
ss M
arin
e S.
A.
1O
pera
ting
reve
nue
1,20
9,02
0
"
0.80
0Ev
ergr
een
Mar
ine
Cor
pora
tion
Gre
enco
mpa
ss M
arin
e S.
A.
1O
pera
ting
cost
1,27
8,05
5
"
0.85
0Ev
ergr
een
Mar
ine
Cor
pora
tion
Ever
gree
n M
arin
e (U
K) L
imite
d1
Ship
owne
r's a
ccou
nt -
debi
t59
5,39
3
"0.
30
0Ev
ergr
een
Mar
ine
Cor
pora
tion
Ever
gree
n M
arin
e (U
K) L
imite
d1
Ope
ratin
g re
venu
e71
8,11
4
"0.
48
0Ev
ergr
een
Mar
ine
Cor
pora
tion
Ever
gree
n M
arin
e (U
K) L
imite
d1
Ope
ratin
g co
st20
7,48
7
"0.
14
0Ev
ergr
een
Mar
ine
Cor
pora
tion
Ever
gree
n M
arin
e (H
ong
Kon
g) L
td.
1Sh
ipow
ner's
acc
ount
- cr
edit
301,
631
"
0.15
0Ev
ergr
een
Mar
ine
Cor
pora
tion
Ever
port
Term
inal
Ser
vice
s Inc
.1
Ope
ratin
g co
st1,
153,
476
"0.
77
1G
reen
com
pass
Mar
ine
S.A
.Ev
ergr
een
Mar
ine
(UK
) Lim
ited
3O
pera
ting
reve
nue
1,60
9,48
7
"
1.07
1G
reen
com
pass
Mar
ine
S.A
.Ev
ergr
een
Mar
ine
(UK
) Lim
ited
3O
pera
ting
cost
741,
678
"
0.49
1G
reen
com
pass
Mar
ine
S.A
.Ev
ergr
een
Mar
ine
(UK
) Lim
ited
3Sh
ipow
ner's
acc
ount
- de
bit
-
"-
1G
reen
com
pass
Mar
ine
S.A
.Ev
ergr
een
Mar
ine
(Hon
g K
ong)
Ltd
.3
Ship
owne
r's a
ccou
nt -
cred
it44
5,00
6
"0.
22
1G
reen
com
pass
Mar
ine
S.A
.Ev
erpo
rt Te
rmin
al S
ervi
ces I
nc.
3O
pera
ting
cost
1,18
0,53
6
"
0.78
1G
reen
com
pass
Mar
ine
S.A
.Ev
ergr
een
Ship
ping
Age
ncy
(Eur
ope)
Gm
bH3
Ope
ratin
g co
st17
0,24
8
"0.
11
2Ev
ergr
een
Mar
ine
(UK
) Lim
ited
Ever
port
Term
inal
Ser
vice
s Inc
.3
Ope
ratin
g co
st3,
805,
088
"2.
53
2Ev
ergr
een
Mar
ine
(UK
) Lim
ited
Gre
enco
mpa
ss M
arin
e S.
A.
3Sh
ipow
ner's
acc
ount
- cr
edit
-
"-
2Ev
ergr
een
Mar
ine
(UK
) Lim
ited
Ever
gree
n Sh
ippi
ng A
genc
y (E
urop
e) G
mbH
3O
pera
ting
cost
199,
369
"
0.13
3W
hitn
ey E
quip
men
t LLC
.Ev
erpo
rt Te
rmin
al S
ervi
ces I
nc.
3O
pera
ting
reve
nue
270,
240
"
0.18
4Pe
ony
Inve
stmen
t S.A
.C
love
Hol
ding
Ltd
.3
Oth
er re
ceiv
able
s52
7,29
7
"0.
26
5Ev
ergr
een
Ship
ping
Age
ncy
(Eur
ope)
Gm
bHEv
ergr
een
Mar
ine
(UK
) Lim
ited
3Sh
ipow
ner's
acc
ount
- de
bit
145,
969
"
0.07
Not
e 1:
The
num
bers
fille
d in
for t
he tr
ansa
ctio
n co
mpa
ny in
resp
ect o
f int
er-c
ompa
ny tr
ansa
ctio
ns a
re a
s fol
low
s:
(1
) Par
ent c
ompa
ny is
‘0’.
(2
) The
subs
idia
ries a
re n
umbe
red
in o
rder
star
ting
from
'1'.
Not
e 2:
Rel
atio
nshi
p be
twee
n tra
nsac
tion
com
pany
and
cou
nter
party
is c
lass
ified
into
the
follo
win
g th
ree
cate
gorie
s; Fi
ll in
the
num
ber o
f cat
egor
y ea
ch c
ase
belo
ngs t
o (I
f tra
nsac
tions
bet
wee
n pa
rent
com
pany
and
subs
idia
ries o
r bet
wee
n
subs
idia
ries r
efer
to th
e sa
me
trans
actio
n, it
is n
ot re
quire
d to
dis
clos
e tw
ice.
For
exa
mpl
e, if
the
pare
nt c
ompa
ny h
as a
lread
y di
sclo
sed
its tr
ansa
ctio
n w
ith a
subs
idia
ry, t
hen
the
subs
idia
ry is
not
requ
ired
to d
iscl
ose
the
trans
actio
n;
for t
rans
actio
ns b
etw
een
two
subs
idia
ries,
if on
e of
the
subs
idia
ries h
as d
iscl
osed
the
trans
actio
n, th
en th
e ot
her i
s not
requ
ired
to d
iscl
ose
the
trans
actio
n.):
(1)
Par
ent c
ompa
ny to
subs
idia
ry.
(2)
Sub
sidia
ry to
par
ent c
ompa
ny
(3)
Sub
sidia
ry to
subs
idia
ry
Not
e 3:
Reg
ardi
ng p
erce
ntag
e of
tran
sact
ion
amou
nt to
con
solid
ated
tota
l ope
ratin
g re
venu
es o
r tot
al a
sset
s, it
is co
mpu
ted
base
d on
per
iod-
end
bala
nce
of tr
ansa
ctio
n to
con
solid
ated
tota
l ass
ets f
or b
alan
ce sh
eet a
ccou
nts a
nd b
ased
on
acc
umul
ated
tran
sact
ion
amou
nt fo
r the
per
iod
to c
onso
lidat
ed to
tal o
pera
ting
reve
nues
for i
ncom
e sta
tem
ent a
ccou
nts.
Not
e 4:
Ter
ms a
re a
ppro
xim
atel
y th
e sa
me
as fo
r gen
eral
tran
sact
ions
.
Not
e 5:
The
Com
pany
may
dec
ide
whe
ther
or n
ot to
dis
clos
e tra
nsac
tion
deta
ils in
this
tabl
e ba
sed
on th
e M
ater
ialit
y Pr
inci
ple.
Num
ber
(Not
e 1)
Com
pany
nam
eC
ount
erpa
rtyR
elat
ions
hip
(Not
e 2)
Tran
sact
ion
Ever
gree
n M
arin
e C
orpo
ratio
n (T
aiw
an) L
td.
Sign
ifica
nt in
ter-c
ompa
ny tr
ansa
ctio
ns d
urin
g th
e re
porti
ng p
erio
dsFo
r the
yea
r end
ed D
ecem
ber 3
1, 2
017
Tabl
e 7
Expr
esse
d in
thou
sand
s of N
TD(E
xcep
t as o
ther
wis
e in
dica
ted)
Gen
eral
ledg
er a
ccou
ntA
mou
ntTr
ansa
ctio
n te
rms
Perc
enta
ge o
f con
solid
ated
tota
lop
erat
ing
reve
nues
or t
otal
ass
ets
(Not
e 3)
0Ev
ergr
een
Mar
ine
Cor
pora
tion
Taiw
an T
erm
inal
Ser
vice
s Co.
,Ltd
.1
Ope
ratin
g co
st83
5,84
6$
Not
e 4
0.56
0Ev
ergr
een
Mar
ine
Cor
pora
tion
Gre
enco
mpa
ss M
arin
e S.
A.
1Sh
ipow
ner's
acc
ount
- cr
edit
362,
323
"
0.18
0Ev
ergr
een
Mar
ine
Cor
pora
tion
Gre
enco
mpa
ss M
arin
e S.
A.
1O
pera
ting
reve
nue
1,20
9,02
0
"
0.80
0Ev
ergr
een
Mar
ine
Cor
pora
tion
Gre
enco
mpa
ss M
arin
e S.
A.
1O
pera
ting
cost
1,27
8,05
5
"
0.85
0Ev
ergr
een
Mar
ine
Cor
pora
tion
Ever
gree
n M
arin
e (U
K) L
imite
d1
Ship
owne
r's a
ccou
nt -
debi
t59
5,39
3
"0.
30
0Ev
ergr
een
Mar
ine
Cor
pora
tion
Ever
gree
n M
arin
e (U
K) L
imite
d1
Ope
ratin
g re
venu
e71
8,11
4
"0.
48
0Ev
ergr
een
Mar
ine
Cor
pora
tion
Ever
gree
n M
arin
e (U
K) L
imite
d1
Ope
ratin
g co
st20
7,48
7
"0.
14
0Ev
ergr
een
Mar
ine
Cor
pora
tion
Ever
gree
n M
arin
e (H
ong
Kon
g) L
td.
1Sh
ipow
ner's
acc
ount
- cr
edit
301,
631
"
0.15
0Ev
ergr
een
Mar
ine
Cor
pora
tion
Ever
port
Term
inal
Ser
vice
s Inc
.1
Ope
ratin
g co
st1,
153,
476
"0.
77
1G
reen
com
pass
Mar
ine
S.A
.Ev
ergr
een
Mar
ine
(UK
) Lim
ited
3O
pera
ting
reve
nue
1,60
9,48
7
"
1.07
1G
reen
com
pass
Mar
ine
S.A
.Ev
ergr
een
Mar
ine
(UK
) Lim
ited
3O
pera
ting
cost
741,
678
"
0.49
1G
reen
com
pass
Mar
ine
S.A
.Ev
ergr
een
Mar
ine
(UK
) Lim
ited
3Sh
ipow
ner's
acc
ount
- de
bit
-
"-
1G
reen
com
pass
Mar
ine
S.A
.Ev
ergr
een
Mar
ine
(Hon
g K
ong)
Ltd
.3
Ship
owne
r's a
ccou
nt -
cred
it44
5,00
6
"0.
22
1G
reen
com
pass
Mar
ine
S.A
.Ev
erpo
rt Te
rmin
al S
ervi
ces I
nc.
3O
pera
ting
cost
1,18
0,53
6
"
0.78
1G
reen
com
pass
Mar
ine
S.A
.Ev
ergr
een
Ship
ping
Age
ncy
(Eur
ope)
Gm
bH3
Ope
ratin
g co
st17
0,24
8
"0.
11
2Ev
ergr
een
Mar
ine
(UK
) Lim
ited
Ever
port
Term
inal
Ser
vice
s Inc
.3
Ope
ratin
g co
st3,
805,
088
"2.
53
2Ev
ergr
een
Mar
ine
(UK
) Lim
ited
Gre
enco
mpa
ss M
arin
e S.
A.
3Sh
ipow
ner's
acc
ount
- cr
edit
-
"-
2Ev
ergr
een
Mar
ine
(UK
) Lim
ited
Ever
gree
n Sh
ippi
ng A
genc
y (E
urop
e) G
mbH
3O
pera
ting
cost
199,
369
"
0.13
3W
hitn
ey E
quip
men
t LLC
.Ev
erpo
rt Te
rmin
al S
ervi
ces I
nc.
3O
pera
ting
reve
nue
270,
240
"
0.18
4Pe
ony
Inve
stmen
t S.A
.C
love
Hol
ding
Ltd
.3
Oth
er re
ceiv
able
s52
7,29
7
"0.
26
5Ev
ergr
een
Ship
ping
Age
ncy
(Eur
ope)
Gm
bHEv
ergr
een
Mar
ine
(UK
) Lim
ited
3Sh
ipow
ner's
acc
ount
- de
bit
145,
969
"
0.07
Not
e 1:
The
num
bers
fille
d in
for t
he tr
ansa
ctio
n co
mpa
ny in
resp
ect o
f int
er-c
ompa
ny tr
ansa
ctio
ns a
re a
s fol
low
s:
(1
) Par
ent c
ompa
ny is
‘0’.
(2
) The
subs
idia
ries a
re n
umbe
red
in o
rder
star
ting
from
'1'.
Not
e 2:
Rel
atio
nshi
p be
twee
n tra
nsac
tion
com
pany
and
cou
nter
party
is c
lass
ified
into
the
follo
win
g th
ree
cate
gorie
s; Fi
ll in
the
num
ber o
f cat
egor
y ea
ch c
ase
belo
ngs t
o (I
f tra
nsac
tions
bet
wee
n pa
rent
com
pany
and
subs
idia
ries o
r bet
wee
n
subs
idia
ries r
efer
to th
e sa
me
trans
actio
n, it
is n
ot re
quire
d to
dis
clos
e tw
ice.
For
exa
mpl
e, if
the
pare
nt c
ompa
ny h
as a
lread
y di
sclo
sed
its tr
ansa
ctio
n w
ith a
subs
idia
ry, t
hen
the
subs
idia
ry is
not
requ
ired
to d
iscl
ose
the
trans
actio
n;
for t
rans
actio
ns b
etw
een
two
subs
idia
ries,
if on
e of
the
subs
idia
ries h
as d
iscl
osed
the
trans
actio
n, th
en th
e ot
her i
s not
requ
ired
to d
iscl
ose
the
trans
actio
n.):
(1)
Par
ent c
ompa
ny to
subs
idia
ry.
(2)
Sub
sidia
ry to
par
ent c
ompa
ny
(3)
Sub
sidia
ry to
subs
idia
ry
Not
e 3:
Reg
ardi
ng p
erce
ntag
e of
tran
sact
ion
amou
nt to
con
solid
ated
tota
l ope
ratin
g re
venu
es o
r tot
al a
sset
s, it
is co
mpu
ted
base
d on
per
iod-
end
bala
nce
of tr
ansa
ctio
n to
con
solid
ated
tota
l ass
ets f
or b
alan
ce sh
eet a
ccou
nts a
nd b
ased
on
acc
umul
ated
tran
sact
ion
amou
nt fo
r the
per
iod
to c
onso
lidat
ed to
tal o
pera
ting
reve
nues
for i
ncom
e sta
tem
ent a
ccou
nts.
Not
e 4:
Ter
ms a
re a
ppro
xim
atel
y th
e sa
me
as fo
r gen
eral
tran
sact
ions
.
Not
e 5:
The
Com
pany
may
dec
ide
whe
ther
or n
ot to
dis
clos
e tra
nsac
tion
deta
ils in
this
tabl
e ba
sed
on th
e M
ater
ialit
y Pr
inci
ple.
Num
ber
(Not
e 1)
Com
pany
nam
eC
ount
erpa
rtyR
elat
ions
hip
(Not
e 2)
Tran
sact
ion
Ever
gree
n M
arin
e C
orpo
ratio
n (T
aiw
an) L
td.
Sign
ifica
nt in
ter-c
ompa
ny tr
ansa
ctio
ns d
urin
g th
e re
porti
ng p
erio
dsFo
r the
yea
r end
ed D
ecem
ber 3
1, 2
017
Tabl
e 7
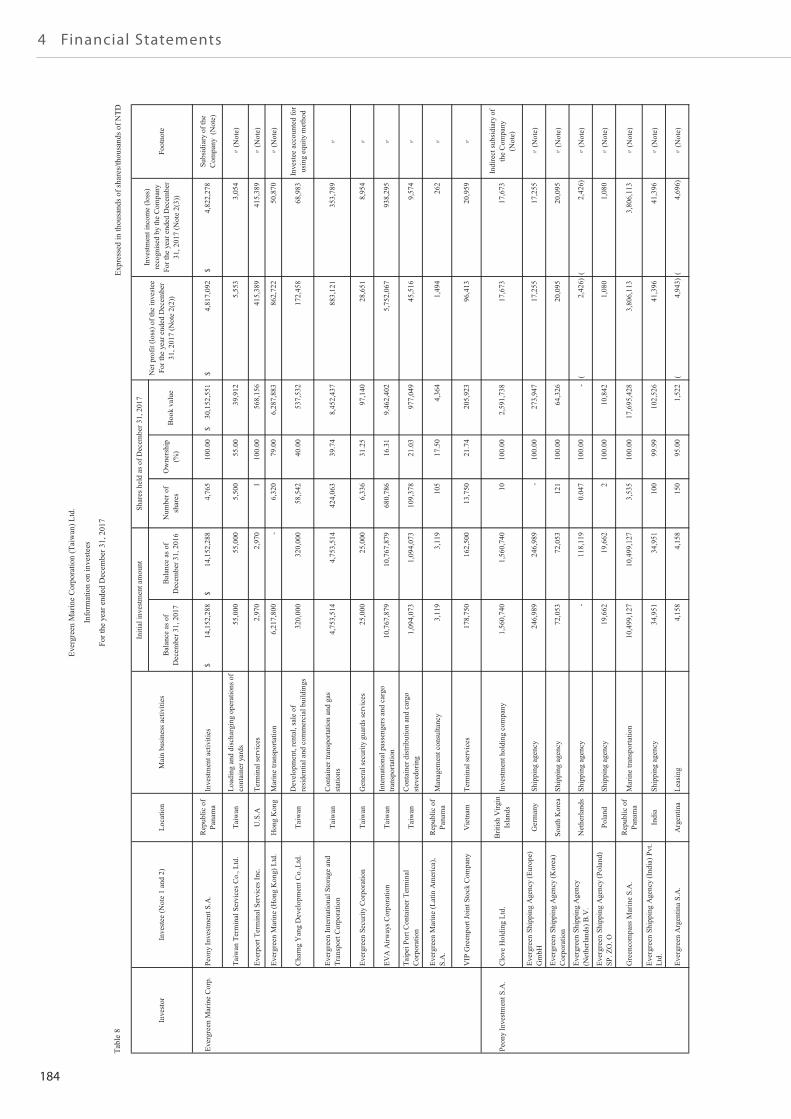
184
4 Financial Statements
Expr
esse
d in
thou
sand
s of s
hare
s/th
ousa
nds o
f NTD
Bal
ance
as o
fD
ecem
ber 3
1, 2
017
Bal
ance
as o
fD
ecem
ber 3
1, 2
016
Num
ber o
fsh
ares
Ow
ners
hip
(%)
Boo
k va
lue
Ever
gree
n M
arin
e C
orp.
Peon
y In
vest
men
t S.A
.R
epub
lic o
fPa
nam
aIn
vest
men
t act
iviti
es14
,152
,288
$
14,1
52,2
88$
4,
765
10
0.00
30,1
52,5
51$
4,81
7,09
2$
4,
822,
278
$
Su
bsid
iary
of t
heC
ompa
ny (
Not
e)
Taiw
an T
erm
inal
Ser
vice
s Co.
, Ltd
.Ta
iwan
Load
ing
and
disc
harg
ing
oper
atio
ns o
fco
ntai
ner y
ards
55,0
00
55
,000
5,50
0
55.0
039
,912
5,
553
3,05
4
(Not
e)
Ever
port
Term
inal
Ser
vice
s Inc
.U
.S.A
Term
inal
serv
ices
2,97
0
2,97
0
1
100.
0056
8,15
6
41
5,38
9
415,
389
(Not
e)
Ever
gree
n M
arin
e (H
ong
Kon
g) L
td.
Hon
g K
ong
Mar
ine
trans
porta
tion
6,21
7,80
0
-
6,
320
79
.00
6,28
7,88
3
862,
722
50
,870
(Not
e)
Cha
rng
Yan
g D
evel
opm
ent C
o.,L
td.
Taiw
anD
evel
opm
ent,
rent
al, s
ale
ofre
side
ntia
l and
com
mer
cial
bui
ldin
gs32
0,00
0
320,
000
58
,542
40.0
053
7,53
2
17
2,45
8
68,9
83
In
vest
ee a
ccou
nted
for
usin
g eq
uity
met
hod
Ever
gree
n In
tern
atio
nal S
tora
ge a
ndTr
ansp
ort C
orpo
ratio
nTa
iwan
Con
tain
er tr
ansp
orta
tion
and
gas
stat
ions
4,75
3,51
4
4,
753,
514
424,
063
39
.74
8,45
2,43
7
883,
121
35
3,78
9
Ever
gree
n Se
curit
y C
orpo
ratio
nTa
iwan
Gen
eral
secu
rity
guar
ds se
rvic
es25
,000
25,0
00
6,
336
31
.25
97,1
40
28,6
51
8,95
4
EVA
Airw
ays C
orpo
ratio
nTa
iwan
Inte
rnat
iona
l pas
seng
ers a
nd c
argo
trans
porta
tion
10,7
67,8
79
10
,767
,879
680,
786
16
.31
9,46
2,40
2
5,75
2,06
7
93
8,29
5
Taip
ei P
ort C
onta
iner
Ter
min
alC
orpo
ratio
nTa
iwan
Con
tain
er d
istri
butio
n an
d ca
rgo
stev
edor
ing
1,09
4,07
3
1,
094,
073
109,
378
21
.03
977,
049
45,5
16
9,57
4
Ever
gree
n M
arin
e (L
atin
Am
eric
a),
S.A
.R
epub
lic o
fPa
nam
aM
anag
emen
t con
sulta
ncy
3,11
9
3,11
9
105
17.5
04,
364
1,49
4
26
2
VIP
Gre
enpo
rt Jo
int S
tock
Com
pany
Vie
tnam
Term
inal
serv
ices
178,
750
16
2,50
0
13,7
50
21
.74
205,
923
96,4
13
20,9
59
Peon
y In
vest
men
t S.A
.C
love
Hol
ding
Ltd
.B
ritis
h V
irgin
Isla
nds
Inve
stm
ent h
oldi
ng c
ompa
ny1,
560,
740
1,56
0,74
0
10
100.
002,
591,
738
17
,673
17
,673
Indi
rect
subs
idia
ry o
fth
e C
ompa
ny(N
ote)
Ever
gree
n Sh
ippi
ng A
genc
y (E
urop
e)G
mbH
Ger
man
ySh
ippi
ng a
genc
y24
6,98
9
246,
989
-
10
0.00
273,
947
17,2
55
17,2
55
(N
ote)
Ever
gree
n Sh
ippi
ng A
genc
y (K
orea
)C
orpo
ratio
nSo
uth
Kor
eaSh
ippi
ng a
genc
y72
,053
72,0
53
12
1
10
0.00
64,3
26
20,0
95
20,0
95
(N
ote)
Ever
gree
n Sh
ippi
ng A
genc
y(N
ethe
rland
s) B
.V.
Net
herla
nds
Ship
ping
age
ncy
-
118,
119
0.
047
10
0.00
-
2,
426)
(
2,42
6)(
(Not
e)
Ever
gree
n Sh
ippi
ng A
genc
y (P
olan
d)SP
. ZO
. OPo
land
Ship
ping
age
ncy
19,6
62
19
,662
2
100.
0010
,842
1,
080
1,08
0
(Not
e)
Gre
enco
mpa
ss M
arin
e S.
A.
Rep
ublic
of
Pana
ma
Mar
ine
trans
porta
tion
10,4
99,1
27
10
,499
,127
3,53
5
100.
0017
,695
,428
3,
806,
113
3,80
6,11
3
(Not
e)
Ever
gree
n Sh
ippi
ng A
genc
y (I
ndia
) Pvt
.Lt
d.In
dia
Ship
ping
age
ncy
34,9
51
34
,951
100
99.9
910
2,52
6
41
,396
41
,396
(Not
e)
Ever
gree
n A
rgen
tina
S.A
.A
rgen
tina
Leas
ing
4,15
8
4,15
8
150
95.0
01,
522
4,94
3)(
4,
696)
(
(N
ote)
Net
pro
fit (l
oss)
of t
he in
vest
eeFo
r the
yea
r end
ed D
ecem
ber
31, 2
017
(Not
e 2(
2))
Inve
stm
ent i
ncom
e (lo
ss)
reco
gnis
ed b
y th
e C
ompa
nyFo
r the
yea
r end
ed D
ecem
ber
31, 2
017
(Not
e 2(
3))
Foot
note
Inve
stor
Inve
stee
(Not
e 1
and
2)Lo
catio
nM
ain
busi
ness
act
iviti
es
Initi
al in
vest
men
t am
ount
Sh
ares
hel
d as
of D
ecem
ber 3
1, 2
017
Info
rmat
ion
on in
vest
ees
For t
he y
ear e
nded
Dec
embe
r 31,
201
7
Tabl
e 8
Ever
gree
n M
arin
e C
orpo
ratio
n (T
aiw
an) L
td.
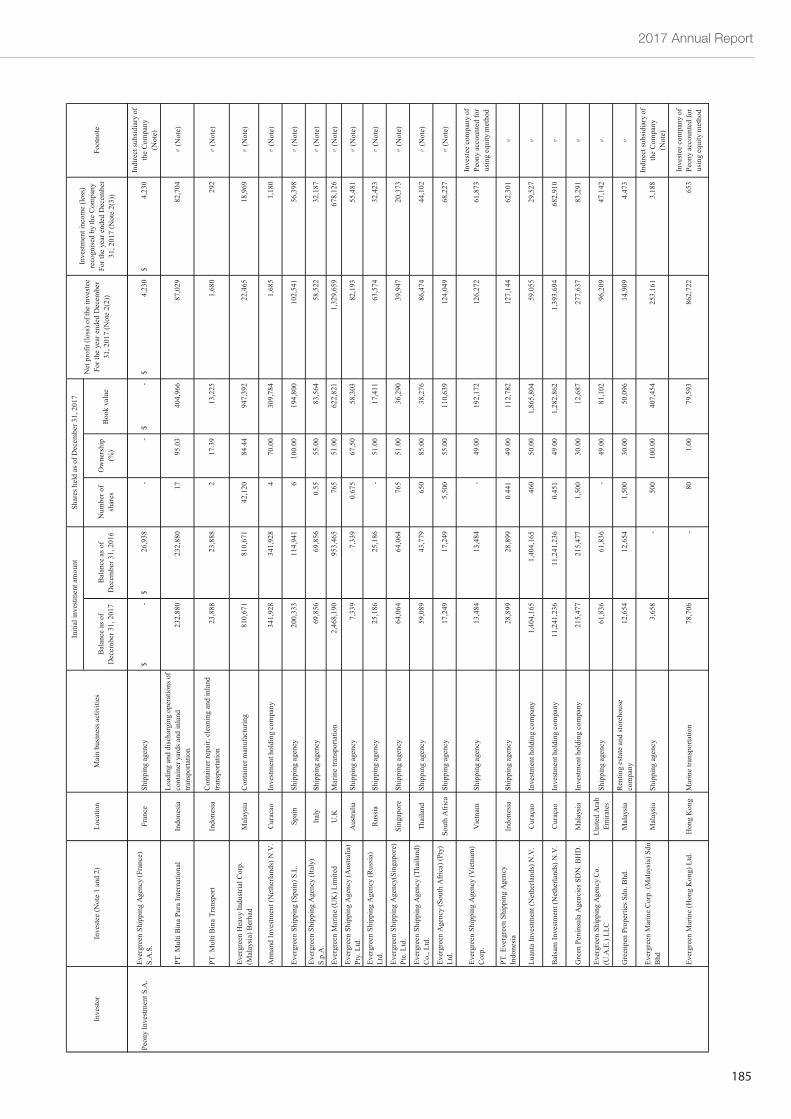
2017 Annual Report
185
Bal
ance
as o
fD
ecem
ber 3
1, 2
017
Bal
ance
as o
fD
ecem
ber 3
1, 2
016
Num
ber o
fsh
ares
Ow
ners
hip
(%)
Boo
k va
lue
Net
pro
fit (l
oss)
of t
he in
vest
eeFo
r the
yea
r end
ed D
ecem
ber
31, 2
017
(Not
e 2(
2))
Inve
stm
ent i
ncom
e (lo
ss)
reco
gnis
ed b
y th
e C
ompa
nyFo
r the
yea
r end
ed D
ecem
ber
31, 2
017
(Not
e 2(
3))
Foot
note
Inve
stor
Inve
stee
(Not
e 1
and
2)Lo
catio
nM
ain
busi
ness
act
iviti
es
Initi
al in
vest
men
t am
ount
Sh
ares
hel
d as
of D
ecem
ber 3
1, 2
017
Peon
y In
vest
men
t S.A
.Ev
ergr
een
Ship
ping
Age
ncy
(Fra
nce)
S.A
.S.
Fran
ceSh
ippi
ng a
genc
y-
$
26
,938
$
-
-
-
$
4,23
0$
4,
230
$
In
dire
ct su
bsid
iary
of
the
Com
pany
(Not
e)
PT. M
ulti
Bin
a Pu
ra In
tern
atio
nal
Indo
nesi
aLo
adin
g an
d di
scha
rgin
g op
erat
ions
of
cont
aine
r yar
ds a
nd in
land
trans
porta
tion
232,
880
23
2,88
0
17
95
.03
404,
966
87,0
29
82,7
04
(N
ote)
PT. M
ulti
Bin
a Tr
ansp
ort
Indo
nesi
aC
onta
iner
repa
ir, c
lean
ing
and
inla
ndtra
nspo
rtatio
n23
,888
23,8
88
2
17
.39
13,2
25
1,68
0
29
2
(N
ote)
Ever
gree
n H
eavy
Indu
stria
l Cor
p.(M
alay
sia)
Ber
had
Mal
aysi
aC
onta
iner
man
ufac
turin
g81
0,67
1
810,
671
42
,120
84.4
494
7,39
2
22
,465
18
,969
(Not
e)
Arm
and
Inve
stm
ent (
Net
herla
nds)
N.V
.C
urac
aoIn
vest
men
t hol
ding
com
pany
341,
928
34
1,92
8
4
70.0
030
9,78
4
1,
685
1,18
0
(Not
e)
Ever
gree
n Sh
ippi
ng (S
pain
) S.L
.Sp
ain
Ship
ping
age
ncy
200,
333
11
4,94
1
6
100.
0019
4,80
0
10
2,54
1
56,3
98
(N
ote)
Ever
gree
n Sh
ippi
ng A
genc
y (I
taly
)S.
p.A
.Ita
lySh
ippi
ng a
genc
y69
,856
69,8
56
0.
55
55.0
083
,564
58
,522
32
,187
(Not
e)
Ever
gree
n M
arin
e (U
K) L
imite
dU
.KM
arin
e tra
nspo
rtatio
n2,
468,
190
953,
465
76
5
51
.00
622,
821
1,32
9,65
9
67
8,12
6
(N
ote)
Ever
gree
n Sh
ippi
ng A
genc
y (A
ustra
lia)
Pty.
Ltd
.A
ustra
liaSh
ippi
ng a
genc
y7,
339
7,
339
0.
675
67
.50
58,3
03
82,1
93
55,4
81
(N
ote)
Ever
gree
n Sh
ippi
ng A
genc
y (R
ussi
a)Lt
d.R
ussi
aSh
ippi
ng a
genc
y25
,186
25,1
86
-
51
.00
17,4
11
63,5
74
32,4
23
(N
ote)
Ever
gree
n Sh
ippi
ng A
genc
y(Si
ngap
ore)
Pte.
Ltd
.Si
ngap
ore
Ship
ping
age
ncy
64,0
64
64
,064
765
51.0
036
,290
39
,947
20
,373
(Not
e)
Ever
gree
n Sh
ippi
ng A
genc
y (T
haila
nd)
Co.
, Ltd
.Th
aila
ndSh
ippi
ng a
genc
y59
,089
43,7
79
65
0
85
.00
38,2
76
86,4
74
44,1
02
(N
ote)
Ever
gree
n A
genc
y (S
outh
Afri
ca) (
Pty)
Ltd.
Sout
h A
frica
Ship
ping
age
ncy
17,2
49
17
,249
5,50
0
55.0
011
0,63
9
12
4,04
9
68,2
27
(N
ote)
Ever
gree
n Sh
ippi
ng A
genc
y (V
ietn
am)
Cor
p.V
ietn
amSh
ippi
ng a
genc
y13
,484
13,4
84
-
49
.00
192,
172
126,
272
61
,873
Inve
stee
com
pany
of
Peon
y ac
coun
ted
for
usin
g eq
uity
met
hod
PT. E
verg
reen
Shi
ppin
g A
genc
yIn
done
sia
Indo
nesi
aSh
ippi
ng a
genc
y28
,899
28,8
99
0.
441
49
.00
112,
782
127,
144
62
,301
Luan
ta In
vest
men
t (N
ethe
rland
s) N
.V.
Cur
açao
Inve
stm
ent h
oldi
ng c
ompa
ny1,
404,
165
1,40
4,16
5
46
0
50
.00
1,86
5,80
4
59,0
55
29,5
27
Bal
sam
Inve
stm
ent (
Net
herla
nds)
N.V
.C
uraç
aoIn
vest
men
t hol
ding
com
pany
11,2
41,2
36
11
,241
,236
0.45
1
49.0
01,
282,
862
1,
393,
694
682,
910
Gre
en P
enin
sula
Age
ncie
s SD
N. B
HD
.M
alay
sia
Inve
stm
ent h
oldi
ng c
ompa
ny21
5,47
7
215,
477
1,
500
30
.00
12,6
87
277,
637
83
,291
Ever
gree
n Sh
ippi
ng A
genc
y C
o.(U
.A.E
.) LL
CU
nite
d A
rab
Emira
tes
Ship
ping
age
ncy
61,8
36
61
,836
-
49.0
081
,102
96
,209
47
,142
Gre
enpe
n Pr
oper
ties S
dn. B
hd.
Mal
aysi
aR
entin
g es
tate
and
stor
ehou
seco
mpa
ny12
,654
12,6
54
1,
500
30
.00
50,0
96
14,9
09
4,47
3
Ever
gree
n M
arin
e C
orp.
(Mal
aysi
a) S
dnB
hdM
alay
sia
Ship
ping
age
ncy
3,65
8
-
500
100.
0040
7,45
4
25
3,16
1
3,18
8
Indi
rect
subs
idia
ry o
fth
e C
ompa
ny(N
ote)
Ever
gree
n M
arin
e (H
ong
Kon
g) L
td.
Hon
g K
ong
Mar
ine
trans
porta
tion
78,7
06
-
80
1.00
79,5
93
862,
722
65
3
In
vest
ee c
ompa
ny o
fPe
ony
acco
unte
d fo
rus
ing
equi
ty m
etho
d
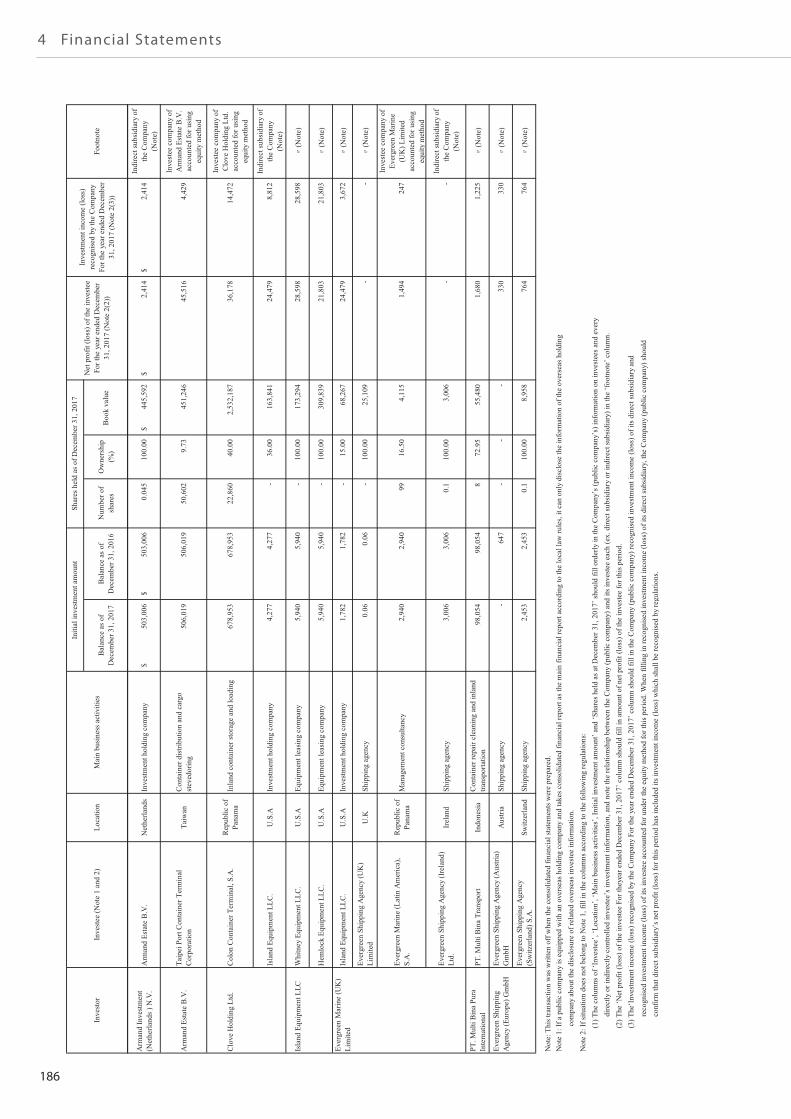
186
4 Financial Statements
Bal
ance
as o
fD
ecem
ber 3
1, 2
017
Bal
ance
as o
fD
ecem
ber 3
1, 2
016
Num
ber o
fsh
ares
Ow
ners
hip
(%)
Boo
k va
lue
Net
pro
fit (l
oss)
of t
he in
vest
eeFo
r the
yea
r end
ed D
ecem
ber
31, 2
017
(Not
e 2(
2))
Inve
stm
ent i
ncom
e (lo
ss)
reco
gnis
ed b
y th
e C
ompa
nyFo
r the
yea
r end
ed D
ecem
ber
31, 2
017
(Not
e 2(
3))
Foot
note
Inve
stor
Inve
stee
(Not
e 1
and
2)Lo
catio
nM
ain
busi
ness
act
iviti
es
Initi
al in
vest
men
t am
ount
Sh
ares
hel
d as
of D
ecem
ber 3
1, 2
017
Arm
and
Inve
stm
ent
(Net
herla
nds )
N.V
.A
rman
d Es
tate
B.V
.N
ethe
rland
sIn
vest
men
t hol
ding
com
pany
503,
006
$
50
3,00
6$
0.04
5
100.
0044
5,59
2$
2,
414
$
2,41
4$
Indi
rect
subs
idia
ry o
fth
e C
ompa
ny(N
ote)
Arm
and
Esta
te B
.V.
Taip
ei P
ort C
onta
iner
Ter
min
alC
orpo
ratio
nTa
iwan
Con
tain
er d
istri
butio
n an
d ca
rgo
stev
edor
ing
506,
019
50
6,01
9
50,6
02
9.
7345
1,24
6
45
,516
4,
429
Inve
stee
com
pany
of
Arm
and
Esta
te B
.V.
acco
unte
d fo
r usi
ngeq
uity
met
hod
Clo
ve H
oldi
ng L
td.
Col
on C
onta
iner
Ter
min
al, S
.A.
Rep
ublic
of
Pana
ma
Inla
nd c
onta
iner
stor
age
and
load
ing
678,
953
67
8,95
3
22,8
60
40
.00
2,53
2,18
7
36,1
78
14,4
72
Inve
stee
com
pany
of
Clo
ve H
oldi
ng L
td.
acco
unte
d fo
r usi
ngeq
uity
met
hod
Isla
nd E
quip
men
t LLC
.U
.S.A
Inve
stm
ent h
oldi
ng c
ompa
ny4,
277
4,
277
-
36
.00
163,
841
24,4
79
8,81
2
Indi
rect
subs
idia
ry o
fth
e C
ompa
ny(N
ote)
Isla
nd E
quip
men
t LLC
Whi
tney
Equ
ipm
ent L
LC.
U.S
.AEq
uipm
ent l
easi
ng c
ompa
ny5,
940
5,
940
-
10
0.00
173,
294
28,5
98
28,5
98
(N
ote)
Hem
lock
Equ
ipm
ent L
LC.
U.S
.AEq
uipm
ent l
easi
ng c
ompa
ny5,
940
5,
940
-
10
0.00
309,
839
21,8
03
21,8
03
(N
ote)
Ever
gree
n M
arin
e (U
K)
Lim
ited
Isla
nd E
quip
men
t LLC
.U
.S.A
Inve
stm
ent h
oldi
ng c
ompa
ny1,
782
1,
782
-
15
.00
68,2
67
24,4
79
3,67
2
(Not
e)
Ever
gree
n Sh
ippi
ng A
genc
y (U
K)
Lim
ited
U.K
Ship
ping
age
ncy
0.06
0.
06
-
100.
0025
,109
-
-
(Not
e)
Ever
gree
n M
arin
e (L
atin
Am
eric
a),
S.A
.R
epub
lic o
fPa
nam
aM
anag
emen
t con
sulta
ncy
2,94
0
2,94
0
99
16
.50
4,11
5
1,
494
247
Inve
stee
com
pany
of
Ever
gree
n M
arin
e(U
K) L
imite
dac
coun
ted
for u
sing
equi
ty m
etho
d
Ever
gree
n Sh
ippi
ng A
genc
y (I
rela
nd)
Ltd.
Irel
and
Ship
ping
age
ncy
3,00
6
3,00
6
0.1
100.
003,
006
-
-
In
dire
ct su
bsid
iary
of
the
Com
pany
(Not
e)
PT. M
ulti
Bin
a Pu
raIn
tern
atio
nal
PT. M
ulti
Bin
a Tr
ansp
ort
Indo
nesi
aC
onta
iner
repa
ir cl
eani
ng a
nd in
land
trans
porta
tion
98,0
54
98
,054
8
72.9
555
,480
1,
680
1,22
5
(Not
e)
Ever
gree
n Sh
ippi
ngA
genc
y (E
urop
e) G
mbH
Ever
gree
n Sh
ippi
ng A
genc
y (A
ustri
a)G
mbH
Aus
tria
Ship
ping
age
ncy
-
647
-
-
-
330
33
0
(N
ote)
Ever
gree
n Sh
ippi
ng A
genc
y(S
witz
erla
nd) S
.A.
Switz
erla
ndSh
ippi
ng a
genc
y2,
453
2,
453
0.
1
10
0.00
8,95
8
76
4
764
(Not
e)
Not
e: T
his t
rans
actio
n w
as w
ritte
n of
f whe
n th
e co
nsol
idat
ed fi
nanc
ial s
tate
men
ts w
ere
prep
ared
.N
ote
1: If
a p
ublic
com
pany
is e
quip
ped
with
an
over
seas
hol
ding
com
pany
and
take
s con
solid
ated
fina
ncia
l rep
ort a
s the
mai
n fin
anci
al re
port
acco
rdin
g to
the
loca
l law
rule
s, it
can
only
dis
clos
e th
e in
form
atio
n of
the
over
seas
hol
ding
com
pany
abo
ut th
e di
sclo
sure
of r
elat
ed o
vers
eas i
nves
tee
info
rmat
ion.
Not
e 2:
If si
tuat
ion
does
not
bel
ong
to N
ote
1, fi
ll in
the
colu
mns
acc
ordi
ng to
the
follo
win
g re
gula
tions
:
(1
) The
col
umns
of ‘
Inve
stee
’, ‘L
ocat
ion’
, ‘M
ain
busi
ness
act
iviti
es’,
Initi
al in
vest
men
t am
ount
’ and
‘Sha
res h
eld
as a
t Dec
embe
r 31,
201
7’ sh
ould
fill
orde
rly in
the
Com
pany
’s (p
ublic
com
pany
’s) i
nfor
mat
ion
on in
vest
ees a
nd e
very
dire
ctly
or i
ndire
ctly
con
trolle
d in
vest
ee’s
inve
stm
ent i
nfor
mat
ion,
and
not
e th
e re
latio
nshi
p be
twee
n th
e C
ompa
ny (p
ublic
com
pany
) and
its i
nves
tee
each
(ex.
dire
ct su
bsid
iary
or i
ndire
ct su
bsid
iary
) in
the
‘foot
note
’ col
umn.
(2) T
he ‘N
et p
rofit
(los
s) o
f the
inve
stee
For
they
ear e
nded
Dec
embe
r 31,
201
7’ c
olum
n sh
ould
fill
in a
mou
nt o
f net
pro
fit (l
oss)
of t
he in
vest
ee fo
r thi
s per
iod.
(3) T
he‘I
nves
tmen
t inc
ome
(loss
) rec
ogni
sed
by th
e C
ompa
ny F
or th
e ye
ar e
nded
Dec
embe
r 31,
201
7’ c
olum
n sh
ould
fill
in th
e C
ompa
ny (p
ublic
com
pany
) rec
ogni
sed
inve
stm
ent i
ncom
e (lo
ss) o
f its
dire
ct su
bsid
iary
and
reco
gnis
ed in
vest
men
t inc
ome
(loss
) of i
ts in
vest
ee a
ccou
nted
for u
nder
the
equi
ty m
etho
d fo
r thi
s per
iod.
Whe
n fil
ling
in re
cogn
ised
inve
stm
ent i
ncom
e (lo
ss) o
f its
dire
ct su
bsid
iary
, the
Com
pany
(pub
lic c
ompa
ny) s
houl
d
co
nfirm
that
dire
ct su
bsid
iary
’s n
et p
rofit
(los
s) fo
r thi
s per
iod
has i
nclu
ded
its in
vest
men
t inc
ome
(loss
) whi
ch sh
all b
e re
cogn
ised
by
regu
latio
ns.
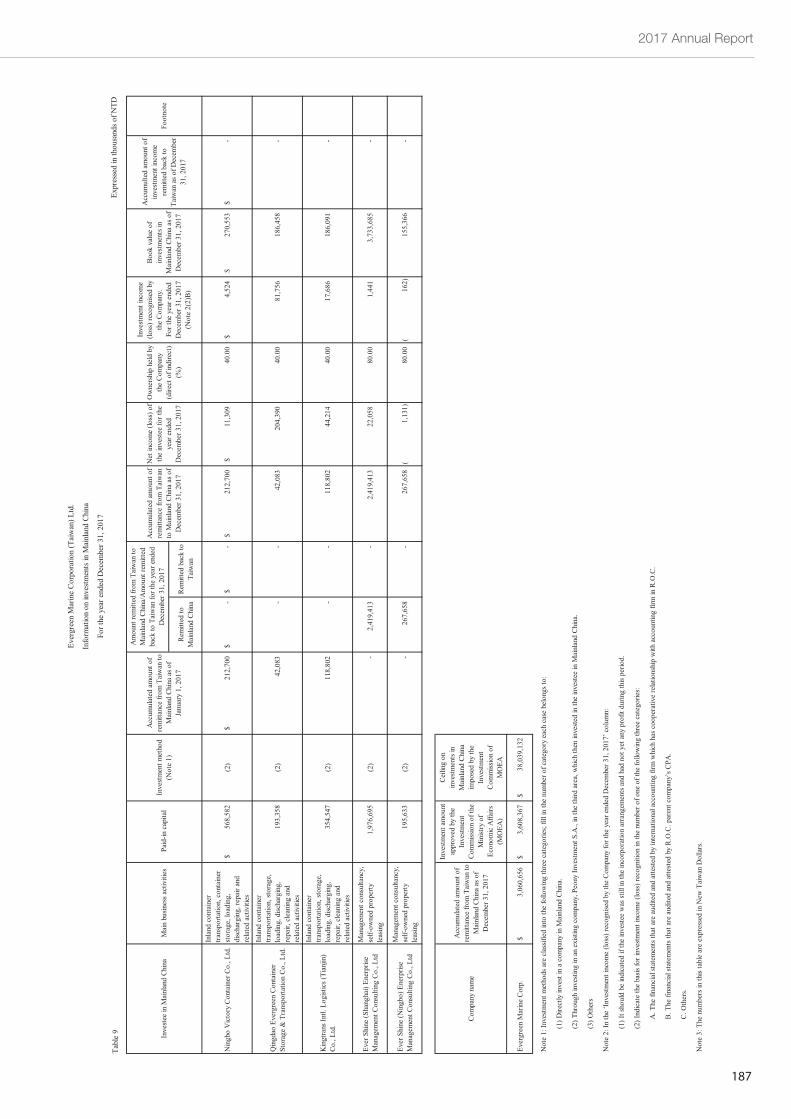
2017 Annual Report
187
Expr
esse
d in
thou
sand
s of N
TD
Rem
itted
toM
ainl
and
Chi
naR
emitt
ed b
ack
toTa
iwan
Nin
gbo
Vic
tory
Con
tain
er C
o., L
td.
Inla
nd c
onta
iner
trans
porta
tion,
con
tain
erst
orag
e, lo
adin
g,di
scha
rgin
g, re
pair
and
rela
ted
activ
ities
568,
582
$
(2)
212,
700
$
-
$
-$
21
2,70
0$
11
,309
$
40
.00
4,52
4$
27
0,55
3$
-$
Qin
gdao
Eve
rgre
en C
onta
iner
Stor
age
& T
rans
porta
tion
Co.
, Ltd
.
Inla
nd c
onta
iner
trans
porta
tion,
stor
age,
load
ing,
disc
harg
ing,
repa
ir, c
lean
ing
and
rela
ted
activ
ities
193,
358
(2)
42,0
83
-
-
42
,083
20
4,39
0
40
.00
81,7
56
186,
458
-
Kin
gtra
ns In
tl. L
ogist
ics (
Tian
jin)
Co.
, Ltd
.
Inla
nd c
onta
iner
trans
porta
tion,
stor
age,
load
ing,
disc
harg
ing,
repa
ir, c
lean
ing
and
rela
ted
activ
ities
354,
547
(2)
118,
802
-
-
11
8,80
2
44
,214
40
.00
17,6
86
186,
091
-
Ever
Shi
ne (S
hang
hai)
Ener
prise
Man
agem
ent C
onsu
lting
Co.
, Ltd
Man
agem
ent c
onsu
ltanc
y,se
lf-ow
ned
prop
erty
leas
ing
1,97
6,69
5
(2)
-
2,41
9,41
3
-
2,41
9,41
3
22,0
58
80.0
01,
441
3,73
3,68
5
-
Ever
Shi
ne (N
ingb
o) E
nerp
rise
Man
agem
ent C
onsu
lting
Co.
, Ltd
Man
agem
ent c
onsu
ltanc
y,se
lf-ow
ned
prop
erty
leas
ing
195,
633
(2)
-
267,
658
-
267,
658
1,13
1)(
80
.00
162)
(
15
5,36
6
-
Com
pany
nam
e
Acc
umul
ated
am
ount
of
rem
ittan
ce fr
om T
aiw
an to
Mai
nlan
d C
hina
as o
fD
ecem
ber 3
1, 2
017
Inve
stm
ent a
mou
ntap
prov
ed b
y th
eIn
vest
men
tC
omm
issio
n of
the
Min
istry
of
Econ
omic
Affa
irs(M
OEA
)
Cei
ling
onin
vest
men
ts in
Mai
nlan
d C
hina
impo
sed
by th
eIn
vest
men
tC
omm
issio
n of
MO
EA
Ever
gree
n M
arin
e C
orp.
$
3,06
0,65
6 $
3
,608
,367
$
38
,039
,132
Not
e 1:
Inve
stm
ent m
etho
ds a
re c
lass
ified
into
the
follo
win
g th
ree
cate
gorie
s; fil
l in
the
num
ber o
f cat
egor
y ea
ch c
ase
belo
ngs t
o:
(1) D
irect
ly in
vest
in a
com
pany
in M
ainl
and
Chi
na.
(2) T
hrou
gh in
vest
ing
in a
n ex
istin
g co
mpa
ny, P
eony
Inve
stm
ent S
.A.,
in th
e th
ird a
rea,
whi
ch th
en in
vest
ed in
the
inve
stee
in M
ainl
and
Chi
na.
(3) O
ther
s
Not
e 2:
In th
e ‘I
nves
tmen
t inc
ome
(loss
) rec
ogni
sed
by th
e C
ompa
ny fo
r the
yea
r end
ed D
ecem
ber 3
1, 2
017’
col
umn:
(1) I
t sho
uld
be in
dica
ted
if th
e in
vest
ee w
as st
ill in
the
inco
rpor
atio
n ar
rang
emen
ts a
nd h
ad n
ot y
et a
ny p
rofit
dur
ing
this
perio
d.
(2) I
ndic
ate
the
basis
for i
nves
tmen
t inc
ome
(loss
) rec
ogni
tion
in th
e nu
mbe
r of o
ne o
f the
follo
win
g th
ree
cate
gorie
s:
A
. The
fina
ncia
l sta
tem
ents
that
are
aud
ited
and
atte
sted
by
inte
rnat
iona
l acc
ount
ing
firm
whi
ch h
as c
oope
rativ
e re
latio
nshi
p w
ith a
ccou
ntin
g fir
m in
R.O
.C.
B
. The
fina
ncia
l sta
tem
ents
that
are
aud
ited
and
atte
sted
by
R.O
.C. p
aren
t com
pany
’s C
PA.
C
. Oth
ers.
Not
e 3:
The
num
bers
in th
is ta
ble
are
expr
esse
d in
New
Tai
wan
Dol
lars
.
Ow
ners
hip
held
by
the
Com
pany
(dire
ct o
f ind
irect
)(%
)
Inve
stm
ent i
ncom
e(lo
ss) r
ecog
nise
d by
the
Com
pany
.Fo
r the
yea
r end
edD
ecem
ber 3
1, 2
017
(Not
e 2(
2)B
)
Boo
k va
lue
ofin
vest
men
ts in
Mai
nlan
d C
hina
as o
fD
ecem
ber 3
1, 2
017
Acc
umul
ted
amou
nt o
fin
vest
men
t inc
ome
rem
itted
bac
k to
Taiw
an a
s of D
ecem
ber
31, 2
017
Am
ount
rem
itted
from
Tai
wan
toM
ainl
and
Chi
na/A
mou
nt re
mitt
edba
ck to
Tai
wan
for t
he y
ear e
nded
Dec
embe
r 31,
201
7
Ever
gree
n M
arin
e C
orpo
ratio
n (T
aiw
an) L
td.
Info
rmat
ion
on in
vest
men
ts in
Mai
nlan
d C
hina
For t
he y
ear e
nded
Dec
embe
r 31,
201
7
Tabl
e 9 Inve
stee
in M
ainl
and
Chi
naM
ain
busin
ess a
ctiv
ities
Paid
-in c
apita
lIn
vest
men
t met
hod
(Not
e 1)
Acc
umul
ated
am
ount
of
rem
ittan
ce fr
om T
aiw
an to
Mai
nlan
d C
hina
as o
fJa
nuar
y 1,
201
7
Foot
note
Acc
umul
ated
am
ount
of
rem
ittan
ce fr
om T
aiw
anto
Mai
nlan
d C
hina
as o
fD
ecem
ber 3
1, 2
017
Net
inco
me
(loss
) of
the
inve
stee
for t
heye
ar e
nded
Dec
embe
r 31,
201
7
188
4 Financial Statements
~1~
REPORT OF INDEPENDENTACCOUNTANTS TRANSLATED FROM CHINESE
To the Board of Directors and Shareholders of Evergreen Marine Corporation (Taiwan) Ltd.
Opinion
We have audited the accompanying parent company only balance sheets of Evergreen MarineCorporation (Taiwan) Ltd. (the “Company”) as of December 31, 2017 and 2016, and the related parentcompany only statements of comprehensive income, of changes in equity and of cash flows for the yearsthen ended, and notes to the financial statements, including a summary of significant accounting policies.
In our opinion, based on our audits and the reports of other independent accountants (please refer toOther Matter section of our report), the accompanying financial statements present fairly, in all materialrespects, the financial position of Evergreen Marine Corporation (Taiwan) Ltd. as of December 31,2017 and 2016, and its financial performance and its cash flows for the years then ended in accordancewith the “Regulations Governing the Preparations of Financial Reports by Securities Issuers” .
Basis for opinion
We conducted our audits in accordance with the “Regulations Governing Auditing and Attestation ofFinancial Statements by Certified Public Accountants” and generally accepted auditing standards in theRepublic of China (ROC GAAS). Our responsibilities under those standards are further described in theAuditor’s Responsibilities for the Audit of the parent company only Financial Statements section of ourreport. We are independent of the Company in accordance with the Code of Professional Ethics forCertified Public Accountants in the Republic of China (the “Code”), and we have fulfilled our otherethical responsibilities in accordance with the Code. We believe that the audit evidence we have obtainedalong with the report of other independent auditors are sufficient and appropriate to provide a basis forour opinion.
Key audit matters
Key audit matters are those matters that, in our professional judgement, were of most significance in ouraudit of the financial statements of the current period. These matters were addressed in the context ofour audit of the financial statements as a whole and, in forming our opinion thereon, we do not providea separate opinion on these matters.
4. Parent Company Only Financial Statements and Report of Independent Accountants
2017 Annual Report
189
~2~
The key audit matters of the parent company only financial statements for the year ended December 31,2017 are as follows:
Accuracy of freight revenue
DescriptionPlease refer to Note 4(29) for accounting policies on revenue recognition, Note 5(2) for uncertainty ofaccounting estimates and assumptions applied on revenue recognition, and Note 6(20) for details of salesrevenue.
Evergreen Marine Corporation (Taiwan) Ltd. primarily engages in global container shipping servicecovering ocean-going and near-sea shipping line, shipping agency business as well as container freightstation business. In 2017, freight revenue was NT$ 27,548,082 thousand, representing 95.33 % ofoperating revenue. Since ocean-going shipping often lasts for several days, voyages are sometimescompleted after the balance sheet date. Also, demands for freight are consistently sent by forwardersduring voyage. Due to the factors mentioned above, freight revenue is recognized under the percentage-of-completion method for each vessel of which the service has been provided during the reporting period.
Despite the Company conducting business worldwide, its transactions are all in small amounts, whereasthe freight rate is subject to fluctuation caused by cargo loading rate as well as market competition.Worldwide shipping agencies use a system to record the transactions by entering data including shippingdeparture, destination, counterparty, transit time, shipping amounts, and freight price for the Company.Therefore, management could recognize freight revenue in accordance with the data on bill of ladingreports generated from system, accompanied by estimation made from past experience and current cargoloading conditions the revenue that would flow in, and calculate the revenue under percentage-of-completion method. As the process of recording transactions, communicating with agencies, maintainingthe system are done manually, and the estimation of freight revenue is subject to management’sjudgement, therefore freight revenue involves high uncertainty and is material to the financial statements.Given the conditions as described above, we consider the accuracy of freight revenue and the appropriateuse of cut-off by the Company and its investee companies as a key audit matter.
190
4 Financial Statements
~3~
How our audit addressed the matter
We performed the following audit procedures on the above key audit matter:
1. Obtained an understanding of the operation and industry of the Company to assess the reasonablenessof policies and procedures on revenue recognition, and confirmed whether it is appropriate to thefinancial statements.
2. Obtained an understanding of the procedures of revenue recognition from booking, picking, billingto receiving. Assessed and tested relevant internal controls, including checking freight items andamounts of delivery information against the approved contracts and booking list. In addition,recalculated the accuracy of freight revenue, and ensured its consistencywith the bill of lading report.
3. Obtained the estimated freight income report for vessels underway as of balance sheets date, andinquired with management for the reasonableness of judgment. In addition, checked historical freightrevenue for total voyage under each individual vessel, along with comparing with current cargoloading condition as well as actual revenue received after period end to ensure the reasonableness ofrevenue assumptions.
4. Confirmed the completeness of vessels underway for the reporting period, including tracking themovements of shipments on the internet to ensure the vessels that depart before period end have beentaken into consideration in the freight revenue calculation.
5. Verified accuracy of data used in calculating percentage of completion under each voyage, includingselecting samples and check whether total shipping days shown on the Company’s website are inagreement with cruise timetable as well as recalculating shipping days (days between departure andbalance sheet date), in order to examine the soundness of percentage applied.
2017 Annual Report
191
~4~
Impairment of property, plant and equipment
DescriptionPlease refer to Note 4(15) for accounting policies on property, plant and equipment, Note 5(2) foruncertainty of accounting estimates and assumptions applied on impairment of property, plant andequipment, and Note 6(8) for details of property, plant and equipment.
As of December 31, 2017, property, plant and equipment amounted to NT$ 27,118,687 thousand,constituting 22.45% of total assets, and ship equipment, transport equipment and cargo handlingequipment amounted to NT$ 26,021,184 thousand, accounting for approximately 95.95% of totalproperty, plant and equipment. As new ships have been built and put into operation by many carriersaround the world, market supply has exceeded demand. Therefore, the market imbalance led to pricecompetition, resulting to losses for the industry and raising the risk of asset impairment. The valuationof impairment and recoverable amounts are evaluated by the Company using the present value of thefuture cash flows expected to be derived from an asset or cash-generating unit compared to the bookvalue. The main assumptions of discounts rates used in recoverable amounts, and expected operatingrevenue growth rates, gross profit, operating profit rates, capital expenditures and discount rates used infuture cash flow estimates are subject to management’s judgement and involve high uncertainty, and theestimated results are material to the financial statements. Given the conditions as described above existin the Company and its investee companies using equitymethod, we consider the impairment assessmentof ship equipment, transport equipment and cargo handling equipment in the property, plant andequipment under the Company and its investee companies as a key audit matter.
How our audit addressed the matter
We performed the following audit procedures on the above key audit matter:
1. Obtained an understanding and assessed the relevant policies, internal controls and process appliedto valuation of assets impairments.
2. Interviewed with management regarding the impairment test report, and assessed the reasonablenessof discounts rate and the reasonableness of operating revenue, gross profit, operating profit rate,growth rates and capital expenditure that management used in estimating future cash flows bychecking actual performance under past operating plans and comparing the performance withindustry forecast to evaluate the intention and capability of management.
3. Checked the parameters of the valuation model and recalculated the valuation model for accuracy.
192
4 Financial Statements
~5~
Other matter – Audit by other independent accountants
We did not audit the financial statements of all the investee companies accounted for using equitymethod.Those statements were audited by other independent accountants whose reports thereon have beenfurnished to us, and our opinion expressed herein, insofar as it relates to the amounts included for thoseinvestee companies accounted for using equity method and information disclosed in Note 13 relating tothese long-term equity investments, is based solely on the reports of the other independent accountants.Long-term equity investments in these investee companies amounted to NT$ 20,592,791 thousand andNT$ 19,659,814 thousand, constituting 17.05% and 18.54% of the total assets as of December 31, 2017,and 2016, respectively, and comprehensive loss (including share of profit or loss and share of othercomprehensive income of associates and joint ventures accounted for using equity method) was NT$1,848,434 thousand and NT$ 3,321,665 thousand for the years then ended.
Responsibilities of management and those charged with governance for the parentcompany only financial statements
Management is responsible for the preparation and fair presentation of the financial statements inaccordance with the “Regulations Governing the Preparations of Financial Reports by Securities Issuers”and for such internal control as management determines is necessary to enable the preparation offinancial statements that are free from material misstatement, whether due to fraud or error.
In preparing the financial statements, management is responsible for assessing the Company’s ability tocontinue as a going concern, disclosing, as applicable, matters related to going concern and using thegoing concern basis of accounting unless management either intends to liquidate the Company, or tocease operations, or has no realistic alternative but to do so.
Those charged with governance, including supervisors, are responsible for overseeing the Company’sfinancial reporting process.
2017 Annual Report
193
~6~
Auditor’s responsibilities for the audit of the parent company only financial statements
Our objectives are to obtain reasonable assurance about whether the parent company only financialstatements as a whole are free from material misstatement, whether due to fraud or error, and to issue anauditor’s report that includes our opinion. Reasonable assurance is a high level of assurance, but is nota guarantee that an audit conducted in accordance with ROC GAAS will always detect a materialmisstatement when it exists. Misstatements can arise from fraud or error and are considered material if,individually or in the aggregate, they could reasonably be expected to influence the economic decisionsof users taken on the basis of these parent company only financial statements.
As part of an audit in accordance with ROC GAAS, we exercise professional judgement and maintainprofessional skepticism throughout the audit. We also:1. Identify and assess the risks of material misstatement of the parent company only financial
statements, whether due to fraud or error, design and perform audit procedures responsive to thoserisks, and obtain audit evidence that is sufficient and appropriate to provide a basis for our opinion.The risk of not detecting a material misstatement resulting from fraud is higher than for oneresulting from error, as fraud may involve collusion, forgery, intentional omissions,misrepresentations, or the override of internal control.
2. Obtain an understanding of internal control relevant to the audit in order to design audit proceduresthat are appropriate in the circumstances, but not for the purpose of expressing an opinion on theeffectiveness of the Company’s internal control.
3. Evaluate the appropriateness of accounting policies used and the reasonableness of accountingestimates and related disclosures made by management.
4. Conclude on the appropriateness of management’s use of the going concern basis of accountingand, based on the audit evidence obtained, whether a material uncertainty exists related to eventsor conditions that may cast significant doubt on the Company’s ability to continue as a goingconcern. If we conclude that a material uncertainty exists, we are required to draw attention in ourauditor’s report to the related disclosures in the financial statements or, if such disclosures areinadequate, to modify our opinion. Our conclusions are based on the audit evidence obtained up tothe date of our auditor’s report. However, future events or conditions may cause the Company tocease to continue as a going concern.
194
4 Financial Statements
~7~
5. Evaluate the overall presentation, structure and content of the parent company only financialstatements, including the disclosures, and whether the financial statements represent the underlyingtransactions and events in a manner that achieves fair presentation.
6. Obtain sufficient appropriate audit evidence regarding the financial information of the entities orbusiness activities within the Company to express an opinion on the financial statements. We areresponsible for the direction, supervision and performance of the audit. We remain solelyresponsible for our audit opinion.
We communicate with those charged with governance regarding, among other matters, the planned scopeand timing of the audit and significant audit findings, including any significant deficiencies in internalcontrol that we identify during our audit.We also provide those charged with governance with a statement that we have complied with relevantethical requirements regarding independence, and to communicate with them all relationships and othermatters that may reasonably be thought to bear on our independence, and where applicable, relatedsafeguards.From the matters communicated with those charged with governance, we determine those matters thatwere of most significance in the audit of the parent company only financial statements of the currentperiod and are therefore the key audit matters. We describe these matters in our auditor’s report unlesslaw or regulation precludes public disclosure about the matter or when, in extremely rare circumstances,we determine that a matter should not be communicated in our report because the adverse consequencesof doing so would reasonably be expected to outweigh the public interest benefits of suchcommunication.
Lai, Chung-Hsi Chih, Ping-Chiun
For and on behalf of PricewaterhouseCoopers, TaiwanMarch 23, 2018-------------------------------------------------------------------------------------------------------------------------------------------------The accompanying parent company only financial statements are not intended to present the financial position and results ofoperations and cash flows in accordance with accounting principles generally accepted in countries and jurisdictions otherthan the Republic of China. The standards, procedures and practices in the Republic of China governing the audit of suchfinancial statements may differ from those generally accepted in countries and jurisdictions other than the Republic of China.Accordingly, the accompanying parent company only financial statements and report of independent accountants are notintended for use by those who are not informed about the accounting principles or auditing standards generally accepted inthe Republic of China, and their applications in practice.As the financial statements are the responsibility of the management, PricewaterhouseCoopers cannot accept any liability forthe use of, or reliance on, the English translation or for any errors or misunderstandings that may derive from the translation.
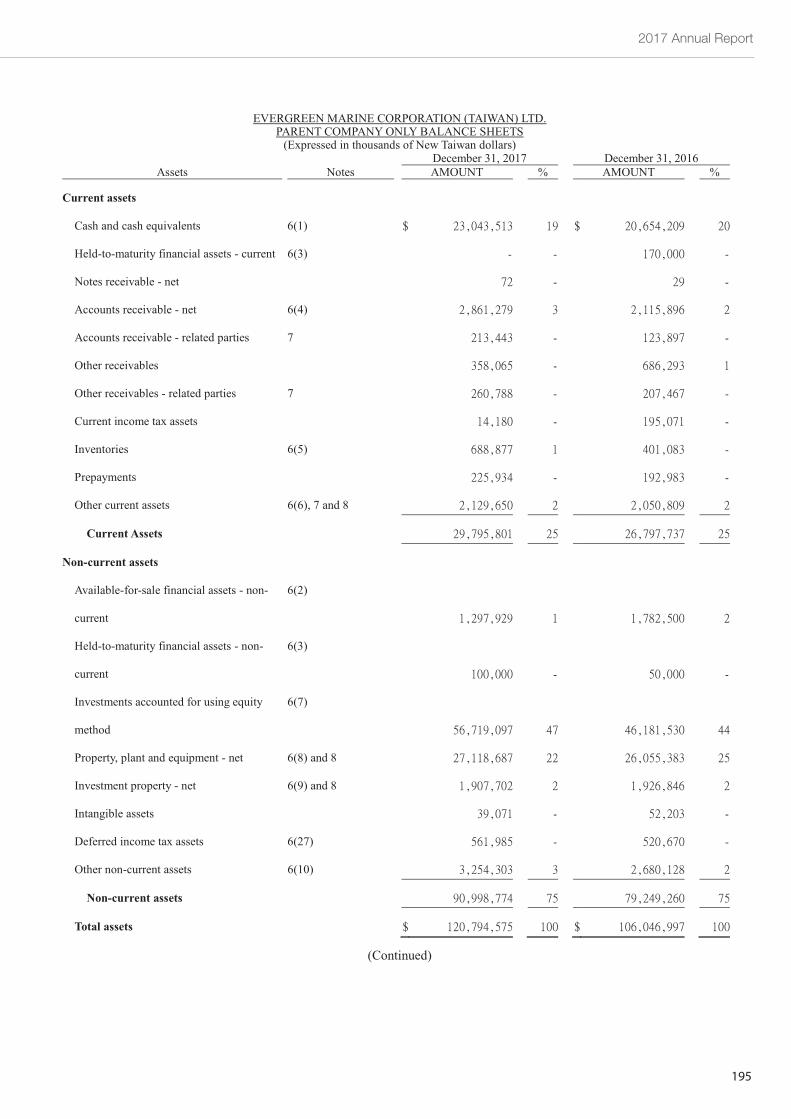
2017 Annual Report
195
EVERGREEN MARINE CORPORATION (TAIWAN) LTD.PARENT COMPANYONLY BALANCE SHEETS(Expressed in thousands of New Taiwan dollars)
~8~
December 31, 2017 December 31, 2016Assets Notes AMOUNT % AMOUNT %
Current assets
Cash and cash equivalents 6(1)
Held-to-maturity financial assets - current 6(3)
Notes receivable - net
Accounts receivable - net 6(4)
Accounts receivable - related parties 7
Other receivables
Other receivables - related parties 7
Current income tax assets
Inventories 6(5)
Prepayments
Other current assets 6(6), 7 and 8
Current Assets
Non-current assets
Available-for-sale financial assets - non-
current
6(2)
Held-to-maturity financial assets - non-
current
6(3)
Investments accounted for using equity
method
6(7)
Property, plant and equipment - net 6(8) and 8
Investment property - net 6(9) and 8
Intangible assets
Deferred income tax assets 6(27)
Other non-current assets 6(10)
Non-current assets
Total assets
(Continued)
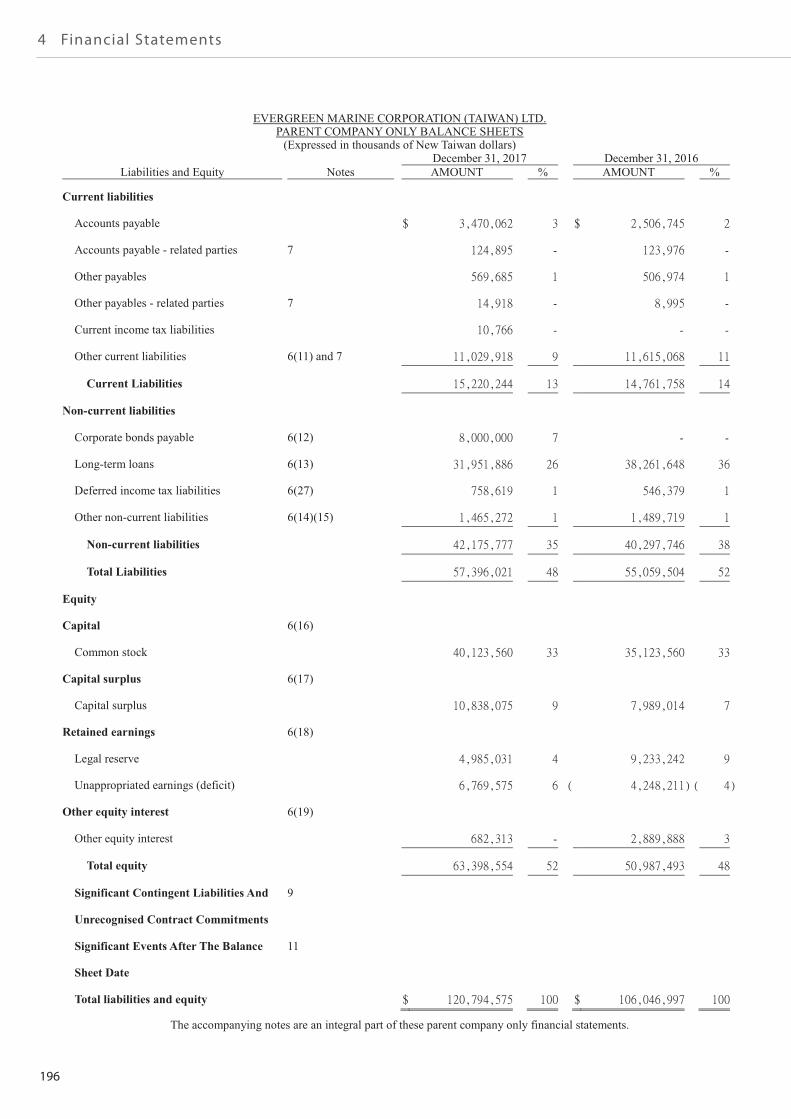
196
4 Financial Statements
EVERGREEN MARINE CORPORATION (TAIWAN) LTD.PARENT COMPANYONLY BALANCE SHEETS(Expressed in thousands of New Taiwan dollars)
The accompanying notes are an integral part of these parent company only financial statements.
~9~
December 31, 2017 December 31, 2016Liabilities and Equity Notes AMOUNT % AMOUNT %
Current liabilities
Accounts payable
Accounts payable - related parties 7
Other payables
Other payables - related parties 7
Current income tax liabilities
Other current liabilities 6(11) and 7
Current Liabilities
Non-current liabilities
Corporate bonds payable 6(12)
Long-term loans 6(13)
Deferred income tax liabilities 6(27)
Other non-current liabilities 6(14)(15)
Non-current liabilities
Total Liabilities
Equity
Capital 6(16)
Common stock
Capital surplus 6(17)
Capital surplus
Retained earnings 6(18)
Legal reserve
Unappropriated earnings (deficit)
Other equity interest 6(19)
Other equity interest
Total equity
Significant Contingent Liabilities And
Unrecognised Contract Commitments
9
Significant Events After The Balance
Sheet Date
11
Total liabilities and equity
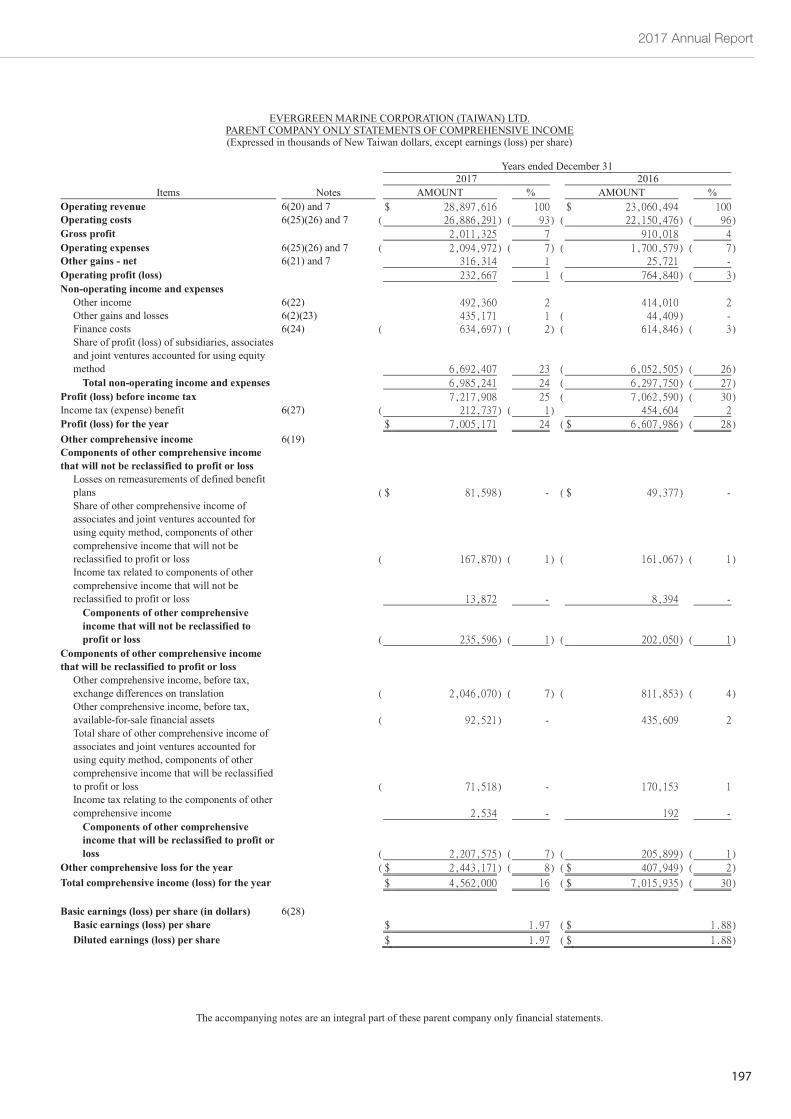
2017 Annual Report
197
EVERGREENMARINE CORPORATION (TAIWAN) LTD.PARENT COMPANY ONLY STATEMENTS OF COMPREHENSIVE INCOME(Expressed in thousands of New Taiwan dollars, except earnings (loss) per share)
The accompanying notes are an integral part of these parent company only financial statements.
~10~
Years ended December 312017 2016
Items Notes AMOUNT % AMOUNT %Operating revenue 6(20) and 7Operating costs 6(25)(26) and 7Gross profitOperating expenses 6(25)(26) and 7Other gains - net 6(21) and 7Operating profit (loss)Non-operating income and expensesOther income 6(22)Other gains and losses 6(2)(23)Finance costs 6(24)Share of profit (loss) of subsidiaries, associatesand joint ventures accounted for using equitymethodTotal non-operating income and expenses
Profit (loss) before income taxIncome tax (expense) benefit 6(27)Profit (loss) for the yearOther comprehensive income 6(19)Components of other comprehensive incomethat will not be reclassified to profit or lossLosses on remeasurements of defined benefitplansShare of other comprehensive income ofassociates and joint ventures accounted forusing equity method, components of othercomprehensive income that will not bereclassified to profit or lossIncome tax related to components of othercomprehensive income that will not bereclassified to profit or lossComponents of other comprehensiveincome that will not be reclassified toprofit or loss
Components of other comprehensive incomethat will be reclassified to profit or lossOther comprehensive income, before tax,exchange differences on translationOther comprehensive income, before tax,available-for-sale financial assetsTotal share of other comprehensive income ofassociates and joint ventures accounted forusing equity method, components of othercomprehensive income that will be reclassifiedto profit or lossIncome tax relating to the components of othercomprehensive incomeComponents of other comprehensiveincome that will be reclassified to profit orloss
Other comprehensive loss for the yearTotal comprehensive income (loss) for the year
Basic earnings (loss) per share (in dollars) 6(28)Basic earnings (loss) per shareDiluted earnings (loss) per share
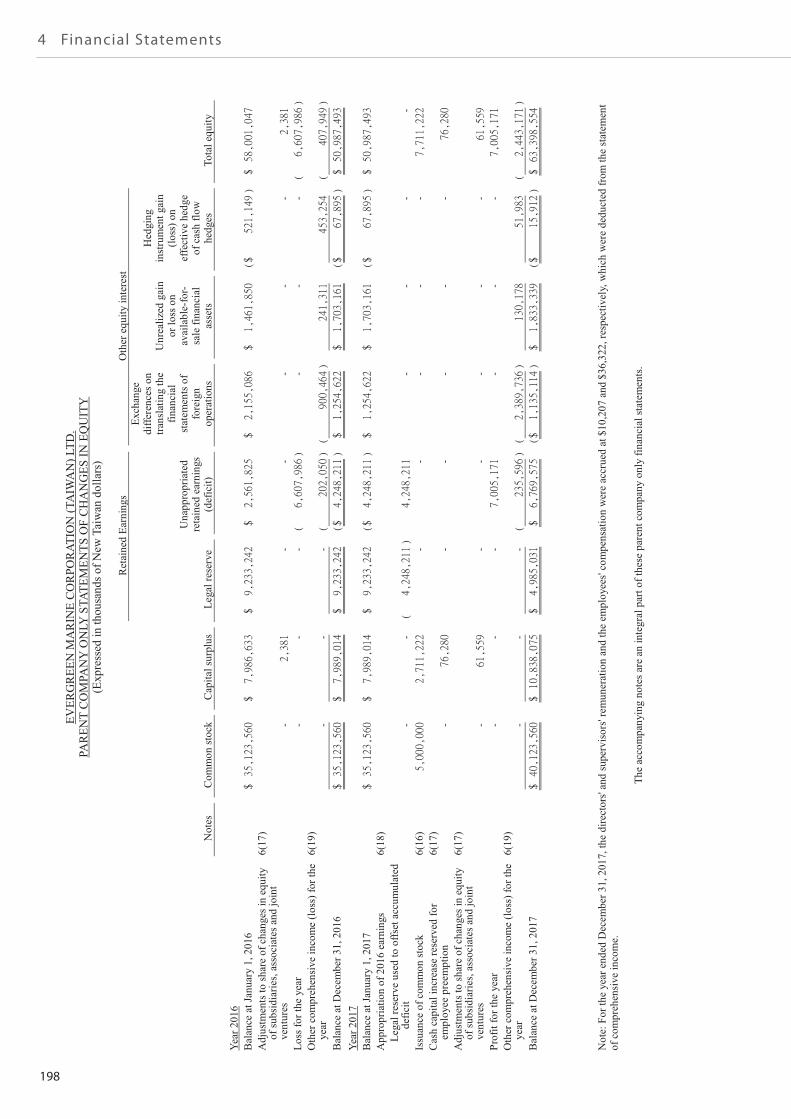
198
4 Financial Statements
EVERGREENMARINECORPORATION(TAIWAN)LTD.
PARENTCOMPANYONLYSTATEMENTSOFCHANGESINEQUITY
(ExpressedinthousandsofNewTaiwandollars)
RetainedEarnings
Otherequityinterest
Notes
Commonstock
Capitalsurplus
Legalreserve
Unappropriated
retainedearnings
(deficit)
Exchange
differenceson
translatingthe
financial
statementsof
foreign
operations
Unrealizedgain
orlosson
available-for-
salefinancial
assets
Hedging
instrumentgain
(loss)on
effectivehedge
ofcashflow
hedges
Totalequity
Note:FortheyearendedDecember31,2017,thedirectors'andsupervisors'remunerationandtheemployees'compensationwereaccruedat$10,207and$36,322,respectively,whichweredeductedfromthestatement
ofcomprehensiveincome.
Theaccompanyingnotesareanintegralpartoftheseparentcompanyonlyfinancialstatements.
~11~
Year2016
BalanceatJanuary1,2016
Adjustmentstoshareofchangesinequity
ofsubsidiaries,associatesandjoint
ventures
6(17)
Lossfortheyear
Othercomprehensiveincome(loss)forthe
year
6(19)
BalanceatDecember31,2016
Year2017
BalanceatJanuary1,2017
Appropriationof2016earnings
6(18)
Legalreserveusedtooffsetaccumulated
deficit
Issuanceofcommonstock
6(16)
Cashcapitalincreasereservedfor
employeepreemption
6(17)
Adjustmentstoshareofchangesinequity
ofsubsidiaries,associatesandjoint
ventures
6(17)
Profitfortheyear
Othercomprehensiveincome(loss)forthe
year
6(19)
BalanceatDecember31,2017
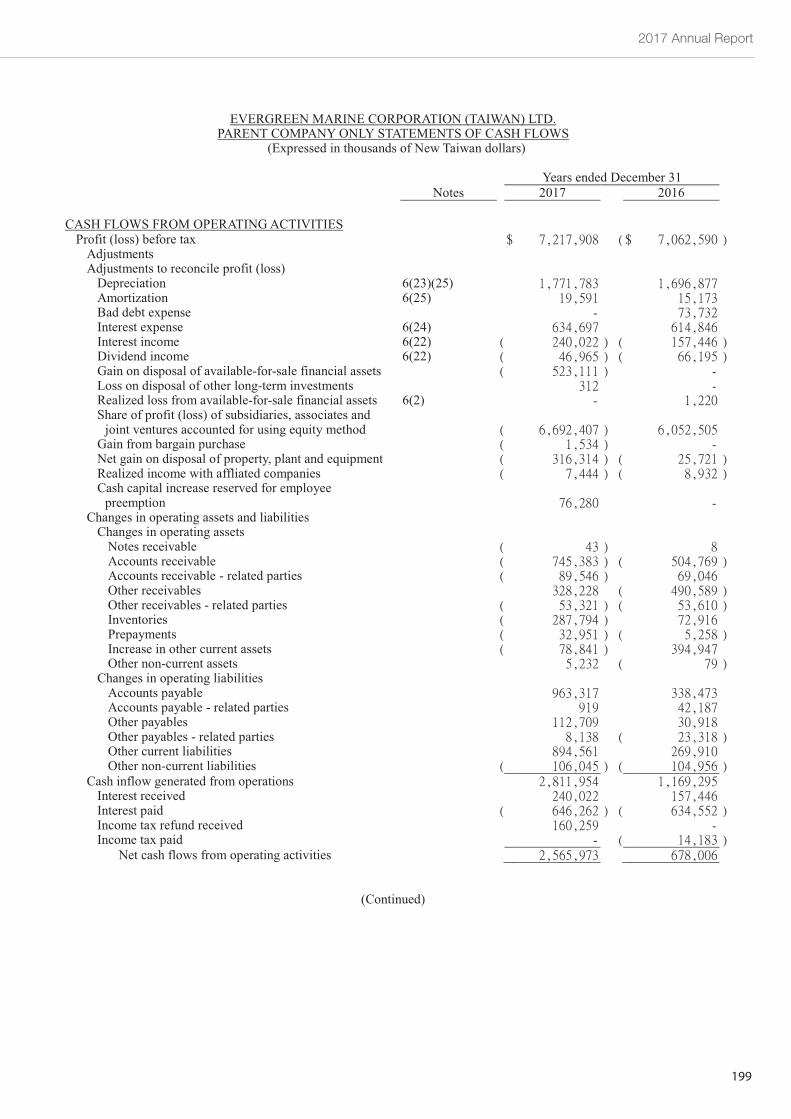
2017 Annual Report
199
EVERGREEN MARINE CORPORATION (TAIWAN) LTD.PARENT COMPANY ONLY STATEMENTS OF CASH FLOWS
(Expressed in thousands of New Taiwan dollars)
Years ended December 31Notes 2017 2016
~12~
CASH FLOWS FROM OPERATINGACTIVITIESProfit (loss) before taxAdjustmentsAdjustments to reconcile profit (loss)Depreciation 6(23)(25)Amortization 6(25)Bad debt expenseInterest expense 6(24)Interest income 6(22)Dividend income 6(22)Gain on disposal of available-for-sale financial assetsLoss on disposal of other long-term investmentsRealized loss from available-for-sale financial assets 6(2)Share of profit (loss) of subsidiaries, associates andjoint ventures accounted for using equity methodGain from bargain purchaseNet gain on disposal of property, plant and equipmentRealized income with affliated companiesCash capital increase reserved for employeepreemption
Changes in operating assets and liabilitiesChanges in operating assetsNotes receivableAccounts receivableAccounts receivable - related partiesOther receivablesOther receivables - related partiesInventoriesPrepaymentsIncrease in other current assetsOther non-current assets
Changes in operating liabilitiesAccounts payableAccounts payable - related partiesOther payablesOther payables - related partiesOther current liabilitiesOther non-current liabilities
Cash inflow generated from operationsInterest receivedInterest paidIncome tax refund receivedIncome tax paid
Net cash flows from operating activities
(Continued)
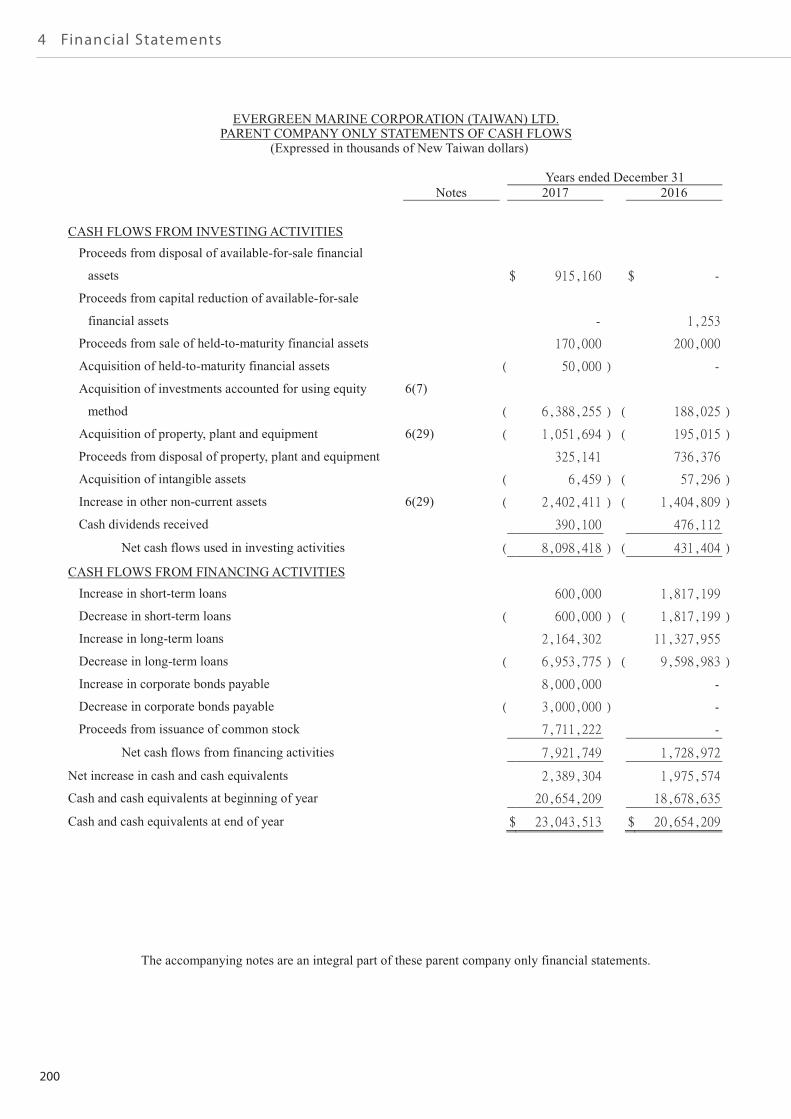
200
4 Financial Statements
EVERGREEN MARINE CORPORATION (TAIWAN) LTD.PARENT COMPANY ONLY STATEMENTS OF CASH FLOWS
(Expressed in thousands of New Taiwan dollars)
Years ended December 31Notes 2017 2016
The accompanying notes are an integral part of these parent company only financial statements.
~13~
CASH FLOWS FROM INVESTINGACTIVITIESProceeds from disposal of available-for-sale financial
assets
Proceeds from capital reduction of available-for-sale
financial assets
Proceeds from sale of held-to-maturity financial assets
Acquisition of held-to-maturity financial assets
Acquisition of investments accounted for using equity
method
6(7)
Acquisition of property, plant and equipment 6(29)
Proceeds from disposal of property, plant and equipment
Acquisition of intangible assets
Increase in other non-current assets 6(29)
Cash dividends received
Net cash flows used in investing activities
CASH FLOWS FROM FINANCINGACTIVITIESIncrease in short-term loans
Decrease in short-term loans
Increase in long-term loans
Decrease in long-term loans
Increase in corporate bonds payable
Decrease in corporate bonds payable
Proceeds from issuance of common stock
Net cash flows from financing activities
Net increase in cash and cash equivalents
Cash and cash equivalents at beginning of year
Cash and cash equivalents at end of year
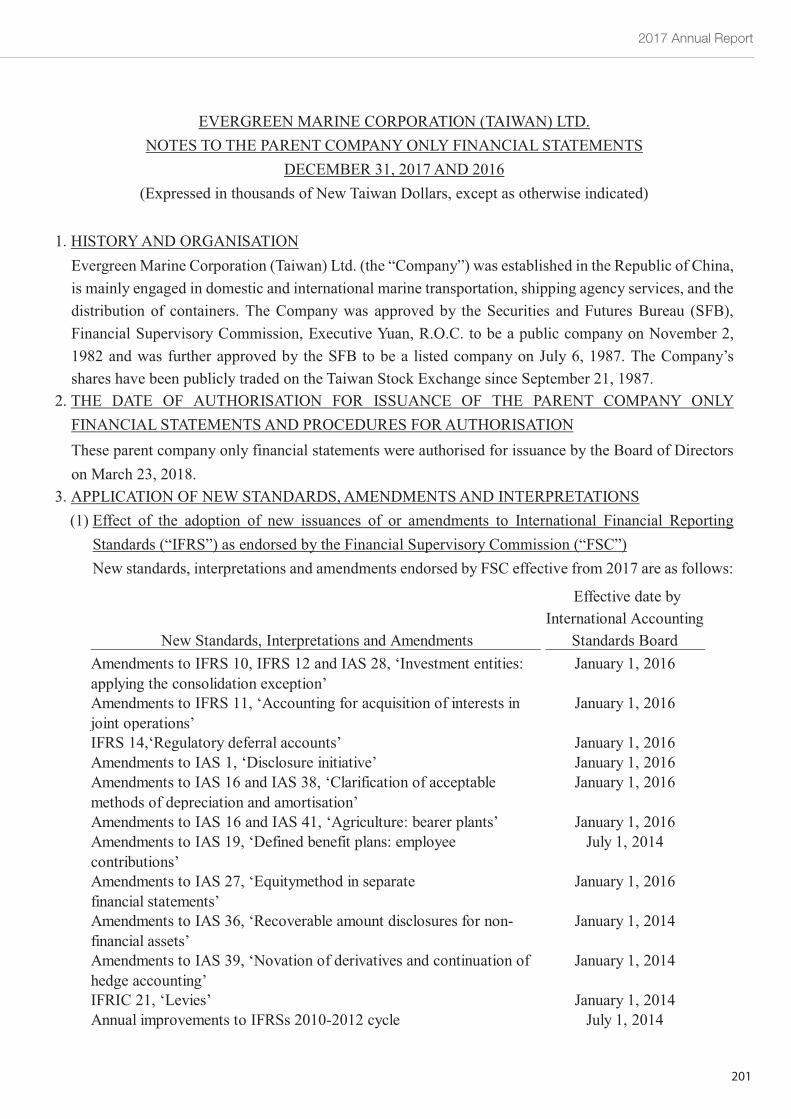
2017 Annual Report
201
~14~
EVERGREEN MARINE CORPORATION (TAIWAN) LTD.NOTES TO THE PARENT COMPANYONLY FINANCIAL STATEMENTS
DECEMBER 31, 2017 AND 2016(Expressed in thousands of New Taiwan Dollars, except as otherwise indicated)
1. HISTORYAND ORGANISATIONEvergreen Marine Corporation (Taiwan) Ltd. (the “Company”) was established in the Republic of China,is mainly engaged in domestic and international marine transportation, shipping agency services, and thedistribution of containers. The Company was approved by the Securities and Futures Bureau (SFB),Financial Supervisory Commission, Executive Yuan, R.O.C. to be a public company on November 2,1982 and was further approved by the SFB to be a listed company on July 6, 1987. The Company’sshares have been publicly traded on the Taiwan Stock Exchange since September 21, 1987.
2. THE DATE OF AUTHORISATION FOR ISSUANCE OF THE PARENT COMPANY ONLYFINANCIAL STATEMENTSAND PROCEDURES FORAUTHORISATIONThese parent company only financial statements were authorised for issuance by the Board of Directorson March 23, 2018.
3. APPLICATION OF NEW STANDARDS, AMENDMENTSAND INTERPRETATIONS(1) Effect of the adoption of new issuances of or amendments to International Financial ReportingStandards (“IFRS”) as endorsed by the Financial Supervisory Commission (“FSC”)New standards, interpretations and amendments endorsed by FSC effective from 2017 are as follows:
New Standards, Interpretations and Amendments
Effective date byInternational Accounting
Standards BoardAmendments to IFRS 10, IFRS 12 and IAS 28, ‘Investment entities:applying the consolidation exception’
January 1, 2016
Amendments to IFRS 11, ‘Accounting for acquisition of interests injoint operations’
January 1, 2016
IFRS 14,‘Regulatory deferral accounts’ January 1, 2016Amendments to IAS 1, ‘Disclosure initiative’ January 1, 2016Amendments to IAS 16 and IAS 38, ‘Clarification of acceptablemethods of depreciation and amortisation’
January 1, 2016
Amendments to IAS 16 and IAS 41, ‘Agriculture: bearer plants’ January 1, 2016Amendments to IAS 19, ‘Defined benefit plans: employeecontributions’
July 1, 2014
Amendments to IAS 27, ‘Equitymethod in separatefinancial statements’
January 1, 2016
Amendments to IAS 36, ‘Recoverable amount disclosures for non-financial assets’
January 1, 2014
Amendments to IAS 39, ‘Novation of derivatives and continuation ofhedge accounting’
January 1, 2014
IFRIC 21, ‘Levies’ January 1, 2014Annual improvements to IFRSs 2010-2012 cycle July 1, 2014
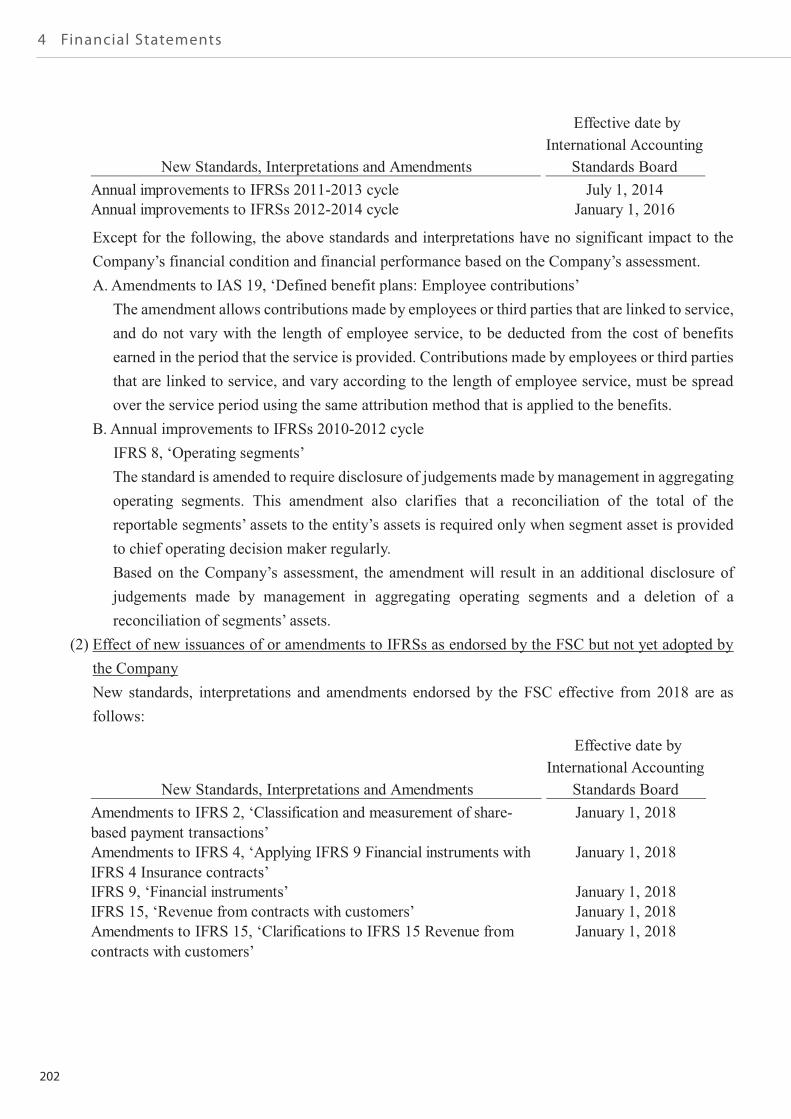
202
4 Financial Statements
~15~
Except for the following, the above standards and interpretations have no significant impact to theCompany’s financial condition and financial performance based on the Company’s assessment.A. Amendments to IAS 19, ‘Defined benefit plans: Employee contributions’The amendment allows contributions made by employees or third parties that are linked to service,and do not vary with the length of employee service, to be deducted from the cost of benefitsearned in the period that the service is provided. Contributions made by employees or third partiesthat are linked to service, and vary according to the length of employee service, must be spreadover the service period using the same attribution method that is applied to the benefits.
B. Annual improvements to IFRSs 2010-2012 cycleIFRS 8, ‘Operating segments’The standard is amended to require disclosure of judgements made bymanagement in aggregatingoperating segments. This amendment also clarifies that a reconciliation of the total of thereportable segments’ assets to the entity’s assets is required only when segment asset is providedto chief operating decision maker regularly.Based on the Company’s assessment, the amendment will result in an additional disclosure ofjudgements made by management in aggregating operating segments and a deletion of areconciliation of segments’ assets.
(2) Effect of new issuances of or amendments to IFRSs as endorsed by the FSC but not yet adopted bythe CompanyNew standards, interpretations and amendments endorsed by the FSC effective from 2018 are asfollows:
New Standards, Interpretations and Amendments
Effective date byInternational Accounting
Standards BoardAnnual improvements to IFRSs 2011-2013 cycle July 1, 2014Annual improvements to IFRSs 2012-2014 cycle January 1, 2016
New Standards, Interpretations and Amendments
Effective date byInternational Accounting
Standards BoardAmendments to IFRS 2, ‘Classification and measurement of share-based payment transactions’
January 1, 2018
Amendments to IFRS 4, ‘Applying IFRS 9 Financial instruments withIFRS 4 Insurance contracts’
January 1, 2018
IFRS 9, ‘Financial instruments’ January 1, 2018IFRS 15, ‘Revenue from contracts with customers’ January 1, 2018Amendments to IFRS 15, ‘Clarifications to IFRS 15 Revenue fromcontracts with customers’
January 1, 2018
2017 Annual Report
203
~16~
Except for the following, the above standards and interpretations have no significant impact to theCompany’s financial condition and financial performance based on the Company’s assessment. Thequantitative impact will be disclosed when the assessment is complete.A. IFRS 9, ‘Financial instruments’(a) Classification of debt instruments is driven by the entity’s business model and the contractualcash flow characteristics of the financial assets, which would be classified as financial asset atfair value through profit or loss, financial asset measured at fair value through othercomprehensive income or financial asset measured at amortised cost. Equity instrumentswould be classified as financial asset at fair value through profit or loss, unless an entity makesan irrevocable election at inception to present in other comprehensive income subsequentchanges in the fair value of an investment in an equity instrument that is not held for trading.
(b) The impairment losses of debt instruments are assessed using an ‘expected credit loss’approach. An entity assesses at each balance sheet date whether there has been a significantincrease in credit risk on that instrument since initial recognition to recognise 12-monthexpected credit losses or lifetime expected credit losses (interest revenue would be calculatedon the gross carrying amount of the asset before impairment losses occurred); or if theinstrument that has objective evidence of impairment, interest revenue after the impairmentwould be calculated on the book value of net carrying amount (i.e. net of credit allowance).
(c) The amended general hedge accounting requirements align hedge accounting more closelywith an entity’s risk management strategy. Risk components of non-financial items and a groupof items can be designated as hedged items. The standard relaxes the requirements for hedgeeffectiveness, removing the 80-125% bright line, and introduces the concept of ‘rebalancing’;while its risk management objective remains unchanged, an entity shall rebalance the hedgeditem or the hedging instrument for the purpose of maintaining the hedge ratio.
New Standards, Interpretations and Amendments
Effective date byInternational Accounting
Standards BoardAmendments to IAS 7, ‘Disclosure initiative’ January 1, 2017Amendments to IAS 12, ‘Recognition of deferred tax assets forunrealised losses’
January 1, 2017
Amendments to IAS 40, ‘Transfers of investment property’ January 1, 2018IFRIC 22, ‘Foreign currency transactions and advance consideration’ January 1, 2018Annual improvements to IFRSs 2014-2016 cycle- Amendments toIFRS 1, ‘First-time adoption of International Financial ReportingStandards’
January 1, 2018
Annual improvements to IFRSs 2014-2016 cycle- Amendments toIFRS 12, ‘Disclosure of interests in other entities’
January 1, 2017
Annual improvements to IFRSs 2014-2016 cycle- Amendments to IAS28, ‘Investments in associates and joint ventures’
January 1, 2018
204
4 Financial Statements
~17~
B. IFRS 15, ‘Revenue from contracts with customers’IFRS 15, ‘Revenue from contracts with customers’ replaces IAS 11, ‘Construction contracts’, IAS18, ‘Revenue’ and relevant interpretations. According to IFRS 15, revenue is recognised when acustomer obtains control of promised goods or services. A customer obtains control of goods orservices when a customer has the ability to direct the use of, and obtain substantially all of theremaining benefits from, the asset.The core principle of IFRS 15 is that an entity recognises revenue to depict the transfer of promisedgoods or services to customers in an amount that reflects the consideration to which the entityexpects to be entitled in exchange for those goods or services. An entity recognises revenue inaccordance with that core principle by applying the following steps:Step 1: Identify contracts with customer.Step 2: Identify separate performance obligations in the contract(s).Step 3: Determine the transaction price.Step 4: Allocate the transaction price.Step 5: Recognise revenue when the performance obligation is satisfied.Further, IFRS 15 includes a set of comprehensive disclosure requirements that requires an entityto disclose sufficient information to enable users of financial statements to understand the nature,amount, timing and uncertainty of revenue and cash flows arising from contracts with customers.
C. Amendments to IAS 7, ‘Disclosure initiative’This amendment requires that an entity shall provide more disclosures related to changes inliabilities arising from financing activities, including both changes arising from cash flows andnon-cash changes.The Company expects to provide additional disclosure to explain the changes in liabilities arisingfrom financing activities.
When adopting the new standards endorsed by the FSC effective from 2018, the Company will applythe new rules under IFRS 9 retrospectively from January 1, 2018, with the practical expedientspermitted under the statement. Further, the Company expects to adopt IFRS 15 using the modifiedretrospective approach. The significant effects of applying the new standards as of January 1, 2018are summarised below:A. The effect of the adoption of the new standard is the reclassification of financial assets in theamount of $1,297,929 from available-for-sale financial assets-non-current to financial assets atfair value through other comprehensive income in accordance with classification rules of IFRS 9.
B. In line with the regulations under IFRS 9 on provision for impairment, other equity interest willhave to be decreased by $192,156 and retained earnings increased by $192,156.
C. In accordance with IFRS 9, the Company expects to reclassify held-to-maturity financial assets of$100,000 by increasing financial assets at amortised cost in the amount of $100,000.
2017 Annual Report
205
~18~
(3) IFRSs issued by IASB but not yet endorsed by the FSCNew standards, interpretations and amendments issued by IASB but not yet included in the IFRSs asendorsed by the FSC are as follows:
Except for the following, the above standards and interpretations have no significant impact to theCompany’s financial condition and financial performance based on the Company’s assessment. Thequantitative impact will be disclosed when the assessment is complete.A. IFRS 16, ‘Leases’IFRS 16, ‘Leases’, replaces IAS 17, ‘Leases’ and related interpretations and SICs. The standardrequires lessees to recognise a 'right-of-use asset' and a lease liability (except for those leases withterms of 12 months or less and leases of low-value assets). The accounting stays the same forlessors, which is to classify their leases as either finance leases or operating leases and account forthose two types of leases differently. IFRS 16 only requires enhanced disclosures to be providedby lessors.
B. Amendments to IAS 19, ‘Plan amendment, curtailment or settlement’When a change to a plan take place the amendments require a company to use the updatedassumptions from this remeasurement to determine current service cost and net interest for theremainder of the reporting period after the change to the plan.
C. Annual improvements to IFRSs 2015-2017 cycle(a) Amendments to IFRS 3, ‘Business combinations’The amendments clarified that obtaining control of a business that is a joint operation is abusiness combination achieved in stages. The acquirer should remeasure its previously heldinterest in the joint operation at fair value at of the acquisition date.
New Standards, Interpretations and Amendments
Effective date byInternational Accounting
Standards BoardAmendments to IFRS 9, ‘Prepayment features with negativecompensation’
January 1, 2019
Amendments to IFRS 10 and IAS 28, ‘Sale or contribution of assetsbetween an investor and its associate or joint venture’
To be determined byInternational Accounting
Standards BoardIFRS 16, ‘Leases’ January 1, 2019IFRS 17, ‘Insurance contracts’ January 1, 2021Amendments to IAS 19, ‘Plan amendment, curtailment or settlement’ January 1, 2019Amendments to IAS 28, ‘Long-term interests in associates and jointventures’
January 1, 2019
IFRIC 23, ‘Uncertainty over income tax treatments’ January 1, 2019Annual improvements to IFRSs 2015-2017 cycle January 1, 2019
206
4 Financial Statements
~19~
(b) Amendments to IAS 12, ‘Income taxes’The amendment clarified that the income tax consequences of dividends on financialinstruments classified as equity should be recognised according to where the past transactionsor events that generated distributable profits were recognised. These requirements apply to allincome tax consequences of dividends.
(c) Amendments to IAS 23, ‘Borrowing costs’The amendments clarified that if a specific borrowing remains outstanding after the relatedqualifying asset is ready for its intended use or sale, it becomes part of general borrowings.
4. SUMMARYOF SIGNIFICANTACCOUNTING POLICIESThe principal accounting policies applied in the preparation of these parent company only financialstatements are set out below. These policies have been consistently applied to all the periods presented,unless otherwise stated.(1) Compliance statementThese parent company only financial statements have been prepared in accordance with the“Regulations Governing the Preparation of Financial Reports by Securities Issuers”.
(2) Basis of preparationA.Except for the following items, these parent company only financial statements have been preparedunder the historical cost convention:(a)Financial assets and financial liabilities (including derivative instruments) at fair value throughprofit or loss.
(b)Available-for-sale financial assets measured at fair value.(c)Defined benefit liabilities recognised based on the net amount of pension fund assets lesspresent value of defined benefit obligation.
B.The preparation of financial statements in conformity with International Financial ReportingStandards, International Accounting Standards, IFRIC Interpretations, and SIC Interpretations asendorsed by the FSC (collectively referred herein as the “IFRSs”) requires the use of certain criticalaccounting estimates. It also requires management to exercise its judgement in the process ofapplying the Company’s accounting policies. The areas involving a higher degree of judgement orcomplexity, or areas where assumptions and estimates are significant to the parent company onlyfinancial statements are disclosed in Note 5.
(3) Foreign currency translationItems included in the financial statements of each of the Company’s entities are measured using thecurrency of the primary economic environment in which the entity operates (the “functionalcurrency”). The parent company only financial statements are presented in New Taiwan Dollars,which is the Company’s functional and presentation currency.
2017 Annual Report
207
~20~
A. Foreign currency transactions and balances(a)Foreign currency transactions are translated into the functional currency using the exchangerates prevailing at the dates of the transactions or valuation where items are remeasured. Foreignexchange gains and losses resulting from the settlement of such transactions are recognized inprofit or loss in the period in which they arise.
(b)Monetary assets and liabilities denominated in foreign currencies at the period end are re-translated at the exchange rates prevailing at the balance sheet date. Exchange differencesarising upon re-translation at the balance sheet date are recognized in profit or loss.
(c)Non-monetary assets and liabilities denominated in foreign currencies held at fair value throughprofit or loss are re-translated at the exchange rates prevailing at the balance sheet date; theirtranslation differences are recognized in profit or loss as part of the fair value gain or loss. Non-monetary assets and liabilities denominated in foreign currencies held at fair value throughother comprehensive income are re-translated at the exchange rates prevailing at the balancesheet date; their translation differences are recognized in other comprehensive income.However, non-monetary assets and liabilities denominated in foreign currencies that are notmeasured at fair value are translated using the historical exchange rates at the dates of the initialtransactions.
(d)All other foreign exchange gains and losses based on the nature of those transactions arepresented in the statement of comprehensive income within ‘other gains and losses’.
B.Translation of foreign operations(a)The operating results and financial position of all the company entities and associates that havea functional currency different from the presentation currency are translated into thepresentation currency as follows:i. Assets and liabilities for each balance sheet presented are translated at the closing exchangerate at the date of that balance sheet;
ii. Income and expenses for each statement of comprehensive income are translated at averageexchange rates of that period; and
iii. All resulting exchange differences are recognized in other comprehensive income.(b)When the foreign operation partially disposed of or sold is an associate, exchange differencesthat were recorded in other comprehensive income are proportionately reclassified to profit orloss as part of the gain or loss on sale. In addition, even when the Company retains partialinterest in the former foreign associate after losing significant influence over the former foreignassociate, such transactions should be accounted for as disposal of all interest in these foreignoperations.
208
4 Financial Statements
~21~
(c)When the foreign operation partially disposed of or sold is a subsidiary, cumulative exchangedifferences that were recorded in other comprehensive income are proportionately transferredto the non-controlling interest in this foreign operation. In addition, even when the Companyretains partial interest in the former foreign subsidiary after losing control of the former foreignsubsidiary, such transactions should be accounted for as disposal of all interest in the foreignoperation.
(4) Classification of current and non-current itemsA.Assets that meet one of the following criteria are classified as current assets; otherwise they areclassified as non-current assets:(a)Assets arising from operating activities that are expected to be realized, or are intended to besold or consumed within the normal operating cycle;
(b)Assets held mainly for trading purposes;(c)Assets that are expected to be realized within twelve months from the balance sheet date;(d)Cash and cash equivalents, excluding restricted cash and cash equivalents and those that are tobe exchanged or used to settle liabilities more than twelve months after the balance sheet date.
B.Liabilities that meet one of the following criteria are classified as current liabilities; otherwise theyare classified as non-current liabilities:(a)Liabilities that are expected to be settled within the normal operating cycle;(b)Liabilities arising mainly from trading activities;(c)Liabilities that are to be settled within twelve months from the balance sheet date;(d)Liabilities for which the repayment date cannot be extended unconditionally to more thantwelve months after the balance sheet date. Terms of a liability that could, at the option of thecounterparty, result in its settlement by the issue of equity instruments do not affect itsclassification.
(5) Cash equivalentsCash equivalents refer to short-term, highly liquid investments that are readily convertible to knownamounts of cash and which are subject to an insignificant risk of changes in value. With due datewithin one year time deposits that meet the definition above and are held for the purpose of meetingshort-term cash commitments in operations are classified as cash equivalents.
(6) Financial assets at fair value through profit or lossA.Financial assets at fair value through profit or loss are financial assets held for trading or financialassets designated as at fair value through profit or loss on initial recognition. Financial assets areclassified in this category of held for trading if acquired principally for the purpose of selling in theshort-term. Derivatives are also categorized as financial assets held for trading unless they aredesignated as hedges. Financial assets that meet one of the following criteria are designated as atfair value through profit or loss on initial recognition:(a)Hybrid (combined) contracts; or(b)They eliminate or significantly reduce a measurement or recognition inconsistency; or
2017 Annual Report
209
~22~
(c)They are managed and their performance is evaluated on a fair value basis, in accordance witha documented risk management or investment strategy.
B.On a regular way purchase or sale basis, financial assets at fair value through profit or loss arerecognized and derecognized using trade date accounting.
C.Financial assets at fair value through profit or loss are initially recognized at fair value. Relatedtransaction costs are expensed in profit or loss. These financial assets are subsequently remeasuredand stated at fair value, and any changes in the fair value of these financial assets are recognized inprofit or loss.
(7) Available-for-sale financial assetsA.Available-for-sale financial assets are non-derivatives that are either designated in this category ornot classified in any of the other categories.
B.On a regular way purchase or sale basis, available-for-sale financial assets are recognized andderecognized using trade date accounting.
C.Available-for-sale financial assets are initially recognized at fair value plus transaction costs. Thesefinancial assets are subsequently remeasured and stated at fair value, and any changes in the fairvalue of these financial assets are recognized in other comprehensive income.
(8) Held-to-maturity financial assetsA.Held-to-maturity financial assets are non-derivative financial assets with fixed or determinablepayments and fixed maturity date that the Company has the positive intention and ability to holdto maturity other than those that meet the definition of loans and receivables and those that aredesignated as at fair value through profit or loss or as available-for-sale on initial recognition.
B.On a regular way purchase or sale basis, held-to-maturity financial assets are recognized andderecognized using trade date accounting.
C.Held-to-maturity financial assets are initially recognized at fair value on the trade date plustransaction costs and subsequently measured at amortized cost using the effective interest method,less provision for impairment. Amortization of a premium or a discount on such assets isrecognized in profit or loss.
(9) Notes, accounts and other receivablesNotes and accounts receivable are claims resulting from the sale of goods or services. Receivablesarising from transactions other than the sale of goods or services are classified as other receivables.Notes, accounts and other receivables are recognized initially at fair value and subsequently measuredat amortized cost using the effective interest method, less provision for impairment. However, short-term accounts receivable without bearing interest are subsequently measured at initial invoice amountas effect of discounting is immaterial.
210
4 Financial Statements
~23~
(10) Impairment of financial assetsA.The Company assesses at each balance sheet date whether there is objective evidence that afinancial asset or a company of financial assets is impaired as a result of one or more events thatoccurred after the initial recognition of the asset (a ‘loss event’) and that loss event (or events)has an impact on the estimated future cash flows of the financial asset or company of financialassets that can be reliably estimated.
B.The criteria that the Company uses to determine whether there is objective evidence of animpairment loss is as follows:(a)Significant financial difficulty of the issuer or debtor;(b)A breach of contract, such as a default or delinquency in interest or principal payments;(c)The Company, for economic or legal reasons relating to the borrower’s financial difficulty,granted the borrower a concession that a lender would not otherwise consider;
(d)It becomes probable that the borrower will enter bankruptcy or other financial reorganization;(e)The disappearance of an active market for that financial asset because of financial difficulties;(f)Observable data indicating that there is a measurable decrease in the estimated future cashflows from a group of financial assets since the initial recognition of those assets, although thedecrease cannot yet be identified with the individual financial asset in the group, includingadverse changes in the payment status of borrowers in the group or national or local economicconditions that correlate with defaults on the assets in the group;
(g)Information about significant changes with an adverse effect that have taken place in thetechnology, market, economic or legal environment in which the issuer operates, and indicatesthat the cost of the investment in the equity instrument may not be recovered;
(h)A significant or prolonged decline in the fair value of an investment in an equity instrumentbelow its cost.
C.When the Company assesses that there has been objective evidence of impairment and animpairment loss has occurred, accounting for impairment is made as follows according to thecategory of financial assets:(a)Financial assets measured at amortised costThe amount of the impairment loss is measured as the difference between the asset’s carryingamount and the present value of estimated future cash flows discounted at the financial asset’soriginal effective interest rate, and is recognised in profit or loss. If, in a subsequent period,the amount of the impairment loss decreases and the decrease can be related objectively to anevent occurring after the impairment loss was recognised, the previously recognisedimpairment loss is reversed through profit or loss to the extent that the carrying amount of theasset does not exceed its amortised cost that would have been at the date of reversal had theimpairment loss not been recognised previously. Impairment loss is recognised and reversedby adjusting the carrying amount of the asset through the use of an impairment allowanceaccount.
2017 Annual Report
211
~24~
(b)Available-for-sale financial assetsThe amount of the impairment loss is measured as the difference between the asset’sacquisition cost (less any principal repayment and amortisation) and current fair value, lessany impairment loss on that financial asset previously recognised in profit or loss, and isreclassified from ‘other comprehensive income’ to ‘profit or loss’. If, in a subsequent period,the fair value of an investment in a debt instrument increases, and the increase can be relatedobjectively to an event occurring after the impairment loss was recognised, such impairmentloss is reversed through profit or loss. Impairment loss of an investment in an equity instrumentrecognised in profit or loss shall not be reversed through profit or loss. Impairment loss isrecognised and reversed by adjusting the carrying amount of the asset through the use of animpairment allowance account.
(11) Derecognition of financial assetsThe Company derecognizes a financial asset when one of the following conditions is met:A.The cash flows from the financial asset have been received.B.The contractual rights to receive cash flows from the financial asset have been transferred and theCompany has transferred substantially all risks and rewards of ownership of the financial asset.
C.The contractual rights to receive cash flows from the financial asset have been transferred;however, the Company has not retained control of the financial asset.
(12) Operating leases (lessor)Lease income from an operating lease (net of any incentives given to the lessee) is recognised inprofit or loss on a straight-line basis over the lease term.
(13) InventoriesInventories refer to fuel inventories and steel inventories. Fuel inventories are physically measuredby the crew of each ship and reported back to the Head Office through telegraph for recordingpurposes at balance sheet date. Valuation of inventories is based on the exchange rate prevailing atbalance sheet date.At the end of period, inventories are evaluated at the lower of cost or net realizable value, and theindividual item approach is used in the comparison of cost and net realizable value. The calculationof net realizable value should be based on the estimated selling price in the normal course of business,net of estimated costs of completion and estimated selling expenses.
(14) Investments accounted for using equity method / subsidiaries and associatesA.Subsidiary is an entity where the Company has the right to dominate its finance and operationpolicies (includes special purpose entity), normally the Company owns more than 50 percent ofthe voting rights directly or indirectly in that entity. Subsidiaries are accounted for under theequity method in the Company's parent company only financial statements.
B.Unrealized gains or losses resulted from inter-company transactions with subsidiaries areeliminated. Necessary adjustments are made to the accounting policies of subsidiaries, to beconsistent with the accounting policies of the Company.
212
4 Financial Statements
~25~
C.After acquisition of subsidiaries, the Company recognizes proportionately for the share of profitand loss and other comprehensive incomes in the income statement as part of the Company'sprofit and loss and other comprehensive income, respectively. When the share of loss from asubsidiary exceeds the carrying amount of Company's interests in that subsidiary, the Companycontinues to recognize its shares in the subsidiary's loss proportionately.
D.Changes in a parent’s ownership interest in a subsidiary that do not result in a loss of control areaccounted for as equity transactions. Any difference between the amount by which the non-controlling interests are adjusted and the fair value of the consideration paid or received shall berecognized directly in equity and attributed to the owners of the parent.
E.If the Company loses control of a subsidiary, the Company recognizes any investment retained inthe former subsidiary at its fair value at the date when control is lost and recognizes any resultingdifference as a gain or loss in profit or loss. The Company shall account for all amounts recognizedin other comprehensive income in relation to that subsidiary on the same basis as would berequired if the Company had directly disposed of the related assets or liabilities. Therefore, if again or loss previously recognized in other comprehensive income would be reclassified to profitor loss on the disposal of the related assets or liabilities, the Company reclassifies the gain or lossfrom equity to profit or loss when it loses control of the subsidiary.
F.Associates are all entities over which the Company has significant influence but not control. Ingeneral, it is presumed that the investor has significant influence, if an investor holds, directly orindirectly 20 percent or more of the voting power of the investee. Investments in associates areaccounted for using the equity method and are initially recognised at cost.
G.The Company’s share of its associates’ post-acquisition profits or losses is recognised in profit orloss, and its share of post-acquisition movements in other comprehensive income is recognisedin other comprehensive income. When the Company’s share of losses in an associate equals orexceeds its interest in the associate, including any other unsecured receivables, the Company doesnot recognise further losses, unless it has incurred constructive obligations or made payments onbehalf of the associate.
H.When changes in an associate’s equity do not arise from profit or loss or other comprehensiveincome of the associate and such changes do not affect the Company’s ownership percentage ofthe associate, the Company recognises in ‘capital surplus’ in proportion to its ownership.
I. Unrealised gains or loss on transactions between the Company and its associates are eliminated tothe extent of the Company’s interest in the associates. Unrealised losses are also eliminated unlessthe transaction provides evidence of an impairment of the asset transferred. Accounting policiesof associates have been adjusted where necessary to ensure consistency with the policies adoptedby the Company.
2017 Annual Report
213
~26~
J. In the case that an associate issues new shares and the Company does not subscribe or acquirenew shares proportionately, which results in a change in the Company’s ownership percentage ofthe associate but maintains significant influence on the associate, then ‘capital surplus’ and‘investments accounted for under the equity method’ shall be adjusted for the increase or decreaseof its share of equity interest. If the above condition causes a decrease in the Company’sownership percentage of the associate, in addition to the above adjustment, the amountspreviously recognised in other comprehensive income in relation to the associate are reclassifiedto profit or loss proportionately on the same basis as would be required if the relevant assets orliabilities were disposed of.
K.Upon loss of significant influence over an associate, the Company remeasures any investmentretained in the former associate at its fair value. Any difference between fair value and carryingamount is recognised in profit or loss.
L.When the Company disposes its investment in an associate and loses significant influence overthis associate, the amounts previously recognised in other comprehensive income in relation tothe associate, are reclassified to profit or loss, on the same basis as would be required if therelevant assets or liabilities were disposed of. If it retains significant influence over this associate,the amounts previously recognised in other comprehensive income in relation to the associate arereclassified to profit or loss proportionately in accordance with the aforementioned approach.
M.When the Company disposes its investment in an associate and loses significant influence overthis associate, the amounts previously recognised as capital surplus in relation to the associate aretransferred to profit or loss. If it retains significant influence over this associate, the amountspreviously recognised as capital surplus in relation to the associate are transferred to profit or lossproportionately.
N.According to “Rules Governing the Preparations of Financial Statements by Securities Issuers”,'profit for the year' and 'other comprehensive income for the year' reported in an entity's parentcompany only statement of comprehensive income, shall equal to 'profit for the year' and 'othercomprehensive income' attributable to owners of the parent reported in that entity's consolidatedstatement of comprehensive income. Total equity reported in an entity's parent company onlyfinancial statements, shall equal to equity attributable to owners of parent reported in that entity'sconsolidated financial statements.
(15) Property, plant and equipmentA.Property, plant and equipment are initially recorded at cost. Borrowing costs incurred during theconstruction period are capitalized.
B.Subsequent costs are included in the asset’s carrying amount or recognized as a separate asset, asappropriate, only when it is probable that future economic benefits associated with the item willflow to the Company and the cost of the item can be measured reliably. The carrying amount ofthe replaced part is derecognized. All other repairs and maintenance are charged to profit or lossduring the financial period in which they are incurred.
214
4 Financial Statements
~27~
C.Land is not depreciated. Other property, plant and equipment apply cost model and are depreciatedusing the straight-line method to allocate their cost over their estimated useful lives. Each part ofan item of property, plant, and equipment with a cost that is significant in relation to the total costof the item must be depreciated separately.
D.The assets’ residual values, useful lives and depreciation methods are reviewed, and adjusted ifappropriate, at each balance sheet date. If expectations for the assets’ residual values and usefullives differ from previous estimates or the patterns of consumption of the assets’ future economicbenefits embodied in the assets have changed significantly, any change is accounted for as achange in estimate under IAS 8, ‘Accounting Policies, Changes in Accounting Estimates andErrors’, from the date of the change. The estimated useful lives of property, plant and equipmentare as follows:Buildings a 50 ~ 55 yearsLoading and unloading equipment 06 ~ 20 yearsShips 18 ~ 25 yearsTransportation equipment a 06 ~ 10 yearsOther equipment 03 ~ 05 years
(16) Operating leases (lessee)
Payments made under an operating lease (net of any incentives received from the lessor) arerecognized in profit or loss on a straight-line basis over the lease term.
(17) Investment propertyAn investment property is stated initially at its cost and measured subsequently using the cost model.Except for land, investment property is depreciated on a straight-line basis over its estimated usefullife of 50~60 years.
(18) Intangible assetsComputer software is stated at cost and amortized on a straight-line basis over its estimated usefullife of 3 years.
(19) Impairment of non-financial assetsThe Company assesses at each balance sheet date the recoverable amounts of those assets wherethere is an indication that they are impaired. An impairment loss is recognized for the amount bywhich the asset’s carrying amount exceeds its recoverable amount. The recoverable amount is thehigher of an asset’s fair value less costs to sell or value in use. When the circumstances or reasonsfor recognizing impairment loss for an asset in prior years no longer exist or diminish, theimpairment loss is reversed. The increased carrying amount due to reversal should not be more thanwhat the depreciated or amortized historical cost would have been if the impairment had not beenrecognized.
2017 Annual Report
215
~28~
(20) BorrowingsA.Borrowings are recognized initially at fair value, net of transaction costs incurred. Borrowings aresubsequently stated at amortized cost; any difference between the proceeds (net of transactioncosts) and the redemption value is recognized in profit or loss over the period of the borrowingsusing the effective interest method.
B.Fees paid on the establishment of loan facilities are recognized as transaction costs of the loan tothe extent that it is probable that some or all of the facility will be drawn down. In this case, thefee is deferred until the draw-down occurs. To the extent there is no evidence that it is probablethat some or all of the facility will be drawn down, the fee is capitalized as a pre-payment forliquidity services and amortized over the period of the facility to which it relates.
(21) Accounts payableAccounts payable are obligations to pay for goods or services that have been acquired in the ordinarycourse of business from suppliers. They are recognized initially at fair value and subsequentlymeasured at amortized cost using the effective interest method. However, short-term accountspayable without bearing interest are subsequently measured at initial invoice amount as effect ofdiscounting is immaterial.
(22) Derecognition of financial liabilitiesA financial liability is derecognized when the obligation under the liability specified in the contractis discharged, cancelled or expires.
(23) Offsetting financial instrumentsFinancial assets and liabilities are offset and reported in the net amount in the balance sheet whenthere is a legally enforceable right to offset the recognized amounts and there is an intention to settleon a net basis or realize the asset and settle the liability simultaneously.
(24) Financial liabilities and equity instrumentsA.Ordinary corporate bonds issued by the Company are initially recognized at fair value, net oftransaction costs incurred. Ordinary corporate bonds are subsequently stated at amortized cost;any difference between the proceeds (net of transaction costs) and the redemption value isaccounted for as the premium or discount on bonds payable and presented as an addition to ordeduction from bonds payable, which is amortized in profit or loss as an adjustment to the ‘financecosts’ over the period of bond circulation using the effective interest method.
B.Convertible corporate bonds issued by the Company contain conversion options (that is, thebondholders have the right to convert the bonds into the Company’s common shares byexchanging a fixed amount of cash for a fixed number of common shares), call options and putoptions. The Company classifies the bonds payable and derivative features embedded inconvertible corporate bonds on initial recognition as a financial asset, a financial liability or anequity instrument. Convertible corporate bonds are accounted for as follows:
216
4 Financial Statements
~29~
(a)Call options and put options embedded in convertible corporate bonds are recognized initiallyat net fair value as ‘financial assets or financial liabilities at fair value through profit or loss’.They are subsequently remeasured and stated at fair value on each balance sheet date; the gainor loss is recognized as ‘gain or loss on valuation of financial assets or financial liabilities atfair value through profit or loss’.
(b)Bonds payable of convertible corporate bonds is initially recognized at fair value andsubsequently stated at amortized cost. Any difference between the proceeds and theredemption value is accounted for as the premium or discount on bonds payable and presentedas an addition to or deduction from bonds payable, which is amortized in profit or loss as anadjustment to the ‘finance costs’ over the period of bond circulation using the effective interestmethod.
(c)Conversion options embedded in convertible corporate bonds issued by the Company, whichmeet the definition of an equity instrument, are initially recognized in ‘capital surplus—stockwarrants’ at the residual amount of total issue price less amounts of ‘financial assets orfinancial liabilities at fair value through profit or loss’ and ‘bonds payable—net’ as statedabove. Conversion options are not subsequently remeasured.
(d)Any transaction costs directly attributable to the issuance of convertible corporate bonds areallocated to the liability and equity components in proportion to the allocation of proceeds.
(e)When bondholders exercise conversion options, the liability component of the bonds(including ‘bonds payable’ and ‘financial assets or financial liabilities at fair value throughprofit or loss’) shall be remeasured on the conversion date. The book value of common sharesissued due to the conversion shall be based on the adjusted book value of the abovementionedliability component plus the book value of capital surplus - share options.
(25) Derivative financial instruments and hedging activitiesA.Derivatives are initially recognised at fair value on the date a derivative contract is entered intoand are subsequently remeasured at their fair value. Any changes in the fair value are recognisedin profit or loss.
B.The Company designates certain derivatives as hedges of a particular risk associated with arecognised asset or liability or a highly probable forecast transaction (cash flow hedge).
C.The Company documents at the inception of the transaction the relationship between hedginginstruments and hedged items, as well as its risk management objectives and strategy forundertaking various hedging transactions. The Company also documents its assessment, both athedge inception and on an ongoing basis, of whether the derivatives that are used in hedgingtransactions are highly effective in offsetting changes in fair values or cash flows of hedged items.
D.The full fair value of a hedging derivative is classified as a non-current asset or liability when theremaining maturity of the hedged item is more than 12 months, and as a current asset or liabilitywhen the remaining maturity of the hedged item is less than 12 months. Trading derivatives areclassified as current assets or liabilities.
2017 Annual Report
217
~30~
E.Cash flow hedge(a)The effective portion of changes in the fair value of derivatives that are designated andqualified as cash flow hedges is recognised in other comprehensive income. The gain or lossrelating to the ineffective portion is recognised immediately in the statement of comprehensiveincome within ‘other gains and losses’.
(b)Amounts accumulated in other comprehensive income are reclassified into profit or loss in theperiods when the hedged item affects profit or loss. The gain or loss relating to the effectiveportion of interest rate swaps hedging variable rate borrowings is recognised in the statementof comprehensive income within ‘finance costs’. However, when the forecast transaction thatis hedged results in the recognition of a non-financial asset or financial liability, the gains andlosses previously deferred in other comprehensive income are reclassified into profit or lossin the periods when the asset acquired or the liability assumed affects profit or loss. Thedeferred amounts are ultimately recognised in operating costs.
(c)When a hedging instrument expires, or is sold, cancelled or executed, or when a hedge nolonger meets the criteria for hedge accounting, any cumulative gain or loss existing in othercomprehensive income at that time remains in other comprehensive income. When a forecasttransaction occurs or is no longer expected to occur, the cumulative gain or loss that wasreported in other comprehensive income is transferred to profit or loss in the periods when thehedged forecast cash flow affects profit or loss.
(26) Employee benefitsA.Short-term employee benefitsShort-term employee benefits are measured at the undiscounted amount of the benefits expectedto be paid in respect of service rendered by employees in a period and should be recognized asexpense in that period when the employees render service.
B.Pensions(a)Defined contribution plansFor defined contribution plans, the contributions are recognized as pension expense when theyare due on an accrual basis. Prepaid contributions are recognised as an asset to the extent of acash refund or a reduction in the future payments.
(b)Defined benefit plansi.Net obligation under a defined benefit plan is defined as the present value of an amount ofpension benefits that employees will receive on retirement for their services with theCompany in current period or prior periods. The liability recognized in the balance sheet inrespect of defined benefit pension plans is the present value of the defined benefit obligationat the balance sheet date less the fair value of plan assets, together with adjustments forunrecognised past service costs. The net defined benefit obligation is calculated annually byindependent actuaries using the projected unit credit method. The rate used to discount isdetermined by using interest rates of high-quality corporate bonds that are denominated in
218
4 Financial Statements
~31~
the currency in which the benefits will be paid, and that have terms to maturityapproximating to the terms of the related pension liability; when there is no deep market inhigh-quality corporate bonds, the Company uses interest rates of government bonds (at thebalance sheet date) instead.
ii.Remeasurements arising on defined benefit plans are recognized in other comprehensiveincome in the period in which they arise and are recorded as retained earnings.
iii.Past service costs are recognised immediately in profit or loss.C.Termination benefitsTermination benefits are employee benefits provided in exchange for the termination ofemployment as a result from either the Group’s decision to terminate an employee’s employmentbefore the normal retirement date, or an employee’s decision to accept an offer of redundancybenefits in exchange for the termination of employment. The Group recognises expense as it canno longer withdraw an offer of termination benefits or it recognises relating restructuring costs,whichever is earlier. Benefits that are expected to be due more than 12 months after balance sheetdate shall be discounted to their present value.
D.Employees’ compensation and directors’ and supervisors’ remunerationEmployees’ compensation and directors’ and supervisors’ remuneration are recognized as expenseand liability, provided that such recognition is required under legal or constructive obligation andthose amounts can be reliably estimated. Any difference between the resolved amounts and thesubsequently actual distributed amounts is accounted for as changes in estimates. If employeecompensation is paid by shares, the Company calculates the number of shares based on theclosing price at the previous day of the board meeting resolution
(27) Income taxA.The tax expense for the period comprises current and deferred tax. Tax is recognized in profit orloss, except to the extent that it relates to items recognized in other comprehensive income oritems recognized directly in equity, in which cases the tax is recognized in other comprehensiveincome or equity.
2017 Annual Report
219
~32~
B.The current income tax expense is calculated on the basis of the tax laws enacted or substantivelyenacted at the balance sheet date in the countries where the Company and its subsidiaries operateand generate taxable income. Management periodically evaluates positions taken in tax returnswith respect to situations in accordance with applicable tax regulations. It establishes provisionswhere appropriate based on the amounts expected to be paid to the tax authorities. An additional10% tax is levied on the unappropriated retained earnings and is recorded as income tax expensein the year the stockholders resolve to retain the earnings.
C.Deferred income tax is recognized, using the balance sheet liability method, on temporarydifferences arising between the tax bases of assets and liabilities and their carrying amounts in theparent company only balance sheet. Deferred income tax is provided on temporary differencesarising on investments in subsidiaries and associates, except where the timing of the reversal ofthe temporary difference is controlled by the Company and it is probable that the temporarydifference will not reverse in the foreseeable future. Deferred income tax is determined using taxrates and laws that have been enacted or substantially enacted by the balance sheet date and areexpected to apply when the related deferred income tax asset is realized or the deferred incometax liability is settled.
D.Deferred income tax assets are recognized only to the extent that it is probable that future taxableprofit will be available against which the temporary differences can be utilized. At each balancesheet date, unrecognized and recognized deferred income tax assets are reassessed.
E.Current income tax assets and liabilities are offset and the net amount reported in the balance sheetwhen there is a legally enforceable right to offset the recognized amounts and there is an intentionto settle on a net basis or realize the asset and settle the liability simultaneously. Deferred incometax assets and liabilities are offset on the balance sheet when the entity has the legally enforceableright to offset current tax assets against current tax liabilities and they are levied by the sametaxation authority on either the same entity or different entities that intend to settle on a net basisor realize the asset and settle the liability simultaneously.
F. A deferred tax asset shall be recognised for the carryforward of unused tax credits resulting fromacquisitions of equipment or technology, research and development expenditures and equityinvestments to the extent that it is possible that future taxable profit will be available against whichthe unused tax credits can be utilised.
(28) DividendsDividends are recorded in the Company’s financial statements in the period in which they areapproved by the Company’s shareholders. Cash dividends are recorded as liabilities; stock dividendsare recorded as stock dividends to be distributed and are reclassified to ordinary shares on theeffective date of new shares issuance.
220
4 Financial Statements
~33~
(29) Revenue recognitionSales of servicesRevenue from delivering services is recognized under the percentage-of-completion method whenthe outcome of services provided can be estimated reliably. The stage of completion of a servicecontract is measured by the percentage of the actual services performed as of the financial reportingdate to the total services to be performed. If the outcome of a service contract cannot be estimatedreliably, contract revenue should be recognized only to the extent that contract costs incurred arelikely to be recoverable.
5. CRITICALACCOUNTING JUDGEMENTS, ESTIMATESAND KEY SOURCES OFASSUMPTIONUNCERTAINTYThe preparation of these parent company only financial statements requires management to make criticaljudgements in applying the Company’s accounting policies and make critical assumptions and estimatesconcerning future events. Assumptions and estimates may differ from the actual results and arecontinually evaluated and adjusted based on historical experience and other factors. The information isaddressed below:(1)Critical judgements in applying the Company’s accounting policiesFinancial assets—impairment of equity investmentsThe Company follows the guidance of IAS 39 to determine whether a financial asset—equityinvestment is impaired. This determination requires significant judgement. In making this judgement,the Company evaluates, among other factors, the duration and extent to which the fair value of anequity investment is less than its cost and the financial health of and short-term business outlook forthe investee, including factors such as industry and sector performance, changes in technology andoperational and financing cash flow.If the decline of the fair value of an individual equity investment below cost was considered significantor prolonged, the Company would transfer the accumulated fair value adjustments recognized in othercomprehensive income on the impaired available-for-sale financial assets to profit or loss, please referto Note 6(2).
(2)Critical accounting estimates and assumptionsA.Revenue recognitionRevenue from delivering services and related costs are recognized under the percentage-of-completion method when the outcome of services provided can be estimated reliably. The stage ofcompletion of a service contract is measured by the percentage of the actual services performed asof the financial reporting date to the total services to be performed.
2017 Annual Report
221
~34~
B.Impairment assessment of tangible and intangible assets (excluding goodwill)The Company assesses impairment based on its subjective judgement and determines the separatecash flows of a specific group of assets, useful lives of assets and the future possible income andexpenses arising from the assets depending on how assets are utilized and industrial characteristics.Any changes of economic circumstances or estimates due to the change of Company strategymightcause material impairment on assets in the future.As of December 31, 2017, the Company had property, plant and equipment and intangible assets,amounting to $27,118,687 and $39,071, respectively.
C.Impairment assessment of investments accounted for using the quity methodThe Company assesses the impairment of an investment accounted for using the equity method assoon as there is any indication that it might have been impaired and its carrying amount cannot berecovered. The Company assesses the recoverable amounts of an investment accounted for usingthe equity method based on the present value of the Company’s share of expected future cash flowsof the investee, and analyzes the reasonableness of related assumptions.
D.Financial assets—fair value measurement of unlisted stocks without active marketThe fair value of unlisted stocks held by the Company that are not traded in an active market isdetermined considering those companies’ recent funding raising activities, fair value assessment ofother companies of the same type, market conditions and other economic indicators existing onbalance sheet date. Any changes in these judgements and estimates will impact the fair valuemeasurement of these unlisted stocks. Please refer to Note 12(3) for the financial instruments fairvalue information.As of December 31, 2017, the carrying amount of unlisted stocks without active market was$152,955.
6. DETAILS OF SIGNIFICANTACCOUNTS(1) Cash and cash equivalents
A.The Company transacts with a variety of financial institutions all with high credit quality todisperse credit risk, so it expects that the probability of counterparty default is remote.
B.The Company has no cash and cash equivalents pledged to others.
December 31, 2017 December 31, 2016Cash on hand and petty cash 13,433$ 14,861$Checking accounts and demand deposits 2,656,471 3,292,633Time deposits 20,373,609 17,346,715
23,043,513$ 20,654,209$
222
4 Financial Statements
~35~
(2) Available-for-sale financial assets
A.The Company recognized net loss and net gain of $92,521 and $435,609 in other comprehensiveincome for fair value change for the years ended December 31, 2017 and 2016, respectively.
B.The Company originally owned the emerging stock of Taiwan High Speed Rail Corporation whichwas first publicly traded on October 27, 2016. However, for the year ended December 31, 2015,the Company assessed that there had been objective evidence of impairment given that the marketprice of the shares continuously declined. The Company then recognised $189,091 as impairmentloss in 2017.
C.The Company recognized impairment loss of $3,065 on unlisted stocks.D.No available-for-sale financial assets held by the Company were pledged to others.
(3) Held-to-maturity financial assets
A.The Company recognized interest income of $2,339 and $8,197 for amortized cost in profit orloss for the years ended December 31, 2017 and 2016, respectively.
B.The counterparties of the Company’s investments have good credit quality.C.No held-to-maturity financial assets held by the Company were pledged to others.
(4) Accounts receivable
A.The credit quality of accounts receivable that were neither past due nor impaired was in thefollowing categories based on the Company’s credit quality control policy.
Items December 31, 2017 December 31, 2016Non-current items:Listed (TSE and OTC) stocks 631,039$ 1,023,088$Unlisted stocks 88,917 88,917
719,956 1,112,005Valuation adjustment 577,973 670,495
1,297,929$ 1,782,500$
Items December 31, 2017 December 31, 2016
Current items:Financial bonds -$ 170,000$
Non-current items:Financial bonds 100,000$ 50,000$
December 31, 2017 December 31, 2016Accounts receivable 2,929,761$ 2,189,628$Less: Allowance for bad debts 68,482)( 73,732)(
2,861,279$ 2,115,896$
December 31, 2017 December 31, 2016Group 1 277,138$ 126,994$Group 2 2,018,146 1,546,534
2,295,284$ 1,673,528$
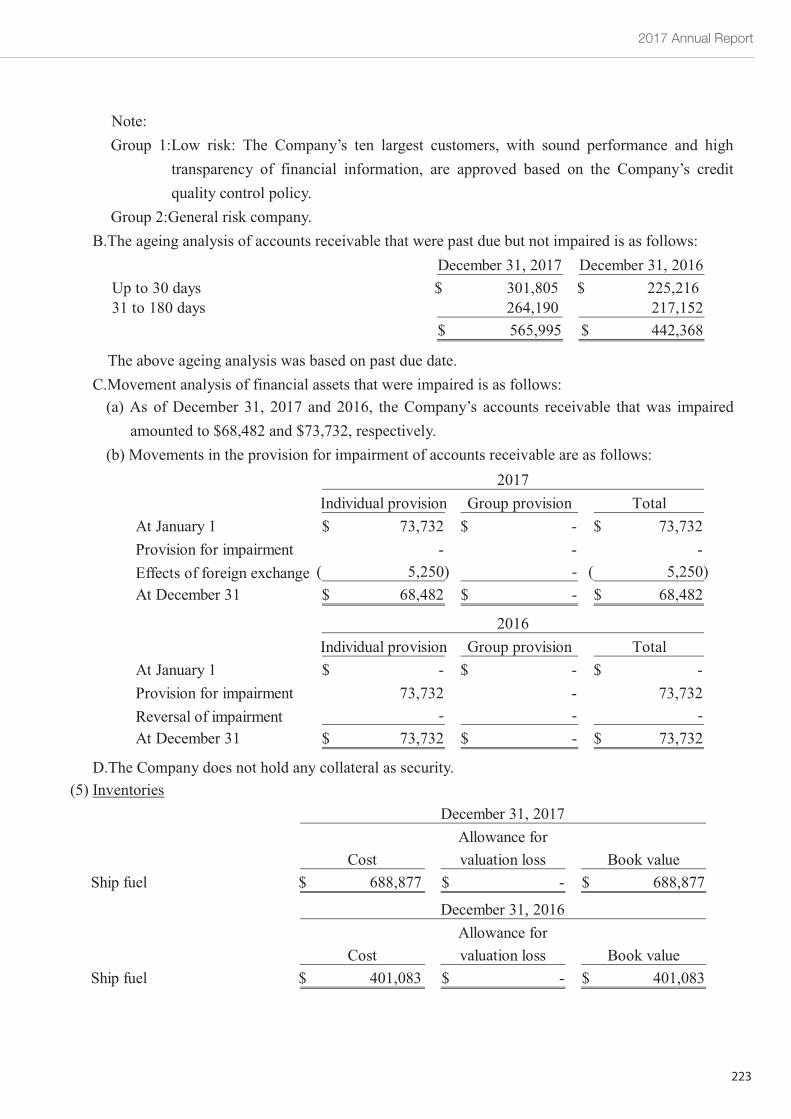
2017 Annual Report
223
~36~
Note:Group 1:Low risk: The Company’s ten largest customers, with sound performance and high
transparency of financial information, are approved based on the Company’s creditquality control policy.
Group 2:General risk company.B.The ageing analysis of accounts receivable that were past due but not impaired is as follows:
The above ageing analysis was based on past due date.C.Movement analysis of financial assets that were impaired is as follows:(a) As of December 31, 2017 and 2016, the Company’s accounts receivable that was impairedamounted to $68,482 and $73,732, respectively.
(b) Movements in the provision for impairment of accounts receivable are as follows:
D.The Company does not hold any collateral as security.(5) Inventories
December 31, 2017 December 31, 2016Up to 30 days 301,805$ 225,216$31 to 180 days 264,190 217,152
565,995$ 442,368$
Individual provision Group provision TotalAt January 1 73,732$ -$ 73,732$Provision for impairment - - -Effects of foreign exchange 5,250)( - 5,250)(At December 31 68,482$ -$ 68,482$
2017
Individual provision Group provision TotalAt January 1 -$ -$ -$Provision for impairment 73,732 - 73,732Reversal of impairment - - -At December 31 73,732$ -$ 73,732$
2016
Allowance forCost valuation loss Book value
Ship fuel 688,877$ -$ 688,877$
December 31, 2017
Allowance forCost valuation loss Book value
Ship fuel 401,083$ -$ 401,083$
December 31, 2016
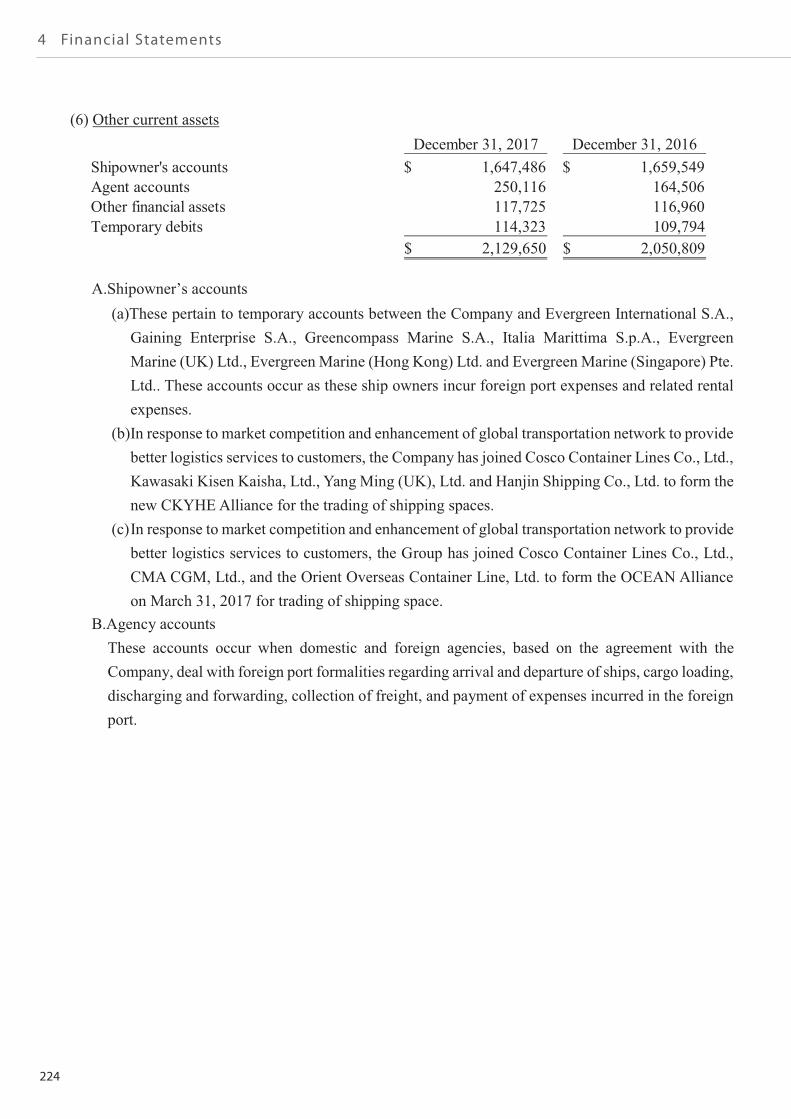
224
4 Financial Statements
~37~
(6) Other current assets
A.Shipowner’s accounts(a)These pertain to temporary accounts between the Company and Evergreen International S.A.,Gaining Enterprise S.A., Greencompass Marine S.A., Italia Marittima S.p.A., EvergreenMarine (UK) Ltd., Evergreen Marine (Hong Kong) Ltd. and Evergreen Marine (Singapore) Pte.Ltd.. These accounts occur as these ship owners incur foreign port expenses and related rentalexpenses.
(b)In response to market competition and enhancement of global transportation network to providebetter logistics services to customers, the Company has joined Cosco Container Lines Co., Ltd.,Kawasaki Kisen Kaisha, Ltd., Yang Ming (UK), Ltd. and Hanjin Shipping Co., Ltd. to form thenew CKYHEAlliance for the trading of shipping spaces.
(c)In response to market competition and enhancement of global transportation network to providebetter logistics services to customers, the Group has joined Cosco Container Lines Co., Ltd.,CMA CGM, Ltd., and the Orient Overseas Container Line, Ltd. to form the OCEAN Allianceon March 31, 2017 for trading of shipping space.
B.Agency accountsThese accounts occur when domestic and foreign agencies, based on the agreement with theCompany, deal with foreign port formalities regarding arrival and departure of ships, cargo loading,discharging and forwarding, collection of freight, and payment of expenses incurred in the foreignport.
December 31, 2017 December 31, 2016Shipowner's accounts 1,647,486$ 1,659,549$Agent accounts 250,116 164,506Other financial assets 117,725 116,960Temporary debits 114,323 109,794
2,129,650$ 2,050,809$
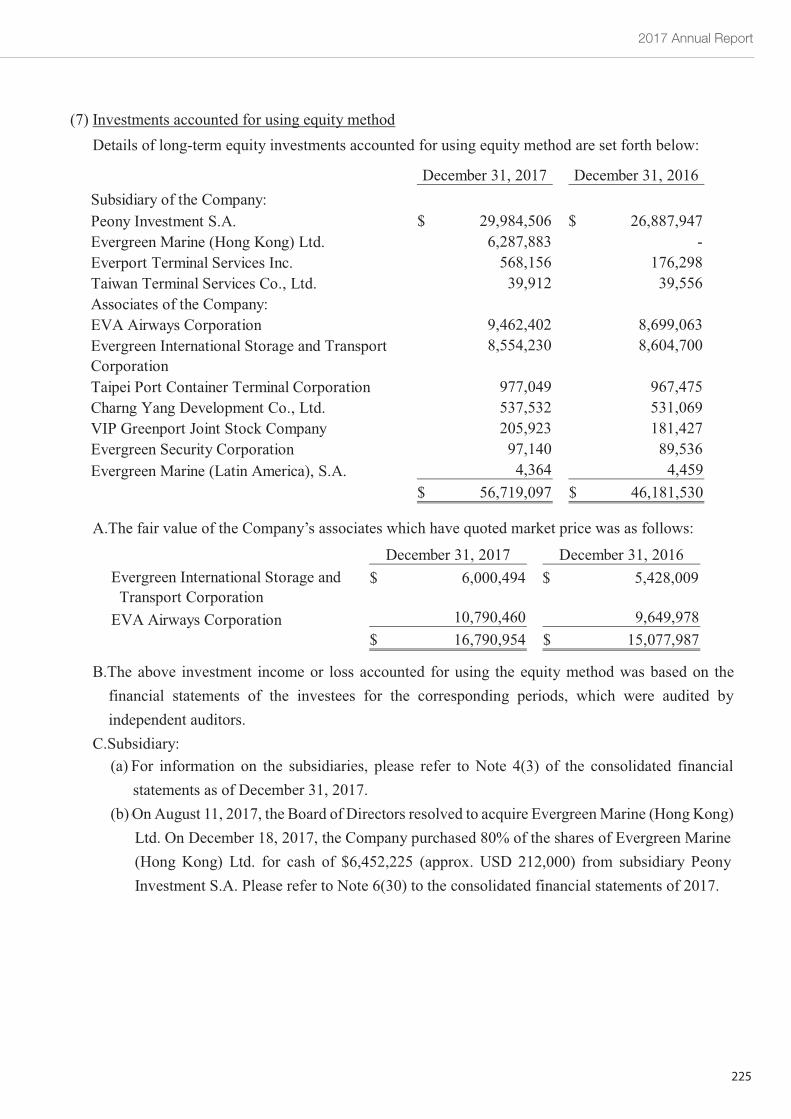
2017 Annual Report
225
~38~
(7) Investments accounted for using equity methodDetails of long-term equity investments accounted for using equity method are set forth below:
A.The fair value of the Company’s associates which have quoted market price was as follows:
B.The above investment income or loss accounted for using the equity method was based on thefinancial statements of the investees for the corresponding periods, which were audited byindependent auditors.
C.Subsidiary:(a)For information on the subsidiaries, please refer to Note 4(3) of the consolidated financialstatements as of December 31, 2017.
(b)On August 11, 2017, the Board of Directors resolved to acquire EvergreenMarine (Hong Kong)Ltd. On December 18, 2017, the Company purchased 80% of the shares of Evergreen Marine(Hong Kong) Ltd. for cash of $6,452,225 (approx. USD 212,000) from subsidiary PeonyInvestment S.A. Please refer to Note 6(30) to the consolidated financial statements of 2017.
December 31, 2017 December 31, 2016Subsidiary of the Company:Peony Investment S.A. 29,984,506$ 26,887,947$Evergreen Marine (Hong Kong) Ltd. 6,287,883 -Everport Terminal Services Inc. 568,156 176,298Taiwan Terminal Services Co., Ltd. 39,912 39,556Associates of the Company:EVA Airways Corporation 9,462,402 8,699,063Evergreen International Storage and TransportCorporation
8,554,230 8,604,700
Taipei Port Container Terminal Corporation 977,049 967,475Charng Yang Development Co., Ltd. 537,532 531,069VIP Greenport Joint Stock Company 205,923 181,427Evergreen Security Corporation 97,140 89,536Evergreen Marine (Latin America), S.A. 4,364 4,459
56,719,097$ 46,181,530$
December 31, 2017 December 31, 2016Evergreen International Storage andTransport Corporation
6,000,494$ 5,428,009$
EVA Airways Corporation 10,790,460 9,649,97816,790,954$ 15,077,987$
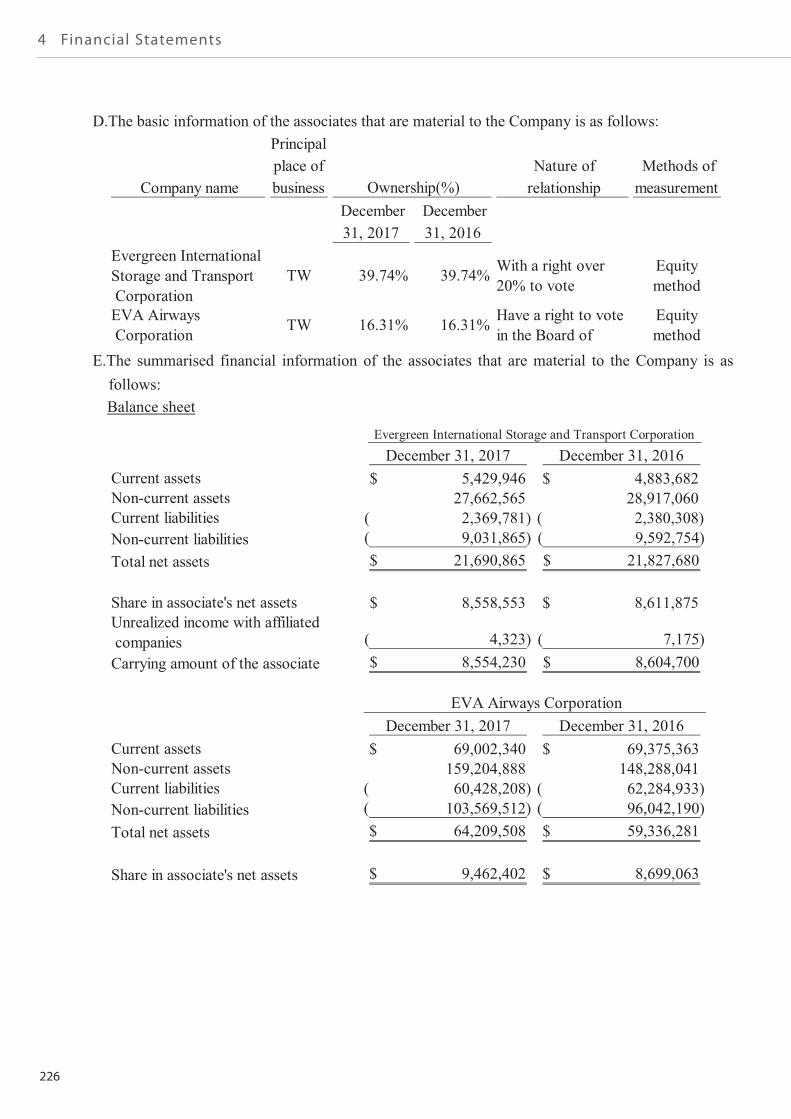
226
4 Financial Statements
~39~
D.The basic information of the associates that are material to the Company is as follows:
E.The summarised financial information of the associates that are material to the Company is asfollows:Balance sheet
Company name
Principalplace ofbusiness
Nature ofrelationship
Methods ofmeasurement
December31, 2017
December31, 2016
Evergreen InternationalStorage and TransportCorporation
TW 39.74% 39.74% With a right over20% to vote
Equitymethod
EVA AirwaysCorporation TW 16.31% 16.31% Have a right to vote
in the Board ofEquitymethod
Ownership(%)
December 31, 2017 December 31, 2016Current assets 5,429,946$ 4,883,682$Non-current assets 27,662,565 28,917,060Current liabilities 2,369,781)( 2,380,308)(Non-current liabilities 9,031,865)( 9,592,754)(Total net assets 21,690,865$ 21,827,680$
Share in associate's net assets 8,558,553$ 8,611,875$Unrealized income with affiliatedcompanies 4,323)( 7,175)(Carrying amount of the associate 8,554,230$ 8,604,700$
Evergreen International Storage and Transport Corporation
December 31, 2017 December 31, 2016Current assets 69,002,340$ 69,375,363$Non-current assets 159,204,888 148,288,041Current liabilities 60,428,208)( 62,284,933)(Non-current liabilities 103,569,512)( 96,042,190)(Total net assets 64,209,508$ 59,336,281$
Share in associate's net assets 9,462,402$ 8,699,063$
EVA Airways Corporation
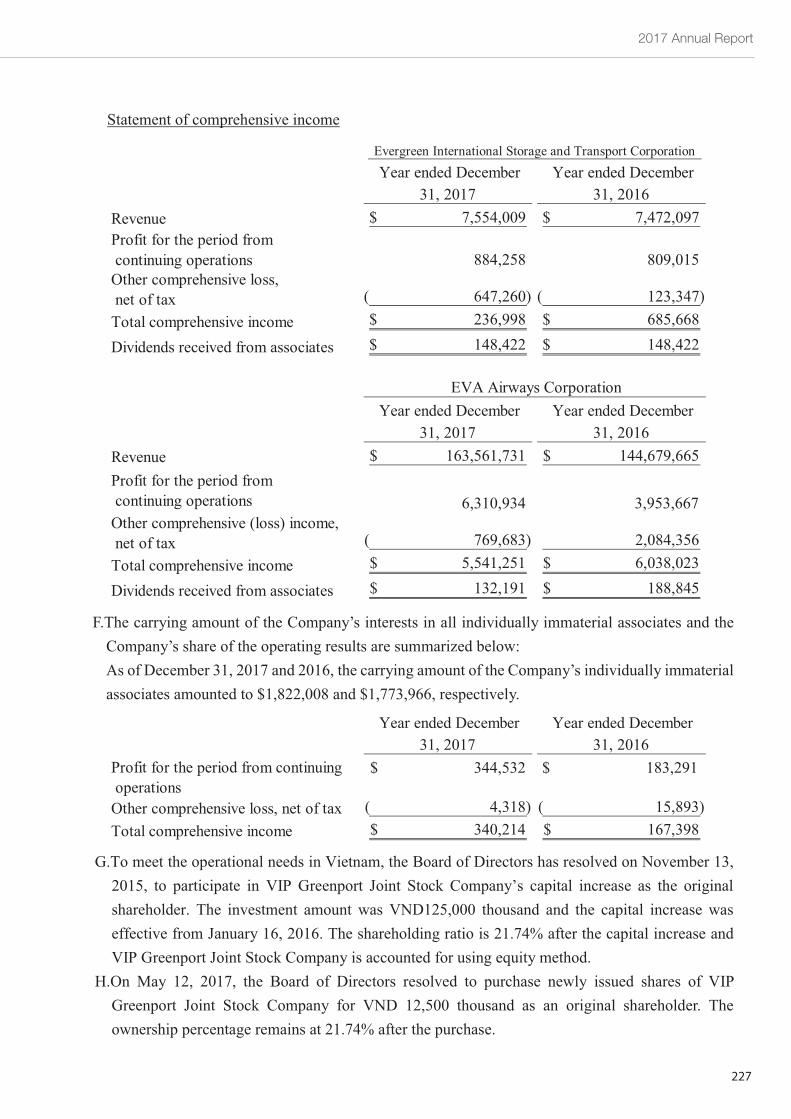
2017 Annual Report
227
~40~
Statement of comprehensive income
F.The carrying amount of the Company’s interests in all individually immaterial associates and theCompany’s share of the operating results are summarized below:As of December 31, 2017 and 2016, the carrying amount of the Company’s individually immaterialassociates amounted to $1,822,008 and $1,773,966, respectively.
G.To meet the operational needs in Vietnam, the Board of Directors has resolved on November 13,2015, to participate in VIP Greenport Joint Stock Company’s capital increase as the originalshareholder. The investment amount was VND125,000 thousand and the capital increase waseffective from January 16, 2016. The shareholding ratio is 21.74% after the capital increase andVIP Greenport Joint Stock Company is accounted for using equity method.
H.On May 12, 2017, the Board of Directors resolved to purchase newly issued shares of VIPGreenport Joint Stock Company for VND 12,500 thousand as an original shareholder. Theownership percentage remains at 21.74% after the purchase.
Year ended December31, 2017
Year ended December31, 2016
Revenue 7,554,009$ 7,472,097$Profit for the period fromcontinuing operations 884,258 809,015Other comprehensive loss,net of tax 647,260)( 123,347)(Total comprehensive income 236,998$ 685,668$
Dividends received from associates 148,422$ 148,422$
Evergreen International Storage and Transport Corporation
Year ended December31, 2017
Year ended December31, 2016
Revenue 163,561,731$ 144,679,665$Profit for the period fromcontinuing operations 6,310,934 3,953,667Other comprehensive (loss) income,net of tax 769,683)( 2,084,356Total comprehensive income 5,541,251$ 6,038,023$
Dividends received from associates 132,191$ 188,845$
EVA Airways Corporation
Year ended December31, 2017
Year ended December31, 2016
Profit for the period from continuingoperations
344,532$ 183,291$
Other comprehensive loss, net of tax 4,318)( 15,893)(Total comprehensive income 340,214$ 167,398$
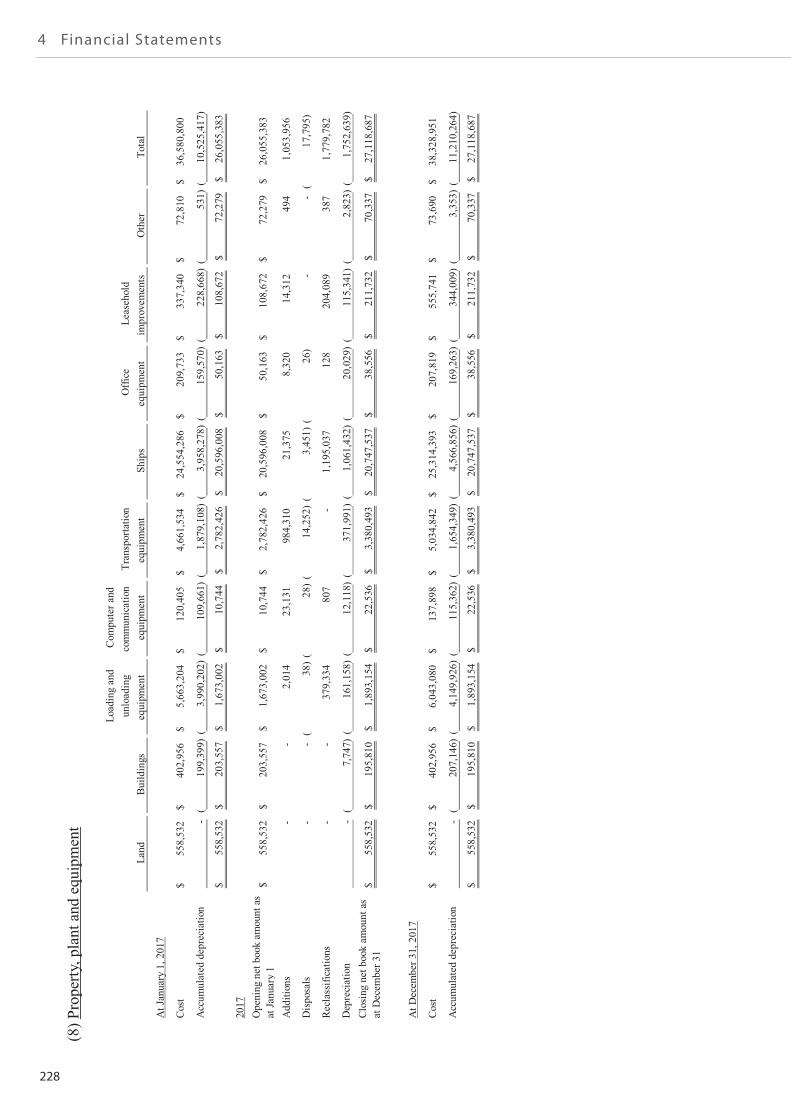
228
4 Financial Statements
~41~
(8)Property,plantandequipment
Land
Buildings
Loadingand
unloading
equipment
Computerand
communication
equipment
Transportation
equipment
Ships
Office
equipment
Leasehold
improvements
Other
Total
AtJanuary1,2017
Cost
558,532
$402,956
$5,663,204
$120,405
$4,661,534
$24,554,286
$209,733
$337,340
$72,810
$36,580,800
$
Accumulateddepreciation
-199,399)
(3,990,202)
(109,661)
(1,879,108)
(3,958,278)
(159,570)
(228,668)
(531)
(10,525,417)
(
558,532
$203,557
$1,673,002
$10,744
$2,782,426
$20,596,008
$50,163
$108,672
$72,279
$26,055,383
$
2017
Openingnetbookamountas
atJanuary1
558,532
$203,557
$1,673,002
$10,744
$2,782,426
$20,596,008
$50,163
$108,672
$72,279
$26,055,383
$
Additions
--
2,014
23,131
984,310
21,375
8,320
14,312
494
1,053,956
Disposals
--
38)
(28)
(14,252)
(3,451)
(26)
(-
-17,795)
(
Reclassifications
--
379,334
807
-1,195,037
128
204,089
387
1,779,782
Depreciation
-7,747)
(161,158)
(12,118)
(371,991)
(1,061,432)
(20,029)
(115,341)
(2,823)
(1,752,639)
(Closingnetbookamountas
atDecember31
558,532
$195,810
$1,893,154
$22,536
$3,380,493
$20,747,537
$38,556
$211,732
$70,337
$27,118,687
$
AtDecember31,2017
Cost
558,532
$402,956
$6,043,080
$137,898
$5,034,842
$25,314,393
$207,819
$555,741
$73,690
$38,328,951
$
Accumulateddepreciation
-207,146)
(4,149,926)
(115,362)
(1,654,349)
(4,566,856)
(169,263)
(344,009)
(3,353)
(11,210,264)
(
558,532
$195,810
$1,893,154
$22,536
$3,380,493
$20,747,537
$38,556
$211,732
$70,337
$27,118,687
$
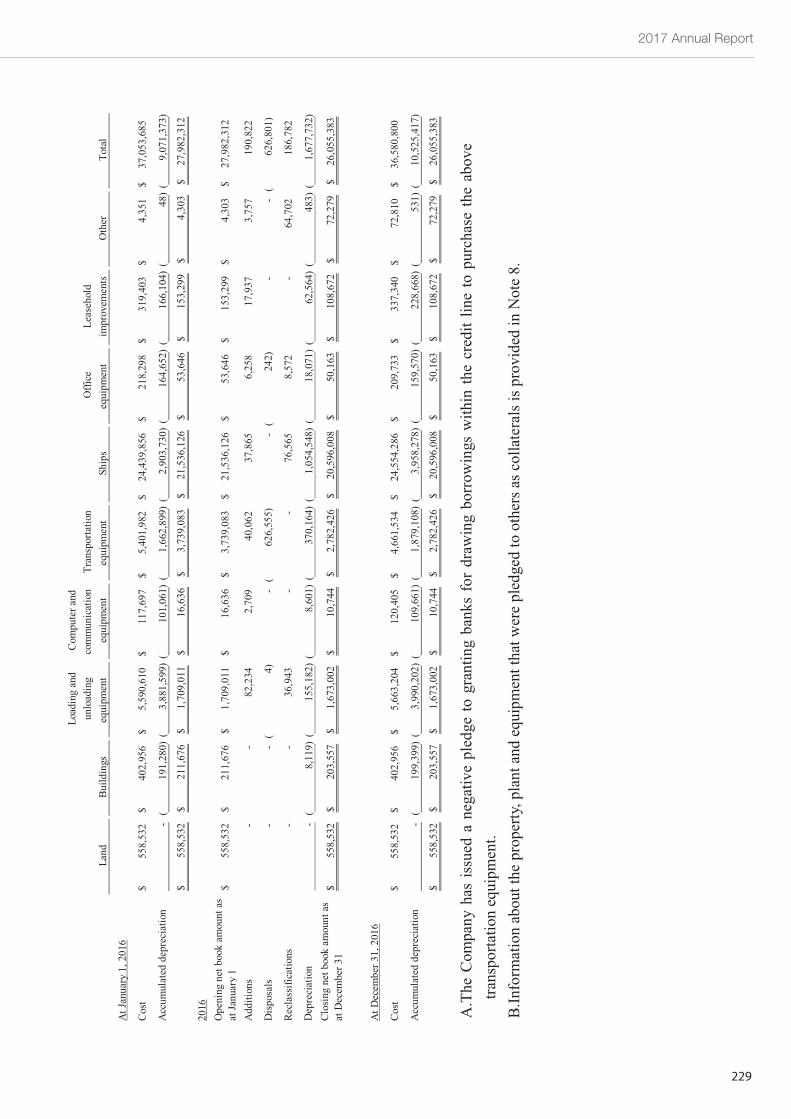
2017 Annual Report
229
~42~
A.TheCompanyhasissuedanegativepledgetograntingbanksfordrawingborrowingswithinthecreditlinetopurchasetheabove
transportationequipment.
B.Informationabouttheproperty,plantandequipmentthatwerepledgedtoothersascollateralsisprovidedinNote8.
Land
Buildings
Loadingand
unloading
equipment
Computerand
communication
equipment
Transportation
equipment
Ships
Office
equipment
Leasehold
improvements
Other
Total
AtJanuary1,2016
Cost
558,532
$402,956
$5,590,610
$117,697
$5,401,982
$24,439,856
$218,298
$319,403
$4,351
$37,053,685
$
Accumulateddepreciation
-191,280)
(3,881,599)
(101,061)
(1,662,899)
(2,903,730)
(164,652)
(166,104)
(48)
(9,071,373)
(
558,532
$211,676
$1,709,011
$16,636
$3,739,083
$21,536,126
$53,646
$153,299
$4,303
$27,982,312
$
2016
Openingnetbookamountas
atJanuary1
558,532
$211,676
$1,709,011
$16,636
$3,739,083
$21,536,126
$53,646
$153,299
$4,303
$27,982,312
$
Additions
--
82,234
2,709
40,062
37,865
6,258
17,937
3,757
190,822
Disposals
--
4)(
-626,555)
(-
242)
(-
-626,801)
(
Reclassifications
--
36,943
--
76,565
8,572
-64,702
186,782
Depreciation
-8,119)
(155,182)
(8,601)
(370,164)
(1,054,548)
(18,071)
(62,564)
(483)
(1,677,732)
(Closingnetbookamountas
atDecember31
558,532
$203,557
$1,673,002
$10,744
$2,782,426
$20,596,008
$50,163
$108,672
$72,279
$26,055,383
$
AtDecember31,2016
Cost
558,532
$402,956
$5,663,204
$120,405
$4,661,534
$24,554,286
$209,733
$337,340
$72,810
$36,580,800
$
Accumulateddepreciation
-199,399)
(3,990,202)
(109,661)
(1,879,108)
(3,958,278)
(159,570)
(228,668)
(531)
(10,525,417)
(
558,532
$203,557
$1,673,002
$10,744
$2,782,426
$20,596,008
$50,163
$108,672
$72,279
$26,055,383
$
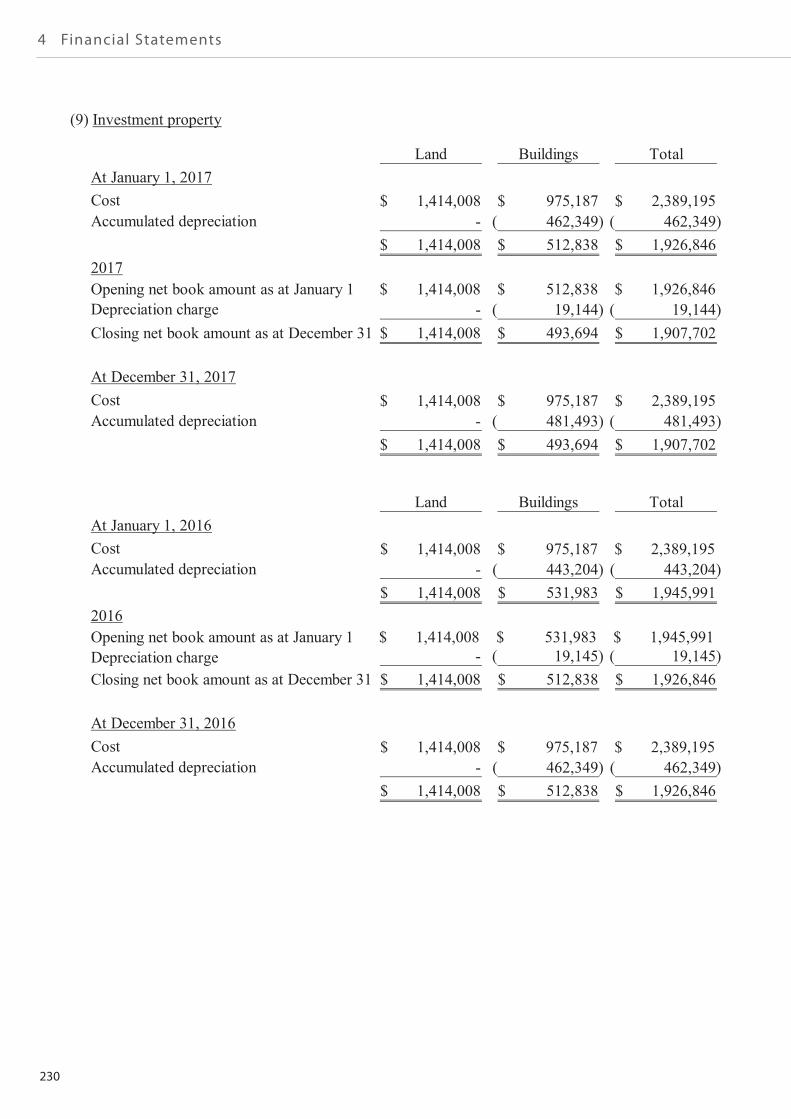
230
4 Financial Statements
~43~
(9) Investment property
Land Buildings TotalAt January 1, 2017Cost 1,414,008$ 975,187$ 2,389,195$Accumulated depreciation - 462,349)( 462,349)(
1,414,008$ 512,838$ 1,926,846$2017Opening net book amount as at January 1 1,414,008$ 512,838$ 1,926,846$Depreciation charge - 19,144)( 19,144)(Closing net book amount as at December 31 1,414,008$ 493,694$ 1,907,702$
At December 31, 2017Cost 1,414,008$ 975,187$ 2,389,195$Accumulated depreciation - 481,493)( 481,493)(
1,414,008$ 493,694$ 1,907,702$
Land Buildings TotalAt January 1, 2016Cost 1,414,008$ 975,187$ 2,389,195$Accumulated depreciation - 443,204)( 443,204)(
1,414,008$ 531,983$ 1,945,991$2016Opening net book amount as at January 1 1,414,008$ 531,983$ 1,945,991$Depreciation charge - 19,145)( 19,145)(Closing net book amount as at December 31 1,414,008$ 512,838$ 1,926,846$
At December 31, 2016Cost 1,414,008$ 975,187$ 2,389,195$Accumulated depreciation - 462,349)( 462,349)(
1,414,008$ 512,838$ 1,926,846$
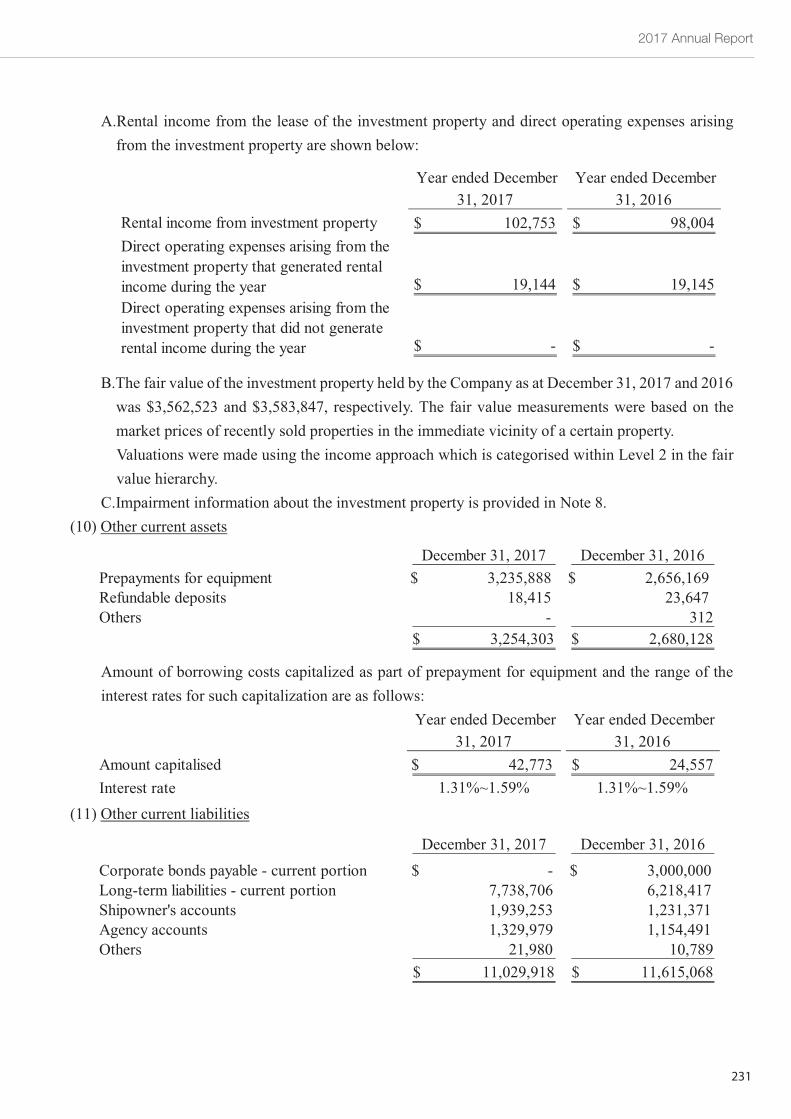
2017 Annual Report
231
~44~
A.Rental income from the lease of the investment property and direct operating expenses arisingfrom the investment property are shown below:
B.The fair value of the investment property held by the Company as at December 31, 2017 and 2016was $3,562,523 and $3,583,847, respectively. The fair value measurements were based on themarket prices of recently sold properties in the immediate vicinity of a certain property.Valuations were made using the income approach which is categorised within Level 2 in the fairvalue hierarchy.
C.Impairment information about the investment property is provided in Note 8.(10) Other current assets
Amount of borrowing costs capitalized as part of prepayment for equipment and the range of theinterest rates for such capitalization are as follows:
(11) Other current liabilities
Year ended December31, 2017
Year ended December31, 2016
Rental income from investment property 102,753$ 98,004$Direct operating expenses arising from theinvestment property that generated rentalincome during the year 19,144$ 19,145$Direct operating expenses arising from theinvestment property that did not generaterental income during the year -$ -$
December 31, 2017 December 31, 2016Prepayments for equipment 3,235,888$ 2,656,169$Refundable deposits 18,415 23,647Others - 312
3,254,303$ 2,680,128$
Year ended December31, 2017
Year ended December31, 2016
Amount capitalised 42,773$ 24,557$Interest rate 1.31%~1.59% 1.31%~1.59%
December 31, 2017 December 31, 2016
Corporate bonds payable - current portion -$ 3,000,000$Long-term liabilities - current portion 7,738,706 6,218,417Shipowner's accounts 1,939,253 1,231,371Agency accounts 1,329,979 1,154,491Others 21,980 10,789
11,029,918$ 11,615,068$
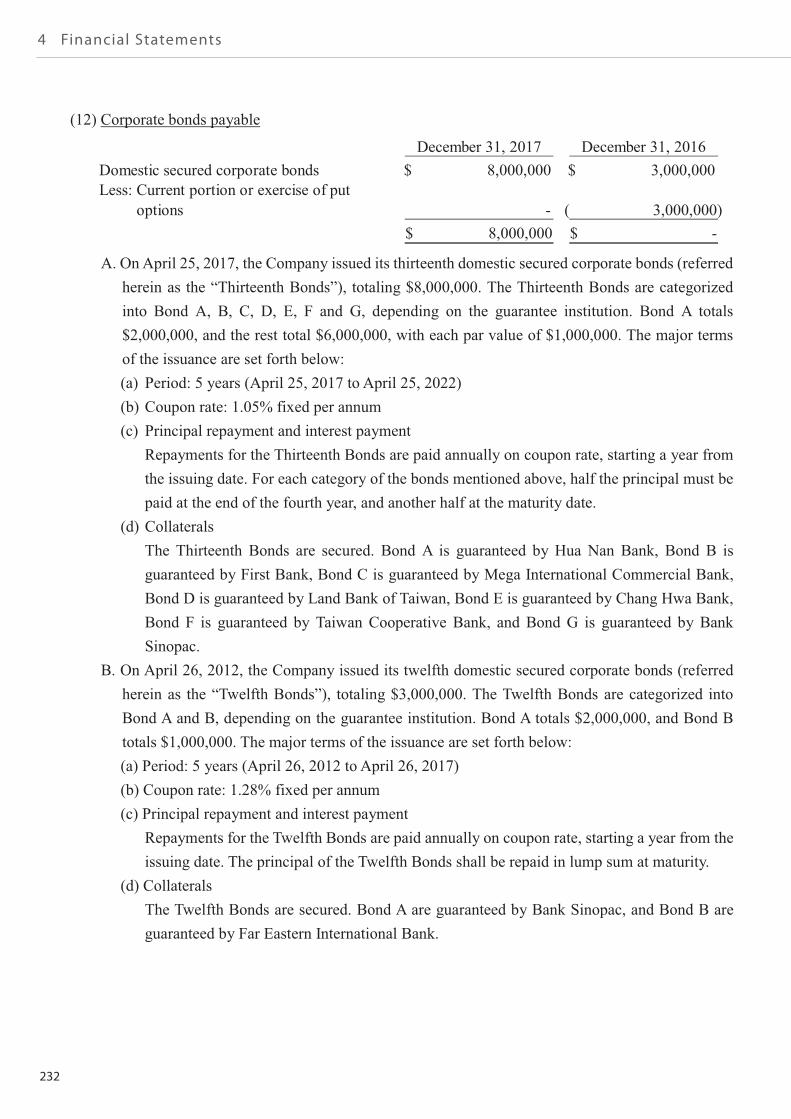
232
4 Financial Statements
~45~
(12) Corporate bonds payable
A. On April 25, 2017, the Company issued its thirteenth domestic secured corporate bonds (referredherein as the “Thirteenth Bonds”), totaling $8,000,000. The Thirteenth Bonds are categorizedinto Bond A, B, C, D, E, F and G, depending on the guarantee institution. Bond A totals$2,000,000, and the rest total $6,000,000, with each par value of $1,000,000. The major termsof the issuance are set forth below:(a) Period: 5 years (April 25, 2017 to April 25, 2022)(b) Coupon rate: 1.05% fixed per annum(c) Principal repayment and interest paymentRepayments for the Thirteenth Bonds are paid annually on coupon rate, starting a year fromthe issuing date. For each category of the bonds mentioned above, half the principal must bepaid at the end of the fourth year, and another half at the maturity date.
(d) CollateralsThe Thirteenth Bonds are secured. Bond A is guaranteed by Hua Nan Bank, Bond B isguaranteed by First Bank, Bond C is guaranteed by Mega International Commercial Bank,Bond D is guaranteed by Land Bank of Taiwan, Bond E is guaranteed by Chang Hwa Bank,Bond F is guaranteed by Taiwan Cooperative Bank, and Bond G is guaranteed by BankSinopac.
B. On April 26, 2012, the Company issued its twelfth domestic secured corporate bonds (referredherein as the “Twelfth Bonds”), totaling $3,000,000. The Twelfth Bonds are categorized intoBond A and B, depending on the guarantee institution. Bond A totals $2,000,000, and Bond Btotals $1,000,000. The major terms of the issuance are set forth below:(a) Period: 5 years (April 26, 2012 to April 26, 2017)(b) Coupon rate: 1.28% fixed per annum(c) Principal repayment and interest paymentRepayments for the Twelfth Bonds are paid annually on coupon rate, starting a year from theissuing date. The principal of the Twelfth Bonds shall be repaid in lump sum at maturity.
(d) CollateralsThe Twelfth Bonds are secured. Bond A are guaranteed by Bank Sinopac, and Bond B areguaranteed by Far Eastern International Bank.
December 31, 2017 December 31, 2016Domestic secured corporate bonds 8,000,000$ 3,000,000$Less: Current portion or exercise of put
options - 3,000,000)(8,000,000$ -$
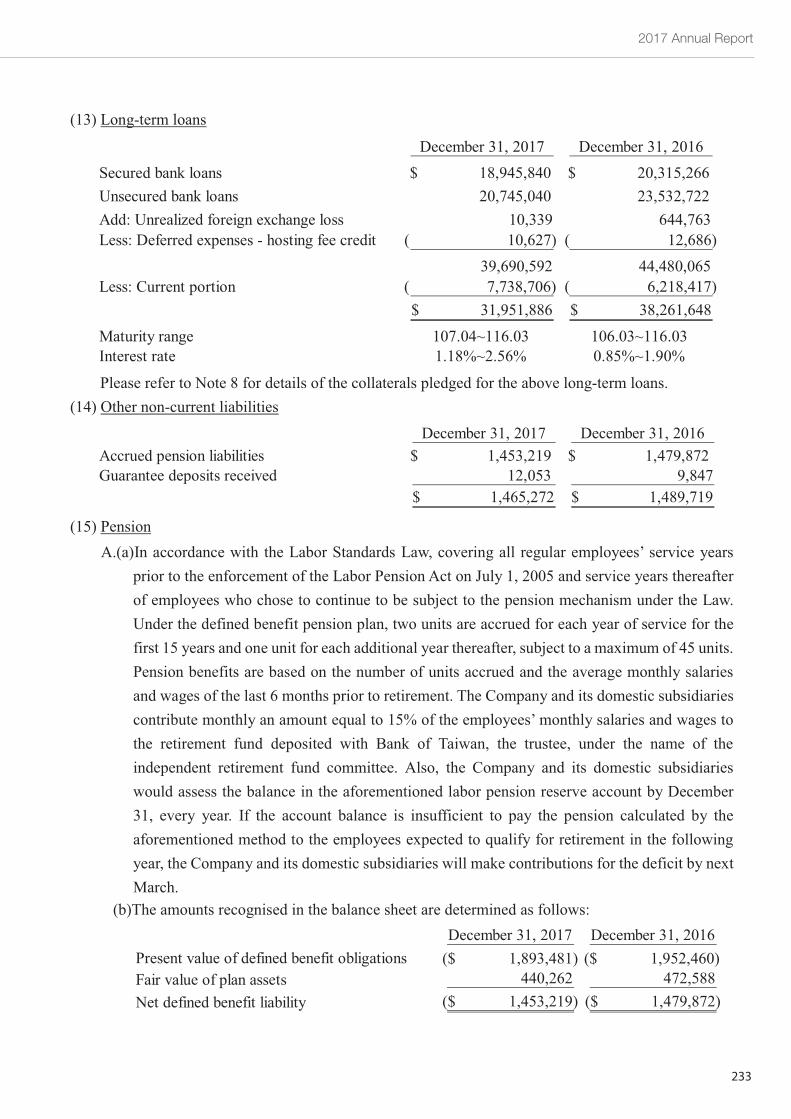
2017 Annual Report
233
~46~
(13) Long-term loans
Please refer to Note 8 for details of the collaterals pledged for the above long-term loans.(14) Other non-current liabilities
(15) PensionA.(a)In accordance with the Labor Standards Law, covering all regular employees’ service years
prior to the enforcement of the Labor Pension Act on July 1, 2005 and service years thereafterof employees who chose to continue to be subject to the pension mechanism under the Law.Under the defined benefit pension plan, two units are accrued for each year of service for thefirst 15 years and one unit for each additional year thereafter, subject to a maximum of 45 units.Pension benefits are based on the number of units accrued and the average monthly salariesand wages of the last 6 months prior to retirement. The Company and its domestic subsidiariescontribute monthly an amount equal to 15% of the employees’ monthly salaries and wages tothe retirement fund deposited with Bank of Taiwan, the trustee, under the name of theindependent retirement fund committee. Also, the Company and its domestic subsidiarieswould assess the balance in the aforementioned labor pension reserve account by December31, every year. If the account balance is insufficient to pay the pension calculated by theaforementioned method to the employees expected to qualify for retirement in the followingyear, the Company and its domestic subsidiaries will make contributions for the deficit by nextMarch.
(b)The amounts recognised in the balance sheet are determined as follows:
December 31, 2017 December 31, 2016Secured bank loans 18,945,840$ 20,315,266$Unsecured bank loans 20,745,040 23,532,722Add: Unrealized foreign exchange loss 10,339 644,763Less: Deferred expenses - hosting fee credit 10,627)( 12,686)(
39,690,592 44,480,065Less: Current portion 7,738,706)( 6,218,417)(
31,951,886$ 38,261,648$
Maturity range 107.04~116.03 106.03~116.03Interest rate 1.18%~2.56% 0.85%~1.90%
December 31, 2017 December 31, 2016Accrued pension liabilities 1,453,219$ 1,479,872$Guarantee deposits received 12,053 9,847
1,465,272$ 1,489,719$
December 31, 2017 December 31, 2016Present value of defined benefit obligations 1,893,481)($ 1,952,460)($Fair value of plan assets 440,262 472,588Net defined benefit liability 1,453,219)($ 1,479,872)($
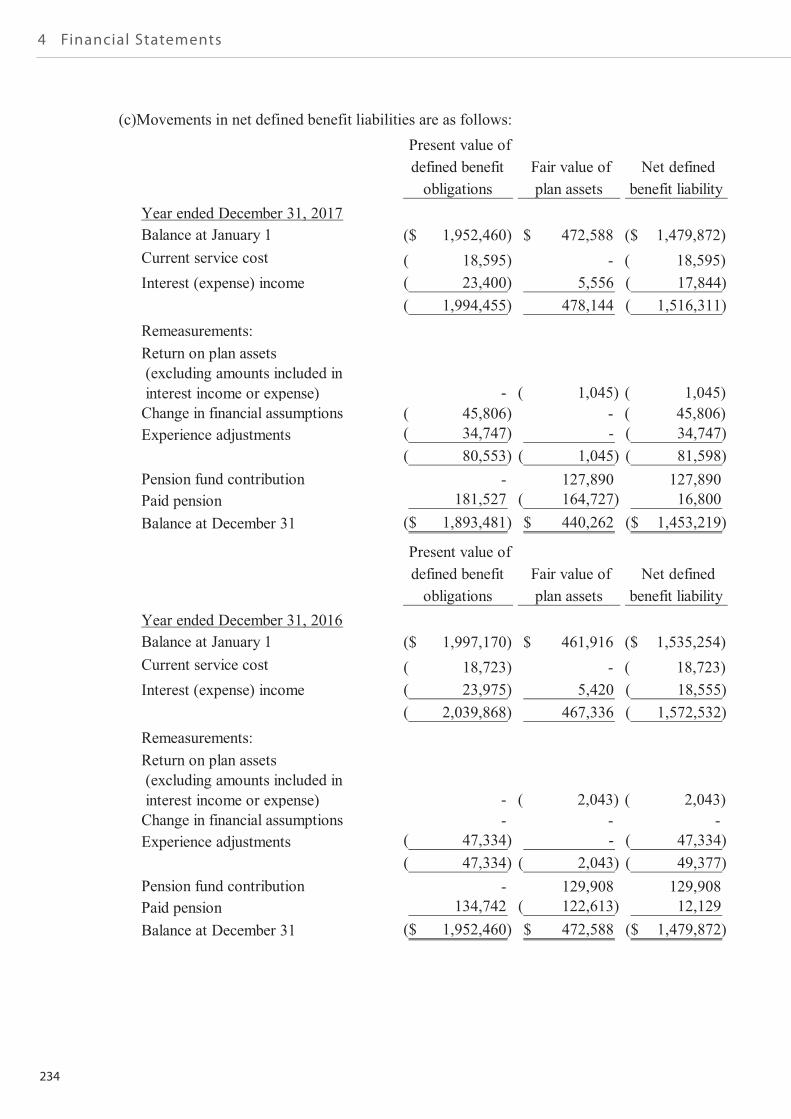
234
4 Financial Statements
~47~
(c)Movements in net defined benefit liabilities are as follows:Present value ofdefined benefitobligations
Fair value ofplan assets
Net definedbenefit liability
Year ended December 31, 2017Balance at January 1 1,952,460)($ 472,588$ 1,479,872)($Current service cost 18,595)( - 18,595)(Interest (expense) income 23,400)( 5,556 17,844)(
1,994,455)( 478,144 1,516,311)(Remeasurements:Return on plan assets(excluding amounts included ininterest income or expense) - 1,045)( 1,045)(Change in financial assumptions 45,806)( - 45,806)(Experience adjustments 34,747)( - 34,747)(
80,553)( 1,045)( 81,598)(Pension fund contribution - 127,890 127,890Paid pension 181,527 164,727)( 16,800Balance at December 31 1,893,481)($ 440,262$ 1,453,219)($
Present value ofdefined benefitobligations
Fair value ofplan assets
Net definedbenefit liability
Year ended December 31, 2016Balance at January 1 1,997,170)($ 461,916$ 1,535,254)($Current service cost 18,723)( - 18,723)(Interest (expense) income 23,975)( 5,420 18,555)(
2,039,868)( 467,336 1,572,532)(Remeasurements:Return on plan assets(excluding amounts included ininterest income or expense) - 2,043)( 2,043)(Change in financial assumptions - - -Experience adjustments 47,334)( - 47,334)(
47,334)( 2,043)( 49,377)(Pension fund contribution - 129,908 129,908Paid pension 134,742 122,613)( 12,129Balance at December 31 1,952,460)($ 472,588$ 1,479,872)($
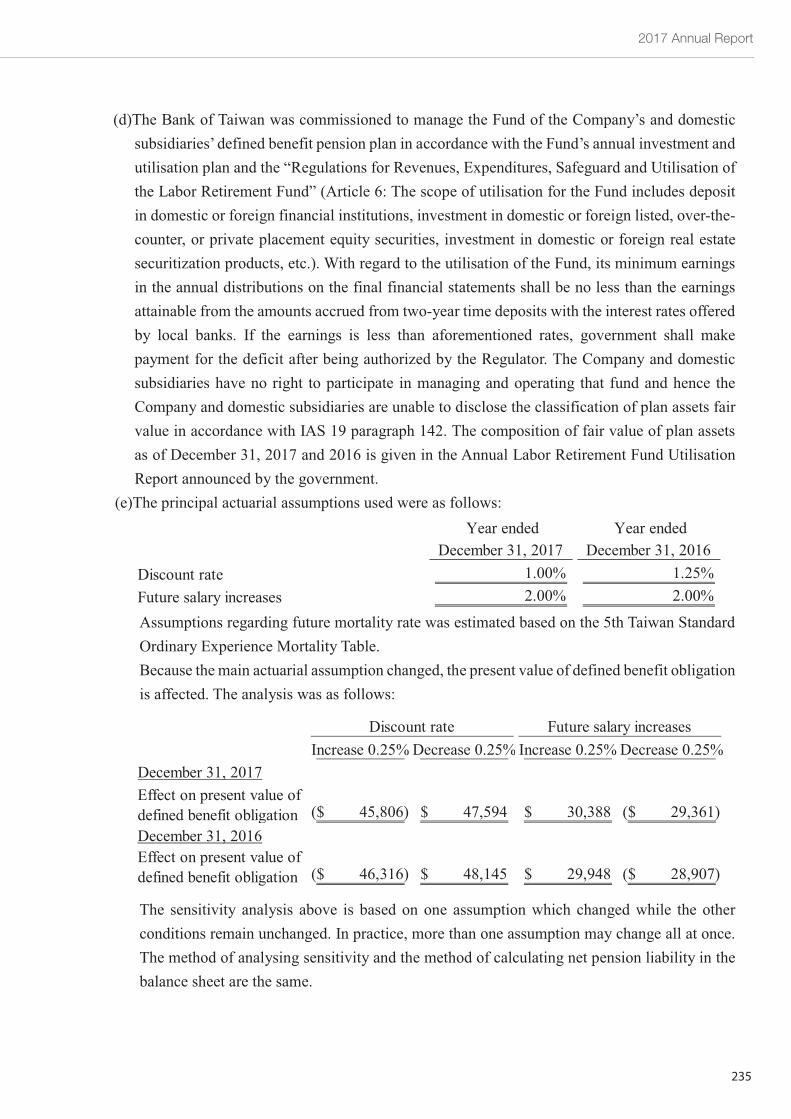
2017 Annual Report
235
~48~
(d)The Bank of Taiwan was commissioned to manage the Fund of the Company’s and domesticsubsidiaries’ defined benefit pension plan in accordance with the Fund’s annual investment andutilisation plan and the “Regulations for Revenues, Expenditures, Safeguard and Utilisation ofthe Labor Retirement Fund” (Article 6: The scope of utilisation for the Fund includes depositin domestic or foreign financial institutions, investment in domestic or foreign listed, over-the-counter, or private placement equity securities, investment in domestic or foreign real estatesecuritization products, etc.). With regard to the utilisation of the Fund, its minimum earningsin the annual distributions on the final financial statements shall be no less than the earningsattainable from the amounts accrued from two-year time deposits with the interest rates offeredby local banks. If the earnings is less than aforementioned rates, government shall makepayment for the deficit after being authorized by the Regulator. The Company and domesticsubsidiaries have no right to participate in managing and operating that fund and hence theCompany and domestic subsidiaries are unable to disclose the classification of plan assets fairvalue in accordance with IAS 19 paragraph 142. The composition of fair value of plan assetsas of December 31, 2017 and 2016 is given in the Annual Labor Retirement Fund UtilisationReport announced by the government.
(e)The principal actuarial assumptions used were as follows:
Assumptions regarding future mortality rate was estimated based on the 5th Taiwan StandardOrdinary Experience Mortality Table.Because the main actuarial assumption changed, the present value of defined benefit obligationis affected. The analysis was as follows:
The sensitivity analysis above is based on one assumption which changed while the otherconditions remain unchanged. In practice, more than one assumption may change all at once.The method of analysing sensitivity and the method of calculating net pension liability in thebalance sheet are the same.
Year endedDecember 31, 2017
Year endedDecember 31, 2016
Discount rate 1.00% 1.25%Future salary increases 2.00% 2.00%
Increase 0.25%Decrease 0.25% Increase 0.25%Decrease 0.25%December 31, 2017Effect on present value ofdefined benefit obligation 45,806)($ 47,594$ 30,388$ 29,361)($December 31, 2016Effect on present value ofdefined benefit obligation 46,316)($ 48,145$ 29,948$ 28,907)($
Discount rate Future salary increases
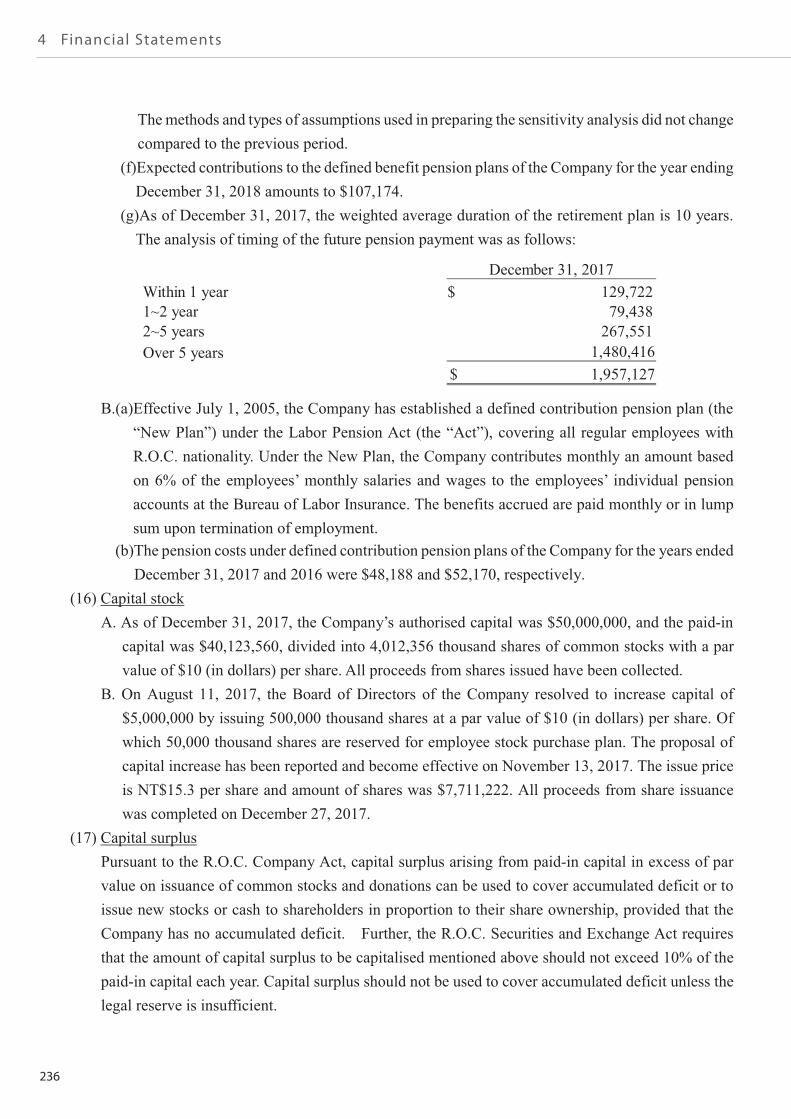
236
4 Financial Statements
~49~
Themethods and types of assumptions used in preparing the sensitivity analysis did not changecompared to the previous period.
(f)Expected contributions to the defined benefit pension plans of the Company for the year endingDecember 31, 2018 amounts to $107,174.
(g)As of December 31, 2017, the weighted average duration of the retirement plan is 10 years.The analysis of timing of the future pension payment was as follows:
B.(a)Effective July 1, 2005, the Company has established a defined contribution pension plan (the“New Plan”) under the Labor Pension Act (the “Act”), covering all regular employees withR.O.C. nationality. Under the New Plan, the Company contributes monthly an amount basedon 6% of the employees’ monthly salaries and wages to the employees’ individual pensionaccounts at the Bureau of Labor Insurance. The benefits accrued are paid monthly or in lumpsum upon termination of employment.
(b)The pension costs under defined contribution pension plans of the Company for the years endedDecember 31, 2017 and 2016 were $48,188 and $52,170, respectively.
(16) Capital stockA. As of December 31, 2017, the Company’s authorised capital was $50,000,000, and the paid-incapital was $40,123,560, divided into 4,012,356 thousand shares of common stocks with a parvalue of $10 (in dollars) per share. All proceeds from shares issued have been collected.
B. On August 11, 2017, the Board of Directors of the Company resolved to increase capital of$5,000,000 by issuing 500,000 thousand shares at a par value of $10 (in dollars) per share. Ofwhich 50,000 thousand shares are reserved for employee stock purchase plan. The proposal ofcapital increase has been reported and become effective on November 13, 2017. The issue priceis NT$15.3 per share and amount of shares was $7,711,222. All proceeds from share issuancewas completed on December 27, 2017.
(17) Capital surplusPursuant to the R.O.C. Company Act, capital surplus arising from paid-in capital in excess of parvalue on issuance of common stocks and donations can be used to cover accumulated deficit or toissue new stocks or cash to shareholders in proportion to their share ownership, provided that theCompany has no accumulated deficit. Further, the R.O.C. Securities and Exchange Act requiresthat the amount of capital surplus to be capitalised mentioned above should not exceed 10% of thepaid-in capital each year. Capital surplus should not be used to cover accumulated deficit unless thelegal reserve is insufficient.
December 31, 2017Within 1 year 129,722$1~2 year 79,4382~5 years 267,551Over 5 years 1,480,416
1,957,127$
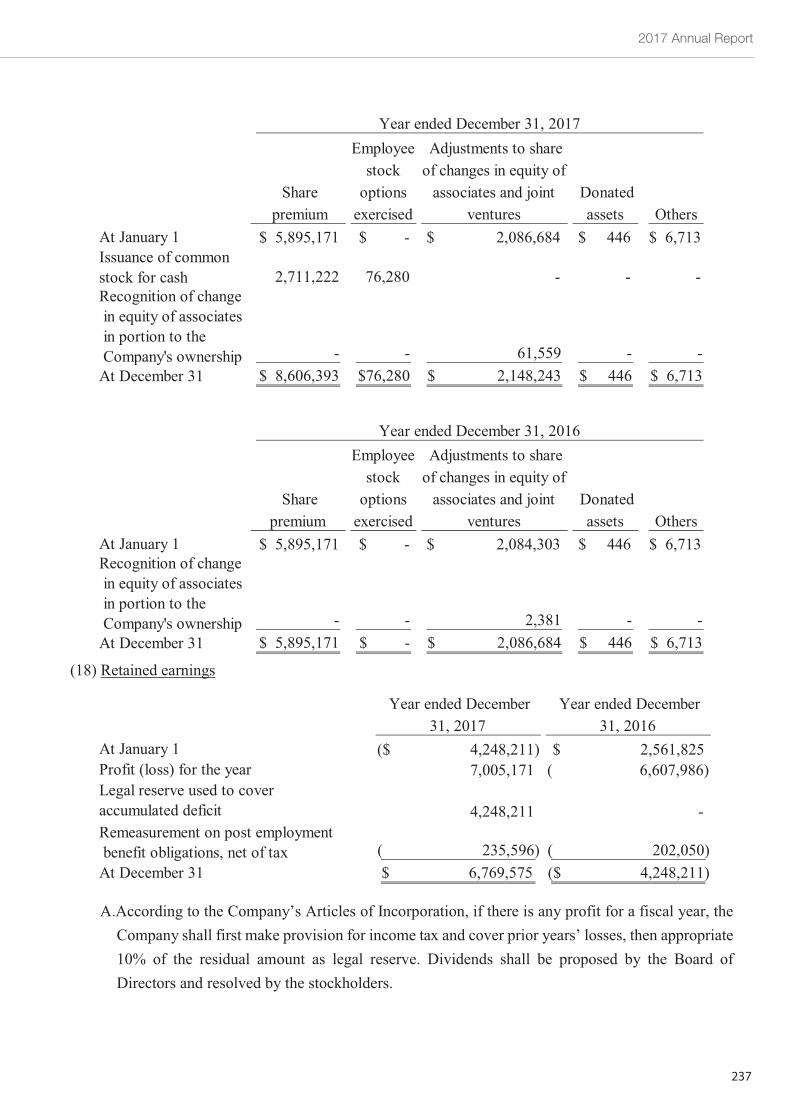
2017 Annual Report
237
~50~
(18) Retained earnings
A.According to the Company’s Articles of Incorporation, if there is any profit for a fiscal year, theCompany shall first make provision for income tax and cover prior years’ losses, then appropriate10% of the residual amount as legal reserve. Dividends shall be proposed by the Board ofDirectors and resolved by the stockholders.
Sharepremium
Employeestockoptionsexercised
Adjustments to shareof changes in equity ofassociates and joint
venturesDonatedassets Others
At January 1 5,895,171$ -$ 2,086,684$ 446$ 6,713$Issuance of commonstock for cash 2,711,222 76,280 - - -Recognition of changein equity of associatesin portion to theCompany's ownership - - 61,559 - -At December 31 8,606,393$ 76,280$ 2,148,243$ 446$ 6,713$
Year ended December 31, 2017
Sharepremium
Employeestockoptionsexercised
Adjustments to shareof changes in equity ofassociates and joint
venturesDonatedassets Others
At January 1 5,895,171$ -$ 2,084,303$ 446$ 6,713$Recognition of changein equity of associatesin portion to theCompany's ownership - - 2,381 - -At December 31 5,895,171$ -$ 2,086,684$ 446$ 6,713$
Year ended December 31, 2016
Year ended December31, 2017
Year ended December31, 2016
At January 1 4,248,211)($ 2,561,825$Profit (loss) for the year 7,005,171 6,607,986)(Legal reserve used to coveraccumulated deficit 4,248,211 -Remeasurement on post employmentbenefit obligations, net of tax 235,596)( 202,050)(At December 31 6,769,575$ 4,248,211)($
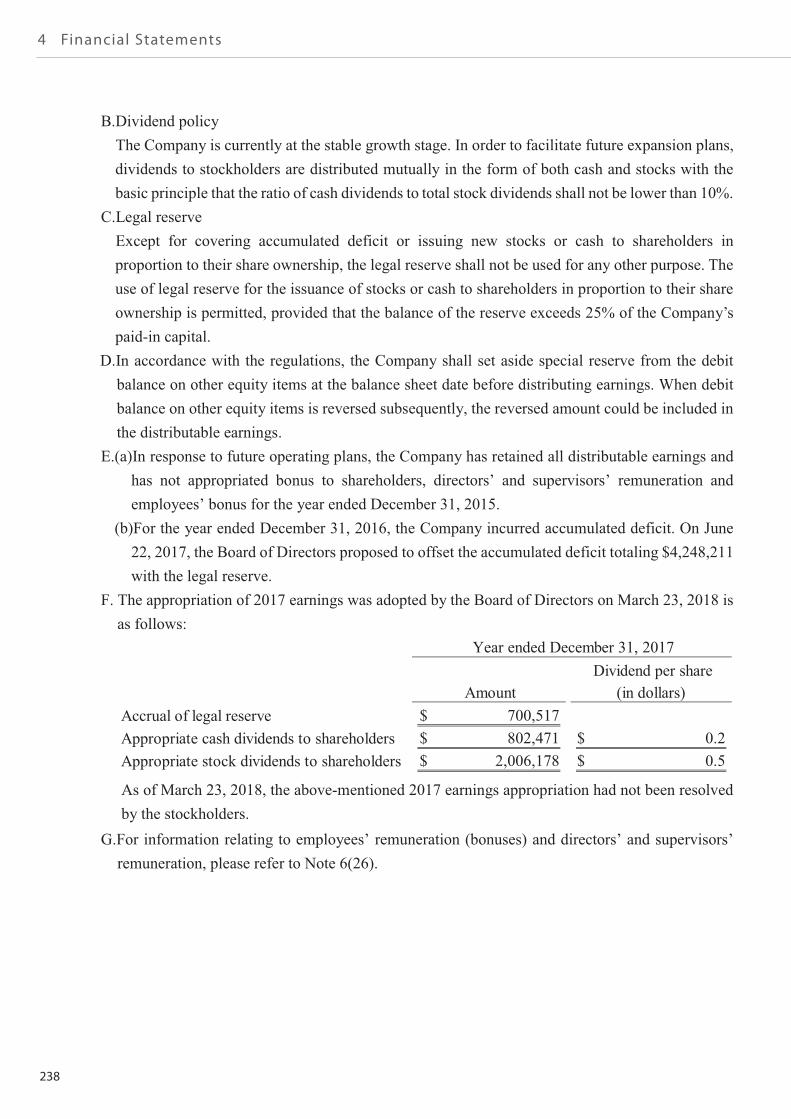
238
4 Financial Statements
~51~
B.Dividend policyThe Company is currently at the stable growth stage. In order to facilitate future expansion plans,dividends to stockholders are distributed mutually in the form of both cash and stocks with thebasic principle that the ratio of cash dividends to total stock dividends shall not be lower than 10%.
C.Legal reserveExcept for covering accumulated deficit or issuing new stocks or cash to shareholders inproportion to their share ownership, the legal reserve shall not be used for any other purpose. Theuse of legal reserve for the issuance of stocks or cash to shareholders in proportion to their shareownership is permitted, provided that the balance of the reserve exceeds 25% of the Company’spaid-in capital.
D.In accordance with the regulations, the Company shall set aside special reserve from the debitbalance on other equity items at the balance sheet date before distributing earnings. When debitbalance on other equity items is reversed subsequently, the reversed amount could be included inthe distributable earnings.
E.(a)In response to future operating plans, the Company has retained all distributable earnings andhas not appropriated bonus to shareholders, directors’ and supervisors’ remuneration andemployees’ bonus for the year ended December 31, 2015.
E.(b)For the year ended December 31, 2016, the Company incurred accumulated deficit. On June22, 2017, the Board of Directors proposed to offset the accumulated deficit totaling $4,248,211with the legal reserve.
F. The appropriation of 2017 earnings was adopted by the Board of Directors on March 23, 2018 isas follows:
As of March 23, 2018, the above-mentioned 2017 earnings appropriation had not been resolvedby the stockholders.
G.For information relating to employees’ remuneration (bonuses) and directors’ and supervisors’remuneration, please refer to Note 6(26).
AmountDividend per share(in dollars)
Accrual of legal reserve 700,517$Appropriate cash dividends to shareholders 802,471$ 0.2$Appropriate stock dividends to shareholders 2,006,178$ 0.5$
Year ended December 31, 2017
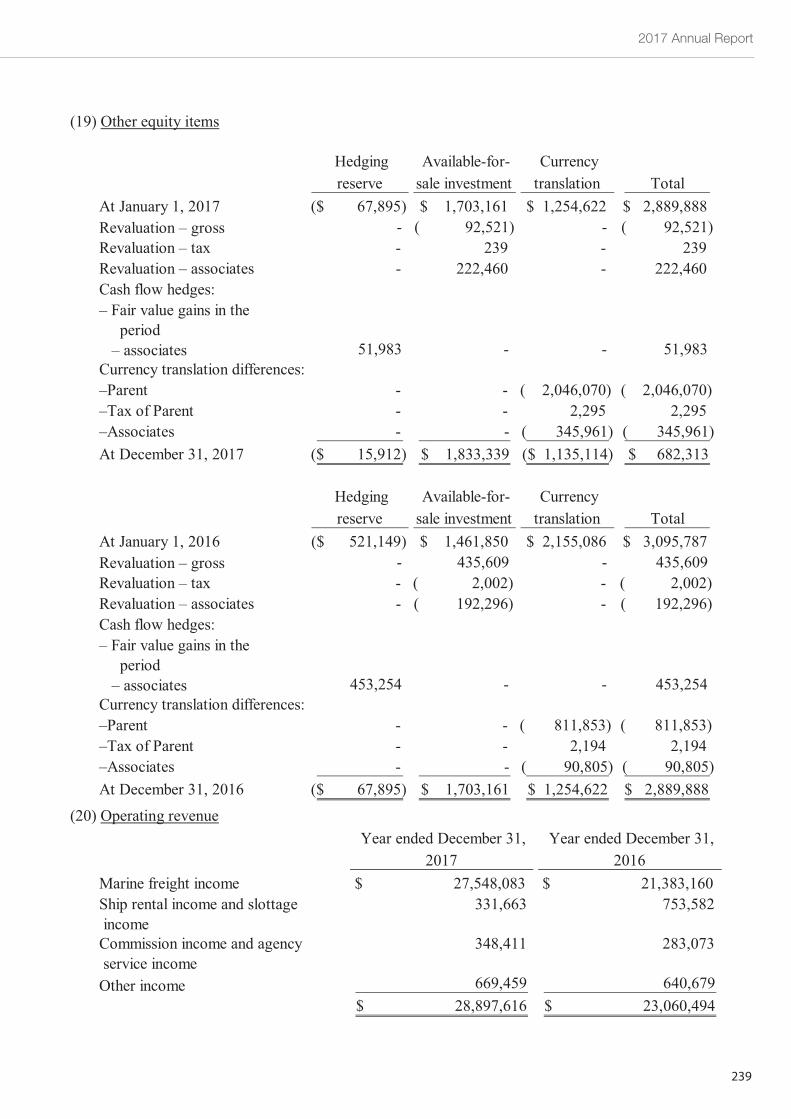
2017 Annual Report
239
~52~
(19) Other equity items
(20) Operating revenue
Hedgingreserve
Available-for-sale investment
Currencytranslation Total
At January 1, 2017 67,895)($ 1,703,161$ 1,254,622$ 2,889,888$Revaluation – gross - 92,521)( - 92,521)(Revaluation – tax - 239 - 239Revaluation – associates - 222,460 - 222,460Cash flow hedges:– Fair value gains in theperiod– associates 51,983 - - 51,983
Currency translation differences:–Parent - - 2,046,070)( 2,046,070)(–Tax of Parent - - 2,295 2,295–Associates - - 345,961)( 345,961)(At December 31, 2017 15,912)($ 1,833,339$ 1,135,114)($ 682,313$
Hedgingreserve
Available-for-sale investment
Currencytranslation Total
At January 1, 2016 521,149)($ 1,461,850$ 2,155,086$ 3,095,787$Revaluation – gross - 435,609 - 435,609Revaluation – tax - 2,002)( - 2,002)(Revaluation – associates - 192,296)( - 192,296)(Cash flow hedges:– Fair value gains in theperiod– associates 453,254 - - 453,254
Currency translation differences:–Parent - - 811,853)( 811,853)(–Tax of Parent - - 2,194 2,194–Associates - - 90,805)( 90,805)(At December 31, 2016 67,895)($ 1,703,161$ 1,254,622$ 2,889,888$
Year ended December 31,2017
Year ended December 31,2016
Marine freight income 27,548,083$ 21,383,160$Ship rental income and slottageincome
331,663 753,582
Commission income and agencyservice income
348,411 283,073
Other income 669,459 640,67928,897,616$ 23,060,494$
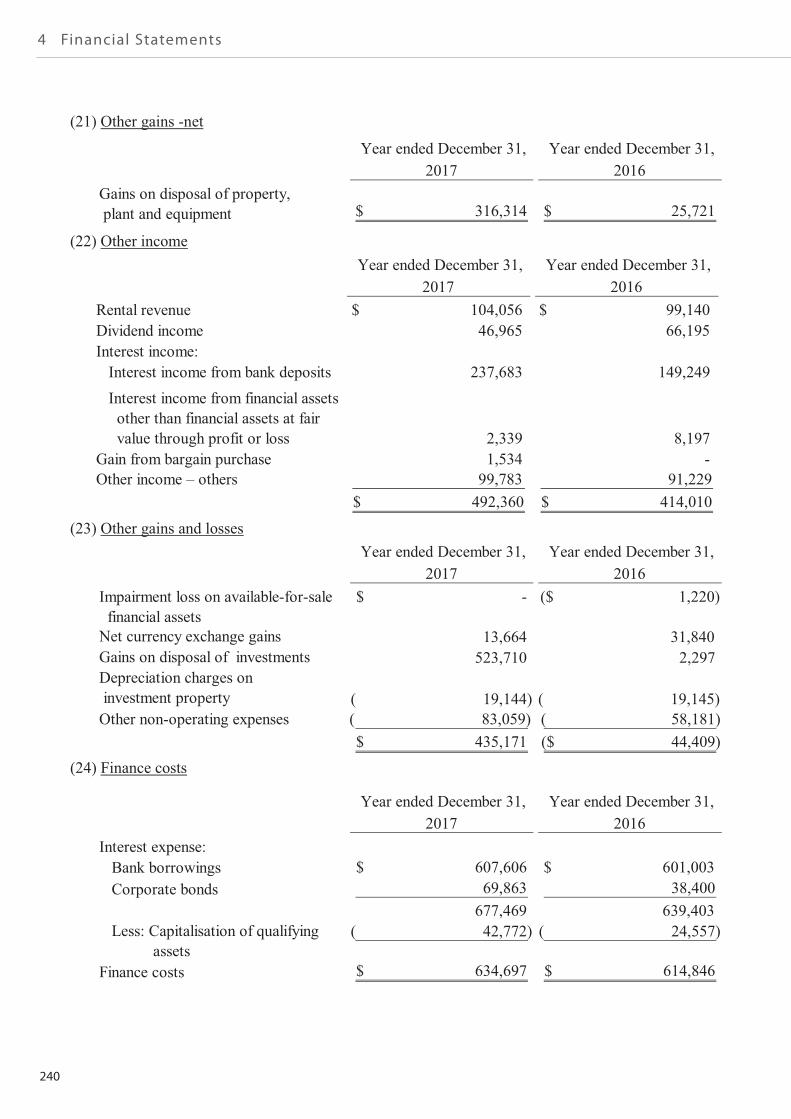
240
4 Financial Statements
~53~
(21) Other gains -net
(22) Other income
(23) Other gains and losses
(24) Finance costs
Year ended December 31,2017
Year ended December 31,2016
Gains on disposal of property,plant and equipment 316,314$ 25,721$
Year ended December 31,2017
Year ended December 31,2016
Rental revenue 104,056$ 99,140$Dividend income 46,965 66,195Interest income:Interest income from bank deposits 237,683 149,249Interest income from financial assetsother than financial assets at fairvalue through profit or loss 2,339 8,197
Gain from bargain purchase 1,534 -Other income – others 99,783 91,229
492,360$ 414,010$
Year ended December 31,2017
Year ended December 31,2016
Impairment loss on available-for-salefinancial assets
-$ 1,220)($
Net currency exchange gains 13,664 31,840Gains on disposal of investments 523,710 2,297Depreciation charges oninvestment property 19,144)( 19,145)(Other non-operating expenses 83,059)( 58,181)(
435,171$ 44,409)($
Year ended December 31,2017
Year ended December 31,2016
Interest expense:Bank borrowings 607,606$ 601,003$Corporate bonds 69,863 38,400
677,469 639,403Less: Capitalisation of qualifying
assets42,772)( 24,557)(
Finance costs 634,697$ 614,846$
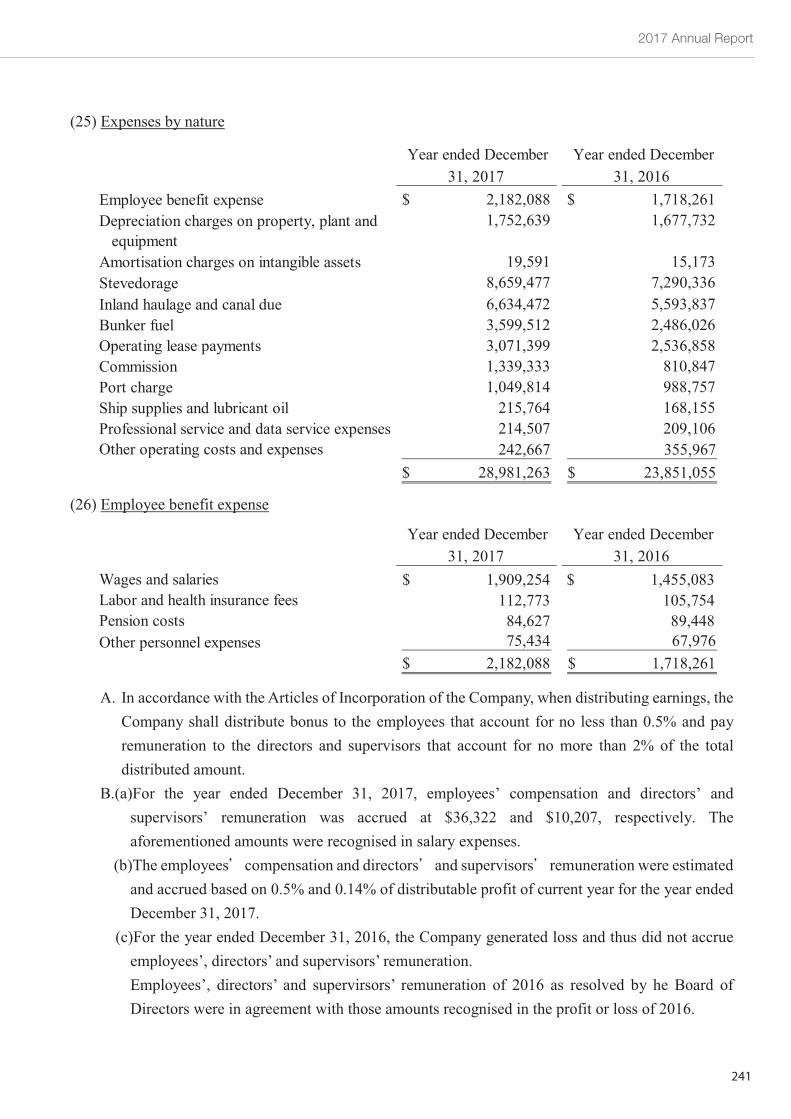
2017 Annual Report
241
~54~
(25) Expenses by nature
(26) Employee benefit expense
A. In accordance with the Articles of Incorporation of the Company, when distributing earnings, theCompany shall distribute bonus to the employees that account for no less than 0.5% and payremuneration to the directors and supervisors that account for no more than 2% of the totaldistributed amount.
B.(a)For the year ended December 31, 2017, employees’ compensation and directors’ andsupervisors’ remuneration was accrued at $36,322 and $10,207, respectively. Theaforementioned amounts were recognised in salary expenses.
B (b)The employees compensation and directors and supervisors remuneration were estimatedand accrued based on 0.5% and 0.14% of distributable profit of current year for the year endedDecember 31, 2017.
B (c)For the year ended December 31, 2016, the Company generated loss and thus did not accrueemployees’, directors’ and supervisors’ remuneration.Employees’, directors’ and supervirsors’ remuneration of 2016 as resolved by he Board ofDirectors were in agreement with those amounts recognised in the profit or loss of 2016.
Year ended December31, 2017
Year ended December31, 2016
Employee benefit expense 2,182,088$ 1,718,261$Depreciation charges on property, plant andequipment
1,752,639 1,677,732
Amortisation charges on intangible assets 19,591 15,173Stevedorage 8,659,477 7,290,336Inland haulage and canal due 6,634,472 5,593,837Bunker fuel 3,599,512 2,486,026Operating lease payments 3,071,399 2,536,858Commission 1,339,333 810,847Port charge 1,049,814 988,757Ship supplies and lubricant oil 215,764 168,155Professional service and data service expenses 214,507 209,106Other operating costs and expenses 242,667 355,967
28,981,263$ 23,851,055$
Year ended December31, 2017
Year ended December31, 2016
Wages and salaries 1,909,254$ 1,455,083$Labor and health insurance fees 112,773 105,754Pension costs 84,627 89,448Other personnel expenses 75,434 67,976
2,182,088$ 1,718,261$
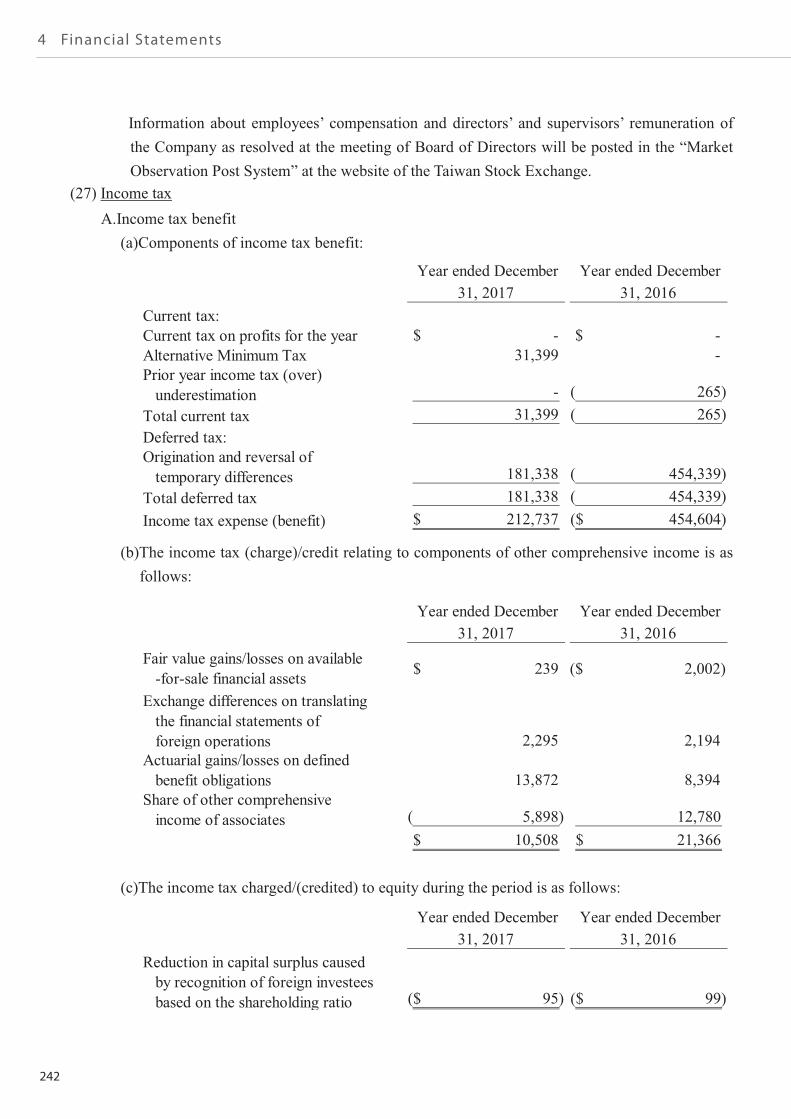
242
4 Financial Statements
~55~
B(c)Information about employees’ compensation and directors’ and supervisors’ remuneration ofthe Company as resolved at the meeting of Board of Directors will be posted in the “MarketObservation Post System” at the website of the Taiwan Stock Exchange.
(27) Income taxA.Income tax benefit(a)Components of income tax benefit:
(b)The income tax (charge)/credit relating to components of other comprehensive income is asfollows:
(c)The income tax charged/(credited) to equity during the period is as follows:
Year ended December31, 2017
Year ended December31, 2016
Current tax:Current tax on profits for the year -$ -$Alternative Minimum Tax 31,399 -Prior year income tax (over)underestimation - 265)(
Total current tax 31,399 265)(Deferred tax:Origination and reversal oftemporary differences 181,338 454,339)(
Total deferred tax 181,338 454,339)(Income tax expense (benefit) 212,737$ 454,604)($
Year ended December31, 2017
Year ended December31, 2016
Fair value gains/losses on available-for-sale financial assets 239$ 2,002)($
Exchange differences on translatingthe financial statements offoreign operations 2,295 2,194
Actuarial gains/losses on definedbenefit obligations 13,872 8,394
Share of other comprehensiveincome of associates 5,898)( 12,780
10,508$ 21,366$
Year ended December31, 2017
Year ended December31, 2016
Reduction in capital surplus causedby recognition of foreign investeesbased on the shareholding ratio 95)($ 99)($
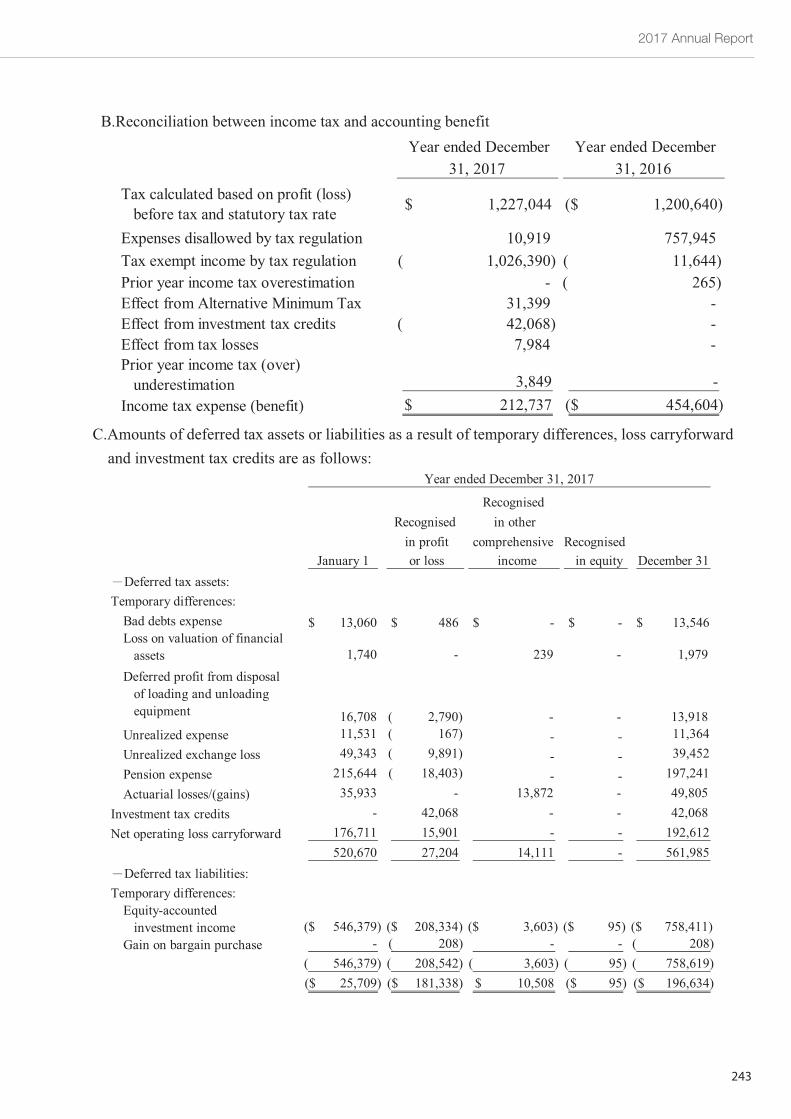
2017 Annual Report
243
~56~
B.Reconciliation between income tax and accounting benefit
C.Amounts of deferred tax assets or liabilities as a result of temporary differences, loss carryforwardand investment tax credits are as follows:
Year ended December31, 2017
Year ended December31, 2016
Tax calculated based on profit (loss)before tax and statutory tax rate 1,227,044$ 1,200,640)($
Expenses disallowed by tax regulation 10,919 757,945Tax exempt income by tax regulation 1,026,390)( 11,644)(Prior year income tax overestimation - 265)(Effect from Alternative Minimum Tax 31,399 -Effect from investment tax credits 42,068)( -Effect from tax losses 7,984 -Prior year income tax (over)underestimation 3,849 -
Income tax expense (benefit) 212,737$ 454,604)($
RecognisedRecognised in otherin profit comprehensive Recognised
January 1 or loss income in equity December 31Deferred tax assets:
Temporary differences:Bad debts expense 13,060$ 486$ -$ -$ 13,546$Loss on valuation of financialassets 1,740 - 239 - 1,979
Deferred profit from disposalof loading and unloadingequipment 16,708 2,790)( - - 13,918
Unrealized expense 11,531 167)( - - 11,364Unrealized exchange loss 49,343 9,891)( - - 39,452Pension expense 215,644 18,403)( - - 197,241Actuarial losses/(gains) 35,933 - 13,872 - 49,805
Investment tax credits - 42,068 - - 42,068Net operating loss carryforward 176,711 15,901 - - 192,612
520,670 27,204 14,111 - 561,985Deferred tax liabilities:
Temporary differences:Equity-accountedinvestment income 546,379)($ 208,334)($ 3,603)($ 95)($ 758,411)($
Gain on bargain purchase - 208)( - - 208)(546,379)( 208,542)( 3,603)( 95)( 758,619)(25,709)($ 181,338)($ 10,508$ 95)($ 196,634)($
Year ended December 31, 2017
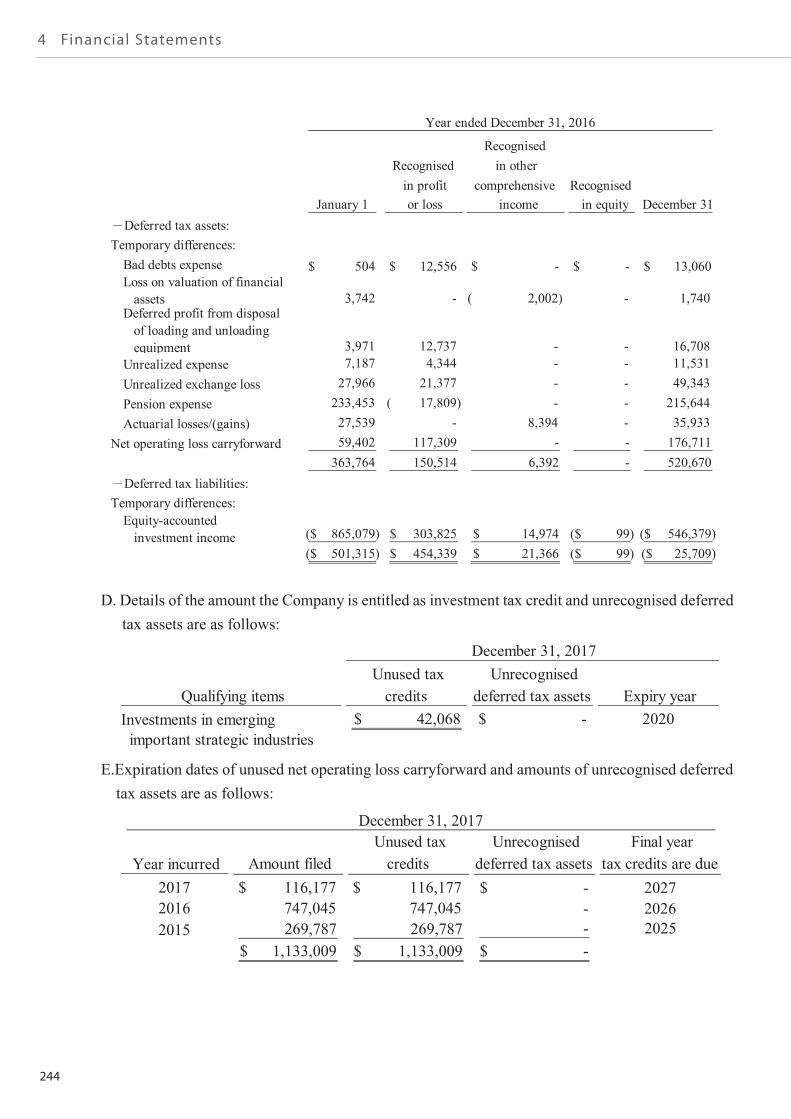
244
4 Financial Statements
~57~
D. Details of the amount the Company is entitled as investment tax credit and unrecognised deferredtax assets are as follows:
E.Expiration dates of unused net operating loss carryforward and amounts of unrecognised deferredtax assets are as follows:
RecognisedRecognised in otherin profit comprehensive Recognised
January 1 or loss income in equity December 31Deferred tax assets:
Temporary differences:Bad debts expense 504$ 12,556$ -$ -$ 13,060$Loss on valuation of financialassets 3,742 - 2,002)( - 1,740
Deferred profit from disposalof loading and unloadingequipment 3,971 12,737 - - 16,708
Unrealized expense 7,187 4,344 - - 11,531Unrealized exchange loss 27,966 21,377 - - 49,343Pension expense 233,453 17,809)( - - 215,644Actuarial losses/(gains) 27,539 - 8,394 - 35,933
Net operating loss carryforward 59,402 117,309 - - 176,711363,764 150,514 6,392 - 520,670
Deferred tax liabilities:Temporary differences:Equity-accountedinvestment income 865,079)($ 303,825$ 14,974$ 99)($ 546,379)($
501,315)($ 454,339$ 21,366$ 99)($ 25,709)($
Year ended December 31, 2016
Qualifying itemsUnused taxcredits
Unrecogniseddeferred tax assets Expiry year
Investments in emergingimportant strategic industries
42,068$ -$ 2020
December 31, 2017
Year incurred2017 116,177$ 116,177$ -$ 20272016 747,045 747,045 - 20262015 269,787 269,787 - 2025
1,133,009$ 1,133,009$ -$
December 31, 2017
Amount filedUnused taxcredits
Unrecogniseddeferred tax assets
Final yeartax credits are due
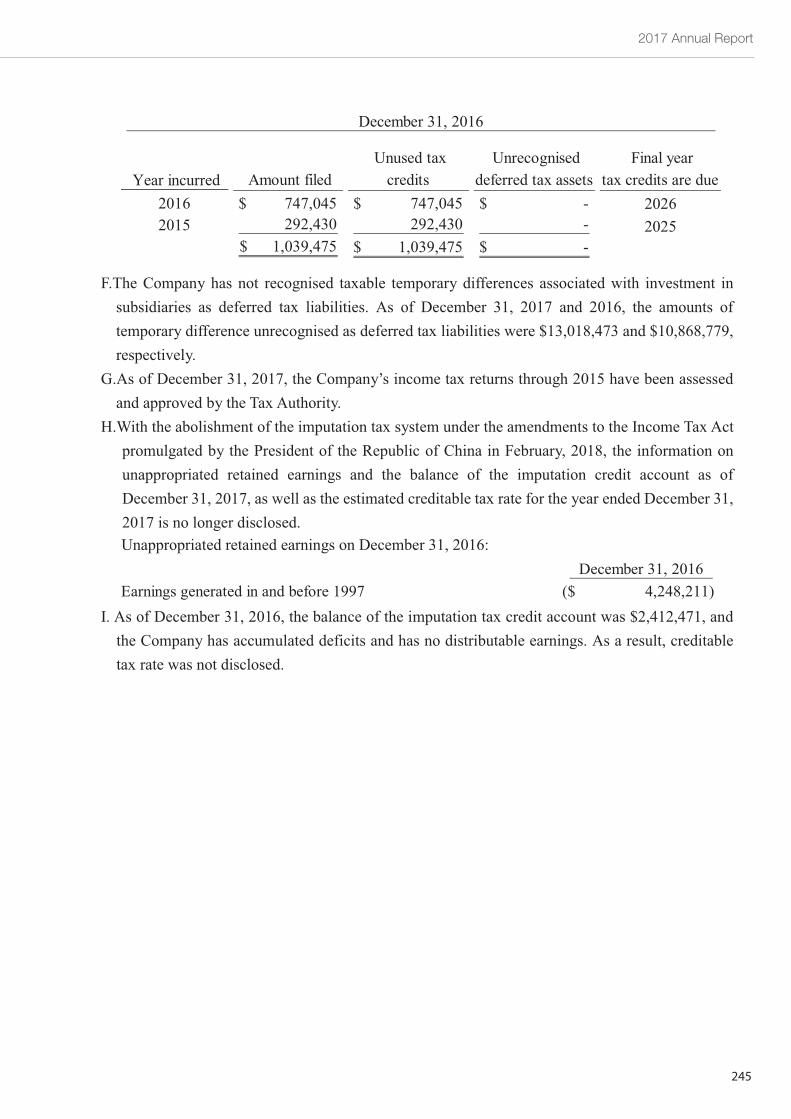
2017 Annual Report
245
~58~
F.The Company has not recognised taxable temporary differences associated with investment insubsidiaries as deferred tax liabilities. As of December 31, 2017 and 2016, the amounts oftemporary difference unrecognised as deferred tax liabilities were $13,018,473 and $10,868,779,respectively.
G.As of December 31, 2017, the Company’s income tax returns through 2015 have been assessedand approved by the Tax Authority.
H.With the abolishment of the imputation tax system under the amendments to the Income Tax Actpromulgated by the President of the Republic of China in February, 2018, the information onunappropriated retained earnings and the balance of the imputation credit account as ofDecember 31, 2017, as well as the estimated creditable tax rate for the year ended December 31,2017 is no longer disclosed.Unappropriated retained earnings on December 31, 2016:
I. As of December 31, 2016, the balance of the imputation tax credit account was $2,412,471, andthe Company has accumulated deficits and has no distributable earnings. As a result, creditabletax rate was not disclosed.
Year incurred2016 747,045$ 747,045$ -$ 20262015 292,430 292,430 - 2025
1,039,475$ 1,039,475$ -$
December 31, 2016
Amount filedUnused taxcredits
Unrecogniseddeferred tax assets
Final yeartax credits are due
December 31, 2016Earnings generated in and before 1997 4,248,211)($

246
4 Financial Statements
~59~
(28) Earnings (loss) per share
Weighted averagenumber of ordinaryshares outstanding Earnings per share
Amount after tax (shares in thousands) (in dollars)Basic earnings per shareProfit attributable toordinary shareholders ofthe parent 7,005,171$ 3,549,342 1.97$
Diluted earnings per shareProfit attributable toordinary shareholders ofthe parent 7,005,171$ 3,549,342Assumed conversion of alldilutive potential ordinarysharesEmployees' compensation - 3,375
Profit attributable toordinary shareholders of theparent plus assumedconversion of alldilutive potential ordinaryshares 7,005,171$ 3,552,717 1.97$
Year ended December 31, 2017
Weighted averagenumber of ordinaryshares outstanding Loss per share
Amount after tax (shares in thousands) (in dollars)Basic loss per shareNet loss attributable toordinary shareholders ofthe parent 6,607,986)($ 3,512,356 1.88)($
Diluted loss per shareNet loss attributable toordinary shareholders ofthe parent 6,607,986)($ 3,512,356 1.88)($
Year ended December 31, 2016
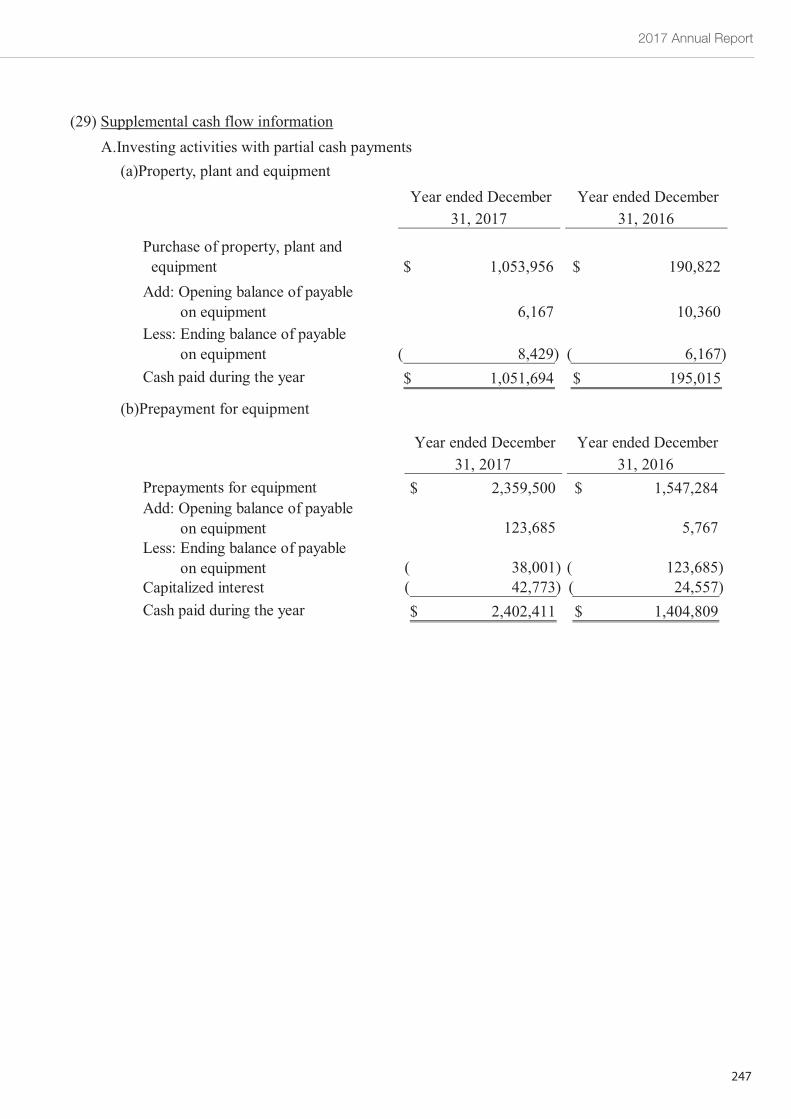
2017 Annual Report
247
~60~
(29) Supplemental cash flow informationA.Investing activities with partial cash payments(a)Property, plant and equipment
(b)Prepayment for equipment
Year ended December31, 2017
Year ended December31, 2016
Purchase of property, plant andequipment 1,053,956$ 190,822$Add: Opening balance of payable
on equipment 6,167 10,360Less: Ending balance of payable
on equipment 8,429)( 6,167)(Cash paid during the year 1,051,694$ 195,015$
Year ended December31, 2017
Year ended December31, 2016
Prepayments for equipment 2,359,500$ 1,547,284$Add: Opening balance of payable
on equipment 123,685 5,767Less: Ending balance of payable
on equipment 38,001)( 123,685)(Capitalized interest 42,773)( 24,557)(Cash paid during the year 2,402,411$ 1,404,809$
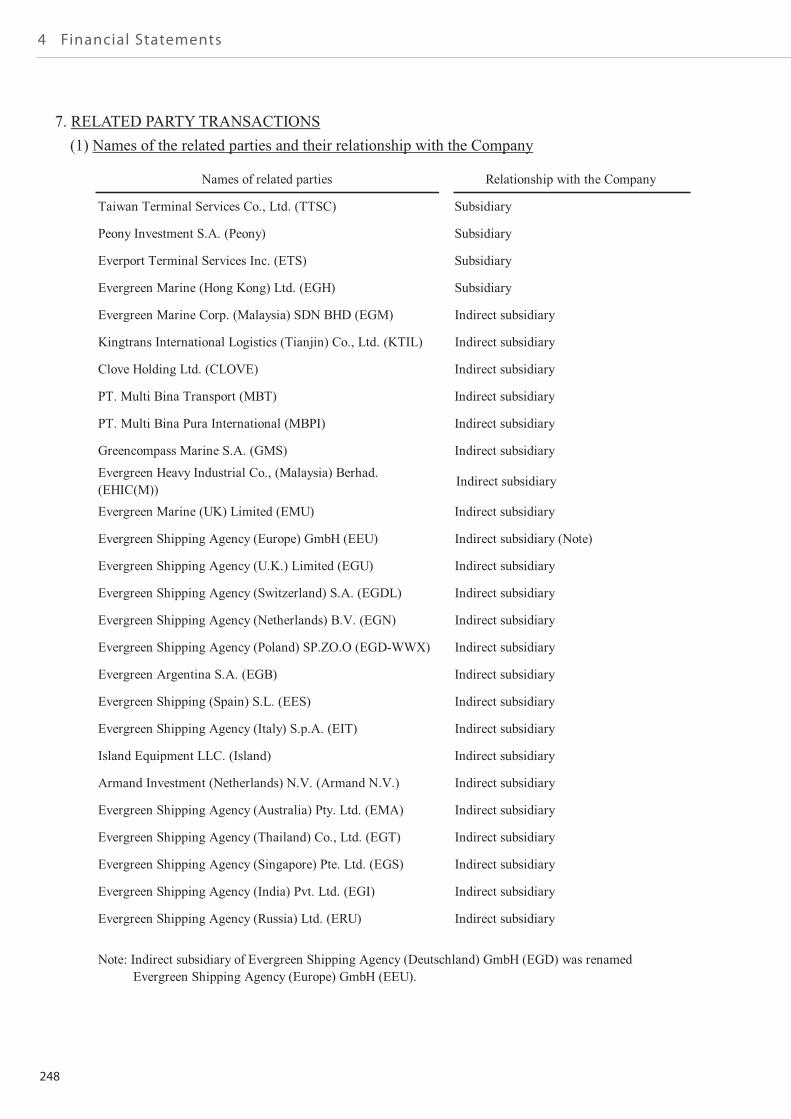
248
4 Financial Statements
~61~
7. RELATED PARTY TRANSACTIONS(1) Names of the related parties and their relationship with the Company
Names of related parties Relationship with the Company
Taiwan Terminal Services Co., Ltd. (TTSC) Subsidiary
Peony Investment S.A. (Peony) Subsidiary
Everport Terminal Services Inc. (ETS) Subsidiary
Evergreen Marine (Hong Kong) Ltd. (EGH) Subsidiary
Evergreen Marine Corp. (Malaysia) SDN BHD (EGM) Indirect subsidiary
Kingtrans International Logistics (Tianjin) Co., Ltd. (KTIL) Indirect subsidiary
Clove Holding Ltd. (CLOVE) Indirect subsidiary
PT. Multi Bina Transport (MBT) Indirect subsidiary
PT. Multi Bina Pura International (MBPI) Indirect subsidiary
Greencompass Marine S.A. (GMS) Indirect subsidiary
Evergreen Heavy Industrial Co., (Malaysia) Berhad.(EHIC(M)) Indirect subsidiary
Evergreen Marine (UK) Limited (EMU) Indirect subsidiary
Evergreen Shipping Agency (Europe) GmbH (EEU) Indirect subsidiary (Note)
Evergreen Shipping Agency (U.K.) Limited (EGU) Indirect subsidiary
Evergreen Shipping Agency (Switzerland) S.A. (EGDL) Indirect subsidiary
Evergreen Shipping Agency (Netherlands) B.V. (EGN) Indirect subsidiary
Evergreen Shipping Agency (Poland) SP.ZO.O (EGD-WWX) Indirect subsidiary
Evergreen Argentina S.A. (EGB) Indirect subsidiary
Evergreen Shipping (Spain) S.L. (EES) Indirect subsidiary
Evergreen Shipping Agency (Italy) S.p.A. (EIT) Indirect subsidiary
Island Equipment LLC. (Island) Indirect subsidiary
Armand Investment (Netherlands) N.V. (Armand N.V.) Indirect subsidiary
Evergreen Shipping Agency (Australia) Pty. Ltd. (EMA) Indirect subsidiary
Evergreen Shipping Agency (Thailand) Co., Ltd. (EGT) Indirect subsidiary
Evergreen Shipping Agency (Singapore) Pte. Ltd. (EGS) Indirect subsidiary
Evergreen Shipping Agency (India) Pvt. Ltd. (EGI) Indirect subsidiary
Evergreen Shipping Agency (Russia) Ltd. (ERU) Indirect subsidiary
Note: Indirect subsidiary of Evergreen Shipping Agency (Deutschland) GmbH (EGD) was renamedEvergreen Shipping Agency (Europe) GmbH (EEU).
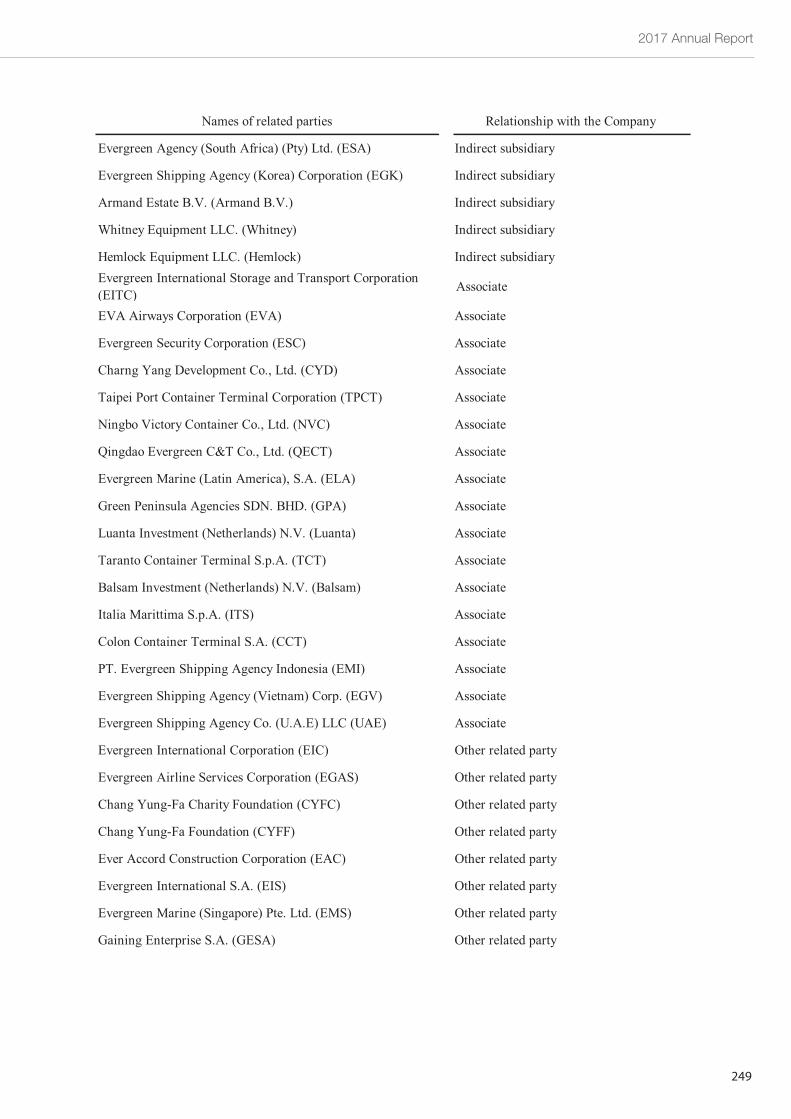
2017 Annual Report
249
~62~
Names of related parties Relationship with the Company
Evergreen Agency (South Africa) (Pty) Ltd. (ESA) Indirect subsidiary
Evergreen Shipping Agency (Korea) Corporation (EGK) Indirect subsidiary
Armand Estate B.V. (Armand B.V.) Indirect subsidiary
Whitney Equipment LLC. (Whitney) Indirect subsidiary
Hemlock Equipment LLC. (Hemlock) Indirect subsidiaryEvergreen International Storage and Transport Corporation(EITC) Associate
EVA Airways Corporation (EVA) Associate
Evergreen Security Corporation (ESC) Associate
Charng Yang Development Co., Ltd. (CYD) Associate
Taipei Port Container Terminal Corporation (TPCT) Associate
Ningbo Victory Container Co., Ltd. (NVC) Associate
Qingdao Evergreen C&T Co., Ltd. (QECT) Associate
Evergreen Marine (Latin America), S.A. (ELA) Associate
Green Peninsula Agencies SDN. BHD. (GPA) Associate
Luanta Investment (Netherlands) N.V. (Luanta) Associate
Taranto Container Terminal S.p.A. (TCT) Associate
Balsam Investment (Netherlands) N.V. (Balsam) Associate
Italia Marittima S.p.A. (ITS) Associate
Colon Container Terminal S.A. (CCT) Associate
PT. Evergreen Shipping Agency Indonesia (EMI) Associate
Evergreen Shipping Agency (Vietnam) Corp. (EGV) Associate
Evergreen Shipping Agency Co. (U.A.E) LLC (UAE) Associate
Evergreen International Corporation (EIC) Other related party
Evergreen Airline Services Corporation (EGAS) Other related party
Chang Yung-Fa Charity Foundation (CYFC) Other related party
Chang Yung-Fa Foundation (CYFF) Other related party
Ever Accord Construction Corporation (EAC) Other related party
Evergreen International S.A. (EIS) Other related party
Evergreen Marine (Singapore) Pte. Ltd. (EMS) Other related party
Gaining Enterprise S.A. (GESA) Other related party
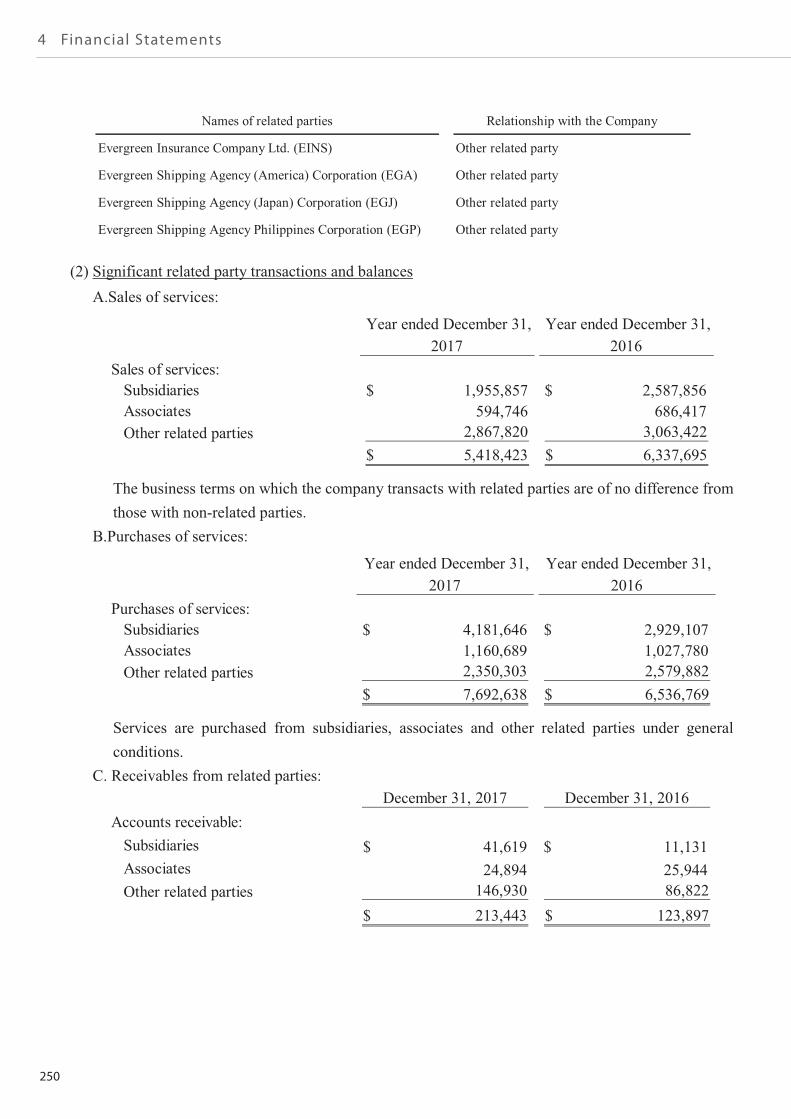
250
4 Financial Statements
~63~
(2) Significant related party transactions and balancesA.Sales of services:
The business terms on which the company transacts with related parties are of no difference fromthose with non-related parties.
B.Purchases of services:
Services are purchased from subsidiaries, associates and other related parties under generalconditions.
C. Receivables from related parties:
Names of related parties Relationship with the Company
Evergreen Insurance Company Ltd. (EINS) Other related party
Evergreen Shipping Agency (America) Corporation (EGA) Other related party
Evergreen Shipping Agency (Japan) Corporation (EGJ) Other related party
Evergreen Shipping Agency Philippines Corporation (EGP) Other related party
Year ended December 31,2017
Year ended December 31,2016
Sales of services:Subsidiaries 1,955,857$ 2,587,856$Associates 594,746 686,417Other related parties 2,867,820 3,063,422
5,418,423$ 6,337,695$
Year ended December 31,2017
Year ended December 31,2016
Purchases of services:Subsidiaries 4,181,646$ 2,929,107$Associates 1,160,689 1,027,780Other related parties 2,350,303 2,579,882
7,692,638$ 6,536,769$
December 31, 2017 December 31, 2016Accounts receivable:Subsidiaries 41,619$ 11,131$Associates 24,894 25,944Other related parties 146,930 86,822
213,443$ 123,897$
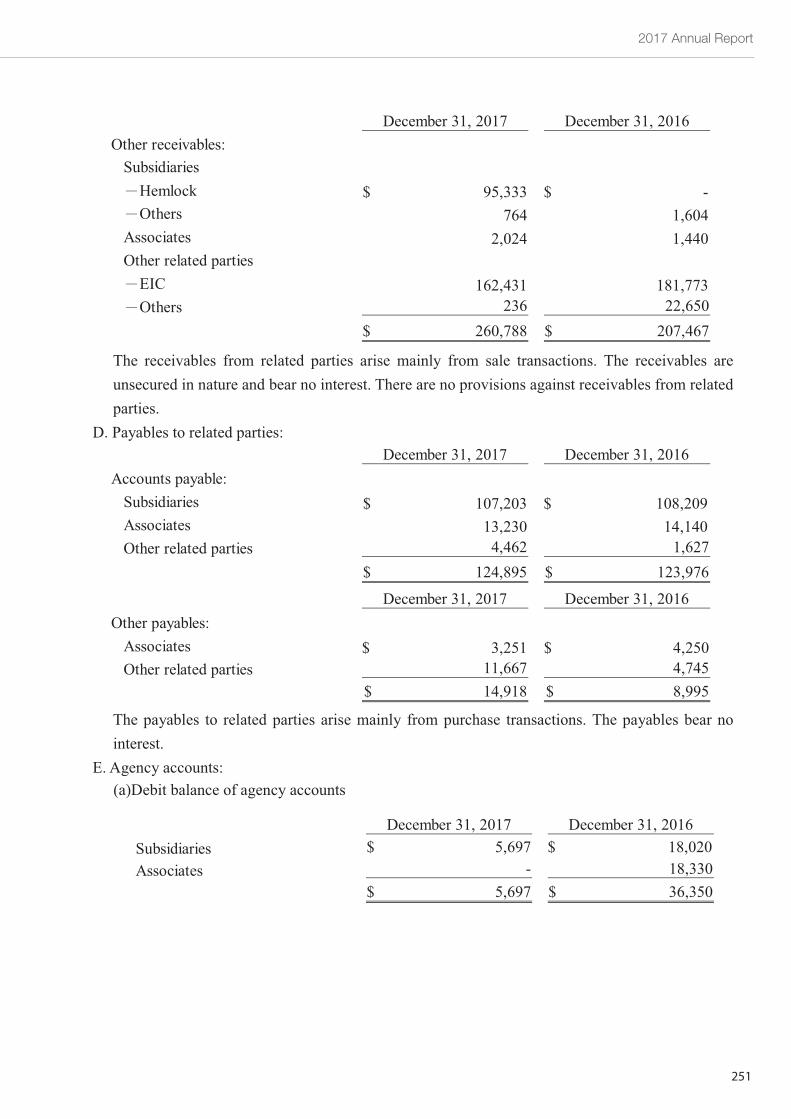
2017 Annual Report
251
~64~
The receivables from related parties arise mainly from sale transactions. The receivables areunsecured in nature and bear no interest. There are no provisions against receivables from relatedparties.
D. Payables to related parties:
The payables to related parties arise mainly from purchase transactions. The payables bear nointerest.
E. Agency accounts:(a)Debit balance of agency accounts
December 31, 2017 December 31, 2016Other receivables:SubsidiariesHemlock 95,333$ -$Others 764 1,604
Associates 2,024 1,440Other related partiesEIC 162,431 181,773Others 236 22,650
260,788$ 207,467$
December 31, 2017 December 31, 2016Accounts payable:Subsidiaries 107,203$ 108,209$Associates 13,230 14,140Other related parties 4,462 1,627
124,895$ 123,976$
December 31, 2017 December 31, 2016Other payables:Associates 3,251$ 4,250$Other related parties 11,667 4,745
14,918$ 8,995$
December 31, 2017 December 31, 2016Subsidiaries 5,697$ 18,020$Associates - 18,330
5,697$ 36,350$
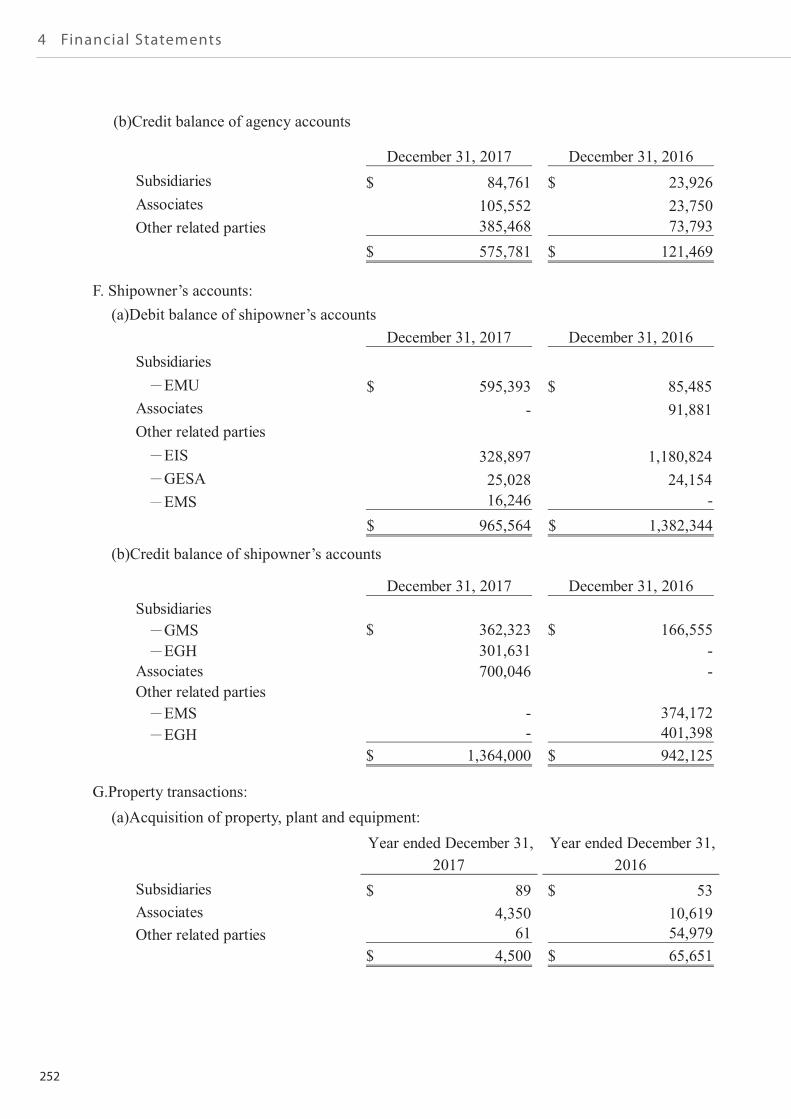
252
4 Financial Statements
~65~
(b)Credit balance of agency accounts
F. Shipowner’s accounts:(a)Debit balance of shipowner’s accounts
(b)Credit balance of shipowner’s accounts
G.Property transactions:(a)Acquisition of property, plant and equipment:
December 31, 2017 December 31, 2016Subsidiaries 84,761$ 23,926$Associates 105,552 23,750Other related parties 385,468 73,793
575,781$ 121,469$
December 31, 2017 December 31, 2016Subsidiaries
EMU 595,393$ 85,485$Associates - 91,881Other related parties
EIS 328,897 1,180,824GESA 25,028 24,154EMS 16,246 -
965,564$ 1,382,344$
December 31, 2017 December 31, 2016Subsidiaries
GMS 362,323$ 166,555$EGH 301,631 -
Associates 700,046 -Other related parties
EMS - 374,172EGH - 401,398
1,364,000$ 942,125$
Year ended December 31,2017
Year ended December 31,2016
Subsidiaries 89$ 53$Associates 4,350 10,619Other related parties 61 54,979
4,500$ 65,651$
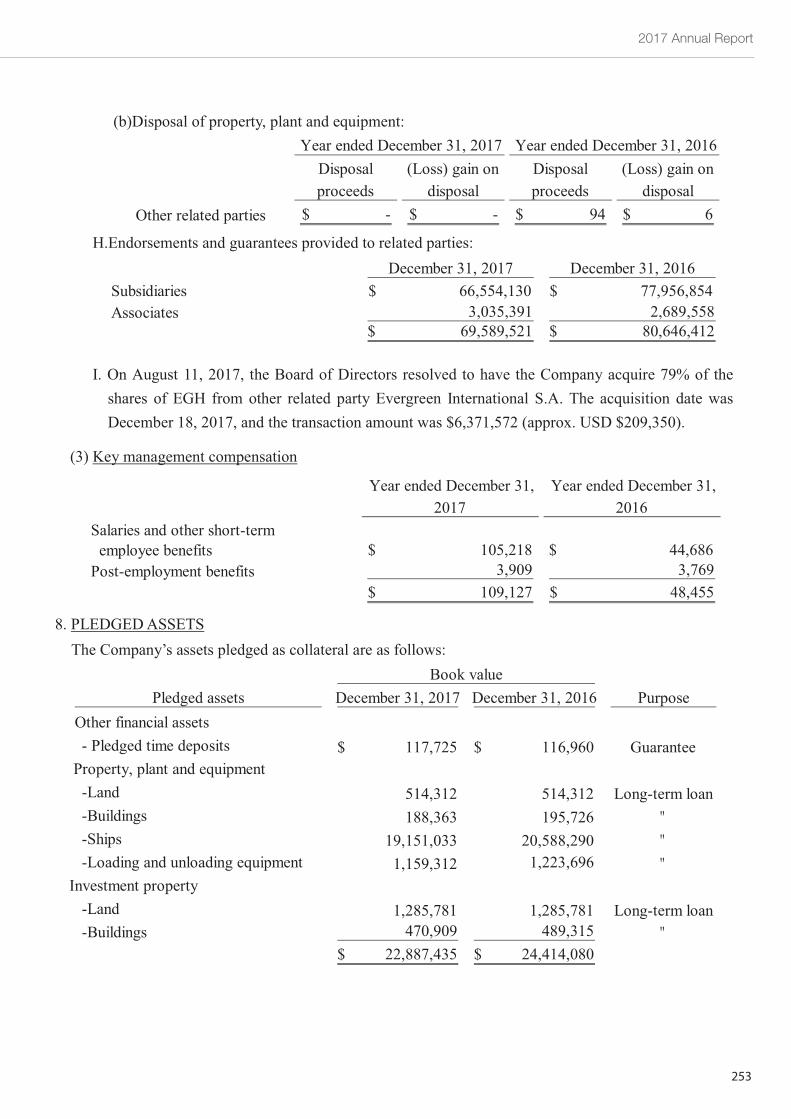
2017 Annual Report
253
~66~
(b)Disposal of property, plant and equipment:
H.Endorsements and guarantees provided to related parties:
I. On August 11, 2017, the Board of Directors resolved to have the Company acquire 79% of theshares of EGH from other related party Evergreen International S.A. The acquisition date wasDecember 18, 2017, and the transaction amount was $6,371,572 (approx. USD $209,350).
(3) Key management compensation
8. PLEDGEDASSETSThe Company’s assets pledged as collateral are as follows:
Disposalproceeds
(Loss) gain ondisposal
Disposalproceeds
(Loss) gain ondisposal
Other related parties -$ -$ 94$ 6$
Year ended December 31, 2017 Year ended December 31, 2016
December 31, 2017 December 31, 2016Subsidiaries 66,554,130$ 77,956,854$Associates 3,035,391 2,689,558
69,589,521$ 80,646,412$
Year ended December 31,2017
Year ended December 31,2016
Salaries and other short-termemployee benefits 105,218$ 44,686$Post-employment benefits 3,909 3,769
109,127$ 48,455$
Pledged assets December 31, 2017 December 31, 2016 PurposeOther financial assets- Pledged time deposits 117,725$ 116,960$ GuaranteeProperty, plant and equipment-Land 514,312 514,312 Long-term loan-Buildings 188,363 195,726-Ships 19,151,033 20,588,290-Loading and unloading equipment 1,159,312 1,223,696
Investment property-Land 1,285,781 1,285,781 Long-term loan-Buildings 470,909 489,315
22,887,435$ 24,414,080$
Book value
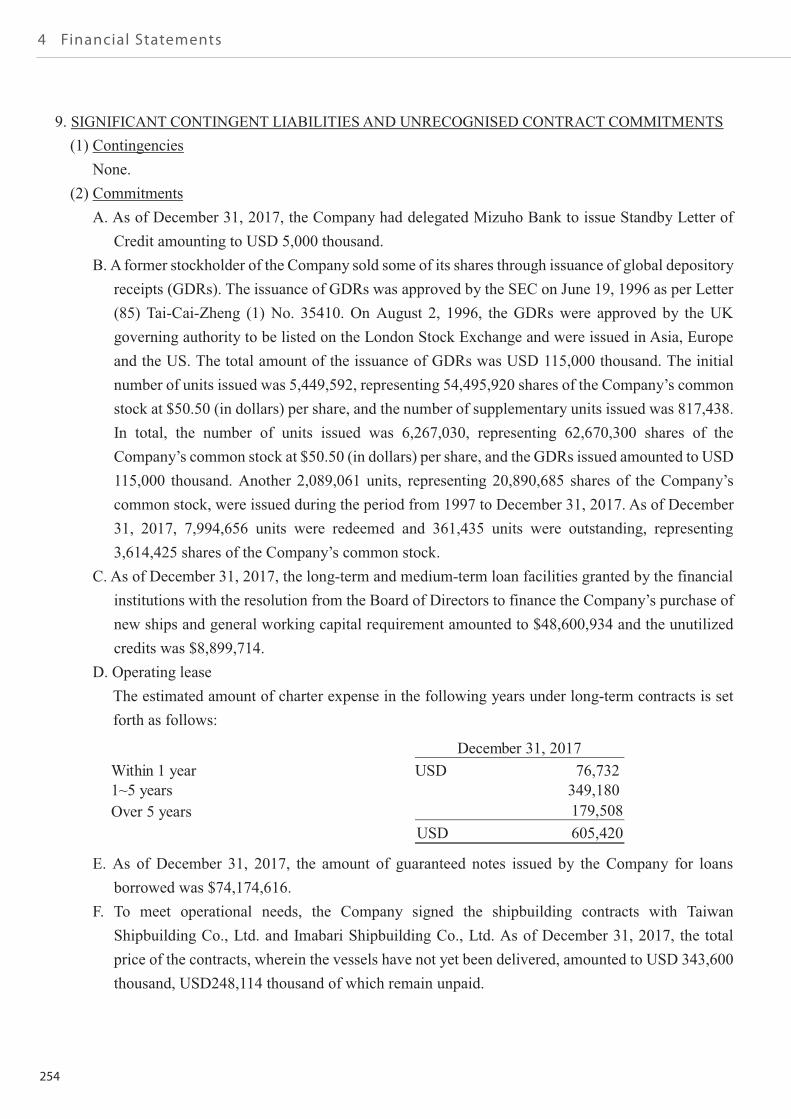
254
4 Financial Statements
~67~
9. SIGNIFICANT CONTINGENT LIABILITIES AND UNRECOGNISED CONTRACT COMMITMENTS(1) ContingenciesNone.
(2) CommitmentsA. As of December 31, 2017, the Company had delegated Mizuho Bank to issue Standby Letter ofCredit amounting to USD 5,000 thousand.
B. A former stockholder of the Company sold some of its shares through issuance of global depositoryreceipts (GDRs). The issuance of GDRs was approved by the SEC on June 19, 1996 as per Letter(85) Tai-Cai-Zheng (1) No. 35410. On August 2, 1996, the GDRs were approved by the UKgoverning authority to be listed on the London Stock Exchange and were issued in Asia, Europeand the US. The total amount of the issuance of GDRs was USD 115,000 thousand. The initialnumber of units issued was 5,449,592, representing 54,495,920 shares of the Company’s commonstock at $50.50 (in dollars) per share, and the number of supplementary units issued was 817,438.In total, the number of units issued was 6,267,030, representing 62,670,300 shares of theCompany’s common stock at $50.50 (in dollars) per share, and the GDRs issued amounted to USD115,000 thousand. Another 2,089,061 units, representing 20,890,685 shares of the Company’scommon stock, were issued during the period from 1997 to December 31, 2017. As of December31, 2017, 7,994,656 units were redeemed and 361,435 units were outstanding, representing3,614,425 shares of the Company’s common stock.
C. As of December 31, 2017, the long-term and medium-term loan facilities granted by the financialinstitutions with the resolution from the Board of Directors to finance the Company’s purchase ofnew ships and general working capital requirement amounted to $48,600,934 and the unutilizedcredits was $8,899,714.
D. Operating leaseThe estimated amount of charter expense in the following years under long-term contracts is setforth as follows:
E. As of December 31, 2017, the amount of guaranteed notes issued by the Company for loansborrowed was $74,174,616.
F. To meet operational needs, the Company signed the shipbuilding contracts with TaiwanShipbuilding Co., Ltd. and Imabari Shipbuilding Co., Ltd. As of December 31, 2017, the totalprice of the contracts, wherein the vessels have not yet been delivered, amounted to USD 343,600thousand, USD248,114 thousand of which remain unpaid.
December 31, 2017Within 1 year 76,732USD1~5 years 349,180Over 5 years 179,508
605,420USD
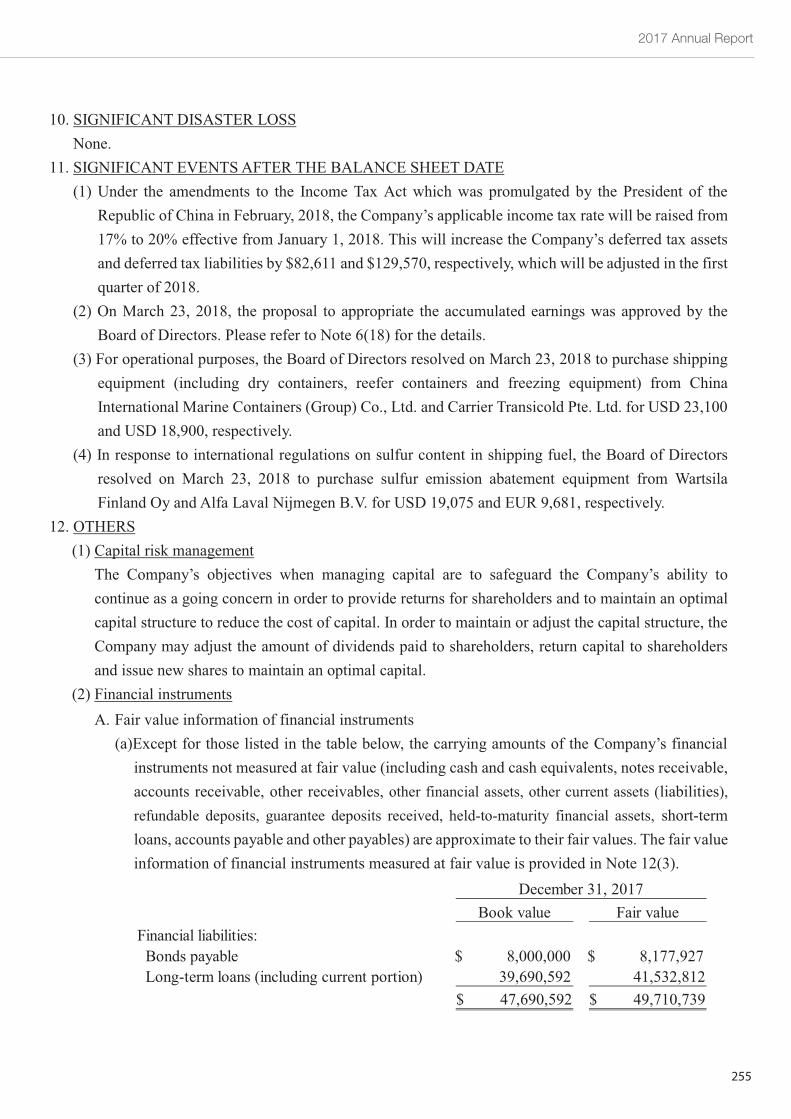
2017 Annual Report
255
~68~
10. SIGNIFICANT DISASTER LOSSNone.
11. SIGNIFICANT EVENTSAFTER THE BALANCE SHEET DATE(1) Under the amendments to the Income Tax Act which was promulgated by the President of theRepublic of China in February, 2018, the Company’s applicable income tax rate will be raised from17% to 20% effective from January 1, 2018. This will increase the Company’s deferred tax assetsand deferred tax liabilities by $82,611 and $129,570, respectively, which will be adjusted in the firstquarter of 2018.
(2) On March 23, 2018, the proposal to appropriate the accumulated earnings was approved by theBoard of Directors. Please refer to Note 6(18) for the details.
(3) For operational purposes, the Board of Directors resolved on March 23, 2018 to purchase shippingequipment (including dry containers, reefer containers and freezing equipment) from ChinaInternational Marine Containers (Group) Co., Ltd. and Carrier Transicold Pte. Ltd. for USD 23,100and USD 18,900, respectively.
(4) In response to international regulations on sulfur content in shipping fuel, the Board of Directorsresolved on March 23, 2018 to purchase sulfur emission abatement equipment from WartsilaFinland Oy and Alfa Laval Nijmegen B.V. for USD 19,075 and EUR 9,681, respectively.
12. OTHERS(1) Capital risk managementThe Company’s objectives when managing capital are to safeguard the Company’s ability tocontinue as a going concern in order to provide returns for shareholders and to maintain an optimalcapital structure to reduce the cost of capital. In order to maintain or adjust the capital structure, theCompany may adjust the amount of dividends paid to shareholders, return capital to shareholdersand issue new shares to maintain an optimal capital.
(2) Financial instrumentsA.Fair value information of financial instruments(a)Except for those listed in the table below, the carrying amounts of the Company’s financialinstruments not measured at fair value (including cash and cash equivalents, notes receivable,accounts receivable, other receivables, other financial assets, other current assets (liabilities),refundable deposits, guarantee deposits received, held-to-maturity financial assets, short-termloans, accounts payable and other payables) are approximate to their fair values. The fair valueinformation of financial instruments measured at fair value is provided in Note 12(3).
Book value Fair valueFinancial liabilities:Bonds payable 8,000,000$ 8,177,927$Long-term loans (including current portion) 39,690,592 41,532,812
47,690,592$ 49,710,739$
December 31, 2017
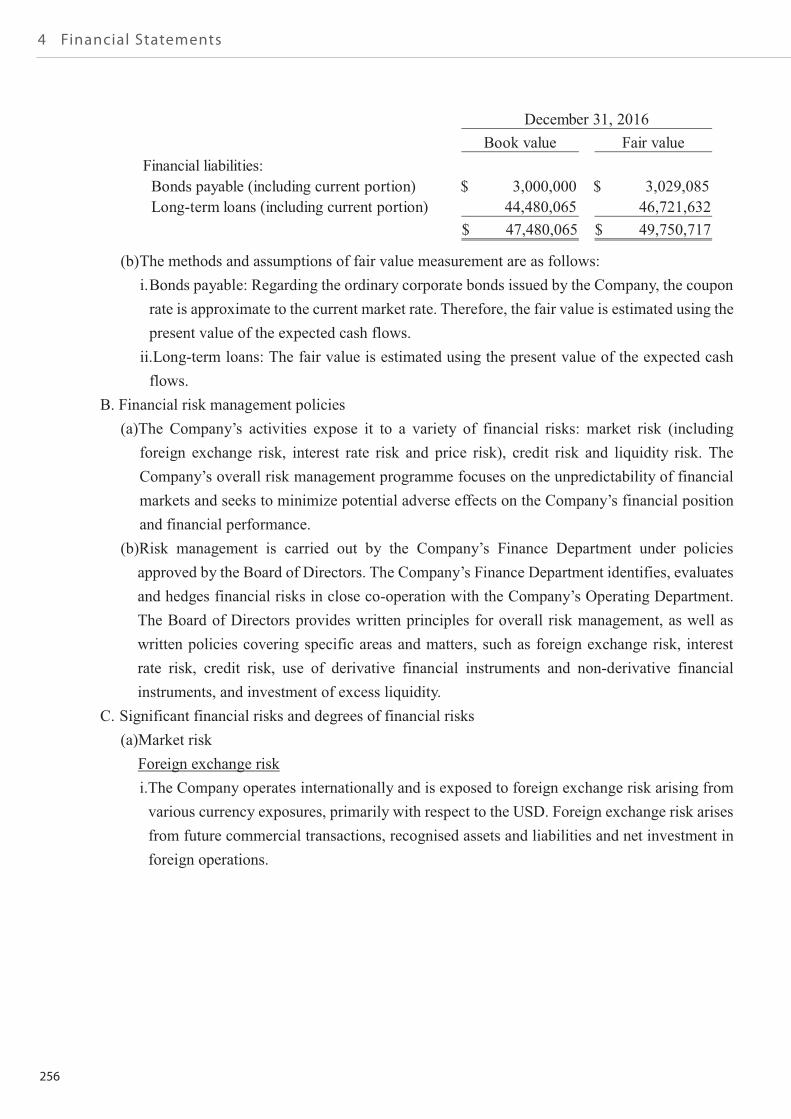
256
4 Financial Statements
~69~
(b)The methods and assumptions of fair value measurement are as follows:i.Bonds payable: Regarding the ordinary corporate bonds issued by the Company, the couponrate is approximate to the current market rate. Therefore, the fair value is estimated using thepresent value of the expected cash flows.ii.Long-term loans: The fair value is estimated using the present value of the expected cashflows.
B. Financial risk management policies(a)The Company’s activities expose it to a variety of financial risks: market risk (includingforeign exchange risk, interest rate risk and price risk), credit risk and liquidity risk. TheCompany’s overall risk management programme focuses on the unpredictability of financialmarkets and seeks to minimize potential adverse effects on the Company’s financial positionand financial performance.
(b)Risk management is carried out by the Company’s Finance Department under policiesapproved by the Board of Directors. The Company’s Finance Department identifies, evaluatesand hedges financial risks in close co-operation with the Company’s Operating Department.The Board of Directors provides written principles for overall risk management, as well aswritten policies covering specific areas and matters, such as foreign exchange risk, interestrate risk, credit risk, use of derivative financial instruments and non-derivative financialinstruments, and investment of excess liquidity.
C.Significant financial risks and degrees of financial risks(a)Market riskForeign exchange riski.The Company operates internationally and is exposed to foreign exchange risk arising fromvarious currency exposures, primarily with respect to the USD. Foreign exchange risk arisesfrom future commercial transactions, recognised assets and liabilities and net investment inforeign operations.
Book value Fair valueFinancial liabilities:Bonds payable (including current portion) 3,000,000$ 3,029,085$Long-term loans (including current portion) 44,480,065 46,721,632
47,480,065$ 49,750,717$
December 31, 2016
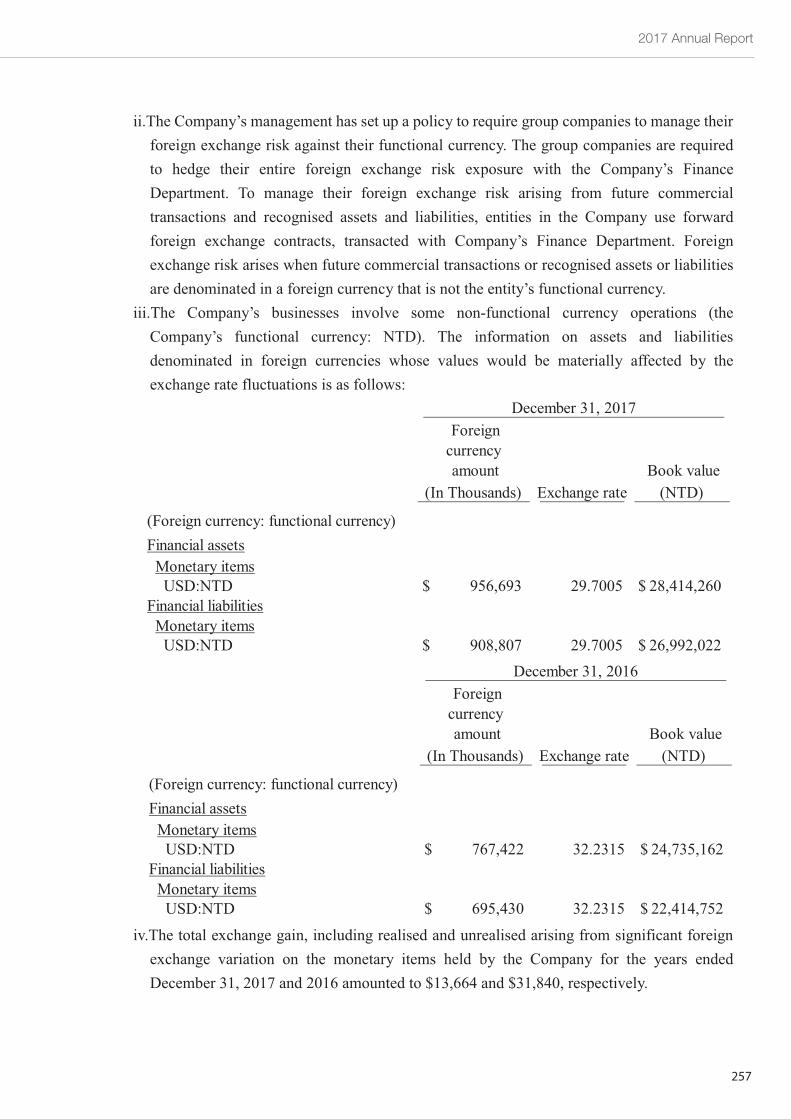
2017 Annual Report
257
~70~
ii.The Company’s management has set up a policy to require group companies to manage theirforeign exchange risk against their functional currency. The group companies are requiredto hedge their entire foreign exchange risk exposure with the Company’s FinanceDepartment. To manage their foreign exchange risk arising from future commercialtransactions and recognised assets and liabilities, entities in the Company use forwardforeign exchange contracts, transacted with Company’s Finance Department. Foreignexchange risk arises when future commercial transactions or recognised assets or liabilitiesare denominated in a foreign currency that is not the entity’s functional currency.
iii.The Company’s businesses involve some non-functional currency operations (theCompany’s functional currency: NTD). The information on assets and liabilitiesdenominated in foreign currencies whose values would be materially affected by theexchange rate fluctuations is as follows:
iv.The total exchange gain, including realised and unrealised arising from significant foreignexchange variation on the monetary items held by the Company for the years endedDecember 31, 2017 and 2016 amounted to $13,664 and $31,840, respectively.
Foreigncurrencyamount
(In Thousands) Exchange rateBook value(NTD)
(Foreign currency: functional currency)Financial assetsMonetary itemsUSD:NTD 956,693$ 29.7005 28,414,260$
Financial liabilitiesMonetary itemsUSD:NTD 908,807$ 29.7005 26,992,022$
December 31, 2017
Foreigncurrencyamount
(In Thousands) Exchange rateBook value(NTD)
(Foreign currency: functional currency)Financial assetsMonetary itemsUSD:NTD 767,422$ 32.2315 24,735,162$
Financial liabilitiesMonetary itemsUSD:NTD 695,430$ 32.2315 22,414,752$
December 31, 2016
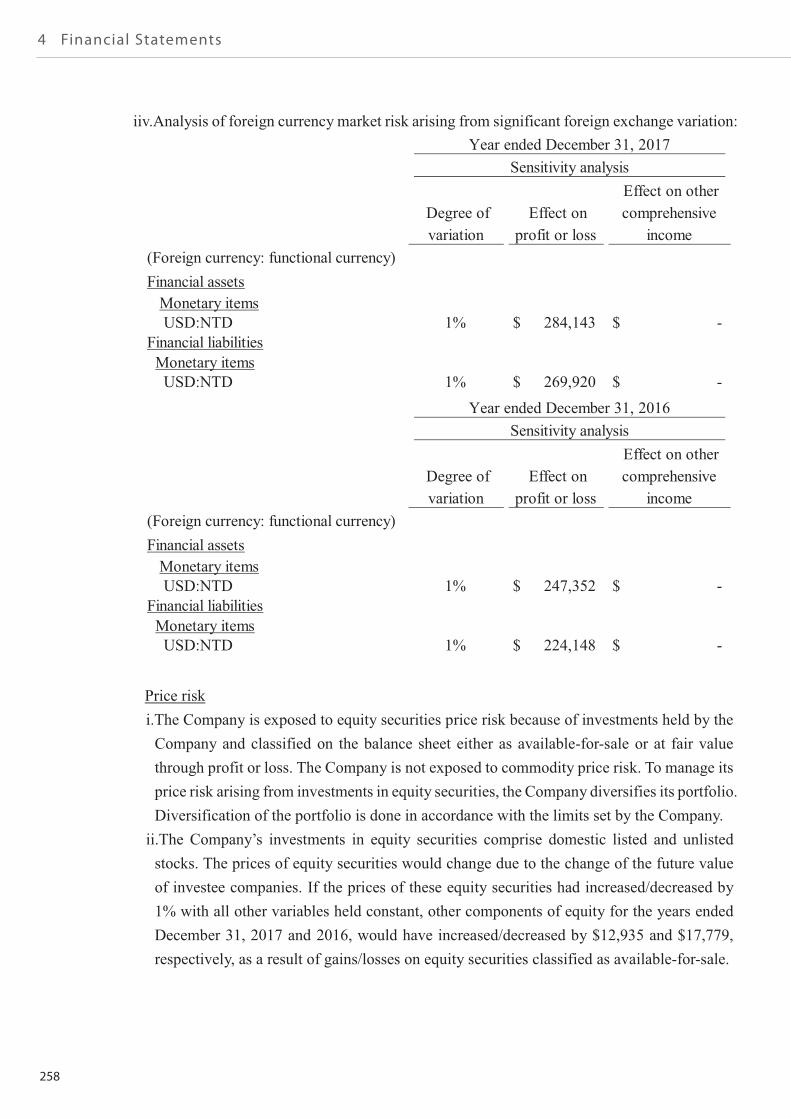
258
4 Financial Statements
~71~
iiv.Analysis of foreign currency market risk arising from significant foreign exchange variation:
Price riski.The Company is exposed to equity securities price risk because of investments held by theCompany and classified on the balance sheet either as available-for-sale or at fair valuethrough profit or loss. The Company is not exposed to commodity price risk. To manage itsprice risk arising from investments in equity securities, the Company diversifies its portfolio.Diversification of the portfolio is done in accordance with the limits set by the Company.ii.The Company’s investments in equity securities comprise domestic listed and unlistedstocks. The prices of equity securities would change due to the change of the future valueof investee companies. If the prices of these equity securities had increased/decreased by1% with all other variables held constant, other components of equity for the years endedDecember 31, 2017 and 2016, would have increased/decreased by $12,935 and $17,779,respectively, as a result of gains/losses on equity securities classified as available-for-sale.
Degree ofvariation
Effect onprofit or loss
Effect on othercomprehensiveincome
(Foreign currency: functional currency)Financial assetsMonetary itemsUSD:NTD 1% 284,143$ -$
Financial liabilitiesMonetary itemsUSD:NTD 1% 269,920$ -$
Year ended December 31, 2017Sensitivity analysis
Degree ofvariation
Effect onprofit or loss
Effect on othercomprehensiveincome
(Foreign currency: functional currency)Financial assetsMonetary itemsUSD:NTD 1% 247,352$ -$
Financial liabilitiesMonetary itemsUSD:NTD 1% 224,148$ -$
Year ended December 31, 2016Sensitivity analysis
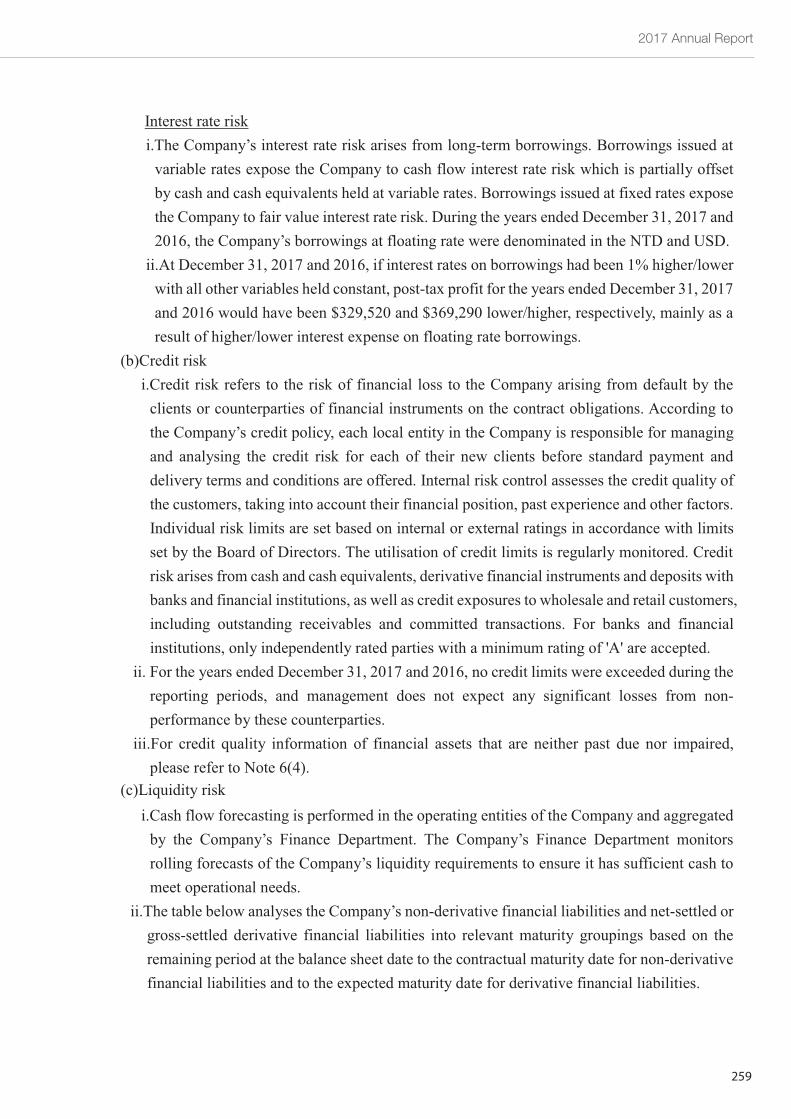
2017 Annual Report
259
~72~
Interest rate riski.The Company’s interest rate risk arises from long-term borrowings. Borrowings issued atvariable rates expose the Company to cash flow interest rate risk which is partially offsetby cash and cash equivalents held at variable rates. Borrowings issued at fixed rates exposethe Company to fair value interest rate risk. During the years ended December 31, 2017 and2016, the Company’s borrowings at floating rate were denominated in the NTD and USD.ii.At December 31, 2017 and 2016, if interest rates on borrowings had been 1% higher/lowerwith all other variables held constant, post-tax profit for the years ended December 31, 2017and 2016 would have been $329,520 and $369,290 lower/higher, respectively, mainly as aresult of higher/lower interest expense on floating rate borrowings.
(b)Credit riski.Credit risk refers to the risk of financial loss to the Company arising from default by theclients or counterparties of financial instruments on the contract obligations. According tothe Company’s credit policy, each local entity in the Company is responsible for managingand analysing the credit risk for each of their new clients before standard payment anddelivery terms and conditions are offered. Internal risk control assesses the credit quality ofthe customers, taking into account their financial position, past experience and other factors.Individual risk limits are set based on internal or external ratings in accordance with limitsset by the Board of Directors. The utilisation of credit limits is regularly monitored. Creditrisk arises from cash and cash equivalents, derivative financial instruments and deposits withbanks and financial institutions, as well as credit exposures to wholesale and retail customers,including outstanding receivables and committed transactions. For banks and financialinstitutions, only independently rated parties with a minimum rating of 'A' are accepted.
ii. For the years ended December 31, 2017 and 2016, no credit limits were exceeded during thereporting periods, and management does not expect any significant losses from non-performance by these counterparties.
iii.For credit quality information of financial assets that are neither past due nor impaired,please refer to Note 6(4).
(c)Liquidity riski.Cash flow forecasting is performed in the operating entities of the Company and aggregatedby the Company’s Finance Department. The Company’s Finance Department monitorsrolling forecasts of the Company’s liquidity requirements to ensure it has sufficient cash tomeet operational needs.
ii.The table below analyses the Company’s non-derivative financial liabilities and net-settled orgross-settled derivative financial liabilities into relevant maturity groupings based on theremaining period at the balance sheet date to the contractual maturity date for non-derivativefinancial liabilities and to the expected maturity date for derivative financial liabilities.
ii.
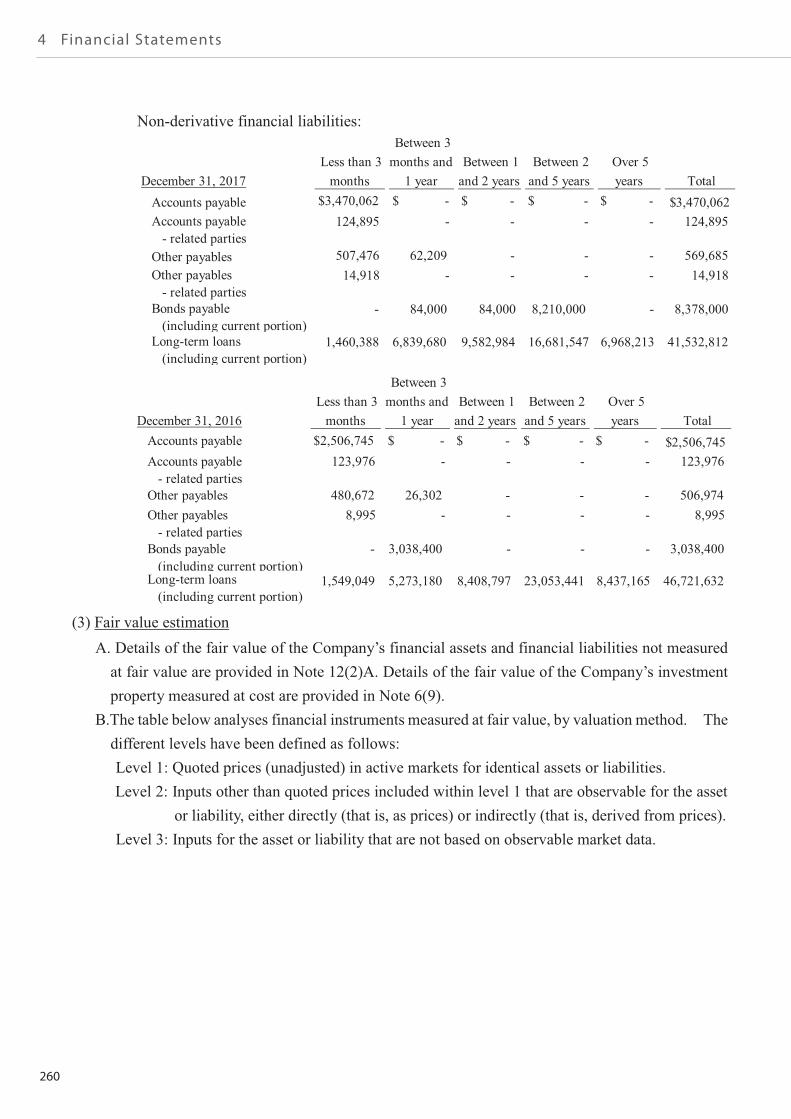
260
4 Financial Statements
~73~
Non-derivative financial liabilities:
(3) Fair value estimationA. Details of the fair value of the Company’s financial assets and financial liabilities not measuredat fair value are provided in Note 12(2)A. Details of the fair value of the Company’s investmentproperty measured at cost are provided in Note 6(9).
B.The table below analyses financial instruments measured at fair value, by valuation method. Thedifferent levels have been defined as follows:Level 1: Quoted prices (unadjusted) in active markets for identical assets or liabilities.Level 2: Inputs other than quoted prices included within level 1 that are observable for the asset
or liability, either directly (that is, as prices) or indirectly (that is, derived from prices).Level 3: Inputs for the asset or liability that are not based on observable market data.
December 31, 2017Less than 3months
Between 3months and1 year
Between 1and 2 years
Between 2and 5 years
Over 5years Total
Accounts payable $3,470,062 $ - $ - $ - $ - 3,470,062$Accounts payable- related parties
124,895 - - - - 124,895
Other payables 507,476 62,209 - - - 569,685Other payables- related parties
14,918 - - - - 14,918
Bonds payable(including current portion)
- 84,000 84,000 8,210,000 - 8,378,000
Long-term loans(including current portion)
1,460,388 6,839,680 9,582,984 16,681,547 6,968,213 41,532,812
December 31, 2016Less than 3months
Between 3months and1 year
Between 1and 2 years
Between 2and 5 years
Over 5years Total
Accounts payable $2,506,745 $ - $ - $ - $ - 2,506,745$Accounts payable- related parties
123,976 - - - - 123,976
Other payables 480,672 26,302 - - - 506,974Other payables- related parties
8,995 - - - - 8,995
Bonds payable(including current portion)
- 3,038,400 - - - 3,038,400
Long-term loans(including current portion)
1,549,049 5,273,180 8,408,797 23,053,441 8,437,165 46,721,632
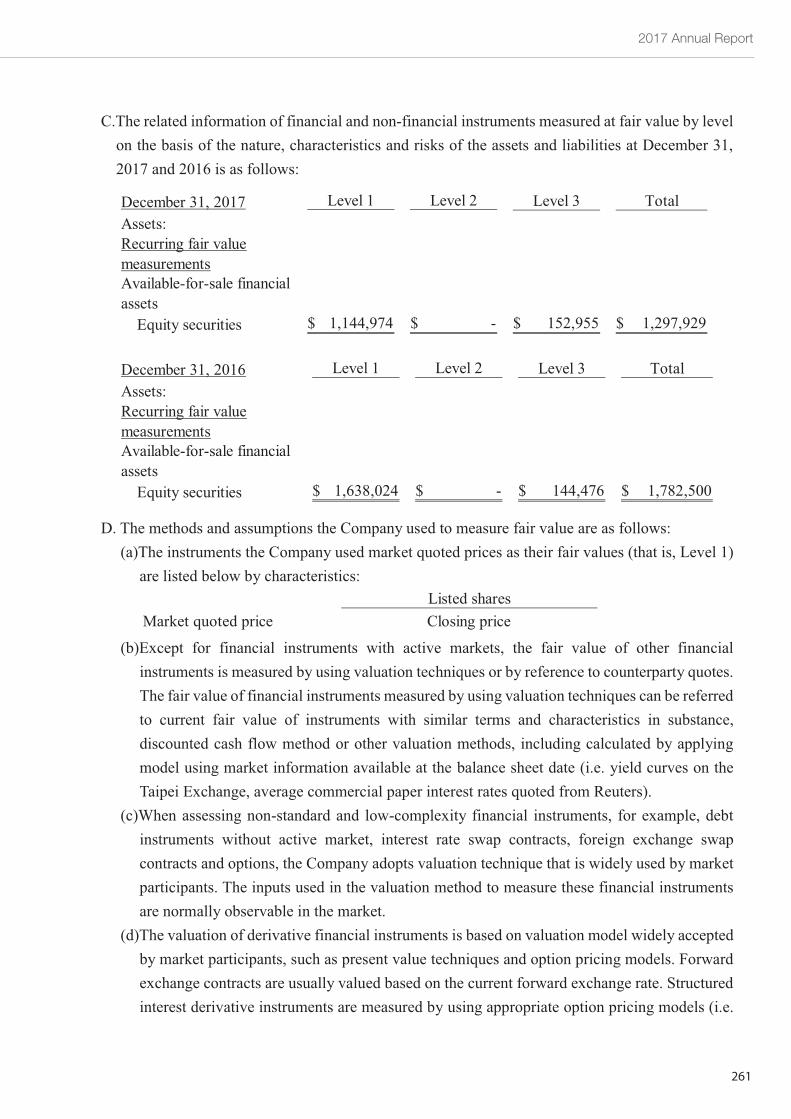
2017 Annual Report
261
~74~
C.The related information of financial and non-financial instruments measured at fair value by levelon the basis of the nature, characteristics and risks of the assets and liabilities at December 31,2017 and 2016 is as follows:
D. The methods and assumptions the Company used to measure fair value are as follows:(a)The instruments the Company used market quoted prices as their fair values (that is, Level 1)are listed below by characteristics:
(b)Except for financial instruments with active markets, the fair value of other financialinstruments is measured by using valuation techniques or by reference to counterparty quotes.The fair value of financial instruments measured by using valuation techniques can be referredto current fair value of instruments with similar terms and characteristics in substance,discounted cash flow method or other valuation methods, including calculated by applyingmodel using market information available at the balance sheet date (i.e. yield curves on theTaipei Exchange, average commercial paper interest rates quoted from Reuters).
(c)When assessing non-standard and low-complexity financial instruments, for example, debtinstruments without active market, interest rate swap contracts, foreign exchange swapcontracts and options, the Company adopts valuation technique that is widely used by marketparticipants. The inputs used in the valuation method to measure these financial instrumentsare normally observable in the market.
(d)The valuation of derivative financial instruments is based on valuation model widely acceptedby market participants, such as present value techniques and option pricing models. Forwardexchange contracts are usually valued based on the current forward exchange rate. Structuredinterest derivative instruments are measured by using appropriate option pricing models (i.e.
December 31, 2017 Level 1 Level 2 Level 3 TotalAssets:Recurring fair valuemeasurementsAvailable-for-sale financialassetsEquity securities 1,144,974$ -$ 152,955$ 1,297,929$
December 31, 2016 Level 1 Level 2 Level 3 TotalAssets:Recurring fair valuemeasurementsAvailable-for-sale financialassetsEquity securities 1,638,024$ -$ 144,476$ 1,782,500$
Listed sharesMarket quoted price Closing price
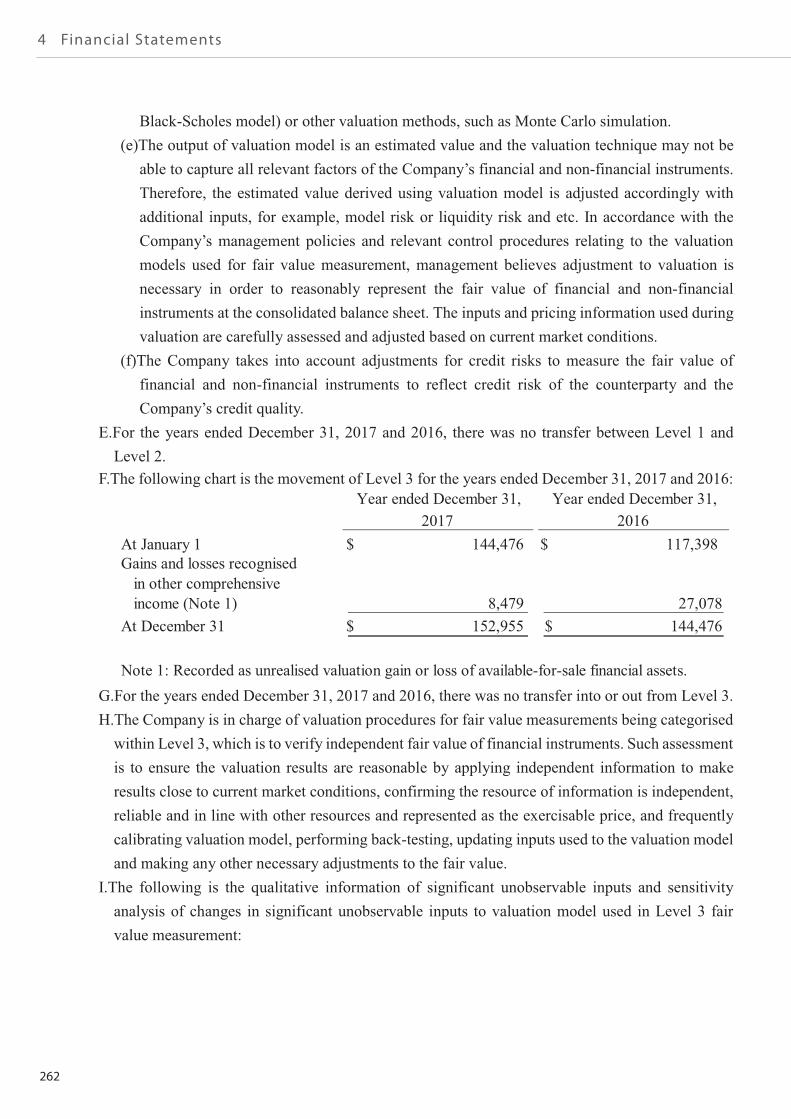
262
4 Financial Statements
~75~
Black-Scholes model) or other valuation methods, such as Monte Carlo simulation.(e)The output of valuation model is an estimated value and the valuation technique may not beable to capture all relevant factors of the Company’s financial and non-financial instruments.Therefore, the estimated value derived using valuation model is adjusted accordingly withadditional inputs, for example, model risk or liquidity risk and etc. In accordance with theCompany’s management policies and relevant control procedures relating to the valuationmodels used for fair value measurement, management believes adjustment to valuation isnecessary in order to reasonably represent the fair value of financial and non-financialinstruments at the consolidated balance sheet. The inputs and pricing information used duringvaluation are carefully assessed and adjusted based on current market conditions.
(f)The Company takes into account adjustments for credit risks to measure the fair value offinancial and non-financial instruments to reflect credit risk of the counterparty and theCompany’s credit quality.
E.For the years ended December 31, 2017 and 2016, there was no transfer between Level 1 andLevel 2.
F.The following chart is the movement of Level 3 for the years ended December 31, 2017 and 2016:
G.For the years ended December 31, 2017 and 2016, there was no transfer into or out from Level 3.H.The Company is in charge of valuation procedures for fair value measurements being categorisedwithin Level 3, which is to verify independent fair value of financial instruments. Such assessmentis to ensure the valuation results are reasonable by applying independent information to makeresults close to current market conditions, confirming the resource of information is independent,reliable and in line with other resources and represented as the exercisable price, and frequentlycalibrating valuation model, performing back-testing, updating inputs used to the valuation modeland making any other necessary adjustments to the fair value.
I.The following is the qualitative information of significant unobservable inputs and sensitivityanalysis of changes in significant unobservable inputs to valuation model used in Level 3 fairvalue measurement:
Year ended December 31,2017
Year ended December 31,2016
At January 1 144,476$ 117,398$Gains and losses recognisedin other comprehensiveincome (Note 1) 8,479 27,078
At December 31 152,955$ 144,476$
Note 1: Recorded as unrealised valuation gain or loss of available-for-sale financial assets.
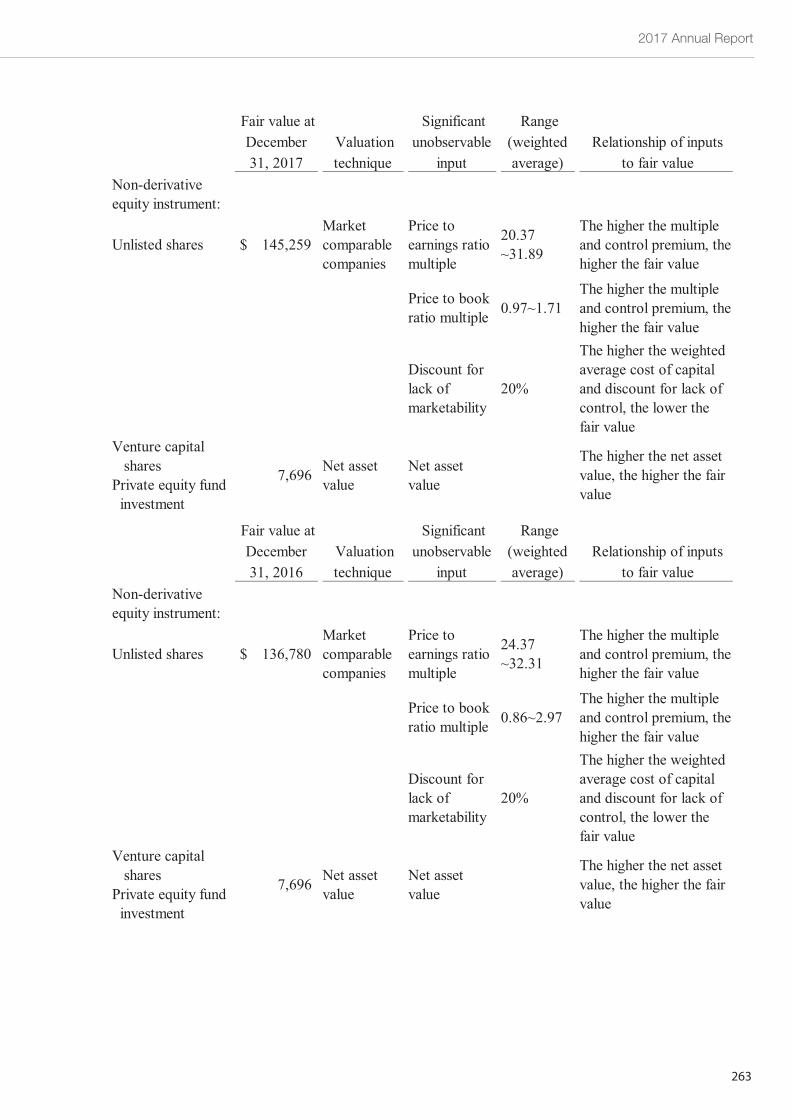
2017 Annual Report
263
~76~
Fair value atDecember31, 2017
Valuationtechnique
Significantunobservable
input
Range(weightedaverage)
Relationship of inputsto fair value
Non-derivativeequity instrument:
Unlisted shares 145,259$Marketcomparablecompanies
Price toearnings ratiomultiple
20.37~31.89
The higher the multipleand control premium, thehigher the fair value
Price to bookratio multiple 0.97~1.71
The higher the multipleand control premium, thehigher the fair value
Discount forlack ofmarketability
20%
The higher the weightedaverage cost of capitaland discount for lack ofcontrol, the lower thefair value
Venture capitalshares
Private equity fundinvestment
7,696 Net assetvalue
Net assetvalue
The higher the net assetvalue, the higher the fairvalue
Fair value atDecember31, 2016
Valuationtechnique
Significantunobservable
input
Range(weightedaverage)
Relationship of inputsto fair value
Non-derivativeequity instrument:
Unlisted shares 136,780$Marketcomparablecompanies
Price toearnings ratiomultiple
24.37~32.31
The higher the multipleand control premium, thehigher the fair value
Price to bookratio multiple 0.86~2.97
The higher the multipleand control premium, thehigher the fair value
Discount forlack ofmarketability
20%
The higher the weightedaverage cost of capitaland discount for lack ofcontrol, the lower thefair value
Venture capitalshares
Private equity fundinvestment
7,696 Net assetvalue
Net assetvalue
The higher the net assetvalue, the higher the fairvalue
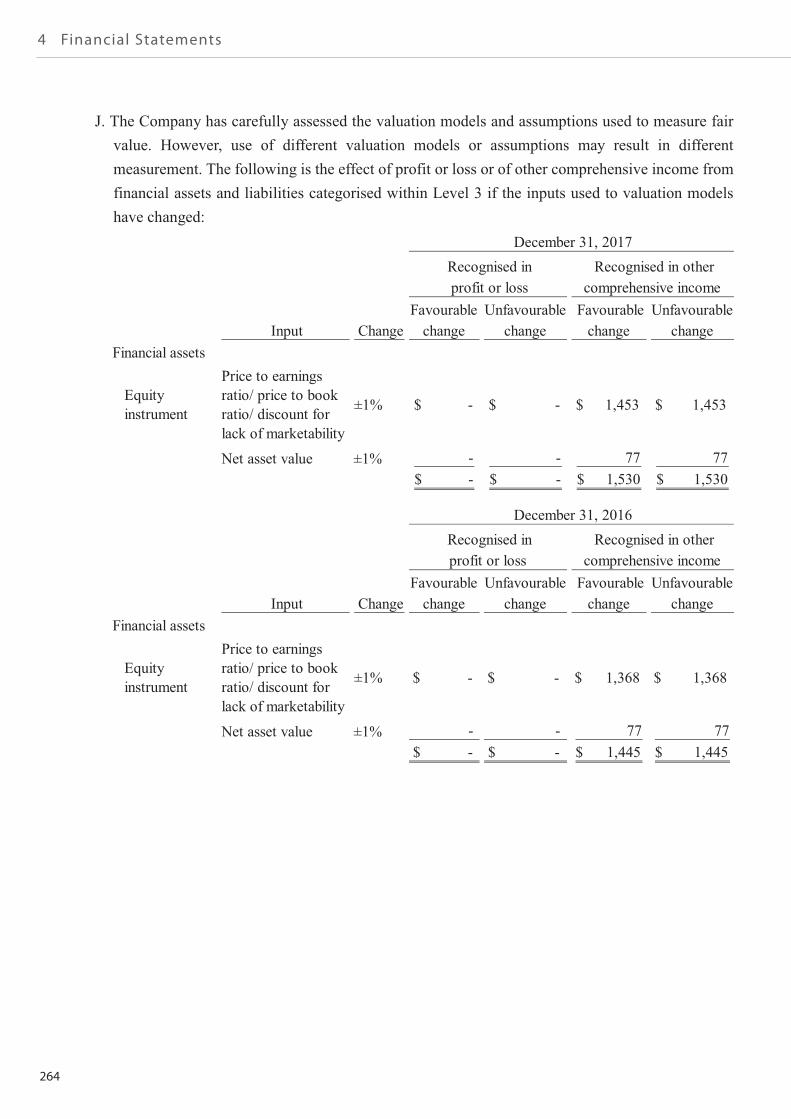
264
4 Financial Statements
~77~
J. The Company has carefully assessed the valuation models and assumptions used to measure fairvalue. However, use of different valuation models or assumptions may result in differentmeasurement. The following is the effect of profit or loss or of other comprehensive income fromfinancial assets and liabilities categorised within Level 3 if the inputs used to valuation modelshave changed:
Input ChangeFavourablechange
Unfavourablechange
Favourablechange
Unfavourablechange
Financial assets
Equityinstrument
Price to earningsratio/ price to bookratio/ discount forlack of marketability
±1% -$ -$ 1,453$ 1,453$
Net asset value ±1% - - 77 77-$ -$ 1,530$ 1,530$
December 31, 2017Recognised inprofit or loss
Recognised in othercomprehensive income
Input ChangeFavourablechange
Unfavourablechange
Favourablechange
Unfavourablechange
Financial assets
Equityinstrument
Price to earningsratio/ price to bookratio/ discount forlack of marketability
±1% $ - $ - $ 1,368 $ 1,368
Net asset value ±1% - - 77 77$ - $ - $ 1,445 $ 1,445
December 31, 2016Recognised inprofit or loss
Recognised in othercomprehensive income
2017 Annual Report
265
~78~
13. SUPPLEMENTARY DISCLOSURES(1) Significant transactions informationA.Loans to others: Please refer to table 1.B.Provision of endorsements and guarantees to others: Please refer to table 2.C.Holding of marketable securities at the end of the period (not including subsidiaries, associatesand joint ventures): Please refer to table 3.
D.Acquisition or sale of the same security with the accumulated cost exceeding $300 million or 20%of the Company’s paid-in capital: Please refer to table 4.
E. Acquisition of real estate reaching $300 million or 20% of paid-in capital or more: None.F. Disposal of real estate reaching $300 million or 20% of paid-in capital or more: None.G.Purchases or sales of goods from or to related parties reaching $100 million or 20% of paid-incapital or more: Please refer to table 5.
H.Receivables from related parties reaching $100 million or 20% of paid-in capital or more: Pleaserefer to table 6.
I. Trading in derivative instruments undertaken during the reporting periods: None.J. Significant inter-company transactions during the reporting periods: Please refer to table 7.
(2) Information on investees (not including investees in Mainland China)Names, locations and other information of investee companies (not including investees in MainlandChina) Please refer to table 8.
(3) Information on investments in Mainland ChinaA. Basic information: Please refer to table 9.B.Significant transactions, either directly or indirectly through a third area, with investee companiesin the Mainland Area: None.
14. SEGMENT INFORMATIONNone.
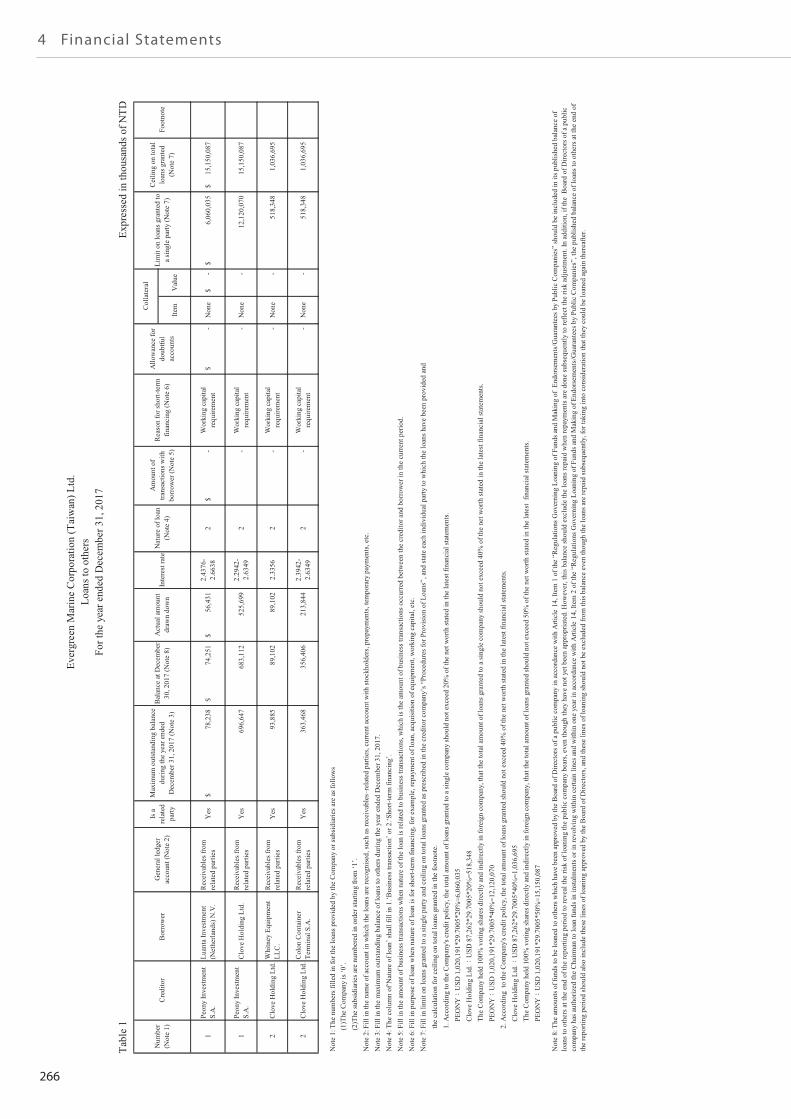
266
4 Financial Statements
Item
Val
ue
1Pe
ony
Inve
stm
ent
S.A
.Lu
anta
Inve
stm
ent
(Net
herla
nds)
N.V
.R
ecei
vabl
es fr
omre
late
d pa
rties
Yes
78,2
38$
74,2
51$
56,4
31$
2.43
76-
2.66
382
-$
W
orki
ng c
apita
lre
quire
men
t-
$
Non
e-
$
6,06
0,03
5$
15
,150
,087
$
1Pe
ony
Inve
stm
ent
S.A
.C
love
Hol
ding
Ltd
.R
ecei
vabl
es fr
omre
late
d pa
rties
Yes
696,
647
68
3,11
2
525,
699
2.
2942
-2.
6349
2-
Wor
king
cap
ital
requ
irem
ent
-
N
one
-
12
,120
,070
15,1
50,0
87
2C
love
Hol
ding
Ltd
.Whi
tney
Equ
ipm
ent
LLC
.R
ecei
vabl
es fr
omre
late
d pa
rties
Yes
93,8
85
89,1
02
89,1
02
2.33
562
-
W
orki
ng c
apita
lre
quire
men
t-
Non
e-
518,
348
1,
036,
695
2C
love
Hol
ding
Ltd
.Col
on C
onta
iner
Term
inal
S.A
.R
ecei
vabl
es fr
omre
late
d pa
rties
Yes
363,
468
35
6,40
6
213,
844
2.
3942
-2.
6349
2-
Wor
king
cap
ital
requ
irem
ent
-
N
one
-
51
8,34
8
1,03
6,69
5
Not
e 1:
The
num
bers
fille
d in
for t
he lo
ans p
rovi
ded
by th
e C
ompa
ny o
r sub
sidi
arie
s are
as f
ollo
ws
(1)T
he C
ompa
ny is
‘0’.
(2)T
he su
bsid
iarie
s are
num
bere
d in
ord
er st
artin
g fro
m ‘1
’.N
ote
2: F
ill in
the
nam
e of
acc
ount
in w
hich
the
loan
s are
reco
gnis
ed, s
uch
as re
ceiv
able
s–re
late
d pa
rties
, cur
rent
acc
ount
with
stoc
khol
ders
, pre
paym
ents
, tem
pora
ry p
aym
ents
, etc
.N
ote
3: F
ill in
the
max
imum
out
stan
ding
bal
ance
of l
oans
to o
ther
s dur
ing
the
year
end
ed D
ecem
ber 3
1, 2
017.
Not
e 4:
The
col
umn
of‘N
atur
e of
loan
’ sha
ll fil
l in
1.‘B
usin
ess t
rans
actio
n’ o
r 2.‘S
hort-
term
fina
ncin
g’.
Not
e 5:
Fill
in th
e am
ount
of b
usin
ess t
rans
actio
ns w
hen
natu
re o
f the
loan
is re
late
d to
bus
ines
s tra
nsac
tions
, whi
ch is
the
amou
nt o
f bus
ines
s tra
nsac
tions
occ
urre
d be
twee
n th
e cr
edito
r and
bor
row
er in
the
curre
nt p
erio
d.N
ote
6: F
ill in
pur
pose
of l
oan
whe
n na
ture
of l
oan
is fo
r sho
rt-te
rm fi
nanc
ing,
for e
xam
ple,
repa
ymen
t of l
oan,
acq
uisi
tion
of e
quip
men
t, w
orki
ng c
apita
l, et
c.N
ote
7: F
ill in
lim
it on
loan
s gra
nted
to a
sing
le p
arty
and
cei
ling
on to
tal l
oans
gra
nted
as p
resc
ribed
in th
e cr
edito
r com
pany
’s “
Proc
edur
es fo
r Pro
visi
on o
f Loa
ns”,
and
stat
e ea
ch in
divi
dual
par
ty to
whi
ch th
e lo
ans h
ave
been
pro
vide
d an
d
th
e ca
lcul
atio
n fo
r cei
ling
on to
tal l
oans
gra
nted
in th
e fo
otno
te.
1. A
ccor
ding
to th
e C
ompa
ny's
cred
it po
licy,
the
tota
l am
ount
of l
oans
gra
nted
to a
sing
le c
ompa
ny sh
ould
not
exc
eed
20%
of t
he n
et w
orth
stat
ed in
the
late
st fi
nanc
ial s
tate
men
ts.
P
EON
YU
SD 1
,020
,191
*29.
7005
*20%
=6,0
60,0
35
Clo
ve H
oldi
ng L
td.
USD
87,
262*
29.7
005*
20%
=518
,348
T
he C
ompa
ny h
eld
100%
vot
ing
shar
es d
irect
ly a
nd in
dire
ctly
in fo
reig
n co
mpa
ny, t
hat t
he to
tal a
mou
nt o
f loa
ns g
rant
ed to
a si
ngle
com
pany
shou
ld n
ot e
xcee
d 40
% o
f the
net
wor
th st
ated
in th
e la
test
fina
ncia
l sta
tem
ents
.
PEO
NY
USD
1,0
20,1
91*2
9.70
05*4
0%=1
2,12
0,07
0
2
. Acc
ordi
ng t
o th
e C
ompa
ny's
cred
it po
licy,
the
tota
l am
ount
of l
oans
gra
nted
shou
ld n
ot e
xcee
d 40
% o
f the
net
wor
th st
ated
in th
e la
test
fina
ncia
l sta
tem
ents
.
Clo
ve H
oldi
ng L
td.
USD
87,
262*
29.7
005*
40%
=1,0
36,6
95
The
Com
pany
hel
d 10
0% v
otin
g sh
ares
dire
ctly
and
indi
rect
ly in
fore
ign
com
pany
, tha
t the
tota
l am
ount
of l
oans
gra
nted
shou
ld n
ot e
xcee
d 50
% o
f the
net
wor
th st
ated
in th
e la
test
fin
anci
al st
atem
ents
.
PEO
NY
USD
1,0
20,1
91*2
9.70
05*5
0%=1
5,15
0,08
7
Not
e 8:
The
am
ount
s of f
unds
to b
e lo
aned
to o
ther
s whi
ch h
ave
been
app
rove
d by
the
Boa
rd o
f Dire
ctor
s of a
pub
lic c
ompa
ny in
acc
orda
nce
with
Arti
cle
14, I
tem
1 o
f the
“R
egul
atio
ns G
over
ning
Loa
ning
of F
unds
and
Mak
ing
of E
ndor
sem
ents
/Gua
rant
ees b
y Pu
blic
Com
pani
es”
shou
ld b
e in
clud
ed in
its p
ublis
hed
bala
nce
oflo
ans t
o ot
hers
at t
he e
nd o
f the
repo
rting
per
iod
to re
veal
the
risk
of lo
anin
g th
e pu
blic
com
pany
bea
rs, e
ven
thou
gh th
ey h
ave
not y
et b
een
appr
opria
ted.
How
ever
, thi
s bal
ance
shou
ld e
xclu
de th
e lo
ans r
epai
d w
hen
repa
ymen
ts a
re d
one
subs
eque
ntly
to re
flect
the
risk
adju
stm
ent.
In a
dditi
on, i
f the
Boa
rd o
f Dire
ctor
s of a
pub
licco
mpa
ny h
as a
utho
rized
the
Cha
irman
to lo
an fu
nds i
n in
stal
men
ts o
r in
revo
lvin
g w
ithin
cer
tain
line
s and
with
in o
ne y
ear i
n ac
cord
ance
with
Arti
cle
14, I
tem
2 o
f the
“R
egul
atio
ns G
over
ning
Loa
ning
of F
unds
and
Mak
ing
of E
ndor
sem
ents
/Gua
rant
ees b
y Pu
blic
Com
pani
es”,
the
publ
ishe
d ba
lanc
e of
loan
s to
othe
rs a
t the
end
of
the
repo
rting
per
iod
shou
ld a
lso
incl
ude
thes
e lin
es o
f loa
ning
app
rove
d by
the
Boa
rd o
f Dire
ctor
s, an
d th
ese
lines
of l
oani
ng sh
ould
not
be
excl
uded
from
this
bal
ance
eve
n th
ough
the
loan
s are
repa
id su
bseq
uent
ly, f
or ta
king
into
con
side
ratio
n th
at th
ey c
ould
be
loan
ed a
gain
ther
eafte
r.
Col
late
ral
Lim
it on
loan
s gra
nted
toa
sing
le p
arty
(Not
e 7)
Cei
ling
on to
tal
loan
s gra
nted
(Not
e 7)
Foot
note
Inte
rest
rate
Nat
ure
of lo
an(N
ote
4)
Am
ount
of
trans
actio
ns w
ithbo
rrow
er (N
ote
5)
Rea
son
for s
hort-
term
finan
cing
(Not
e 6)
Allo
wan
ce fo
rdo
ubtfu
lac
coun
ts
Max
imum
out
stan
ding
bal
ance
durin
g th
e ye
ar e
nded
Dec
embe
r 31,
201
7 (N
ote
3)
Bal
ance
at D
ecem
ber
30, 2
017
(Not
e 8)
Act
ual a
mou
ntdr
awn
dow
nN
umbe
r(N
ote
1)C
redi
tor
Bor
row
er
Gen
eral
ledg
erac
coun
t (N
ote
2)
Is a
rela
ted
party
Ever
gree
n M
arin
e C
orpo
ratio
n (T
aiw
an) L
td.
Loan
s to
othe
rsFo
r the
yea
r end
ed D
ecem
ber 3
1, 2
017
Tabl
e 1
Expr
esse
d in
thou
sand
s of N
TD(E
xcep
t as o
ther
wis
e in
dica
ted)
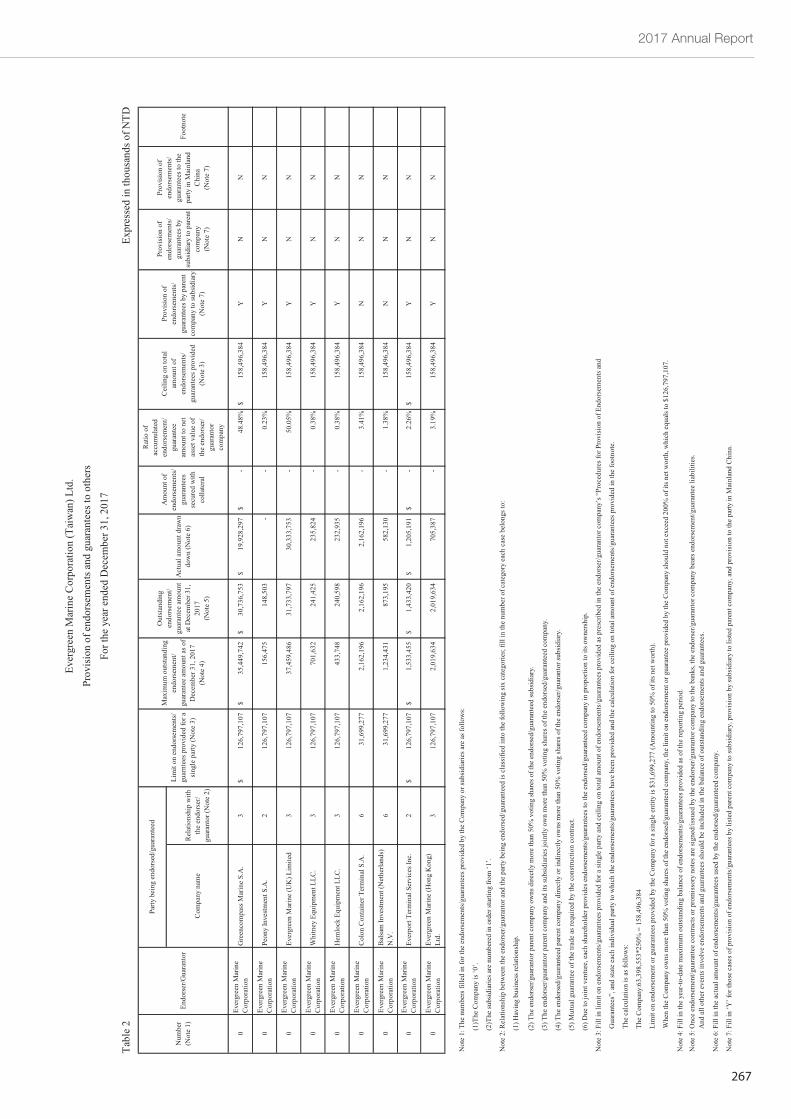
2017 Annual Report
267Com
pany
nam
eR
elat
ions
hip
with
the
endo
rser
/gu
aran
tor (
Not
e 2)
0Ev
ergr
een
Mar
ine
Cor
pora
tion
Gre
enco
mpa
ss M
arin
e S.
A.
312
6,79
7,10
7$
35,4
49,7
42$
30
,736
,753
$
19,9
28,2
97$
-$
48
.48%
158,
496,
384
$
YN
N
0Ev
ergr
een
Mar
ine
Cor
pora
tion
Peon
y In
vest
men
t S.A
.2
126,
797,
107
15
6,47
5
14
8,50
3
-
-
0.23
%15
8,49
6,38
4
Y
NN
0Ev
ergr
een
Mar
ine
Cor
pora
tion
Ever
gree
n M
arin
e (U
K) L
imite
d3
126,
797,
107
37
,459
,486
31,7
33,7
97
30
,333
,753
-
50.0
5%15
8,49
6,38
4
Y
NN
0Ev
ergr
een
Mar
ine
Cor
pora
tion
Whi
tney
Equ
ipm
ent L
LC.
312
6,79
7,10
7
701,
632
241,
425
235,
824
-
0.38
%15
8,49
6,38
4
Y
NN
0Ev
ergr
een
Mar
ine
Cor
pora
tion
Hem
lock
Equ
ipm
ent L
LC.
312
6,79
7,10
7
433,
748
240,
598
232,
935
-
0.38
%15
8,49
6,38
4
Y
NN
0Ev
ergr
een
Mar
ine
Cor
pora
tion
Col
on C
onta
iner
Ter
min
al S
.A.
631
,699
,277
2,16
2,19
6
2,16
2,19
6
2,16
2,19
6
-
3.41
%15
8,49
6,38
4
N
NN
0Ev
ergr
een
Mar
ine
Cor
pora
tion
Bal
sam
Inve
stm
ent (
Net
herla
nds)
N.V
.6
31,6
99,2
77
1,
234,
431
87
3,19
5
58
2,13
0
-
1.
38%
158,
496,
384
NN
N
Prov
isio
n of
endo
rsem
ents
/gu
aran
tees
to th
epa
rty in
Mai
nlan
dC
hina
(Not
e 7)
Foot
note
Am
ount
of
endo
rsem
ents
/gu
aran
tees
secu
red
with
colla
tera
l
Rat
io o
fac
cum
ulat
eden
dors
emen
t/gu
aran
tee
amou
nt to
net
asse
t val
ue o
fth
e en
dors
er/
guar
anto
rco
mpa
ny
Cei
ling
on to
tal
amou
nt o
fen
dors
emen
ts/
guar
ante
es p
rovi
ded
(Not
e 3)
Prov
isio
n of
endo
rsem
ents
/gu
aran
tees
by
pare
ntco
mpa
ny to
subs
idia
ry(N
ote
7)
Prov
isio
n of
endo
rsem
ents
/gu
aran
tees
by
subs
idia
ry to
par
ent
com
pany
(Not
e 7)
Out
stan
ding
endo
rsem
ent/
guar
ante
e am
ount
at D
ecem
ber 3
1,20
17(N
ote
5)
Act
ual a
mou
nt d
raw
ndo
wn
(Not
e 6)
Num
ber
(Not
e 1)
Endo
rser
/Gua
rant
or
Party
bei
ng e
ndor
sed/
guar
ante
ed
Lim
it on
end
orse
men
ts/
guar
ntee
s pro
vide
d fo
r asi
ngle
par
ty (N
ote
3)
Max
imum
out
stan
ding
endo
rsem
ent/
guar
ante
e am
ount
as o
fD
ecem
ber 3
1, 2
017
(Not
e 4)
Ever
gree
n M
arin
e C
orpo
ratio
n (T
aiw
an) L
td.
Prov
isio
n of
end
orse
men
ts a
nd g
uara
ntee
s to
othe
rsFo
r the
yea
r end
ed D
ecem
ber 3
1, 2
017
Tabl
e 2
Expr
esse
d in
thou
sand
s of N
TD
Com
pany
nam
eR
elat
ions
hip
with
the
endo
rser
/gu
aran
tor (
Not
e 2)
Prov
isio
n of
endo
rsem
ents
/gu
aran
tees
to th
epa
rty in
Mai
nlan
dC
hina
(Not
e 7)
Foot
note
Am
ount
of
endo
rsem
ents
/gu
aran
tees
secu
red
with
colla
tera
l
Rat
io o
fac
cum
ulat
eden
dors
emen
t/gu
aran
tee
amou
nt to
net
asse
t val
ue o
fth
e en
dors
er/
guar
anto
rco
mpa
ny
Cei
ling
on to
tal
amou
nt o
fen
dors
emen
ts/
guar
ante
es p
rovi
ded
(Not
e 3)
Prov
isio
n of
endo
rsem
ents
/gu
aran
tees
by
pare
ntco
mpa
ny to
subs
idia
ry(N
ote
7)
Prov
isio
n of
endo
rsem
ents
/gu
aran
tees
by
subs
idia
ry to
par
ent
com
pany
(Not
e 7)
Out
stan
ding
endo
rsem
ent/
guar
ante
e am
ount
at D
ecem
ber 3
1,20
17(N
ote
5)
Act
ual a
mou
nt d
raw
ndo
wn
(Not
e 6)
Num
ber
(Not
e 1)
Endo
rser
/Gua
rant
or
Party
bei
ng e
ndor
sed/
guar
ante
ed
Lim
it on
end
orse
men
ts/
guar
ntee
s pro
vide
d fo
r asi
ngle
par
ty (N
ote
3)
Max
imum
out
stan
ding
endo
rsem
ent/
guar
ante
e am
ount
as o
fD
ecem
ber 3
1, 2
017
(Not
e 4)
0Ev
ergr
een
Mar
ine
Cor
pora
tion
Ever
port
Term
inal
Ser
vice
s Inc
.2
126,
797,
107
$
1,
533,
455
$
1,
433,
420
$
1,
205,
191
$
-$
2.
26%
158,
496,
384
$
YN
N
0Ev
ergr
een
Mar
ine
Cor
pora
tion
Ever
gree
n M
arin
e (H
ong
Kon
g)Lt
d.3
126,
797,
107
2,
019,
634
2,
019,
634
70
5,38
7
-
3.
19%
158,
496,
384
YN
N
Not
e 1:
The
num
bers
fille
d in
for t
he e
ndor
sem
ents
/gua
rant
ees p
rovi
ded
by th
e C
ompa
ny o
r sub
sidi
arie
s are
as f
ollo
ws:
(1)T
he C
ompa
ny is
‘0’.
(2)T
he su
bsid
iarie
s are
num
bere
d in
ord
er st
artin
g fro
m ‘1
’.
Not
e 2:
Rel
atio
nshi
p be
twee
n th
e en
dors
er/g
uara
ntor
and
the
party
bei
ng e
ndor
sed/
guar
ante
ed is
cla
ssifi
ed in
to th
e fo
llow
ing
six
cate
gorie
s; fil
l in
the
num
ber o
f cat
egor
y ea
ch c
ase
belo
ngs t
o:
(1) H
avin
g bu
sine
ss re
latio
nshi
p.
(2) T
he e
ndor
ser/g
uara
ntor
par
ent c
ompa
ny o
wns
dire
ctly
mor
e th
an 5
0% v
otin
g sh
ares
of t
he e
ndor
sed/
guar
ante
ed su
bsid
iary
.
(3) T
he e
ndor
ser/g
uara
ntor
par
ent c
ompa
ny a
nd it
s sub
sidi
arie
s joi
ntly
ow
n m
ore
than
50%
vot
ing
shar
es o
f the
end
orse
d/gu
aran
teed
com
pany
.
(4) T
he e
ndor
sed/
guar
ante
ed p
aren
t com
pany
dire
ctly
or i
ndire
ctly
ow
ns m
ore
than
50%
vot
ing
shar
es o
f the
end
orse
r/gua
rant
or su
bsid
iary
.
(5) M
utua
l gua
rant
ee o
f the
trad
e as
requ
ired
by th
e co
nstru
ctio
n co
ntra
ct.
(6) D
ue to
join
t ven
ture
, eac
h sh
areh
olde
r pro
vide
s end
orse
men
ts/g
uara
ntee
s to
the
endo
rsed
/gua
rant
eed
com
pany
in p
ropo
rtion
to it
s ow
ners
hip.
Not
e 3:
Fill
in li
mit
on e
ndor
sem
ents
/gua
rant
ees p
rovi
ded
for a
sing
le p
arty
and
cei
ling
on to
tal a
mou
nt o
f end
orse
men
ts/g
uara
ntee
s pro
vide
d as
pre
scrib
ed in
the
endo
rser
/gua
rant
or c
ompa
ny’s
“Pr
oced
ures
for P
rovi
sion
of E
ndor
sem
ents
and
Gua
rant
ees”
, and
stat
e ea
ch in
divi
dual
par
ty to
whi
ch th
e en
dors
emen
ts/g
uara
ntee
s hav
e be
en p
rovi
ded
and
the
calc
ulat
ion
for c
eilin
g on
tota
l am
ount
of e
ndor
sem
ents
/gua
rant
ees p
rovi
ded
in th
e fo
otno
te.
The
cal
cula
tion
is a
s fol
low
s:
The
Com
pany
:63,
398,
553*
250%
= 1
58,4
96,3
84
Lim
it on
end
orse
men
t or g
uara
ntee
s pro
vide
d by
the
Com
pany
for a
sing
le e
ntity
is $
31,6
99,2
77 (A
mou
ntin
g to
50%
of i
ts n
et w
orth
).
Whe
n th
e C
ompa
ny o
wns
mor
e th
an 5
0% v
otin
g sh
ares
of t
he e
ndor
sed/
guar
ante
ed c
ompa
ny, t
he li
mit
on e
ndor
sem
ent o
r gua
rant
ee p
rovi
ded
by th
e C
ompa
ny sh
ould
not
exc
eed
200%
of i
ts n
et w
orth
, whi
ch e
qual
s to
$126
,797
,107
.
Not
e 4:
Fill
in th
e ye
ar-to
-dat
e m
axim
um o
utst
andi
ng b
alan
ce o
f end
orse
men
ts/g
uara
ntee
s pro
vide
d as
of t
he re
porti
ng p
erio
d.
Not
e 6:
Fill
in th
e ac
tual
am
ount
of e
ndor
sem
ents
/gua
rant
ees u
sed
by th
e en
dors
ed/g
uara
ntee
d co
mpa
ny.
Not
e 7:
Fill
in ‘Y
’ for
thos
e ca
ses o
f pro
visi
on o
f end
orse
men
ts/g
uara
ntee
s by
liste
d pa
rent
com
pany
to su
bsid
iary
, pro
visi
on b
y su
bsid
iary
to li
sted
par
ent c
ompa
ny, a
nd p
rovi
sion
to th
e pa
rty in
Mai
nlan
d C
hina
.
Not
e 5:
Onc
e en
dors
emen
t/gua
rant
ee c
ontra
cts o
r pro
mis
sory
not
es a
re si
gned
/issu
ed b
y th
e en
dors
er/g
uara
ntor
com
pany
to th
e ba
nks,
the
endo
rser
/gua
rant
or c
ompa
ny b
ears
end
orse
men
t/gua
rant
ee li
abili
ties.
And
all
othe
r eve
nts i
nvol
ve e
ndor
sem
ents
and
gua
rant
ees s
houl
d be
incl
uded
in th
e ba
lanc
e of
out
stan
ding
end
orse
men
ts a
nd g
uara
ntee
s.
Com
pany
nam
eR
elat
ions
hip
with
the
endo
rser
/gu
aran
tor (
Not
e 2)
Prov
isio
n of
endo
rsem
ents
/gu
aran
tees
to th
epa
rty in
Mai
nlan
dC
hina
(Not
e 7)
Foot
note
Am
ount
of
endo
rsem
ents
/gu
aran
tees
secu
red
with
colla
tera
l
Rat
io o
fac
cum
ulat
eden
dors
emen
t/gu
aran
tee
amou
nt to
net
asse
t val
ue o
fth
e en
dors
er/
guar
anto
rco
mpa
ny
Cei
ling
on to
tal
amou
nt o
fen
dors
emen
ts/
guar
ante
es p
rovi
ded
(Not
e 3)
Prov
isio
n of
endo
rsem
ents
/gu
aran
tees
by
pare
ntco
mpa
ny to
subs
idia
ry(N
ote
7)
Prov
isio
n of
endo
rsem
ents
/gu
aran
tees
by
subs
idia
ry to
par
ent
com
pany
(Not
e 7)
Out
stan
ding
endo
rsem
ent/
guar
ante
e am
ount
at D
ecem
ber 3
1,20
17(N
ote
5)
Act
ual a
mou
nt d
raw
ndo
wn
(Not
e 6)
Num
ber
(Not
e 1)
Endo
rser
/Gua
rant
or
Party
bei
ng e
ndor
sed/
guar
ante
ed
Lim
it on
end
orse
men
ts/
guar
ntee
s pro
vide
d fo
r asi
ngle
par
ty (N
ote
3)
Max
imum
out
stan
ding
endo
rsem
ent/
guar
ante
e am
ount
as o
fD
ecem
ber 3
1, 2
017
(Not
e 4)
0Ev
ergr
een
Mar
ine
Cor
pora
tion
Ever
port
Term
inal
Ser
vice
s Inc
.2
126,
797,
107
$
1,
533,
455
$
1,
433,
420
$
1,
205,
191
$
-$
2.
26%
158,
496,
384
$
YN
N
0Ev
ergr
een
Mar
ine
Cor
pora
tion
Ever
gree
n M
arin
e (H
ong
Kon
g)Lt
d.3
126,
797,
107
2,
019,
634
2,
019,
634
70
5,38
7
-
3.
19%
158,
496,
384
YN
N
Not
e 1:
The
num
bers
fille
d in
for t
he e
ndor
sem
ents
/gua
rant
ees p
rovi
ded
by th
e C
ompa
ny o
r sub
sidi
arie
s are
as f
ollo
ws:
(1)T
he C
ompa
ny is
‘0’.
(2)T
he su
bsid
iarie
s are
num
bere
d in
ord
er st
artin
g fro
m ‘1
’.
Not
e 2:
Rel
atio
nshi
p be
twee
n th
e en
dors
er/g
uara
ntor
and
the
party
bei
ng e
ndor
sed/
guar
ante
ed is
cla
ssifi
ed in
to th
e fo
llow
ing
six
cate
gorie
s; fil
l in
the
num
ber o
f cat
egor
y ea
ch c
ase
belo
ngs t
o:
(1) H
avin
g bu
sine
ss re
latio
nshi
p.
(2) T
he e
ndor
ser/g
uara
ntor
par
ent c
ompa
ny o
wns
dire
ctly
mor
e th
an 5
0% v
otin
g sh
ares
of t
he e
ndor
sed/
guar
ante
ed su
bsid
iary
.
(3) T
he e
ndor
ser/g
uara
ntor
par
ent c
ompa
ny a
nd it
s sub
sidi
arie
s joi
ntly
ow
n m
ore
than
50%
vot
ing
shar
es o
f the
end
orse
d/gu
aran
teed
com
pany
.
(4) T
he e
ndor
sed/
guar
ante
ed p
aren
t com
pany
dire
ctly
or i
ndire
ctly
ow
ns m
ore
than
50%
vot
ing
shar
es o
f the
end
orse
r/gua
rant
or su
bsid
iary
.
(5) M
utua
l gua
rant
ee o
f the
trad
e as
requ
ired
by th
e co
nstru
ctio
n co
ntra
ct.
(6) D
ue to
join
t ven
ture
, eac
h sh
areh
olde
r pro
vide
s end
orse
men
ts/g
uara
ntee
s to
the
endo
rsed
/gua
rant
eed
com
pany
in p
ropo
rtion
to it
s ow
ners
hip.
Not
e 3:
Fill
in li
mit
on e
ndor
sem
ents
/gua
rant
ees p
rovi
ded
for a
sing
le p
arty
and
cei
ling
on to
tal a
mou
nt o
f end
orse
men
ts/g
uara
ntee
s pro
vide
d as
pre
scrib
ed in
the
endo
rser
/gua
rant
or c
ompa
ny’s
“Pr
oced
ures
for P
rovi
sion
of E
ndor
sem
ents
and
Gua
rant
ees”
, and
stat
e ea
ch in
divi
dual
par
ty to
whi
ch th
e en
dors
emen
ts/g
uara
ntee
s hav
e be
en p
rovi
ded
and
the
calc
ulat
ion
for c
eilin
g on
tota
l am
ount
of e
ndor
sem
ents
/gua
rant
ees p
rovi
ded
in th
e fo
otno
te.
The
cal
cula
tion
is a
s fol
low
s:
The
Com
pany
:63,
398,
553*
250%
= 1
58,4
96,3
84
Lim
it on
end
orse
men
t or g
uara
ntee
s pro
vide
d by
the
Com
pany
for a
sing
le e
ntity
is $
31,6
99,2
77 (A
mou
ntin
g to
50%
of i
ts n
et w
orth
).
Whe
n th
e C
ompa
ny o
wns
mor
e th
an 5
0% v
otin
g sh
ares
of t
he e
ndor
sed/
guar
ante
ed c
ompa
ny, t
he li
mit
on e
ndor
sem
ent o
r gua
rant
ee p
rovi
ded
by th
e C
ompa
ny sh
ould
not
exc
eed
200%
of i
ts n
et w
orth
, whi
ch e
qual
s to
$126
,797
,107
.
Not
e 4:
Fill
in th
e ye
ar-to
-dat
e m
axim
um o
utst
andi
ng b
alan
ce o
f end
orse
men
ts/g
uara
ntee
s pro
vide
d as
of t
he re
porti
ng p
erio
d.
Not
e 6:
Fill
in th
e ac
tual
am
ount
of e
ndor
sem
ents
/gua
rant
ees u
sed
by th
e en
dors
ed/g
uara
ntee
d co
mpa
ny.
Not
e 7:
Fill
in ‘Y
’ for
thos
e ca
ses o
f pro
visi
on o
f end
orse
men
ts/g
uara
ntee
s by
liste
d pa
rent
com
pany
to su
bsid
iary
, pro
visi
on b
y su
bsid
iary
to li
sted
par
ent c
ompa
ny, a
nd p
rovi
sion
to th
e pa
rty in
Mai
nlan
d C
hina
.
Not
e 5:
Onc
e en
dors
emen
t/gua
rant
ee c
ontra
cts o
r pro
mis
sory
not
es a
re si
gned
/issu
ed b
y th
e en
dors
er/g
uara
ntor
com
pany
to th
e ba
nks,
the
endo
rser
/gua
rant
or c
ompa
ny b
ears
end
orse
men
t/gua
rant
ee li
abili
ties.
And
all
othe
r eve
nts i
nvol
ve e
ndor
sem
ents
and
gua
rant
ees s
houl
d be
incl
uded
in th
e ba
lanc
e of
out
stan
ding
end
orse
men
ts a
nd g
uara
ntee
s.
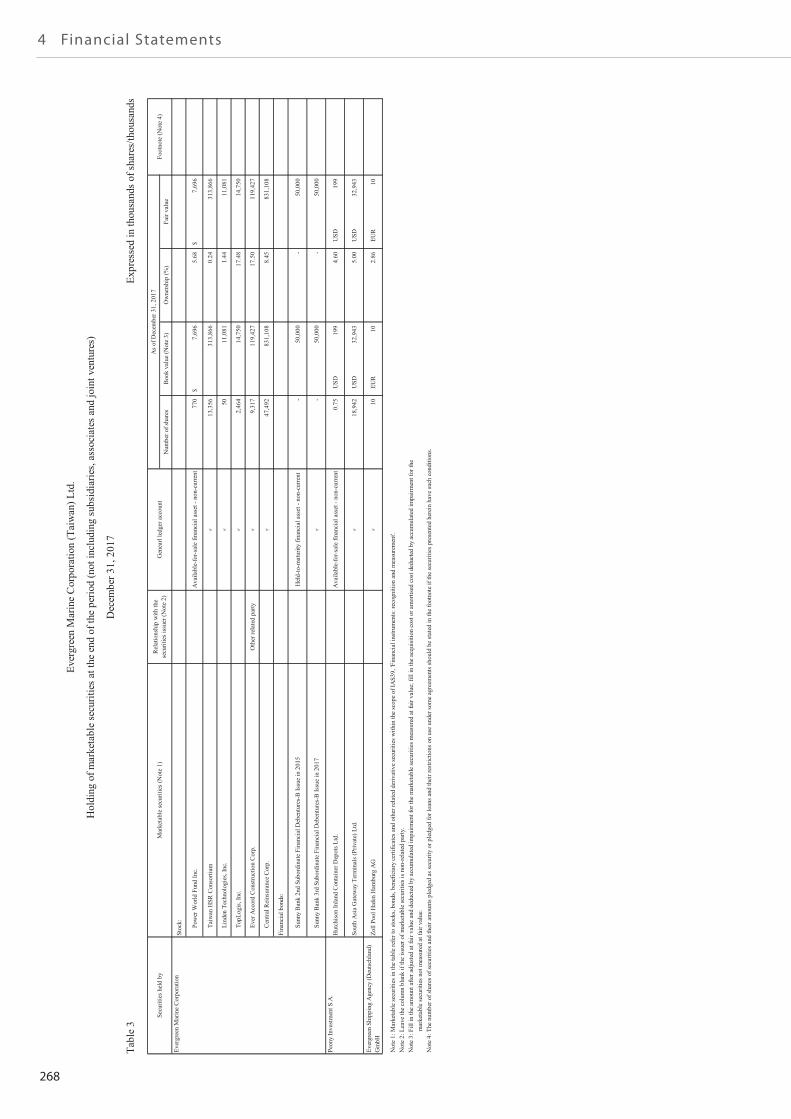
268
4 Financial Statements
Num
ber o
f sha
res
Boo
k va
lue
(Not
e 3)
Ow
ners
hip
(%)
Fair
valu
e
Stoc
k: Pow
er W
orld
Fun
d In
c.A
vaila
ble-
for-s
ale
finan
cial
ass
et -
non-
curre
nt77
0
7,
696
$
5.
687,
696
$
Taiw
an H
SR C
onso
rtium
13,3
56
313,
866
0.24
313,
866
Lind
en T
echn
olog
ies,
Inc.
50
11,0
81
1.44
11,0
81
TopL
ogis
, Inc
.2,
464
14
,750
17
.48
14,7
50
Ever
Acc
ord
Con
stru
ctio
n C
orp.
Oth
er re
late
d pa
rty9,
317
11
9,42
7
17
.50
119,
427
Cen
tral R
eins
uran
ce C
orp.
47,4
92
831,
108
8.45
831,
108
Fina
ncia
l bon
ds:
Sunn
y B
ank
2nd
Subo
rdin
ate
Fina
ncia
l Deb
entu
res-
B Is
sue
in 2
015
Hel
d-to
-mat
urity
fina
ncia
l ass
et -
non-
curre
nt-
50,0
00
-
50
,000
Sunn
y B
ank
3rd
Subo
rdin
ate
Fina
ncia
l Deb
entu
res-
B Is
sue
in 2
017
-
50
,000
-
50,0
00
Hut
chis
on In
land
Con
tain
er D
epot
s Ltd
.A
vaila
ble-
for-s
ale
finan
cial
ass
et -
non-
curre
nt0.
75
U
SD
1
994.
60
U
SD
1
99
Sout
h A
sia
Gat
eway
Ter
min
als (
Priv
ate)
Ltd
.18
,942
U
SD
3
2,94
35.
00
U
SD
3
2,94
3
Ever
gree
n Sh
ippi
ng A
genc
y (D
euts
chla
nd)
Gm
bHZo
ll Po
ol H
afen
Ham
burg
AG
10
EUR
10
2.86
EUR
10
Not
e 1:
Mar
keta
ble
secu
ritie
s in
the
tabl
e re
fer t
o st
ocks
, bon
ds, b
enef
icia
ry c
ertif
icat
es a
nd o
ther
rela
ted
deriv
ativ
e se
curit
ies w
ithin
the
scop
e of
IAS3
9, 'F
inan
cial
inst
rum
ents
: rec
ogni
tion
and
mea
sure
men
t'.N
ote
2: L
eave
the
colu
mn
blan
k if
the
issu
er o
f mar
keta
ble
secu
ritie
s is n
on-re
late
d pa
rty.
Not
e 3:
Fill
in th
e am
ount
afte
r adj
uste
d at
fair
valu
e an
d de
duct
ed b
y ac
cum
ulat
ed im
pairm
ent f
or th
e m
arke
tabl
e se
curit
ies m
easu
red
at fa
ir va
lue;
fill
in th
e ac
quis
ition
cos
t or a
mor
tised
cos
t ded
ucte
d by
acc
umul
ated
impa
irmen
t for
the
mar
keta
ble
secu
ritie
s not
mea
sure
d at
fair
valu
e.N
ote
4: T
he n
umbe
r of s
hare
s of s
ecur
ities
and
thei
r am
ount
s ple
dged
as s
ecur
ity o
r ple
dged
for l
oans
and
thei
r res
trict
ions
on
use
unde
r som
e ag
reem
ents
shou
ld b
e st
ated
in th
e fo
otno
te if
the
secu
ritie
s pre
sent
ed h
erei
n ha
ve su
ch co
nditi
ons.
Ever
gree
n M
arin
e C
orpo
ratio
n
Peon
y In
vest
men
t S.A
.
Foot
note
(Not
e 4)
Secu
ritie
s hel
d by
Mar
keta
ble
secu
ritie
s (N
ote
1)R
elat
ions
hip
with
the
secu
ritie
s iss
uer (
Not
e 2)
Gen
earl
ledg
er a
ccou
ntA
s of D
ecem
ber 3
1, 2
017
(Exc
ept a
s oth
erw
ise
indi
cate
d)
Ever
gree
n M
arin
e C
orpo
ratio
n (T
aiw
an) L
td.
Hol
ding
of m
arke
tabl
e se
curit
ies a
t the
end
of t
he p
erio
d (n
ot in
clud
ing
subs
idia
ries,
asso
ciat
es a
nd jo
int v
entu
res)
Dec
embe
r 31,
201
7
Tabl
e 3
Expr
esse
d in
thou
sand
s of s
hare
s/th
ousa
nds
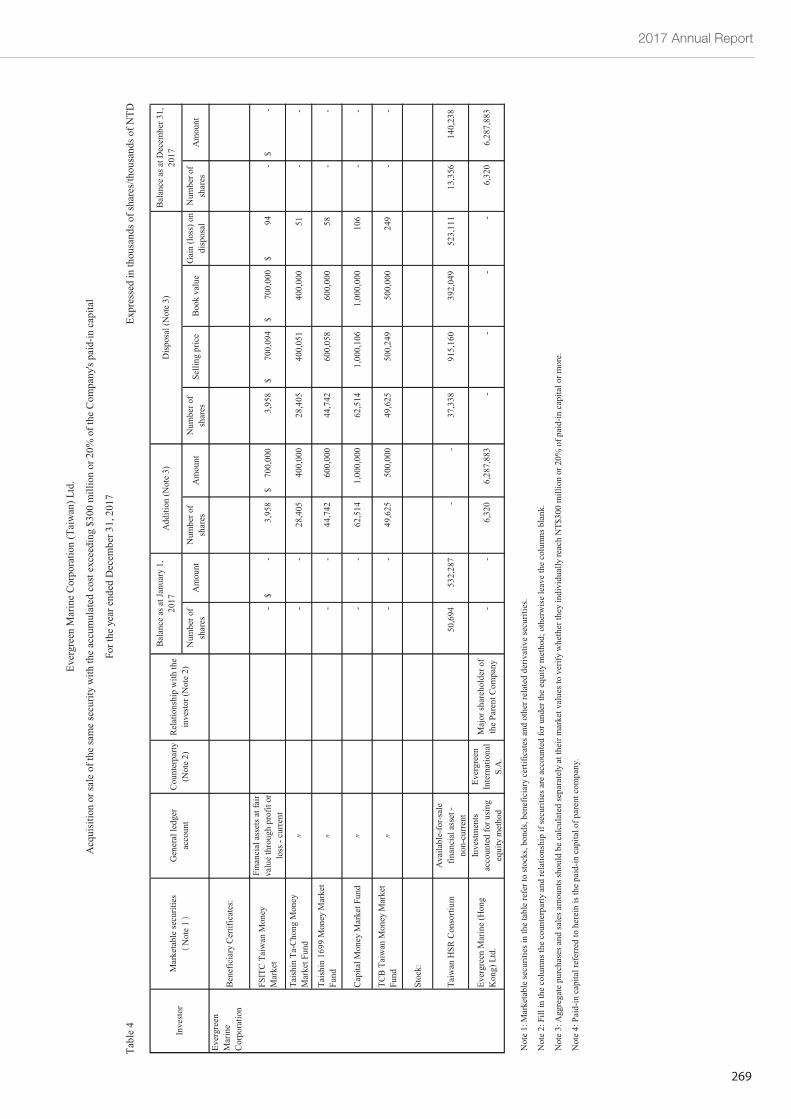
2017 Annual Report
269
Num
ber o
fsh
ares
Am
ount
Num
ber o
fsh
ares
Am
ount
Num
ber o
fsh
ares
Selli
ng p
rice
Boo
k va
lue
Gai
n (lo
ss) o
ndi
spos
alN
umbe
r of
shar
esA
mou
nt
Bene
ficia
ry C
ertif
icat
es:
FSIT
C T
aiw
an M
oney
Mar
ket
Fina
ncia
l ass
ets a
t fai
rva
lue
thro
ugh
prof
it or
loss
- cu
rren
t
-
-$
3
,958
700,
000
$
3
,958
700,
094
$
700,
000
$
94$
-
-$
Tais
hin
Ta-C
hong
Mon
eyM
arke
t Fun
d
-
-
28,
405
400
,000
2
8,40
5
400
,051
4
00,0
00
51
-
-
Tais
hin
1699
Mon
ey M
arke
tFu
nd
-
-
44,
742
600
,000
4
4,74
2
600
,058
6
00,0
00
58
-
-
Cap
ital M
oney
Mar
ket F
und
-
-
6
2,51
4
1,0
00,0
00
62,
514
1,0
00,1
06
1
,000
,000
10
6
-
-
TCB
Taiw
an M
oney
Mar
ket
Fund
-
-
4
9,62
5
5
00,0
00
49,
625
5
00,2
49
500
,000
24
9
-
-
Stoc
k:
Taiw
an H
SR C
onso
rtium
Ava
ilabl
e-fo
r-sal
efin
anci
al a
sset
-no
n-cu
rrent
50
,694
532,
287
-
-
37,
338
9
15,1
60
392
,049
523
,111
13
,356
14
0,23
8
Ever
gree
n M
arin
e (H
ong
Kon
g) L
td.
Inve
stm
ents
acco
unte
d fo
r usi
ngeq
uity
met
hod
Ever
gree
nIn
tern
atio
nal
S.A
.
Maj
or sh
areh
olde
r of
the
Pare
nt C
ompa
ny
-
-
6
,320
6
,287
,883
-
-
-
-
6,3
20
6,
287,
883
Not
e 1:
Mar
keta
ble
secu
ritie
s in
the
tabl
e re
fer t
o st
ocks
, bon
ds, b
enef
icia
ry c
ertif
icat
es a
nd o
ther
rela
ted
deriv
ativ
e se
curit
ies.
Not
e 2:
Fill
in th
e co
lum
ns th
e co
unte
rpar
ty a
nd re
latio
nshi
p if
secu
ritie
s are
acc
ount
ed fo
r und
er th
e eq
uity
met
hod;
oth
erw
ise
leav
e th
e co
lum
ns b
lank
.
Not
e 3:
Agg
rega
te p
urch
ases
and
sale
s am
ount
s sho
uld
be c
alcu
late
d se
para
tely
at t
heir
mar
ket v
alue
s to
verif
y w
heth
er th
ey in
divi
dual
ly re
ach
NT$
300
mill
ion
or 2
0% o
f pai
d-in
cap
ital o
r mor
e.
Not
e 4:
Pai
d-in
cap
ital r
efer
red
to h
erei
n is
the
paid
-in c
apita
l of p
aren
t com
pany
.
Ever
gree
nM
arin
eC
orpo
ratio
n
Acq
uisi
tion
or sa
le o
f the
sam
e se
curit
y w
ith th
e ac
cum
ulat
ed c
ost e
xcee
ding
$30
0 m
illio
n or
20%
of t
he C
ompa
ny's
paid
-in c
apita
l
For t
he y
ear e
nded
Dec
embe
r 31,
201
7
Tabl
e 4
(Exc
ept a
s oth
erw
ise
indi
cate
d)
Ever
gree
n M
arin
e C
orpo
ratio
n (T
aiw
an) L
td.
Expr
esse
d in
thou
sand
s of s
hare
s/th
ousa
nds o
f NTD
Add
ition
(Not
e 3)
Dis
posa
l (N
ote
3)Ba
lanc
e as
at D
ecem
ber 3
1,20
17In
vest
orM
arke
tabl
e se
curit
ies
Not
e 1
Gen
eral
ledg
erac
coun
tC
ount
erpa
rty(N
ote
2)R
elat
ions
hip
with
the
inve
stor
(Not
e 2)
Bala
nce
as a
t Jan
uary
1,
2017
Num
ber o
fsh
ares
Am
ount
Num
ber o
fsh
ares
Am
ount
Num
ber o
fsh
ares
Selli
ng p
rice
Boo
k va
lue
Gai
n (lo
ss) o
ndi
spos
alN
umbe
r of
shar
esA
mou
nt
Bene
ficia
ry C
ertif
icat
es:
FSIT
C T
aiw
an M
oney
Mar
ket
Fina
ncia
l ass
ets a
t fai
rva
lue
thro
ugh
prof
it or
loss
- cu
rren
t
-
-$
3
,958
700,
000
$
3
,958
700,
094
$
700,
000
$
94$
-
-$
Tais
hin
Ta-C
hong
Mon
eyM
arke
t Fun
d
-
-
28,
405
400
,000
2
8,40
5
400
,051
4
00,0
00
51
-
-
Tais
hin
1699
Mon
ey M
arke
tFu
nd
-
-
44,
742
600
,000
4
4,74
2
600
,058
6
00,0
00
58
-
-
Cap
ital M
oney
Mar
ket F
und
-
-
6
2,51
4
1,0
00,0
00
62,
514
1,0
00,1
06
1
,000
,000
10
6
-
-
TCB
Taiw
an M
oney
Mar
ket
Fund
-
-
4
9,62
5
5
00,0
00
49,
625
5
00,2
49
500
,000
24
9
-
-
Stoc
k:
Taiw
an H
SR C
onso
rtium
Ava
ilabl
e-fo
r-sal
efin
anci
al a
sset
-no
n-cu
rrent
50
,694
532,
287
-
-
37,
338
9
15,1
60
392
,049
523
,111
13
,356
14
0,23
8
Ever
gree
n M
arin
e (H
ong
Kon
g) L
td.
Inve
stm
ents
acco
unte
d fo
r usi
ngeq
uity
met
hod
Ever
gree
nIn
tern
atio
nal
S.A
.
Maj
or sh
areh
olde
r of
the
Pare
nt C
ompa
ny
-
-
6
,320
6
,287
,883
-
-
-
-
6,3
20
6,
287,
883
Not
e 1:
Mar
keta
ble
secu
ritie
s in
the
tabl
e re
fer t
o st
ocks
, bon
ds, b
enef
icia
ry c
ertif
icat
es a
nd o
ther
rela
ted
deriv
ativ
e se
curit
ies.
Not
e 2:
Fill
in th
e co
lum
ns th
e co
unte
rpar
ty a
nd re
latio
nshi
p if
secu
ritie
s are
acc
ount
ed fo
r und
er th
e eq
uity
met
hod;
oth
erw
ise
leav
e th
e co
lum
ns b
lank
.
Not
e 3:
Agg
rega
te p
urch
ases
and
sale
s am
ount
s sho
uld
be c
alcu
late
d se
para
tely
at t
heir
mar
ket v
alue
s to
verif
y w
heth
er th
ey in
divi
dual
ly re
ach
NT$
300
mill
ion
or 2
0% o
f pai
d-in
cap
ital o
r mor
e.
Not
e 4:
Pai
d-in
cap
ital r
efer
red
to h
erei
n is
the
paid
-in c
apita
l of p
aren
t com
pany
.
Ever
gree
nM
arin
eC
orpo
ratio
n
Acq
uisi
tion
or sa
le o
f the
sam
e se
curit
y w
ith th
e ac
cum
ulat
ed c
ost e
xcee
ding
$30
0 m
illio
n or
20%
of t
he C
ompa
ny's
paid
-in c
apita
l
For t
he y
ear e
nded
Dec
embe
r 31,
201
7
Tabl
e 4
(Exc
ept a
s oth
erw
ise
indi
cate
d)
Ever
gree
n M
arin
e C
orpo
ratio
n (T
aiw
an) L
td.
Expr
esse
d in
thou
sand
s of s
hare
s/th
ousa
nds o
f NTD
Add
ition
(Not
e 3)
Dis
posa
l (N
ote
3)Ba
lanc
e as
at D
ecem
ber 3
1,20
17In
vest
orM
arke
tabl
e se
curit
ies
Not
e 1
Gen
eral
ledg
erac
coun
tC
ount
erpa
rty(N
ote
2)R
elat
ions
hip
with
the
inve
stor
(Not
e 2)
Bala
nce
as a
t Jan
uary
1,
2017
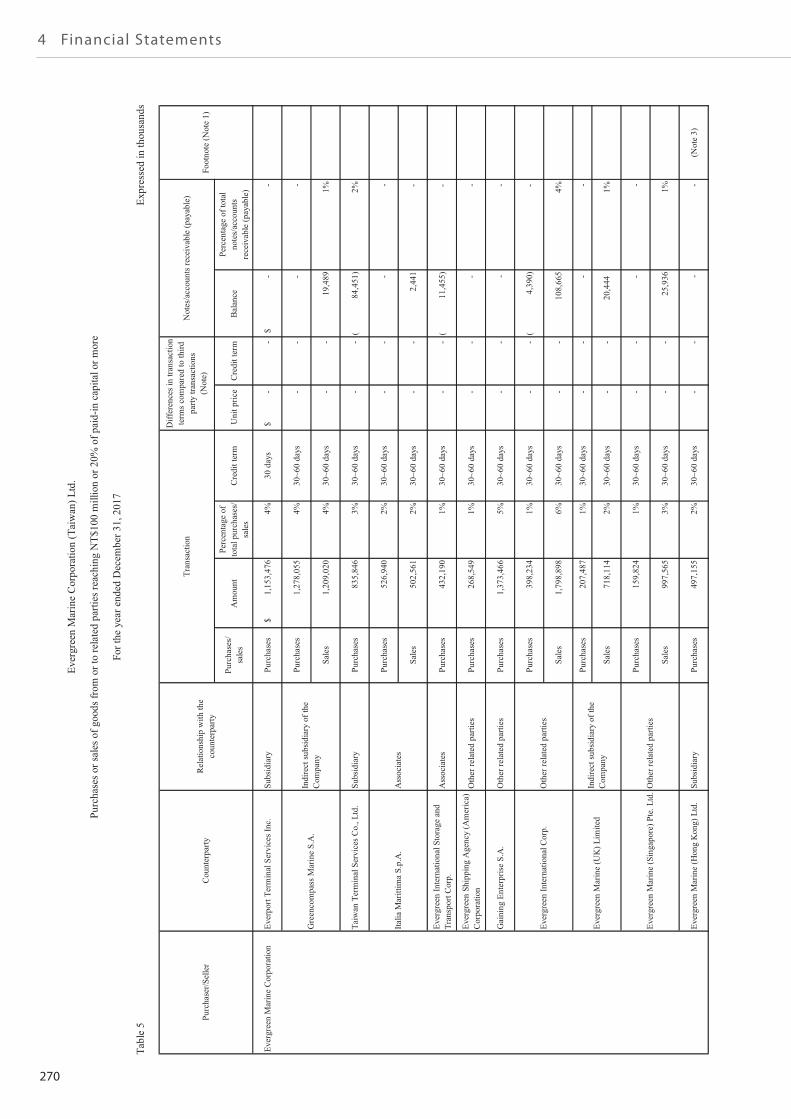
270
4 Financial Statements
Purc
hase
s/sa
les
Am
ount
Pe
rcen
tage
of
tota
l pur
chas
es/
sale
sC
redi
t ter
mU
nit p
rice
Cre
dit t
erm
Bal
ance
Pe
rcen
tage
of t
otal
note
s/ac
coun
tsre
ceiv
able
(pay
able
)
Ever
gree
n M
arin
e C
orpo
ratio
nEv
erpo
rt Te
rmin
al S
ervi
ces I
nc.
Subs
idia
ryPu
rcha
ses
$1,
153,
476
4%30
day
s $
-
-
$
-
-
Purc
hase
s1,
278,
055
4%30
~60
days
-
-
-
-
Sale
s1,
209,
020
4%30
~60
days
-
-19
,489
1%
Taiw
an T
erm
inal
Ser
vice
s Co.
, Ltd
.Su
bsid
iary
Purc
hase
s83
5,84
63%
30~6
0 da
ys
-
-
(84
,451
)2%
Purc
hase
s52
6,94
02%
30~6
0 da
ys
-
-
-
-
Sale
s50
2,56
12%
30~6
0 da
ys
-
-
2,44
1
-
Ever
gree
n In
tern
atio
nal S
tora
ge a
ndTr
ansp
ort C
orp.
Ass
ocia
tes
Purc
hase
s43
2,19
01%
30~6
0 da
ys
-
-
(11
,455
)
-
Ever
gree
n Sh
ippi
ng A
genc
y (A
mer
ica)
Cor
pora
tion
Oth
er re
late
d pa
rties
Purc
hase
s26
8,54
91%
30~6
0 da
ys
-
-
-
-
Gai
ning
Ent
erpr
ise
S.A
.O
ther
rela
ted
parti
esPu
rcha
ses
1,37
3,46
65%
30~6
0 da
ys
-
-
-
-
Purc
hase
s39
8,23
41%
30~6
0 da
ys
-
-
(4,
390)
-
Sale
s1,
798,
898
6%30
~60
days
-
-10
8,66
54%
Purc
hase
s20
7,48
71%
30~6
0 da
ys
-
-
-
-
Sale
s71
8,11
42%
30~6
0 da
ys
-
-
2
0,44
41%
Purc
hase
s15
9,82
41%
30~6
0 da
ys
-
-
-
-
Sale
s99
7,56
53%
30~6
0 da
ys
-
-
25,9
361%
Ever
gree
n M
arin
e (H
ong
Kon
g) L
td.
Subs
idia
ryPu
rcha
ses
497,
155
2%30
~60
days
-
-
-
-(N
ote
3)
Expr
esse
d in
thou
sand
s
Gre
enco
mpa
ss M
arin
e S.
A.
Indi
rect
subs
idia
ry o
f the
Com
pany
Foot
note
(Not
e 1)
Purc
hase
r/Sel
ler
Cou
nter
party
Rel
atio
nshi
p w
ith th
eco
unte
rpar
ty
Tran
sact
ion
Diff
eren
ces i
n tra
nsac
tion
term
s com
pare
d to
third
party
tran
sact
ions
(Not
e)
Not
es/a
ccou
nts r
ecei
vabl
e (p
ayab
le)
(Exc
ept a
s oth
erw
ise
indi
cate
d)
Ever
gree
n M
arin
e C
orpo
ratio
n (T
aiw
an) L
td.
Purc
hase
s or s
ales
of g
oods
from
or t
o re
late
d pa
rties
reac
hing
NT$
100
mill
ion
or 2
0% o
f pai
d-in
cap
ital o
r mor
e
For t
he y
ear e
nded
Dec
embe
r 31,
201
7
Tabl
e 5
Oth
er re
late
d pa
rties
Italia
Mar
ittim
a S.
p.A
.A
ssoc
iate
s
Ever
gree
n M
arin
e (S
inga
pore
) Pte
. Ltd
.Oth
er re
late
d pa
rties
Ever
gree
n M
arin
e (U
K) L
imite
dIn
dire
ct su
bsid
iary
of t
heC
ompa
ny
Ever
gree
n In
tern
atio
nal C
orp.
Purc
hase
s/sa
les
Am
ount
Pe
rcen
tage
of
tota
l pur
chas
es/
sale
sC
redi
t ter
mU
nit p
rice
Cre
dit t
erm
Bal
ance
Pe
rcen
tage
of t
otal
note
s/ac
coun
tsre
ceiv
able
(pay
able
)
Ever
gree
n M
arin
e C
orpo
ratio
nEv
erpo
rt Te
rmin
al S
ervi
ces I
nc.
Subs
idia
ryPu
rcha
ses
$1,
153,
476
4%30
day
s $
-
-
$
-
-
Purc
hase
s1,
278,
055
4%30
~60
days
-
-
-
-
Sale
s1,
209,
020
4%30
~60
days
-
-19
,489
1%
Taiw
an T
erm
inal
Ser
vice
s Co.
, Ltd
.Su
bsid
iary
Purc
hase
s83
5,84
63%
30~6
0 da
ys
-
-
(84
,451
)2%
Purc
hase
s52
6,94
02%
30~6
0 da
ys
-
-
-
-
Sale
s50
2,56
12%
30~6
0 da
ys
-
-
2,44
1
-
Ever
gree
n In
tern
atio
nal S
tora
ge a
ndTr
ansp
ort C
orp.
Ass
ocia
tes
Purc
hase
s43
2,19
01%
30~6
0 da
ys
-
-
(11
,455
)
-
Ever
gree
n Sh
ippi
ng A
genc
y (A
mer
ica)
Cor
pora
tion
Oth
er re
late
d pa
rties
Purc
hase
s26
8,54
91%
30~6
0 da
ys
-
-
-
-
Gai
ning
Ent
erpr
ise
S.A
.O
ther
rela
ted
parti
esPu
rcha
ses
1,37
3,46
65%
30~6
0 da
ys
-
-
-
-
Purc
hase
s39
8,23
41%
30~6
0 da
ys
-
-
(4,
390)
-
Sale
s1,
798,
898
6%30
~60
days
-
-10
8,66
54%
Purc
hase
s20
7,48
71%
30~6
0 da
ys
-
-
-
-
Sale
s71
8,11
42%
30~6
0 da
ys
-
-
2
0,44
41%
Purc
hase
s15
9,82
41%
30~6
0 da
ys
-
-
-
-
Sale
s99
7,56
53%
30~6
0 da
ys
-
-
25,9
361%
Ever
gree
n M
arin
e (H
ong
Kon
g) L
td.
Subs
idia
ryPu
rcha
ses
497,
155
2%30
~60
days
-
-
-
-(N
ote
3)
Expr
esse
d in
thou
sand
s
Gre
enco
mpa
ss M
arin
e S.
A.
Indi
rect
subs
idia
ry o
f the
Com
pany
Foot
note
(Not
e 1)
Purc
hase
r/Sel
ler
Cou
nter
party
Rel
atio
nshi
p w
ith th
eco
unte
rpar
ty
Tran
sact
ion
Diff
eren
ces i
n tra
nsac
tion
term
s com
pare
d to
third
party
tran
sact
ions
(Not
e)
Not
es/a
ccou
nts r
ecei
vabl
e (p
ayab
le)
(Exc
ept a
s oth
erw
ise
indi
cate
d)
Ever
gree
n M
arin
e C
orpo
ratio
n (T
aiw
an) L
td.
Purc
hase
s or s
ales
of g
oods
from
or t
o re
late
d pa
rties
reac
hing
NT$
100
mill
ion
or 2
0% o
f pai
d-in
cap
ital o
r mor
e
For t
he y
ear e
nded
Dec
embe
r 31,
201
7
Tabl
e 5
Oth
er re
late
d pa
rties
Italia
Mar
ittim
a S.
p.A
.A
ssoc
iate
s
Ever
gree
n M
arin
e (S
inga
pore
) Pte
. Ltd
.Oth
er re
late
d pa
rties
Ever
gree
n M
arin
e (U
K) L
imite
dIn
dire
ct su
bsid
iary
of t
heC
ompa
ny
Ever
gree
n In
tern
atio
nal C
orp.
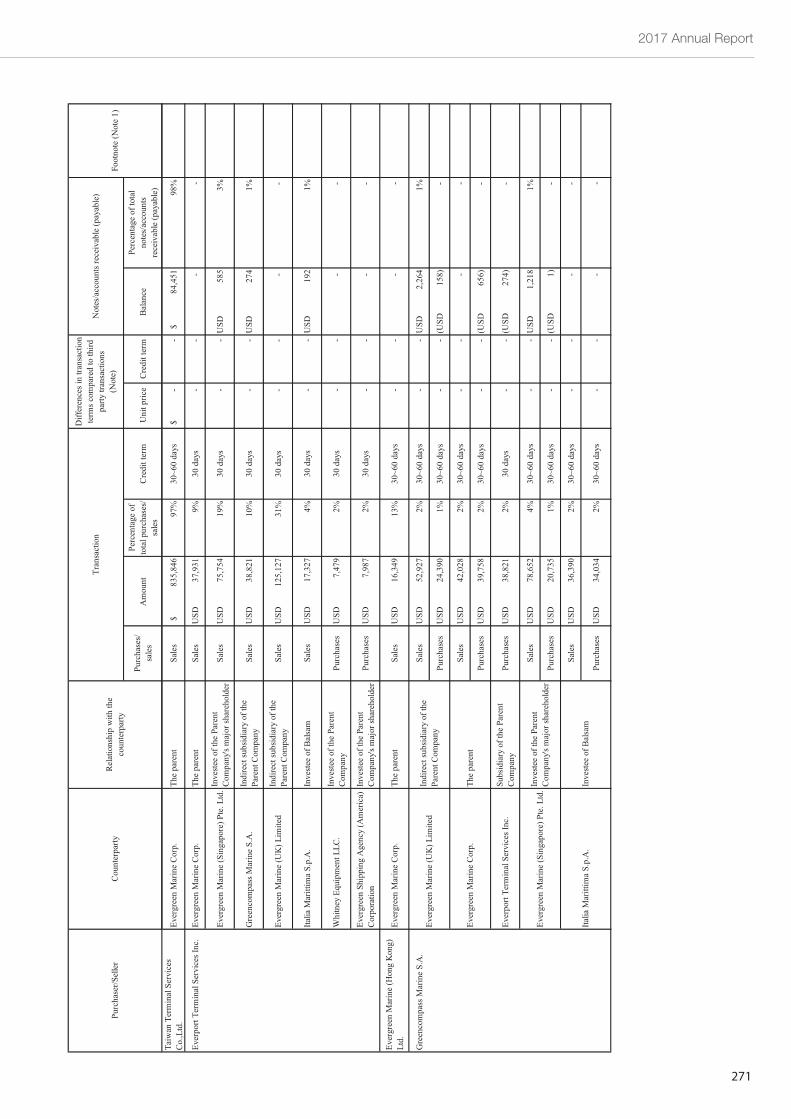
2017 Annual Report
271
Purc
hase
s/sa
les
Am
ount
Pe
rcen
tage
of
tota
l pur
chas
es/
sale
sC
redi
t ter
mU
nit p
rice
Cre
dit t
erm
Bal
ance
Pe
rcen
tage
of t
otal
note
s/ac
coun
tsre
ceiv
able
(pay
able
)
Foot
note
(Not
e 1)
Purc
hase
r/Sel
ler
Cou
nter
party
Rel
atio
nshi
p w
ith th
eco
unte
rpar
ty
Tran
sact
ion
Diff
eren
ces i
n tra
nsac
tion
term
s com
pare
d to
third
party
tran
sact
ions
(Not
e)
Not
es/a
ccou
nts r
ecei
vabl
e (p
ayab
le)
Taiw
an T
erm
inal
Ser
vice
sC
o.,L
td.
Ever
gree
n M
arin
e C
orp.
The
pare
ntSa
les
$83
5,84
697
%30
~60
days
$
-
-$
84,4
5198
%
Ever
port
Term
inal
Ser
vice
s Inc
.Ev
ergr
een
Mar
ine
Cor
p.Th
e pa
rent
Sale
sU
SD37
,931
9%30
day
s
-
-
-
-
Ever
gree
n M
arin
e (S
inga
pore
) Pte
. Ltd
.Inve
stee
of t
he P
aren
tC
ompa
ny's
maj
or sh
areh
olde
rSa
les
USD
75,7
5419
%30
day
s
-
-
USD
585
3%
Gre
enco
mpa
ss M
arin
e S.
A.
Indi
rect
subs
idia
ry o
f the
Pare
nt C
ompa
nySa
les
USD
38,8
2110
%30
day
s
-
-
USD
274
1%
Ever
gree
n M
arin
e (U
K) L
imite
dIn
dire
ct su
bsid
iary
of t
hePa
rent
Com
pany
Sale
sU
SD12
5,12
731
%30
day
s
-
-
-
-
Italia
Mar
ittim
a S.
p.A
.In
vest
ee o
f Bal
sam
Sale
sU
SD17
,327
4%30
day
s
-
-
USD
192
1%
Whi
tney
Equ
ipm
ent L
LC.
Inve
stee
of t
he P
aren
tC
ompa
nyPu
rcha
ses
USD
7,47
92%
30 d
ays
-
-
-
-
Ever
gree
n Sh
ippi
ng A
genc
y (A
mer
ica)
Cor
pora
tion
Inve
stee
of t
he P
aren
tC
ompa
ny's
maj
or sh
areh
olde
rPu
rcha
ses
USD
7,98
72%
30 d
ays
-
-
-
-
Ever
gree
n M
arin
e (H
ong
Kon
g)Lt
d.Ev
ergr
een
Mar
ine
Cor
p.Th
e pa
rent
Sale
sU
SD16
,349
13%
30~6
0 da
ys
-
-
-
-
Gre
enco
mpa
ss M
arin
e S.
A.
Sale
sU
SD52
,927
2%30
~60
days
-
-U
SD2,
264
1%
Purc
hase
sU
SD24
,390
1%30
~60
days
-
-(U
SD15
8)
-
Sale
sU
SD42
,028
2%30
~60
days
-
-
-
-
Purc
hase
sU
SD39
,758
2%30
~60
days
-
-(U
SD65
6)
-
Ever
port
Term
inal
Ser
vice
s Inc
.Su
bsid
iary
of t
he P
aren
tC
ompa
nyPu
rcha
ses
USD
38,8
212%
30 d
ays
-
-(U
SD27
4)
-
Sale
sU
SD78
,652
4%30
~60
days
-
-U
SD1,
218
1%
Purc
hase
sU
SD20
,735
1%30
~60
days
-
-(U
SD1)
-
Sale
sU
SD36
,390
2%30
~60
days
-
-
-
-
Purc
hase
sU
SD34
,034
2%30
~60
days
-
-
-
-In
vest
ee o
f Bal
sam
Italia
Mar
ittim
a S.
p.A
.
Ever
gree
n M
arin
e (U
K) L
imite
dIn
dire
ct su
bsid
iary
of t
hePa
rent
Com
pany
Ever
gree
n M
arin
e C
orp.
The
pare
nt
Ever
gree
n M
arin
e (S
inga
pore
) Pte
. Ltd
.Inve
stee
of t
he P
aren
tC
ompa
ny's
maj
or sh
areh
olde
r
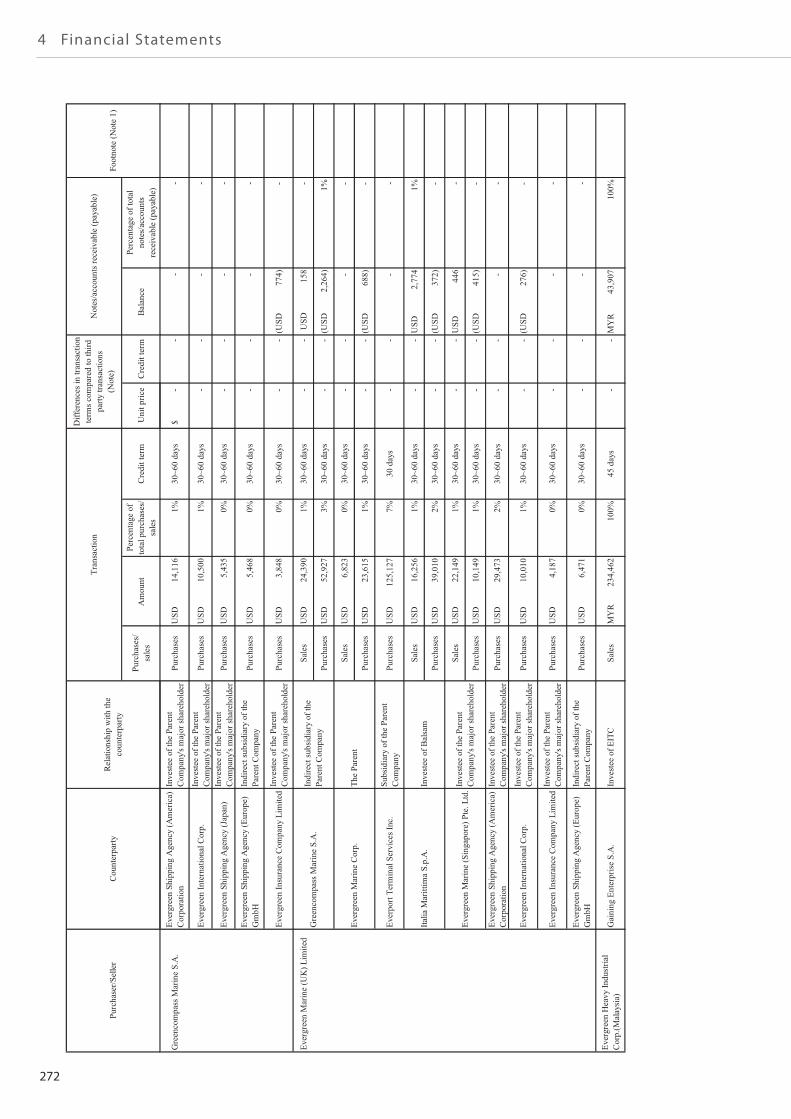
272
4 Financial Statements
Purc
hase
s/sa
les
Am
ount
Pe
rcen
tage
of
tota
l pur
chas
es/
sale
sC
redi
t ter
mU
nit p
rice
Cre
dit t
erm
Bal
ance
Pe
rcen
tage
of t
otal
note
s/ac
coun
tsre
ceiv
able
(pay
able
)
Foot
note
(Not
e 1)
Purc
hase
r/Sel
ler
Cou
nter
party
Rel
atio
nshi
p w
ith th
eco
unte
rpar
ty
Tran
sact
ion
Diff
eren
ces i
n tra
nsac
tion
term
s com
pare
d to
third
party
tran
sact
ions
(Not
e)
Not
es/a
ccou
nts r
ecei
vabl
e (p
ayab
le)
Gre
enco
mpa
ss M
arin
e S.
A.
Ever
gree
n Sh
ippi
ng A
genc
y (A
mer
ica)
Cor
pora
tion
Inve
stee
of t
he P
aren
tC
ompa
ny's
maj
or sh
areh
olde
rPu
rcha
ses
USD
14,1
161%
30~6
0 da
ys $
-
-
-
-
Ever
gree
n In
tern
atio
nal C
orp.
Inve
stee
of t
he P
aren
tC
ompa
ny's
maj
or sh
areh
olde
rPu
rcha
ses
USD
10,5
001%
30~6
0 da
ys
-
-
-
-
Ever
gree
n Sh
ippi
ng A
genc
y (J
apan
)In
vest
ee o
f the
Par
ent
Com
pany
's m
ajor
shar
ehol
der
Purc
hase
sU
SD5,
435
0%30
~60
days
-
-
-
-
Ever
gree
n Sh
ippi
ng A
genc
y (E
urop
e)G
mbH
Indi
rect
subs
idia
ry o
f the
Pare
nt C
ompa
nyPu
rcha
ses
USD
5,46
80%
30~6
0 da
ys
-
-
-
-
Ever
gree
n In
sura
nce
Com
pany
Lim
ited
Inve
stee
of t
he P
aren
tC
ompa
ny's
maj
or sh
areh
olde
rPu
rcha
ses
USD
3,84
80%
30~6
0 da
ys
-
-
(USD
774)
-
Ever
gree
n M
arin
e (U
K) L
imite
dSa
les
USD
24,3
901%
30~6
0 da
ys
-
-
USD
158
-
Purc
hase
sU
SD52
,927
3%30
~60
days
-
-(U
SD2,
264)
1%
Sale
sU
SD6,
823
0%30
~60
days
-
-
-
-
Purc
hase
sU
SD23
,615
1%30
~60
days
-
-(U
SD68
8)
-
Ever
port
Term
inal
Ser
vice
s Inc
.Su
bsid
iary
of t
he P
aren
tC
ompa
nyPu
rcha
ses
USD
125,
127
7%30
day
s
-
-
-
-
Sale
sU
SD16
,256
1%30
~60
days
-
-U
SD2,
774
1%
Purc
hase
sU
SD39
,010
2%30
~60
days
-
-(U
SD37
2)
-
Sale
sU
SD22
,149
1%30
~60
days
-
-U
SD44
6
-
Purc
hase
sU
SD10
,149
1%30
~60
days
-
-(U
SD41
5)
-
Ever
gree
n Sh
ippi
ng A
genc
y (A
mer
ica)
Cor
pora
tion
Inve
stee
of t
he P
aren
tC
ompa
ny's
maj
or sh
areh
olde
rPu
rcha
ses
USD
29,4
732%
30~6
0 da
ys
-
-
-
-
Ever
gree
n In
tern
atio
nal C
orp.
Inve
stee
of t
he P
aren
tC
ompa
ny's
maj
or sh
areh
olde
rPu
rcha
ses
USD
10,0
101%
30~6
0 da
ys
-
-
(USD
276)
-
Ever
gree
n In
sura
nce
Com
pany
Lim
ited
Inve
stee
of t
he P
aren
tC
ompa
ny's
maj
or sh
areh
olde
rPu
rcha
ses
USD
4,18
70%
30~6
0 da
ys
-
-
-
-
Ever
gree
n Sh
ippi
ng A
genc
y (E
urop
e)G
mbH
Indi
rect
subs
idia
ry o
f the
Pare
nt C
ompa
nyPu
rcha
ses
USD
6,47
10%
30~6
0 da
ys
-
-
-
-
Ever
gree
n H
eavy
Indu
stria
lC
orp.
(Mal
aysi
a)G
aini
ng E
nter
pris
e S.
A.
Inve
stee
of E
ITC
Sale
sM
YR
234,
462
100%
45 d
ays
-
-M
YR
43,9
0710
0%
Inve
stee
of B
alsa
m
Ever
gree
n M
arin
e C
orp.
The
Pare
nt
Ever
gree
n M
arin
e (S
inga
pore
) Pte
. Ltd
.Inve
stee
of t
he P
aren
tC
ompa
ny's
maj
or sh
areh
olde
r
Gre
enco
mpa
ss M
arin
e S.
A.
Indi
rect
subs
idia
ry o
f the
Pare
nt C
ompa
ny
Italia
Mar
ittim
a S.
p.A
.
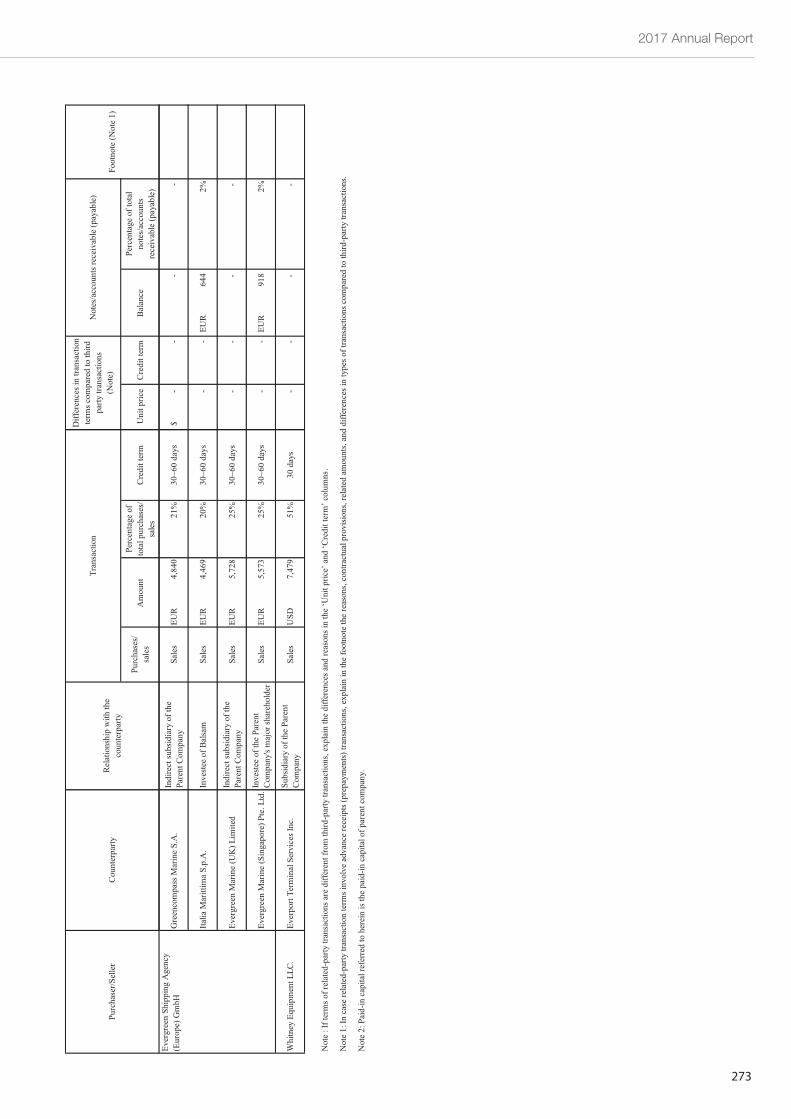
2017 Annual Report
273
Purc
hase
s/sa
les
Am
ount
Pe
rcen
tage
of
tota
l pur
chas
es/
sale
sC
redi
t ter
mU
nit p
rice
Cre
dit t
erm
Bal
ance
Pe
rcen
tage
of t
otal
note
s/ac
coun
tsre
ceiv
able
(pay
able
)
Foot
note
(Not
e 1)
Purc
hase
r/Sel
ler
Cou
nter
party
Rel
atio
nshi
p w
ith th
eco
unte
rpar
ty
Tran
sact
ion
Diff
eren
ces i
n tra
nsac
tion
term
s com
pare
d to
third
party
tran
sact
ions
(Not
e)
Not
es/a
ccou
nts r
ecei
vabl
e (p
ayab
le)
Gre
enco
mpa
ss M
arin
e S.
A.
Indi
rect
subs
idia
ry o
f the
Pare
nt C
ompa
nySa
les
EUR
4,84
021
%30
~60
days
$
-
-
-
-
Italia
Mar
ittim
a S.
p.A
.In
vest
ee o
f Bal
sam
Sale
sEU
R4,
469
20%
30~6
0 da
ys
-
-
EU
R
6
442%
Ever
gree
n M
arin
e (U
K) L
imite
dIn
dire
ct su
bsid
iary
of t
hePa
rent
Com
pany
Sale
sEU
R5,
728
25%
30~6
0 da
ys
-
-
-
-
Ever
gree
n M
arin
e (S
inga
pore
) Pte
. Ltd
.Inve
stee
of t
he P
aren
tC
ompa
ny's
maj
or sh
areh
olde
rSa
les
EUR
5,57
325
%30
~60
days
-
- E
UR
918
2%
Whi
tney
Equ
ipm
ent L
LC.
Ever
port
Term
inal
Ser
vice
s Inc
.Su
bsid
iary
of t
he P
aren
tC
ompa
nySa
les
USD
7,47
951
%30
day
s
-
-
-
-
Not
e : I
f ter
ms o
f rel
ated
-par
ty tr
ansa
ctio
ns a
re d
iffer
ent f
rom
third
-par
ty tr
ansa
ctio
ns, e
xpla
in th
e di
ffere
nces
and
reas
ons i
n th
e ‘U
nit p
rice’
and
‘Cre
dit t
erm
’ col
umns
.
Not
e 1:
In c
ase
rela
ted-
party
tran
sact
ion
term
s inv
olve
adv
ance
rece
ipts
(pre
paym
ents)
tran
sact
ions
, exp
lain
in th
e fo
otno
te th
e re
ason
s, co
ntra
ctua
l pro
visi
ons,
rela
ted
amou
nts,
and
diffe
renc
es in
type
s of t
rans
actio
ns c
ompa
red
to th
ird-p
arty
tran
sact
ions
.
Not
e 2:
Pai
d-in
cap
ital r
efer
red
to h
erei
n is
the
paid
-in c
apita
l of p
aren
t com
pany
.
Ever
gree
n Sh
ippi
ng A
genc
y(E
urop
e) G
mbH
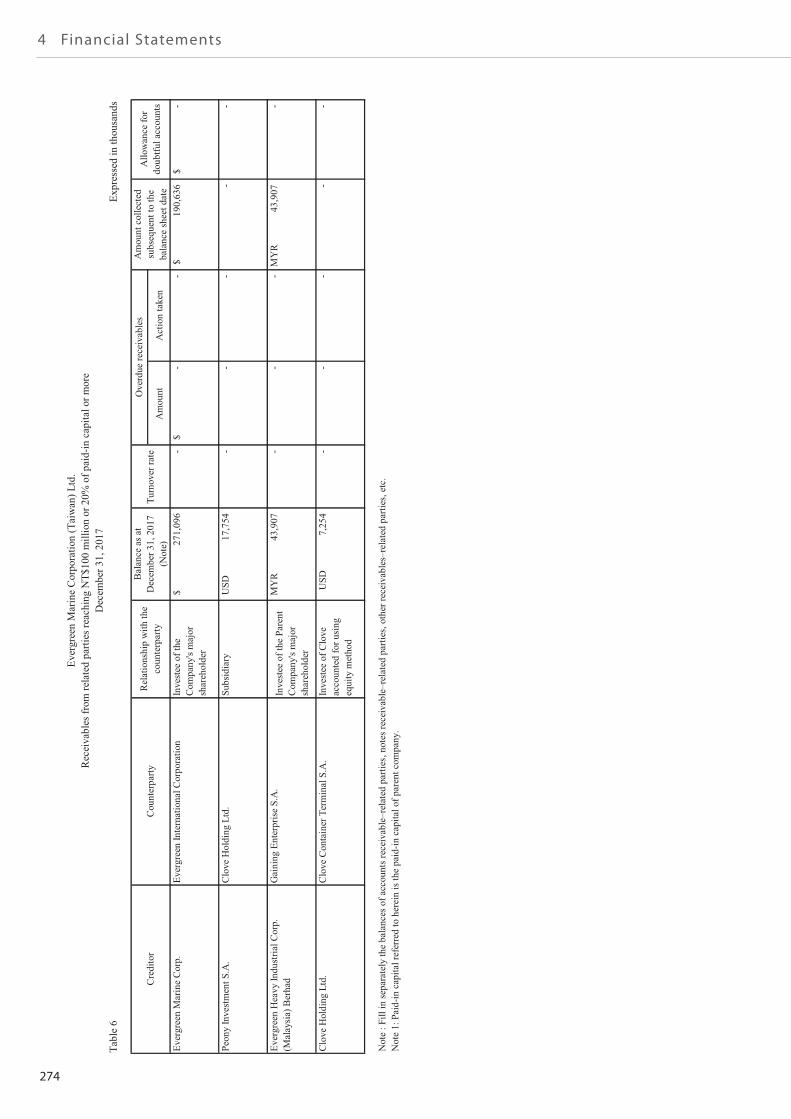
274
4 Financial Statements
Tabl
e 6
Expr
esse
d in
thou
sand
s(E
xcep
t as o
ther
wis
e in
dica
ted)
Am
ount
A
ctio
n ta
ken
Ever
gree
n In
tern
atio
nal C
orpo
ratio
nIn
vest
ee o
f the
Com
pany
's m
ajor
shar
ehol
der
271,
096
$
-
-
$
-
190,
636
$
-
$
Peon
y In
vest
men
t S.A
.C
love
Hol
ding
Ltd
.Su
bsid
iary
USD
17,
754
-
-
-
-
-
Ever
gree
n H
eavy
Indu
stria
l Cor
p.(M
alay
sia)
Ber
had
Gai
ning
Ent
erpr
ise
S.A
.In
vest
ee o
f the
Par
ent
Com
pany
's m
ajor
shar
ehol
der
MY
R
4
3,90
7-
-
-
MY
R
4
3,90
7-
Clo
ve H
oldi
ng L
td.
Clo
ve C
onta
iner
Ter
min
al S
.A.
Inve
stee
of C
love
acco
unte
d fo
r usi
ngeq
uity
met
hod
USD
7,2
54-
-
-
-
-
Not
e : F
ill in
sepa
rate
ly th
e ba
lanc
es o
f acc
ount
s rec
eiva
ble–
rela
ted
parti
es, n
otes
rece
ivab
le–r
elat
ed p
artie
s, ot
her r
ecei
vabl
es–r
elat
ed p
artie
s, e
tc.
Not
e 1:
Pai
d-in
cap
ital r
efer
red
to h
erei
n is
the
paid
-in c
apita
l of p
aren
t com
pany
.
Ever
gree
n M
arin
e C
orp.
Am
ount
col
lect
edsu
bseq
uent
to th
eba
lanc
e sh
eet d
ate
Allo
wan
ce fo
rdo
ubtfu
l acc
ount
sC
redi
tor
Cou
nter
party
Rel
atio
nshi
p w
ith th
eco
unte
rpar
ty
Bal
ance
as a
tD
ecem
ber 3
1, 2
017
(Not
e)Tu
rnov
er ra
te
Ove
rdue
rece
ivab
les
Ever
gree
n M
arin
e C
orpo
ratio
n (T
aiw
an) L
td.
Rec
eiva
bles
from
rela
ted
parti
es re
achi
ng N
T$10
0 m
illio
n or
20%
of p
aid-
in c
apita
l or m
ore
Dec
embe
r 31,
201
7Ta
ble
6Ex
pres
sed
in th
ousa
nds
(Exc
ept a
s oth
erw
ise
indi
cate
d)
Am
ount
A
ctio
n ta
ken
Ever
gree
n In
tern
atio
nal C
orpo
ratio
nIn
vest
ee o
f the
Com
pany
's m
ajor
shar
ehol
der
271,
096
$
-
-
$
-
190,
636
$
-
$
Peon
y In
vest
men
t S.A
.C
love
Hol
ding
Ltd
.Su
bsid
iary
USD
17,
754
-
-
-
-
-
Ever
gree
n H
eavy
Indu
stria
l Cor
p.(M
alay
sia)
Ber
had
Gai
ning
Ent
erpr
ise
S.A
.In
vest
ee o
f the
Par
ent
Com
pany
's m
ajor
shar
ehol
der
MY
R
4
3,90
7-
-
-
MY
R
4
3,90
7-
Clo
ve H
oldi
ng L
td.
Clo
ve C
onta
iner
Ter
min
al S
.A.
Inve
stee
of C
love
acco
unte
d fo
r usi
ngeq
uity
met
hod
USD
7,2
54-
-
-
-
-
Not
e : F
ill in
sepa
rate
ly th
e ba
lanc
es o
f acc
ount
s rec
eiva
ble–
rela
ted
parti
es, n
otes
rece
ivab
le–r
elat
ed p
artie
s, ot
her r
ecei
vabl
es–r
elat
ed p
artie
s, e
tc.
Not
e 1:
Pai
d-in
cap
ital r
efer
red
to h
erei
n is
the
paid
-in c
apita
l of p
aren
t com
pany
.
Ever
gree
n M
arin
e C
orp.
Am
ount
col
lect
edsu
bseq
uent
to th
eba
lanc
e sh
eet d
ate
Allo
wan
ce fo
rdo
ubtfu
l acc
ount
sC
redi
tor
Cou
nter
party
Rel
atio
nshi
p w
ith th
eco
unte
rpar
ty
Bal
ance
as a
tD
ecem
ber 3
1, 2
017
(Not
e)Tu
rnov
er ra
te
Ove
rdue
rece
ivab
les
Ever
gree
n M
arin
e C
orpo
ratio
n (T
aiw
an) L
td.
Rec
eiva
bles
from
rela
ted
parti
es re
achi
ng N
T$10
0 m
illio
n or
20%
of p
aid-
in c
apita
l or m
ore
Dec
embe
r 31,
201
7
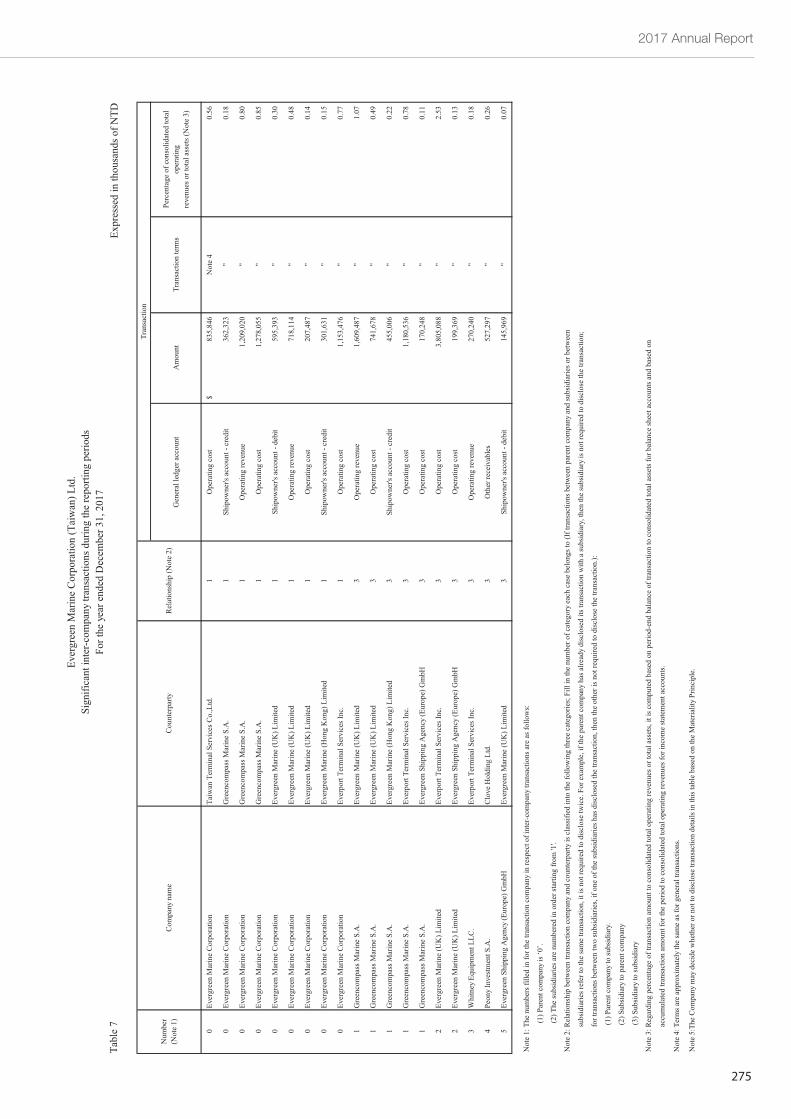
2017 Annual Report
275
Expr
esse
d in
thou
sand
s of N
TD(E
xcep
t as o
ther
wis
e in
dica
ted)
Gen
eral
ledg
er a
ccou
ntA
mou
ntTr
ansa
ctio
n te
rms
Perc
enta
ge o
f con
solid
ated
tota
lop
erat
ing
reve
nues
or t
otal
ass
ets (
Not
e 3)
0Ev
ergr
een
Mar
ine
Cor
pora
tion
Taiw
an T
erm
inal
Ser
vice
s Co.
,Ltd
.1
Ope
ratin
g co
st83
5,84
6$
Not
e 4
0.56
0Ev
ergr
een
Mar
ine
Cor
pora
tion
Gre
enco
mpa
ss M
arin
e S.
A.
1Sh
ipow
ner's
acc
ount
- cr
edit
362,
323
"
0.18
0Ev
ergr
een
Mar
ine
Cor
pora
tion
Gre
enco
mpa
ss M
arin
e S.
A.
1O
pera
ting
reve
nue
1,20
9,02
0
"
0.80
0Ev
ergr
een
Mar
ine
Cor
pora
tion
Gre
enco
mpa
ss M
arin
e S.
A.
1O
pera
ting
cost
1,27
8,05
5
"
0.85
0Ev
ergr
een
Mar
ine
Cor
pora
tion
Ever
gree
n M
arin
e (U
K) L
imite
d1
Ship
owne
r's a
ccou
nt -
debi
t59
5,39
3
"0.
30
0Ev
ergr
een
Mar
ine
Cor
pora
tion
Ever
gree
n M
arin
e (U
K) L
imite
d1
Ope
ratin
g re
venu
e71
8,11
4
"0.
48
0Ev
ergr
een
Mar
ine
Cor
pora
tion
Ever
gree
n M
arin
e (U
K) L
imite
d1
Ope
ratin
g co
st20
7,48
7
"0.
14
0Ev
ergr
een
Mar
ine
Cor
pora
tion
Ever
gree
n M
arin
e (H
ong
Kon
g) L
imite
d1
Ship
owne
r's a
ccou
nt -
cred
it30
1,63
1
"0.
15
0Ev
ergr
een
Mar
ine
Cor
pora
tion
Ever
port
Term
inal
Ser
vice
s Inc
.1
Ope
ratin
g co
st1,
153,
476
"0.
77
1G
reen
com
pass
Mar
ine
S.A
.Ev
ergr
een
Mar
ine
(UK
) Lim
ited
3O
pera
ting
reve
nue
1,60
9,48
7
"
1.07
1G
reen
com
pass
Mar
ine
S.A
.Ev
ergr
een
Mar
ine
(UK
) Lim
ited
3O
pera
ting
cost
741,
678
"
0.49
1G
reen
com
pass
Mar
ine
S.A
.Ev
ergr
een
Mar
ine
(Hon
g K
ong)
Lim
ited
3Sh
ipow
ner's
acc
ount
- cr
edit
455,
006
"
0.22
1G
reen
com
pass
Mar
ine
S.A
.Ev
erpo
rt Te
rmin
al S
ervi
ces I
nc.
3O
pera
ting
cost
1,18
0,53
6
"
0.78
1G
reen
com
pass
Mar
ine
S.A
.Ev
ergr
een
Ship
ping
Age
ncy
(Eur
ope)
Gm
bH3
Ope
ratin
g co
st17
0,24
8
"0.
11
2Ev
ergr
een
Mar
ine
(UK
) Lim
ited
Ever
port
Term
inal
Ser
vice
s Inc
.3
Ope
ratin
g co
st3,
805,
088
"2.
53
2Ev
ergr
een
Mar
ine
(UK
) Lim
ited
Ever
gree
n Sh
ippi
ng A
genc
y (E
urop
e) G
mbH
3O
pera
ting
cost
199,
369
"
0.13
3W
hitn
ey E
quip
men
t LLC
.Ev
erpo
rt Te
rmin
al S
ervi
ces I
nc.
3O
pera
ting
reve
nue
270,
240
"
0.18
4Pe
ony
Inve
stmen
t S.A
.C
love
Hol
ding
Ltd
.3
Oth
er re
ceiv
able
s52
7,29
7
"0.
26
5Ev
ergr
een
Ship
ping
Age
ncy
(Eur
ope)
Gm
bHEv
ergr
een
Mar
ine
(UK
) Lim
ited
3Sh
ipow
ner's
acc
ount
- de
bit
145,
969
"
0.07
Not
e 1:
The
num
bers
fille
d in
for t
he tr
ansa
ctio
n co
mpa
ny in
resp
ect o
f int
er-c
ompa
ny tr
ansa
ctio
ns a
re a
s fol
low
s:
(1
) Par
ent c
ompa
ny is
‘0’.
(2
) The
subs
idia
ries a
re n
umbe
red
in o
rder
star
ting
from
'1'.
Not
e 2:
Rel
atio
nshi
p be
twee
n tra
nsac
tion
com
pany
and
cou
nter
party
is c
lass
ified
into
the
follo
win
g th
ree
cate
gorie
s; Fi
ll in
the
num
ber o
f cat
egor
y ea
ch c
ase
belo
ngs t
o (I
f tra
nsac
tions
bet
wee
n pa
rent
com
pany
and
subs
idia
ries o
r bet
wee
n
subs
idia
ries r
efer
to th
e sa
me
trans
actio
n, it
is n
ot re
quire
d to
dis
clos
e tw
ice.
For
exa
mpl
e, if
the
pare
nt c
ompa
ny h
as a
lread
y di
sclo
sed
its tr
ansa
ctio
n w
ith a
subs
idia
ry, t
hen
the
subs
idia
ry is
not
requ
ired
to d
isclo
se th
e tra
nsac
tion;
for t
rans
actio
ns b
etw
een
two
subs
idia
ries,
if on
e of
the
subs
idia
ries h
as d
iscl
osed
the
trans
actio
n, th
en th
e ot
her i
s not
requ
ired
to d
iscl
ose
the
trans
actio
n.):
(1)
Par
ent c
ompa
ny to
subs
idia
ry.
(2)
Sub
sidia
ry to
par
ent c
ompa
ny
(3)
Sub
sidia
ry to
subs
idia
ry
Not
e 3:
Reg
ardi
ng p
erce
ntag
e of
tran
sact
ion
amou
nt to
con
solid
ated
tota
l ope
ratin
g re
venu
es o
r tot
al a
sset
s, it
is co
mpu
ted
base
d on
per
iod-
end
bala
nce
of tr
ansa
ctio
n to
con
solid
ated
tota
l ass
ets f
or b
alan
ce sh
eet a
ccou
nts a
nd b
ased
on
acc
umul
ated
tran
sact
ion
amou
nt fo
r the
per
iod
to c
onso
lidat
ed to
tal o
pera
ting
reve
nues
for i
ncom
e sta
tem
ent a
ccou
nts.
Not
e 4:
Ter
ms a
re a
ppro
xim
atel
y th
e sa
me
as fo
r gen
eral
tran
sact
ions
.
Not
e 5:
The
Com
pany
may
dec
ide
whe
ther
or n
ot to
dis
clos
e tra
nsac
tion
deta
ils in
this
tabl
e ba
sed
on th
e M
ater
ialit
y Pr
inci
ple.
Num
ber
(Not
e 1)
Com
pany
nam
eC
ount
erpa
rtyR
elat
ions
hip
(Not
e 2)
Tran
sact
ion
Ever
gree
n M
arin
e C
orpo
ratio
n (T
aiw
an) L
td.
Sign
ifica
nt in
ter-c
ompa
ny tr
ansa
ctio
ns d
urin
g th
e re
porti
ng p
erio
dsFo
r the
yea
r end
ed D
ecem
ber 3
1, 2
017
Tabl
e 7
Expr
esse
d in
thou
sand
s of N
TD(E
xcep
t as o
ther
wis
e in
dica
ted)
Gen
eral
ledg
er a
ccou
ntA
mou
ntTr
ansa
ctio
n te
rms
Perc
enta
ge o
f con
solid
ated
tota
lop
erat
ing
reve
nues
or t
otal
ass
ets (
Not
e 3)
0Ev
ergr
een
Mar
ine
Cor
pora
tion
Taiw
an T
erm
inal
Ser
vice
s Co.
,Ltd
.1
Ope
ratin
g co
st83
5,84
6$
Not
e 4
0.56
0Ev
ergr
een
Mar
ine
Cor
pora
tion
Gre
enco
mpa
ss M
arin
e S.
A.
1Sh
ipow
ner's
acc
ount
- cr
edit
362,
323
"
0.18
0Ev
ergr
een
Mar
ine
Cor
pora
tion
Gre
enco
mpa
ss M
arin
e S.
A.
1O
pera
ting
reve
nue
1,20
9,02
0
"
0.80
0Ev
ergr
een
Mar
ine
Cor
pora
tion
Gre
enco
mpa
ss M
arin
e S.
A.
1O
pera
ting
cost
1,27
8,05
5
"
0.85
0Ev
ergr
een
Mar
ine
Cor
pora
tion
Ever
gree
n M
arin
e (U
K) L
imite
d1
Ship
owne
r's a
ccou
nt -
debi
t59
5,39
3
"0.
30
0Ev
ergr
een
Mar
ine
Cor
pora
tion
Ever
gree
n M
arin
e (U
K) L
imite
d1
Ope
ratin
g re
venu
e71
8,11
4
"0.
48
0Ev
ergr
een
Mar
ine
Cor
pora
tion
Ever
gree
n M
arin
e (U
K) L
imite
d1
Ope
ratin
g co
st20
7,48
7
"0.
14
0Ev
ergr
een
Mar
ine
Cor
pora
tion
Ever
gree
n M
arin
e (H
ong
Kon
g) L
imite
d1
Ship
owne
r's a
ccou
nt -
cred
it30
1,63
1
"0.
15
0Ev
ergr
een
Mar
ine
Cor
pora
tion
Ever
port
Term
inal
Ser
vice
s Inc
.1
Ope
ratin
g co
st1,
153,
476
"0.
77
1G
reen
com
pass
Mar
ine
S.A
.Ev
ergr
een
Mar
ine
(UK
) Lim
ited
3O
pera
ting
reve
nue
1,60
9,48
7
"
1.07
1G
reen
com
pass
Mar
ine
S.A
.Ev
ergr
een
Mar
ine
(UK
) Lim
ited
3O
pera
ting
cost
741,
678
"
0.49
1G
reen
com
pass
Mar
ine
S.A
.Ev
ergr
een
Mar
ine
(Hon
g K
ong)
Lim
ited
3Sh
ipow
ner's
acc
ount
- cr
edit
455,
006
"
0.22
1G
reen
com
pass
Mar
ine
S.A
.Ev
erpo
rt Te
rmin
al S
ervi
ces I
nc.
3O
pera
ting
cost
1,18
0,53
6
"
0.78
1G
reen
com
pass
Mar
ine
S.A
.Ev
ergr
een
Ship
ping
Age
ncy
(Eur
ope)
Gm
bH3
Ope
ratin
g co
st17
0,24
8
"0.
11
2Ev
ergr
een
Mar
ine
(UK
) Lim
ited
Ever
port
Term
inal
Ser
vice
s Inc
.3
Ope
ratin
g co
st3,
805,
088
"2.
53
2Ev
ergr
een
Mar
ine
(UK
) Lim
ited
Ever
gree
n Sh
ippi
ng A
genc
y (E
urop
e) G
mbH
3O
pera
ting
cost
199,
369
"
0.13
3W
hitn
ey E
quip
men
t LLC
.Ev
erpo
rt Te
rmin
al S
ervi
ces I
nc.
3O
pera
ting
reve
nue
270,
240
"
0.18
4Pe
ony
Inve
stmen
t S.A
.C
love
Hol
ding
Ltd
.3
Oth
er re
ceiv
able
s52
7,29
7
"0.
26
5Ev
ergr
een
Ship
ping
Age
ncy
(Eur
ope)
Gm
bHEv
ergr
een
Mar
ine
(UK
) Lim
ited
3Sh
ipow
ner's
acc
ount
- de
bit
145,
969
"
0.07
Not
e 1:
The
num
bers
fille
d in
for t
he tr
ansa
ctio
n co
mpa
ny in
resp
ect o
f int
er-c
ompa
ny tr
ansa
ctio
ns a
re a
s fol
low
s:
(1
) Par
ent c
ompa
ny is
‘0’.
(2
) The
subs
idia
ries a
re n
umbe
red
in o
rder
star
ting
from
'1'.
Not
e 2:
Rel
atio
nshi
p be
twee
n tra
nsac
tion
com
pany
and
cou
nter
party
is c
lass
ified
into
the
follo
win
g th
ree
cate
gorie
s; Fi
ll in
the
num
ber o
f cat
egor
y ea
ch c
ase
belo
ngs t
o (I
f tra
nsac
tions
bet
wee
n pa
rent
com
pany
and
subs
idia
ries o
r bet
wee
n
subs
idia
ries r
efer
to th
e sa
me
trans
actio
n, it
is n
ot re
quire
d to
dis
clos
e tw
ice.
For
exa
mpl
e, if
the
pare
nt c
ompa
ny h
as a
lread
y di
sclo
sed
its tr
ansa
ctio
n w
ith a
subs
idia
ry, t
hen
the
subs
idia
ry is
not
requ
ired
to d
iscl
ose
the
trans
actio
n;
for t
rans
actio
ns b
etw
een
two
subs
idia
ries,
if on
e of
the
subs
idia
ries h
as d
iscl
osed
the
trans
actio
n, th
en th
e ot
her i
s not
requ
ired
to d
iscl
ose
the
trans
actio
n.):
(1)
Par
ent c
ompa
ny to
subs
idia
ry.
(2)
Sub
sidia
ry to
par
ent c
ompa
ny
(3)
Sub
sidia
ry to
subs
idia
ry
Not
e 3:
Reg
ardi
ng p
erce
ntag
e of
tran
sact
ion
amou
nt to
con
solid
ated
tota
l ope
ratin
g re
venu
es o
r tot
al a
sset
s, it
is co
mpu
ted
base
d on
per
iod-
end
bala
nce
of tr
ansa
ctio
n to
con
solid
ated
tota
l ass
ets f
or b
alan
ce sh
eet a
ccou
nts a
nd b
ased
on
acc
umul
ated
tran
sact
ion
amou
nt fo
r the
per
iod
to c
onso
lidat
ed to
tal o
pera
ting
reve
nues
for i
ncom
e sta
tem
ent a
ccou
nts.
Not
e 4:
Ter
ms a
re a
ppro
xim
atel
y th
e sa
me
as fo
r gen
eral
tran
sact
ions
.
Not
e 5:
The
Com
pany
may
dec
ide
whe
ther
or n
ot to
dis
clos
e tra
nsac
tion
deta
ils in
this
tabl
e ba
sed
on th
e M
ater
ialit
y Pr
inci
ple.
Num
ber
(Not
e 1)
Com
pany
nam
eC
ount
erpa
rtyR
elat
ions
hip
(Not
e 2)
Tran
sact
ion
Ever
gree
n M
arin
e C
orpo
ratio
n (T
aiw
an) L
td.
Sign
ifica
nt in
ter-c
ompa
ny tr
ansa
ctio
ns d
urin
g th
e re
porti
ng p
erio
dsFo
r the
yea
r end
ed D
ecem
ber 3
1, 2
017
Tabl
e 7
Expr
esse
d in
thou
sand
s of N
TD(E
xcep
t as o
ther
wis
e in
dica
ted)
Gen
eral
ledg
er a
ccou
ntA
mou
ntTr
ansa
ctio
n te
rms
Perc
enta
ge o
f con
solid
ated
tota
lop
erat
ing
reve
nues
or t
otal
ass
ets (
Not
e 3)
0Ev
ergr
een
Mar
ine
Cor
pora
tion
Taiw
an T
erm
inal
Ser
vice
s Co.
,Ltd
.1
Ope
ratin
g co
st83
5,84
6$
Not
e 4
0.56
0Ev
ergr
een
Mar
ine
Cor
pora
tion
Gre
enco
mpa
ss M
arin
e S.
A.
1Sh
ipow
ner's
acc
ount
- cr
edit
362,
323
"
0.18
0Ev
ergr
een
Mar
ine
Cor
pora
tion
Gre
enco
mpa
ss M
arin
e S.
A.
1O
pera
ting
reve
nue
1,20
9,02
0
"
0.80
0Ev
ergr
een
Mar
ine
Cor
pora
tion
Gre
enco
mpa
ss M
arin
e S.
A.
1O
pera
ting
cost
1,27
8,05
5
"
0.85
0Ev
ergr
een
Mar
ine
Cor
pora
tion
Ever
gree
n M
arin
e (U
K) L
imite
d1
Ship
owne
r's a
ccou
nt -
debi
t59
5,39
3
"0.
30
0Ev
ergr
een
Mar
ine
Cor
pora
tion
Ever
gree
n M
arin
e (U
K) L
imite
d1
Ope
ratin
g re
venu
e71
8,11
4
"0.
48
0Ev
ergr
een
Mar
ine
Cor
pora
tion
Ever
gree
n M
arin
e (U
K) L
imite
d1
Ope
ratin
g co
st20
7,48
7
"0.
14
0Ev
ergr
een
Mar
ine
Cor
pora
tion
Ever
gree
n M
arin
e (H
ong
Kon
g) L
imite
d1
Ship
owne
r's a
ccou
nt -
cred
it30
1,63
1
"0.
15
0Ev
ergr
een
Mar
ine
Cor
pora
tion
Ever
port
Term
inal
Ser
vice
s Inc
.1
Ope
ratin
g co
st1,
153,
476
"0.
77
1G
reen
com
pass
Mar
ine
S.A
.Ev
ergr
een
Mar
ine
(UK
) Lim
ited
3O
pera
ting
reve
nue
1,60
9,48
7
"
1.07
1G
reen
com
pass
Mar
ine
S.A
.Ev
ergr
een
Mar
ine
(UK
) Lim
ited
3O
pera
ting
cost
741,
678
"
0.49
1G
reen
com
pass
Mar
ine
S.A
.Ev
ergr
een
Mar
ine
(Hon
g K
ong)
Lim
ited
3Sh
ipow
ner's
acc
ount
- cr
edit
455,
006
"
0.22
1G
reen
com
pass
Mar
ine
S.A
.Ev
erpo
rt Te
rmin
al S
ervi
ces I
nc.
3O
pera
ting
cost
1,18
0,53
6
"
0.78
1G
reen
com
pass
Mar
ine
S.A
.Ev
ergr
een
Ship
ping
Age
ncy
(Eur
ope)
Gm
bH3
Ope
ratin
g co
st17
0,24
8
"0.
11
2Ev
ergr
een
Mar
ine
(UK
) Lim
ited
Ever
port
Term
inal
Ser
vice
s Inc
.3
Ope
ratin
g co
st3,
805,
088
"2.
53
2Ev
ergr
een
Mar
ine
(UK
) Lim
ited
Ever
gree
n Sh
ippi
ng A
genc
y (E
urop
e) G
mbH
3O
pera
ting
cost
199,
369
"
0.13
3W
hitn
ey E
quip
men
t LLC
.Ev
erpo
rt Te
rmin
al S
ervi
ces I
nc.
3O
pera
ting
reve
nue
270,
240
"
0.18
4Pe
ony
Inve
stmen
t S.A
.C
love
Hol
ding
Ltd
.3
Oth
er re
ceiv
able
s52
7,29
7
"0.
26
5Ev
ergr
een
Ship
ping
Age
ncy
(Eur
ope)
Gm
bHEv
ergr
een
Mar
ine
(UK
) Lim
ited
3Sh
ipow
ner's
acc
ount
- de
bit
145,
969
"
0.07
Not
e 1:
The
num
bers
fille
d in
for t
he tr
ansa
ctio
n co
mpa
ny in
resp
ect o
f int
er-c
ompa
ny tr
ansa
ctio
ns a
re a
s fol
low
s:
(1
) Par
ent c
ompa
ny is
‘0’.
(2
) The
subs
idia
ries a
re n
umbe
red
in o
rder
star
ting
from
'1'.
Not
e 2:
Rel
atio
nshi
p be
twee
n tra
nsac
tion
com
pany
and
cou
nter
party
is c
lass
ified
into
the
follo
win
g th
ree
cate
gorie
s; Fi
ll in
the
num
ber o
f cat
egor
y ea
ch c
ase
belo
ngs t
o (I
f tra
nsac
tions
bet
wee
n pa
rent
com
pany
and
subs
idia
ries o
r bet
wee
n
subs
idia
ries r
efer
to th
e sa
me
trans
actio
n, it
is n
ot re
quire
d to
dis
clos
e tw
ice.
For
exa
mpl
e, if
the
pare
nt c
ompa
ny h
as a
lread
y di
sclo
sed
its tr
ansa
ctio
n w
ith a
subs
idia
ry, t
hen
the
subs
idia
ry is
not
requ
ired
to d
isclo
se th
e tra
nsac
tion;
for t
rans
actio
ns b
etw
een
two
subs
idia
ries,
if on
e of
the
subs
idia
ries h
as d
iscl
osed
the
trans
actio
n, th
en th
e ot
her i
s not
requ
ired
to d
iscl
ose
the
trans
actio
n.):
(1)
Par
ent c
ompa
ny to
subs
idia
ry.
(2)
Sub
sidia
ry to
par
ent c
ompa
ny
(3)
Sub
sidia
ry to
subs
idia
ry
Not
e 3:
Reg
ardi
ng p
erce
ntag
e of
tran
sact
ion
amou
nt to
con
solid
ated
tota
l ope
ratin
g re
venu
es o
r tot
al a
sset
s, it
is co
mpu
ted
base
d on
per
iod-
end
bala
nce
of tr
ansa
ctio
n to
con
solid
ated
tota
l ass
ets f
or b
alan
ce sh
eet a
ccou
nts a
nd b
ased
on
acc
umul
ated
tran
sact
ion
amou
nt fo
r the
per
iod
to c
onso
lidat
ed to
tal o
pera
ting
reve
nues
for i
ncom
e sta
tem
ent a
ccou
nts.
Not
e 4:
Ter
ms a
re a
ppro
xim
atel
y th
e sa
me
as fo
r gen
eral
tran
sact
ions
.
Not
e 5:
The
Com
pany
may
dec
ide
whe
ther
or n
ot to
dis
clos
e tra
nsac
tion
deta
ils in
this
tabl
e ba
sed
on th
e M
ater
ialit
y Pr
inci
ple.
Num
ber
(Not
e 1)
Com
pany
nam
eC
ount
erpa
rtyR
elat
ions
hip
(Not
e 2)
Tran
sact
ion
Ever
gree
n M
arin
e C
orpo
ratio
n (T
aiw
an) L
td.
Sign
ifica
nt in
ter-c
ompa
ny tr
ansa
ctio
ns d
urin
g th
e re
porti
ng p
erio
dsFo
r the
yea
r end
ed D
ecem
ber 3
1, 2
017
Tabl
e 7
Expr
esse
d in
thou
sand
s of N
TD(E
xcep
t as o
ther
wis
e in
dica
ted)
Gen
eral
ledg
er a
ccou
ntA
mou
ntTr
ansa
ctio
n te
rms
Perc
enta
ge o
f con
solid
ated
tota
lop
erat
ing
reve
nues
or t
otal
ass
ets (
Not
e 3)
0Ev
ergr
een
Mar
ine
Cor
pora
tion
Taiw
an T
erm
inal
Ser
vice
s Co.
,Ltd
.1
Ope
ratin
g co
st83
5,84
6$
Not
e 4
0.56
0Ev
ergr
een
Mar
ine
Cor
pora
tion
Gre
enco
mpa
ss M
arin
e S.
A.
1Sh
ipow
ner's
acc
ount
- cr
edit
362,
323
"
0.18
0Ev
ergr
een
Mar
ine
Cor
pora
tion
Gre
enco
mpa
ss M
arin
e S.
A.
1O
pera
ting
reve
nue
1,20
9,02
0
"
0.80
0Ev
ergr
een
Mar
ine
Cor
pora
tion
Gre
enco
mpa
ss M
arin
e S.
A.
1O
pera
ting
cost
1,27
8,05
5
"
0.85
0Ev
ergr
een
Mar
ine
Cor
pora
tion
Ever
gree
n M
arin
e (U
K) L
imite
d1
Ship
owne
r's a
ccou
nt -
debi
t59
5,39
3
"0.
30
0Ev
ergr
een
Mar
ine
Cor
pora
tion
Ever
gree
n M
arin
e (U
K) L
imite
d1
Ope
ratin
g re
venu
e71
8,11
4
"0.
48
0Ev
ergr
een
Mar
ine
Cor
pora
tion
Ever
gree
n M
arin
e (U
K) L
imite
d1
Ope
ratin
g co
st20
7,48
7
"0.
14
0Ev
ergr
een
Mar
ine
Cor
pora
tion
Ever
gree
n M
arin
e (H
ong
Kon
g) L
imite
d1
Ship
owne
r's a
ccou
nt -
cred
it30
1,63
1
"0.
15
0Ev
ergr
een
Mar
ine
Cor
pora
tion
Ever
port
Term
inal
Ser
vice
s Inc
.1
Ope
ratin
g co
st1,
153,
476
"0.
77
1G
reen
com
pass
Mar
ine
S.A
.Ev
ergr
een
Mar
ine
(UK
) Lim
ited
3O
pera
ting
reve
nue
1,60
9,48
7
"
1.07
1G
reen
com
pass
Mar
ine
S.A
.Ev
ergr
een
Mar
ine
(UK
) Lim
ited
3O
pera
ting
cost
741,
678
"
0.49
1G
reen
com
pass
Mar
ine
S.A
.Ev
ergr
een
Mar
ine
(Hon
g K
ong)
Lim
ited
3Sh
ipow
ner's
acc
ount
- cr
edit
455,
006
"
0.22
1G
reen
com
pass
Mar
ine
S.A
.Ev
erpo
rt Te
rmin
al S
ervi
ces I
nc.
3O
pera
ting
cost
1,18
0,53
6
"
0.78
1G
reen
com
pass
Mar
ine
S.A
.Ev
ergr
een
Ship
ping
Age
ncy
(Eur
ope)
Gm
bH3
Ope
ratin
g co
st17
0,24
8
"0.
11
2Ev
ergr
een
Mar
ine
(UK
) Lim
ited
Ever
port
Term
inal
Ser
vice
s Inc
.3
Ope
ratin
g co
st3,
805,
088
"2.
53
2Ev
ergr
een
Mar
ine
(UK
) Lim
ited
Ever
gree
n Sh
ippi
ng A
genc
y (E
urop
e) G
mbH
3O
pera
ting
cost
199,
369
"
0.13
3W
hitn
ey E
quip
men
t LLC
.Ev
erpo
rt Te
rmin
al S
ervi
ces I
nc.
3O
pera
ting
reve
nue
270,
240
"
0.18
4Pe
ony
Inve
stmen
t S.A
.C
love
Hol
ding
Ltd
.3
Oth
er re
ceiv
able
s52
7,29
7
"0.
26
5Ev
ergr
een
Ship
ping
Age
ncy
(Eur
ope)
Gm
bHEv
ergr
een
Mar
ine
(UK
) Lim
ited
3Sh
ipow
ner's
acc
ount
- de
bit
145,
969
"
0.07
Not
e 1:
The
num
bers
fille
d in
for t
he tr
ansa
ctio
n co
mpa
ny in
resp
ect o
f int
er-c
ompa
ny tr
ansa
ctio
ns a
re a
s fol
low
s:
(1
) Par
ent c
ompa
ny is
‘0’.
(2
) The
subs
idia
ries a
re n
umbe
red
in o
rder
star
ting
from
'1'.
Not
e 2:
Rel
atio
nshi
p be
twee
n tra
nsac
tion
com
pany
and
cou
nter
party
is c
lass
ified
into
the
follo
win
g th
ree
cate
gorie
s; Fi
ll in
the
num
ber o
f cat
egor
y ea
ch c
ase
belo
ngs t
o (I
f tra
nsac
tions
bet
wee
n pa
rent
com
pany
and
subs
idia
ries o
r bet
wee
n
subs
idia
ries r
efer
to th
e sa
me
trans
actio
n, it
is n
ot re
quire
d to
dis
clos
e tw
ice.
For
exa
mpl
e, if
the
pare
nt c
ompa
ny h
as a
lread
y di
sclo
sed
its tr
ansa
ctio
n w
ith a
subs
idia
ry, t
hen
the
subs
idia
ry is
not
requ
ired
to d
isclo
se th
e tra
nsac
tion;
for t
rans
actio
ns b
etw
een
two
subs
idia
ries,
if on
e of
the
subs
idia
ries h
as d
iscl
osed
the
trans
actio
n, th
en th
e ot
her i
s not
requ
ired
to d
iscl
ose
the
trans
actio
n.):
(1)
Par
ent c
ompa
ny to
subs
idia
ry.
(2)
Sub
sidia
ry to
par
ent c
ompa
ny
(3)
Sub
sidia
ry to
subs
idia
ry
Not
e 3:
Reg
ardi
ng p
erce
ntag
e of
tran
sact
ion
amou
nt to
con
solid
ated
tota
l ope
ratin
g re
venu
es o
r tot
al a
sset
s, it
is co
mpu
ted
base
d on
per
iod-
end
bala
nce
of tr
ansa
ctio
n to
con
solid
ated
tota
l ass
ets f
or b
alan
ce sh
eet a
ccou
nts a
nd b
ased
on
acc
umul
ated
tran
sact
ion
amou
nt fo
r the
per
iod
to c
onso
lidat
ed to
tal o
pera
ting
reve
nues
for i
ncom
e sta
tem
ent a
ccou
nts.
Not
e 4:
Ter
ms a
re a
ppro
xim
atel
y th
e sa
me
as fo
r gen
eral
tran
sact
ions
.
Not
e 5:
The
Com
pany
may
dec
ide
whe
ther
or n
ot to
dis
clos
e tra
nsac
tion
deta
ils in
this
tabl
e ba
sed
on th
e M
ater
ialit
y Pr
inci
ple.
Num
ber
(Not
e 1)
Com
pany
nam
eC
ount
erpa
rtyR
elat
ions
hip
(Not
e 2)
Tran
sact
ion
Ever
gree
n M
arin
e C
orpo
ratio
n (T
aiw
an) L
td.
Sign
ifica
nt in
ter-c
ompa
ny tr
ansa
ctio
ns d
urin
g th
e re
porti
ng p
erio
dsFo
r the
yea
r end
ed D
ecem
ber 3
1, 2
017
Tabl
e 7
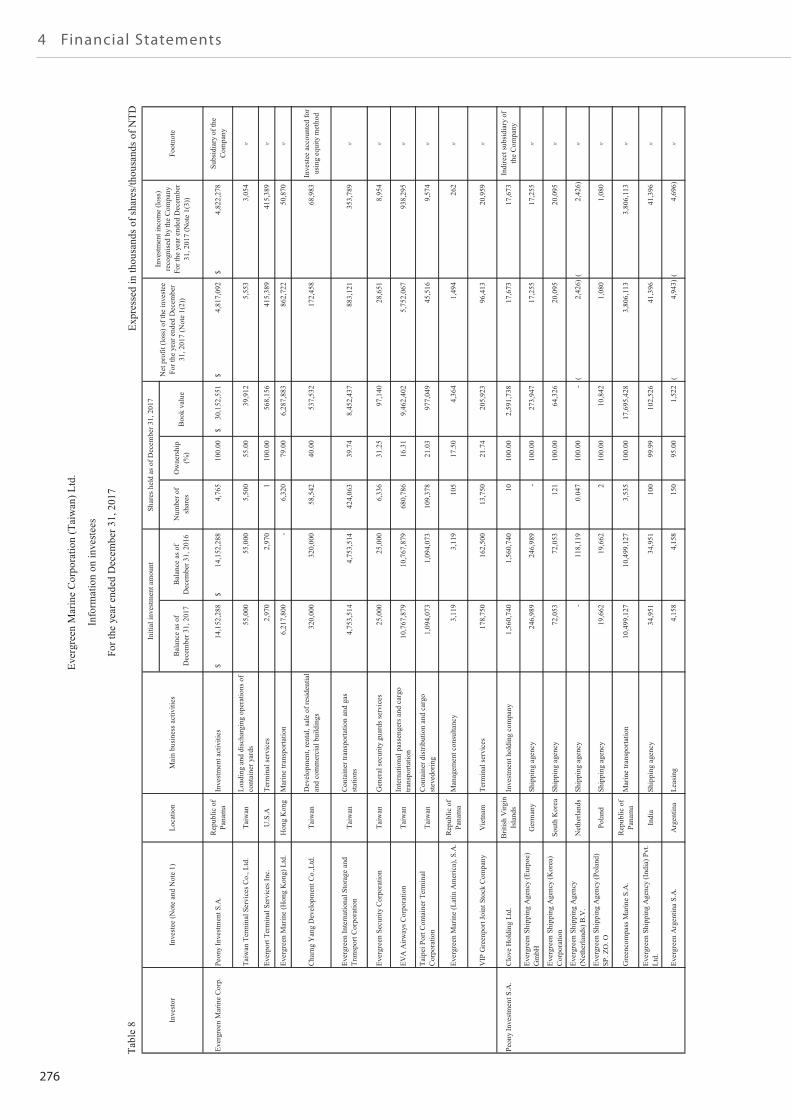
276
4 Financial Statements
Expr
esse
d in
thou
sand
s of s
hare
s/th
ousa
nds o
f NTD
Bal
ance
as o
fD
ecem
ber 3
1, 2
017
Bal
ance
as o
fD
ecem
ber 3
1, 2
016
Num
ber o
fsh
ares
Ow
ners
hip
(%)
Boo
k va
lue
Ever
gree
n M
arin
e C
orp.
Peon
y In
vest
men
t S.A
.R
epub
lic o
fPa
nam
aIn
vest
men
t act
iviti
es14
,152
,288
$
14,1
52,2
88$
4,
765
10
0.00
30,1
52,5
51$
4,81
7,09
2$
4,
822,
278
$
Su
bsid
iary
of t
heC
ompa
ny
Taiw
an T
erm
inal
Ser
vice
s Co.
, Ltd
.Ta
iwan
Load
ing
and
disc
harg
ing
oper
atio
ns o
fco
ntai
ner y
ards
55,0
00
55
,000
5,50
0
55.0
039
,912
5,
553
3,05
4
Ever
port
Term
inal
Ser
vice
s Inc
.U
.S.A
Term
inal
serv
ices
2,97
0
2,97
0
1
100.
0056
8,15
6
41
5,38
9
415,
389
Ever
gree
n M
arin
e (H
ong
Kon
g) L
td.
Hon
g K
ong
Mar
ine
trans
porta
tion
6,21
7,80
0
-
6,
320
79
.00
6,28
7,88
3
862,
722
50
,870
Cha
rng
Yan
g D
evel
opm
ent C
o.,L
td.
Taiw
anD
evel
opm
ent,
rent
al, s
ale
of re
side
ntia
lan
d co
mm
erci
al b
uild
ings
320,
000
32
0,00
0
58,5
42
40
.00
537,
532
172,
458
68
,983
In
vest
ee a
ccou
nted
for
usin
g eq
uity
met
hod
Ever
gree
n In
tern
atio
nal S
tora
ge a
ndTr
ansp
ort C
orpo
ratio
nTa
iwan
Con
tain
er tr
ansp
orta
tion
and
gas
stat
ions
4,75
3,51
4
4,
753,
514
424,
063
39
.74
8,45
2,43
7
883,
121
35
3,78
9
Ever
gree
n Se
curit
y C
orpo
ratio
nTa
iwan
Gen
eral
secu
rity
guar
ds se
rvic
es25
,000
25,0
00
6,
336
31
.25
97,1
40
28,6
51
8,95
4
EVA
Airw
ays C
orpo
ratio
nTa
iwan
Inte
rnat
iona
l pas
seng
ers a
nd c
argo
trans
porta
tion
10,7
67,8
79
10
,767
,879
680,
786
16
.31
9,46
2,40
2
5,75
2,06
7
93
8,29
5
Taip
ei P
ort C
onta
iner
Ter
min
alC
orpo
ratio
nTa
iwan
Con
tain
er d
istri
butio
n an
d ca
rgo
stev
edor
ing
1,09
4,07
3
1,
094,
073
109,
378
21
.03
977,
049
45,5
16
9,57
4
Ever
gree
n M
arin
e (L
atin
Am
eric
a), S
.A.
Rep
ublic
of
Pana
ma
Man
agem
ent c
onsu
ltanc
y3,
119
3,
119
10
5
17
.50
4,36
4
1,
494
262
VIP
Gre
enpo
rt Jo
int S
tock
Com
pany
Vie
tnam
Term
inal
serv
ices
178,
750
16
2,50
0
13,7
50
21
.74
205,
923
96,4
13
20,9
59
Peon
y In
vest
men
t S.A
.C
love
Hol
ding
Ltd
.B
ritis
h V
irgin
Isla
nds
Inve
stm
ent h
oldi
ng c
ompa
ny1,
560,
740
1,56
0,74
0
10
100.
002,
591,
738
17
,673
17
,673
In
dire
ct su
bsid
iary
of
the
Com
pany
Ever
gree
n Sh
ippi
ng A
genc
y (E
urpo
e)G
mbH
Ger
man
ySh
ippi
ng a
genc
y24
6,98
9
246,
989
-
10
0.00
273,
947
17,2
55
17,2
55
Ever
gree
n Sh
ippi
ng A
genc
y (K
orea
)C
orpo
ratio
nSo
uth
Kor
eaSh
ippi
ng a
genc
y72
,053
72,0
53
12
1
10
0.00
64,3
26
20,0
95
20,0
95
Ever
gree
n Sh
ippi
ng A
genc
y(N
ethe
rland
s) B
.V.
Net
herla
nds
Ship
ping
age
ncy
-
118,
119
0.
047
10
0.00
-
2,
426)
(
2,42
6)(
Ever
gree
n Sh
ippi
ng A
genc
y (P
olan
d)SP
. ZO
. OPo
land
Ship
ping
age
ncy
19,6
62
19
,662
2
100.
0010
,842
1,
080
1,08
0
Gre
enco
mpa
ss M
arin
e S.
A.
Rep
ublic
of
Pana
ma
Mar
ine
trans
porta
tion
10,4
99,1
27
10
,499
,127
3,53
5
100.
0017
,695
,428
3,
806,
113
3,80
6,11
3
Ever
gree
n Sh
ippi
ng A
genc
y (I
ndia
) Pvt
.Lt
d.In
dia
Ship
ping
age
ncy
34,9
51
34
,951
100
99.9
910
2,52
6
41
,396
41
,396
Ever
gree
n A
rgen
tina
S.A
.A
rgen
tina
Leas
ing
4,15
8
4,15
8
150
95.0
01,
522
4,94
3)(
4,
696)
(
Net
pro
fit (l
oss)
of t
he in
vest
eeFo
r the
yea
r end
ed D
ecem
ber
31, 2
017
(Not
e 1(
2))
Inve
stm
ent i
ncom
e (lo
ss)
reco
gnis
ed b
y th
e C
ompa
nyFo
r the
yea
r end
ed D
ecem
ber
31, 2
017
(Not
e 1(
3))
Foot
note
Inve
stor
Inve
stee
(Not
e an
d N
ote
1)Lo
catio
nM
ain
busi
ness
act
iviti
es
Initi
al in
vest
men
t am
ount
Sh
ares
hel
d as
of D
ecem
ber 3
1, 2
017
Info
rmat
ion
on in
vest
ees
For t
he y
ear e
nded
Dec
embe
r 31,
201
7
Tabl
e 8
Ever
gree
n M
arin
e C
orpo
ratio
n (T
aiw
an) L
td.
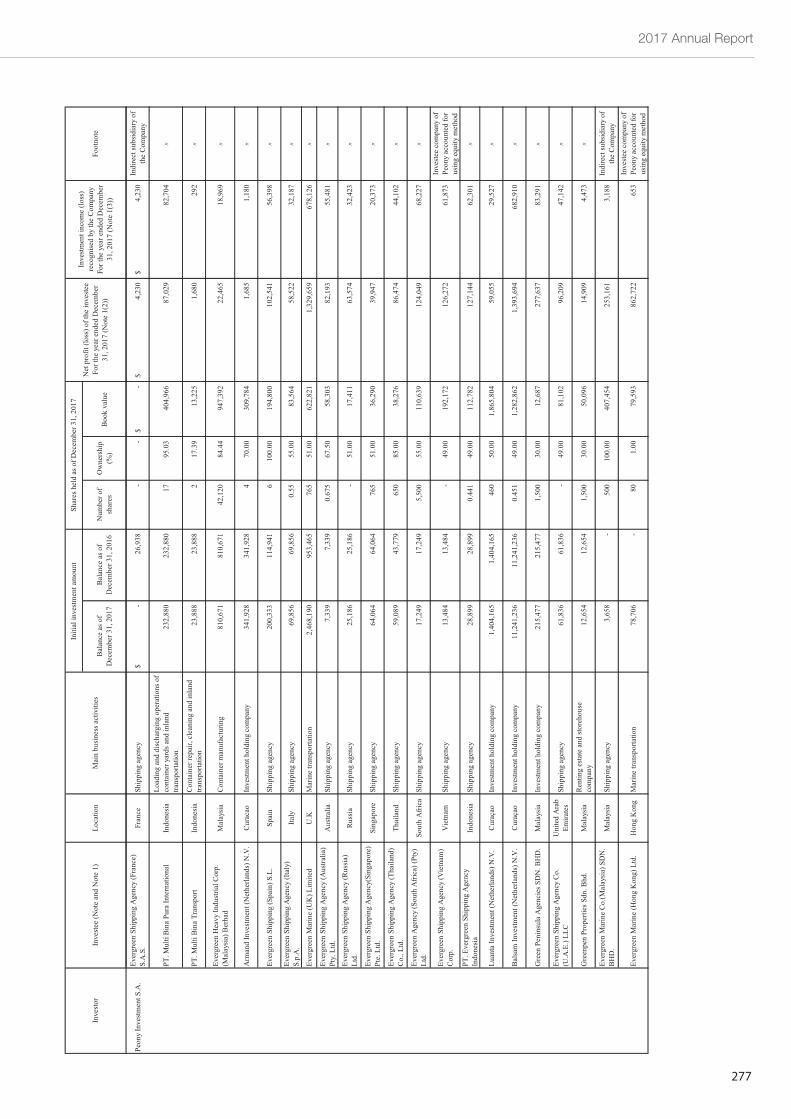
2017 Annual Report
277
Bal
ance
as o
fD
ecem
ber 3
1, 2
017
Bal
ance
as o
fD
ecem
ber 3
1, 2
016
Num
ber o
fsh
ares
Ow
ners
hip
(%)
Boo
k va
lue
Net
pro
fit (l
oss)
of t
he in
vest
eeFo
r the
yea
r end
ed D
ecem
ber
31, 2
017
(Not
e 1(
2))
Inve
stm
ent i
ncom
e (lo
ss)
reco
gnis
ed b
y th
e C
ompa
nyFo
r the
yea
r end
ed D
ecem
ber
31, 2
017
(Not
e 1(
3))
Foot
note
Inve
stor
Inve
stee
(Not
e an
d N
ote
1)Lo
catio
nM
ain
busi
ness
act
iviti
es
Initi
al in
vest
men
t am
ount
Sh
ares
hel
d as
of D
ecem
ber 3
1, 2
017
Peon
y In
vest
men
t S.A
.Ev
ergr
een
Ship
ping
Age
ncy
(Fra
nce)
S.A
.S.
Fran
ceSh
ippi
ng a
genc
y-
$
26
,938
-
-
-
$
4,23
0$
4,
230
$
In
dire
ct su
bsid
iary
of
the
Com
pany
PT. M
ulti
Bin
a Pu
ra In
tern
atio
nal
Indo
nesi
aLo
adin
g an
d di
scha
rgin
g op
erat
ions
of
cont
aine
r yar
ds a
nd in
land
trans
porta
tion
232,
880
23
2,88
0
17
95
.03
404,
966
87,0
29
82,7
04
PT. M
ulti
Bin
a Tr
ansp
ort
Indo
nesi
aC
onta
iner
repa
ir, c
lean
ing
and
inla
ndtra
nspo
rtatio
n23
,888
23,8
88
2
17
.39
13,2
25
1,68
0
29
2
Ever
gree
n H
eavy
Indu
stria
l Cor
p.(M
alay
sia)
Ber
had
Mal
aysi
aC
onta
iner
man
ufac
turin
g81
0,67
1
810,
671
42
,120
84.4
494
7,39
2
22
,465
18
,969
Arm
and
Inve
stm
ent (
Net
herla
nds)
N.V
.C
urac
aoIn
vest
men
t hol
ding
com
pany
341,
928
34
1,92
8
4
70.0
030
9,78
4
1,
685
1,18
0
Ever
gree
n Sh
ippi
ng (S
pain
) S.L
.Sp
ain
Ship
ping
age
ncy
200,
333
11
4,94
1
6
100.
0019
4,80
0
10
2,54
1
56,3
98
Ever
gree
n Sh
ippi
ng A
genc
y (I
taly
)S.
p.A
.Ita
lySh
ippi
ng a
genc
y69
,856
69,8
56
0.
55
55.0
083
,564
58
,522
32
,187
Ever
gree
n M
arin
e (U
K) L
imite
dU
.KM
arin
e tra
nspo
rtatio
n2,
468,
190
953,
465
76
5
51
.00
622,
821
1,32
9,65
9
67
8,12
6
Ever
gree
n Sh
ippi
ng A
genc
y (A
ustra
lia)
Pty.
Ltd
.A
ustra
liaSh
ippi
ng a
genc
y7,
339
7,
339
0.
675
67
.50
58,3
03
82,1
93
55,4
81
Ever
gree
n Sh
ippi
ng A
genc
y (R
ussi
a)Lt
d.R
ussi
aSh
ippi
ng a
genc
y25
,186
25,1
86
-
51
.00
17,4
11
63,5
74
32,4
23
Ever
gree
n Sh
ippi
ng A
genc
y(Si
ngap
ore)
Pte.
Ltd
.Si
ngap
ore
Ship
ping
age
ncy
64,0
64
64
,064
765
51.0
036
,290
39
,947
20
,373
Ever
gree
n Sh
ippi
ng A
genc
y (T
haila
nd)
Co.
, Ltd
.Th
aila
ndSh
ippi
ng a
genc
y59
,089
43,7
79
65
0
85
.00
38,2
76
86,4
74
44,1
02
Ever
gree
n A
genc
y (S
outh
Afri
ca) (
Pty)
Ltd.
Sout
h A
frica
Ship
ping
age
ncy
17,2
49
17
,249
5,50
0
55.0
011
0,63
9
12
4,04
9
68,2
27
Ever
gree
n Sh
ippi
ng A
genc
y (V
ietn
am)
Cor
p.V
ietn
amSh
ippi
ng a
genc
y13
,484
13,4
84
-
49
.00
192,
172
126,
272
61
,873
In
vest
ee c
ompa
ny o
fPe
ony
acco
unte
d fo
rus
ing
equi
ty m
etho
dPT
. Eve
rgre
en S
hipp
ing
Age
ncy
Indo
nesi
aIn
done
sia
Ship
ping
age
ncy
28,8
99
28
,899
0.44
1
49.0
011
2,78
2
12
7,14
4
62,3
01
Luan
ta In
vest
men
t (N
ethe
rland
s) N
.V.
Cur
açao
Inve
stm
ent h
oldi
ng c
ompa
ny1,
404,
165
1,40
4,16
5
46
0
50
.00
1,86
5,80
4
59,0
55
29,5
27
Bal
sam
Inve
stm
ent (
Net
herla
nds)
N.V
.C
uraç
aoIn
vest
men
t hol
ding
com
pany
11,2
41,2
36
11
,241
,236
0.45
1
49.0
01,
282,
862
1,
393,
694
682,
910
Gre
en P
enin
sula
Age
ncie
s SD
N. B
HD
.M
alay
sia
Inve
stm
ent h
oldi
ng c
ompa
ny21
5,47
7
215,
477
1,
500
30
.00
12,6
87
277,
637
83
,291
Ever
gree
n Sh
ippi
ng A
genc
y C
o.(U
.A.E
.) LL
CU
nite
d A
rab
Emira
tes
Ship
ping
age
ncy
61,8
36
61
,836
-
49.0
081
,102
96
,209
47
,142
Gre
enpe
n Pr
oper
ties S
dn. B
hd.
Mal
aysi
aR
entin
g es
tate
and
stor
ehou
seco
mpa
ny12
,654
12,6
54
1,
500
30
.00
50,0
96
14,9
09
4,47
3
Ever
gree
n M
arin
e C
o.(M
alay
sia)
SD
N.
BH
D.
Mal
aysi
aSh
ippi
ng a
genc
y3,
658
-
50
0
10
0.00
407,
454
253,
161
3,
188
In
dire
ct su
bsid
iary
of
the
Com
pany
Ever
gree
n M
arin
e (H
ong
Kon
g) L
td.
Hon
g K
ong
Mar
ine
trans
porta
tion
78,7
06
-
80
1.00
79,5
93
862,
722
65
3
In
vest
ee c
ompa
ny o
fPe
ony
acco
unte
d fo
rus
ing
equi
ty m
etho
d
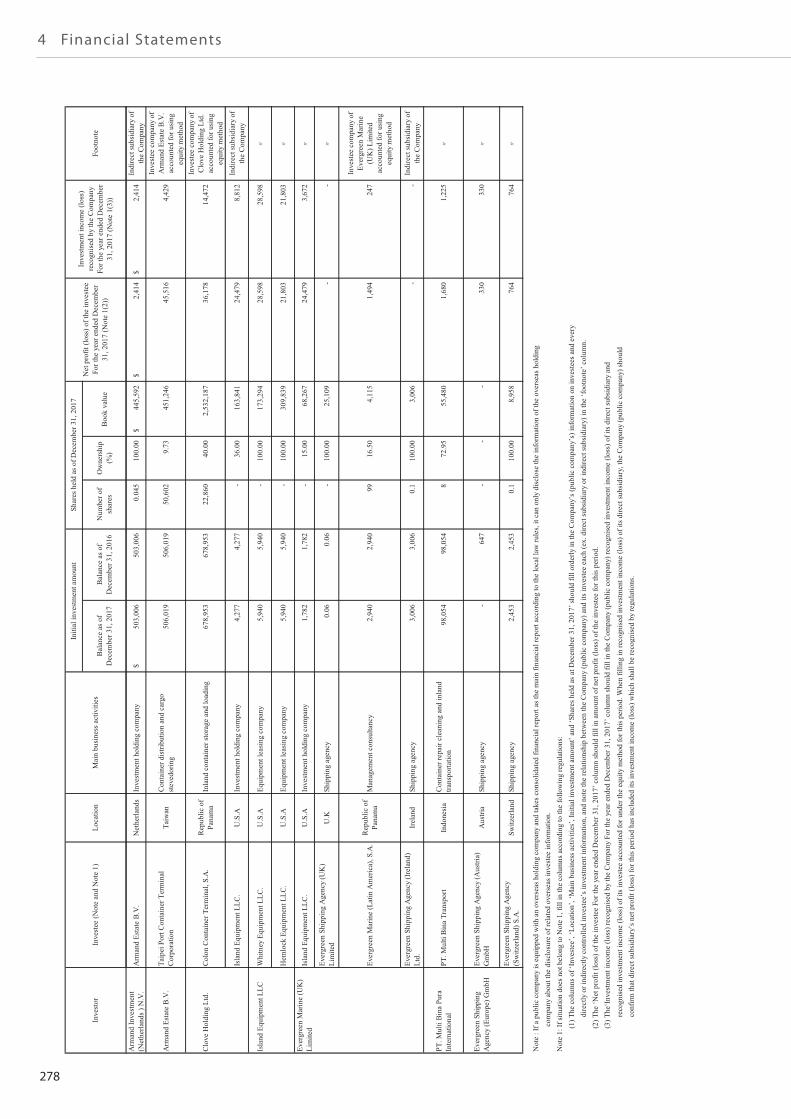
278
4 Financial Statements
Bal
ance
as o
fD
ecem
ber 3
1, 2
017
Bal
ance
as o
fD
ecem
ber 3
1, 2
016
Num
ber o
fsh
ares
Ow
ners
hip
(%)
Boo
k va
lue
Net
pro
fit (l
oss)
of t
he in
vest
eeFo
r the
yea
r end
ed D
ecem
ber
31, 2
017
(Not
e 1(
2))
Inve
stm
ent i
ncom
e (lo
ss)
reco
gnis
ed b
y th
e C
ompa
nyFo
r the
yea
r end
ed D
ecem
ber
31, 2
017
(Not
e 1(
3))
Foot
note
Inve
stor
Inve
stee
(Not
e an
d N
ote
1)Lo
catio
nM
ain
busi
ness
act
iviti
es
Initi
al in
vest
men
t am
ount
Sh
ares
hel
d as
of D
ecem
ber 3
1, 2
017
Arm
and
Inve
stm
ent
(Net
herla
nds )
N.V
.A
rman
d Es
tate
B.V
.N
ethe
rland
sIn
vest
men
t hol
ding
com
pany
503,
006
$
50
3,00
6
0.04
5
100.
0044
5,59
2$
2,
414
$
2,41
4$
Indi
rect
subs
idia
ry o
fth
e C
ompa
ny
Arm
and
Esta
te B
.V.
Taip
ei P
ort C
onta
iner
Ter
min
alC
orpo
ratio
nTa
iwan
Con
tain
er d
istri
butio
n an
d ca
rgo
stev
edor
ing
506,
019
50
6,01
9
50,6
02
9.
7345
1,24
6
45
,516
4,
429
Inve
stee
com
pany
of
Arm
and
Esta
te B
.V.
acco
unte
d fo
r usi
ngeq
uity
met
hod
Clo
ve H
oldi
ng L
td.
Col
on C
onta
iner
Ter
min
al, S
.A.
Rep
ublic
of
Pana
ma
Inla
nd c
onta
iner
stor
age
and
load
ing
678,
953
67
8,95
3
22,8
60
40
.00
2,53
2,18
7
36,1
78
14,4
72
Inve
stee
com
pany
of
Clo
ve H
oldi
ng L
td.
acco
unte
d fo
r usi
ngeq
uity
met
hod
Isla
nd E
quip
men
t LLC
.U
.S.A
Inve
stm
ent h
oldi
ng c
ompa
ny4,
277
4,
277
-
36
.00
163,
841
24,4
79
8,81
2
Indi
rect
subs
idia
ry o
fth
e C
ompa
ny
Isla
nd E
quip
men
t LLC
Whi
tney
Equ
ipm
ent L
LC.
U.S
.AEq
uipm
ent l
easi
ng c
ompa
ny5,
940
5,
940
-
10
0.00
173,
294
28,5
98
28,5
98
Hem
lock
Equ
ipm
ent L
LC.
U.S
.AEq
uipm
ent l
easi
ng c
ompa
ny5,
940
5,
940
-
10
0.00
309,
839
21,8
03
21,8
03
Ever
gree
n M
arin
e (U
K)
Lim
ited
Isla
nd E
quip
men
t LLC
.U
.S.A
Inve
stm
ent h
oldi
ng c
ompa
ny1,
782
1,
782
-
15
.00
68,2
67
24,4
79
3,67
2
Ever
gree
n Sh
ippi
ng A
genc
y (U
K)
Lim
ited
U.K
Ship
ping
age
ncy
0.06
0.
06
-
100.
0025
,109
-
-
Ever
gree
n M
arin
e (L
atin
Am
eric
a), S
.A.
Rep
ublic
of
Pana
ma
Man
agem
ent c
onsu
ltanc
y2,
940
2,
940
99
16.5
04,
115
1,49
4
24
7
Inve
stee
com
pany
of
Ever
gree
n M
arin
e(U
K) L
imite
dac
coun
ted
for u
sing
equi
ty m
etho
d
Ever
gree
n Sh
ippi
ng A
genc
y (I
rela
nd)
Ltd.
Irel
and
Ship
ping
age
ncy
3,00
6
3,00
6
0.1
100.
003,
006
-
-
In
dire
ct su
bsid
iary
of
the
Com
pany
PT. M
ulti
Bin
a Pu
raIn
tern
atio
nal
PT. M
ulti
Bin
a Tr
ansp
ort
Indo
nesi
aC
onta
iner
repa
ir cl
eani
ng a
nd in
land
trans
porta
tion
98,0
54
98
,054
8
72.9
555
,480
1,
680
1,22
5
Ever
gree
n Sh
ippi
ngA
genc
y (E
urop
e) G
mbH
Ever
gree
n Sh
ippi
ng A
genc
y (A
ustri
a)G
mbH
Aus
tria
Ship
ping
age
ncy
-
647
-
-
-
330
33
0
Ever
gree
n Sh
ippi
ng A
genc
y(S
witz
erla
nd) S
.A.
Switz
erla
ndSh
ippi
ng a
genc
y2,
453
2,
453
0.
1
10
0.00
8,95
8
76
4
764
Not
e : I
f a p
ublic
com
pany
is e
quip
ped
with
an
over
seas
hol
ding
com
pany
and
take
s con
solid
ated
fina
ncia
l rep
ort a
s the
mai
n fin
anci
al re
port
acco
rdin
g to
the
loca
l law
rule
s, it
can
only
dis
clos
e th
e in
form
atio
n of
the
over
seas
hol
ding
com
pany
abo
ut th
e di
sclo
sure
of r
elat
ed o
vers
eas i
nves
tee
info
rmat
ion.
Not
e 1:
If si
tuat
ion
does
not
bel
ong
to N
ote
1, fi
ll in
the
colu
mns
acc
ordi
ng to
the
follo
win
g re
gula
tions
:
(1
) The
col
umns
of ‘
Inve
stee
’, ‘L
ocat
ion’
, ‘M
ain
busi
ness
act
iviti
es’,
Initi
al in
vest
men
t am
ount
’ and
‘Sha
res h
eld
as a
t Dec
embe
r 31,
201
7’ sh
ould
fill
orde
rly in
the
Com
pany
’s (p
ublic
com
pany
’s) i
nfor
mat
ion
on in
vest
ees a
nd e
very
dire
ctly
or i
ndire
ctly
con
trolle
d in
vest
ee’s
inve
stm
ent i
nfor
mat
ion,
and
not
e th
e re
latio
nshi
p be
twee
n th
e C
ompa
ny (p
ublic
com
pany
) and
its i
nves
tee
each
(ex.
dire
ct su
bsid
iary
or i
ndire
ct su
bsid
iary
) in
the
‘foot
note
’ col
umn.
(2) T
he ‘N
et p
rofit
(los
s) o
f the
inve
stee
For
the
year
end
ed D
ecem
ber 3
1, 2
017’
col
umn
shou
ld fi
ll in
am
ount
of n
et p
rofit
(los
s) o
f the
inve
stee
for t
his p
erio
d.
(3
) The
‘Inv
estm
ent i
ncom
e (lo
ss) r
ecog
nise
d by
the
Com
pany
For
the
year
end
ed D
ecem
ber 3
1, 2
017’
col
umn
shou
ld fi
ll in
the
Com
pany
(pub
lic c
ompa
ny) r
ecog
nise
d in
vest
men
t inc
ome
(loss
) of i
ts d
irect
subs
idia
ry a
nd
reco
gnis
ed in
vest
men
t inc
ome
(loss
) of i
ts in
vest
ee a
ccou
nted
for u
nder
the
equi
ty m
etho
d fo
r thi
s per
iod.
Whe
n fil
ling
in re
cogn
ised
inve
stm
ent i
ncom
e (lo
ss) o
f its
dire
ct su
bsid
iary
, the
Com
pany
(pub
lic c
ompa
ny) s
houl
d
co
nfirm
that
dire
ct su
bsid
iary
’s n
et p
rofit
(los
s) fo
r thi
s per
iod
has i
nclu
ded
its in
vest
men
t inc
ome
(loss
) whi
ch sh
all b
e re
cogn
ised
by
regu
latio
ns.
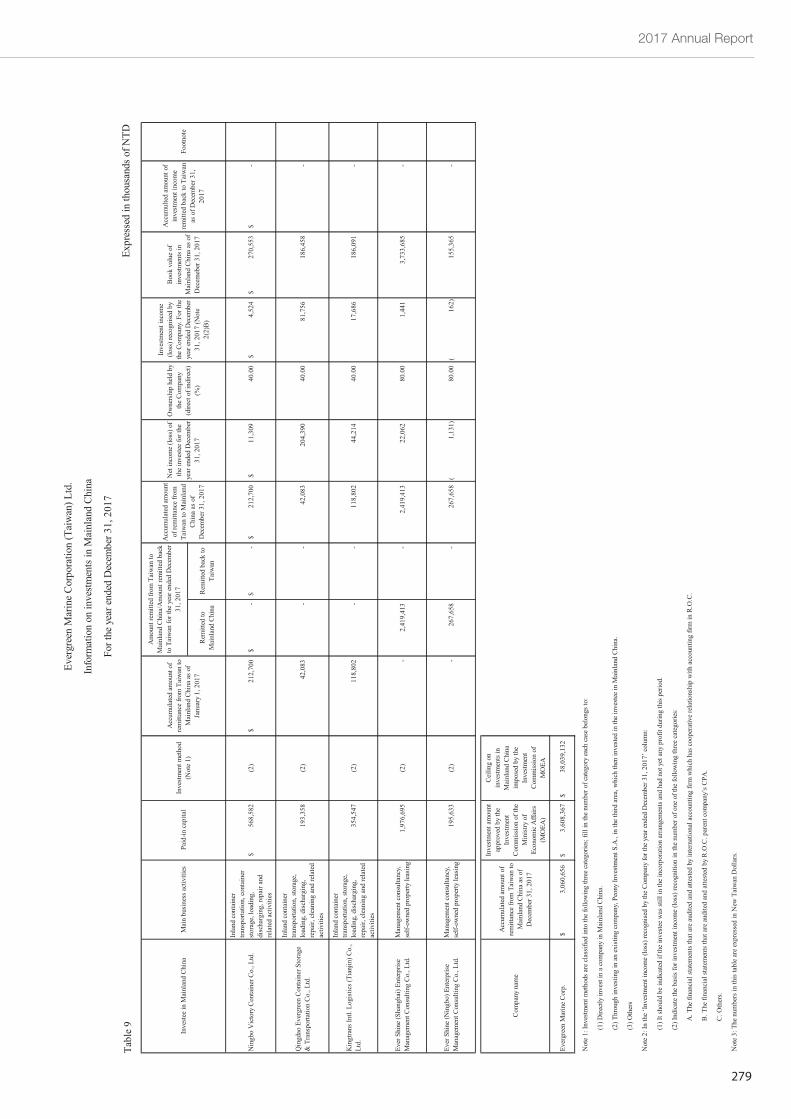
2017 Annual Report
279
Expr
esse
d in
thou
sand
s of N
TD
(Exc
ept a
s oth
erw
ise
indi
cate
d)
Rem
itted
toM
ainl
and
Chi
naR
emitt
ed b
ack
toTa
iwan
Nin
gbo
Vic
tory
Con
tain
er C
o., L
td.
Inla
nd c
onta
iner
trans
porta
tion,
con
tain
erst
orag
e, lo
adin
g,di
scha
rgin
g, re
pair
and
rela
ted
activ
ities
568,
582
$
(2)
212,
700
$
-$
-$
212,
700
$
11,3
09$
40.0
04,
524
$
270,
553
$
-
$
Qin
gdao
Eve
rgre
en C
onta
iner
Sto
rage
& T
rans
porta
tion
Co.
, Ltd
.
Inla
nd c
onta
iner
trans
porta
tion,
stor
age,
load
ing,
dis
char
ging
,re
pair,
cle
anin
g an
d re
late
dac
tiviti
es
193,
358
(2)
42,0
83
-
-
42
,083
20
4,39
0
40
.00
81,7
56
186,
458
-
Kin
gtra
ns In
tl. L
ogis
tics (
Tian
jin) C
o.,
Ltd.
Inla
nd c
onta
iner
trans
porta
tion,
stor
age,
load
ing,
dis
char
ging
,re
pair,
cle
anin
g an
d re
late
dac
tiviti
es
354,
547
(2)
118,
802
-
-
118,
802
44,2
14
40.0
017
,686
18
6,09
1
-
Ever
Shi
ne (S
hang
hai)
Ente
rpris
eM
anag
emen
t Con
sulti
ng C
o., L
td.
Man
agem
ent c
onsu
ltanc
y,se
lf-ow
ned
prop
erty
leas
ing
1,97
6,69
5
(2)
-
2,
419,
413
-
2,41
9,41
3
22,0
62
80.0
01,
441
3,73
3,68
5
-
Ever
Shi
ne (N
ingb
o) E
nter
pris
eM
anag
emen
t Con
sulti
ng C
o., L
td.
Man
agem
ent c
onsu
ltanc
y,se
lf-ow
ned
prop
erty
leas
ing
195,
633
(2)
-
26
7,65
8
-
267,
658
1,13
1)(
80
.00
162)
(
15
5,36
5
-
Com
pany
nam
e
Acc
umul
ated
am
ount
of
rem
ittan
ce fr
om T
aiw
an to
Mai
nlan
d C
hina
as o
fD
ecem
ber 3
1, 2
017
Inve
stm
ent a
mou
ntap
prov
ed b
y th
eIn
vest
men
tC
omm
issi
on o
f the
Min
istry
of
Econ
omic
Affa
irs(M
OEA
)
Cei
ling
onin
vest
men
ts in
Mai
nlan
d C
hina
impo
sed
by th
eIn
vest
men
tC
omm
issi
on o
fM
OEA
Ever
gree
n M
arin
e C
orp.
$
3,0
60,6
56 $
3,60
8,36
7 $
38,0
39,1
32
Not
e 1:
Inve
stm
ent m
etho
ds a
re c
lass
ified
into
the
follo
win
g th
ree
cate
gorie
s; fi
ll in
the
num
ber o
f cat
egor
y ea
ch c
ase
belo
ngs t
o:
(1) D
irect
ly in
vest
in a
com
pany
in M
ainl
and
Chi
na.
(2) T
hrou
gh in
vest
ing
in a
n ex
istin
g co
mpa
ny, P
eony
Inve
stm
ent S
.A.,
in th
e th
ird a
rea,
whi
ch th
en in
vest
ed in
the
inve
stee
in M
ainl
and
Chi
na.
(3) O
ther
s
Not
e 2:
In th
e ‘In
vest
men
t inc
ome
(loss
) rec
ogni
sed
by th
e C
ompa
ny fo
r the
yea
r end
ed D
ecem
ber 3
1, 2
017’
col
umn:
(1) I
t sho
uld
be in
dica
ted
if th
e in
vest
ee w
as st
ill in
the
inco
rpor
atio
n ar
rang
emen
ts a
nd h
ad n
ot y
et a
ny p
rofit
dur
ing
this
per
iod.
(2) I
ndic
ate
the
basi
s for
inve
stm
ent i
ncom
e (lo
ss) r
ecog
nitio
n in
the
num
ber o
f one
of t
he fo
llow
ing
thre
e ca
tego
ries:
A
. The
fina
ncia
l sta
tem
ents
that
are
aud
ited
and
atte
sted
by
inte
rnat
iona
l acc
ount
ing
firm
whi
ch h
as c
oope
rativ
e re
latio
nshi
p w
ith a
ccou
ntin
g fir
m in
R.O
.C.
B
. The
fina
ncia
l sta
tem
ents
that
are
aud
ited
and
atte
sted
by
R.O
.C. p
aren
t com
pany
’s C
PA.
C
. Oth
ers.
Not
e 3:
The
num
bers
in th
is ta
ble
are
expr
esse
d in
New
Tai
wan
Dol
lars
.
Ow
ners
hip
held
by
the
Com
pany
(dire
ct o
f ind
irect
)(%
)
Inve
stm
ent i
ncom
e(lo
ss) r
ecog
nise
d by
the
Com
pany
. For
the
year
end
ed D
ecem
ber
31, 2
017
(Not
e2(
2)B
)
Boo
k va
lue
ofin
vest
men
ts in
Mai
nlan
d C
hina
as o
fD
ecem
eber
31,
201
7
Acc
umul
ted
amou
nt o
fin
vest
men
t inc
ome
rem
itted
bac
k to
Tai
wan
as o
f Dec
embe
r 31,
2017
Am
ount
rem
itted
from
Tai
wan
toM
ainl
and
Chi
na/A
mou
nt re
mitt
ed b
ack
to T
aiw
an fo
r the
yea
r end
ed D
ecem
ber
31, 2
017
Ever
gree
n M
arin
e C
orpo
ratio
n (T
aiw
an) L
td.
Info
rmat
ion
on in
vest
men
ts in
Mai
nlan
d C
hina
For t
he y
ear e
nded
Dec
embe
r 31,
201
7
Tabl
e 9 In
vest
ee in
Mai
nlan
d C
hina
Mai
n bu
sine
ss a
ctiv
ities
Paid
-in c
apita
lIn
vest
men
t met
hod
(Not
e 1)
Acc
umul
ated
am
ount
of
rem
ittan
ce fr
om T
aiw
an to
Mai
nlan
d C
hina
as o
fJa
nuar
y 1,
201
7
Foot
note
Acc
umul
ated
am
ount
of re
mitt
ance
from
Taiw
an to
Mai
nlan
dC
hina
as o
fD
ecem
ber 3
1, 2
017
Net
inco
me
(loss
) of
the
inve
stee
for t
heye
ar e
nded
Dec
embe
r31
, 201
7