Embed Size (px)
Citation preview

HAZMAT MODELINGPRODUCTS
HAZMAT MODELINGPRODUCTS
forSpill Response and Planning
N OAA Ocean Service • OR&RNational Oceanic and Atmospheric Administration • NOAA Ocean Service • Office of Response and Restoration
HAZMAT • Hazardous Materials Response Division7600 Sand Point Way N.E. • Seattle, Washington 98115
Phone: 206-526-6317 • fax: 206-526-6329 • http://response.restoration.noaa.gov
November 2002

Contents 1 Introduction........................................................................................................1
2 Initial Oil Spill Response Products ....................................................................2
3 Computer Modeling Products for Spills ............................................................7
4 On-scene Oil Spill Tracking ..............................................................................9
5 SAR and Other Trajectory Modeling Products................................................11
6 Oil Spill Drill Products ....................................................................................14 7 Oil Spill Planning ......................................................................................... 17
8 GNOME Files ..................................................................................................24
9 Dispersed Oil Modeling...................................................................................26
10 Chemical Spill Response .................................................................................29
11 Availability of NOAA/HAZMAT Software....................................................35 Figures
1 Example of a weather forecast ...........................................................................3
2 Tidal current prediction for Golden Gate, San Francisco Bay, California ........4
3 Tidal height prediction for Golden Gate, San Francisco Bay, California..........4
4 Example of ADIOS2 oil fate table.....................................................................5
5 Verbal trajectory analysis ..................................................................................6
6 Trajectory analysis .............................................................................................8
7 HAZMAT Overflight map...............................................................................10
8 Example of TWA 800 SAR map .....................................................................12
9 Example of receptor mode run for mystery slick.............................................13
10 Benzene concentration table for drill control...................................................16 11 Statistical wind tables used to help plan for the Ehime Maru recovery
effort off Honolulu...........................................................................................18
Figures, cont. 12 An example of what was generated for the U.S. Navy to assess the risk of
an oil spill from the Ehime Maru that could occur during the 7-day forecasted weather. ..........................................................................................19
13 Example of area planning run for spill originating from James River
Reserve Fleet....................................................................................................20
14 Receptor mode contours for Waikiki beach planning......................................21 15 Example of TAP output for San Francisco Bay showing where spills can go......................................................................................................................23
16 GNOME output window for San Diego, California ........................................25
17 Dispersed and un-dispersed oil foot prints for Chesapeake Bay scenario .......27
18 Time-series plot of oil concentrations..............................................................28
19 Response Information Data Sheets (RIDS) .....................................................32
20 ALOHA footprint.............................................................................................33
21 ALOHA footprint on MARPLOT map............................................................34 Appendix
I Drill Request Form. .........................................................................................36
II Area Planning Request Form. ..........................................................................40

1 Introduction The Hazardous Materials Response Division (HAZMAT) of the NOAA Ocean Service has a mission to develop and use programs that provide scientific information to help the professional responders as well as the general public understand, plan for, and respond to oil and chemical spills. The organization is based in Seattle and consists of numerous teams that work on spill response and research. The purpose of this report is to show the products from one of these teams, the Modeling and Simulations Studies (MASS) Team. For more information see our website at http://response.restoration.noaa.gov
1

2 Initial Oil Spill Response Products (the first hour) This information is usually conveyed initially verbally via a phone call, then followed up in the second hour with faxed and emailed products to all concerned parties. Weather forecast The HAZMAT modeling team is responsible for obtaining and sending out the forecast. This ensures that the forecast used for trajectories and field operations are consistent. Typically, twice-daily forecasts are obtained from the National Weather Service Forecast Office responsible for the spill area. The forecast is geared for trajectory information, field operations, and long term planning for the spill. The forecast will typically include information such as sunrise/sunset times, surface wind, waves, visibility, temperature extremes, river rise and fall information, and a longer-range, extended forecast. See Figure 1 for an example. Tide forecast Forecast of tide heights and currents are generated from our in-house tide model, Shio, which is based on the NOS tide tables. Tide current information is important for transport analysis as well as for operational planning. Tide heights will often dictate whether beached oil will refloat or remain high and dry. See Figures 2 and 3 for tide prediction examples. Oil fate information Model predictions of the fate of the oil will come from our ADIOS2™ model. This is augmented by our estimates of the beach and water impacts one can expect from the type and amount of oil that has been spilled. This is based on published reports and decades of experience dealing with oil spills of varying sizes and types. See Figure 4 for an example of ADIOS table output. An initial trajectory report After the above information is gathered, we will estimate the time scale and length scale of the problem. This will give us an idea of how long the oil will be a problem, how far we can expect it to move, and which areas are threatened downcurrent and downwind. This initial trajectory information is passed on verbally with a phone call and followed up with a written report. See Figure 5 for an example.
2

CHAMPION TRADER INCIDENT 1100 CST, Friday October 30 1998 Sunrise (10/30): 0600 Sunset (10/30): 1705 Sunrise (10/31): 0601 Sunset (10/31): 1704 36 HOUR FORECAST: Winds: Tonight, the winds are expected to be from the east at 5-10 knots. Saturday through Saturday night, east winds at 10 knots are predicted. Waves: Tonight, the seas are forecast to be 1 foot. Saturday through Saturday night, 2 foot seas are expected. Precipitation: Tonight through Saturday night, no precipitation is expected. Ceiling/Visibility: Tonight, patchy fog is predicted. Saturday, morning fog is forecast. Visibility is expected to be less than one mile lifting to be 5-7 miles by the afternoon hours. Temperature: The temperatures are predicted to range from highs in the 80's to lows in the 60's. Extended Forecast: Sunday, the winds are expected to be from the SE at 10-15 knots shifting to be from the south at 10-15 knots by the late afternoon hours. Seas 2-3 feet. Scattered showers and isolated thunderstorms are predicted. Monday, south winds at 10 knots are predicted to shift and be from the north at 10 knots by the late evening hours. Seas 2 feet. Showers and isolated thunderstorms are forecast. Tropical Outlook: Hurricane Mitch is not forecast to affect the spill region during the next five days. No major weather disturbance is predicted to affect the spill area during the next five days. Figure 1. Example of a weather forecast.
3

-3.0
-2.0
-1.0
0.0
1.0
2.0
3.0
4.0
Speed (kt)
midnight10/12
Fri
6:00am noon 6:00pm midnight10/13
SatLocal Daylight Savings Time
Fld Dir: 070° Ebb Dir: 256°
0:37am -2.9 ebb
4:23am
7:37am 3.1 fld
10:48am
1:28pm -1.7 ebb
4:43pm
7:33pm 2.2 fld
10:13pm
orth
Figure 2. Tidal current prediction for Golden Gate, San Francisco Bay, California.
-1.0
0.0
1.0
2.0
3.0
4.0
5.0
6.0
Height (ft)
midnight10/12
Fri
6:00am noon 6:00pm midnight10/13
SatLocal Daylight Savings Time
2:02am -0.1
9:28am 5.2
2:33pm 2.5
8:29pm 5.7
Tidal Heights at Golden Gate, San Francisco Bay
Figure 3. Tidal height prediction for Golden Gate, San Francisco Bay, California.
4
Oil Name = DIESEL/HEATING OIL NO.2, CHEVRON API = 33.5 Pour Point = 5 deg F Wind Speed = constant at 15 mph Wave Height = computed from winds Water Temperature = 65 deg F Time of Initial Release = February 26, 0900 hours Total Amount of Oil Released = 5,000 bbl ______________________________________________________________________ Hours Into Released Evaporated Dispersed Remaining Spill bbl percent percent percent 1 5,000 - 0 - 0 - 100 2 5,000 0 1 99 4 5,000 - 1 - 2 - 97 6 5,000 2 7 91 8 5,000 - 4 - 15 - 81 10 5,000 6 27 67 12 5,000 - 8 - 40 - 52 18 5,000 12 69 19
Figure 4. Example of ADIOS2 oil fate table.
5

Date: June 21, 1998, 2115 PDT To: NOAA SSC Brad Benggio FROM: NOAA/Hazardous Materials Response Division Modeling and Simulation Studies Seattle, WA 98115 SUBJECT: M/T Kapitan Egora 6502 FOR ADDITIONAL INFORMATION, PLEASE CONTACT Jerry Galt, MODELING AND SIMULATION STUDIES, NOAA, SEATTLE, WA 98115. PHONE (206) 526-6317. ________________________________________________________ Per your request, we have looked at trajectory implications of a potential release of Fuel Oil #6. These notes are based on the following information: On June 21, 1998 we received notification that the vessel M/T Kapitan Egora was aground off of Bahia De Guayanilla at 17-57.7N 66-45.96W in the vicinity of buoy #1. On board was 298,000 gal. of #6. At this time, the vessel is not leaking product. If any of this initial information is incorrect or if more information becomes available, please let us know ASAP as it would affect any trajectory implications. _______________________________________________________ _________________________________ 1) WEATHER Present winds in the vicinity of the grounding are reported to be from the east at 25 to 30 knots. Seas may be to 8 feet with the dominant swell moving from east to west. There are also reports of scattered showers and thundershowers. Forecasts are for weather to return to the dominant trade wind pattern with 10-20 knot winds from the E-ESE. 2) TRAJECTORY ANALYSIS If a significant amount of product is lost the reef front to the northwest of the grounding site will be threatened as well as the Punta Verraco area. On the flood tide oil could be carried into the western arm of Bahia De Guayanilla and threaten the mangrove area in the back reaches of the bay. Beyond the immediate vicinity of the grounding the dominant strong easterly winds and forecasted persistent trades will tend to move any spilled oil west along the coast where it could cause scattered or patchy shoreline impacts along the entire southwest coast of Puerto Rico. Heavy refined products, such as Fuel Oil #6, tend to weather very slowly. This type of oil may not spread into a very thin film and often simply breaks up into smaller patches and eventually tar balls. Because this type of oil may not form a sheen, the resulting tar ball field may be difficult to observe using visual and remote sensing techniques. This, combined with the persistence of the tar balls, makes these types of spills quite likely to result in long-range and, occasionally, unexpected beach impacts. 3) OIL WEATHERING Given the forecast winds, we would expect that less than ten percent of the oil will evaporate or disperse into the water column during the first twenty-four hours. There may be some scavenging of the slick from suspended sediment, particularly in the nearshore or surf areas. We do not expect emulsification to occur. Figure 5. Verbal trajectory analysis.
6

3 Computer Modeling Products for Spills (hours 2-4) If the initial trajectory report described above indicates that the oil will be a threat to resources over a time span of 24 hours or more, then a computer trajectory model is set up and run. For most coastal U.S. areas, this will take about 2 to 3 hours from start to finish. For areas that we have not worked before it may take 4 to 6 hours before a model run is complete. Model output consists of a set of maps with a series of contours showing heavy, medium, and light distributions of oil bounded by an uncertainty line. At the bottom of the page is a scale bar with pictures indicating what heavy and light contours represent. The maps are generated daily and typically forecast 24-48 hours into the future. A set of maps will consist of 2 to 4 maps showing the distribution of oil for the next morning and late the next afternoon. These times are usually selected to coincide with overflight times. The contours represent our best guess as to where the oil would be at the indicated times. The uncertainty lines represent the uncertainty in the inputs to the model run. These include uncertainty in the weather predictions, and water current estimates. The maps are usually faxed to the command post, and sent out via email as bitmap or JPEG images. They can also be saved as a set of files in a MOSS file format for import into a geographic information system. A separate manual (Digital Distribution Standard of NOAA Trajectory Analysis Information) documents the MOSS format. Translators are available for the asking. See Figure 6 for an example of what is sent out.
7

Figure 6. Trajectory analysis.
8

4 On-scene Oil Spill Tracking (day 2 to end of spill) If a spill warrants it, an Away Team member goes on-scene to provide vital observational data for modeling calibration , response operations, and to help interpret MASS trajectory analysis for response personnel. Typical duties for Away Team personnel include flying reconnaissance over the spill area and mapping the pollutant's distribution, locating important oceanographic features that may affect the trajectory, deploying instruments to measure winds and currents, deploying satellite-tracked drifters, and assisting with the interpretation of remote sensing data. Away Team members also serve as on-site experts for spill trajectory and behavior that can be queried by the spill incident commanders. The overflight maps are distributed on-scene at the command post and to other interested parties via fax or email from HAZMAT central in Seattle. The interaction between the on-scene Away Team and the Home Team back in Seattle doing the model predictions are key to the success of the trajectory predictions. With daily reports from the Away Team guiding the calibration of the model parameters, the accuracy of the model will typically increase from about 60% to 70% initially to about 80% to 90% after a few days. See Figure 7 for an example of a NOAA/HAZMAT-generated overflight map.
9

Figure 7. HAZMAT Overflight map.
10

5 SAR and Other Trajectory Modeling Products The HAZMAT modeling team has been involved with modeling more than oil spills over the years. Search and rescue (SAR) cases have involved searches for missing people, missing boats, and flotsam from several highly publicized plane crashes. We have also been involved with locating the source of mystery tarballs, garbage and, on rare occasions, bodies that have come ashore. Our modeling tools can be run in both forward and backward modes. The forward runs will predict where things will end up, and the backward mode will predict where things came from. The typical output will be a map that with a 90 or 95% probability contour that indicates where things can go to or come from. See Figures 8 and 9 for examples of SAR and mystery slick source runs.
11

Figure 8. Example of TWA 800 SAR map.
12
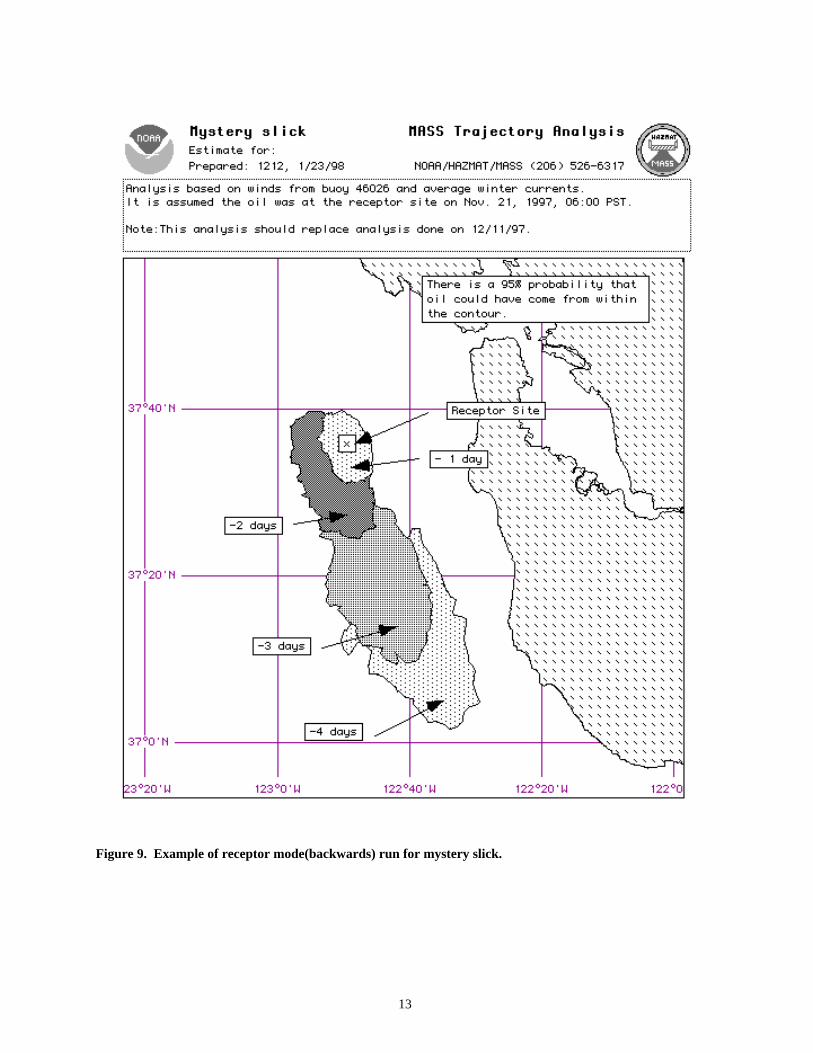
Figure 9. Example of receptor mode(backwards) run for mystery slick.
13

6 Oil Spill Drill Products
The modeling team has been providing free oil spill drill products for about 20 to 30 drills each year for government agencies and private companies. The materials generated for a drill are identical to what would be generated for a real spill. This helps the local spill community become familiar with the HAZMAT products that would be used during an actual spill. We also prepare a few additional products to help plan a drill scenario and direct the activities on drill day.
Products used to plan a drill
We often set up the model for a given area and help run several scenarios with different wind conditions and start times to help drill planners pick a scenario that will meet their goals. We recommend that you work with your local HAZMAT Scientific Support Coordinator when seeking help with developing a scenario. They are experienced in running our General NOAA Oil Modeling Environment (GNOME) spill model in drill mode to help select a scenario. See Section 8 for a description and example of GNOME.
Products used to control a drill
Once the spill scenario and environmental conditions are selected for a drill, we will produce a QuickTime or AVI formatted movie showing the movement of the oil. The movie frames allow drill control personnel to run the drill in detail. The movie frames can be generated at user specified time intervals and can be printed by the user. This is a drill control product only. During actual spills we do not send out movies.
For drills that involve products that would generate hazardous air plumes such as gasoline and volatile chemicals, we would work with our HAZMAT chemists and health and safety officers to produce concentration versus distance tables or maps for the drill control people. See Figure 10 for an example.
Products for drill players to use
All of the actual spill products mentioned previously are available for drill players to use. These include the initial spill response products, trajectory model output products, and onscene overflight maps. The goal in making these products available is to familiarize local responders to the HAZMAT modeling products they would see during an actual spill event. See Figures 1 through 7 for examples.
14
How to request drill products
We recommend that you work with the Scientific Support Coordinator responsible for your area. You will be asked to fill in a HAZMAT drill request form that will make our lives easier. The completed drill form should get back to us at least two weeks in advance of when you need our products. Occasionally, we are asked to participate in a real-time drill, often unannounced. When this happens we will not generate a full set of products. With the 20 to 30 drills and over 100 spill calls a year, we are often reluctant to drop what we are doing to respond to an unannounced drill. See Appendix I for a copy of the drill request form.
15

ALOHA Modeled Pyrolysis Gas Plume Lengths
FOR SONS DRILL .
Distance (in miles)
Time downwind crosswind width crosswind meander
0700 to 0730 - initial release 1 ppm 4 to 8 1.0 3.0 10 ppm (blue haze) 4 to 7 0.6 2.0 100 ppm 1.9 0.4 0.6 150 ppm 1.2 0.3 0.4 1000 ppm 0.5 0.0 0.2
0800 to 0830 - transition 1 ppm 12.0 0.8 2.7 10 ppm (blue haze) 7.0 0.5 1.3 100 ppm 1.3 0.3 0.4 150 ppm 0.8 0.2 0.3 1000 ppm 0.3 0.1 0.2
0830 to 1830 - continious release 1 ppm 7.0 0.6 2.4 10 ppm (blue haze) 2.0 0.3 0.6 100 ppm 0.6 0.1 0.2 150 ppm 0.5 0.1 0.2 1000 ppm 0.2 0.1 0.2
Figure 10. Benzene concentration table for drill control.
16
7 Oil-Spill Planning
To model a spill that hasn’t happened yet requires a different type of analysis, because neither the environmental parameters nor the scenario for a spill in the future is known. The inputs have to be dealt with statistically, and the outputs have to be presented as probabilities. Over the last 20 years, we have developed several statistical products that have been used to evaluate everything from the short-term risk from a grounded or sunken vessel to the long-term risk of having a spill from a facility or within a port area.
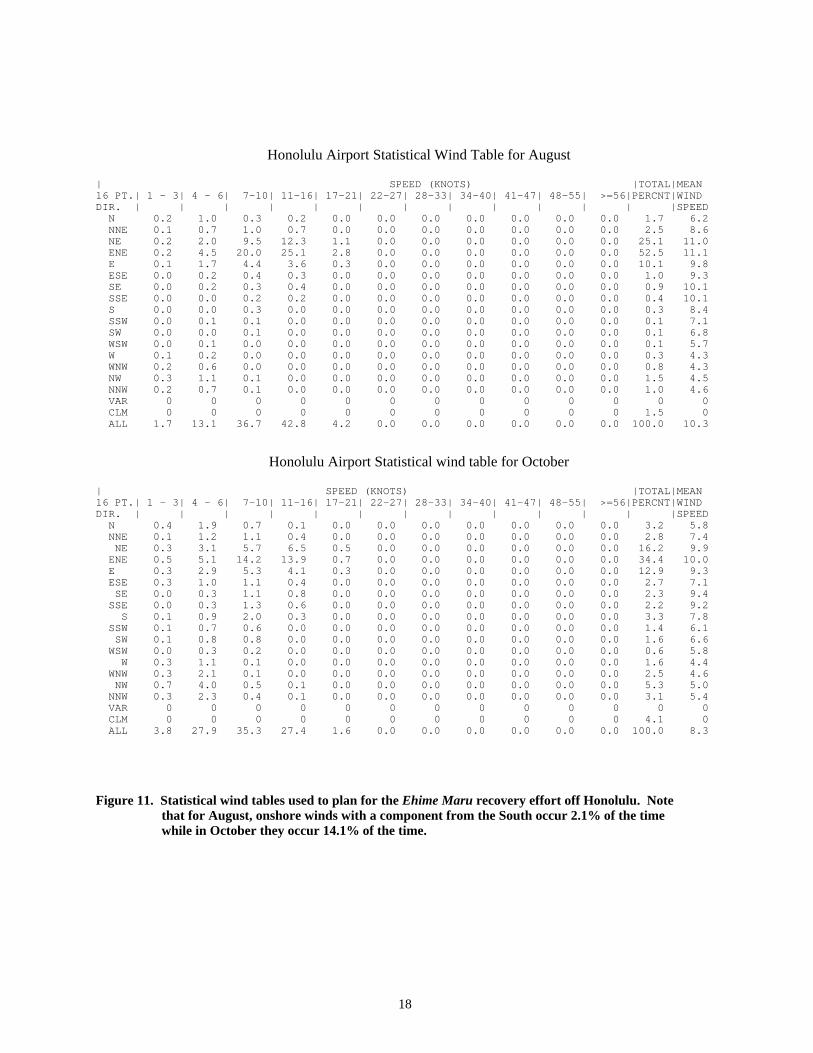
Statistical wind tables are some of the most useful planning products that we produce. These are generated from 10 years or more of hourly wind data collected and archived by either the National Data Buoy Center or the National Climatic Data Center. These tables are used to assess the probability of wind blowing oil ashore. See Figure 11 for an example.
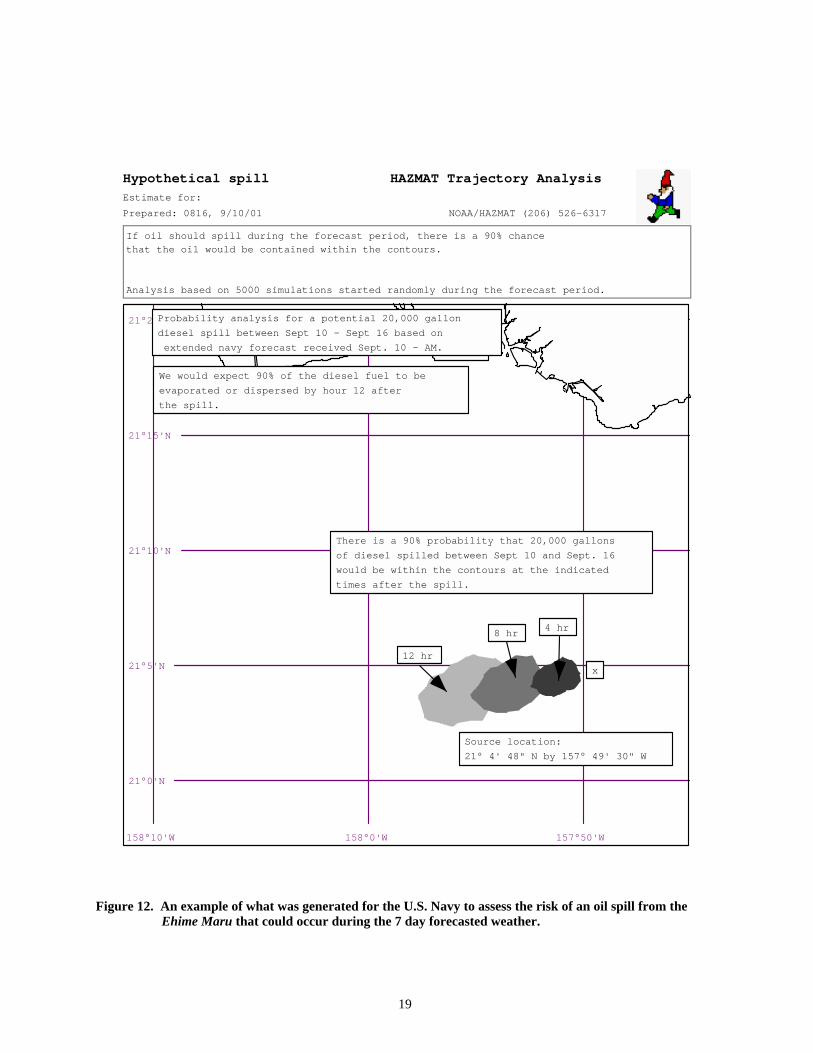
For long term oil spill planning where no forecast for the weather or currents are possible, we have developed several different products. The first two methods discussed below are what is available now. While the latest program, the Trajectory Analysis Planner, TAP, is a work in progress but a few locations have been analyzed and are available for the asking.
Planning for a fixed source When developing a risk analysis from a specific source site, such as refinery, pipeline lightering site, or a sunken vessel, the model is run in a forward mode using statistical wind tables, long term (10 – 20 years) hourly wind records, or an extended forecast. The model is run with several thousand particles and each particle is released under a different wind and tide condition. The output will consist of contours that will encompass the area where you would expect oil to be 90% to 95% of the time. Figure 12 is an example that uses an extended 7 day forecast, and Figure 13 is an example using a 20 year hourly wind record. Planning for a specific receptor site When planning for a specific stretch of beach such as Waikiki to Diamond Head, the model is run backwards from the beach. Once again, the model is run with statistical wind tables or 10-20 year, hourly wind records. Several thousand particles are released with their own unique wind and current history and the results are contours at specific times. The results tell you where oil could be spilled to impact your stretch of beach. You also get an idea of how long it would take the oil to impact the receptor beach. This type of information is typically used to plan for locating shipping lanes and lightering areas. See Figure 14 for example.
17
Honolulu Airport Statistical Wind Table for August
| SPEED (KNOTS) |TOTAL|MEAN 16 PT.| 1 - 3| 4 - 6| 7-10| 11-16| 17-21| 22-27| 28-33| 34-40| 41-47| 48-55| >=56|PERCNT|WIND DIR. | | | | | | | | | | | | |SPEED N 0.2 1.0 0.3 0.2 0.0 0.0 0.0 0.0 0.0 0.0 0.0 1.7 6.2 NNE 0.1 0.7 1.0 0.7 0.0 0.0 0.0 0.0 0.0 0.0 0.0 2.5 8.6 NE 0.2 2.0 9.5 12.3 1.1 0.0 0.0 0.0 0.0 0.0 0.0 25.1 11.0 ENE 0.2 4.5 20.0 25.1 2.8 0.0 0.0 0.0 0.0 0.0 0.0 52.5 11.1 E 0.1 1.7 4.4 3.6 0.3 0.0 0.0 0.0 0.0 0.0 0.0 10.1 9.8 ESE 0.0 0.2 0.4 0.3 0.0 0.0 0.0 0.0 0.0 0.0 0.0 1.0 9.3 SE 0.0 0.2 0.3 0.4 0.0 0.0 0.0 0.0 0.0 0.0 0.0 0.9 10.1 SSE 0.0 0.0 0.2 0.2 0.0 0.0 0.0 0.0 0.0 0.0 0.0 0.4 10.1 S 0.0 0.0 0.3 0.0 0.0 0.0 0.0 0.0 0.0 0.0 0.0 0.3 8.4 SSW 0.0 0.1 0.1 0.0 0.0 0.0 0.0 0.0 0.0 0.0 0.0 0.1 7.1 SW 0.0 0.0 0.1 0.0 0.0 0.0 0.0 0.0 0.0 0.0 0.0 0.1 6.8 WSW 0.0 0.1 0.0 0.0 0.0 0.0 0.0 0.0 0.0 0.0 0.0 0.1 5.7 W 0.1 0.2 0.0 0.0 0.0 0.0 0.0 0.0 0.0 0.0 0.0 0.3 4.3 WNW 0.2 0.6 0.0 0.0 0.0 0.0 0.0 0.0 0.0 0.0 0.0 0.8 4.3 NW 0.3 1.1 0.1 0.0 0.0 0.0 0.0 0.0 0.0 0.0 0.0 1.5 4.5 NNW 0.2 0.7 0.1 0.0 0.0 0.0 0.0 0.0 0.0 0.0 0.0 1.0 4.6 VAR 0 0 0 0 0 0 0 0 0 0 0 0 0 CLM 0 0 0 0 0 0 0 0 0 0 0 1.5 0 ALL 1.7 13.1 36.7 42.8 4.2 0.0 0.0 0.0 0.0 0.0 0.0 100.0 10.3
Honolulu Airport Statistical wind table for October
| SPEED (KNOTS) |TOTAL|MEAN 16 PT.| 1 - 3| 4 - 6| 7-10| 11-16| 17-21| 22-27| 28-33| 34-40| 41-47| 48-55| >=56|PERCNT|WIND DIR. | | | | | | | | | | | | |SPEED N 0.4 1.9 0.7 0.1 0.0 0.0 0.0 0.0 0.0 0.0 0.0 3.2 5.8 NNE 0.1 1.2 1.1 0.4 0.0 0.0 0.0 0.0 0.0 0.0 0.0 2.8 7.4 NE 0.3 3.1 5.7 6.5 0.5 0.0 0.0 0.0 0.0 0.0 0.0 16.2 9.9 ENE 0.5 5.1 14.2 13.9 0.7 0.0 0.0 0.0 0.0 0.0 0.0 34.4 10.0 E 0.3 2.9 5.3 4.1 0.3 0.0 0.0 0.0 0.0 0.0 0.0 12.9 9.3 ESE 0.3 1.0 1.1 0.4 0.0 0.0 0.0 0.0 0.0 0.0 0.0 2.7 7.1 SE 0.0 0.3 1.1 0.8 0.0 0.0 0.0 0.0 0.0 0.0 0.0 2.3 9.4 SSE 0.0 0.3 1.3 0.6 0.0 0.0 0.0 0.0 0.0 0.0 0.0 2.2 9.2 S 0.1 0.9 2.0 0.3 0.0 0.0 0.0 0.0 0.0 0.0 0.0 3.3 7.8 SSW 0.1 0.7 0.6 0.0 0.0 0.0 0.0 0.0 0.0 0.0 0.0 1.4 6.1 SW 0.1 0.8 0.8 0.0 0.0 0.0 0.0 0.0 0.0 0.0 0.0 1.6 6.6 WSW 0.0 0.3 0.2 0.0 0.0 0.0 0.0 0.0 0.0 0.0 0.0 0.6 5.8 W 0.3 1.1 0.1 0.0 0.0 0.0 0.0 0.0 0.0 0.0 0.0 1.6 4.4 WNW 0.3 2.1 0.1 0.0 0.0 0.0 0.0 0.0 0.0 0.0 0.0 2.5 4.6 NW 0.7 4.0 0.5 0.1 0.0 0.0 0.0 0.0 0.0 0.0 0.0 5.3 5.0 NNW 0.3 2.3 0.4 0.1 0.0 0.0 0.0 0.0 0.0 0.0 0.0 3.1 5.4 VAR 0 0 0 0 0 0 0 0 0 0 0 0 0 CLM 0 0 0 0 0 0 0 0 0 0 0 4.1 0 ALL 3.8 27.9 35.3 27.4 1.6 0.0 0.0 0.0 0.0 0.0 0.0 100.0 8.3
Figure 11. Statistical wind tables used to plan for the Ehime Maru recovery effort off Honolulu. Note that for August, onshore winds with a component from the South occur 2.1% of the time while in October they occur 14.1% of the time.
18
158°10'W 158°0'W 157°50'W
21°0'N
21°5'N
21°10'N
21°15'N
21°20'N
x
Source location:
21° 4' 48" N by 157° 49' 30" W
Probability analysis for a potential 20,000 gallon
diesel spill between Sept 10 - Sept 16 based on
extended navy forecast received Sept. 10 - AM.
We would expect 90% of the diesel fuel to be
evaporated or dispersed by hour 12 after
the spill.
There is a 90% probability that 20,000 gallons
of diesel spilled between Sept 10 and Sept. 16
would be within the contours at the indicated
times after the spill.
12 hr
8 hr4 hr
Hypothetical spill HAZMAT Trajectory Analysis
Estimate for:
Prepared: 0816, 9/10/01 NOAA/HAZMAT (206) 526-6317
If oil should spill during the forecast period, there is a 90% chance
that the oil would be contained within the contours.
Analysis based on 5000 simulations started randomly during the forecast period.
Figure 12. An example of what was generated for the U.S. Navy to assess the risk of an oil spill from the Ehime Maru that could occur during the 7 day forecasted weather.
19
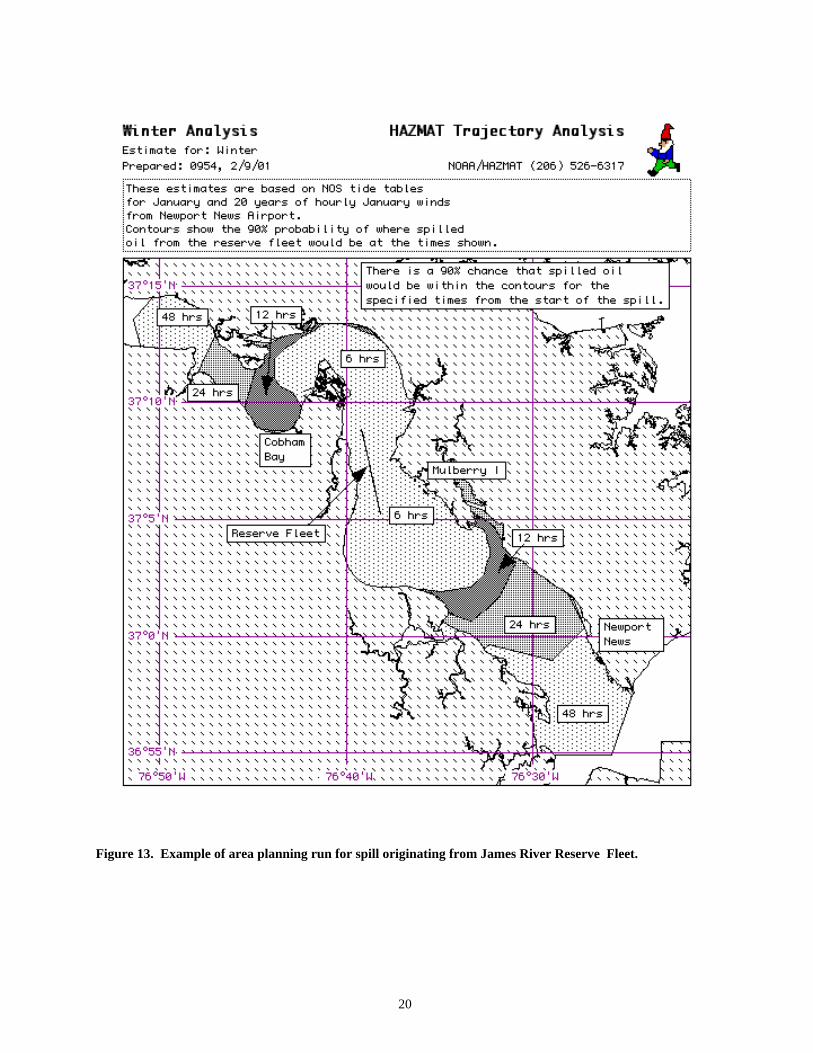
Figure 13. Example of area planning run for spill originating from James River Reserve Fleet.
20

Figure 14. Receptor mode contours for Waikiki beach planning.
21
TAP … Trajectory Analysis for Planning The TAP project is designed to analyze the following issues for an entire port:
• potential threats from oil spills during different seasons of the year; • the probability of spilled oil reaching a receptor site; • how long it would take oil to reach a receptor site; • how much oil could impact a receptor site; • the cost of having an oil spill in terms of dollars or other assets.
TAP runs off a set of data cubes developed for a particular port. Each cube represents the distribution of oil from a particular source site and a particular season. The cubes are generated by running the oil spill model thousands of time from each source site and accumulating statistics from each run. The runs start at a different time within a 10- to 20-year record of winds, tides, and river runoff. Unlike the first two methods, TAP will generate actual probability ranges and adjust for oil types. The TAP runs have been time- and labor-intensive efforts. As of the winter of 2002, the locations that are publically available are: San Francisco Bay; San Diego Bay; Kaneohe Bay, Hawaii; Puget Sound, the Straits of Juan De Fuca and Rosario Strait, Washington; Calcasieu Shipping Lanes, Louisiana; Inchon Harbor, Korea; and the Arabian Gulf. These are available on CD by request. Development continues on the project. It is hoped that future versions will be able to allow for on-water intervention techniques such as skimming, dispersant application, and burning. Check our website (http://response.restoration.noaa.gov) or email to [email protected] to find out what’s available. See Figure 15 for an example of TAP output.
22

122°40'W 122°30'W 122°20'W 122°10'W
37°45'N
37°50'N
37°55'N
TAP II™ - Trajectory Analysis PlannerMode: Shoreline Impact AnalysisSeason: Mar - AugTime: 1 day
Oil Type: Fuel Oil #6Amount Released: 1000 bblLevel of Concern: 1 bbl
0 10 20 30 40 50 60 70 80 90 100
Percent Of Spills
Figure 15. Example of TAP output for San Francisco Bay showing which shorelines are most likely to be impacted within one day from a spill at the ship location.
23

8 GNOME (General NOAA Oil Modeling Environment) Files
General NOAA Oil Modeling Environment (GNOME) is an object-oriented application that simulates oil movement due to wind, currents, tides and turbulent mixing. It is a publicly available, oil-spill trajectory model. GNOME plots the predicted evolution of spill positions from relevant oceanographic, atmospheric, and spill information. HAZMAT uses this model during spill response to calculate our best guess of the spill's trajectory and the associated uncertainty in that trajectory considering the imprecision of input information. Regional “location files” are available for different regions of the United States that contain preloaded data regarding local shorelines and currents for use with GNOME. These files ask you simple questions about the conditions you would like to simulate, and set up the GNOME model accordingly. Location files also contain references and Internet data sites to help you find more detailed information and observations. These location files are not complete enough for use in spill response but are an excellent tool for creating scenarios and building intuition regarding oil-spill trajectories at a particular location. The number of areas with location files is increasing. Get GNOME at response.restoration.noaa.gov/software/gnome/gnomeinfo.html in Macintosh and Windows compatible formats. Training is periodically available from HAZMAT. See Figure 16 for an example of a GNOME output screen.
24
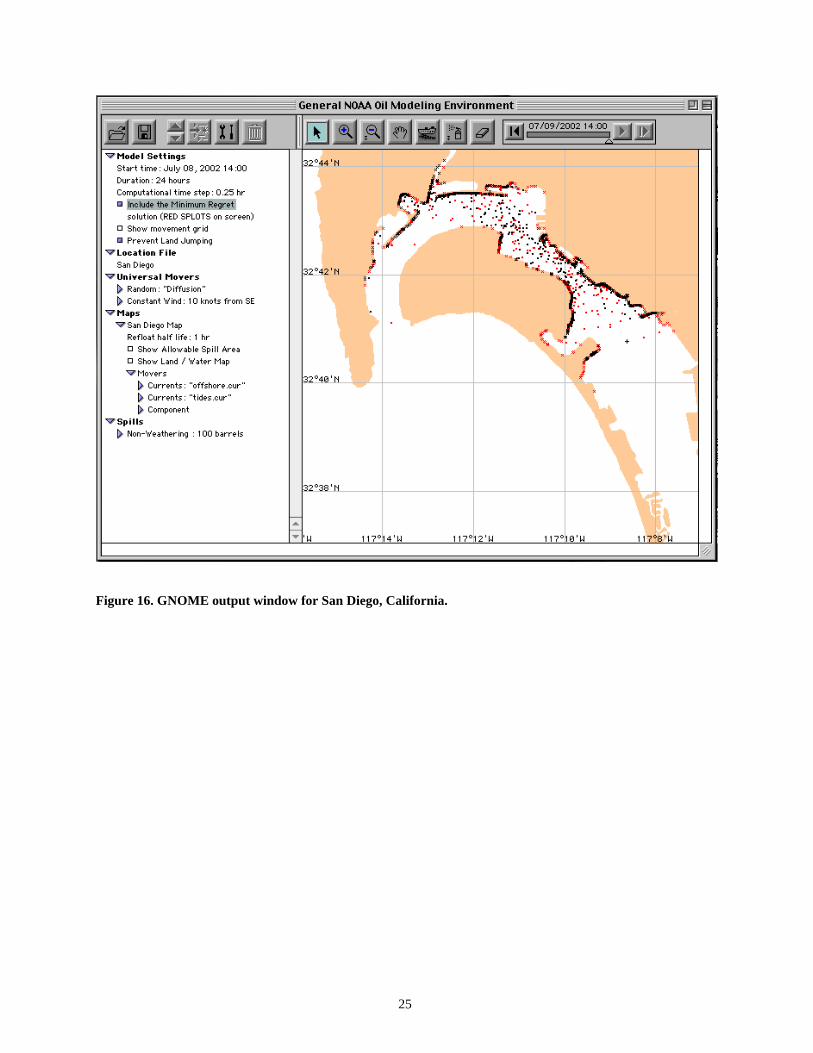
Figure 16. GNOME output window for San Diego, California.
25

9 Dispersed Oil Modeling HAZMAT has developed a model to estimate dispersed oil concentrations in the water column. This was done by adding routines to GNOME which allows it to track subsurface oil and compute subsurface oil concentrations. There are two output modes available. The first shows a bird’s eye view of the special distribution of subsurface oil and floating oil over time. See Figure 17 for an example. The second output type allows the user to see how dispersed oil concentration varies as a function of time for a fixed area or as you move with the plume. The model includes aquatic toxicity information that can be plotted over the oil concentration graphs. See Figure 18 for an example.
26

Spill scenario - 2000 bbls of fuel oil #6Time - 4/5/02 at 1200 hrsLocation - 39.15 N, 76.37 WPatapsco
River
KentIsland
Chester River
Dispersed at 1600 hrs80% effectiveFootprint 48 hrs after spill(44 hrs after dispersal)
Chesapeake Bay
Chesapeake Bay
Patapsco River
Dispersed at 1600 hrs80% effectiveFootprint 24 hrs after spill(20 hrs after dispersal)
Chester River Kent
Island
Spill scenario - 2000 bbls of fuel oil #6Time - 4/5/02 at 1200 hrsLocation - 39.15 N, 76.37 W
Figure 17. Dispersed and un-dispersed oil foot prints for Chesapeake Bay scenario at 24 hours and 48
hours post-spill.
27

Chesapeake Bay scenario (A)
Chesapeake Bay scenario (B)
Figure 18. Time-series plot of (a) average and (b) maximum oil concentrations. Note tidal signal in
graphs.
28
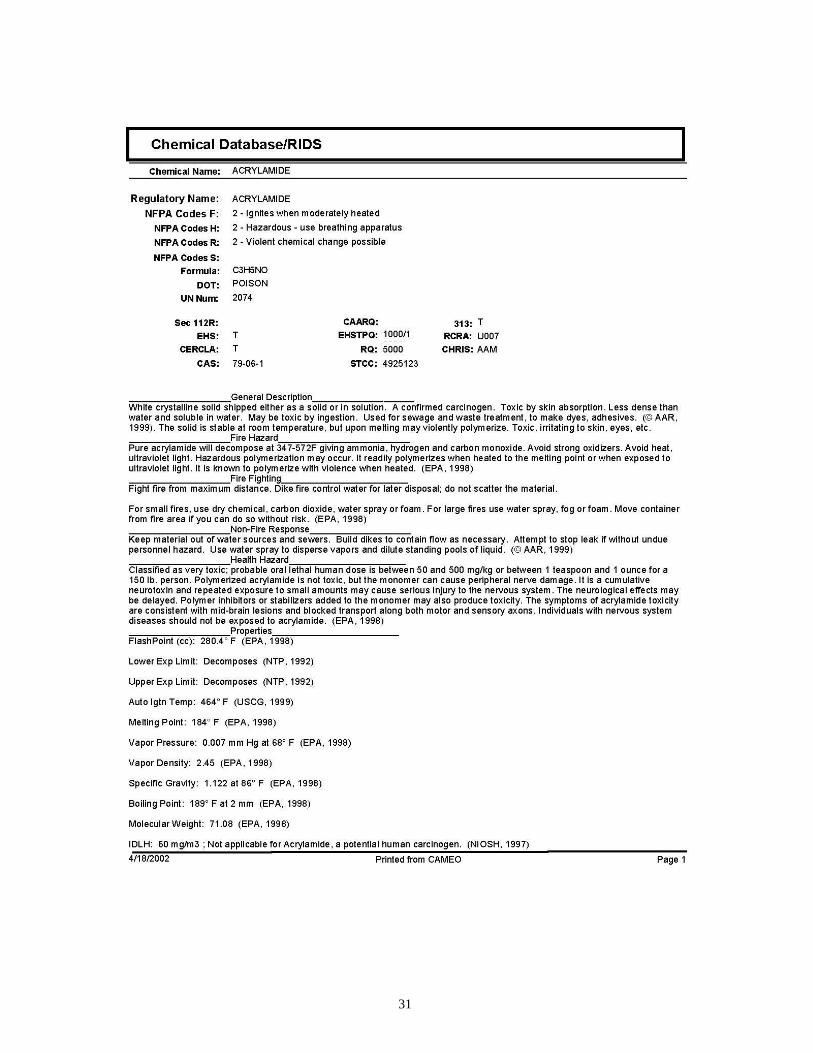
10 Chemical Spill Response Accidents involving large amounts of chemicals in ship containers, trains, and storage tanks at large fixed facilities in or near marine resources have required HAZMAT to design and implement several scientific tools that can help responders and planners answer many of the questions that arise during a chemical spill. When the call comes in, many of the questions concern chemistry issues such as, What chemical are we dealing with? If it is released in large quantity how will it behave? Does the material react with water, air, or other chemicals? Once the chemical is known, what are the intrinsic hazards associated with it? What are the health and safety issues that we need to be concerned with for the workers at the site and the general community? Knowledge of the chemical's behavior and resources at risk help to define response options. HAZMAT's most widely used computer tool for chemical spill response and planning is the Computer-Aided Management of Emergency Operations (CAMEO®) system. CAMEO includes a chemical information module with a database; federal regulatory information on hazardous chemicals; Mapping Application for Response, PLanning, and Operational Tasks (MARPLOT®, a microcomputer-based, rapid mapping program), a map display application that allows quick and flexible manipulation of electronic maps derived from U.S. Bureau of the Census TIGER/Line digital map files; an air plume model, Areal Locations of Hazardous Atmospheres (ALOHA®), for modeling the behavior of releases of chemicals to the atmosphere; and the Chemical Reactivity Worksheet, which predicts potential hazardous chemical reactions. All modules work interactively to quickly display critical information. The Chemical Database module, which contains response information for approximately 6,000 chemicals, includes 80,000 chemical synonyms and identification numbers that help the emergency responder identify unknown substances during an incident. Once a chemical is identified, fire fighting, physical property, health hazards, first aid guidance, and spill recommendations are provided (Figure 19). The Reactivity database includes all the chemicals in CAMEO, and gives specific information about chemical reactivity behavior with common materials and mixtures of chemicals, along with case history and anecdotal information. Much of the above information is used to assess and prioritize the hazards associated with particular chemical constituents in a given scenario. The ALOHA® atmospheric dispersion module predicts the downwind dispersion of a chemical cloud (Figure 20). Graphical outputs include estimates of the plume footprint,
29
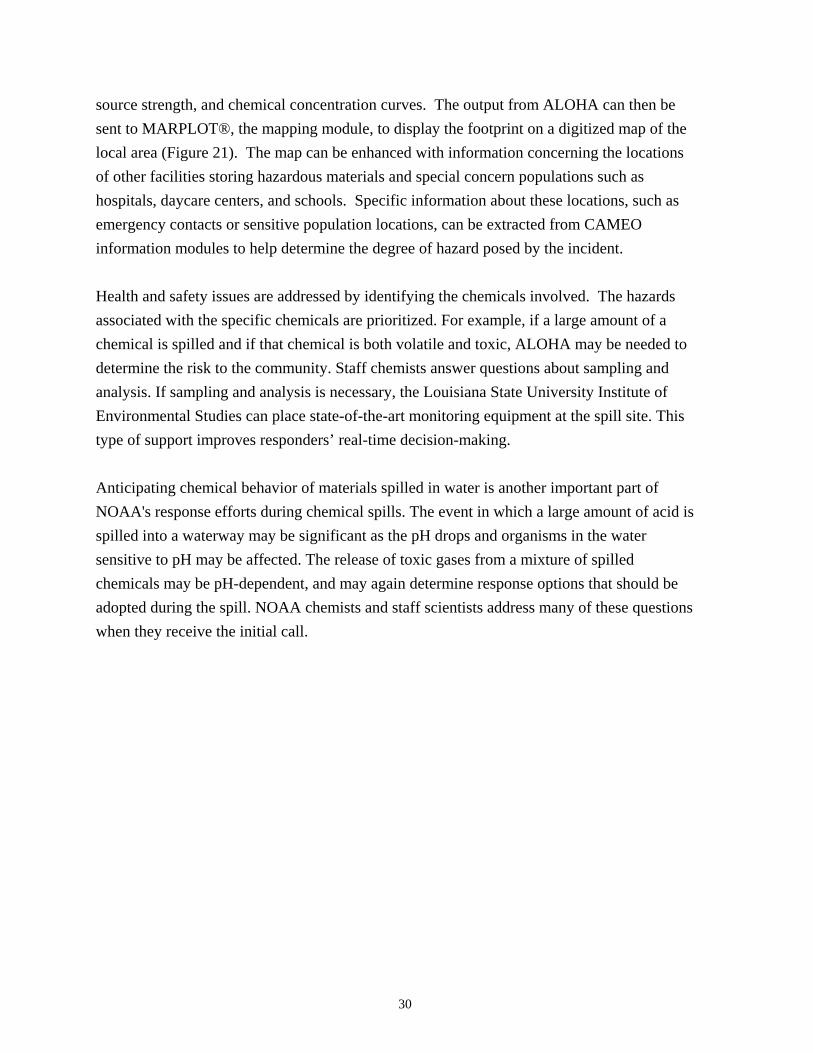
source strength, and chemical concentration curves. The output from ALOHA can then be sent to MARPLOT®, the mapping module, to display the footprint on a digitized map of the local area (Figure 21). The map can be enhanced with information concerning the locations of other facilities storing hazardous materials and special concern populations such as hospitals, daycare centers, and schools. Specific information about these locations, such as emergency contacts or sensitive population locations, can be extracted from CAMEO information modules to help determine the degree of hazard posed by the incident. Health and safety issues are addressed by identifying the chemicals involved. The hazards associated with the specific chemicals are prioritized. For example, if a large amount of a chemical is spilled and if that chemical is both volatile and toxic, ALOHA may be needed to determine the risk to the community. Staff chemists answer questions about sampling and analysis. If sampling and analysis is necessary, the Louisiana State University Institute of Environmental Studies can place state-of-the-art monitoring equipment at the spill site. This type of support improves responders’ real-time decision-making. Anticipating chemical behavior of materials spilled in water is another important part of NOAA's response efforts during chemical spills. The event in which a large amount of acid is spilled into a waterway may be significant as the pH drops and organisms in the water sensitive to pH may be affected. The release of toxic gases from a mixture of spilled chemicals may be pH-dependent, and may again determine response options that should be adopted during the spill. NOAA chemists and staff scientists address many of these questions when they receive the initial call.
30
31
Figure 19. Response Information Data Sheets (RIDS)
32

Figure 20. ALOHA footprint
33

Figure 21. ALOHA footprint on MARPLOT map.
34
11 Availability of NOAA/HAZMAT Software The programs that we use to generate our products have all been written and developed in-house and come in two flavors. The first set is distributed publicly. These are well-documented and usually come with sample problems and training materials. The second set is developed as in-house tools and come with very little or no documentation. All the software is available for free. Those developed for public distribution can be downloaded from our website for both Windows and Macintosh systems. These include the CAMEO programs, GNOME, and ADIOS2. The programs developed for in-house use are available for the asking with very little or no documentation, and in some cases are Macintosh-only applications. These include SHIO (our in-house tide program), OSSM (our old industrial strength oil spill model), CATS (our hydrodynamic program), GNOME Analyst (our display program that generates the trajectory graphics), and a host of other smaller utility programs. TAP is available for planning for specific areas ([email protected] ). It comes packaged with a manual and a CD with all the data. About once every other year, we hold an oil spill modeling workshop. The course runs an entire week and we discuss and distribute all our modeling tools, including the in-house versions. If you are interested in attending the class, you can email us at [email protected] to get on the list. In general, we do not distribute the source code for the applications. There is no documentation for any of our code nor is there a system setup for helping with computer code questions.
35

Appendix I
DRILL REQUEST FORM (To be filled out by NOAA SSC)
Drill request rules: A completed drill request form is needed for each drill request submitted. The form should be filled in or reviewed by an SSC before being submitted to MASS. The SSC is responsible for making sure the request is reasonable and for explaining the output options to the requesting party. Drill requests are put into the queue when received. They will usually be assigned in the order they are received. When they get done will depend upon how complicated the request is and how busy we are. If time is an issue, we may move Coast Guard requests to the top of the queue and move industry requests to the bottom. A minimum of two weeks’ advance notice is required. We usually run the requested scenario through the model, and send the SSC the preliminary results to get confirmation that the trajectory will satisfy the goals of the drill. We will not generate any of the requested output until we get confirmation that the trajectory is OK.
36
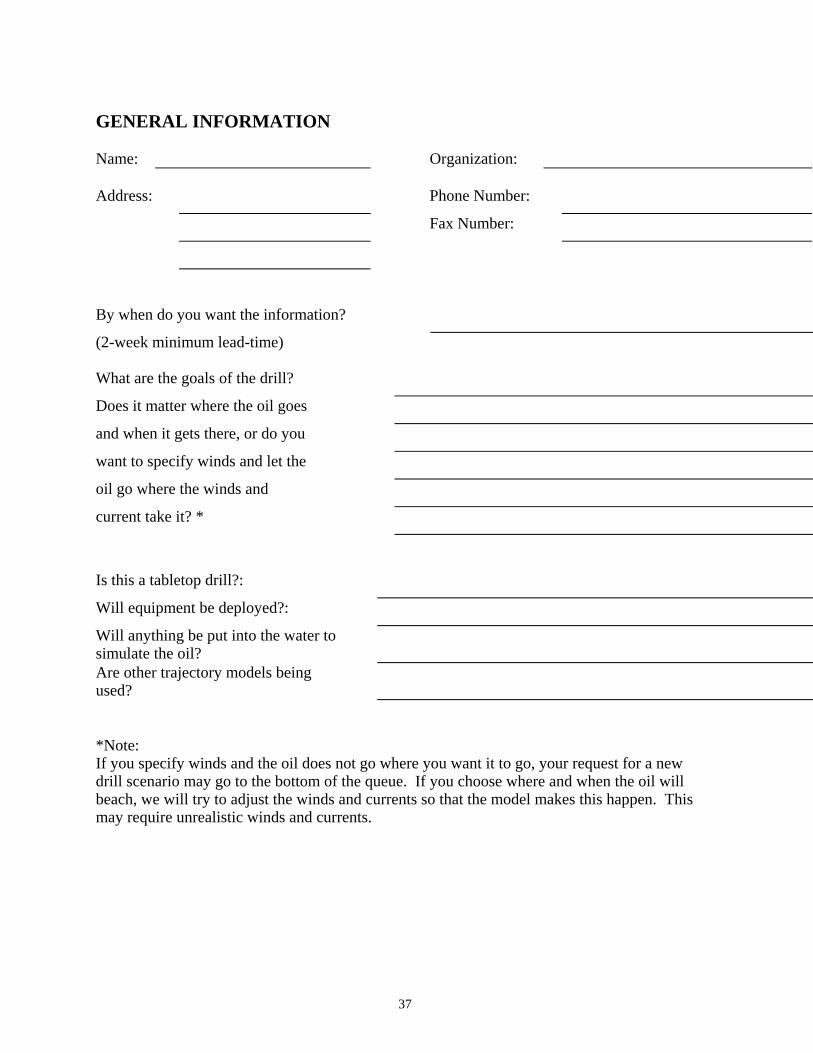
GENERAL INFORMATION Name: Organization: Address: Phone Number:
Fax Number:
By when do you want the information?
(2-week minimum lead-time) What are the goals of the drill?
Does it matter where the oil goes
and when it gets there, or do you
want to specify winds and let the
oil go where the winds and
current take it? *
Is this a tabletop drill?:
Will equipment be deployed?:
Will anything be put into the water to simulate the oil?
Are other trajectory models being used?
*Note: If you specify winds and the oil does not go where you want it to go, your request for a new drill scenario may go to the bottom of the queue. If you choose where and when the oil will beach, we will try to adjust the winds and currents so that the model makes this happen. This may require unrealistic winds and currents.
37

DRILL REQUEST FORM Accident Location Latitude: Longitude:
Geographic Description:
SPILL SCENARIO Start date and time of spill:
Duration of spill
(instantaneous or continuing
over hours or days):
Is source stationary or moving
(provide course and speed if
moving):
THE OIL Amount of oil spilled (provide
leak rate if continuous spill):
If you select an ADIOS oil, just provide the name. Otherwise, fill in all of the requested information below. Name of oil:
API of oil:
Pour point of oil (supply units):
Viscosity at ref. temp. (supply units for visc. and temp)
38
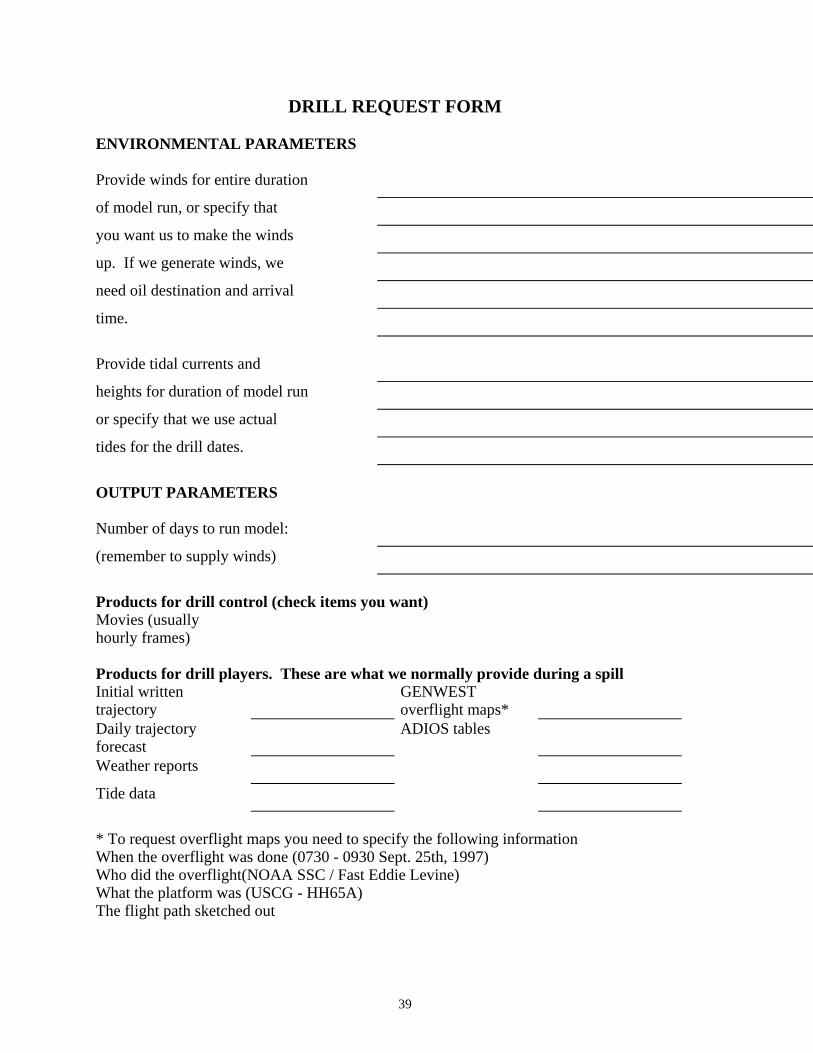
DRILL REQUEST FORM ENVIRONMENTAL PARAMETERS Provide winds for entire duration
of model run, or specify that
you want us to make the winds
up. If we generate winds, we
need oil destination and arrival
time.
Provide tidal currents and
heights for duration of model run
or specify that we use actual
tides for the drill dates.
OUTPUT PARAMETERS Number of days to run model:
(remember to supply winds)
Products for drill control (check items you want) Movies (usually hourly frames)
Products for drill players. These are what we normally provide during a spill Initial written trajectory
GENWEST overflight maps*
Daily trajectory forecast
ADIOS tables
Weather reports
Tide data
* To request overflight maps you need to specify the following information When the overflight was done (0730 - 0930 Sept. 25th, 1997) Who did the overflight(NOAA SSC / Fast Eddie Levine) What the platform was (USCG - HH65A) The flight path sketched out
39

Appendix II
AREA PLANNING REQUEST FORM (To be filled out by NOAA SSC)
Planning request rules: A completed planning request form is needed for each request submitted. The form should be filled in or reviewed by an SSC before being submitted to MASS. The SSC is responsible for making sure the request is reasonable and explaining the output options to the requesting party. Planning requests are put into the queue when received. They will usually be assigned in the order they are received. When they get done, will depend upon how complicated the request is and how busy we are. Typical request will be processed within a month. We suggest that you provide long-term (10 years’ worth) of wind data for us to use or have us obtain archived hourly wind data for 10 years to use. If you specify that we obtain the long wind records necessary for the analysis, it may take 2 to 3 weeks for the data to arrive from the National Climatic Data Center and another 2 to 3 weeks to process the data and do the model runs.
40

GENERAL INFORMATION Name: Organization: Address: Phone Number:
Fax Number:
By when do you want the information? 4 week mininum lead-time
What are the goals of the study?
How are the results being used?
41

PLANNING REQUEST FORM
What type of analysis do you want done? Statistical Run Deterministic Run Foward Run Backwards Run Accident Locations(foward run) or Receptor sites(backwards run) Latitude Longitude Latitude Longitude Latitude Longitude Latitude Longitude Latitude Longitude When do you want model run for? Start date and time for determistic runs OR Season or months to evalutate for statistical runs WHAT ARE WE MODELLING? If Oil : Specify oil type Amount spilled Duration of spill If not oil explain: How long do you want model run for? Specify days or hours
42
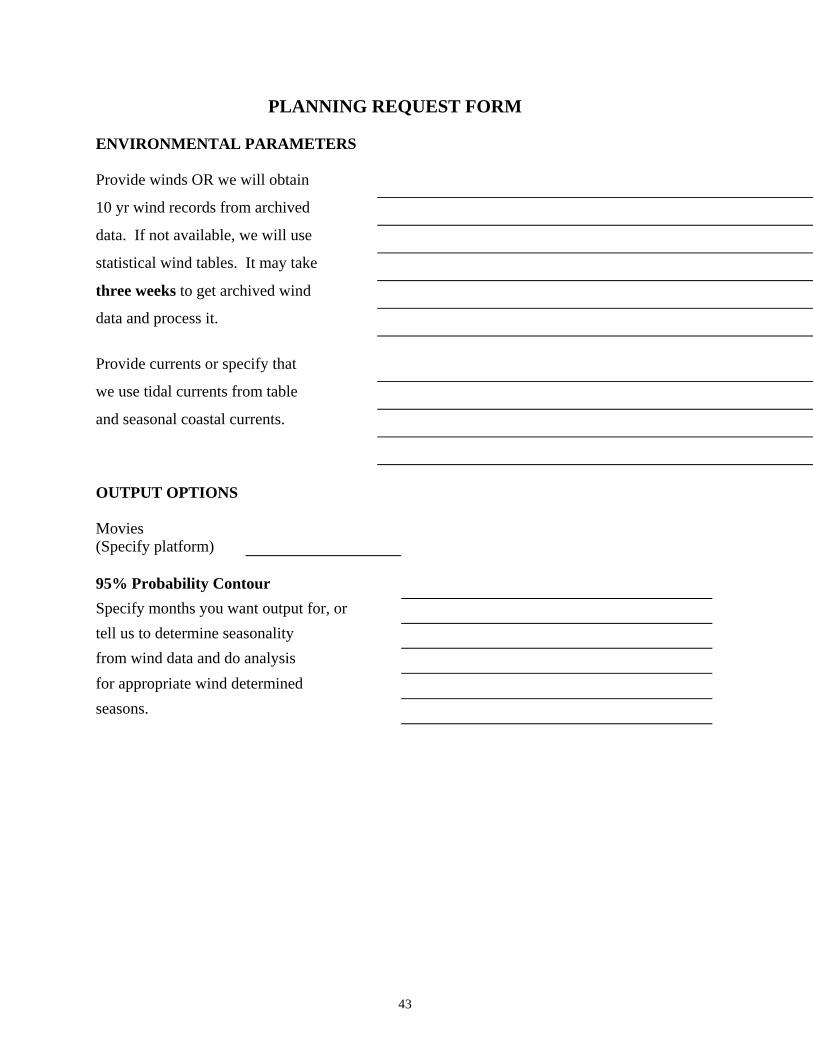
PLANNING REQUEST FORM ENVIRONMENTAL PARAMETERS Provide winds OR we will obtain
10 yr wind records from archived
data. If not available, we will use
statistical wind tables. It may take
three weeks to get archived wind
data and process it.
Provide currents or specify that
we use tidal currents from table
and seasonal coastal currents.
OUTPUT OPTIONS Movies (Specify platform)
for appropriate wind determined seasons.
95% Probability Contour Specify months you want output for, or tell us to determine seasonality from wind data and do analysis
43